1. Introduction
With the rapid process of high-speed urbanization and urban expansion, the interweaving of urban and rural hinterlands has created various forms of integration between these areas [
1]. This has given rise to the formation of an intermediary region that lies between urban and rural areas. This transitional zone is marked by a specific level of population density and urban service functionalities as well as a blending and overlapping of urban and rural land utilization. Moreover, this area experiences swift socio-economic structural transformations. This region is commonly referred to as the urban–rural integration zone [
2]. The urban–rural integration zone is a complex spatial mix of diverse elements that give rise to conflicting urban and rural interests, making it a site of acute land use conflicts and social management challenges, thereby becoming a crucial research area [
3]. The elements within the urban–rural integration zone, such as land, landscape, industry, and population, exhibit significant spatial distribution heterogeneity, transition, and dynamics [
4,
5]. Due to its frontier role in urban expansion and central position in urbanization, the urban–rural integration zone has become an independent territorial unit that cannot be neglected. Accurately establishing the spatial boundary of the urban–rural integration zone is beneficial for constructing an orderly and coordinated spatial control pattern for the “urban area-urban–rural integration space-rural area” [
6].
There are various methods available for identifying the spatial extent of the urban–rural integration zone. The classification standards used by the US Census Bureau consider population density and geographical location, while standards proposed by foreign scholars incorporate multiple indicators, such as land use, economic development, and social psychology [
7]. Pagliacci used fuzzy logic to construct a multi-dimensional and continuous rural index for the identification and division of urban–rural integration zones [
1]. Many scholars use GIS to delineate the spatial extent of urban–rural integration areas in geospatial terms. Li and Bai established an index system for regional characteristic attributes based on population, land use, economy, and society. They developed a model for defining regional characteristic attributes using a fuzzy comprehensive evaluation method [
8]. However, the lack of precise delimitation of urban and rural areas, as well as implementable methods, remains a challenge. Zhou et al. used the comprehensive dynamic degree of land use to define the boundary of the urban–rural interface [
5]. Zhang et al. constructed a model of combined features of brightness and fluctuation in brightness using DMSP/OLS nighttime light data to spatially identify the urban–rural integration zone of the main urban area of Chongqing [
9]. Huang et al. developed an attribute system of urban–rural features, including land use status, ownership, industry, and land planning. They used the landscape complexity index and the G-statistic to establish the spatial boundaries of the urban–rural integration zone in Wuhan City [
10]. These studies have greatly enriched the knowledge of the urban–rural integration space and have given later scholars many lessons and references in the indicator system and identification methods. Liu et al. proposed a method of identifying urban fringe areas based on multi-source data and deep learning techniques, employing remote sensing imagery, population data, and POI big data [
11]. Liang and Zeng proposed a spatial identification method that integrates a three-dimensional feature index of the urban–rural integration zone with spatial autocorrelation analysis [
12]. Scholars have approached the spatial identification of urban–rural integration areas from various perspectives, leveraging the distinctions in spatial characteristics among cities, urban–rural integration areas, and villages. To achieve this, they have employed diverse methods including mutation detection methods [
5], remote sensing satellite identification [
4], and hotspot analysis [
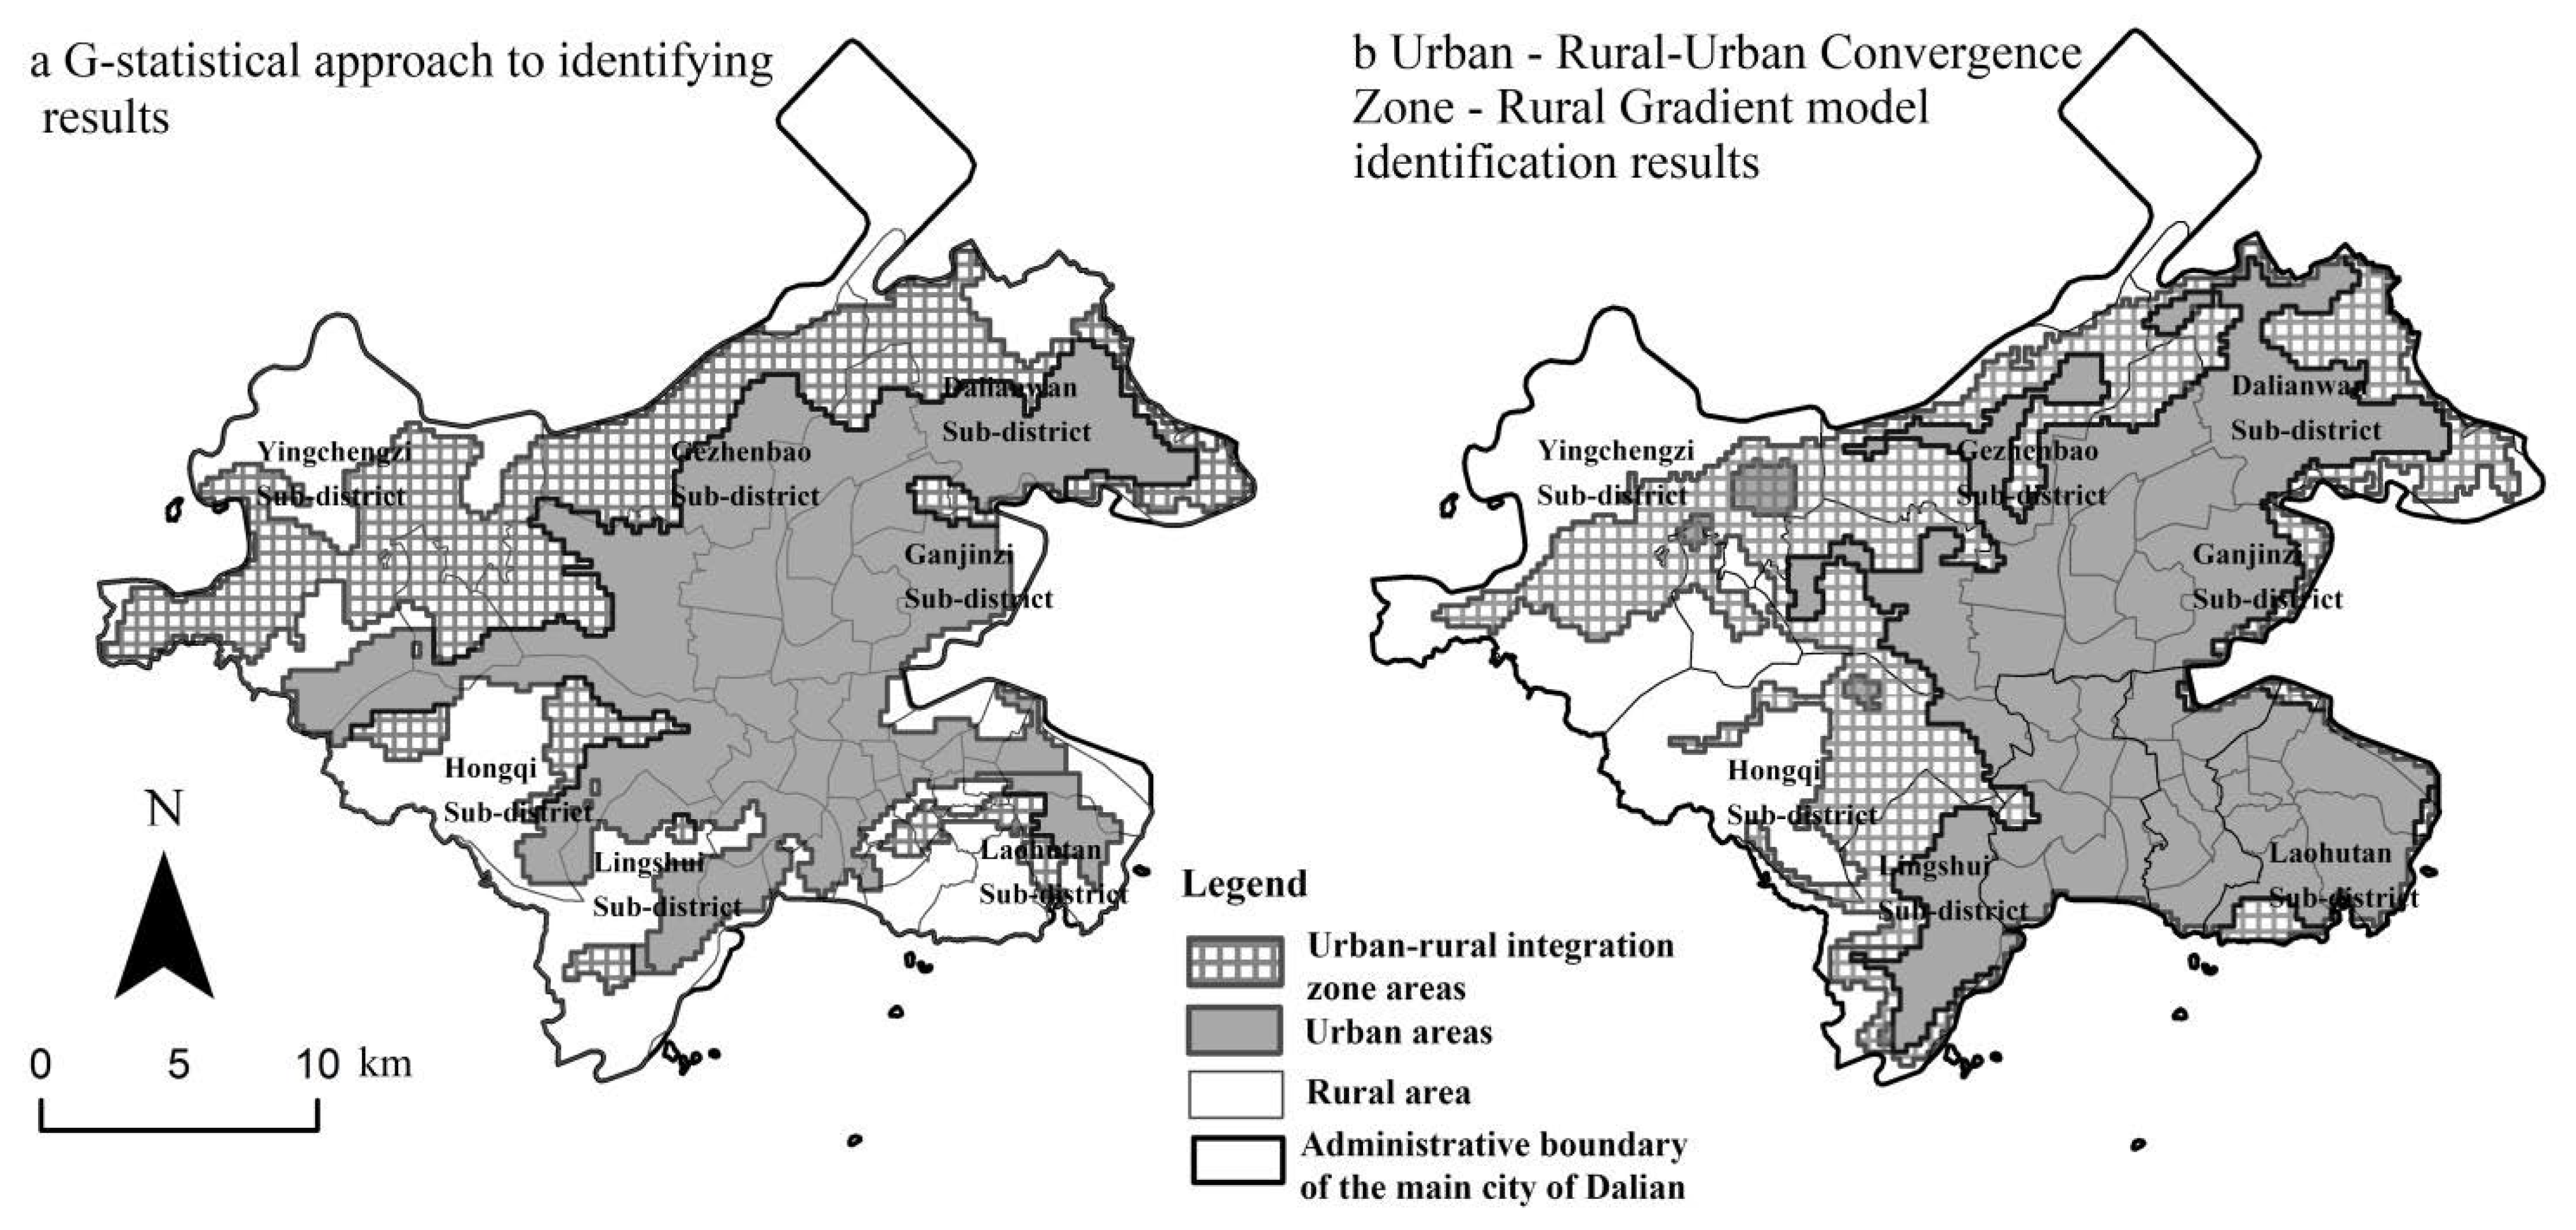
10]. These approaches enable researchers to investigate and analyze the spatial dynamics of urban–rural integration areas. However, there is a relative scarcity of comparative research among these methods, and the differences in strengths, weaknesses, and applicability between them remain unclear. Urban–rural integration is a multidimensional concept that encompasses social, economic, environmental, and spatial aspects. Comparing these methods can contribute to a comprehensive evaluation of the diverse aspects of spatial integration in urban and rural areas. Some methods may prioritize spatial patterns, while others may emphasize social-economic indicators or environmental factors. Through such comparisons, new methodologies and frameworks can be developed, expanding the toolkit for identifying and understanding urban–rural integration. Influenced by data sources and indicator selection, two common categories of methods are frequently observed in the practice of identifying spatial integration in urban and rural areas, as outlined below. (1) The first approach involves performing cluster analysis on high-value land areas with three significant dynamics, transitional and diverse features of the urban–rural integration zone compared to urban or rural areas, using the G-statistics method. The spatial division of urban, urban–rural integration zone, and rural areas is then based on the spatial range of the central urban area. (2) The second approach involves a quantitative assessment of the total scores of various spatial influencing factors based on the spatial gradient effect of urban–rural integration areas. The urban, urban–rural integration areas, and rural areas are divided using the differences in attribute scores of different spatial factors and a threshold as a breakpoint.
In addition, scholars need to enhance the richness of spatial conflict diversity, landscape attributes, and social indicators within the construction process of the identification system. The urban–rural integration belt encompasses a wide array of geographical locations characterized by diverse natural, social, and landscape features. Notably, landscape attributes play a pivotal role in shaping the urban–rural integration space. Moreover, the diversity of spatial conflicts and socio-economic attributes within the urban–rural integration zone are closely interconnected. Neglecting these factors may impede the effectiveness of the urban–rural integration belt identification system in achieving sustainable development goals. Hence, it is imperative to acknowledge and incorporate social and landscape spatial pattern attributes in order to accurately identify the spatial extent of the urban–rural integration zone.
Symbiosis is a widely observed phenomenon that entails mutually beneficial interactions occurring across various levels of life systems. In the context of integrated urban–rural spaces, symbiotic development occurs within economic, social, and ecological systems as rural and urban communities collaborate and leverage each other’s resources and services. The concept of “symbiosis” was initially introduced by De Bary, a German biologist, in 1897, and it encompasses the notions of symbiotic units, symbiotic patterns, and symbiotic environments [
13]. Scholars from diverse disciplines have expanded the exploration of symbiotic theory, investigating symbiotic relationships between different elements [
14], the transformation of rural residential areas [
15], the identification of urban–rural regional systems [
16], urban–rural coordination [
17], and social development [
18]. Mutually beneficial symbiotic patterns can be categorized into three main types: mutualistic symbiosis, symbiotic communism, and parasitic symbiosis [
14]. The symbiotic relationship within the context of urban–rural integration spaces is characterized by its complexity. Scholars employing symbiotic theory to analyze relationships among spatial elements often introduce indicators such as symbiotic degree or symbiotic nature to examine the extent and nature of symbiotic relationships among different elements [
14,
17]. Symbiosis serves as a fundamental principle for achieving sustainability and prosperity in human society, urban–rural development, and other life systems. In the context of urban–rural integration spaces, cities provide rural areas with robust infrastructure and public services, while rural areas offer cities high-quality natural environments and ecological resources. By applying symbiotic theory to analyze the symbiotic relationship within urban–rural integration regions, researchers can select indicators that reflect the interdependent relationship between urban and rural spaces to effectively identify urban–rural integration areas.
The emergence of urban–rural integration zones is a result of urban areas expanding their boundaries to incorporate rural regions into the urban structure. Urban expansion is a global phenomenon widely recognized by economists as the enlargement of land use and spatial scope of urban entities driven by factors such as population growth and economic development [
19]. While scholars have conducted numerous studies on the structural evolution [
20] and drivers of urban sprawl [
21], there has been a relative dearth of scientific investigation into the unique spatial attributes of urban–rural integration zones resulting from urban expansion. Urban expansion in China exhibits distinctive features that set it apart from other countries, leading to significant differences in the costs associated with regional land consolidation due to the interplay between dynamic economic development and fixed administrative boundaries.
The delimitation of integrated zones between urban and rural areas aims to provide guidance for decision-making related to land use planning, infrastructure development, resource management, and the provision of services in urban–rural integrated regions. Therefore, it is necessary to deepen our understanding of the integrated zones through theoretical exploration. The symbiotic relationship in the spatial integration between urban and rural areas demonstrates a high degree of complexity and dynamism, aiding researchers in recognizing the mutual interdependence and interactions between urban and rural areas within a specific region. Urban expansion theory focuses on the actual growth and spatial patterns of urban areas. It investigates the processes and factors driving urbanization, including population growth, economic development, and infrastructure expansion, helping to identify the encroachment of urban development on rural areas and the resulting urban–rural integration. The identification method of urban–rural integration zones, employing the G-statistic, exemplifies the principles of symbiosis theory by discerning the mutual benefits, interdependence, and distinct spatial relationships between urban and rural areas. Furthermore, it aligns with the principles of urban expansion theory by identifying spatial patterns, peri-urban areas, and potential land use changes arising from the expansion of urban areas towards rural regions. Consequently, evaluation indicators, including land use dynamics, vegetation cover dynamics, and fluctuations in nighttime light, have been established. Similarly, the identification method of urban–rural integration zones based on the urban–rural gradient model delimits regions where urban and rural characteristics intricately coexist, signifying potential symbiotic relationships. This approach not only captures the pattern of urban spatial expansion but also identifies areas where urban areas extend into rural domains, thus reflecting the tenets of urban expansion theory. In this context, evaluation indicators encompassing location, economy, transportation, and land use were employed.
In conclusion, this paper introduces the concepts of symbiosis theory and urban expansion theory to explore the spatial attributes of urban–rural integration zones. The G-statistic method and the urban–rural integration zone–rural spatial gradient model are utilized to delimit the extent of the urban–rural integration zone in Dalian City. A comparative analysis of the two identification methods is conducted based on the obtained results. This study offers several potential contributions: (1) It introduces symbiosis theory and urban expansion theory as frameworks for identifying the spatial characteristics of urban–rural integration zones and guiding their identification. (2) The index system for identifying urban–rural integration zones is enriched by incorporating social attributes and landscape spatial pattern indicators. (3) By employing two distinct methods to identify the spatial attributes of urban–rural integration zones in the same case study, this paper compares the differences and potential applicability of the two approaches.
These innovative points highlight the significance of integrating theoretical frameworks, expanding the index system, and conducting comparative analyses to enhance the understanding and practical application of identifying urban–rural integration zones.
The subsequent sections of this paper are structured as follows.
Section 2 elaborates on the research concepts and methodologies employed in this study.
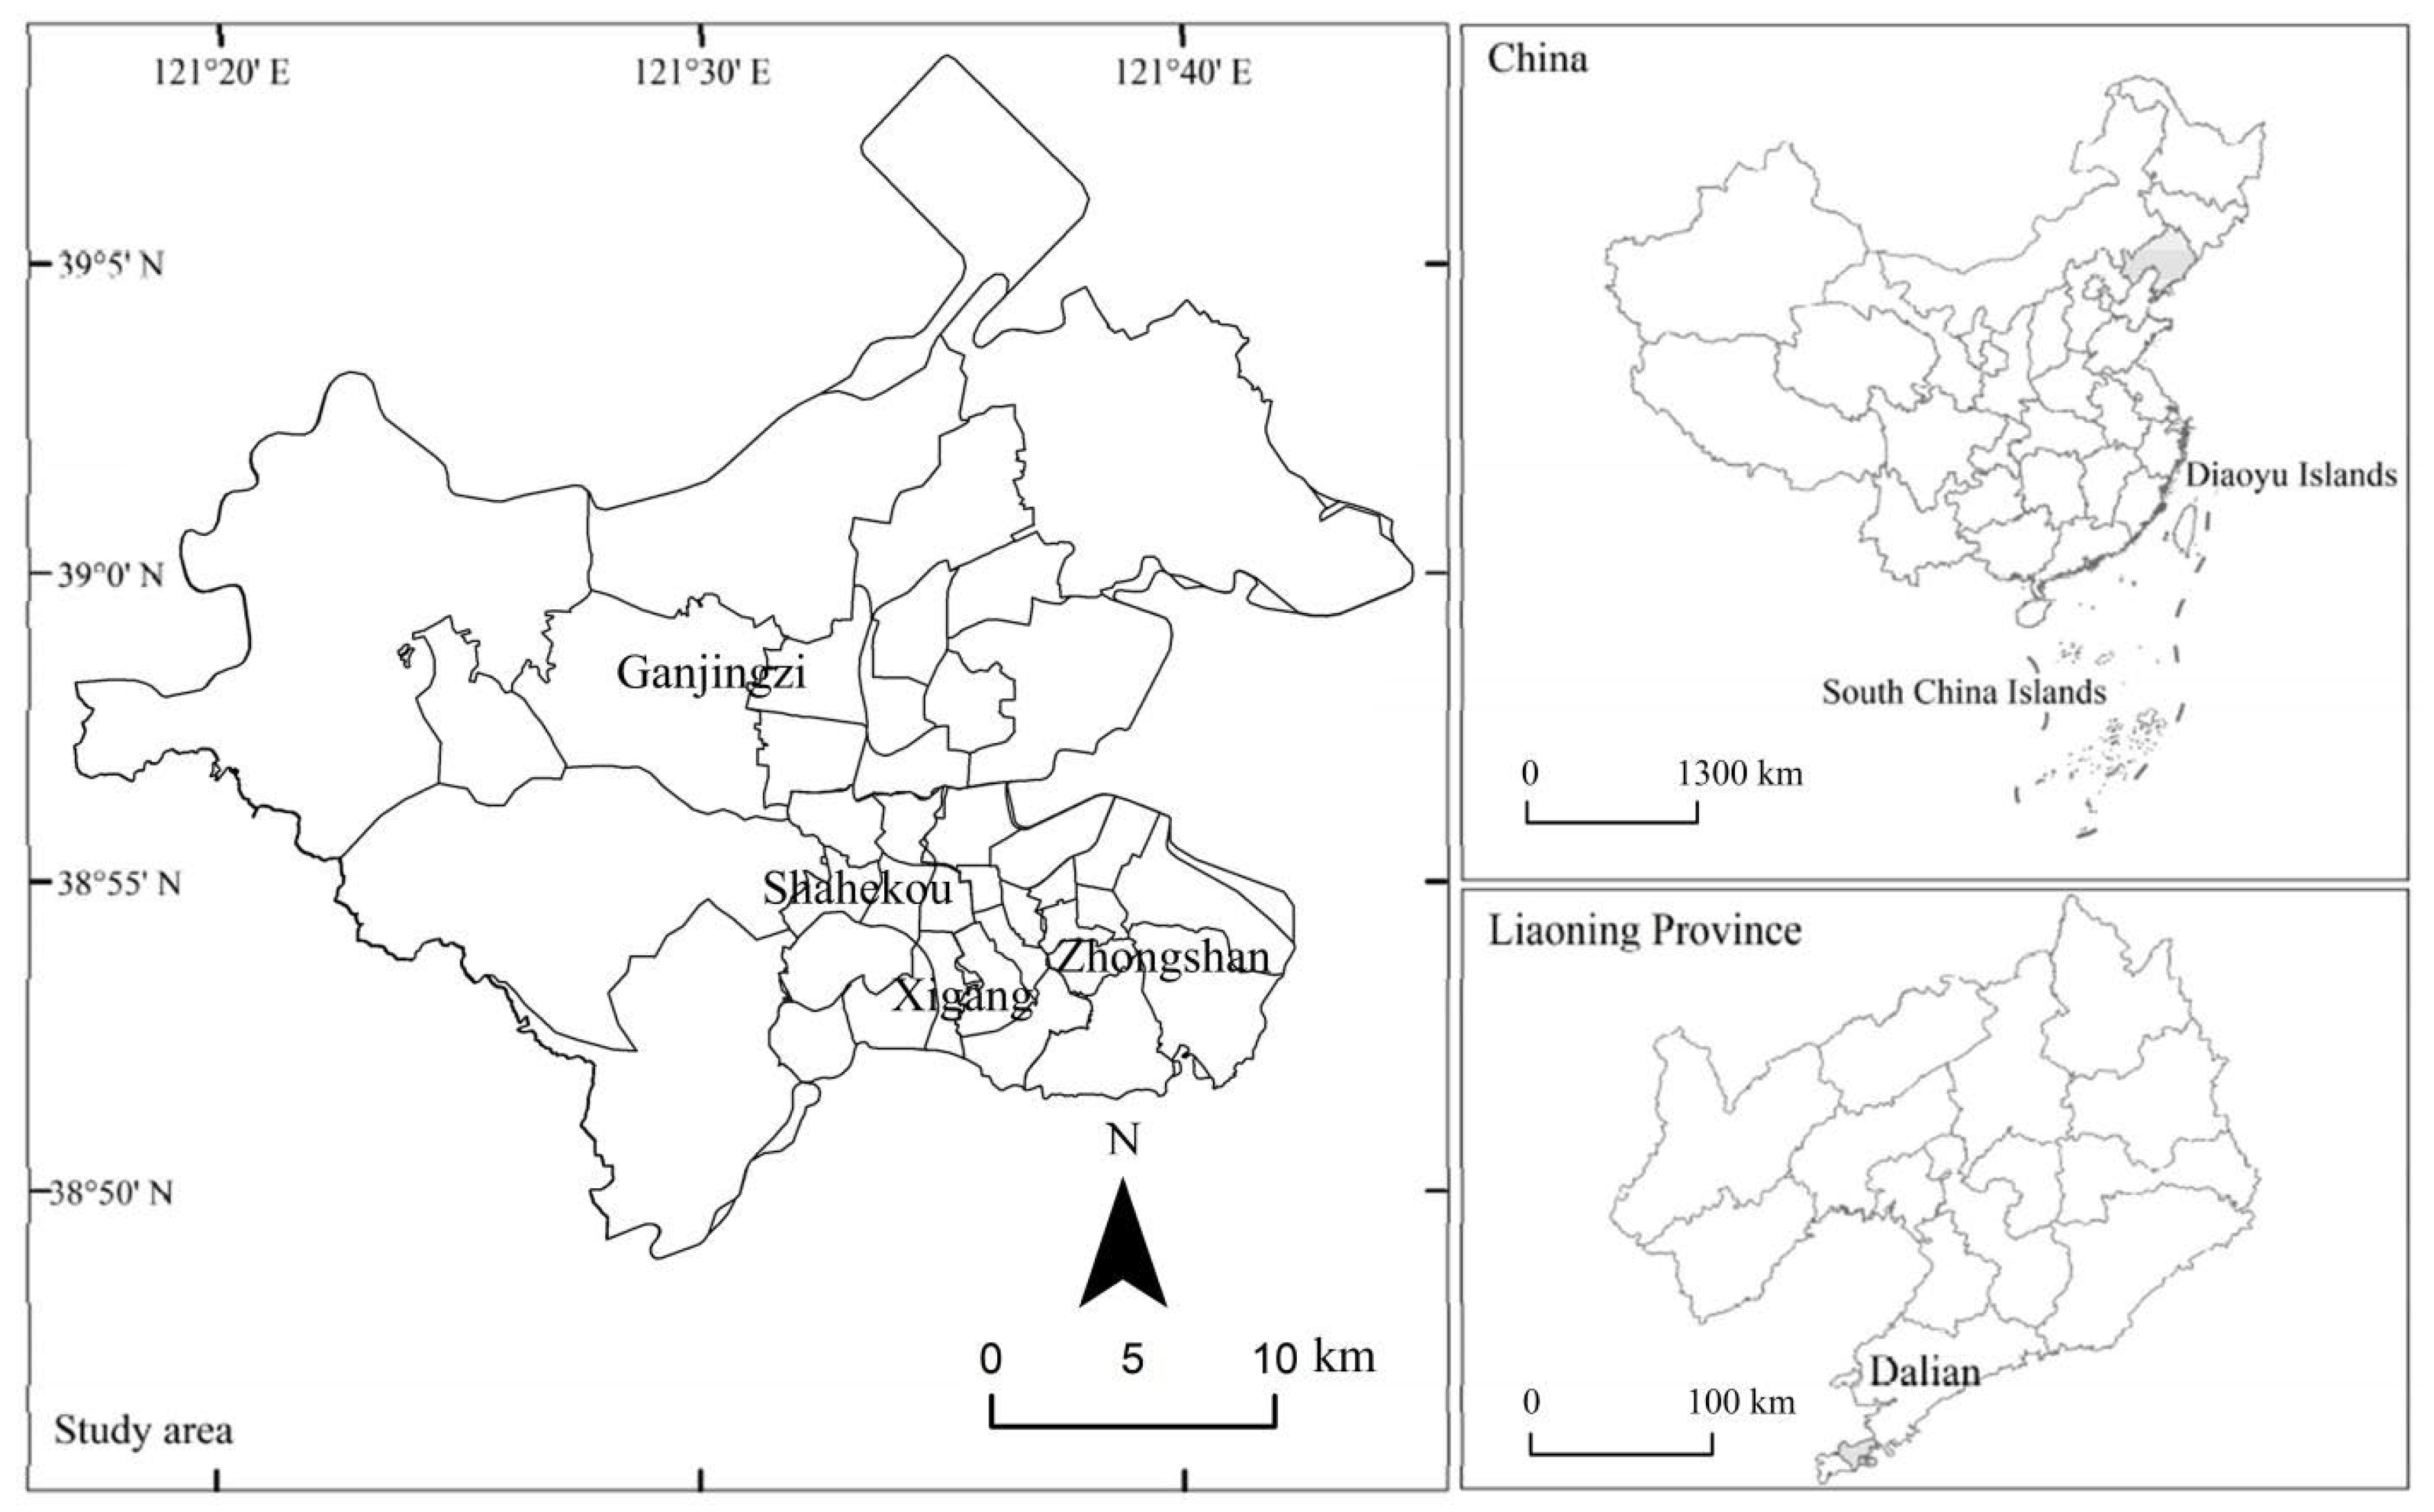
Section 3 provides an overview of the study area and delimits the sources of research data. In
Section 4, empirical research is conducted in Dalian City, whereby the spatial characteristics of Dalian’s urban–rural integration zone are summarized, and a comparative analysis of the two spatial recognition methods is discussed.
Section 5 presents a comprehensive discussion of the findings, while
Section 6 offers the concluding remarks.
2. Research Methods
2.1. Research Framework
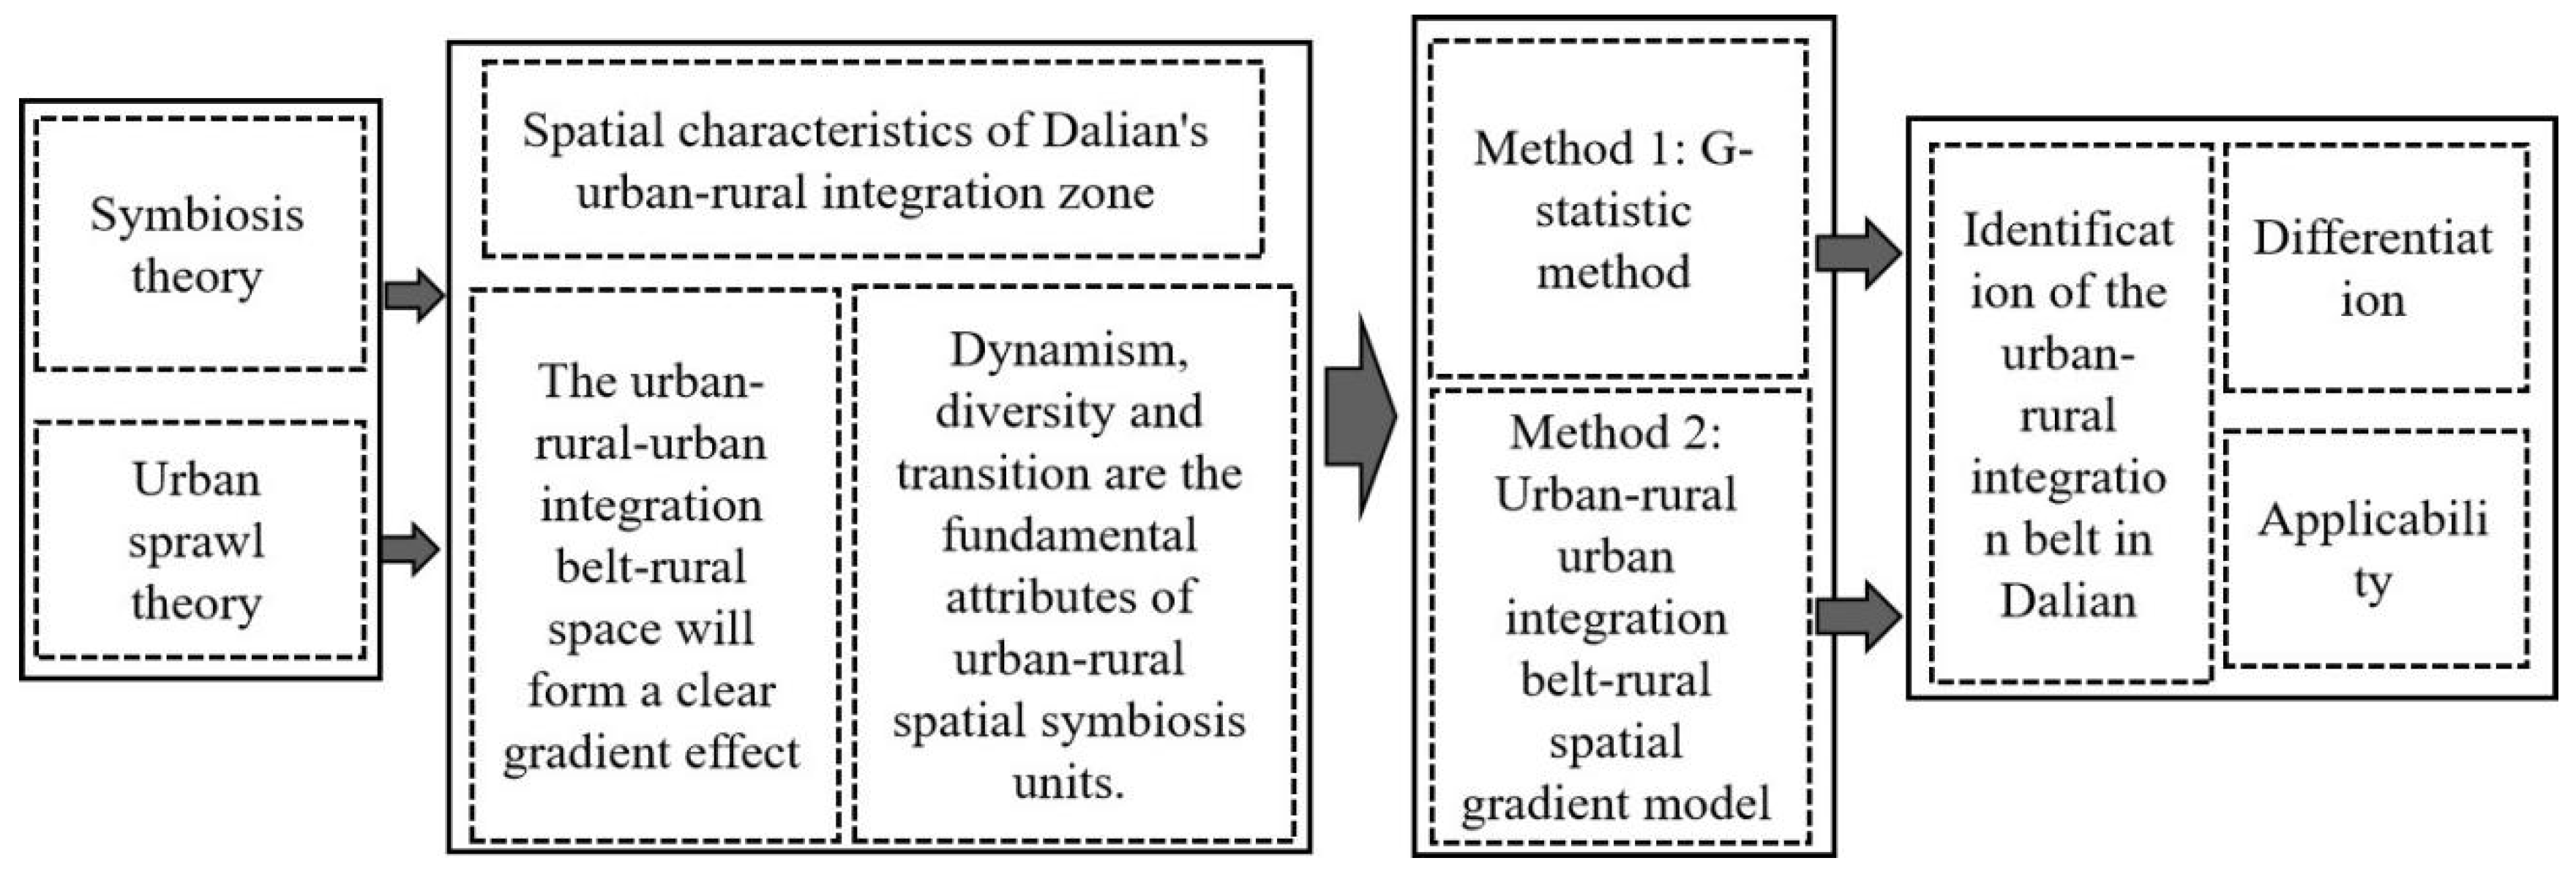
This paper initiates an analysis of the spatial attributes of urban–rural integration zones by incorporating the theories of symbiosis and urban expansion, thereby comparing the spatial foundations of these two theories. Based on this theoretical framework (
Figure 1), two distinct methods are employed to identify urban–rural integration zones in the city of Dalian. Firstly, guided by the theoretical analysis, the spatial characteristics of urban–rural integration zones are found to encompass four fundamental features: hybridity, dynamics, diversity, and transition. Using the G-statistic method to examine land exhibiting these characteristics, the spatial agglomeration area within Dalian is identified as the urban–rural integration zone. Secondly, considering the urban–rural dualistic structure of the city, a spatial gradient model of urban–urban–rural integration is developed. By assigning weights to the spatial properties of land-use units in the study area and subsequently summing them, a total score is obtained for each unit. Utilizing the threshold determined by the inflection point within the urban–urban–rural gradient model, the urban–rural integration zone is identified.
To delve deeper into the subject, the main urban area of Dalian is selected as a research case, facilitating the examination and comparison of the identification results yielded by the two methods for urban–rural integration zone identification. Through empirical analysis, we explore the disparities and potential applicability conditions between these two methods.
2.2. Theoretical Analysis
The theory of symbiosis is rooted in the notion of mutual benefit and interaction among diverse entities. In the realm of urban–rural development, this theory posits that urban and rural areas can foster a symbiotic relationship, characterized by the mutually advantageous utilization of each other’s strengths and resources, rather than engaging in conflicts or competition [
20]. When applied to the examination of urban–rural integration zones, the theory of symbiosis offers valuable insights into the collaborative dynamics and synergistic potentials between urban and rural domains, ultimately contributing to the pursuit of sustainable development. When identifying urban–rural integration zones, it is necessary to consider the social structure and connections between urban and rural populations, including access to education, healthcare, social services, and recreational facilities. Furthermore, the analysis should encompass social networks, cultural exchanges, and community cooperation that extend beyond the boundaries of urban and rural areas. The symbiotic relationship between urban and rural areas is not only manifested at the spatial level but also emphasizes the diverse livelihood patterns and economic structures between urban and rural areas at the social level. By incorporating the concept of symbiosis within the context of urban–rural integration spaces, the symbiotic unit emerges as the fundamental building block of such spaces, encompassing elements such as land use, industry, landscape, population, and spatial utilization (economic–ecological) factors. These elements, functioning through diverse symbiotic modes, collectively shape the symbiotic environment within urban–rural integration zones. From a vertical perspective, the spatial configuration of urban–rural integration zones constantly evolves and develops through the dynamic interactions of constituent units, imbuing the space with resolute dynamism, vitality, and complexity. Consequently, the urban–rural integration zone can be envisioned as a dynamic, intricate system comprised of ever-changing relationships. The inherent dynamism, diversity, and transitional nature of the spatial arrangement embody the fundamental properties of symbiotic units within the urban–rural space.
Urban expansion is a mode of urban development characterized by dispersed, low-density settlements and automobile-dependent land use. This development pattern, guided by economic, demographic, and social factors, is encapsulated by urban expansion theory. The concept of the urban–city–rural gradient delimits the gradual transition of land use and residential patterns from urban to rural areas. This transition exhibits a continuum of land use types, beginning with densely populated urban regions featuring intensive land utilization, progressing to peri-urban areas characterized by a blend of urban and rural land uses, and culminating in rural areas predominantly devoted to agricultural and natural resource activities. Within this framework, the urban–rural integration zone emerges as an area where urban and suburban land uses intersect and amalgamate. It encompasses mixed land utilization practices spanning the urban–rural spectrum, effectively serving as a transitional zone bridging the urban core and the rural periphery. This gradient becomes discernible through shifts in population density, land use intensity, and land use composition. Typical features of this gradient often entail declining population density, augmented agricultural and natural resource utilization, and a transition towards more dispersed settlement patterns. The inherent disparity between urban and rural areas is objectively present and conforms to a distance decay law [
22]. Consequently, economic, social, and functional elements exhibit a gradient effect in their spatial distribution [
23]. Grounded in the urban expansion model, which emanates from the central city and progressively extends outward, a distinct gradient effect materializes within the urban–suburban–rural integration zone, encompassing urban, suburban, and rural spaces. Various production factors and populations converge towards the city, gradually establishing a spatial distribution characterized by a discernible gradient. This gradient effect facilitates the demarcation of regional structural divisions within the urban–rural integration zone and rural areas [
24].
As a transitional area, the urban–rural integration zone exhibits a high level of complexity and dynamism in its spatial symbiotic relationships. The theory of symbiosis guides the delimitation of the integration zone by understanding the inter-relationships between urban and rural ecosystems and selecting indicators that can reflect the spatial symbiosis between them. These indicators include a comprehensive land use index, Shannon’s diversity index, patch density, and maximum patch index. The identification of the urban–rural integration zone using such indicators reveals the intricate symbiotic relationships within its land patches and spatial landscape patterns, indicating a heightened ecological sensitivity. Based on this understanding, protective strategies can be devised to safeguard agricultural land, preserve natural habitats, and establish green infrastructure networks that connect urban and rural areas. The theory of urban expansion directs the delimitation of the urban–rural integration zone by analyzing the spatial expansion patterns relevant to urban–rural integration through the construction of urban gradient models. Indicators reflecting urban expansion, such as distance from the city center, density of points of interest (POIs), distance to train stations, and distance to subway stations, can be selected. The identification of the integration zone through these indicators demonstrates land usage that aligns with the urban development pattern and direction, boasting relatively good public services, infrastructure, and potential for future development.
2.3. Identification Method of Urban–Rural Fusion Zone Based on G-Statistics
The G-statistic serves as a spatial autocorrelation measure designed to assess the clustering or dispersion tendencies of a particular variable across a geographic region [
25]. Within the context of urban–rural integration zone identification, the G-statistic is employed to analyze variables that capture the extent of urban–rural integration characteristics. Significantly high G-statistic values delimit regions that embody urban–rural integration zones. In these areas, urban and rural domains are witnessing an increasing level of integration, accompanied by the convergence of economic, social, and environmental factors.
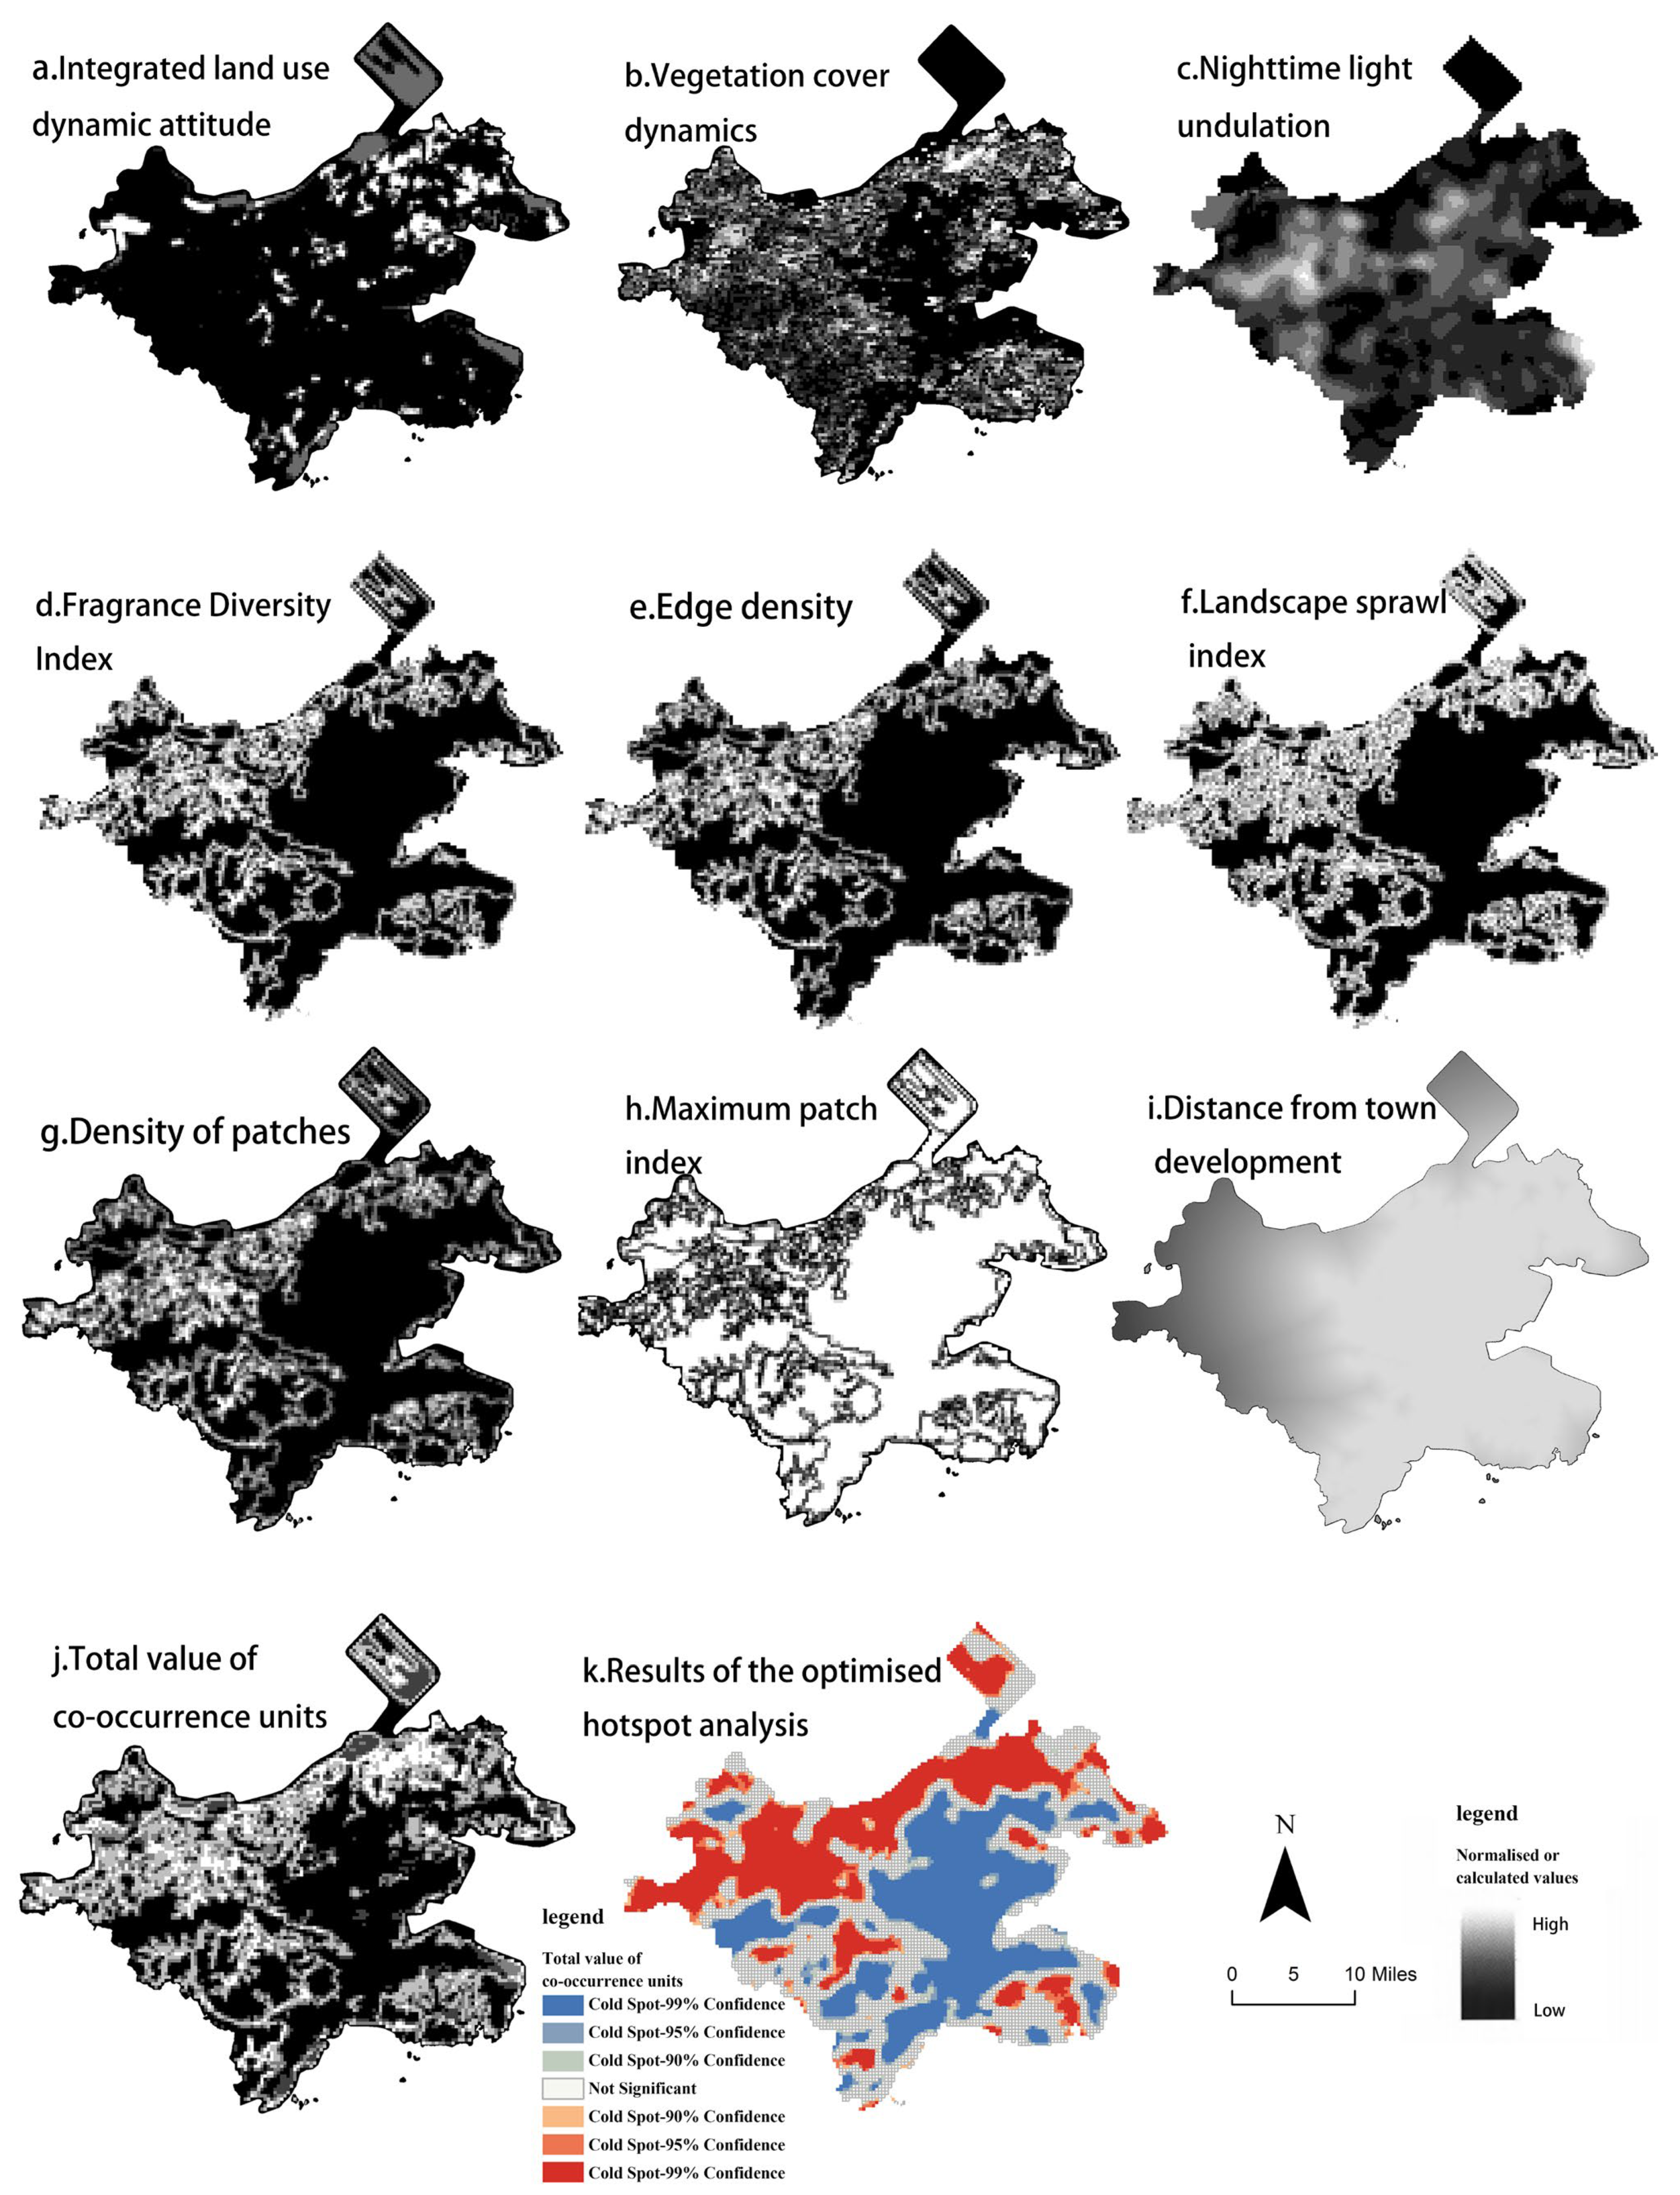
Drawing upon the theories of symbiosis and urban expansion, the urban–rural integration zone, recognized as an open and intricate dynamic system [
26], emerges as the most dynamic arena for land use transformations, vegetation cover degradation, and economic activity fluctuations during the process of urban expansion. Consequently, the spatial characteristics of the urban–rural integration zone are distinguished by the dynamic variations in land use, vegetation cover, and nighttime illumination across different periods, emphasizing spatial heterogeneity and dynamism. Land use within the urban–rural integration zone exhibits complex and diverse attributes [
11,
27], featuring distinct landscape patterns that differentiate it from both urban and rural areas. Hence, in terms of spatial diversity indicators, the Shannon diversity index, edge density, sprawl index, patch density, and maximum patch index have been selected to portray the degree of spatial diversity. As proximity to the city increases, human interventions in the natural and economic environment intensify, amplifying the influence of various economic activities radiating from the city. The neighboring urban regions of the urban–rural integration zone occupy a prominent position within the economic development gradient. Therefore, the urban spatial influence index was chosen to characterize the transitional qualities of the urban–rural integration zone [
13]. In summary, nine indicator factors that effectively capture the spatial attributes of the urban–suburban integration zone within the study area were identified (refer to
Table 1).
Let
V denote the value of a land unit, and consider the following formula:
Here, V represents the comprehensive index of a land unit, a denotes the normalized value of the ith index factor (such as location conditions, transportation conditions, and land use conditions), and negative attribute index values are reverse normalized. p represents the corresponding weight (n = 9). The land unit index V is a dimensionless continuous variable in a custom ratio scale, reflecting the cumulative numerical value of the indices within the land unit.
Tobler’s first law of geography states that there is a stronger correlation between objects as spatial distance decreases [
29]. The spatial characteristics of the urban–rural integration zone align with this law. By utilizing the optimized hotspot analysis tool in ArcGIS 10.6.1, the analysis and computation for each period were conducted using first-order Queen adjacency spatial weight [
10]. This approach enables the determination of the Z-score multiple of the standard deviation and its corresponding
p-value within the 90%, 95%, and 99% confidence intervals for each sampling grid. Hypothesis testing is applied, and a positive Z-score indicates that the feature index of the urban–rural integration zone in the sampling grid is relatively higher compared to the surrounding grids, signifying a hotspot. The magnitude of the Z-score determines the degree of clustering. Conversely, a negative Z-score represents a cold spot, while a failure to pass the hypothesis test suggests that the numerical agglomeration is not significant [
12].
Referring to Zhang’s method [
30] for delimiting the boundary of the urban–rural integration zone, 36 radial profile lines were generated by originating from the center of Dalian’s urban core area, forming 1 line every 10 degrees. Based on the V unit values of the corresponding grids intersected by the profile lines, 36 data sequences were constructed. For a given profile line, the comprehensive score value of the V raster unit is plotted on the ordinate, while the distance from the center of the grid cell to the city center is plotted on the abscissa. The inflection points representing the transitions from low to high and from high to low values of the V raster units are identified. Subsequently, all the turning points are marked on the remote sensing image according to their geographic coordinates, and the inner and outer turning points are distinguished based on their relative positions with respect to the initial point. Connecting the inner and outer turning points establishes the inner and outer boundaries of the urban–rural integration zone, where the inner boundary demarcates the boundary between the city and the urban–rural integration zone, while the outer boundary represents the boundary between the urban–rural integration zone and the rural area.
2.4. Identification Method of Urban–Rural Integration Zone Based on Urban–Urban–Rural Integration Zone–Rural Gradient Model
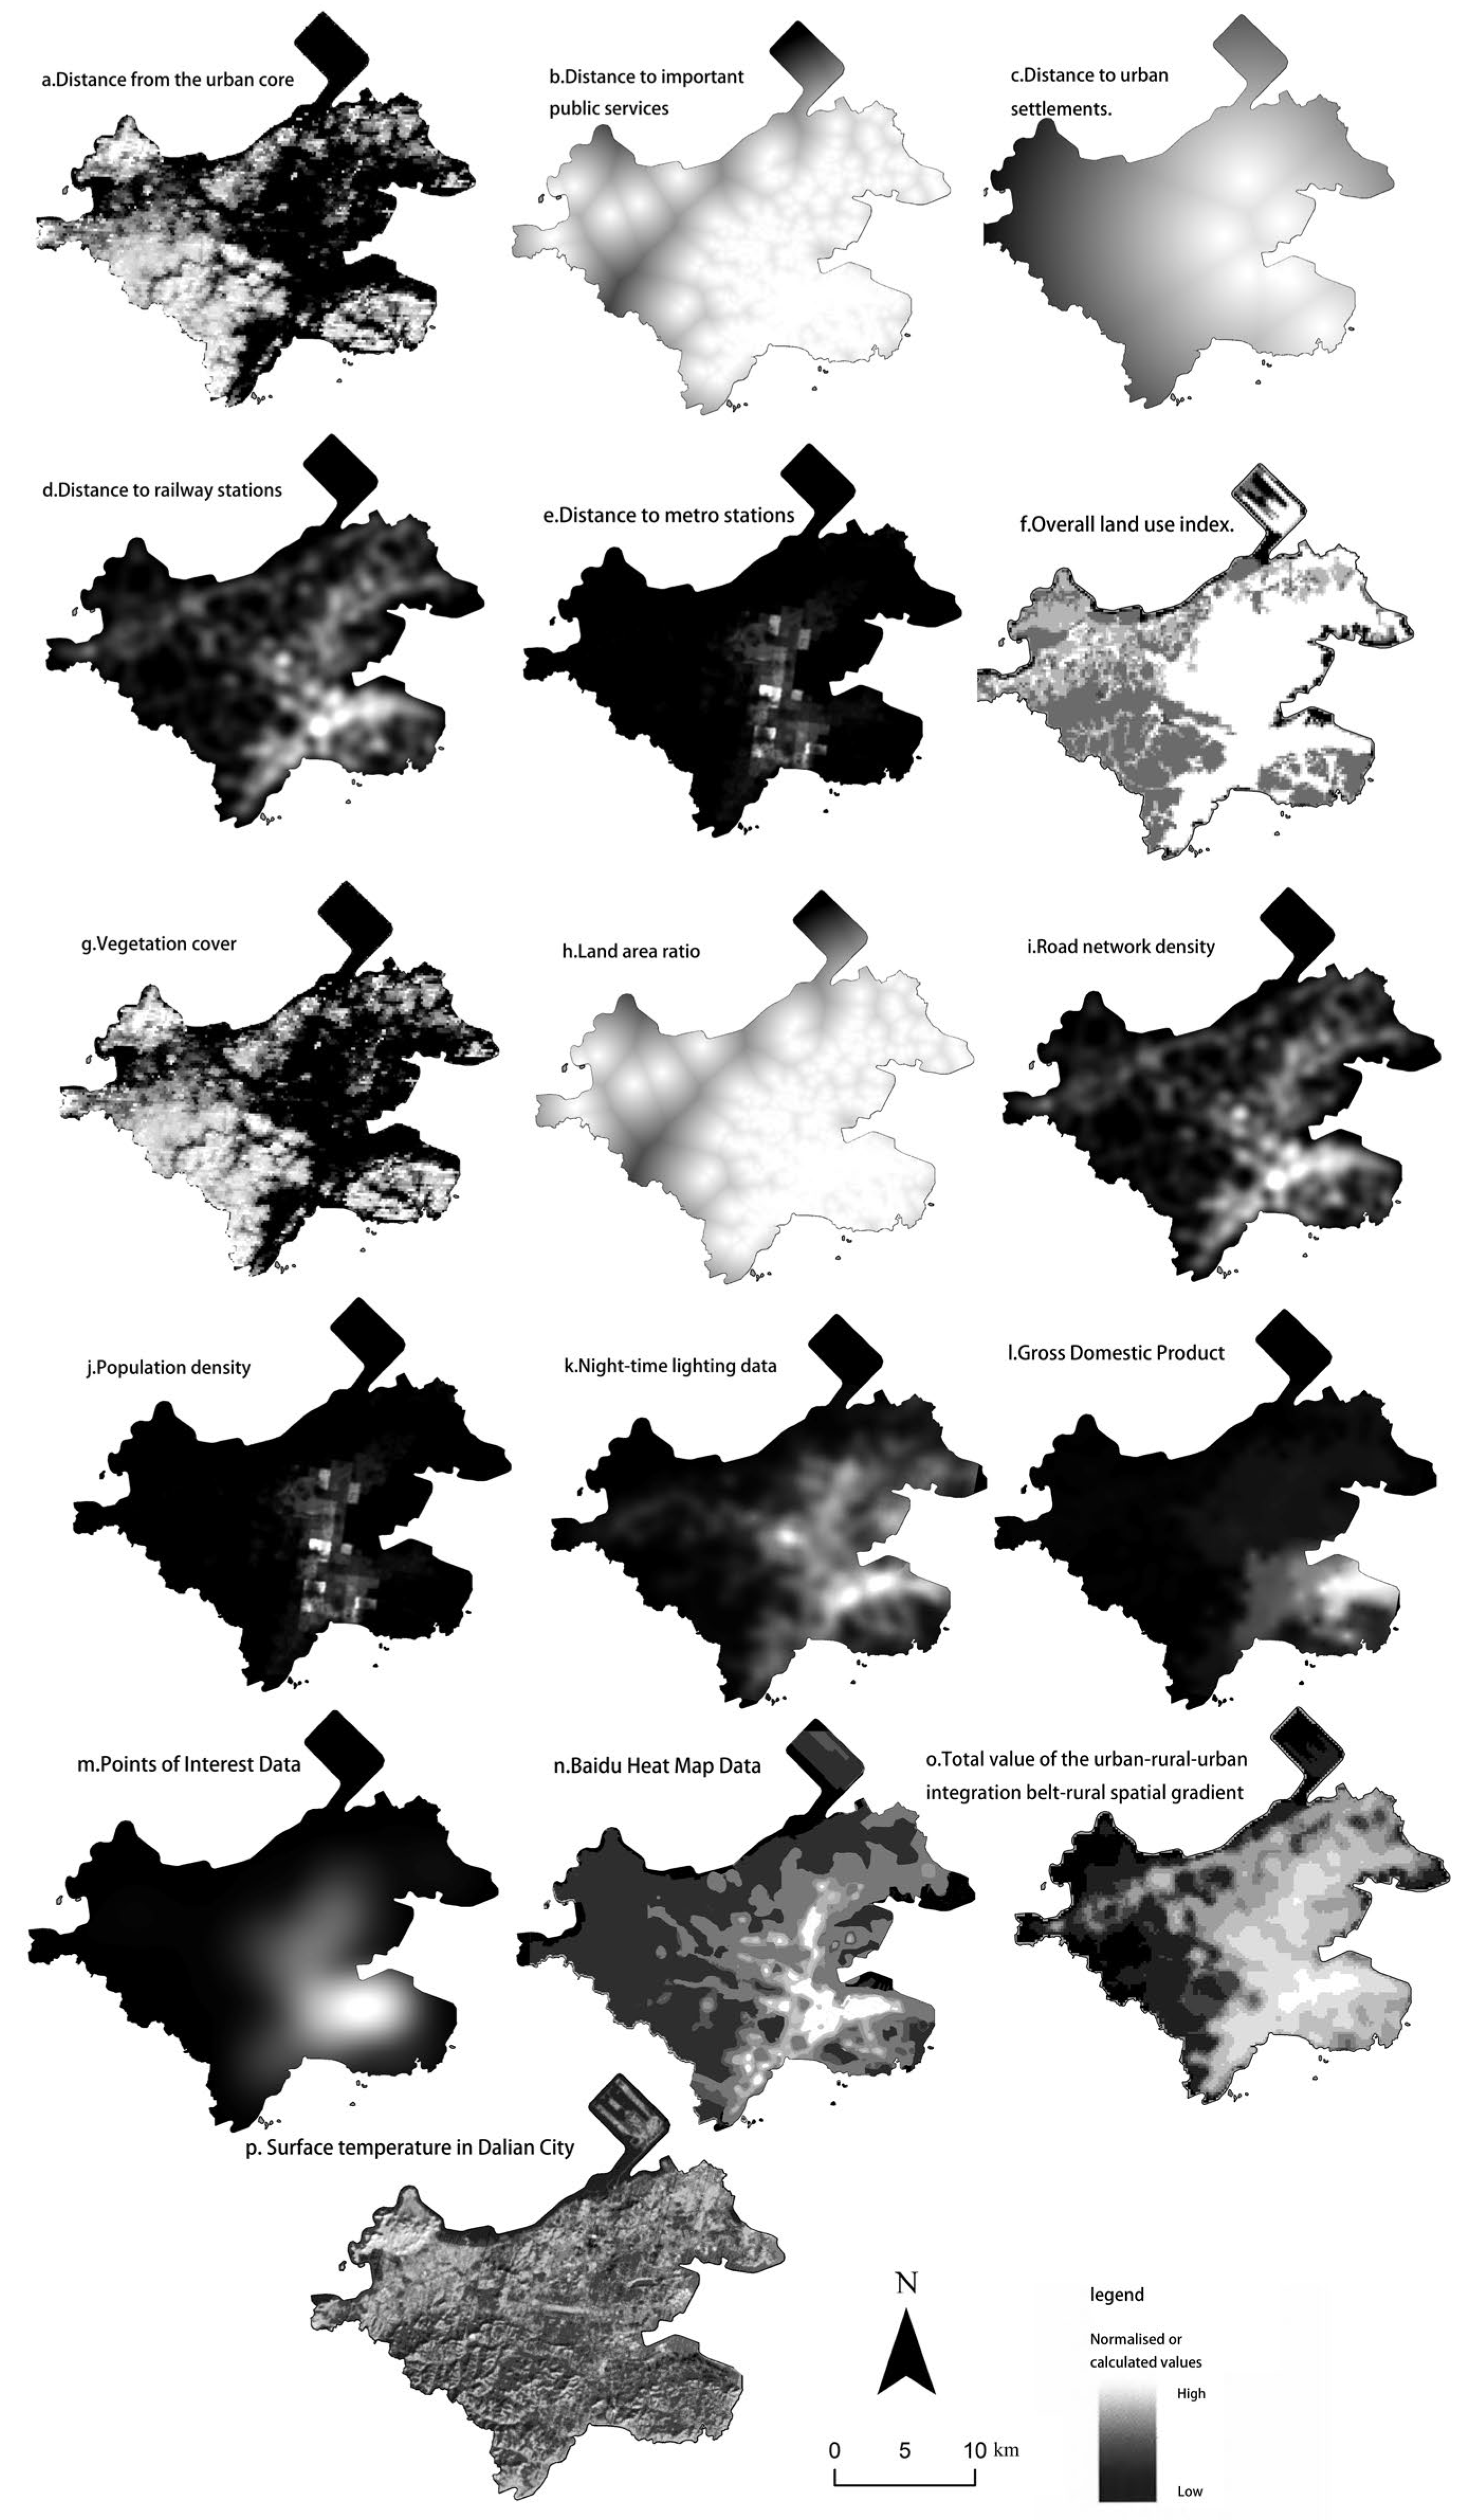
In light of the gradient effect of urbanization, the spatial integration characteristics of urban–rural areas can be identified. The study area is categorized into urban, urban–rural integration zone, and rural areas, wherein the urban area represents the highest spatial gradient value, the rural area represents the lowest spatial gradient value, and the intermediate value defines the urban–rural integration zone. The development of the urban–urban–rural integration zone–rural gradient model entails two main aspects: establishing the evaluation index system and determining the index weights. The urban–rural integration area not only fulfills its own basic requirements but also relies heavily on the core resources of the urban core area. It is influenced by the radiation effect of the urban core area, and its location, transportation, and land use exhibit close associations with the distance from the core city area. Moreover, drawing on urban economics theory and urban land price principles, the proximity of land use within the urban–rural integration zone to essential public service facilities, urban residential areas, transportation hubs, and transit stations follows a gradient spatial model. In terms of land use conditions per se, indicators such as land use intensity and vegetation coverage decline with increasing distance from the city, while social attributes including population, economy, and density of points of interest (POIs) also adhere to the gradient spatial effect. Based on the aforementioned analysis, five primary indicators were selected, namely location factors, transportation factors, land use factors, economic factors, and social factors.
Regarding the location factor, secondary indicators such as distance to the city core area, distance to important public service facilities, and distance to residential areas were selected. In terms of the transportation factor, taking into account urban expansion patterns where new airports and high-speed railway stations often emerge at a certain distance from the city center, secondary indicators such as distance to railway stations and subway stations were chosen. The land use factor encompasses the comprehensive indices of land use intensity, land use density, and road density, which collectively reflect the extent of human development and land utilization within the region, serving as crucial indicators to assess the scope and depth of regional land use. The secondary indicators for social attributes include population density and heat map data, which effectively capture the inter-relationship between population distribution and spatial patterns. As for economic factors, the secondary indicators encompass nighttime lighting, GDP, and density of points of interest (POIs), providing essential measures for evaluating regional urban economic development. Based on these considerations, a gradient evaluation index system for land units was constructed, followed by correlation testing for each indicator. Through the elimination of indicators with significant mutual influence and consideration of the representative characteristics of actual indicators in the study area, superior indicator factors capable of characterizing the spatial attributes of the urban–suburban integration zone in the study area were selected (refer to
Table 2).
To establish the precise boundaries of the urban–rural integration zone using the urban–suburban–rural gradient model, it is crucial to determine two thresholds. The threshold value denoted as
S″ corresponds to the spatial unit value of the urban–rural integration zone, while
S′ represents the value of the rural spatial unit, and
S‴ represents the value of the urban spatial unit (as illustrated below).
In the formula, S represents the summation of indicator data for a land unit, b represents the normalized value of the ith indicator factor (such as location conditions, transportation conditions, land use conditions, etc.), and p represents the corresponding weight, where (n = 14). The land unit index S is dimensionless and reflects the numerical value obtained by summing the indicators within the land unit. S′ represents the threshold value of S for urban land units, while S″ represents the threshold value of S for rural land units.
An optimal approach for determining the thresholds involves identifying natural breakpoints in the distribution of
S values, which correspond to distinct “valleys” in the S distribution plot. This method ensures a significant differentiation between properties inside and outside the thresholds, contributing to a scientifically meaningful demarcation between the urban–rural gradient and rural areas [
33]. Given the scale of urban construction land and the development goals of Dalian City, it is crucial to establish different thresholds based on diverse development scenarios. Based on the aforementioned analysis, it is evident that the calculation of S values can be combined with the urban population as a reference for determining the thresholds. The total land area of the four main urban districts in Dalian is 550.27 square kilometers, with a permanent population of 3.2058 million in 2022 and an urbanization rate of 82.1%. Following the “Urban Land Classification and Planning Construction Land Standards (GB50137-2011)” and considering the current situation in Dalian, the per capita construction land for special large cities should range from 70 to 110 square meters per person [
34]. The upper limit serves as the boundary between the urban–rural integration zone and the urban area, while the lower limit serves as the boundary between the urban–rural integration zone and the rural area.
2.5. Research Unit
Urban–rural integration zones in China currently encompass two intertwined spatial forms: residential communities (such as newly-built residential areas) and living clusters (such as urban villages) [
35]. In Dalian, small communities typically have a population of approximately 1000 to 5000 people and cover a land area of 20,000 to 90,000 square meters, accommodating around 500 households. In line with the spatial scales defined in urban and rural planning guidelines [
36], this study considers residential communities (natural villages) as the micro-scale spaces within urban–rural integration areas, spanning approximately 100 to 300 m. The living areas (administrative villages and community levels) with well-established infrastructure, characterized by main road spacing of approximately 300 to 1000 m, are considered as the macro-scale spaces. Previous studies on urban–rural integration zones have predominantly adopted macro- and meso-perspectives, with most research conducted at scales above 500 m. Thus, for this study, we selected an upper limit of 250 m for the spatial data scale, corresponding to the spatial management range of suburban neighborhoods or urban communities, based on residents’ daily travel radius and the maximum service radius of shops. By employing the first level of land use and land cover (LULC) classification, the study area was divided into grid cells, and a sampling analysis was conducted, considering the resolution of the research data and drawing insights from relevant studies [
10,
37]. The results of comparing sampling grids with side lengths of 100 m, 200 m, 250 m, 300 m, and 500 m reveal that a grid size of 250 m is the most suitable. Consequently, a total of 10,591 sampling areas were established, each with a basic analysis unit of 250 m × 250 m. To standardize each indicator and eliminate units of measurement bias, the following formula was employed [
38].
2.6. Weight Establishment
The determination of indicator weights aims to reflect the importance, scientific rigor, and practical relevance of each element. To achieve this, two methods were employed in this study: the entropy method and the expert scoring method. A detailed description of the results and comparisons can be found in the provided reference [
33].
The expert scoring method was implemented as follows: A concise questionnaire was developed based on the indicator system employed in this study, and consultative surveys were conducted with 12 experts and senior practitioners specializing in urban planning, geography, and landscape architecture within the local case city. The respondents were requested to rank the degree of influence of various factors on the identification of the urban–rural integration zone. Based on the questionnaire responses, the weights were proportionally calculated according to the cumulative rankings of the factors. Higher-ranked factors received larger weights, while lower-ranked factors received smaller weights. The resulting weightings were appropriately adjusted based on expert opinions.
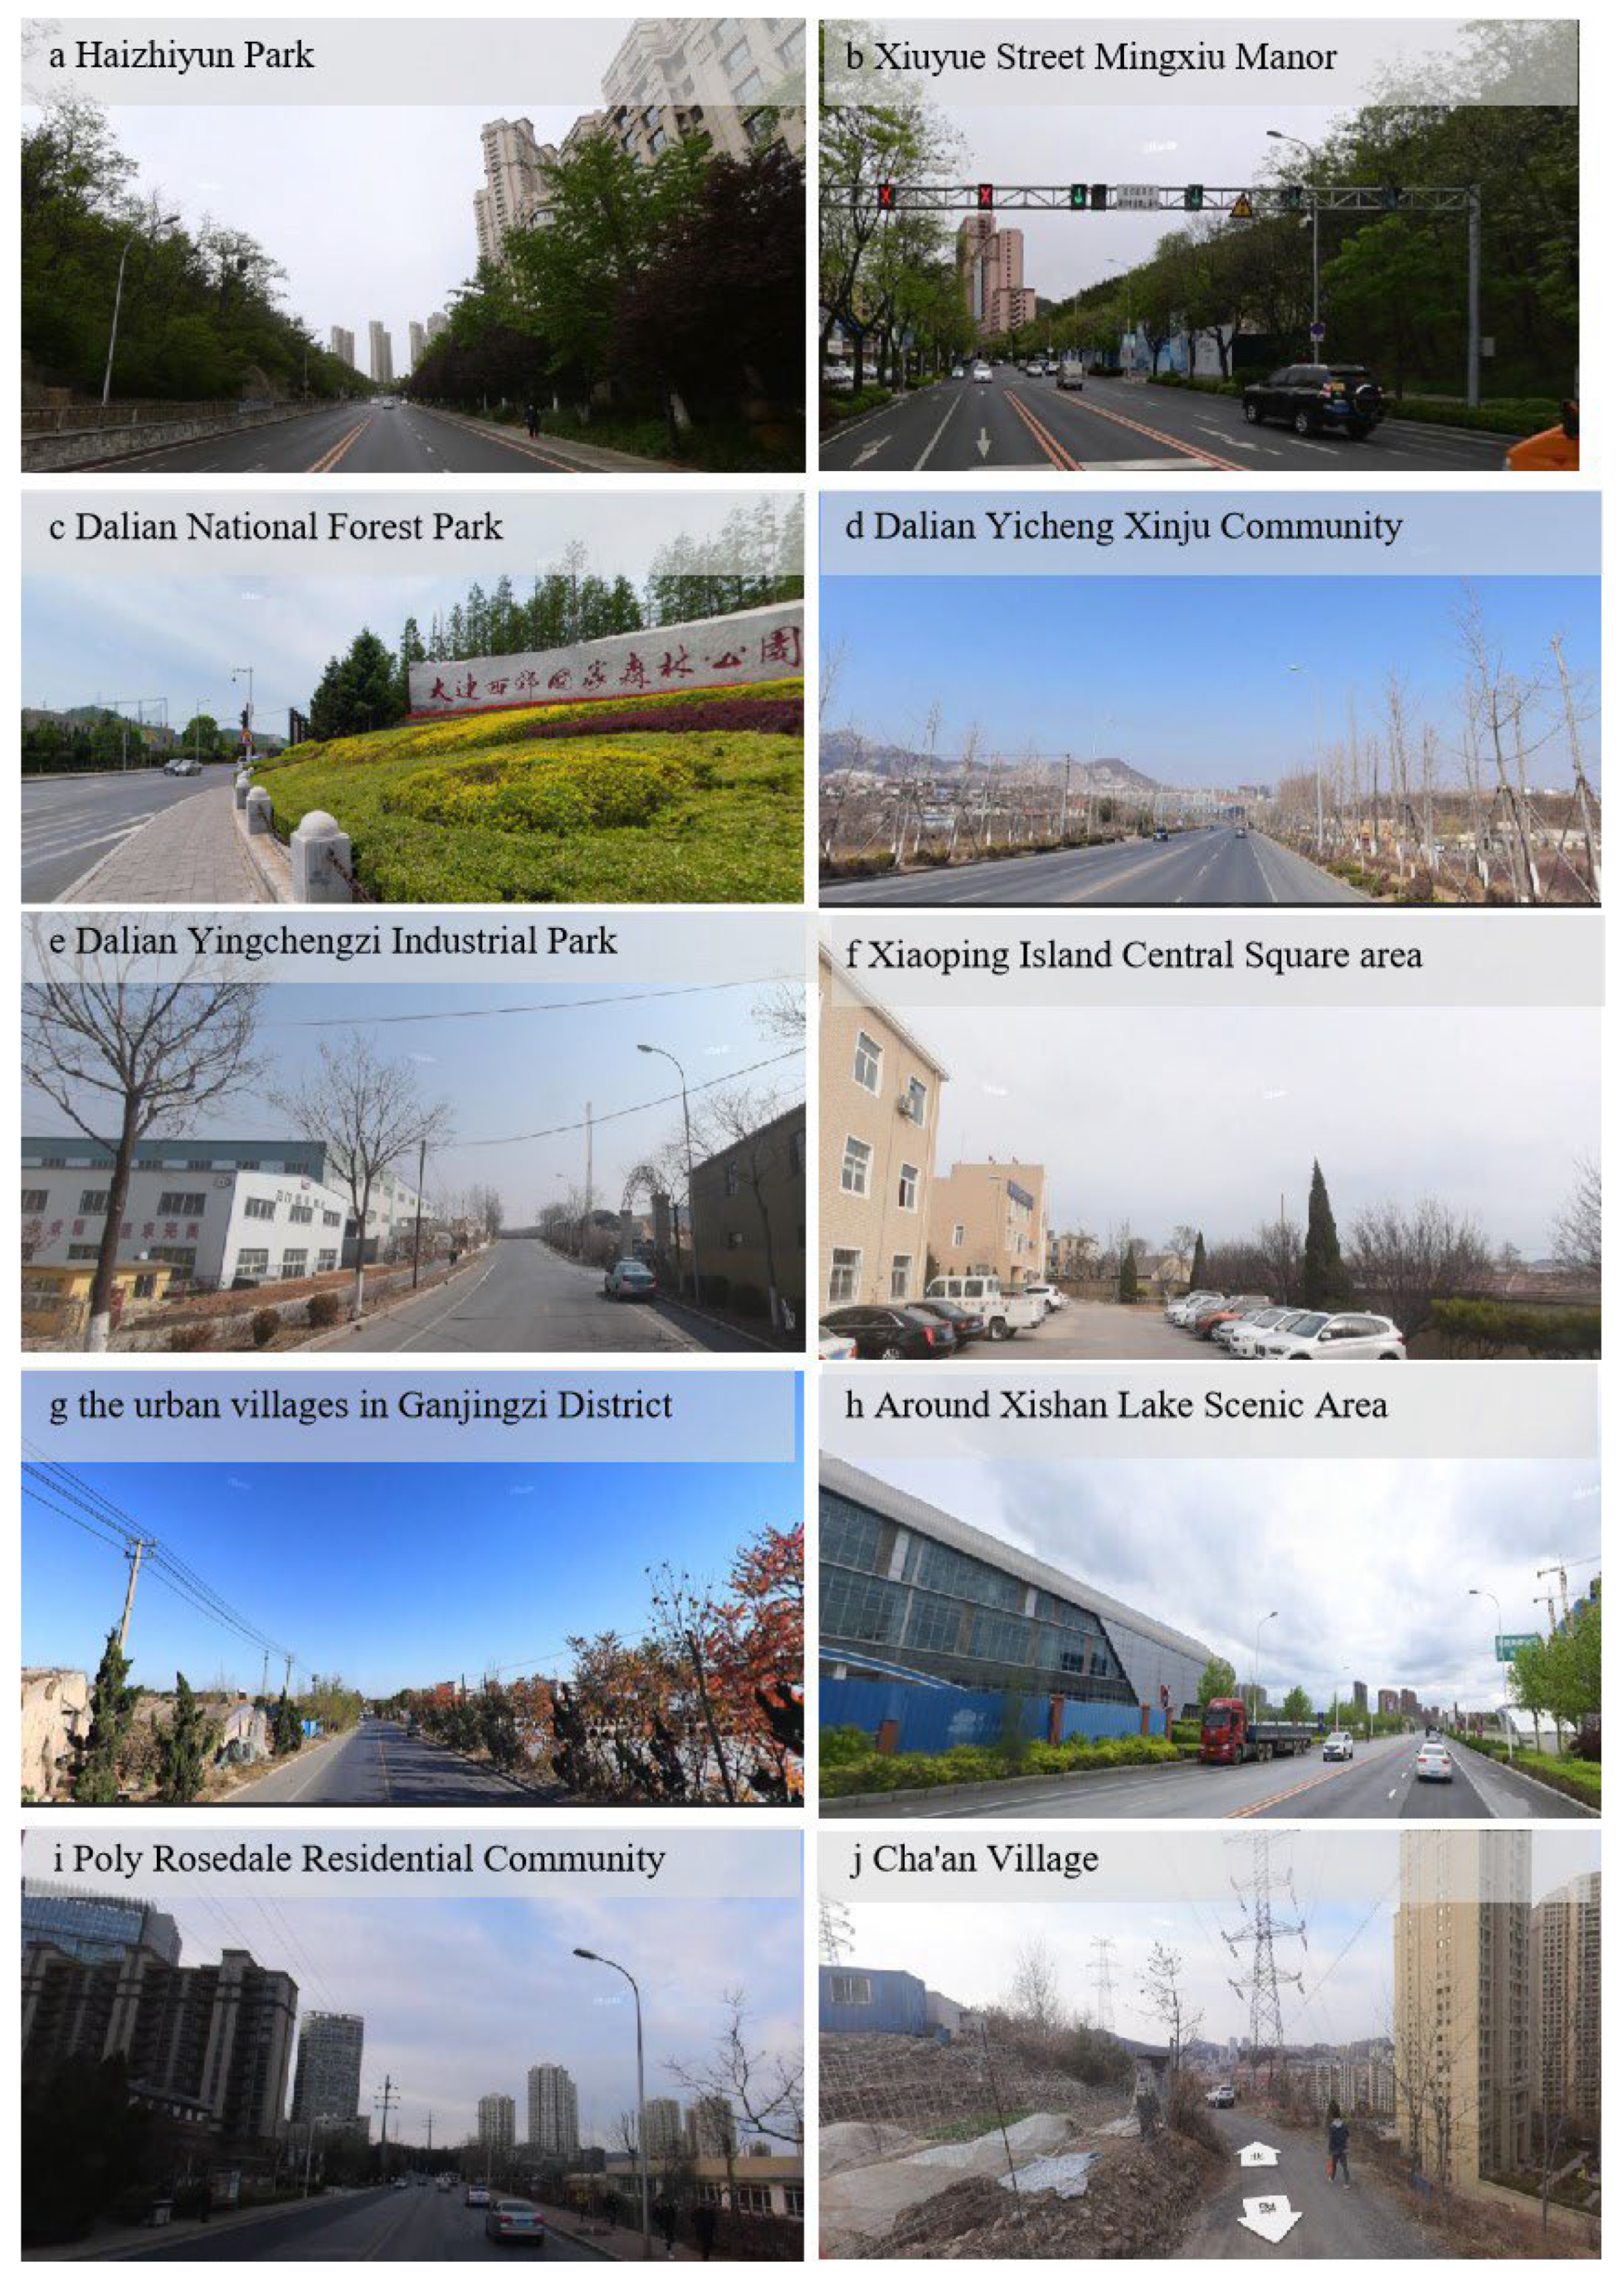
To provide further validation regarding the influence of the two weight assignment methods on the research outcomes, a random sampling approach was employed to assess the spatial identification results of the urban–rural integration zone generated by the two distinct weight methods. A total of fifty sampling grids were randomly selected as samples, and field investigations were conducted in areas not covered by the real scene impact map. Among the selected samples, forty-four out of fifty samples obtained through the entropy method satisfied the division criteria, whereas only thirty-seven out of fifty samples obtained through the weight method met the division criteria. Hence, it can be concluded that the entropy method is deemed appropriate for weight assignment in the present study.
6. Discussion
This study adopts symbiosis theory and urban expansion theory as guiding frameworks for recognizing the urban–rural integration space. Two methods, namely the G-statistics method and the urban–rural integration space–rural space gradient model, are employed to identify the spatial extent of the urban–rural integration belt in Dalian. Given the inherent ambiguity surrounding the boundary of the urban–rural integration space, existing research lacks a standardized criterion for selecting factors to define its spatial boundary. It is evident that the urban–rural integration space encompasses multiple factors. Hence, this study incorporates landscape pattern attributes and social attribute indicators into the identification system, thereby enhancing the index system used to identify the spatial scope of the urban–rural integration belt. Both the G-statistics method and the urban–rural integration belt–rural space gradient model prove valuable in identifying the urban–rural integration belt. Different regions and backgrounds possess unique characteristics and dynamics that influence the integration of urban and rural areas. By comparing various approaches, adjustments and customization of methods can be made to adapt to specific regional contexts. Researchers and policymakers can select or develop methods that are most suitable for capturing the subtle differences and complexities of urban–rural integration in specific areas by considering a range of approaches. Such assessments can provide information for evidence-based decision-making and help refine and strengthen strategies for urban–rural integration. The choice of methods for identifying urban–rural transition zones carries policy significance and impacts the decision-making process. Different approaches may emphasize different areas or aspects of integration, which can affect the prioritization of resources, target interventions, and policy formulation. Through empirical analysis, it becomes evident that each method possesses its own strengths and limitations, and their suitability depends on the research objectives, data availability, analysis scale, and expected outcomes of the urban–rural integration area. Consequently, when researchers select methods to identify the urban–rural integration belt and interpret its spatial patterns and dynamics, careful consideration of these factors is crucial.
The urban–rural integration zone in Dalian exhibits notable spatial characteristics, encompassing spatial proximity, economic integration, and social integration. Positioned between urban and rural areas, the integration zone is marked by close physical proximity, combined with a blend of residential, commercial, and industrial land uses. The rural and urban economies exhibit interdependence, facilitating the movement of goods, services, and individuals between the two regions. Owing to the high cost of living in the central urban area, individuals have relocated from rural areas to both urban areas and the urban–rural integration zone. As a result, the population within the urban–rural integration zone continues to grow, accompanied by an increase in population density. Serving as a significant economic region, the urban–rural integration zone focuses on agriculture, manufacturing, and service industries. This concentration has fostered the development of agriculture, industry, logistics, and tourism within the zone. Moreover, the urban–rural integration zone benefits from a well-established infrastructure, encompassing roads, bridges, and public transportation systems, which facilitate the seamless flow of people and goods between urban and rural areas. Consequently, the urban–rural integration zone has emerged as a pivotal economic region characterized by diversified land uses and robust infrastructure, while simultaneously prioritizing environmental preservation and sustainable development.
Limitations: Despite the advancements made in researching symbiotic theory and urban expansion, there remains a need for further theoretical exploration to strengthen its practical application in studying urban–rural integration zones. Additionally, insufficient attention has been paid to investigating the sentiments of residents living within the urban–rural integration zone. The inclusion of bottom-up decision-making processes is vital for accurately identifying such zones. Furthermore, the selection of indicators for identifying urban–rural integration areas, based on G-statistics and urban–rural spatial gradient models, is constrained by the availability of data sources. The consideration of more granular data, such as urban–rural household registration, social security, and housing information, has not been adequately incorporated. Additionally, there is a need to adopt a dynamic approach in identifying urban–rural integration zones, incorporating indicators that better capture the flow characteristics between urban and rural areas, such as factor flow and urban land ownership. To address these limitations, further comprehensive research efforts are warranted in these areas.
7. Conclusions
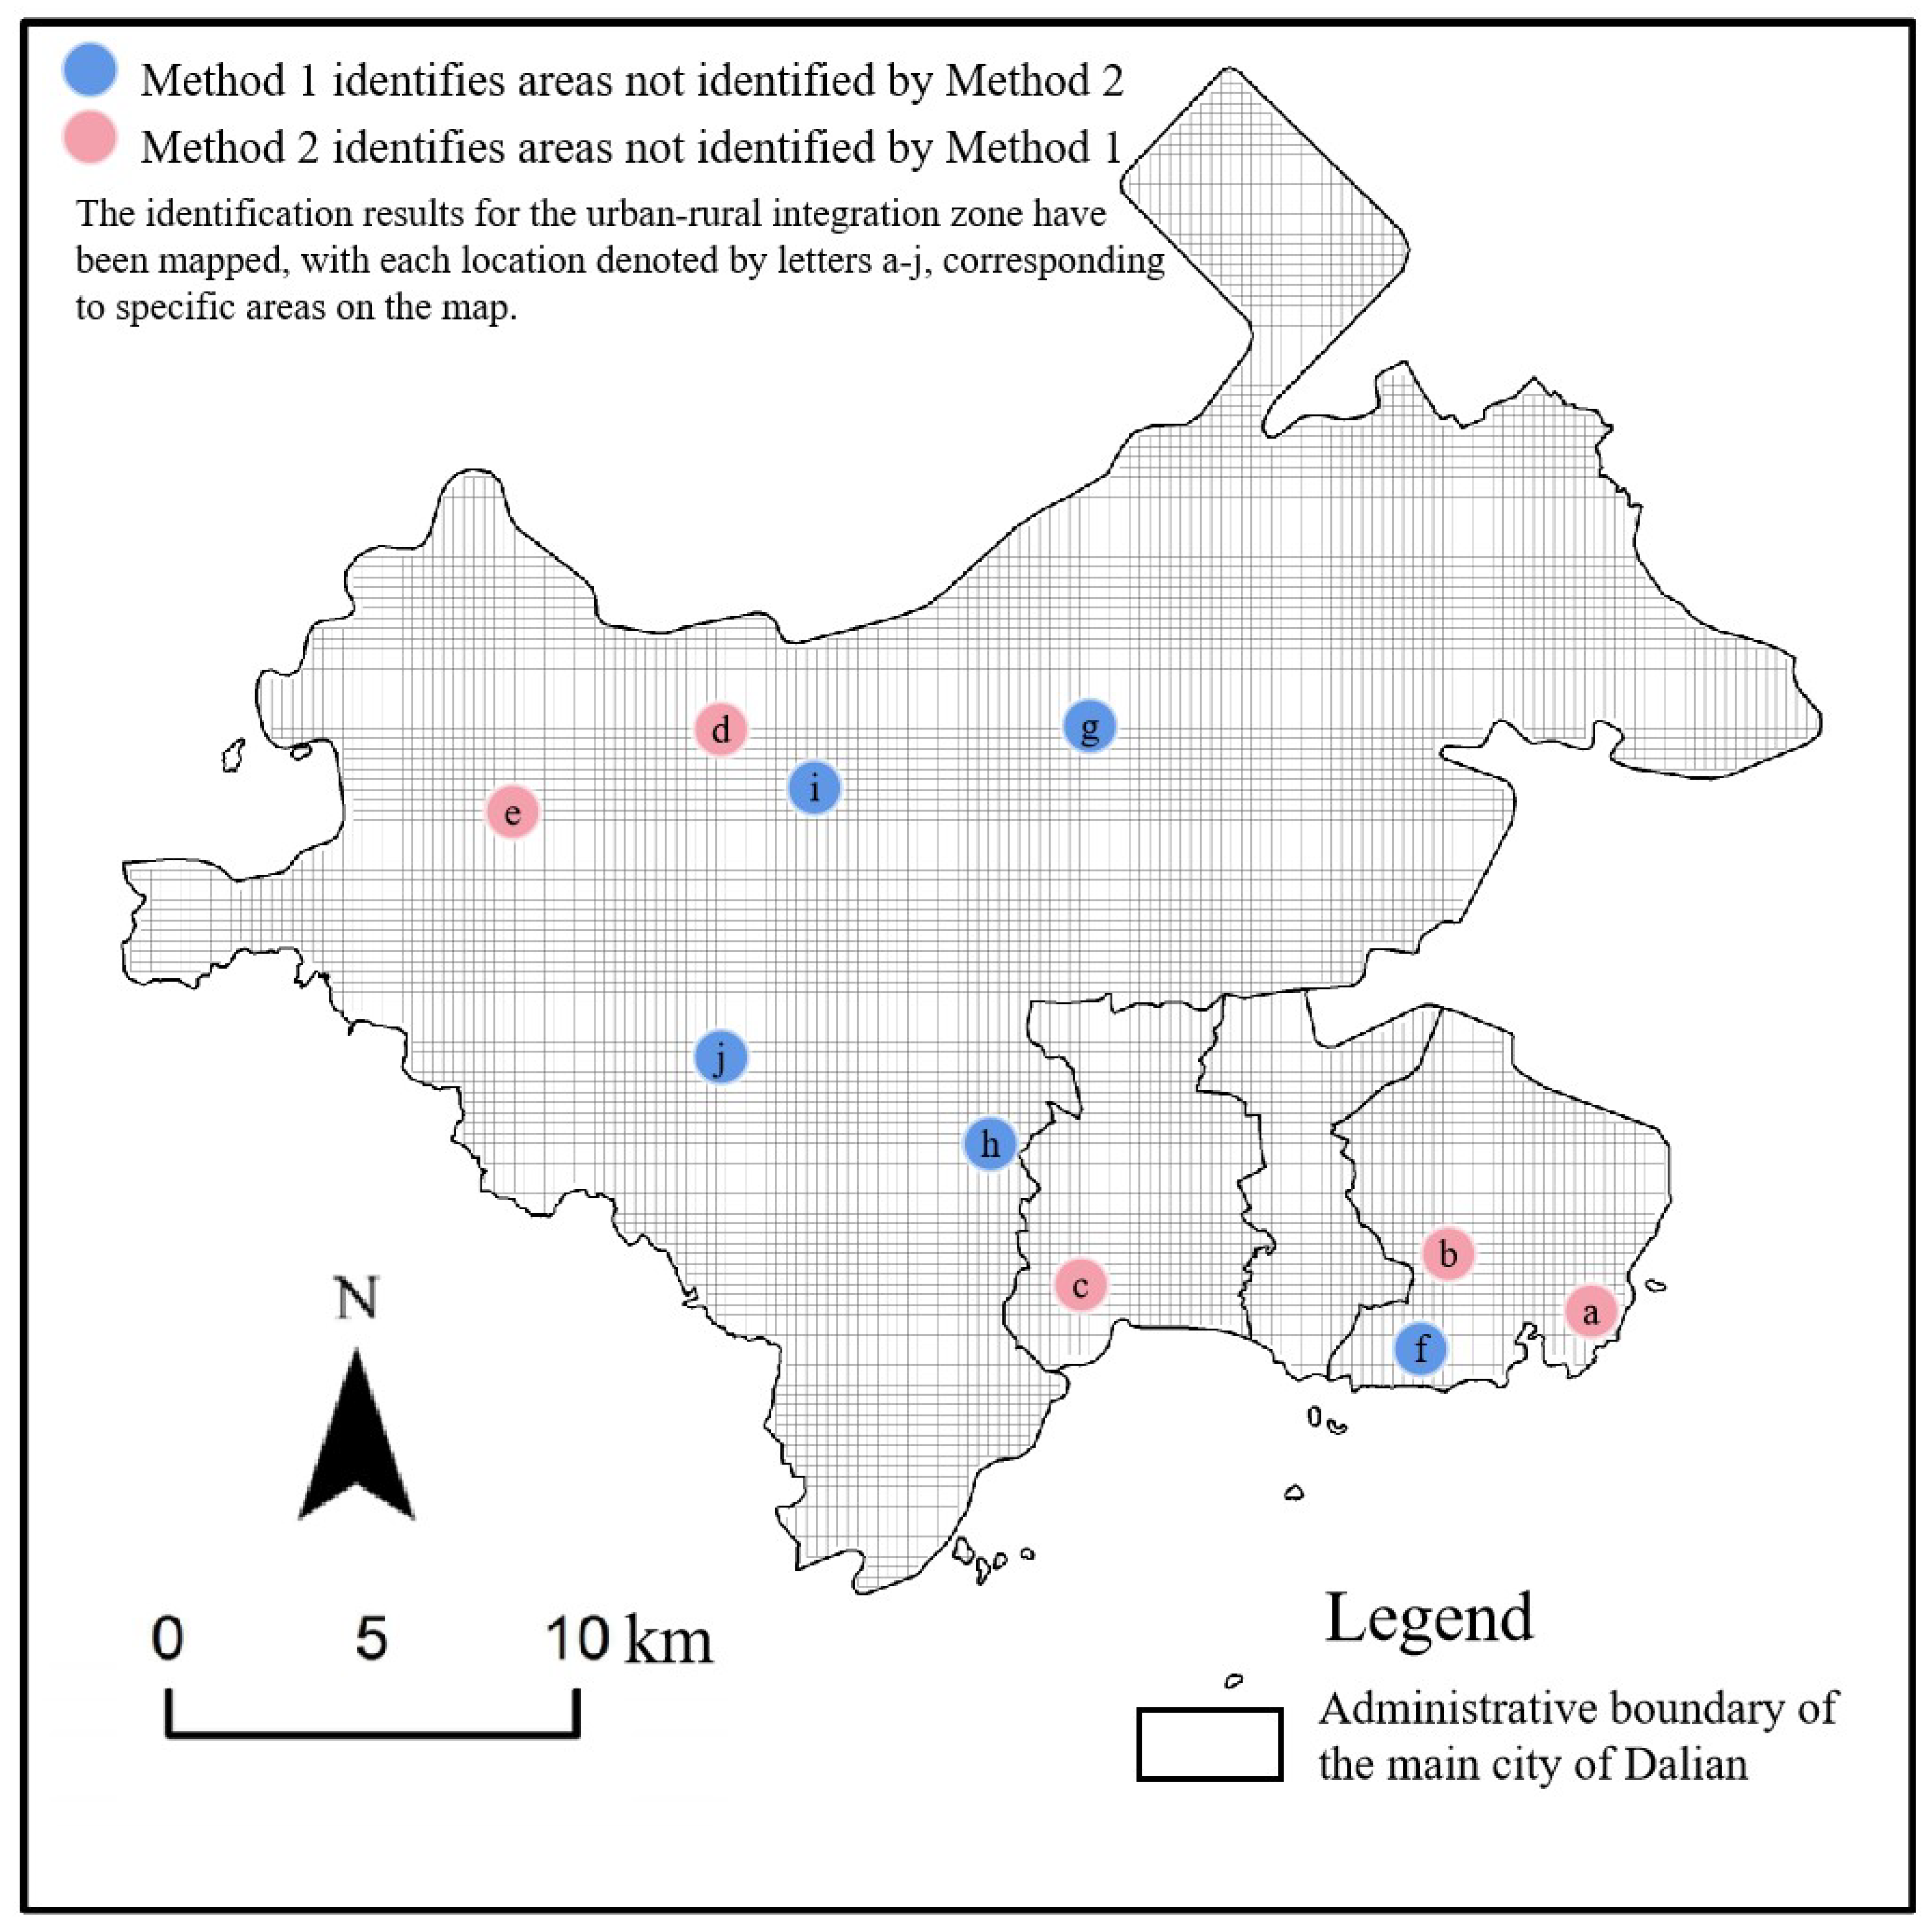
The identification of urban–rural integration spaces in various cities is characterized by heterogeneity, which requires the consideration of diverse methods and indicator systems. In the case of Dalian, two methods employed to identify the spatial distribution characteristics of its urban–rural integration zone exhibit fundamental agreement. However, the primary discrepancy lies in the selection of land units situated within the “intermediate zone.” These areas, encircling the city, possess advantageous geographical positions and strong ecological foundations, having developed into ecological parks throughout the urbanization process. Consequently, a tension arises between economic value and ecological benefits. This study yielded several key findings, which are summarized as follows:
(1) The spatial distribution of the urban–rural integration zone in Dalian primarily manifests in the northwestern and southern regions of the main urban area, spanning along the coastline and transportation routes, and is strongly influenced by the hilly topography. The presence of hilly terrain and coastal urban development contributes to the irregular and patchy spatial configuration of the urban–rural integration zone.
(2) The core area of Dalian’s main urban region encompasses expansive mountainous forests, which significantly impact the delimitation of urban–rural integration zones. The inclusion of mountainous forest areas on the urban fringe within the urban–rural space warrants careful consideration, contingent upon the specific developmental requirements of different cities. The hilly terrain affects certain indicators in the system, rendering some factors that are applicable to the division of urban–rural integration zones in other cities unsuitable for use, such as surface temperature and vegetation coverage.
(3) The integration of symbiosis theory and urban expansion theory holds substantial value in guiding the identification of urban–rural integration zones. The applicability of the G-statistic method may be more suitable for delimiting such zones in cities significantly influenced by terrain, where topographic factors play a pronounced role. Conversely, the urban–rural gradient model method may prove more appropriate for demarcating urban–rural integration zones in cities where the impact of terrain on urban expansion is minimal and the terrain exhibits relatively flat characteristics.


