

Influence of the Built Environment on Older Adults’ Travel Time: Evidence from the Nanjing Metropolitan Area, China

Abstract
:1. Introduction
2. Literature Review
3. Materials and Methods
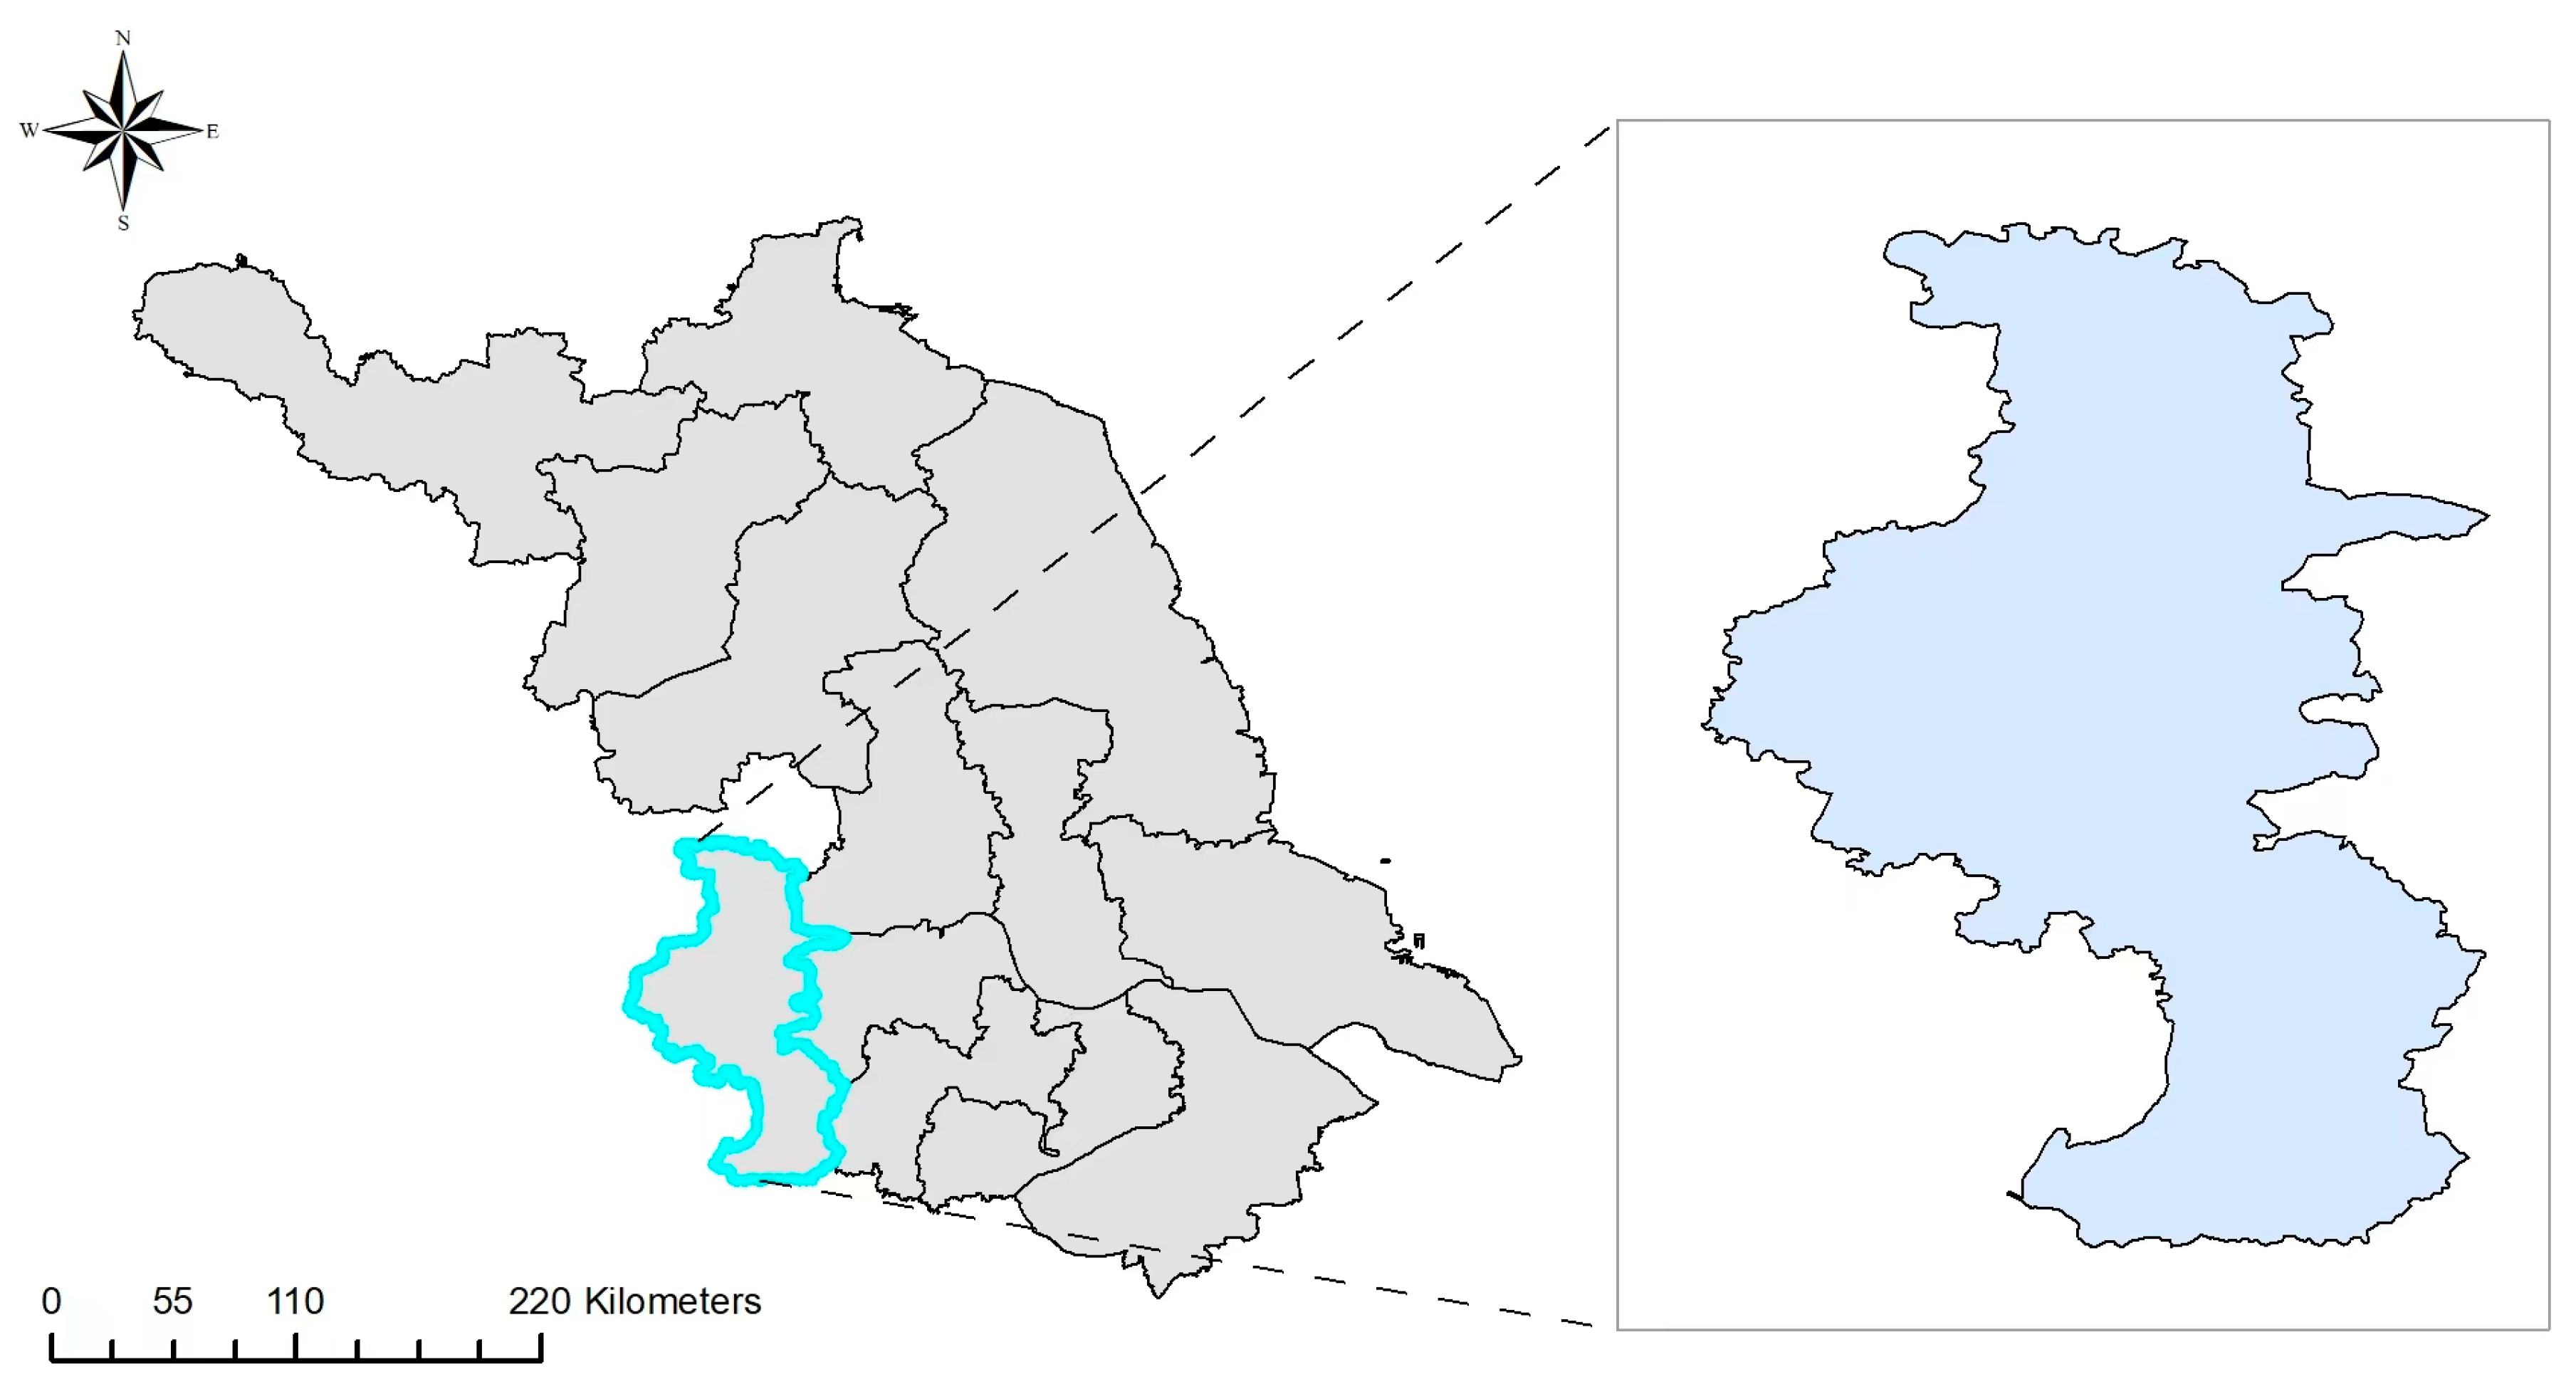
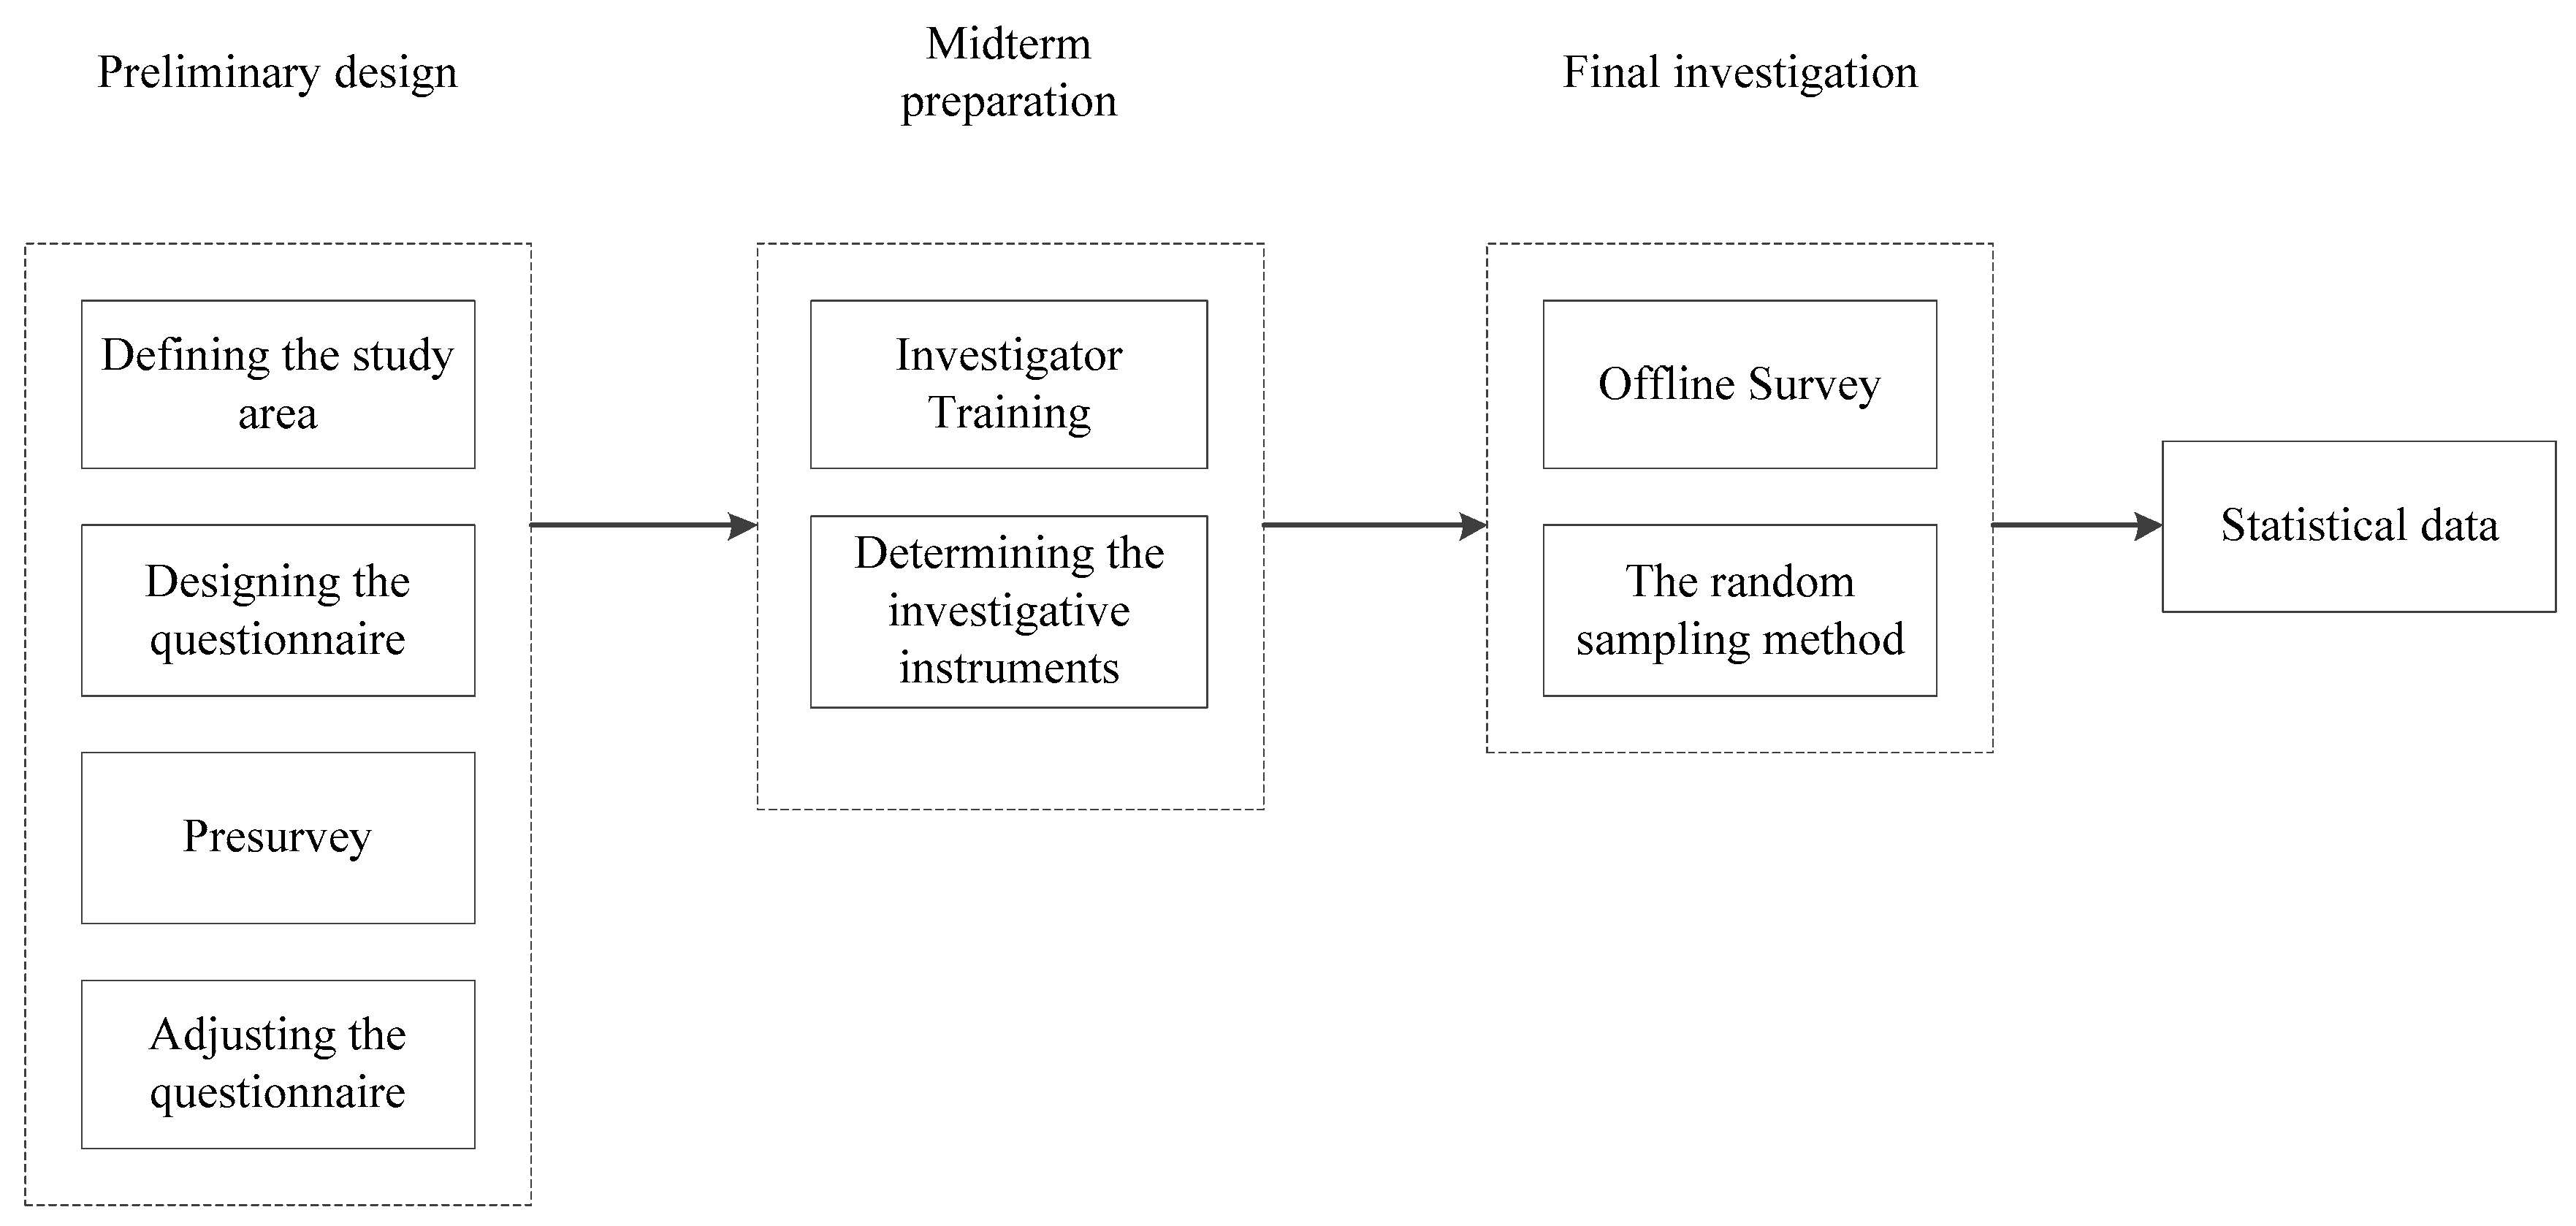
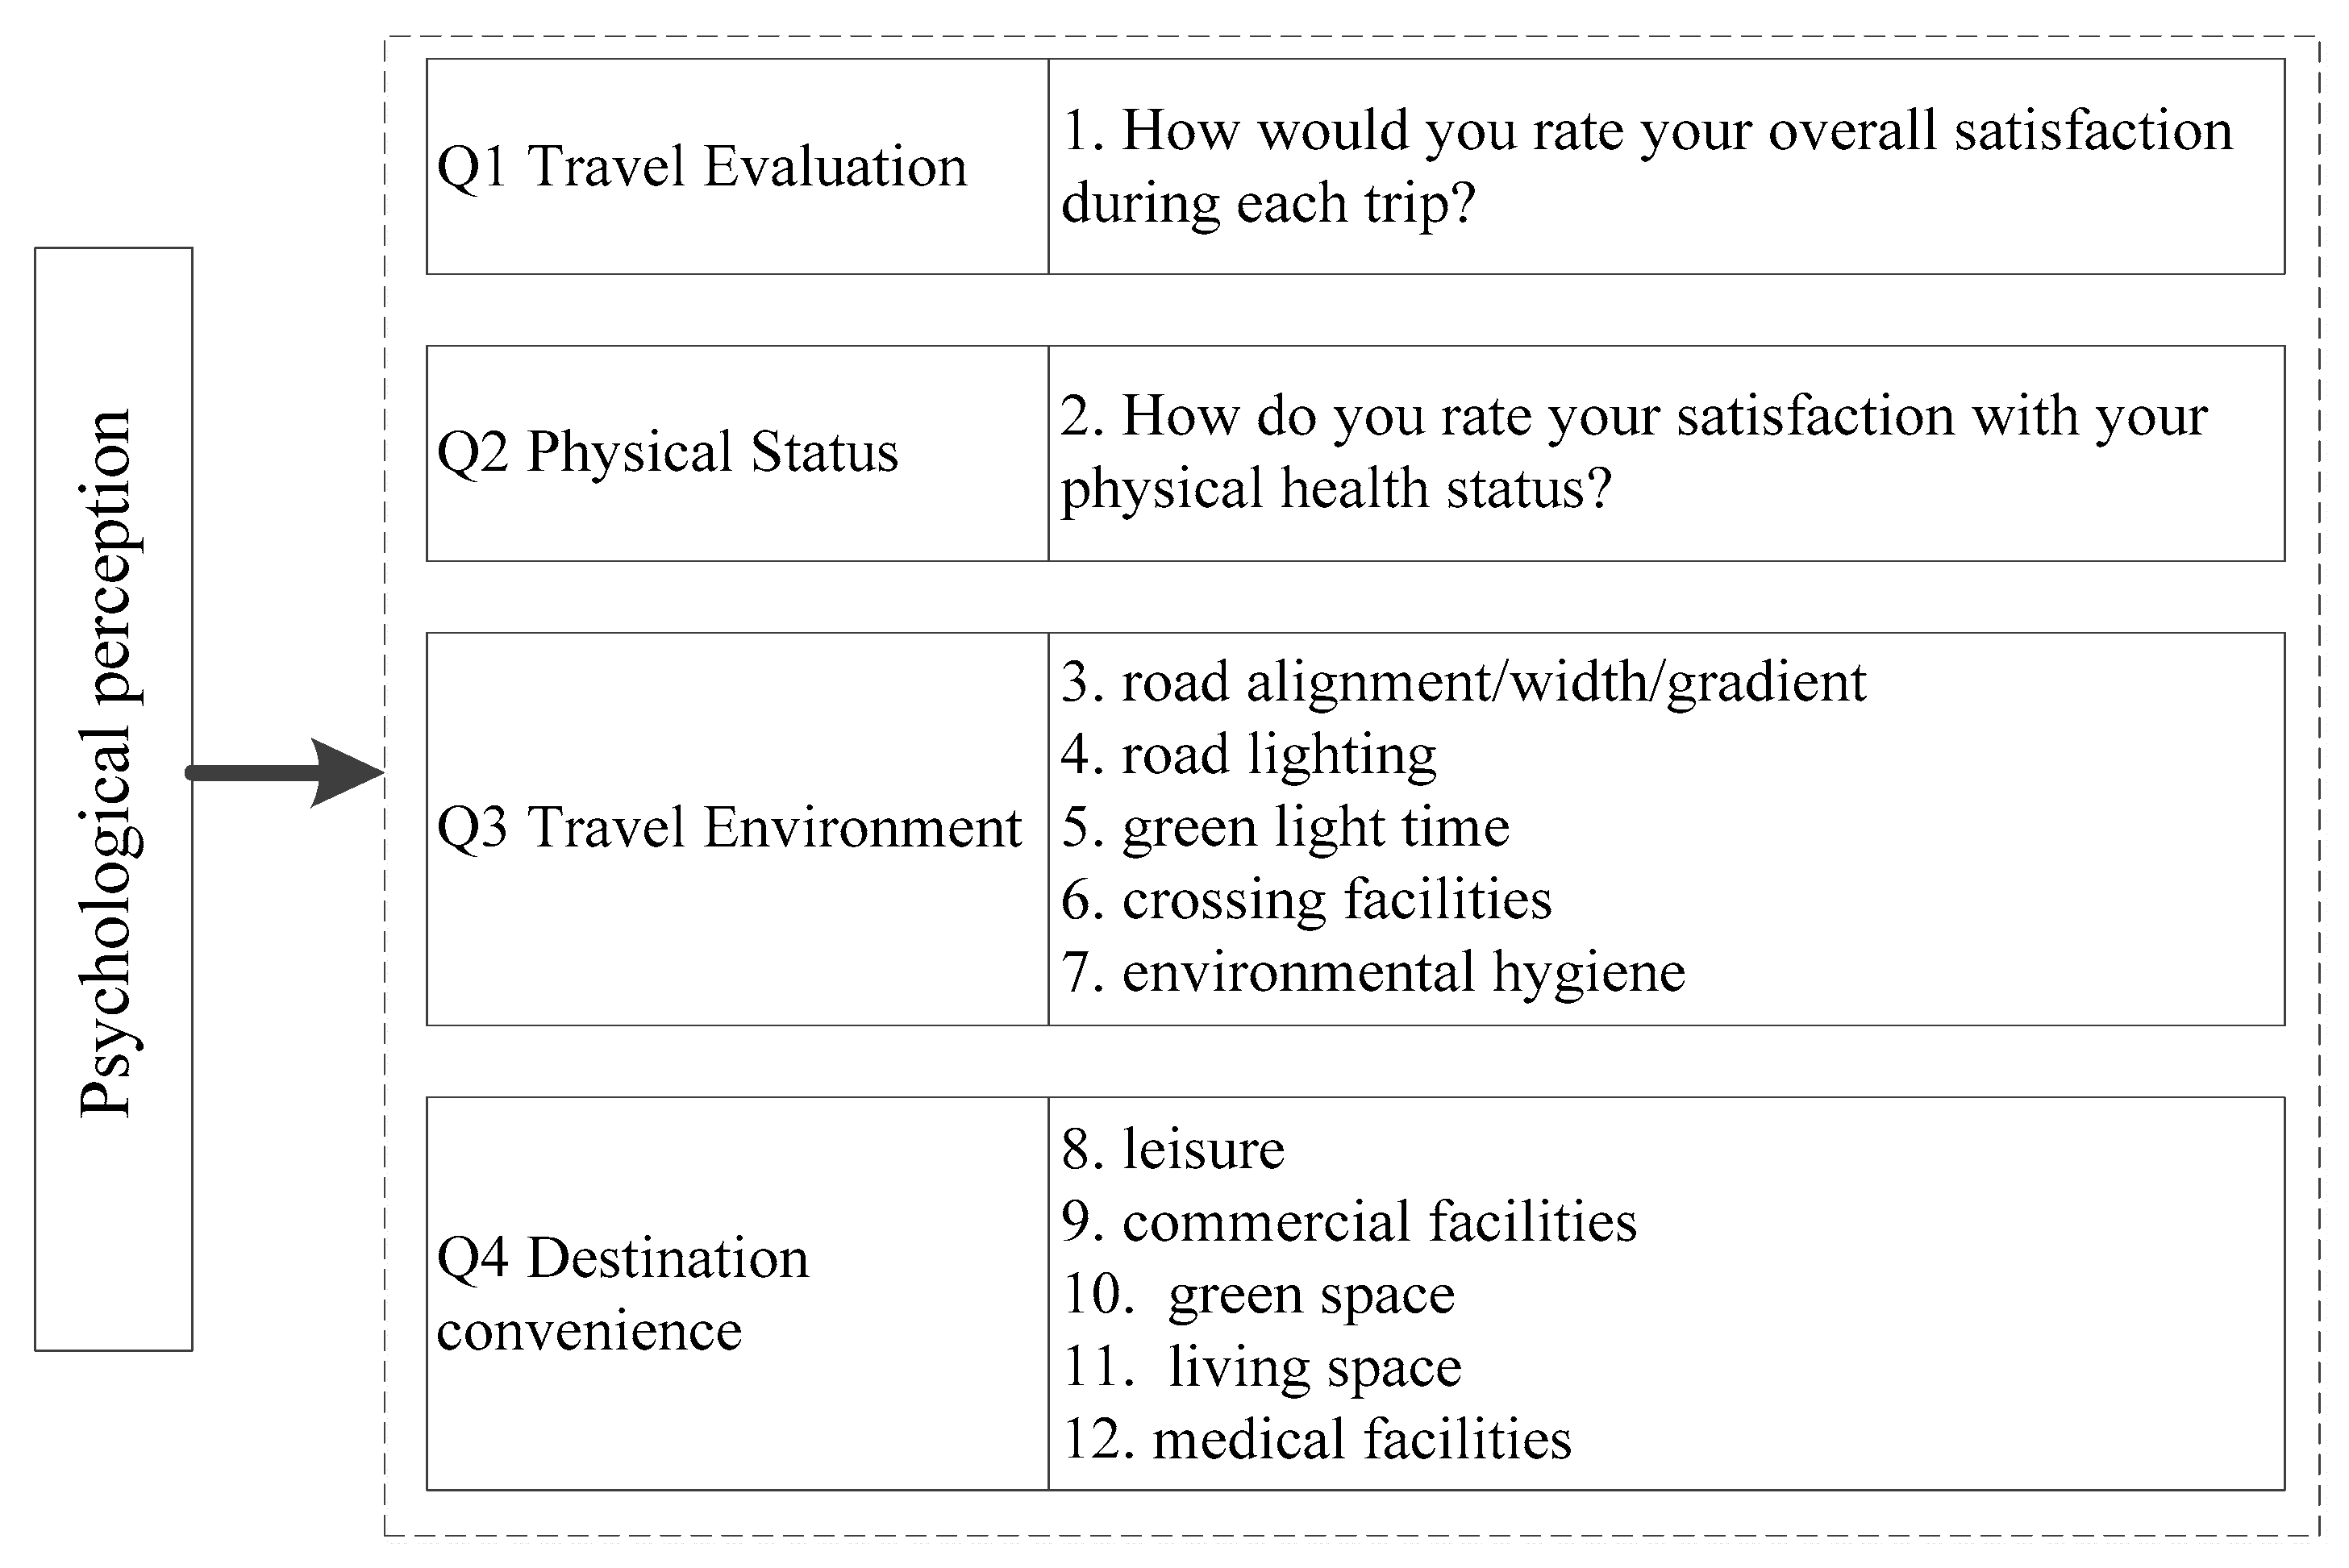
3.1. Data
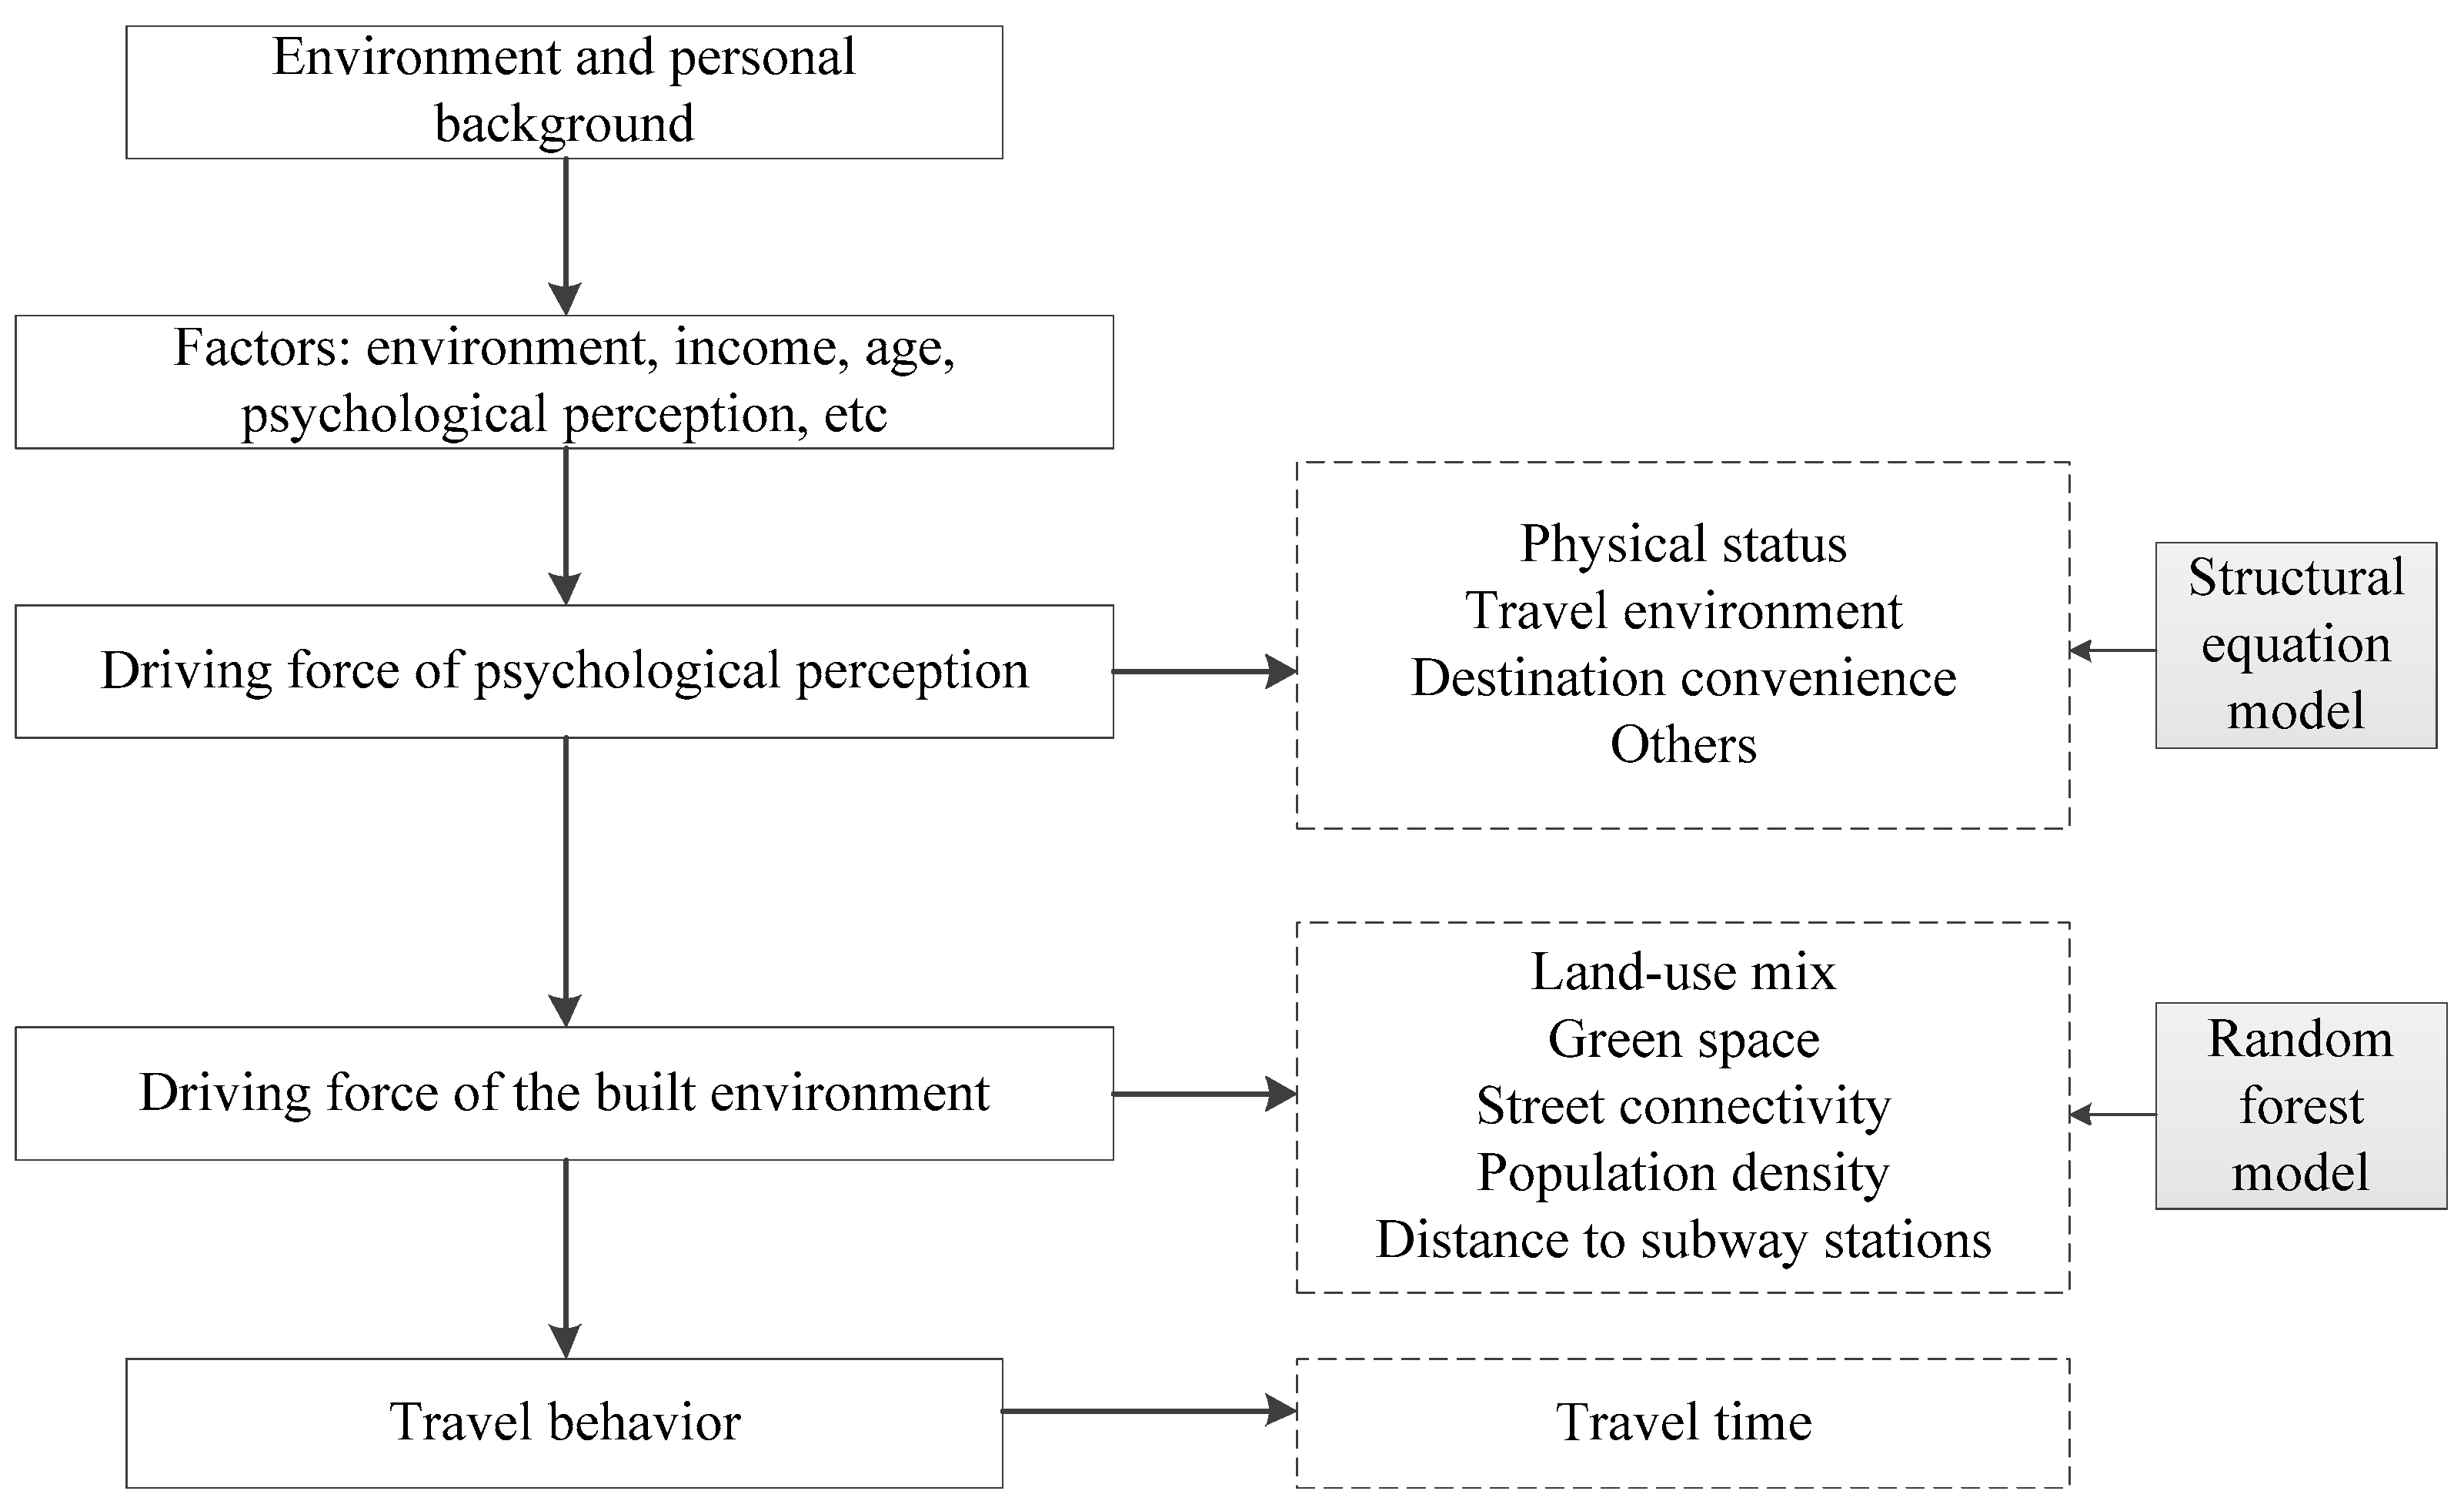
3.2. Methods
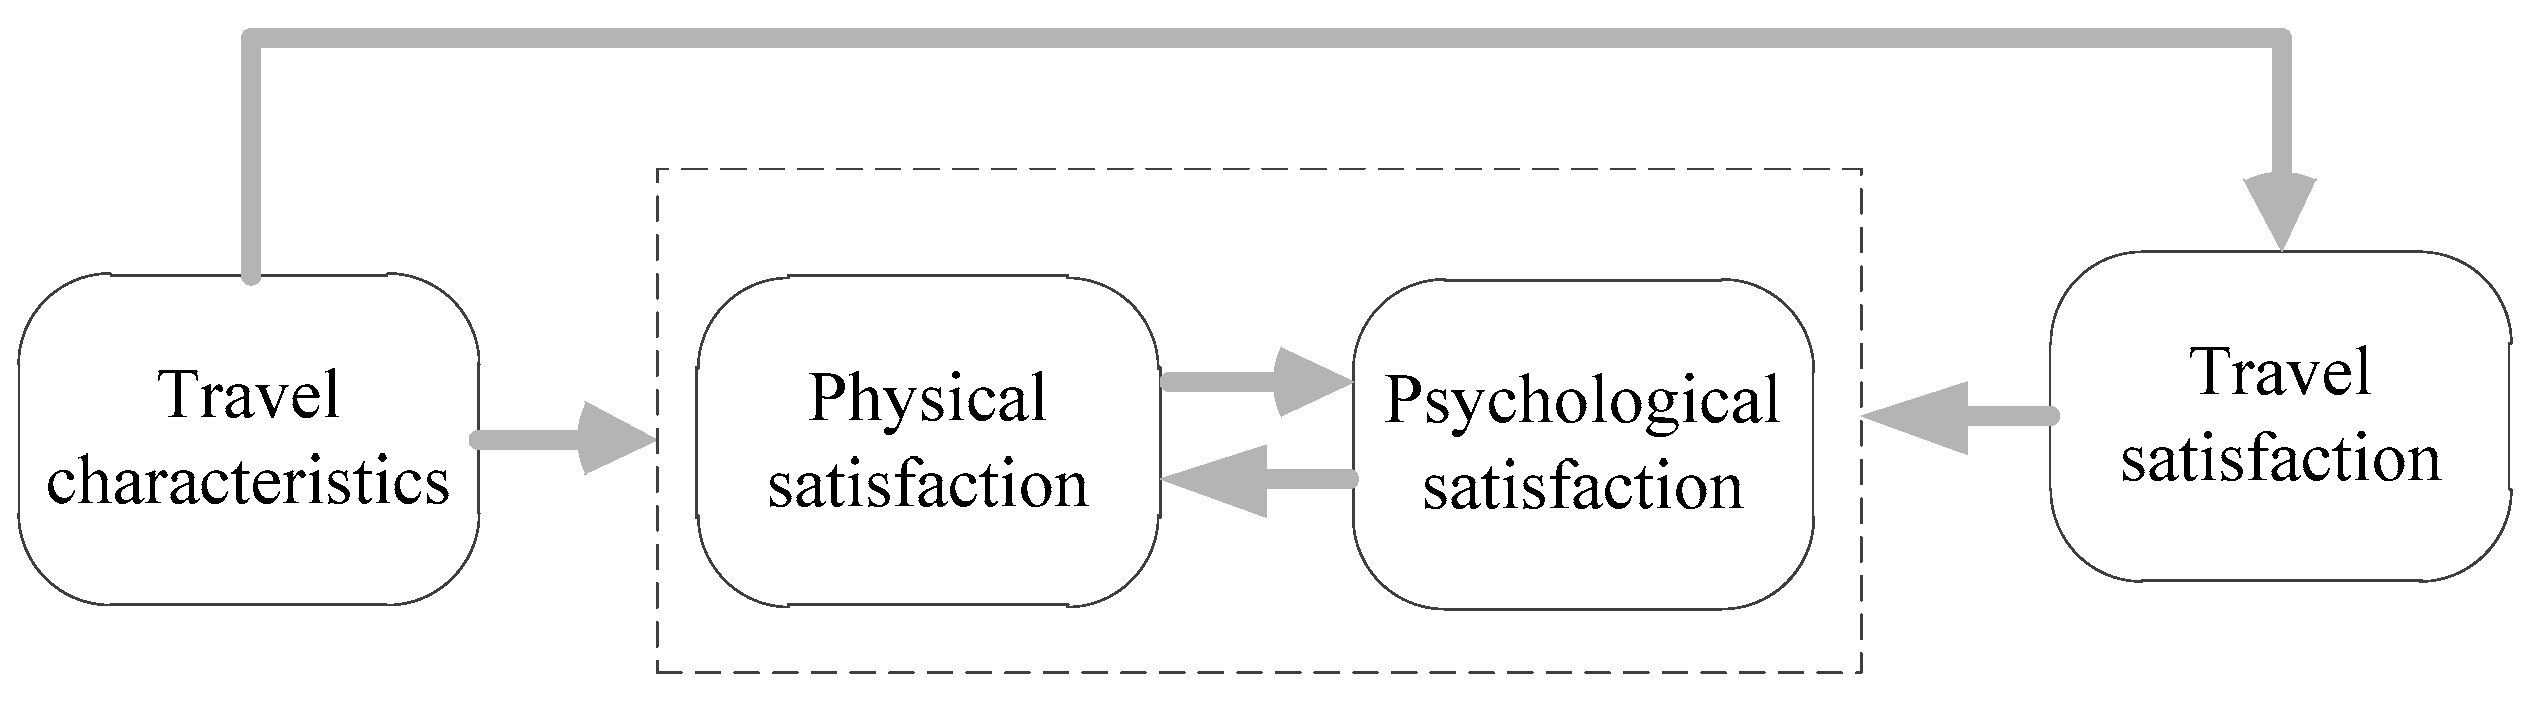
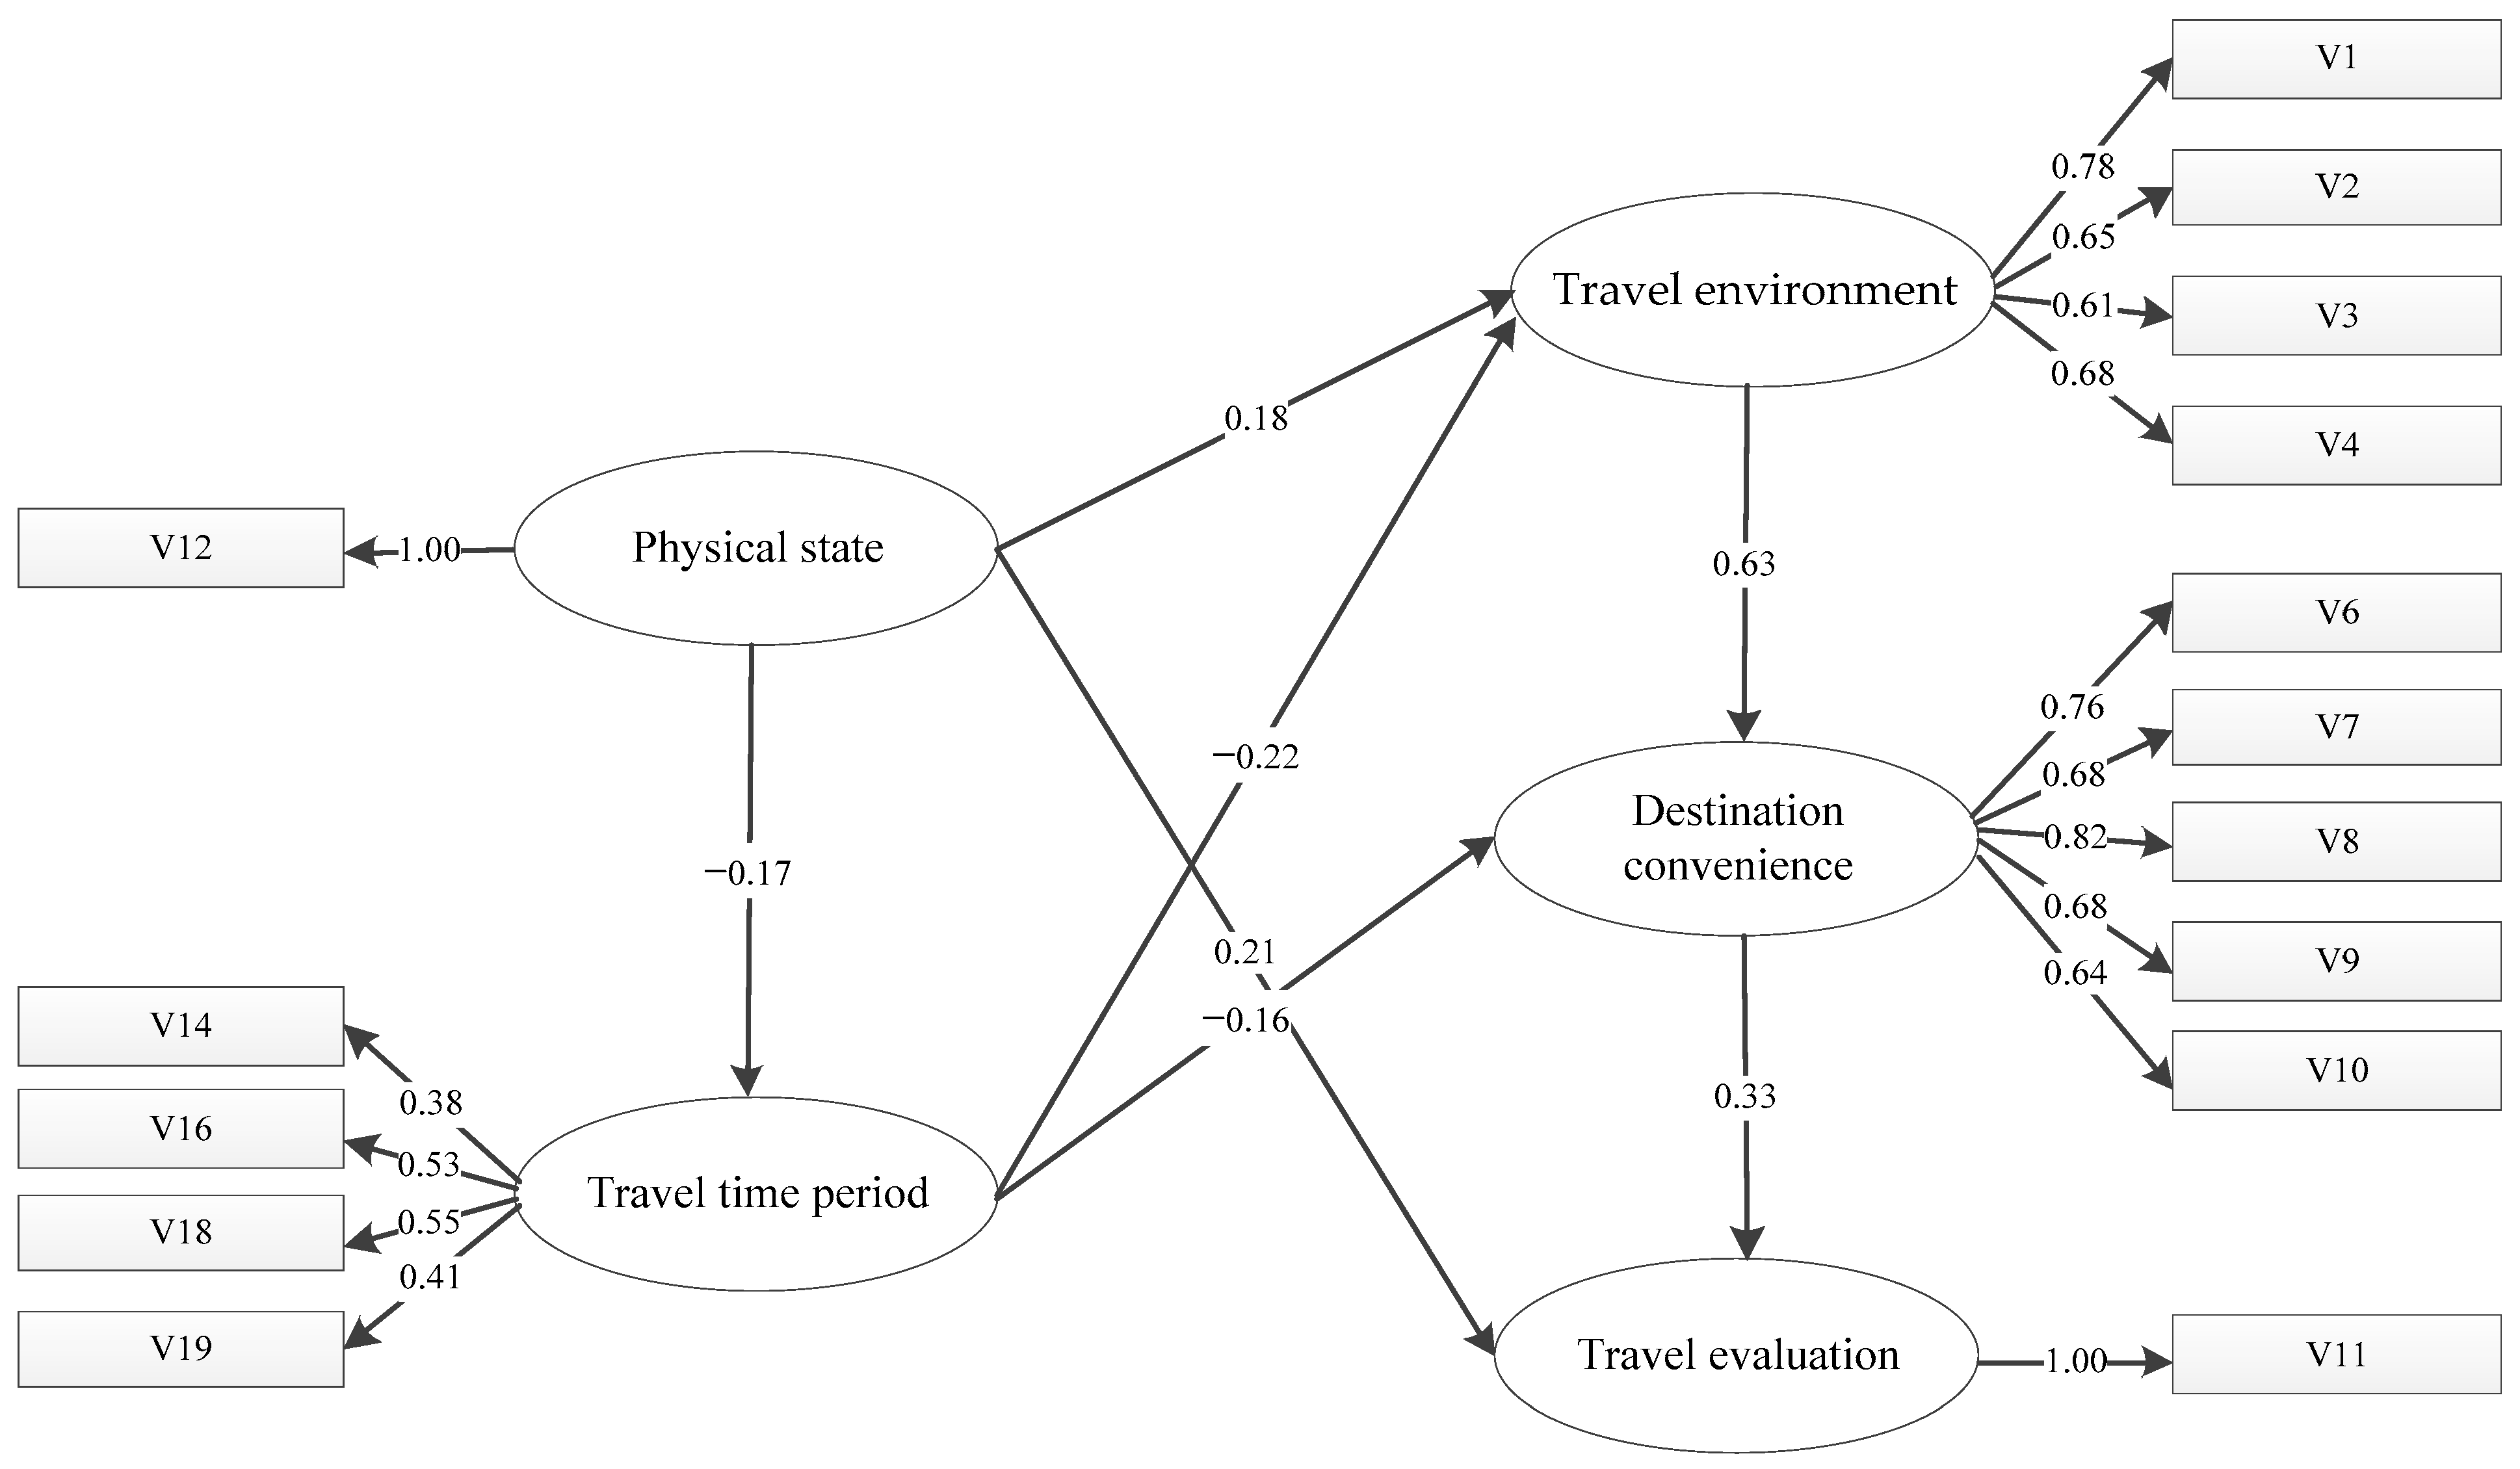
3.2.1. Structural Equation Model
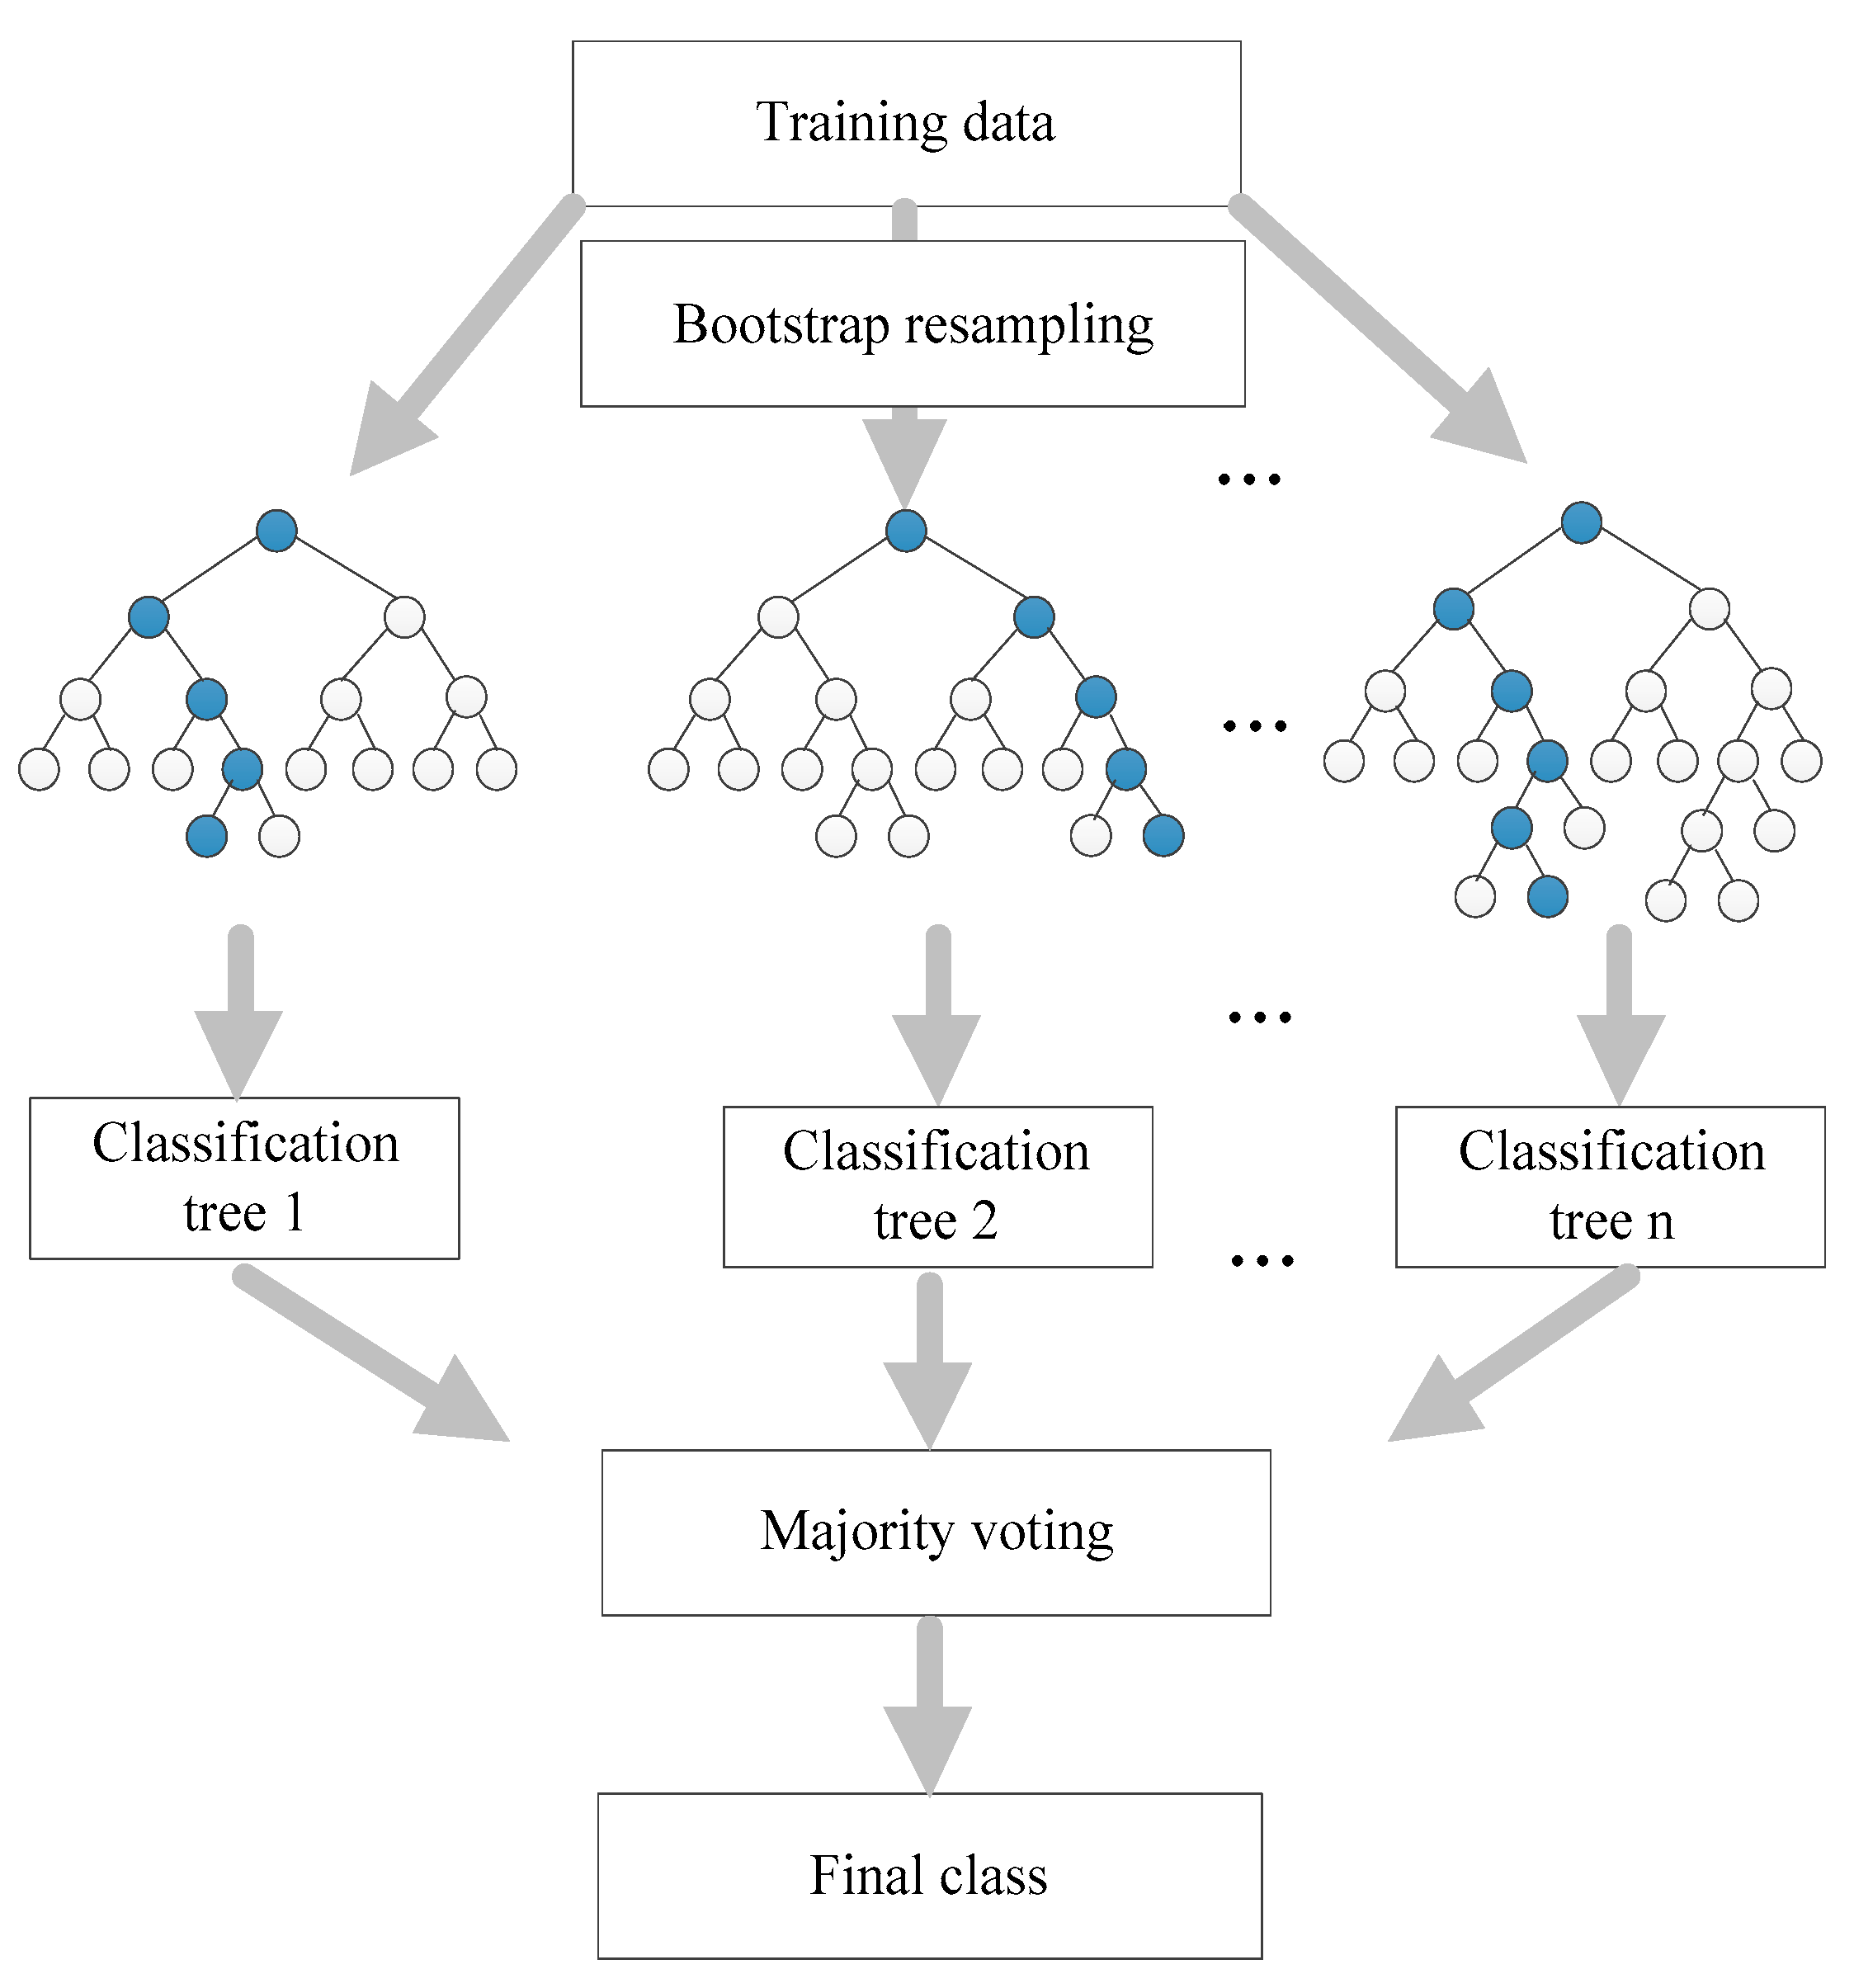
3.2.2. Random Forest Model
- Randomly samples some training sets from the original dataset with replacement.
- Constructs a decision tree for each training set and predicts the results.
- Using the voting method, the decision tree classification category with the most votes is the final category (non-weighted average method).
4. Results and Discussion
4.1. Data Descriptive Results
4.2. Relative Importance of Explanatory Variables
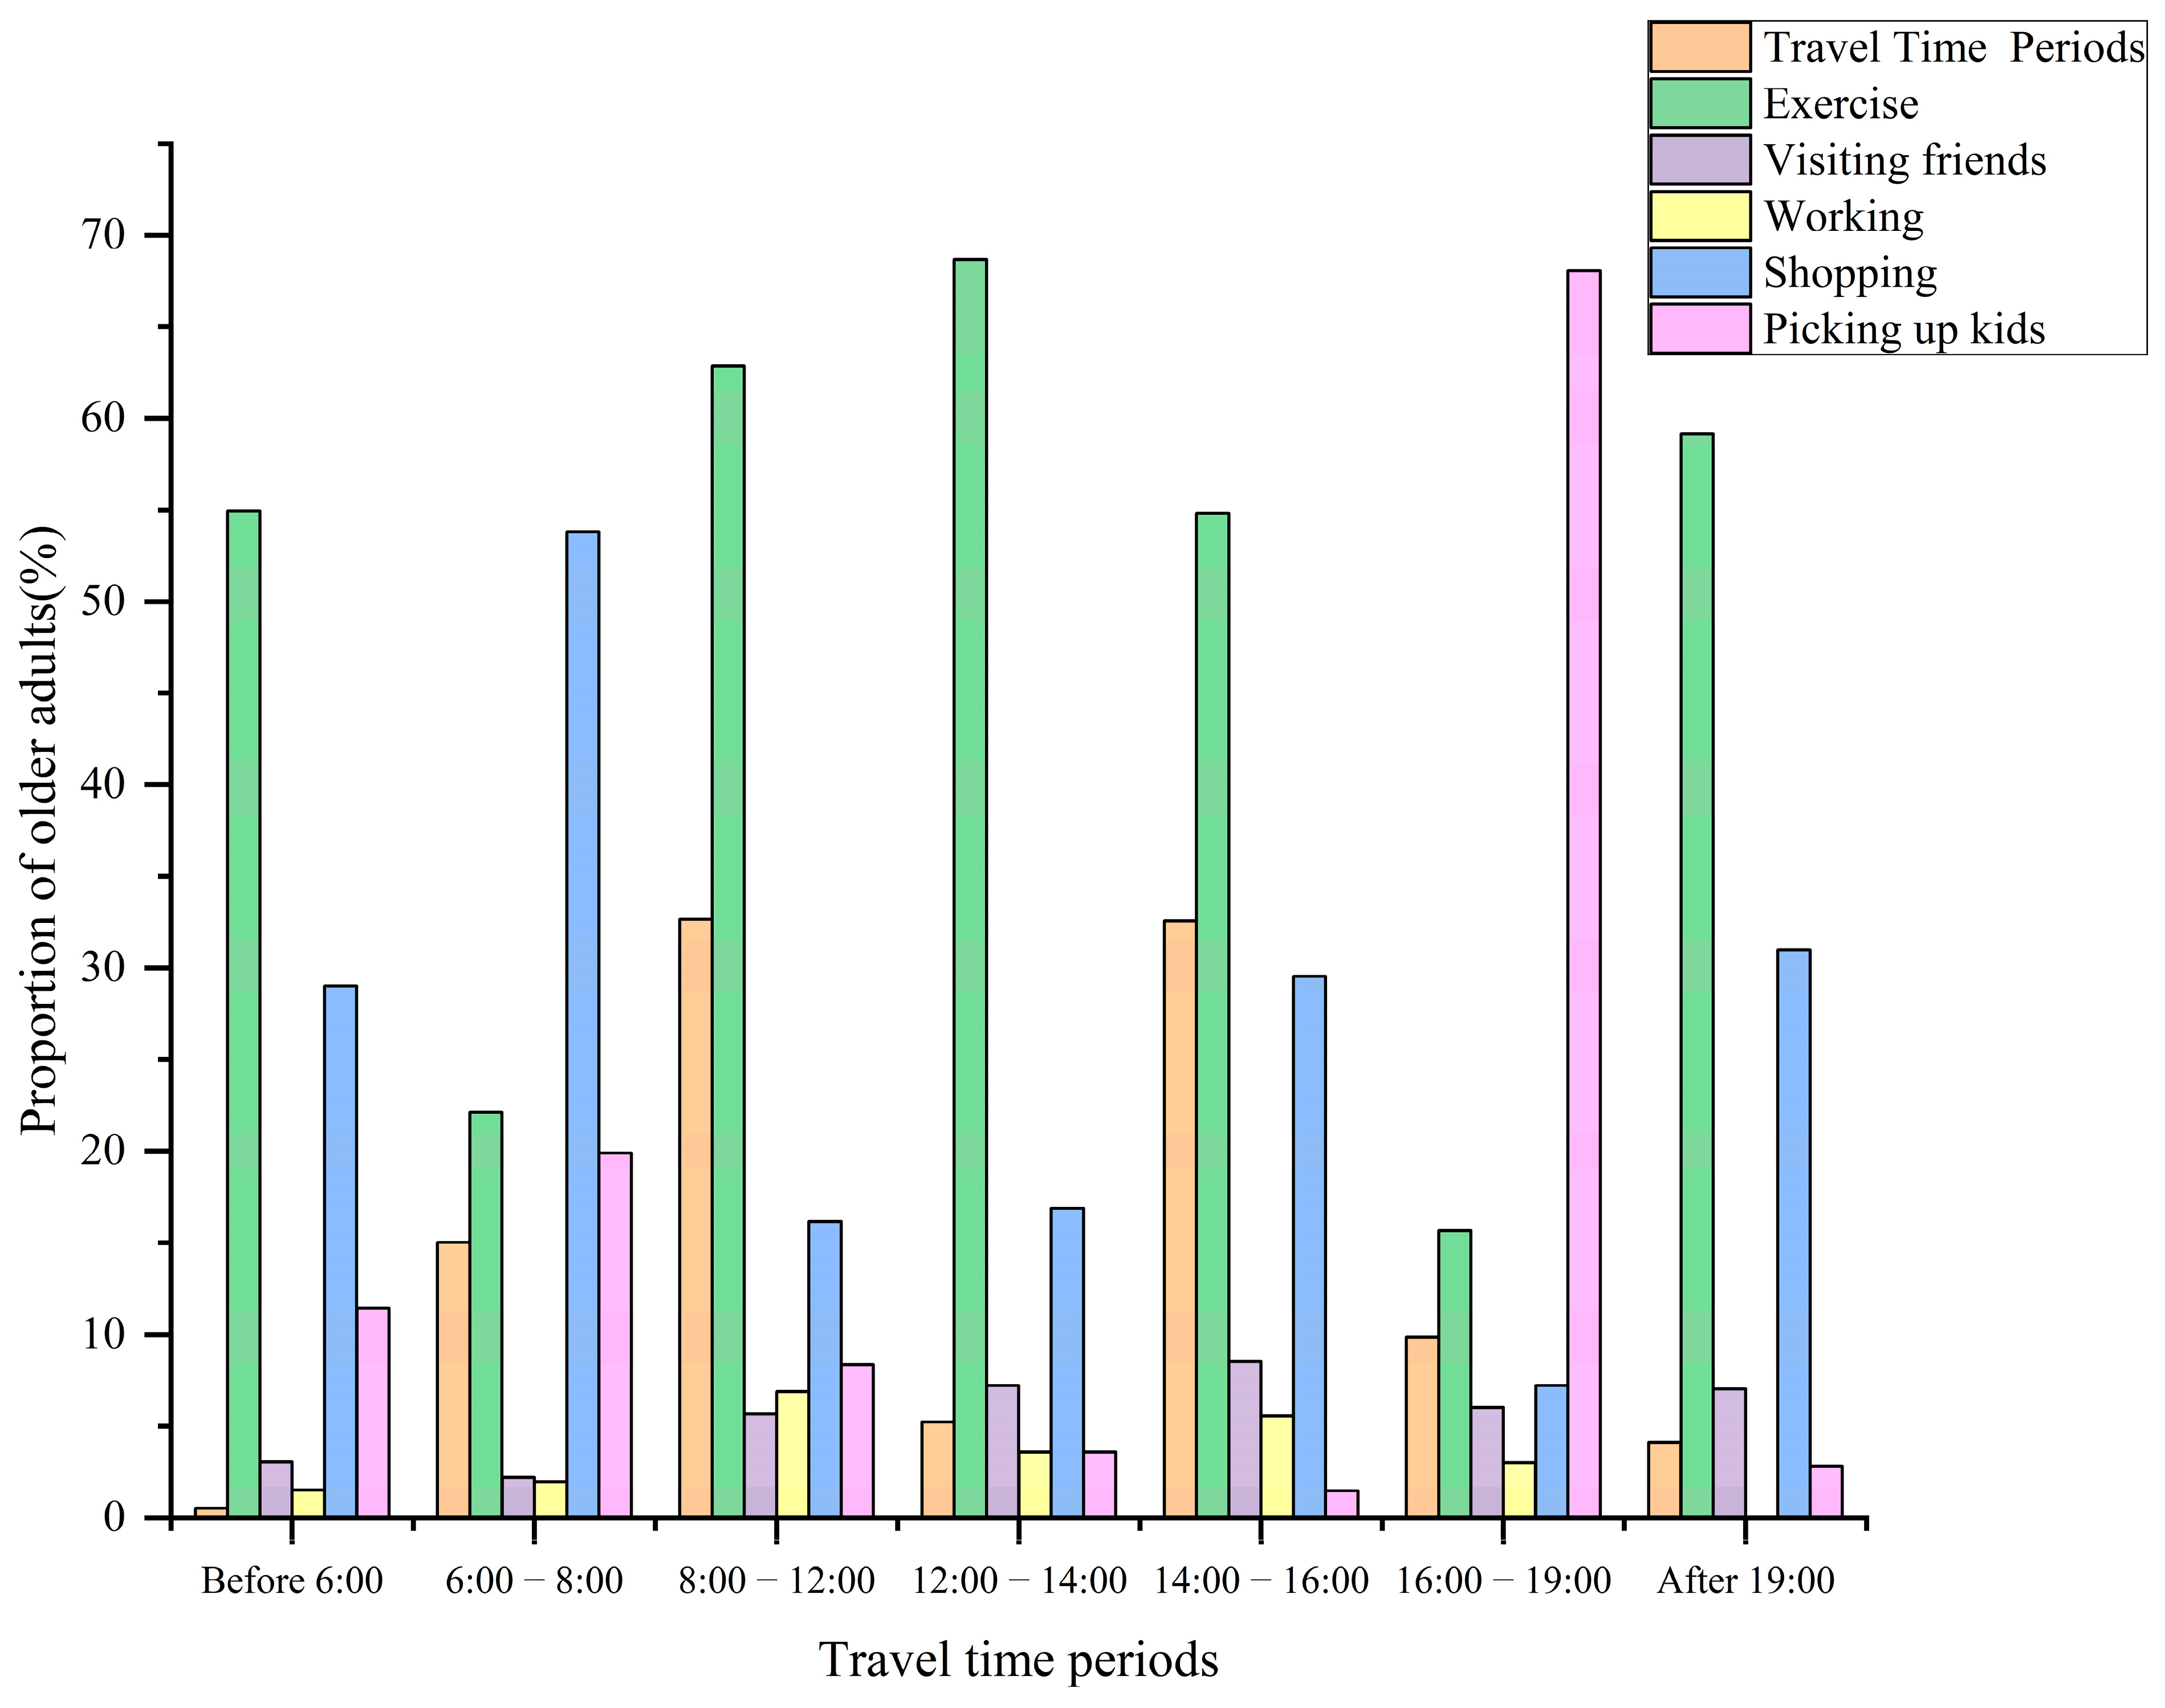
4.3. Travel-Perception Analysis for Different Travel Times
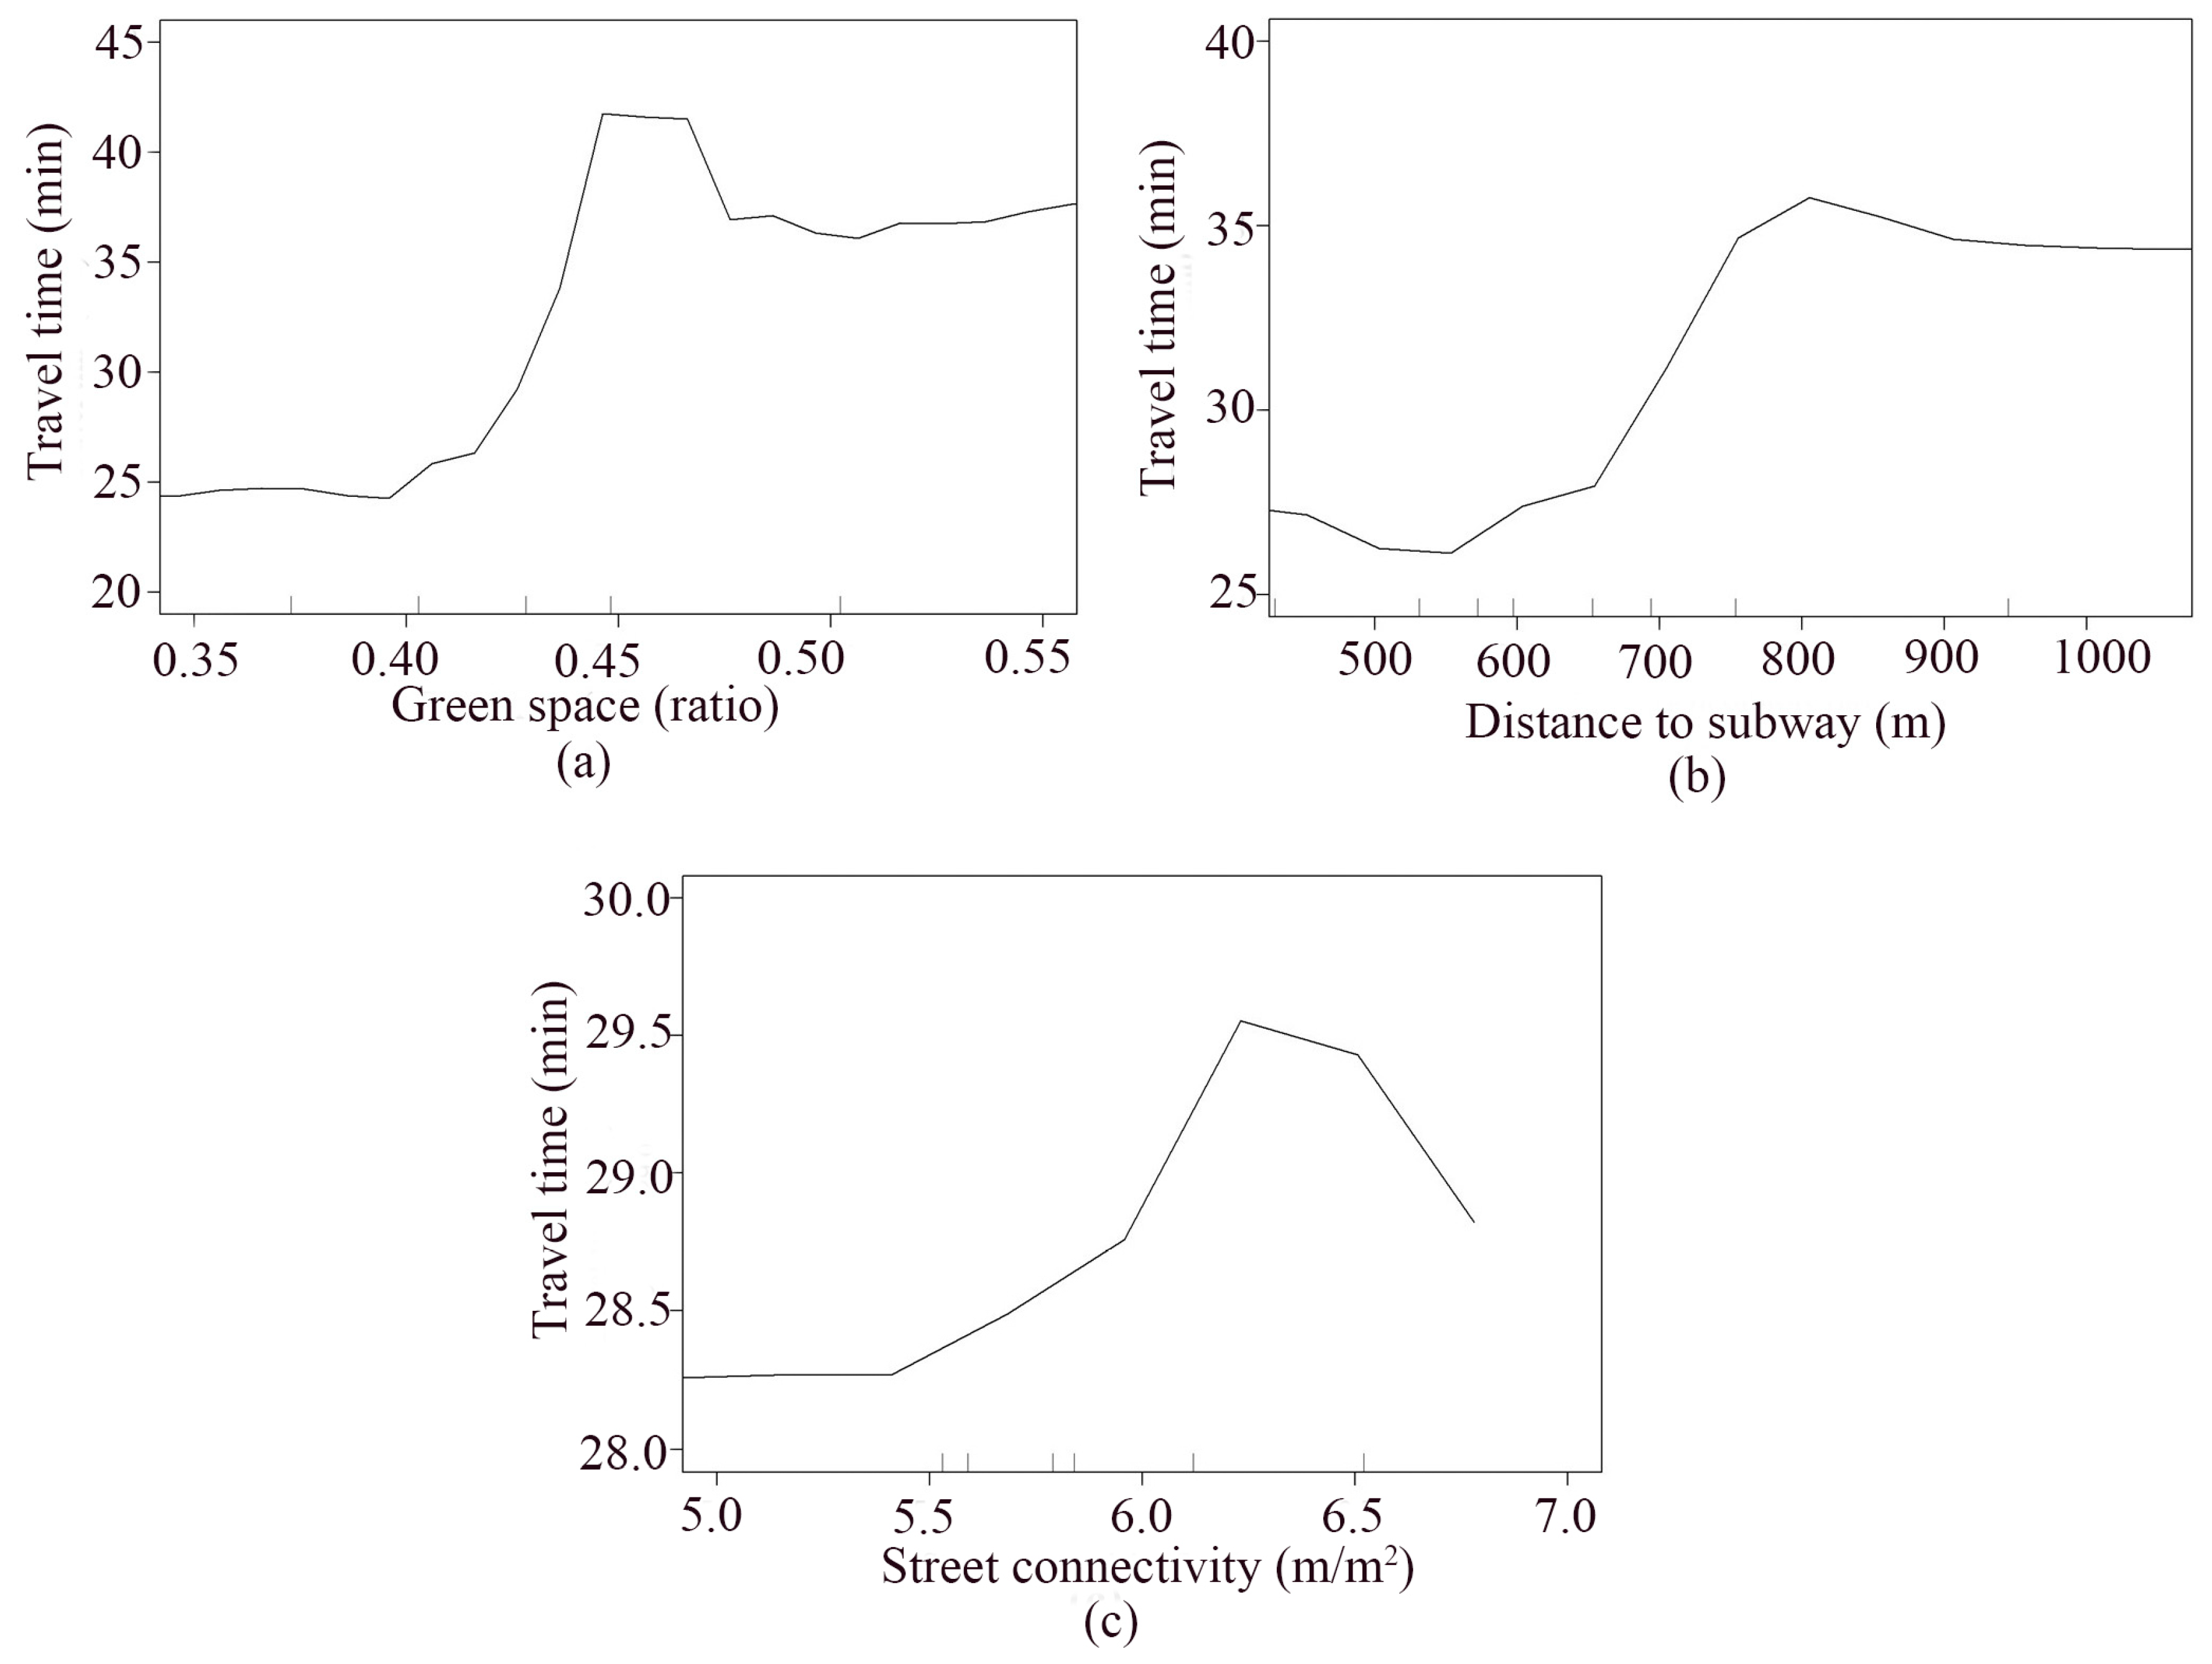
4.4. Analysis of Constraints between the Built Environment and Travel Time
5. Conclusions
6. Future Studies
Author Contributions
Funding
Institutional Review Board Statement
Informed Consent Statement
Data Availability Statement
Acknowledgments
Conflicts of Interest
References
- Michel, J.P.; Sadana, R. “Healthy Aging” concepts and measures. J. Am. Med. Dir. Assoc. 2017, 18, 460–464. [Google Scholar] [CrossRef] [PubMed]
- Fallon, C.K.; Karlawish, J. Is the WHO definition of health aging well? Frameworks for “Health” after three score and ten. Am. J. Public Health 2019, 109, 1104–1106. [Google Scholar] [CrossRef] [PubMed]
- World Population Prospects 2019: Highlights. Available online: https://www.un.org/development/desa/publications/world-population-prospects-2019-highlights.html (accessed on 17 June 2019).
- Zhou, Y.; Yuan, Q.; Ding, F.Y.; Chen, M.Y.; Yang, C.; Guo, T.Y. Demand, mobility, and constraints: Exploring travel behaviors and mode choices of older adults using a facility-based framework. J. Transp. Geogr. 2022, 102, 103368. [Google Scholar] [CrossRef]
- The State Council Issued the Outline for the Construction of A Strong Transportation Country. Available online: http://www.gov.cn/zhengce/2019-09/19/content_5431432.htm (accessed on 19 September 2019).
- The State Council Issued Outline of the National Comprehensive Three-Dimensional Transportation Network Plan. Available online: http://www.gov.cn/gongbao/content/2021/content_5593440.htm (accessed on 20 October 2021).
- Van Hoof, J.; Marston, H.R.; Kazak, J.K.; Buffel, T. Ten questions concerning age-friendly cities and communities and the built environment. Build. Environ. 2021, 199, 107922. [Google Scholar] [CrossRef]
- Zhu, P.Y.; Wang, K.L.; Ho, S.N.; Tan, X.Y. How is commute mode choice related to built environment in a high-density urban context? Cities 2023, 134, 104180. [Google Scholar] [CrossRef]
- Cerin, E.; Sit, C.H.P.; Barnett, A.; Johnston, J.M.; Cheung, M.C.; Chan, W.M. Ageing in an ultra-dense metropolis: Perceived neighbourhood characteristics and utilitarian walking in Hong Kong elders. Public Health Nutr. 2014, 17, 225–232. [Google Scholar] [CrossRef] [PubMed]
- Yang, Y.J.; Sasaki, K.K.; Cheng, L.; Tao, S. Does the built environment matter for active travel among older adults: Insights from Chiba City, Japan. J. Transp. Geogr. 2022, 101, 103338. [Google Scholar] [CrossRef]
- Yang, H.; Ruan, Z.H.; Li, W.S.; Zhu, H.J.; Zhao, J.; Peng, J.D. The impact of built environment factors on elderly people’s mobility characteristics by metro system considering spatial heterogeneity. ISPRS Int. J. Geoinf. 2022, 11, 315. [Google Scholar] [CrossRef]
- Kim, J.; Schmocker, J.D.; Nakamura, T.; Uno, N.; Iwamoto, T. Integrated impacts of public transport travel and travel satisfaction on quality of life of older people. Transp. Res. Part A Policy Pract. 2020, 138, 15–27. [Google Scholar] [CrossRef]
- Curl, A.; Fitt, H.; Tomintz, M. Experiences of the built environment, falls and fear of falling outdoors among older adults: An exploratory study and future directions. Int. J. Environ. Res. Public Health 2020, 17, 1224. [Google Scholar] [CrossRef] [Green Version]
- Hou, Y.T.; Moogoor, A.; Dieterich, A.; Song, S.Q.; Yuen, B. Exploring built environment correlates of older adults’ walking travel from lifelogging images. Transp. Res. D Transp. Environ. 2021, 96, 102850. [Google Scholar] [CrossRef]
- Domenech-Abella, J.; Mundo, J.; Leonardi, M.; Chatterji, S.; Tobiasz-Adamczyk, B.; Koskinen, S.; Ayuso-Mateos, J.L.; Haro, J.M.; Olaya, B. Loneliness and depression among older European adults: The role of perceived neighborhood built environment. Health Place 2020, 62, 102280. [Google Scholar] [CrossRef]
- Whiting, S.; Mendes, R.; Abu-Omar, K.; Gelius, P.; Crispo, A.; McColl, K.; Simmonds, P.; Fedkina, N.; Andreasyan, D.; Gahraman, H.; et al. Physical inactivity in nine European and Central Asian countries: An analysis of national population-based survey results. Eur. J. Public Health 2021, 31, 846–853. [Google Scholar] [CrossRef] [PubMed]
- Yanagihara, T. Travel behavior and IADL evaluation of elderly people. J. Transp. Health 2015, 2, S75. [Google Scholar] [CrossRef]
- Zhang, S.; Zhang, K.; Liu, X.Y.; Zeng, J.; Liu, Y.; Zhao, L. Characterisation of elderly daily travel behaviour in Tianjin using a space-time cube. Environ. Plan B Urban Anal. City Sci. 2022, 49, 603–618. [Google Scholar]
- Graham, H.; de Bell, S.; Flemming, K.; Sowden, A.; White, P.; Wright, K. Older people’s experiences of everyday travel in the urban environment: A thematic synthesis of qualitative studies in the United Kingdom. Ageing Soc. 2020, 40, 842–868. [Google Scholar] [CrossRef] [Green Version]
- Kahlert, D.; Schlicht, W. Older people’s perceptions of pedestrian friendliness and traffic safety: An experiment using computer-simulated walking environments. Int. J. Environ. Res. Public Health 2015, 12, 10066–10078. [Google Scholar] [CrossRef]
- Nordbakke, S.T.D. Out-of-home activity participation and needs fulfilment in later life. Int. J. Environ. Res. Public Health 2019, 16, 5109. [Google Scholar] [CrossRef] [Green Version]
- Hino, K.; Asami, Y. Change in walking steps and association with built environments during the COVID-19 state of emergency: A longitudinal comparison with the first half of 2019 in Yokohama, Japan. Health Place 2021, 16, 102544. [Google Scholar] [CrossRef]
- Liu, Z.Y.; Kemperman, A.; Timmermans, H. Correlates of older adults’ walking trip duration. J. Transp. Health 2020, 18, 100889. [Google Scholar] [CrossRef]
- Hou, Y.T.; Yap, W.; Chua, R.; Song, S.Q.; Yuen, B. The associations between older adults’ daily travel pattern and objective and perceived built environment: A Study of three neighbourhoods in Singapore. Transp. Policy 2020, 99, 314–328. [Google Scholar] [CrossRef]
- Golant, S.M. Stop bashing the suburbs: Mobility limitations of older residents are less relevant as connectivity options expand. J. Aging. Stud. 2019, 50, 100793. [Google Scholar] [CrossRef] [PubMed]
- Yang, L.C.; Liu, J.X.; Lu, Y.; Ao, Y.B.; Guo, Y.Y.; Huang, W.C.; Zhao, R.; Wang, R.Y. Global and local associations between urban greenery and travel propensity of older adults in Hong Kong. Sustain. Cities Soc. 2020, 63, 102442. [Google Scholar] [CrossRef]
- Zandieh, R.; Martinez, J.; Flacke, J.; Jones, P.; van Maarseveen, M. Older adults’ outdoor walking: Inequalities in neighbourhood safety, pedestrian infrastructure and aesthetics. Int. J. Environ. Res. Public Health 2016, 13, 1179. [Google Scholar] [CrossRef] [PubMed] [Green Version]
- Hanson, H.M.; Schiller, C.; Winters, M.; Sims-Gould, J.; Clarke, P.; Curran, E.; Donaldson, M.G.; Pitman, B.; Scott, V.; McKay, H.A.; et al. Concept mapping applied to the intersection between older adults’ outdoor walking and the built and social environments. Prev. Med. 2013, 57, 785–791. [Google Scholar] [CrossRef] [Green Version]
- Cheng, L.; Chen, X.W.; Yang, S.; Cao, Z.; De Vos, J.; Witlox, F. Active travel for active ageing in China: The role of built environment. J. Transp. Geogr. 2019, 76, 142–152. [Google Scholar] [CrossRef]
- Feng, J.X. The influence of built environment on travel behavior of the elderly in urban China. Transp. Res. D Transp. Environ. 2017, 52, 619–633. [Google Scholar] [CrossRef]
- Zhang, F.; Li, D. Multiple linear regression-structural equation modeling based development of the integrated model of perceived neighborhood environment and quality of life of community-dwelling older adults: A cross-sectional study in Nanjing, China. Int. J. Environ. Res. Public Health 2019, 16, 4933. [Google Scholar] [CrossRef] [Green Version]
- Recommended Levels of Physical Activity for Adults Aged 65 and above. Available online: https://www.who.int/publications/i/item/9789241599979 (accessed on 30 October 2022).
- Zhou, M.; Wang, D.G.; Guan, X.D. Co-evolution of the built environment and travel behaviour in Shenzhen, China. Transp. Res. D Transp. Environ. 2022, 107, 103291. [Google Scholar] [CrossRef]
- Gordon, C.J.; Comas, M.; Postnova, S.; Miller, C.B.; Roy, D.; Bartlett, D.J.; Grunstein, R.R. The effect of consecutive transmeridian flights on alertness, sleep-wake cycles and sleepiness: A case study. Chronobiol. Int. 2018, 35, 1471–1480. [Google Scholar] [CrossRef]
- He, S.Y.; Cheung, Y.N.H.Y.; Tao, S. Travel mobility and social participation among older people in a transit metropolis: A socio-spatial-temporal perspective. Transp. Res. A Policy Pract. 2018, 118, 608–626. [Google Scholar] [CrossRef]
- Nanjing’s Ageing Population Continues to Grow. Available online: http://tjj.nanjing.gov.cn/tjxx/202205/t20220505_3358775.html (accessed on 5 May 2022).
- Yang, Y.J.; Cheng, L.; Liu, X.W. Gender differences in active travel among older adults: Non-linear built environment insights. Transp. Res D Transp. Environ. 2022, 110, 103405. [Google Scholar] [CrossRef]
- Zang, P.; Lu, Y.; Ma, J.; Xie, B.; Wang, R.Y.; Liu, Y. Disentangling residential self-selection from impacts of built environment characteristics on travel behaviors for older adults. Soc. Sci. Med. 2019, 238, 112515. [Google Scholar] [CrossRef] [PubMed]
- He, Y.S.; Thøgersen, J.; Cheung, H.Y.Y.; Yu, H.Y.A. Ageing in a transit-oriented city: Satisfaction with transport, social inclusion and wellbeing. Transp. Policy 2020, 97, 85–94. [Google Scholar] [CrossRef]
- Wang, Z.; Zhang, H.; Yang, X.L.; Li, G.X. Neighborhood streets as places of older adults’ active travel and social interaction—A study in Daokou ancient town. J. Transp. Health 2022, 24, 101309. [Google Scholar] [CrossRef]
- Liu, J.X.; Wang, B.; Xiao, L.Z. Non-linear associations between built environment and active travel for working and shopping: An extreme gradient boosting approach. J. Transp. Geogr. 2021, 92, 103034. [Google Scholar] [CrossRef]
- Wu, J.N.; Zhao, C.L.; Li, C.Y.; Wang, T.; Wang, L.J.; Zhang, Y. Non-linear relationships between the built environment and walking frequency among older adults in Zhongshan, China. Front. Public Health 2021, 9, 686144. [Google Scholar] [CrossRef]
- Wang, W.; Zhang, Y.; Zhao, C.; Liu, X.; Chen, X.; Li, C.; Wang, T.; Wu, J.; Wang, L. Nonlinear associations of the built environment with cycling frequency among older adults in Zhongshan, China. Int. J. Environ. Res. Public Health 2021, 18, 10723. [Google Scholar] [CrossRef]
- Wang, L.; Zhao, C.; Liu, X.; Chen, X.; Li, C.; Wang, T.; Wu, J.; Zhang, Y. Non-linear effects of the built environment and social environment on bus use among older adults in China: An application of the XGBoost model. Int. J. Environ. Res. Public Health 2021, 18, 9592. [Google Scholar] [CrossRef]
- Cheng, L.; Jin, T.H.; Wang, K.L.; Lee, Y.S.; Witlox, F. Promoting the integrated use of bikeshare and metro: A focus on the nonlinearity of built environment effects. MULTRA 2022, 1, 100004. [Google Scholar] [CrossRef]
- Bai, X.; Hung, K.; Lai, D.W.L. The role of travel in enhancing life satisfaction among Chinese older adults in Hong Kong. Ageing Soc. 2017, 37, 1824–1848. [Google Scholar] [CrossRef]
- Zhang, F.Y.; Loo, B.P.Y.; Wang, B. Aging in place: From the neighborhood environment, sense of community, to life satisfaction. Ann. Am. Assoc. Geogr. 2022, 112, 1484–1499. [Google Scholar] [CrossRef]
- McMullan, I.I.; Bunting, B.P.; Burns, A.; Smith, L.; Cunningham, C.; O’Sullivan, R.; Blackburn, N.E.; Wilson, J.J.; Tully, M.A. Is physical activity associated with loneliness or social isolation in older adults? Results of a longitudinal analysis using the irish longitudinal study on ageing. J. Aging Phys. Act. 2021, 29, 562–572. [Google Scholar] [CrossRef] [PubMed]
- Yang, C.M.; Tang, X.L.; Yang, L.C. Spatially varying associations between the built environment and older adults’ propensity to walk. Front. Public Health 2022, 10, 1003791. [Google Scholar] [CrossRef]
- Pratiwi, P.I.; Xiang, Q.Y.; Furuya, K. Physiological and psychological effects of walking in urban parks and its imagery in different seasons in middle-aged and older adults: Evidence from Matsudo city, Japan. Sustainability 2020, 12, 4003. [Google Scholar] [CrossRef]
- Astell-Burt, T.; Feng, X.Q.; Kolt, G.S. Green space is associated with walking and moderate-to-vigorous physical activity (MVPA) in middle-to-older-aged adults: Findings from 203,883 Australians in the 45 and up study. Br. J. Sports Med. 2014, 48, 5. [Google Scholar] [CrossRef]
- Zhang, Y.; He, Q.; Wu, W.; Li, C.Y. Public transport use among the urban and rural elderly in China: Effects of personal, attitudinal, household, social-environment and built-environment factors. J. Transp. Land Use 2018, 11, 701–719. [Google Scholar] [CrossRef]
- Grigoletto, A.; Loi, A.; Latessa, P.M.; Marini, S.; Rinaldo, N.; Gualdi-Russo, E.; Zaccagni, L.; Toselli, S. Physical activity behavior, motivation and active commuting: Relationships with the use of green spaces in Italy. Int. J. Environ. Res. Public Health 2022, 19, 9248. [Google Scholar] [CrossRef]
- Zhang, W.T.; Gao, Y.X.; Li, S.; Liu, W.P.; Zeng, C.; Gao, L.; Li, M.X.; Peng, C. Accessibility measurements for urban parks considering age-grouped walkers? Sectorial travel behavior and built environment. Urban For. Urban Green 2022, 76, 127715. [Google Scholar] [CrossRef]
- Hui, L.C.; Jim, C.Y. Unraveling visiting-activity patterns of heterogeneous communities for urban-park planning and design. Forests 2022, 13, 841. [Google Scholar] [CrossRef]
- Lin, T.; Xia, J.H.; Robinson, T.P.; Goulias, K.G.; Church, R.L.; Olaru, D.; Tapin, J.; Han, R.L. Spatial analysis of access to and accessibility surrounding train stations: A case study of accessibility for the elderly in Perth, western Australia. J. Transp. Geogr. 2014, 39, 111–120. [Google Scholar] [CrossRef] [Green Version]
- Laatikainen, T.E.; Haybatollahi, M.; Kytta, M. Environmental, individual and personal goal influences on older adults’ walking in the Helsinki metropolitan area. Int. J. Environ. Res. Public Health 2019, 16, 58. [Google Scholar] [CrossRef] [Green Version]
- Zang, P.; Qiu, H.L.; Xian, F.; Zhou, X.; Ma, S.F.; Zhao, Y.B. Research on the difference between recreational walking and transport walking among the elderly in mega cities with different density zones: The case of Guangzhou city. Front. Public Health 2021, 9, 775103. [Google Scholar] [CrossRef] [PubMed]
- Boakye-Dankwa, E.; Barnett, A.; Pachana, N.A.; Turrell, G.; Cerin, E. Associations between latent classes of perceived neighborhood destination accessibility and walking behaviors in older adults of a low-density and a high-density city. J. Aging Phys. Act. 2019, 27, 553–564. [Google Scholar] [CrossRef]
- Mifsud, D.; Attard, M.; Ison, S. An exploratory study of the psychological determinants of mobility of older people in Malta. Res. Transp. Bus. Manag. 2019, 30, 100373. [Google Scholar] [CrossRef]
- Moran, M.; Van-Cauwenberg, J.; Hercky-Linnewiel, R.; Cerin, E.; Deforche, B.; Plaut, P. Understanding the relationships between the physical environment and physical activity in older adults: A systematic review of qualitative studies. Int. J. Behav. Nutr. Phys. Act. 2014, 11, 79. [Google Scholar] [CrossRef] [Green Version]
- Van-Cauwenberg, J.; Nathan, A.; Barnett, A.; Barnett, D.W.; Cerin, E. Relationships between neighborhood physical environmental attributes and older adults’ leisure-time physical activity: A systematic review and meta-analysis. Br. J. Sports Med. 2018, 48, 1635–1660. [Google Scholar] [CrossRef]
- Cao, Y.X.; Heng, C.K.; Fung, J.C. Using walk-along interviews to identify environmental factors influencing older adults’ out-of-home behaviors in a high-rise, high-density neighborhood. Int. J. Environ. Res. Public Health 2019, 16, 4251. [Google Scholar] [CrossRef] [PubMed] [Green Version]
- Van-Cauwenberg, J.; Van Holle, V.; Simons, D.; Deridder, R.; Clarys, P.; Goubert, L.; Nasar, J.; Salmon, J.; De Bourdeaudhuij, I.; Deforche, B. Environmental factors influencing older adults’ walking for transportation: A study using walk-along interviews. Int. J. Behav. Nutr. Phys. Act. 2012, 9, 85. [Google Scholar] [CrossRef] [Green Version]
- Ding, C.; Cao, X.Y.; Wang, Y.P. Synergistic effects of the built environment and commuting programs on commute mode choice. Transp. Res. Part A Policy Pract. 2018, 118, 104–118. [Google Scholar] [CrossRef]
- Lundberg, S.M.; Lee, S.I. A Unified Approach to Interpreting Model Predictions. In Proceedings of the 31st Annual Conference on Neural Information Processing Systems (NIPS), Long Beach, CA, USA, 4–9 December 2017. [Google Scholar]


| Variable | Description | Mean | SD | |
|---|---|---|---|---|
| Individual economic attributes | Gender | Male = 1, female = 2 | 1.53 | 0.5 |
| Age | Age of the respondent (years) | 72.25 | 7.94 | |
| Income | Current monthly personal income (USD) | 817.47 | 439.67 | |
| Residential status | Solitary = 1, Living with partner = 2, Living with children/grandchildren = 3 | 2.27 | 0.706 | |
| Educational level | Junior high school and below = 1, High school and secondary vocational school = 2, Junior college = 3, Bachelor’s degree = 4, Associate degree = 5, Postgraduate degree = 6 | 2.04 | 1.029 | |
| Pre-retirement work | Farmer = 1, Worker = 2, Company Staff = 3, Government and institutional employee = 4, Private and individual workers = 5, Service workers = 6, Educator = 7, Science and technology, health care worker = 8 | 4.49 | 2.145 | |
| Physical status | Have a chronic disease (Yes = 1, No = 2) | 1.38 | 0.485 | |
| Travel behavior | Travel time | The total amount of time for each trip (min) | 28.78 | 18.07 |
| Active travel (walking/cycling) | 28.21 | 11.39 | ||
| Public transportation | 29.70 | 12.84 | ||
| Car | 32.30 | 6.6 | ||
| Variable | Description | Mean | SD |
|---|---|---|---|
| Distance to subway stations | Distance between the residence and subway stations (m) | 808.25 | 472.45 |
| Green space | Green area/total built area in a 500 m buffer zone (%) | 0.29 | 0.17 |
| Street connectivity | The total length of a street/total built area in a 1 km buffer zone (km/km2) | 5.21 | 1.32 |
| Land use mix | Land use diversity index measured by the equation in a 1 km buffer zone | 0.60 | 0.19 |
| Population density | Total residential population/total built area in a 1 km buffer zone (persons/1 km2) | 18.85 | 4.19 |
| Name | Judgment Criterion | Result |
|---|---|---|
| CMIN/DF | Better fit for <3; acceptable at 3–5 | 3.419 |
| GFI | >0.9 | 0.930 |
| AGFI | >0.8 | 0.901 |
| RMSEA | <0.08 | 0.008 |
| NNFI | >0.9 | 0.906 |
| CFI | >0.9 | 0.900 |
| Model Path | Estimate | S.E. | C.R. | p |
|---|---|---|---|---|
| Travel times ← Physical status | −0.031 | 0.012 | −2.562 | 0.010 |
| Facility layout satisfaction ← Physical status | 0.147 | 0.045 | 3.24 | 0.001 |
| Facility layout satisfaction ← Travel times | −1.043 | 0.344 | −3.032 | 0.002 |
| Destination convenience satisfaction ← Facility-layout satisfaction | 0.398 | 0.04 | 9.978 | *** |
| Destination convenience satisfaction← Travel times | −0.487 | 0.197 | −2.468 | 0.014 |
| Travel evaluation ← Destination convenience satisfaction | 0.47 | 0.067 | 7.006 | *** |
| Travel evaluation ← Physical status | 0.165 | 0.033 | 5.022 | *** |
| V15 ← Travel times | 1.464 | 0.278 | 5.274 | *** |
| V16 ← Travel times | 1.944 | 0.398 | 4.881 | *** |
| V17 ← Travel times | 1 | |||
| V18 ← Travel times | 1.535 | 0.334 | 4.591 | *** |
| V12 ← Physical status | 1 | |||
| V9 ← Destination convenience satisfaction | 1 | |||
| V10 ← Destination convenience satisfaction | 1.158 | 0.084 | 13.741 | *** |
| V7 ←Destination convenience satisfaction | 1.143 | 0.075 | 15.289 | *** |
| V10 ← Destination convenience satisfaction | 1.025 | 0.082 | 12.495 | *** |
| V6 ← Destination convenience satisfaction | 1.09 | 0.077 | 14.24 | *** |
| V1 ← Facility layout satisfaction | 1 | |||
| V2 ← Facility layout satisfaction | 0.775 | 0.064 | 12.179 | *** |
| V3 ← Facility layout satisfaction | 0.88 | 0.076 | 11.519 | *** |
| V4 ← Facility layout satisfaction | 0.862 | 0.06 | 14.431 | *** |
| V11 ← Travel evaluation | 1 |
| Variable | Relative Importance (%) | Total (%) | |
|---|---|---|---|
| Built environment | Land use mix | 9 | 72 |
| Green space | 16 | ||
| Street connectivity | 22 | ||
| Population density | 10 | ||
| Distance to subway stations | 15 | ||
| Individual economic attributes | Age | 9 | 28 |
| Gender | 8 | ||
| Education level | 5 | ||
| Income | 6 | ||
| Total relative importance | 100 | ||
Disclaimer/Publisher’s Note: The statements, opinions and data contained in all publications are solely those of the individual author(s) and contributor(s) and not of MDPI and/or the editor(s). MDPI and/or the editor(s) disclaim responsibility for any injury to people or property resulting from any ideas, methods, instructions or products referred to in the content. |
© 2023 by the authors. Licensee MDPI, Basel, Switzerland. This article is an open access article distributed under the terms and conditions of the Creative Commons Attribution (CC BY) license (https://creativecommons.org/licenses/by/4.0/).
Share and Cite
Sun, J.; Zhu, Z.; Han, J.; He, Z.; Xu, X. Influence of the Built Environment on Older Adults’ Travel Time: Evidence from the Nanjing Metropolitan Area, China. Land 2023, 12, 1264. https://doi.org/10.3390/land12061264
Sun J, Zhu Z, Han J, He Z, Xu X. Influence of the Built Environment on Older Adults’ Travel Time: Evidence from the Nanjing Metropolitan Area, China. Land. 2023; 12(6):1264. https://doi.org/10.3390/land12061264
Chicago/Turabian StyleSun, Jingrui, Zhenjun Zhu, Ji Han, Zhanpeng He, and Xinfang Xu. 2023. "Influence of the Built Environment on Older Adults’ Travel Time: Evidence from the Nanjing Metropolitan Area, China" Land 12, no. 6: 1264. https://doi.org/10.3390/land12061264