Article

Identification and Classification of Urban Shrinkage in Northeast China

1
China Research Center for Resource-Based Urban Transformation and Development and Rural Revitalization, China University of Mining and Technology, Xuzhou 221116, China
2
School of Environment and Spatial Informatics, China University of Mining and Technology, Xuzhou 221116, China
3
School of Public Policy & Management, China University of Mining and Technology, Xuzhou 221116, China
*
Author to whom correspondence should be addressed.
Land 2023, 12(6), 1245; https://doi.org/10.3390/land12061245
Submission received: 22 May 2023 / Revised: 14 June 2023 / Accepted: 15 June 2023 / Published: 17 June 2023
(This article belongs to the Topic Urban Land Use and Spatial Analysis)

Abstract

:
The phenomenon of shrinking cities is a significant challenge faced by many cities today. To more accurately identify the leading factors driving urban shrinkage and develop rational recommendations, precise identification and classification of urban shrinkage has become an indispensable part of the process. This paper focuses on the typical population loss region of China’s three northeastern provinces, using 497 identified physical cities as the basic research unit. Based on multi-source geographical big data and utilizing the geographically weighted regression (GWR) model, spatial modeling of population in the three provinces of northeast China was conducted, resulting in spatialized population data, followed by identification and classification of shrinking cities among the physical cities. Cities with a total population change rate of less than 0 are defined as shrinking cities. In cities where the total population change rate is greater than 0, cities with both a city shrinking area ratio and a decreased population ratio greater than 5% are defined as locally shrinking cities. Based on this, 90 (18.1%) shrinking cities and 118 (23.7%) locally shrinking cities were identified within the three provinces of northeast China. The phenomenon of urban shrinkage is distributed throughout various regions, mainly in smaller cities located near larger cities. According to the standards of the urban shrinkage classification model, the spatial pattern of population loss regions was divided into four types, identifying 13 (6.3%) global type, 111 (53.4%) concentrated type, 64 (30.7%) perforated type, and 20 (9.6%) edge type. Analysis of shrinking cities based on their classification revealed that the main reasons for urban shrinkage are the decline and dissolution of large industrial enterprises, abandonment and neglect of buildings, and unreasonable design planning in cities. Economic development and inward population flow can be promoted in shrinking cities by creating job opportunities, improving living standards, developing transportation, adjusting urban planning or concentrating urban population, as well as vigorously developing urban center areas. These measures can provide support for the revival and development of shrinking cities.

1. Introduction

In 1988, the German scholar Häußermann coined the term “shrinking cities” to describe the phenomenon of population loss in urban areas [1]. According to the Shrinking Cities International Research Network (SCIRN), a shrinking city is an urban area, which has lost more than two years of population and has a total population of 10,000 or more. International scholarly research on understanding urban shrinkage has been growing in recent years. A current trend is to identify and analyze it through different perspectives, scopes, and types to investigate the causes of urban shrinkage, the factors affecting society, and how to respond positively. For example, Andrea Sarzynski and Thomas J. Vicino [2] discussed the evolution of shrinking suburbs in the United States, identified the characteristics of shrinking suburbs, and found that about one quarter of the suburbs were shrinking. Manuel Wolff and Thorsten Wiechmann [3] focused on the impact on local dynamics, studied urban contraction from two aspects of duration and spatial distribution, and investigated the impact of economic and demographic drivers on the nonlinear evolution of European shrinking cities. The research on shrinking cities has also been improved in terms of methods in recent years. For example, Annegret Haase [4] et al. explored the factors driving urban population growth and economic recovery by comparing the growth and contraction of European cities. Gurrutxaga Mikel [5] incorporated the life process method into the evaluation of shrinking cities and studied the evolution of population groups with socio-economic change indicators from the perspective of urban dynamics.
China’s urban population has grown rapidly since the reform and opening up, from 172 million in 1978 to 921 million in 2022, accounting for 17.9% to 65.22% of the country’s total population. However, as China’s economy enters a “new normal”, structural population pressures emerge, and economic growth rates gradually decline. Both the relatively developed eastern regions and less developed central and western regions have begun to show varying degrees of urban shrinkage [6]. China’s cities have continued to develop rapidly, but some are facing significant population outflows and slow economic growth due to shrinkage phenomena. These issues have led to social problems, which are spreading across the country and becoming increasingly common, even considered normal in some areas [7]. This has also caught the interest of many researchers, and the three main areas of the current research are as follows: ① From early single qualitative research and census data to the selection of indicators for evaluation and the selection of geographic big data. For example, Sun Pingjun et al. [8] used indicators in four dimensions—population, economy, financial stability, and investment and consumption—to identify urban decline using the “two-part diagnosis technique”. Meng Xiangfeng et al. [9] classified shrinking cities into five categories: perforated, complete, local, doughnut, and peripheral. They used data from Baidu’s Wise-Eye grid to analyze changes in population patterns within Chinese cities, which helped reconcile the differences between resident and registered populations, as well as between physical and administrative urban boundaries. Jiang Zhidian et al. [10] used point of interest (POI) and road network data to redefine natural cities. Then, they identified shrinking cities using night-time light remote-sensing data based on nature cities, breaking the limitations of administrative divisions; ② In terms of exploring the driving factors of urban contraction, most scholars focus on analyzing the influencing factors of urban contraction with different models from a certain perspective. For example, Zhao Chao et al. [11] analyzed the nature and underlying causes of shrinkage in traditional capitalist industrial cities using a Marxist spatial political economy framework. Their work has inspired research on shrinkage in China’s traditional industrial regions, which are facing similar challenges. Chen Rui [12] utilizes a panel data model to examine the variables impacting decreasing cities in terms of population, economy, and urban building. He analyzes the degree of shrinkage in China, as well as its spatial distribution and other characteristics. Hu Yukun et al. [13] analyze the impact of development zone policies on shrinking cities in China, starting from location-oriented policies; ③ Regarding the typical case studies of shrinking cities and shrinking regions, He Heming et al. [14] analyzed the impact of government interventions on perforated shrinking cities using the area on both sides of Huanghe Road in Changzhou high-tech zone as an example. They also studied the driving factors behind these urban phenomena and explored potential ways to optimize urban development in such areas. Zhang Li [15] took Sichuan Province and Xinyang City in Henan Province as examples to study the spatial reconfiguration perspective of the population in central and western China.
In addition, in recent years, China has also taken clear policy directions on how urban shrinkage should be developed. In April 2019, the “Key Tasks of New-type Urbanization Construction in 2019” mentioned “shrinking cities” for the first time. It clearly stated that the coordinated development of large, medium, and small cities should be promoted. In April 2020, the “Key Tasks of New-type Urbanization Construction and Integrated Urban-Rural Development in 2020” mentioned shrinking cities again. It pointed out that it is necessary to “coordinate the cultivation of newborn cities and the slimming and strengthening of shrinking cities……”. In May 2022, the “Opinions on Promoting Urbanization with Counties as Important Carriers” again pointed out the need to “guide the transformation and development of depopulated counties and support the cultivation of successive alternative industries in resource-depleted counties that are in a position to do so”.
From the above research, although there is no precise definition for shrinking cities, the selection of indicators and methods used in previous studies has become more mature. The research has also provided insightful analysis into typical regions at different scales. However, most scholars are limited to studying shrinking cities based on administrative divisions as the basic unit and relying on statistical data for indicator selection. It is difficult to conduct further spatial analysis of shrinking cities. In addition, the conclusions of existing studies based on the spatial dimension are mainly based on the selection of typical shrinking cities as the sample to classify the types. This results in the conclusions being rather macro, lacking the exploration of the fine scale. Therefore, this paper aims to break the limitations of administrative divisions and explore further the spatial pattern changes in shrinking cities. Through classification, common problems can be studied to make reasonable judgments about their dominant factors. Additionally, some physical cities experiencing population growth have also seen significant localized contractions in certain regions. Based on this, this paper proposes the definition of locally shrinking cities, which further refines the study of shrinking cities.
In this context, we select the typical region of the three provinces in northeast China as the research object. Firstly, the 2018 POI data are used to identify the physical cities. Then, we use the geographically weighted regression (GWR) model to spatialize the population of the three provinces of northeast China based on multi-source geographic big data, such as land use, night-time lights, and POIs. We obtain spatialized population data at a 30 m × 30 m scale grid and verify its accuracy. Finally, we use the spatialized population data and the physical cities in the three provinces of northeast China to identify shrinkage and classify the type. The paper explores in depth the leading causes of urban shrinkage and changes in intra-city spatial patterns in the shrinking cities of the three provinces of northeast China, providing reasonable explanations and policy recommendations. It also serves as a typical case to provide a reference for shrinking cities with similar causes in the rapid urbanization process in China. The remainder of the study is organized as follows. Section 2 provides an overview of the research area and data sources, the definition and identification of physical cities, research methods for population spatialization, and the identification and classification of urban shrinkage. Section 3 presents the results of identifying physical cities, population spatialization, and urban shrinkage identification and classification. Section 4 categorically discusses the leading factors that may cause urban shrinkage and makes recommendations. Section 5 summarizes the findings and limitations of this study, as well as future research directions.

2. Materials and Methods
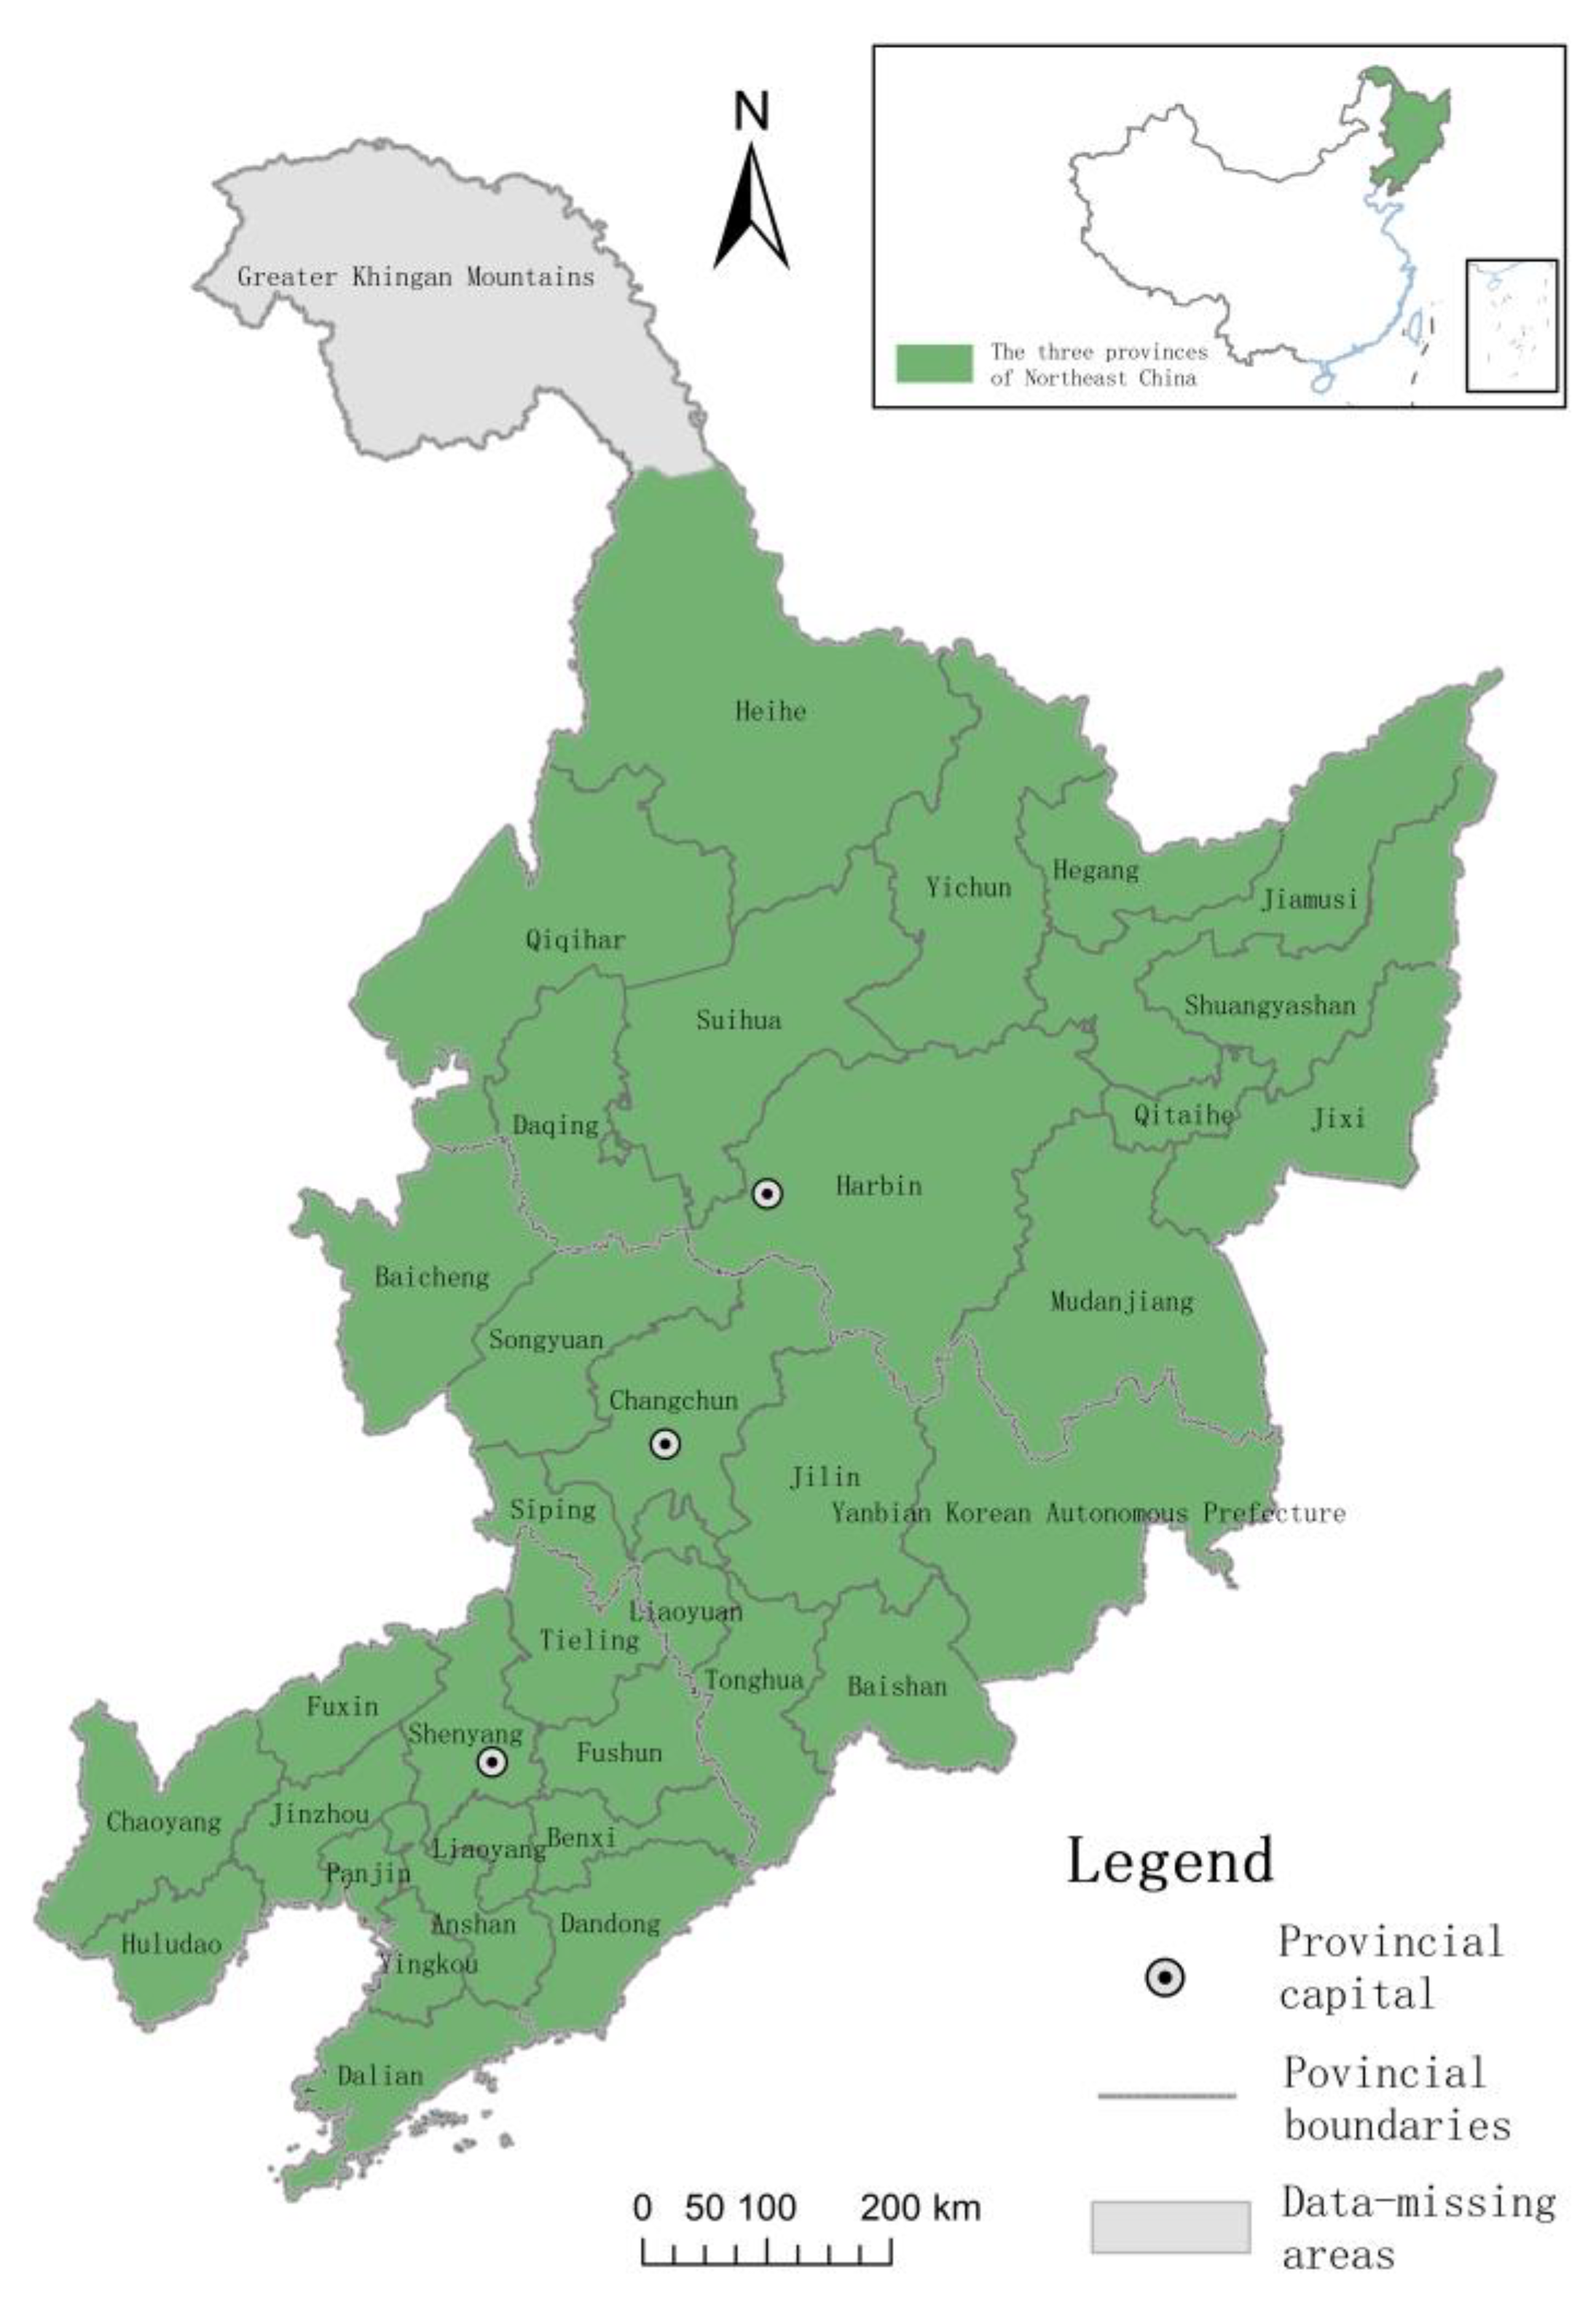
2.1. Study Area

The three provinces of northeast China include Liaoning, Jilin, and Heilongjiang provinces, with a total of 36 prefecture-level administrative units. Due to a lack of data, 35 prefecture-level cities, except the Daxing’anling area, were selected as the study area, of which there were 278 counties and districts in 2015 and 285 counties and districts in 2020. The overview of the study area is shown in Figure 1. The economies of the three provinces of northeast China started early. They have made historic contributions to the development and growth of New China, strongly supporting the economic construction of the country. However, the northeast region is affected by a single industrial structure, insufficient development of new industries, lagging deep reforms of state-owned enterprises, poor investment environment, and aging population, resulting in insufficient output capacity, low level of industrial investment, low fiscal revenue, and unbalanced debt burden. These problems have become increasingly serious in recent years. Additionally, there has been a substantial population loss within the city. During the period 2009–2019, the number of comprehensive shrinking cities in aggregate was the highest compared to other regions, totaling 54, or 32.93% of China’s total. In terms of the degree of shrinkage in a single dimension, the three provinces of northeast China are also in a high state of shrinkage, representing the most severely contracted region in China [10]. Additionally, this is also a more typical and significant region for regional urban shrinkage problems, which has important implications for the study of other shrinking cities in China. Therefore, the three provinces of northeast China were selected as samples to explore the changes in urban population and spatial patterns within the cities. The study will focus on the five-year period between 2015 and 2020, with the goal of providing a guarantee for the future revival and development of shrinking cities in this region.

2.2. Data Sources

The data used include county-level population data for 2015 and 2020 for the three provinces of northeast China, derived from provincial statistical yearbooks and the Seventh National Census. The night-time light data used in this study were obtained from the “NPP-VIIRS-like” night-time light dataset. This dataset has a global resolution of 500 m and is similar to NPP VIIRS [16]. It was corrected using different sensors to improve the quality of the data and mitigate oversaturation and spillover effects of the original DMSP-OLS data. This helps to accurately reflect the population changes in high luminance image elements in economically developed cities and capture detailed information within the city. The 2015 and 2020 POI data were obtained from 2015 POI data provided by the College of Humanities and Social Sciences of East China Normal University [17] and 2018 Gaode Map data provided by the Open Platform of Peking University [18]. Limited by the availability of data, this paper used POI data updated to November 2018 as the 2020 population spatialization dependent variable. The administrative divisions and 30 m resolution land use data for 2015 and 2020 for the three provinces of northeast China were sourced from the China Land Survey and Planning Institute. So as to accurately express the distribution of population spatially, urban, established town, schools, and other unit sites in 2015 and 2020 were extracted as settlements according to the current land use classification standard. In order to eliminate the errors caused by the calculation of experimental data under different coordinate systems, the unified coordinate system in this paper is WGS_1984_UTM_Zone_50_N.

2.3. Methodology

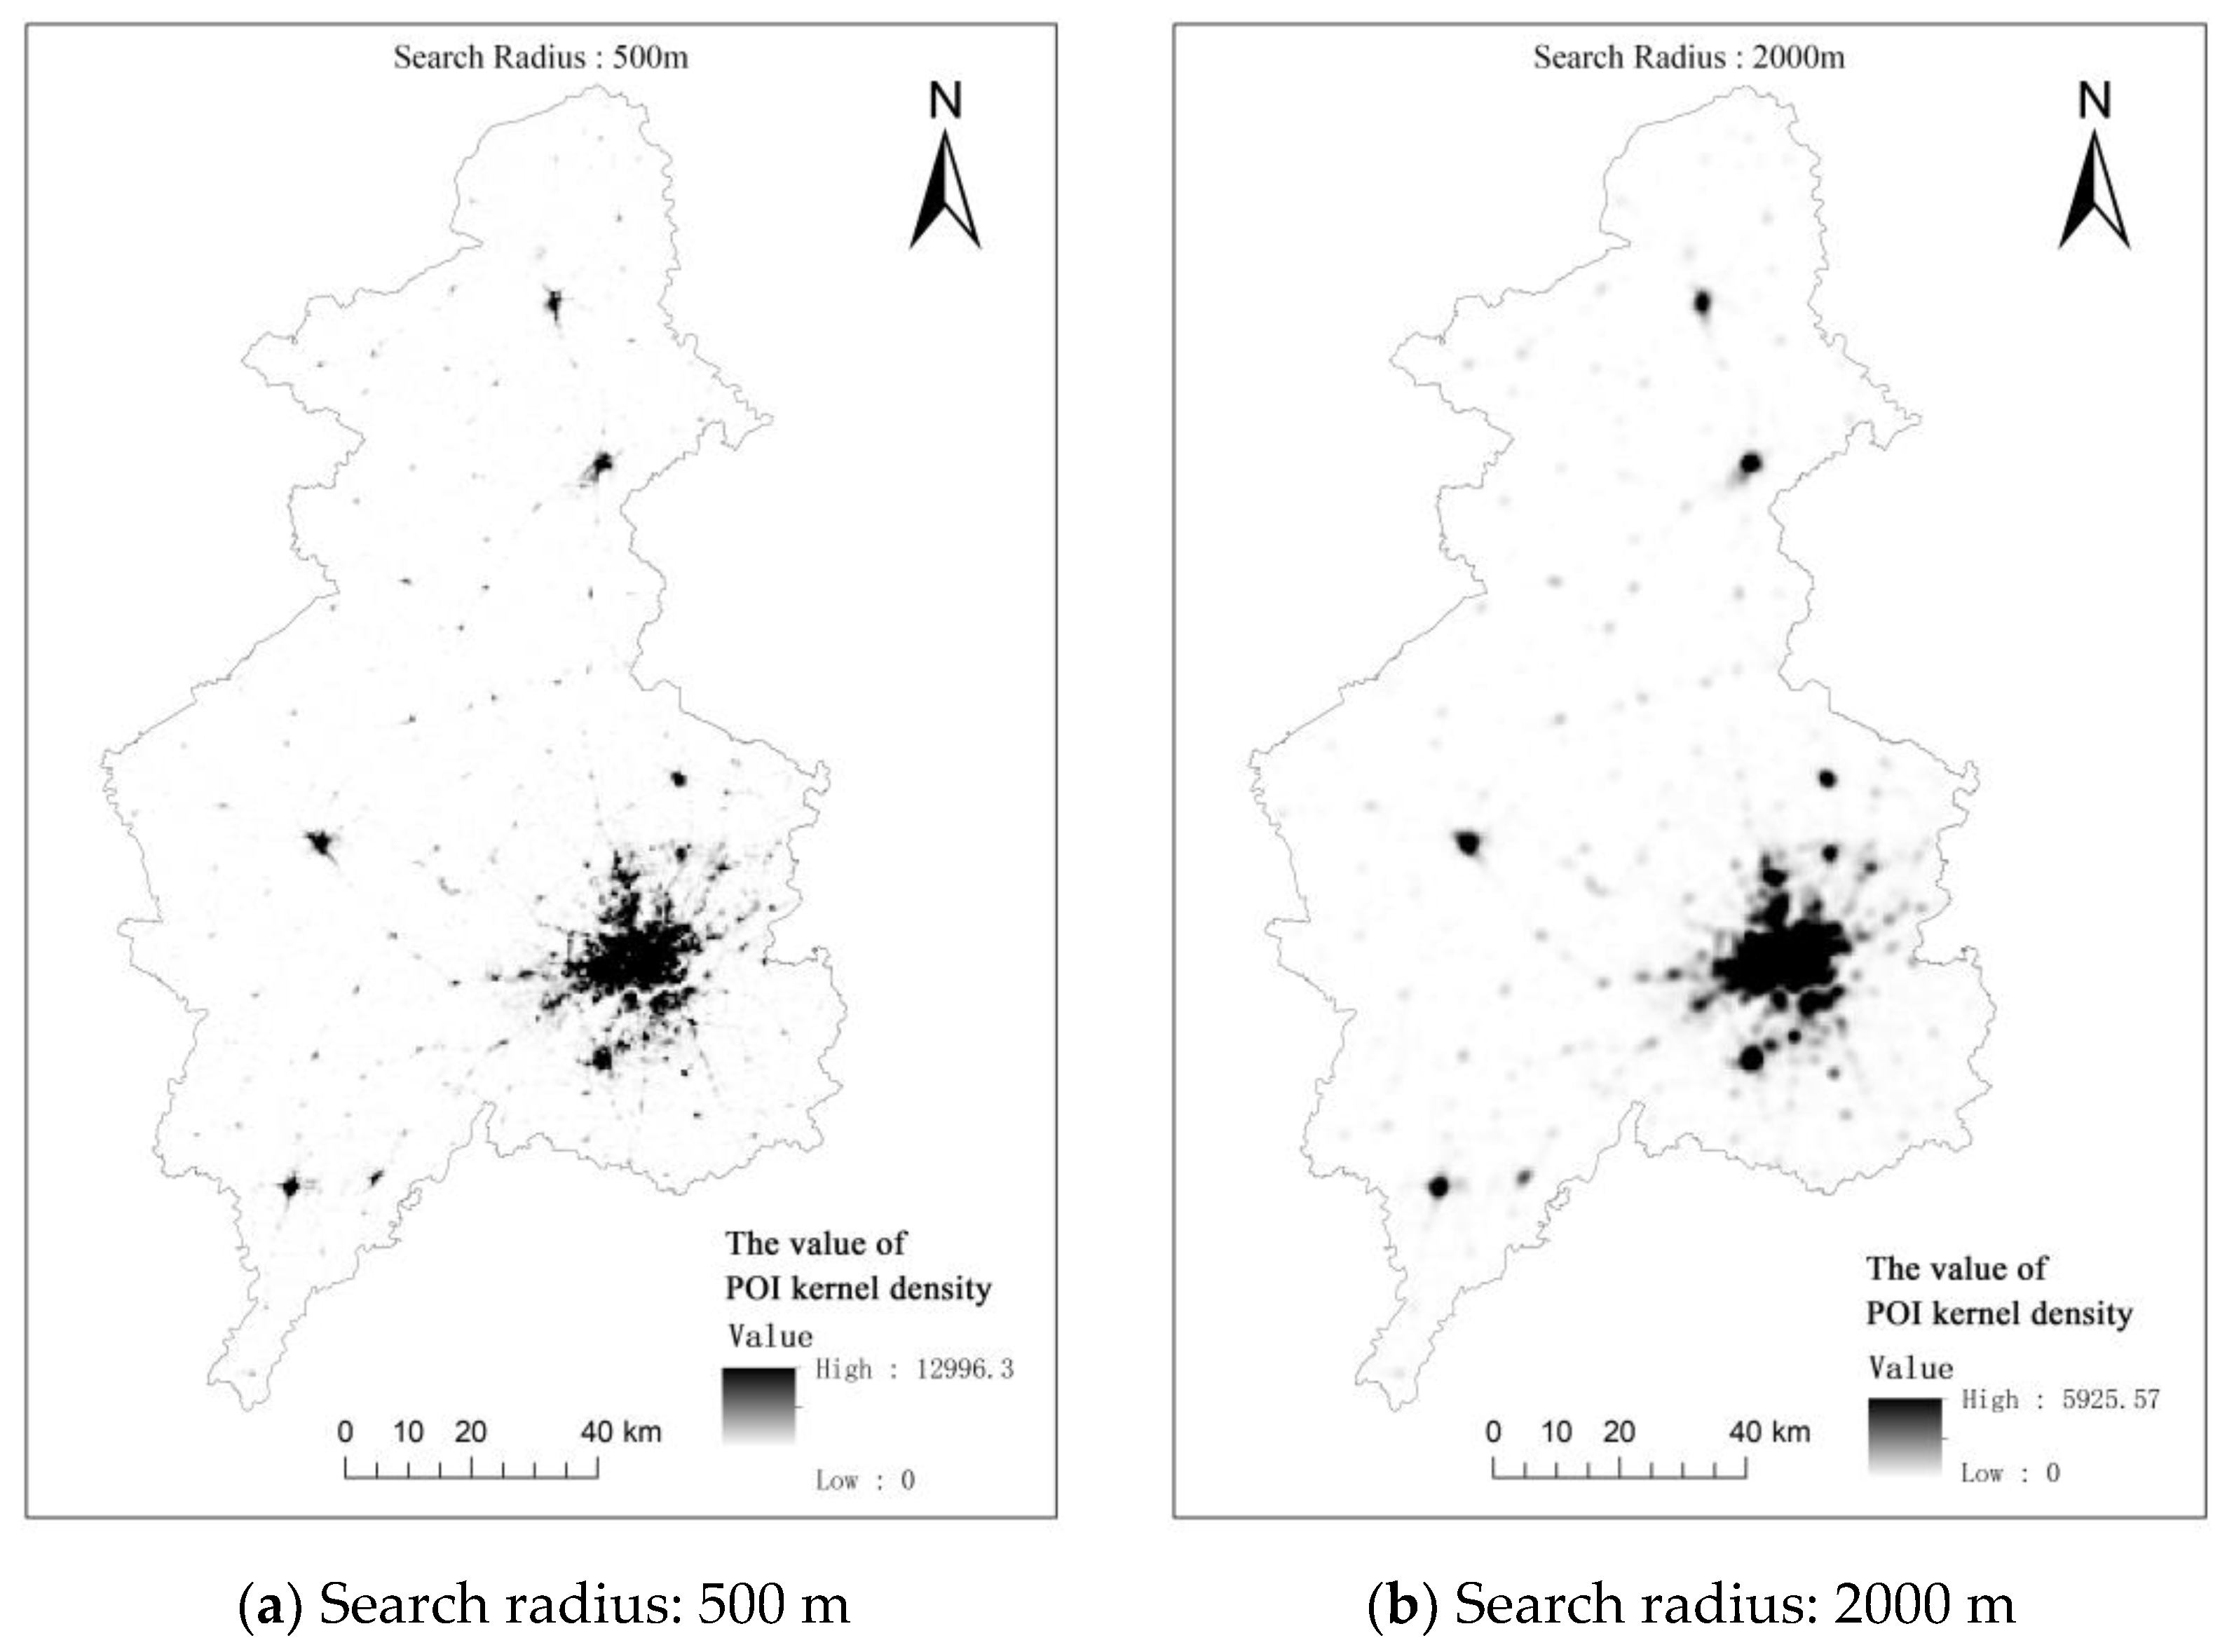
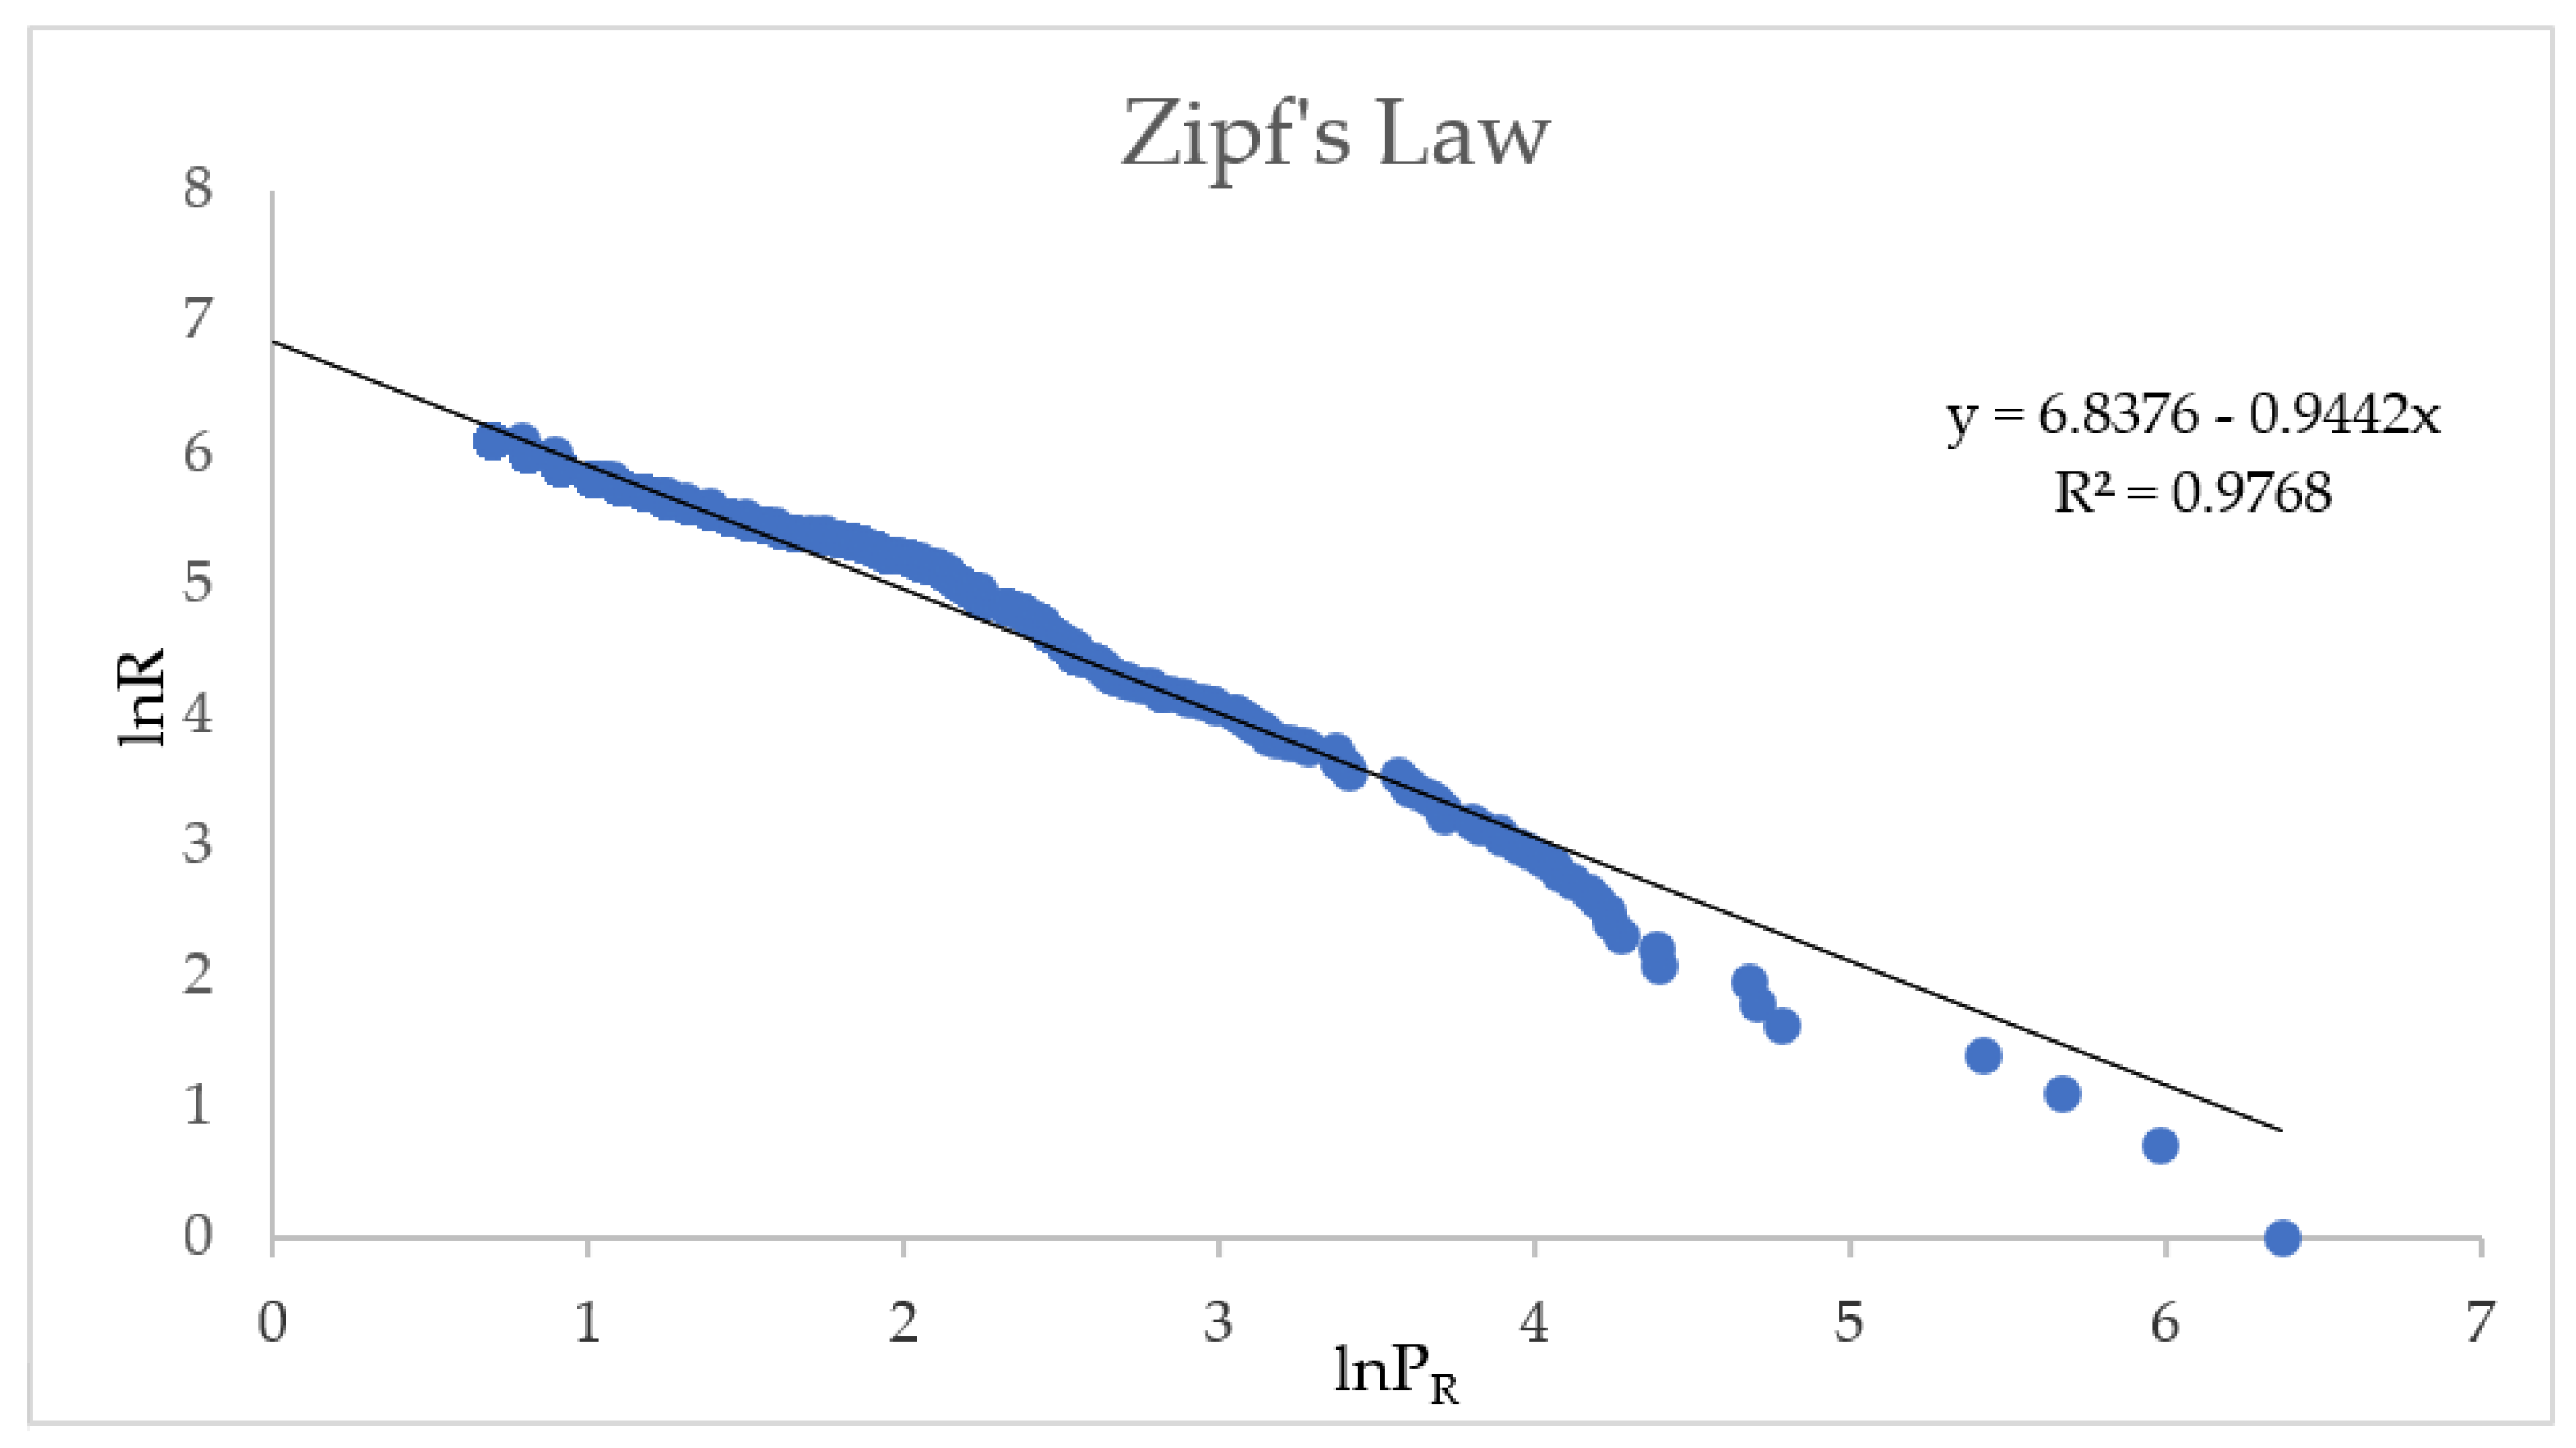
2.3.1. Definition and Identification of Physical Cities

From the perspective of natural attributes, densely populated areas with high infrastructure density have emerged through human activity. These areas continuously gather toward the center in the development of socio-economic activities. The regions with high population and infrastructure density are referred to as physical cities. They can be studied as independent economic entities and are more systematic and dense than cities, which simultaneously include both rural and urban areas under administrative divisions. Additionally, they are more suitable for studying small-scale and refined urban issues, also facilitating research on spatial patterns of shrinking cities. Among the identification methods for physical cities, those that are currently more applied and have better results include the identification of built-up areas by accurately extracting built-up areas using aerial remote-sensing images [19]; identification by establishing a comprehensive index through two types of night-time light images and POI data [20]; and identification by the threshold method and the H/T break method using POI data [10,21]. Among them, POI data are large in volume and accuracy, and the POI distribution is also more continuous and concentrated in places with dense urban populations and infrastructure. Therefore, this paper adopts the method of Liu [22] and Jiang et al. [10], based on the cumulative distribution function, and uses POI data for entity city identification.
The POI data were first processed by python, and 17 types of data were selected and cleaned, including food and beverage services, business housing, living services, etc., which are closely related to the distribution of population in the three provinces of northeast China. The POI data are then subjected to kernel density analysis, where a kernel function is used to calculate the quantity per unit area based on point elements in order to fit each point to a smooth conical surface, visualizing the distribution of discrete measurements over a continuous area. The equation for an arbitrary point is shown in Equation (1).
F i = 1 n π W 2 × j = 1 n K j ( 1 D 2 i j W 2 ) 2
where K j is the weight function of the study object, and D i j is the Euclidean distance between the point and the study object; W is the bandwidth of the selected area, also called the search radius; and n is the number of study objects in the selected area. When using different search radii for kernel density analysis, there are significant differences in high-density area boundaries and area integrity, as shown in Figure 2. When the search radius is small, the identified physical city boundaries are better, but at the same time, this can result in a region being split into too many cities. Therefore, the search radii of 200 m, 500 m, 1000 m, and 2000 m were chosen as the search radii for the kernel density analysis of POI data. Considering the boundaries and regional integrity of high-density value regions, the kernel density analysis data with a search radius of 500 m were chosen as the experimental data for identifying physical cities.
From the definition of a physical city, it is clear that the greater the POI density, the more likely the area is to be a physical city. Therefore, the overall distribution of POI density was analyzed using the cumulative distribution function (CDF). Calculate the proportion of the tail of the random variable of the density histogram (CDF value), which is the probability that the area at that density is likely to be a physical city [20]. A density of 5/km2 was selected as a value interval statistic. As can be seen from Table 1, the smaller the POI density value, the smaller the CDF value, and the smaller the probability that the area is a physical city at that density, while the amount of CDF change also becomes larger, indicating that the probability that the area is not a physical city at that density grows faster. According to the research results [15,22], when the CDF value is less than 0.4%, i.e., when the POI density is greater than 45/km2, the image element can be considered a physical city. A total of 5.80% of the image elements with POI density higher than 45/km2, i.e., 5.80% of the physical city area is obtained when the classification threshold is 45/km2. Based on the threshold value of POI kernel density, the POI kernel density raster data were extracted. After transforming them into a vector layer, the area of each region was calculated, and the regions with an area of less than 2 km2 were excluded as physical cities.

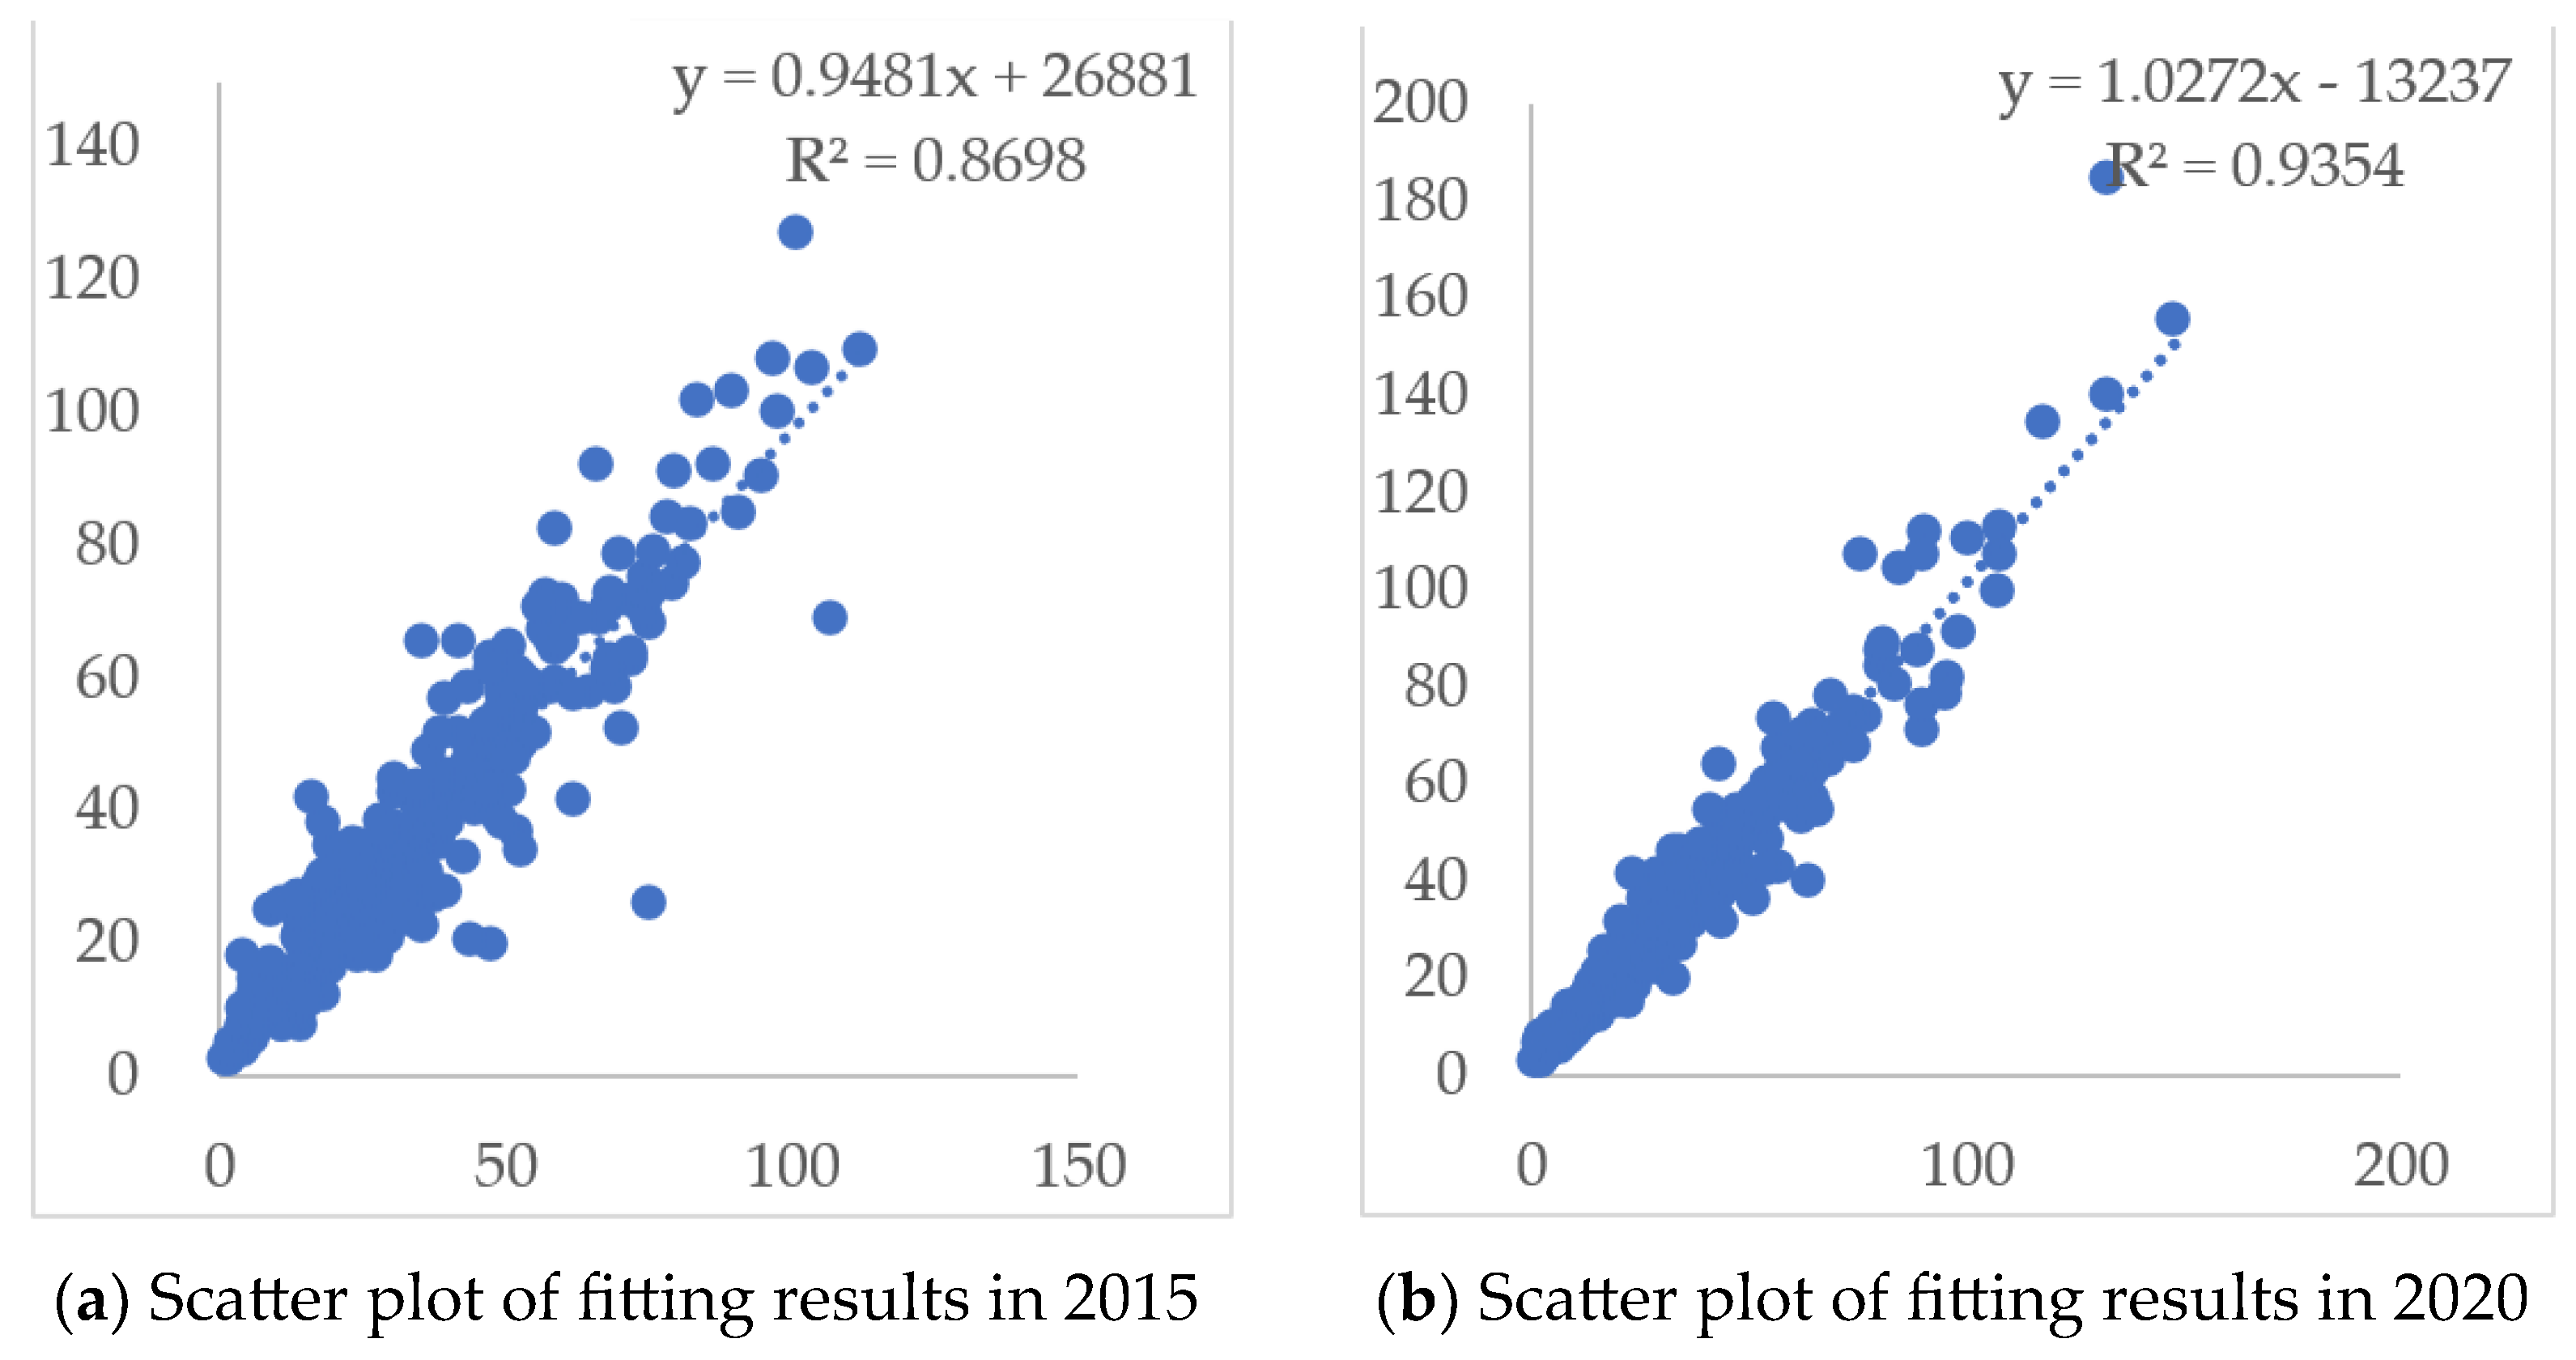
2.3.2. Research on Population Spatialization Based on the GWR Model

Establishing a population spatialization model can clearly depict the distribution of populations in the city, facilitating the study of the spatial patterns of population change in urban areas. Spatial autocorrelation analysis was conducted on the county-level population statistics of the three provinces of northeast China. The Morans’ I index value of the county-level population in the three provinces of northeast China was 0.35, and the z value was 9.28, which passed the test at the significance level of 0.001. This shows that the county-level population in the three provinces of northeast China has a strong positive spatial correlation. Referring to relevant research results [23,24,25], the geographically weighted regression (GWR) model fits well and has high accuracy in regions with high population density. This paper mainly studies physical cities, which are regions with a more concentrated population, so the GWR model is chosen to establish population spatialization.
GWR is a local regression model, which takes into account geospatial relationships. Its advantage over multiple linear regression models is that it takes into account the existence of local effects on spatial objects when spatial autocorrelation occurs within a certain range, and it eliminates the influence of local areas on the whole by selecting bandwidths and constructing separate equations for each element (see Equation (2)).
y i = β 0 ( u i ,   v i ) + k = 1 p β k ( u i ,   v i ) x i k + ε i       i = 1 , 2 , , n
Considering the situation of the study area, the area of settlements, night-time light intensity, and POI kernel density values were selected as the dependent variables for the spatialization of the population in 2015 and 2020. The land use data, night-time light data, and POI data of these two years were extracted for the feature values. In accordance with the “no land, no population” principle, the GWR4 software was used to model the spatialization of the population in the three provinces of northeast China without using constant terms as independent variables in the modeling regressions. The GWR model parameters were chosen to be modeled with an adaptive quadratic square adaptive spatial kernel function (Bi-square); a default golden section search procedure was chosen for bandwidth selection; and the Akaike information criterion (AIC) was used as the information evaluation criterion [24]. The population modeling factors were set as follows: the administrative division code was used as the id index value; the coordinates of the point of mass (x, y) where the administrative division of each county is located were used as the geographic location coordinates. The area of the settlement, the night-time light intensity value, and the POI kernel density of each county were used as the independent variables, and the demographic data of each county were used as the dependent variables.

2.3.3. Identification of Physical Urban Shrinkage

The 2015 and 2020 population spatialization grid data for the three provinces of northeast China were analyzed. Cities where the population of the physical cities decreases over a five-year period in terms of the resident population are considered to be shrinking cities. The rate of population change, Rs, is calculated through Equation (3), and it is classified into three categories in terms of the degree of shrinkage: mild shrinkage (−10% < R s < 0), moderate shrinkage (20% < Rs < 10%), and severe shrinkage ( R s < 20%).
R s = P O P 2020 P O P 2015 P O P 2015 × 100
where R s is the rate of population change, P O P 2020 is the number of the resident population in the physical city in 2020, and P O P 2015 is the number of the resident population in the entity city in 2015. The area of the population reduction grid and the number of population reduction are counted. Subsequently, the city shrinkage area ratio and the population reduction ratio are considered together. Cities with the number of population reduction ratio and the area ratio of the population reduction area in the physical cities are both greater than 5% ( T i > 5% and S i > 5%), but where the total population change rate is greater than 0, cities are defined as locally shrinking cities ( R s > 0). The identification process is shown in Figure 3.
T i = i = 1 n N i P O P 2015 × 100
S i = i = 1 n M i A r e a 2015 × 100
where N i represents the number of population reductions within a depopulation grid; M i represents the area of the depopulation grid; T i represents the ratio of population reductions; and S i represents the ratio of the depopulated area.

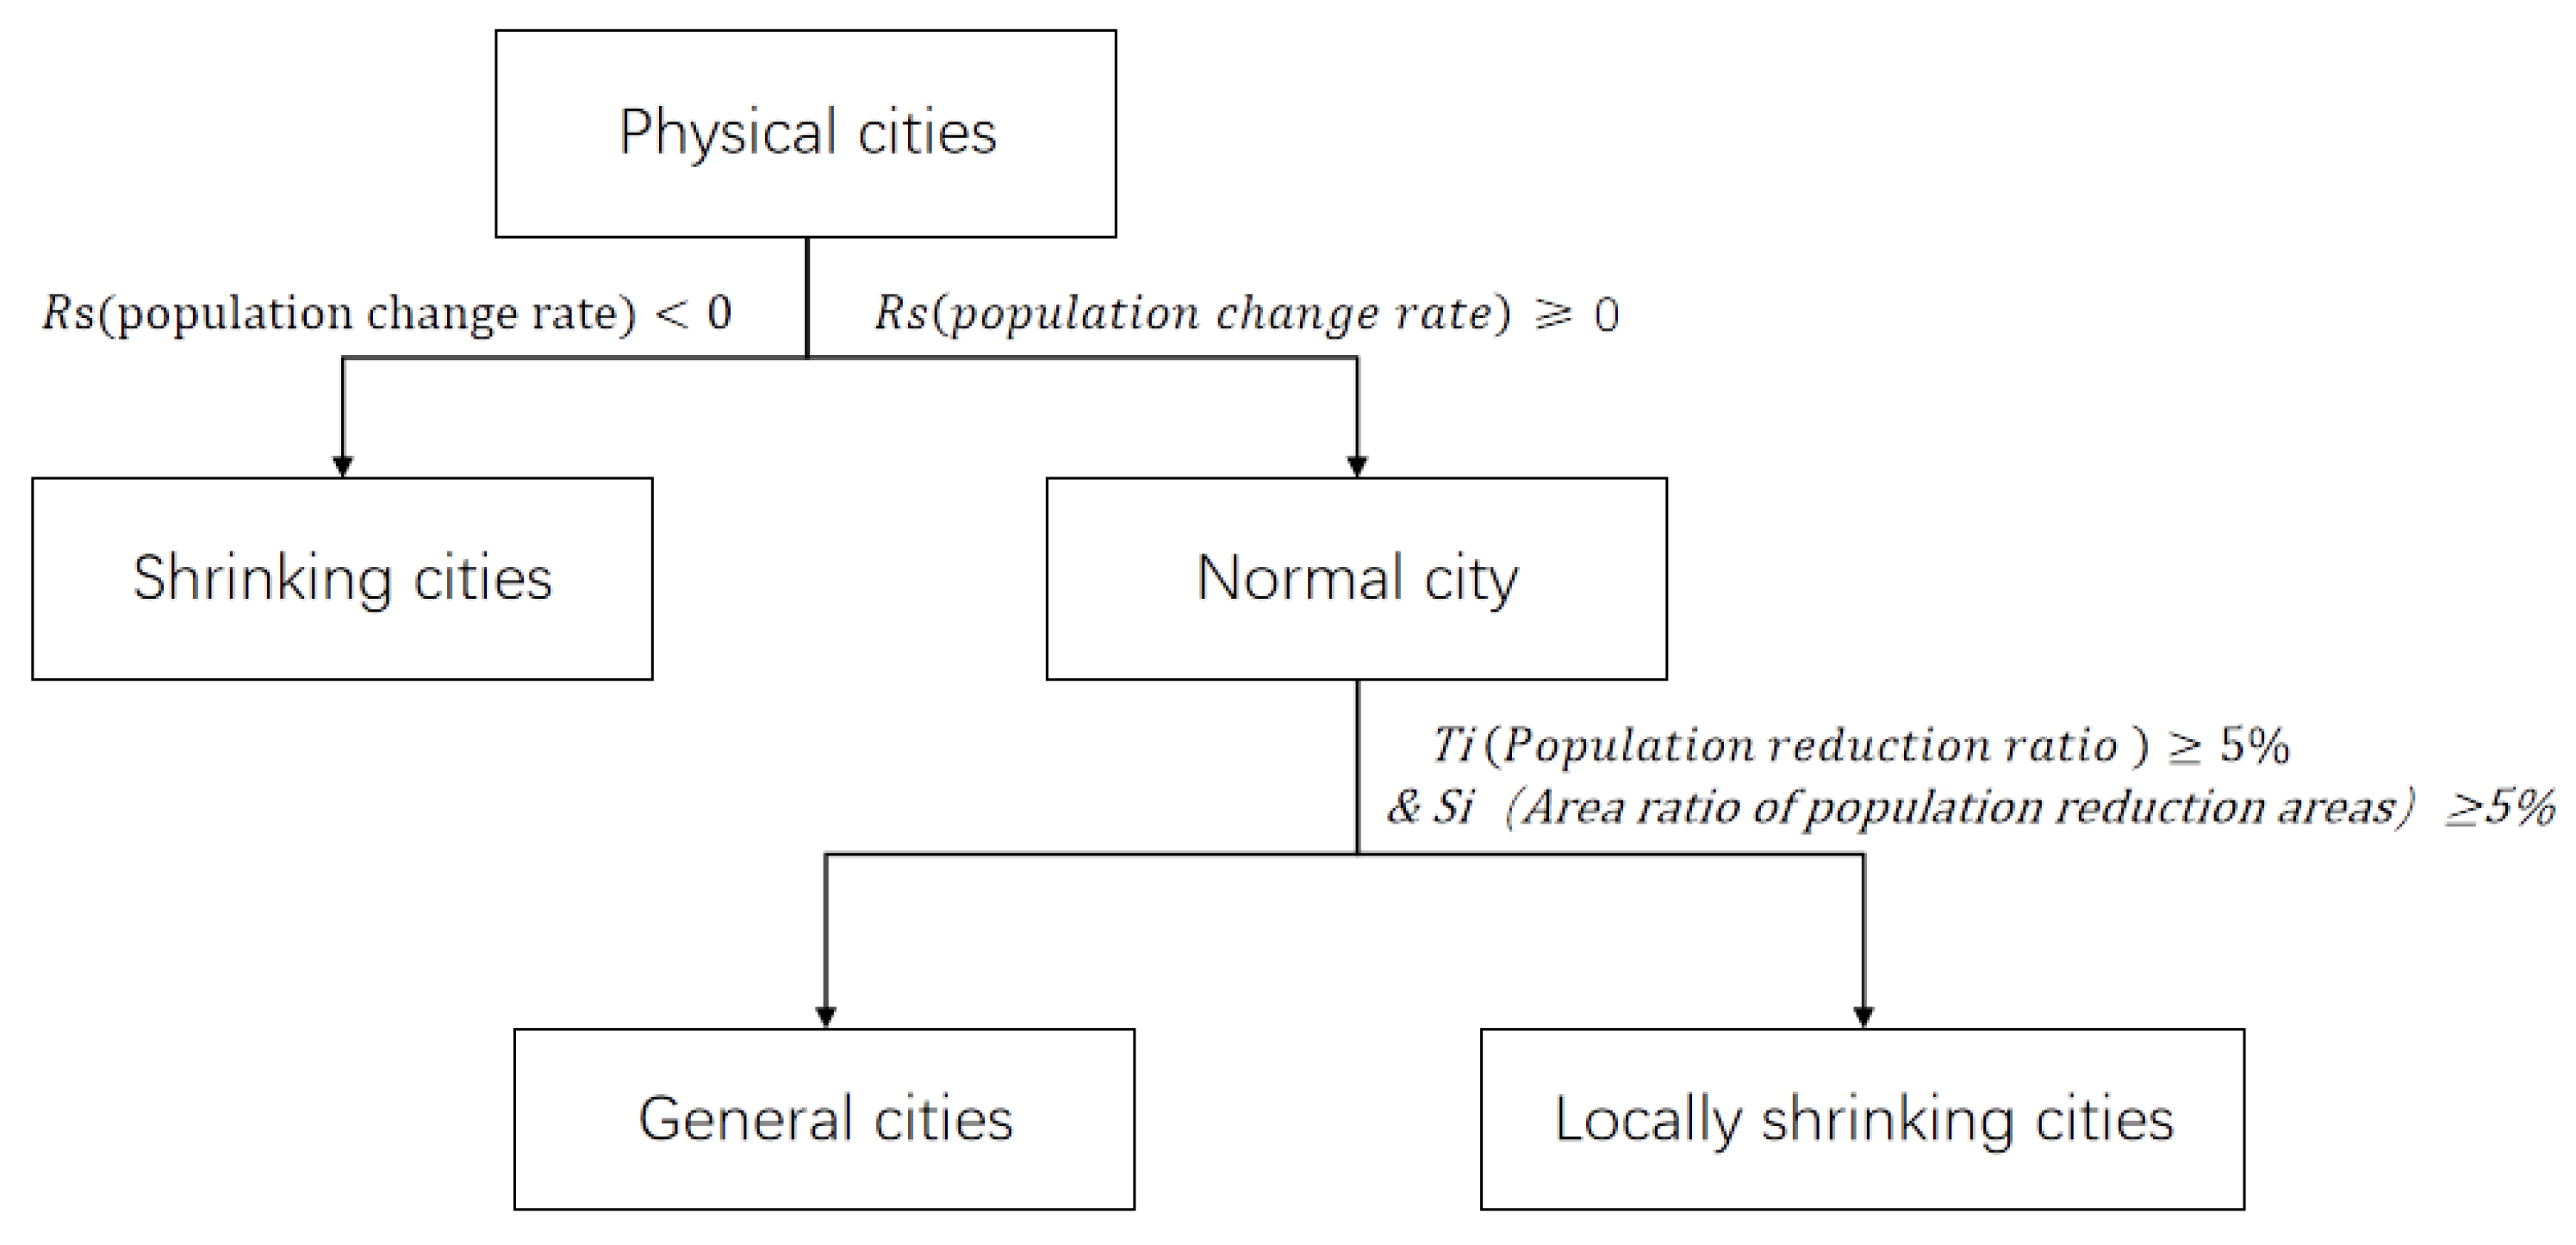
2.3.4. Classification of Physical Urban Shrinkage

In order to give reasonable advice on urban shrinkage, this paper examines the spatial pattern of population change within physical cities and uses this to classify the types. Based on the identification results and following current international research [9,26,27], physical territorial shrinking cities can be classified into four types—complete, concentrated, perforated, and peripheral—based on the area ratio and spatial distribution characteristics of depopulated areas within the city. The classification criteria of shrinking cities are shown in Table 2.

3. Results

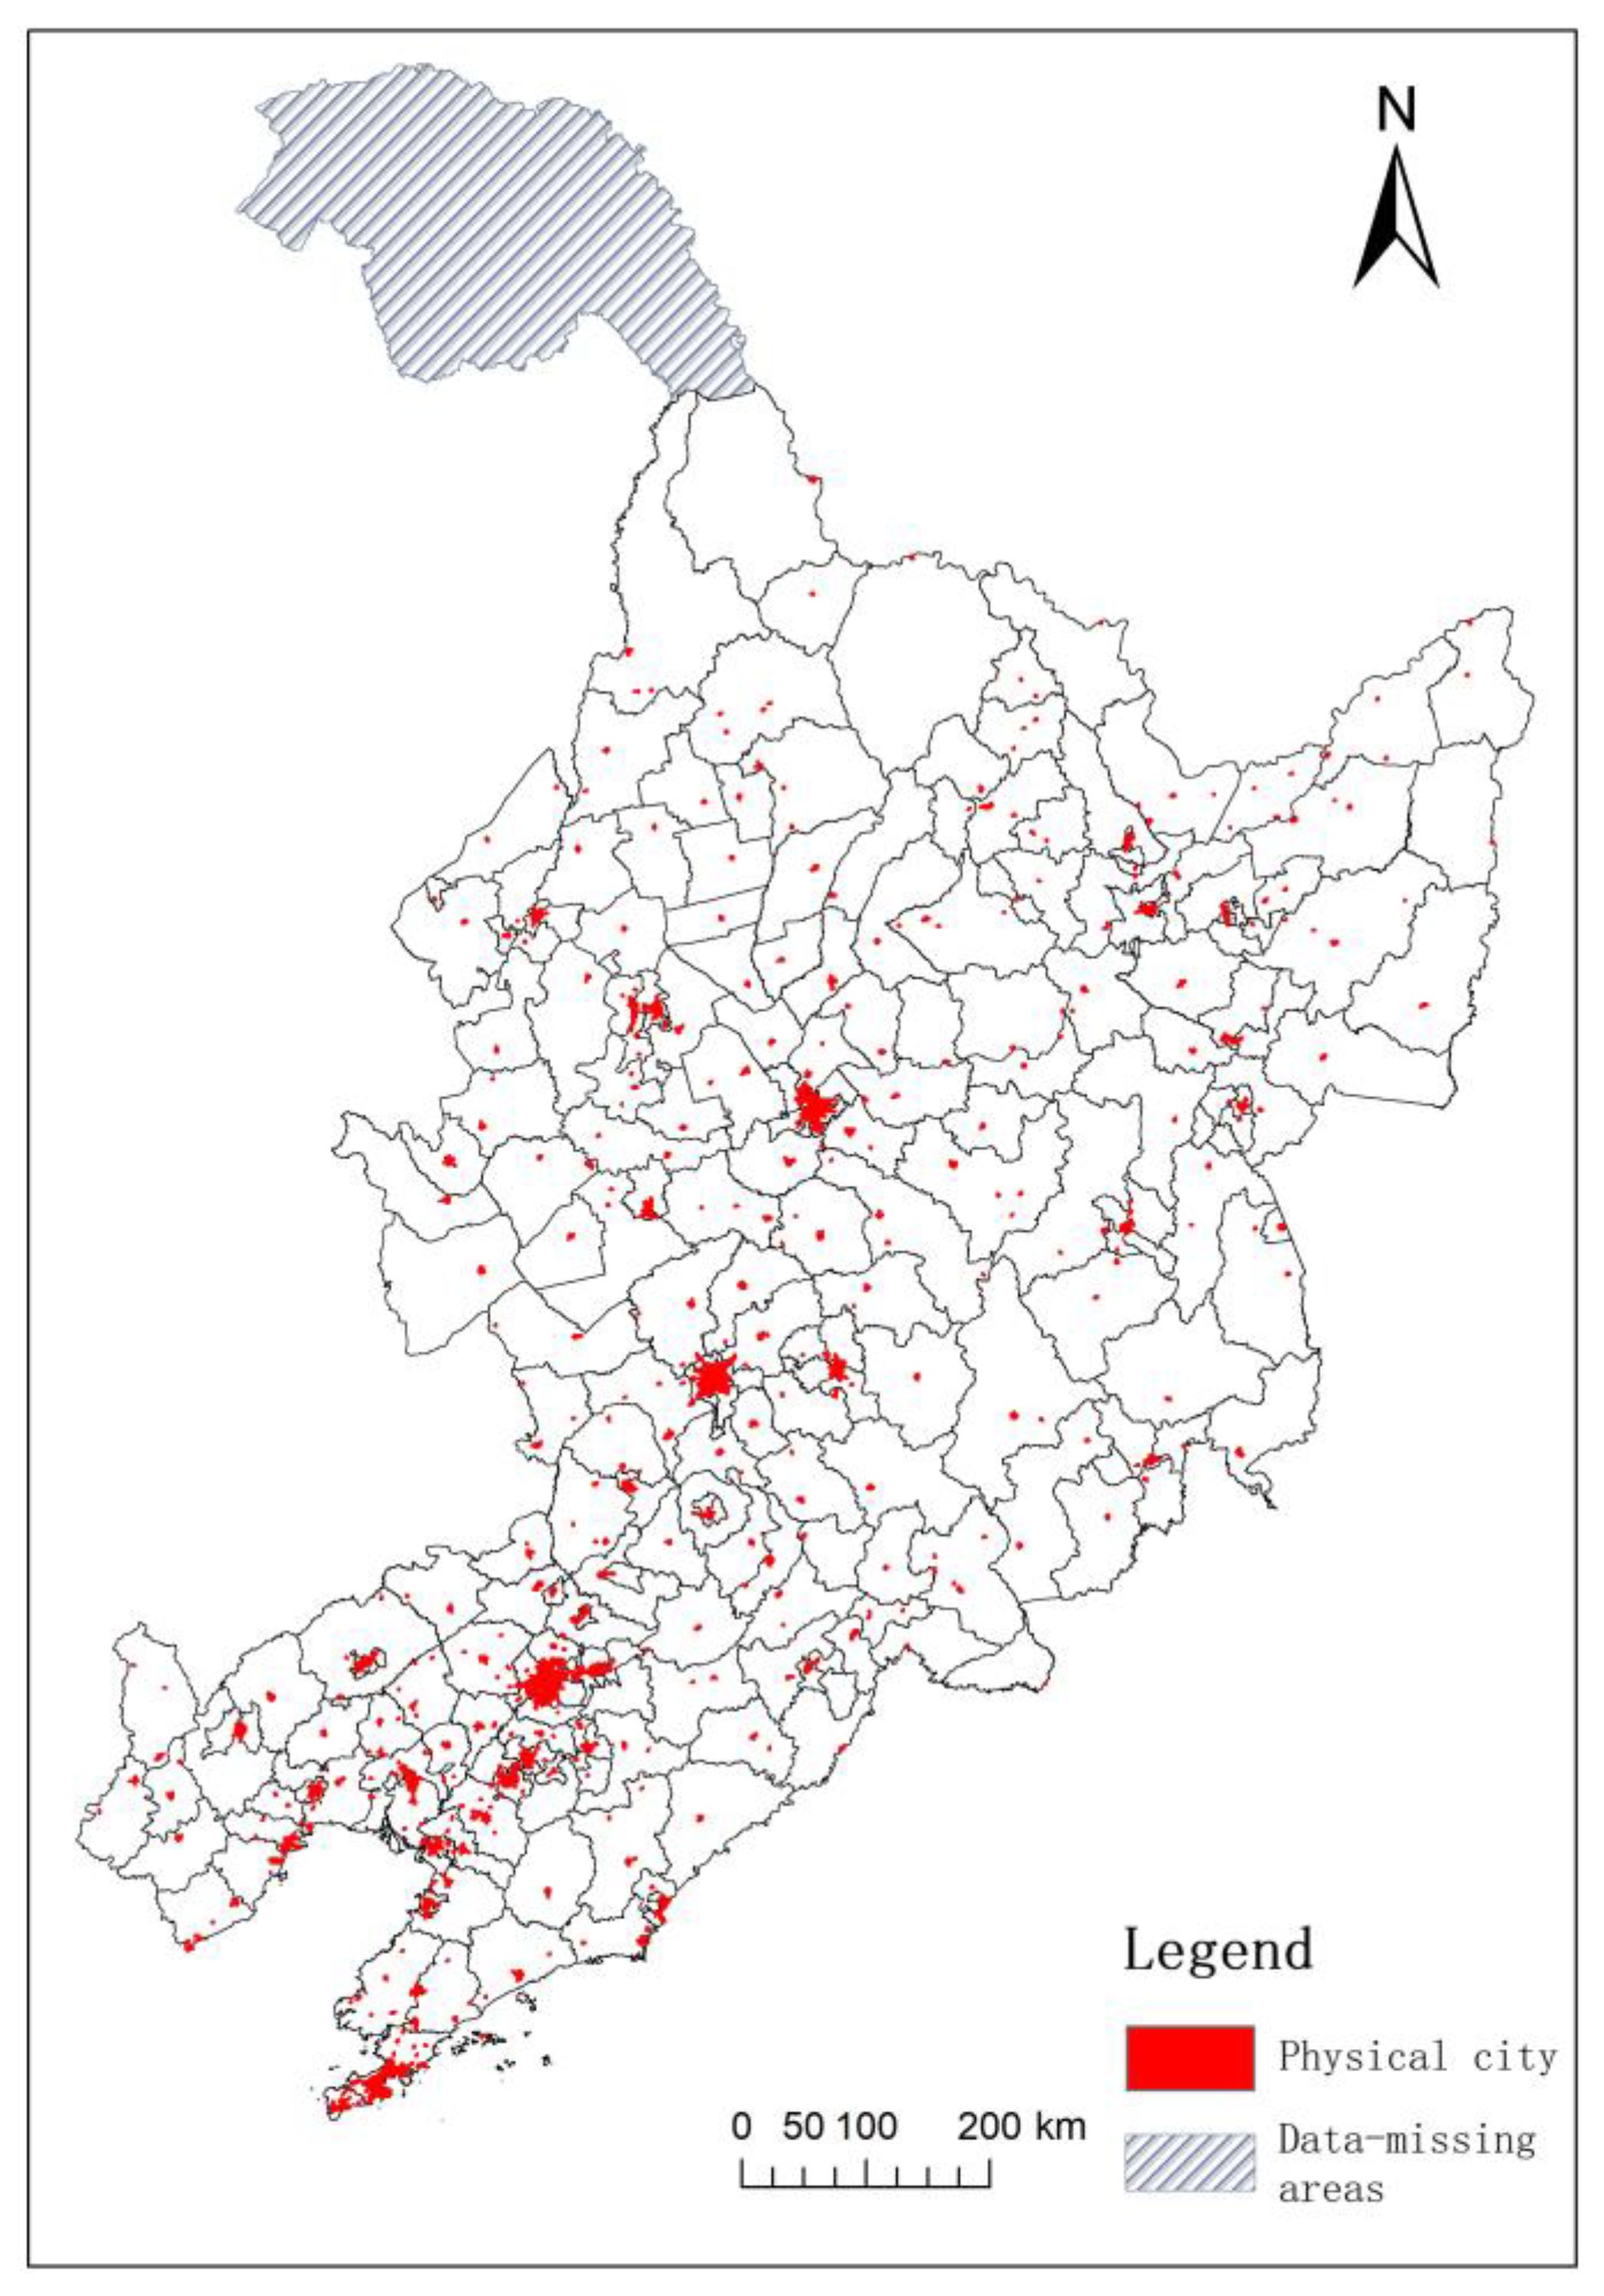
3.1. Physical City Identification Results

A total of 497 physical cities in the three provinces of northeast China were identified, including 216 in Liaoning Province, 176 in Heilongjiang Province, and 105 in Jilin Province, as shown in Figure 4. In order to identify and judge the shrinkage status of the physical cities one by one, the physical cities were first named. Where there is only one physical city in a county, it is named “prefecture-level city + county district”, e.g., Yichun City Meixi District. Where there are multiple physical cities within a county, they are numbered according to the area of the county and named “prefecture-level city + county district + number”, for example, Dalian City Jinzhou District 1, Dalian City Jinzhou District 2. Where a physical city is divided by more than one county, with an area of more than 20 km2, it will be named “prefecture-level city + main city”, for example, the main city of Shenyang. If the area is less than or equal to 20 km2, it will be named as “prefecture-level city + county + number” for the larger county.
The result is shown in Table 3. Refer to Zipf’s law; the result is calculated from Equation (6). α = 0.94, which is close to 1, as shown in Figure 5, indicating that the physical cities in the three provinces of northeast China are in line with the basic law of cities, obeying Zipf’s law.
ln R = A α ln P R
where P 1 , P 2 , P 3 P n is the rank order of the physical cities in descending order of size; P R is the urban area of the R th largest physical city; and α is the Pareto index, which reflects the population distribution of the city. The closer α is to 1, the closer the city is to the ideal state of Zipf’s law, and the more the population development is in line with the basic laws of the city [28].

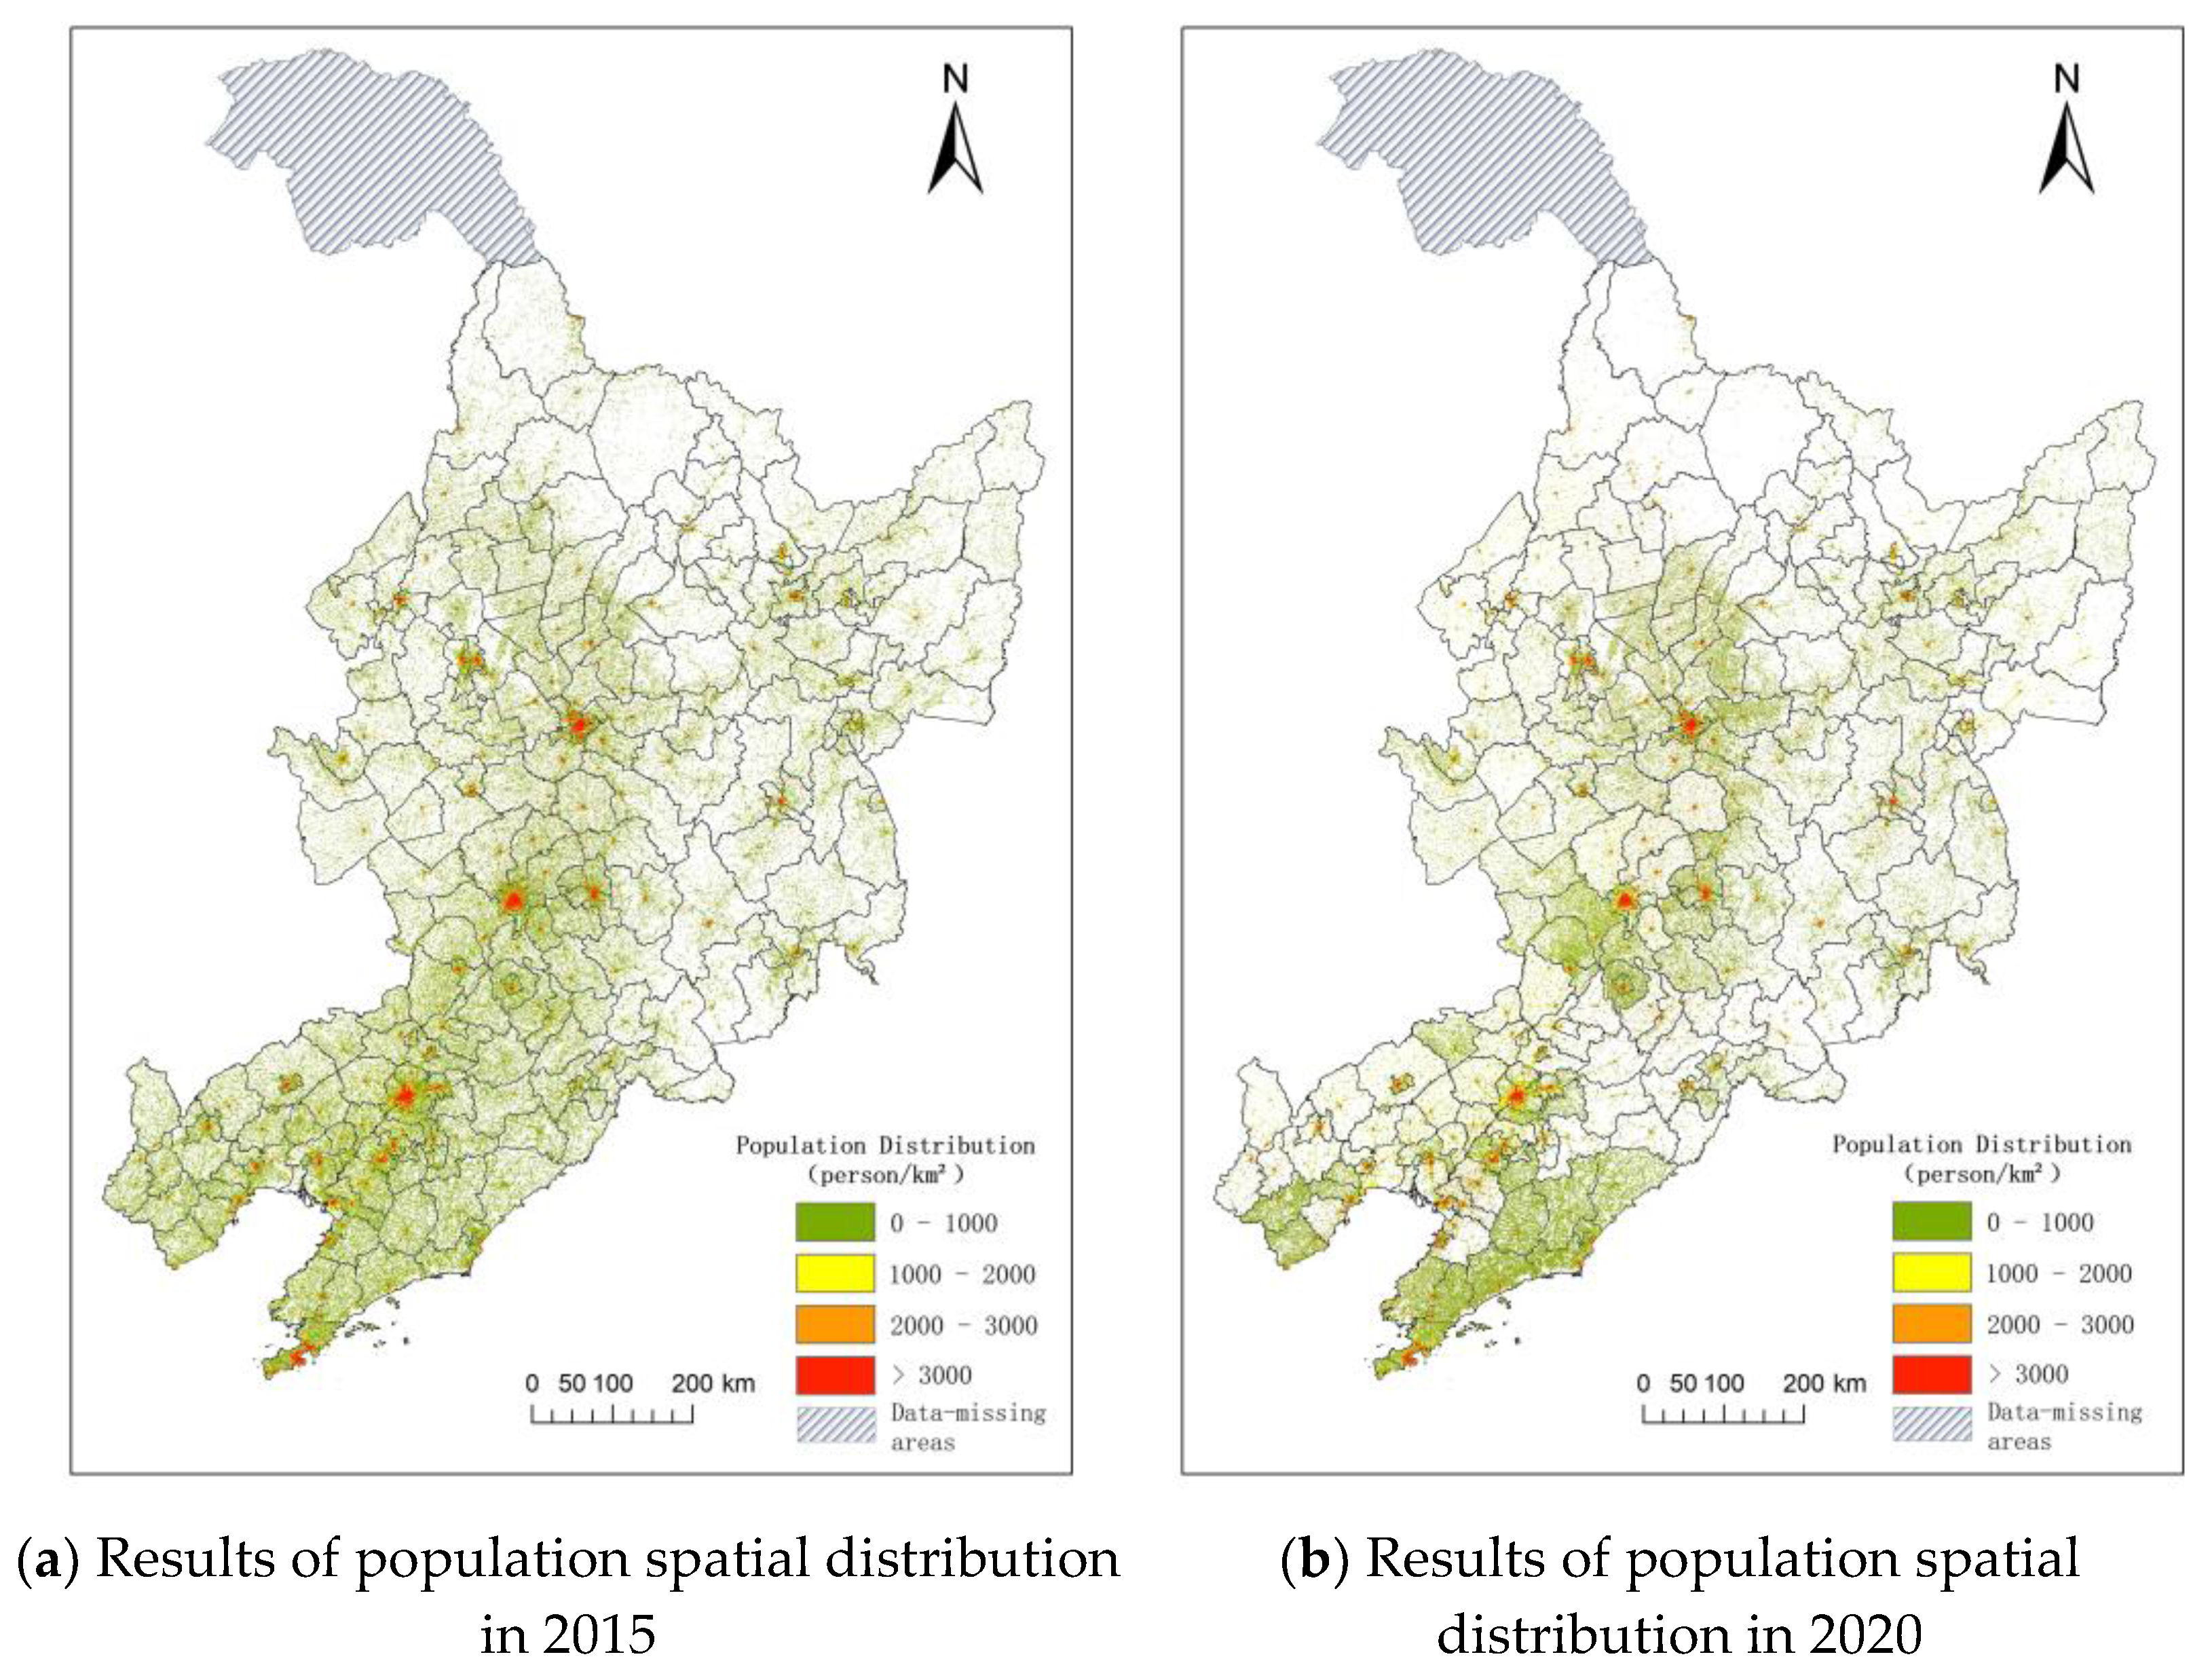
3.2. Results of Population Spatial Distributions

The results of population spatialization were calculated and are shown in Figure 6. The coefficients of determination (R2) of the GWR model for 2015 and 2020 were 0.86 and 0.93, respectively, as shown in Figure 7a,b, which shows that the fit results are better and more accurate in the less populated counties. The adjusted coefficients of determination (adj R2) were 0.84 and 0.92, respectively, both exceeding 0.8 and passing the significance test (p < 0.001). The spatial correlation of residuals (Moran’s I) was calculated, and the more the residuals tended to be randomly distributed, the more reliable the regression model was. The values of Moran’s I in 2015 and 2020 were 0.05 and −0.03, respectively, obeying the characteristics of random distribution, indicating that the regression results were more reliable. The accuracy was verified by comparing the mean absolute error (MAE), root mean square error (RMSE), and relative root mean square error (% RMSE) with the existing product dataset WorldPop population data.
The smaller the MAE, RMSE, and % RMSE, the smaller the error between the spatialized population and the statistical population, the smaller the overall deviation, and the higher the accuracy of the model. The spatialized population data and the WorldPop population data with 1 km accuracy within each county were counted, and the results are shown in Table 4. Therefore, compared with existing products, the spatialized population results obtained in this paper have a higher fitting accuracy at the county scale, which provides a reliable guarantee for the identification and classification of shrinking cities.

3.3. Identification Results and Classification of Urban Shrinkage

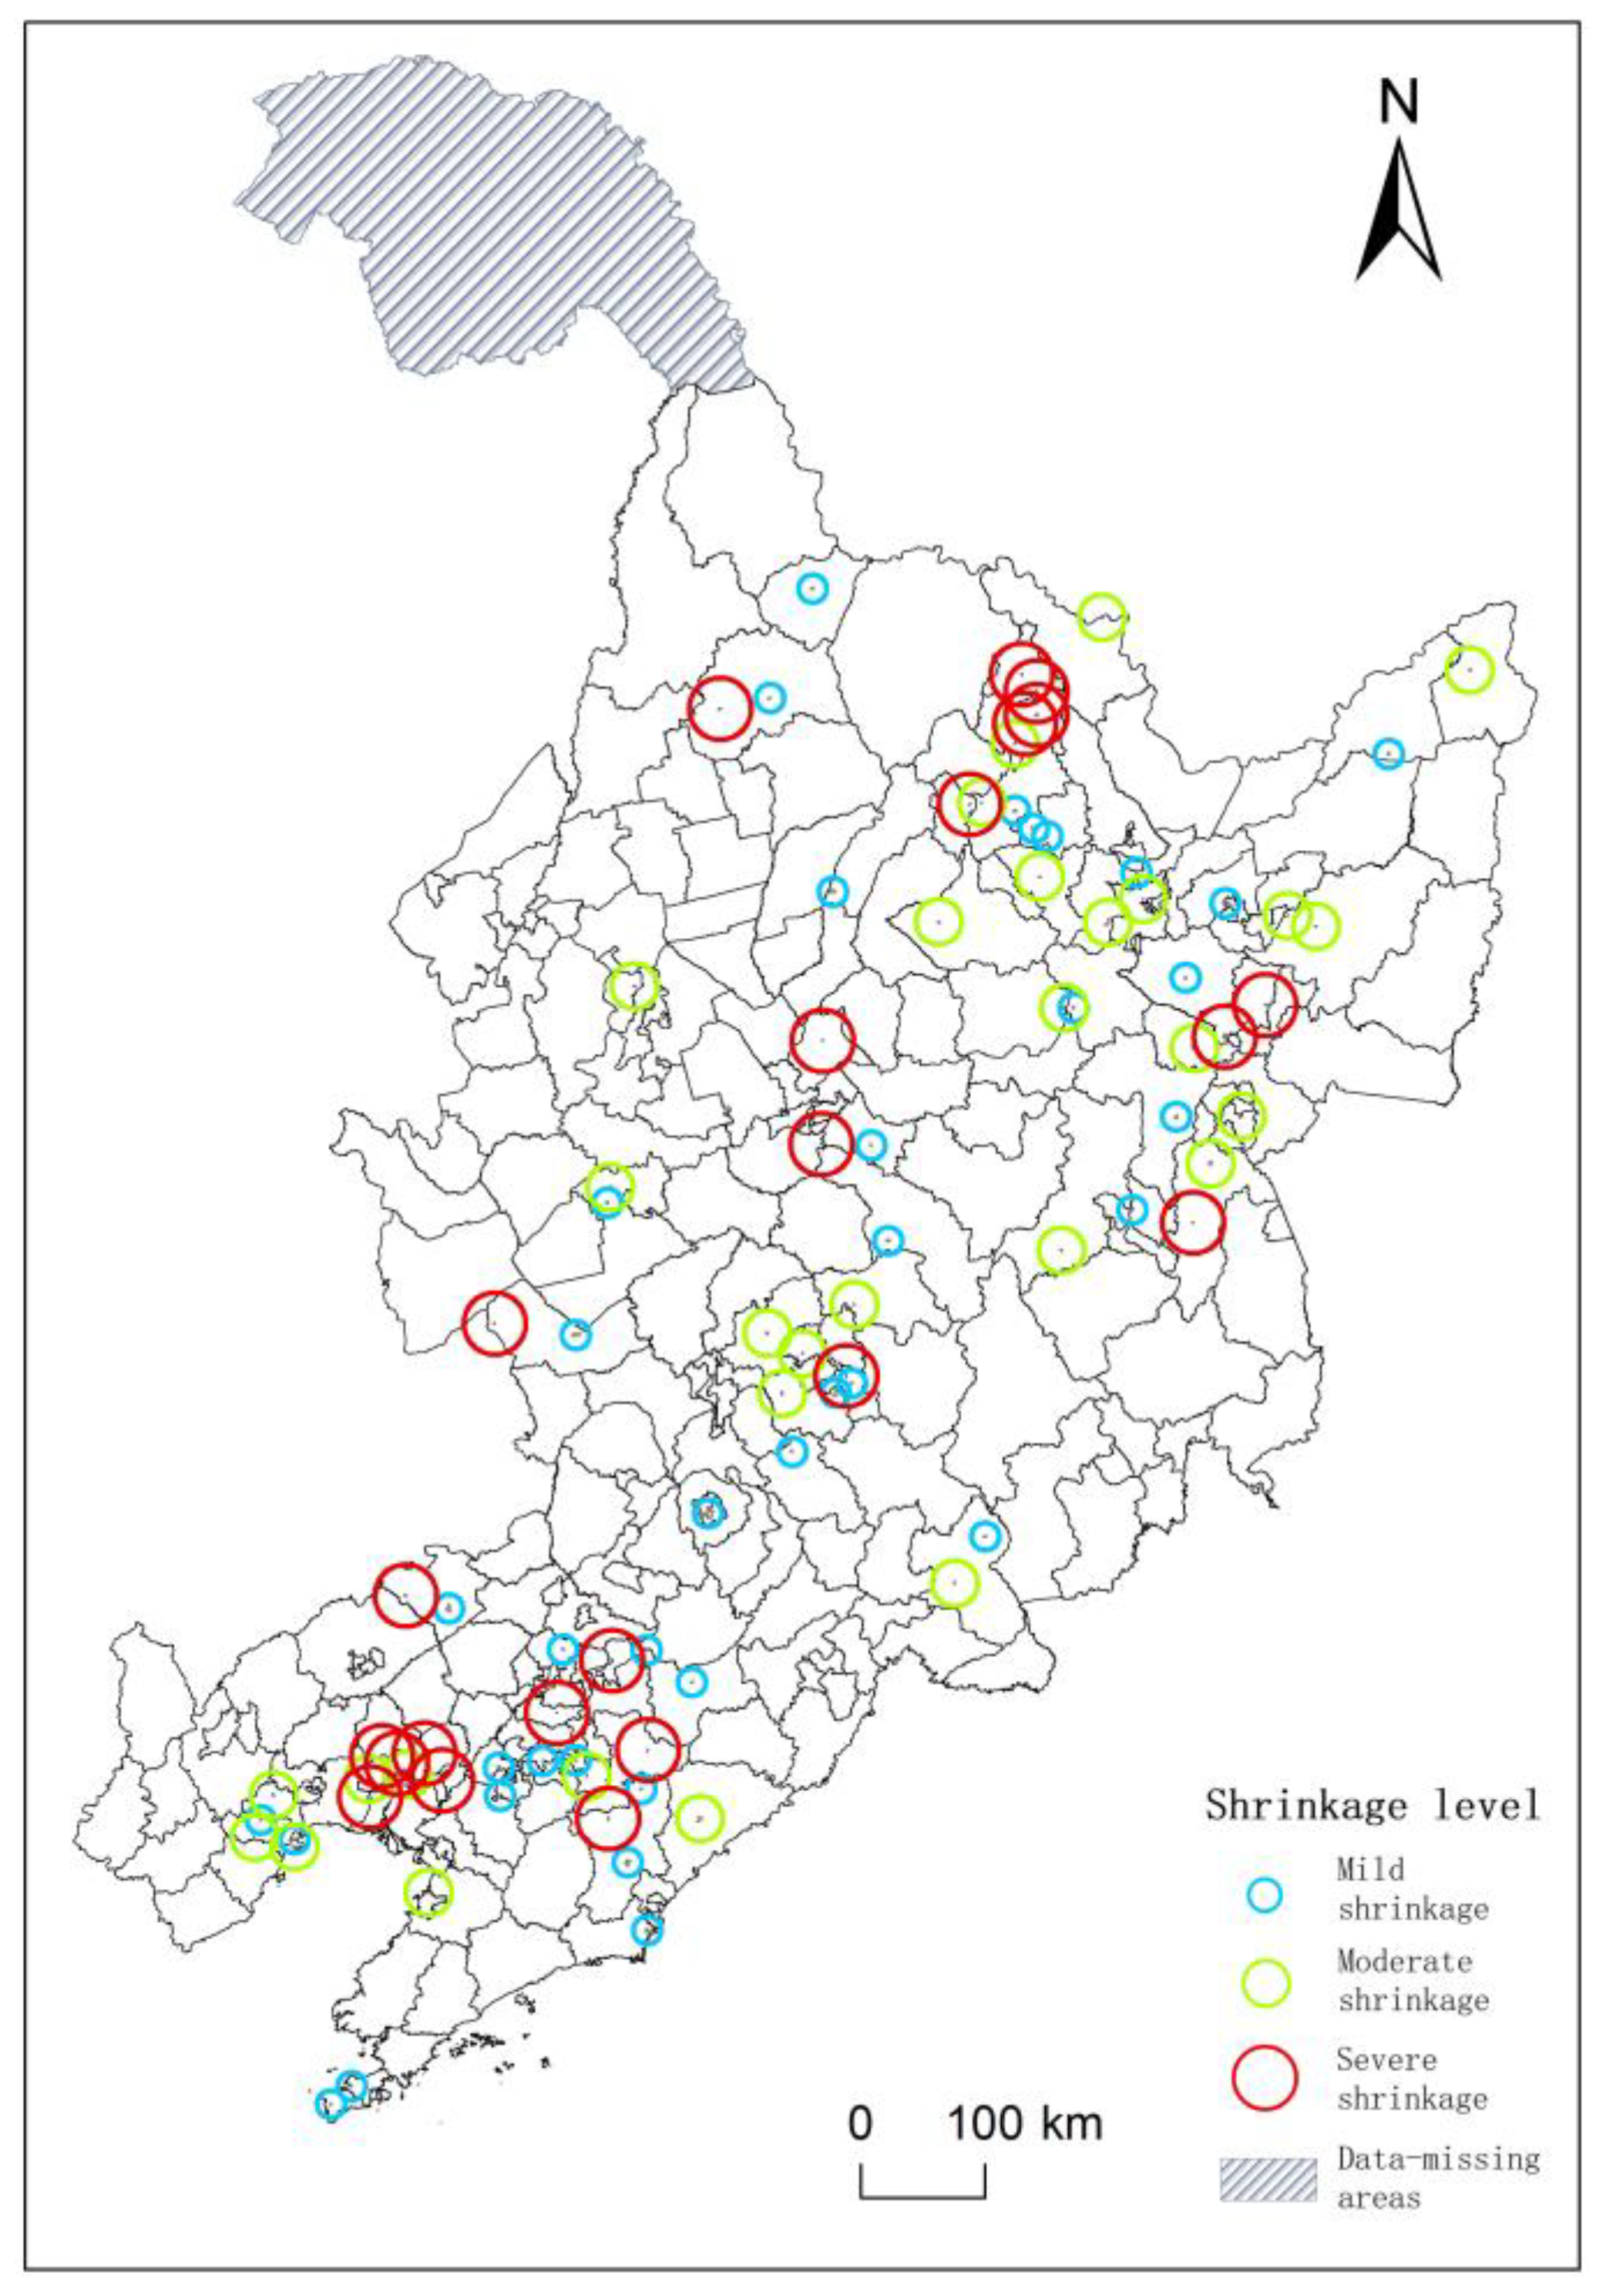
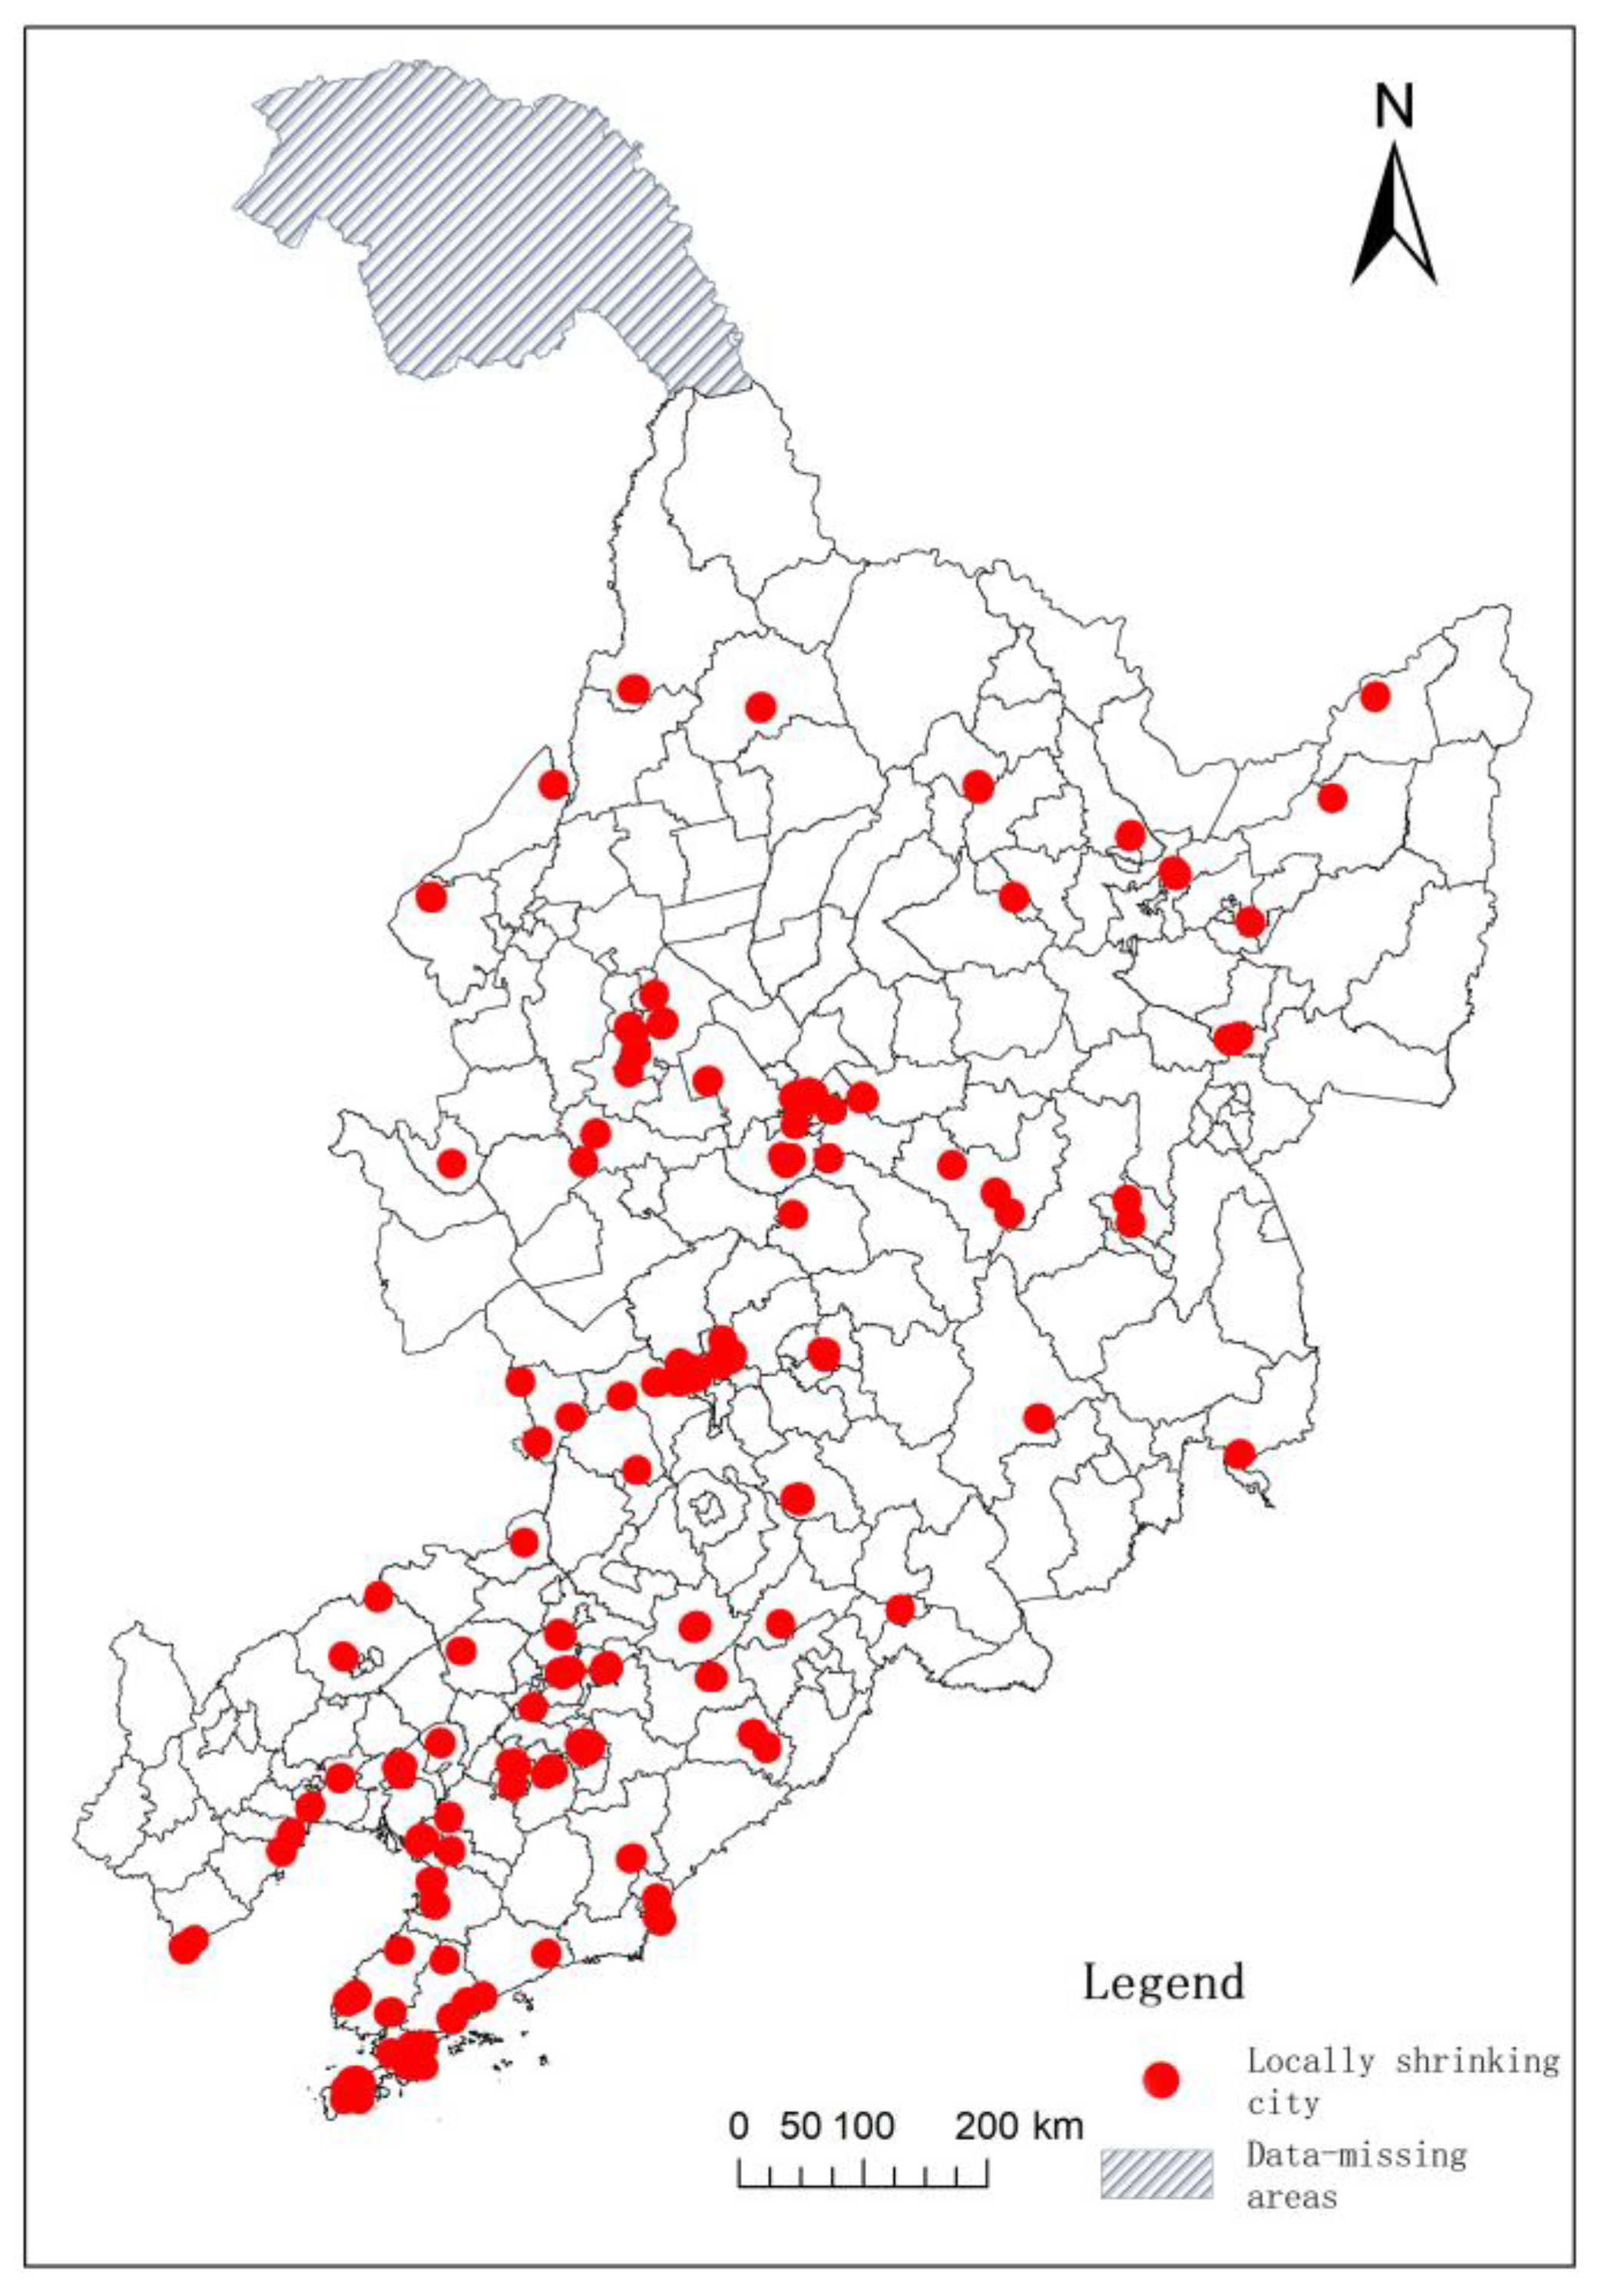
3.3.1. Results of Urban Shrinkage Identification

Of the total of 497 physical cities, 90 were identified as shrinking cities, with their spatial distribution shown in Figure 8. Forty-two of them were in Heilongjiang province, the most in the three provinces of northeast China, accounting for 46.7% of all cities. Shrinking cities appeared in all the prefecture-level cities, with a relative concentration in Yichun. Jilin had a total of 15 shrinking cities, accounting for 16.7%, mostly concentrated in Jilin, Songyuan, and Liaoyuan. Additionally, Liaoyuan’s main urban area decreased in terms of the population by 5.7% and shrank in terms of the area by 24.9%, making it the largest shrinking city in the three provinces of northeast China in terms of area. In Liaoning, 33 cities are shrinking, accounting for 36.7%, mainly in Panjin, Huludao, and Dandong in southern Liaoning, with a few in other cities, such as Benxi and Liaoyang. The shrinking cities in the three provinces of northeast China are mainly small and medium-sized cities. Only two cities, Shuangtaizi District in Panjin and the main city of Liaoyuan, have an area of more than 20 km2. The total area of shrinking cities was 395.49 km2, accounting for 18.07% of the total physical city area. Among them, 37 are mildly shrunken cities, 30 are moderately shrunken cities, and 23 are heavily shrunken cities. The classification results are shown in Table 5. It shows that shrinking cities are found in all regions of the three provinces of northeast China, with heavily shrunken cities mostly concentrated in Yichun, a typical shrunken city in northern Heilongjiang, and in cities around large cities in the coastal areas of Liaoning.
In terms of the total population of the physical cities, although most of the physical cities are still dominated by population growth, each of the total 497 physical cities is experiencing a shrinkage, i.e., there are areas of greater or lesser population loss. For example, in Jilin Changyi District 1, although the total population grew by 3.24%, 16.41% of the area within the city was in the process of losing population, and it lost 11.73% of the total population, that is, 11.73% of the population in 16.41% of the area. This indicates that significant localized contractions have emerged in some areas within physical cities, even as the population of the city as a whole is increasing. Therefore, a combination of city shrinkage area ratio and population reduction ratio identifies 118 locally shrinking cities, as shown in Figure 9. Among them, 59, or 50%, are in Liaoning, the largest of the three provinces of northeast China; 34, or 28.8%, are in Heilongjiang; and 25, or 21.2%, are in Jilin. The locally shrinking cities are dominated by small cities around large cities, especially mega-cities, such as the main city of Harbin, the main city of Shenyang, and the main city of Dalian, which have a great influence on the small cities around them.

3.3.2. Results of Urban Shrinkage Classification

The spatial patterns of population loss areas within shrinking cities and locally shrinking cities were judged according to the classification model criteria of urban shrinkage. The cities in each category were obtained, as shown in Table 6. It was determined that the concentrated shrinking city category was the most prevalent in the three provinces of northeast China, with a total of 111 cities, accounting for 50.9%. They are mainly distributed in Liaoning Province and Heilongjiang Province and mostly include small and medium-sized cities. There was a significant reduction in population in specific areas within the concentrated shrinking cities, with a relatively high ratio of shrinkage areas. The second category is perforated shrinkage, with a total of 64 cities, accounting for 29.4%. They are mainly distributed in small cities around major cities in the coastal areas of Liaoning Province and around the main city of Changchun City. Most of them are cities with relatively small shrinking area ratios and population reduction. The population change rate is also dominated by positive growth or stable change (−5% < Rs < 5%), indicating that perforation-type contraction has a small impact on cities. A total of 20 marginal shrinkage cities, accounting for 12.8%, are evenly distributed in the three provinces of northeast China, mainly in small cities. Most peripheral cities lost their peripheral population, but their internal population is accompanied by a significant increase in the total population. The rate of population change also increased significantly. Only a few cities have relatively stable population changes. There are a total of 13 complete shrinkage cities, accounting for 6.0%, mainly concentrated in Yichun City, Heilongjiang Province. While the urban interior is shrinking in a large area, the population is also showing a significant decline. Complete shrinking cities are all heavily contracted cities. The examples of various shrinking cities are shown in Table 7.

4. Discussion

China’s urbanization started late but was driven by rapid economic development; the urbanization is progressing rapidly but is of low quality overall. Against the background of vigorous development of heavy industry, resource-based cities in the three provinces of northeast China have risen rapidly. However, the rapid expansion of urban areas and a significant increase in urban area have led to low overall quality. At the same time, China is facing a serious aging population and a low natural population growth rate. There is a significant imbalance between the population growth rate and the growth rate of built-up areas, which leads to a dilution of population density. In addition, in recent years, the resources of the three northeastern provinces have been depleted. Coal, minerals, and other pillar industries are gradually declining; the transformation of the industrial structure is difficult in order to achieve rapid results; and economic development is slow. Compared to economically developed cities, such as Beijing, Shanghai, Guangzhou, and Shenzhen, cities in the three provinces of northeast China are relatively backward in terms of salary levels, welfare benefits, and educational resources. Moreover, the climate of cities in the south is relatively livable, and it is difficult to avoid a large outflow of population from the three provinces of northeast China. In this environment, the three provinces of northeast China have created a situation of population reduction and urban contraction.
Complete shrinking cities are experiencing serious population loss and economic development difficulties. People are more willing to go out for employment and development, forming a vicious circle of continuous decline in the “population economy”. Improving urban infrastructure construction, increasing support for enterprises, creating more employment opportunities and a better employment environment for local communities are necessary steps to promote economic development and break the vicious circle.
There is regional population loss in concentrated and shrinking cities. The causes of its formation are relatively diverse. For example, resource-based cities in China have experienced a rapid inflow of population and development. Former “unit complexes”, such as mining bureaus, in these cities have gradually declined and disintegrated due to resource depletion or the impact of national-policy-oriented economic transformation, resulting in a significant loss of population in the region. Moreover, most resource-based cities are built in mines, making it difficult to form convenient transportation conditions. Therefore, after resource depletion, it is difficult for the overall economy of the city to develop and recover. Regional populations may also be affected by the terrain and move out in large numbers, leading to population loss. Appropriate solutions should be adopted for different regions, such as developing transportation to solve the problem of urban blockages; encouraging companies to rebuild in the disintegrated unit areas can promote economic development, attract population, and boost the surrounding economy.
There are discontinuous and irregular population holes in perforated shrinking cities, but the loss areas are not concentrated, and the population loss is relatively small. This may be due to the existence of abandoned buildings in the city, the staggered mixing of idle and abandoned spaces and used spaces, or the adjustment of urban internal planning and regional reconstruction, forming a discontinuous urban texture [23]. Appropriate measures should be taken as early as possible for perforated shrinking cities, before the emergence of regional contraction. Such measures could include, for instance, adjusting urban planning in a timely manner and addressing issues such as vacant houses and idle land to avoid large-scale population outflows in certain regions.
Peripheral shrinking cities tend to have a significant increase in the population of urban centers while reducing the population at the edge of the city. This indicates that rapid development is occurring within the city. However, this development brings with it potential issues, such as excessive suburban urbanization, overly fast development of built-up areas, and difficulty in attracting population to peripheral regions. The government should take overall control of this situation by slowing down the rate of urbanization, improving the efficiency of land use around the edges of the city, strengthening infrastructure construction, and enriching cultural and entertainment activities. These efforts will help attract more people to these areas.
In addition, the emphasis on expanding development is no longer applicable to all cities. Urban shrinkage, caused in part by endogenous factors, such as resource depletion, talent shortage, financial depression, and severe age imbalance, is difficult to restore to its original level and is irreversible [22]. Therefore, it is necessary to look at urban shrinkage dialectically, adjust urban planning, and face the challenges posed by urban shrinkage positively. For example, concentrating on urban population, vigorously developing the central areas of cities can promote rapid economic development while improving resident living standards. This can increase the vitality index of the city, enhance residents’ sense of well-being, and alleviate population loss. In addition to the original size of the city, industries such as green, tourism, and manufacturing can be developed according to local conditions. Unused buildings and land can be renovated and ecological environments adjusted to improve housing construction value and land utilization efficiency. The city’s spatial pattern and industrial structure can be reasonably transformed to alleviate the imbalance between the built-up area and population ratio caused by urban expansion.

5. Conclusions

Based on POI data, this paper identifies the physical cities in the three northeastern provinces. Then, land use, night-time light, and POI multi-source geographic big data are used to extract their feature values as independent variables. Taking the population of each county as the dependent variable, the GWR model was used to obtain the spatial data of the 30 m grid population in the three northeastern provinces as a way to identify whether the physical cities in the three provinces of northeast China are shrinking. In the spatial dimension, this study analyzes the causes of shrinkage and gives policy recommendations based on the type of spatial pattern division of the urban population loss areas. The main conclusions are as follows. (1) Physical cities were identified using a threshold of a POI kernel density value greater than 45/km2 and an area size greater than or equal to 2 km2. A total of 497 physical cities were identified in the three northeastern provinces, 216 in Liaoning Province, 176 in Heilongjiang Province, and 105 in Jilin Province, with a total area of 6264.43 km2. The largest physical city is the central city of Shenyang, with an area of 584.75 km2. The identified physical cities obey Zipf’s law, which is in line with the basic law of natural urban development, indicating that the identified physical cities in the three provinces of northeast China are valid, and it is feasible to use them as the basic research unit. (2) The population data from the counties in the three provinces of northeast China were found to be spatially correlated and suitable for analysis using the GWR model. The 2015 and 2020 population spatialization results through land use data, night-time light data, and POI kernel density analysis data are generally consistent with existing studies. The adjusted coefficients of determination are 0.84 and 0.92, respectively, and the residual Moran’s indices are 0.05 and −0.03, respectively. The degree of fit is good; the residuals obey the characteristics of random distribution; and the regression results are more reliable. Additionally, the error at the county scale is small compared with WorldPOP; the overall deviation degree is small; and the model accuracy is high. (3) Physical cities with a negative population change rate (Rs < 0) are considered shrinking cities. Cities with a reduction in population and shrinking area ratios greater than 5% ( T i > 5% and S i > 5%), but an overall positive population change rate (Rs > 0), are categorized as locally shrinking cities. A total of 90 shrinking cities and 118 locally shrinking cities were identified, which were distributed throughout the three provinces of northeast China and were mostly small cities around large cities. According to the spatial pattern of population loss areas, 13 complete shrinking cities, 111 concentrated shrinking cities, 64 perforated shrinking cities, and 20 peripheral shrinking cities were identified. The causes of the different types of shrinking cities were analyzed, such as the decay and disintegration of unit compounds, abandoned buildings, and unreasonable design and planning in cities. Economic development can be promoted by creating employment opportunities, improving living welfare, developing transport, adjusting urban planning or concentrating urban population, and vigorously developing urban centers to attract inward population flows and provide for the revival and development of shrinking cities.
In this paper, research was conducted on the spatial pattern of population loss areas within shrinking cities through population spatialization data, with the physical city as the basic unit. Although certain research results were achieved and preliminary conclusions obtained, there are still some shortcomings, which need to be improved. (1) In identifying the physical city, the city boundary is jagged and obvious, and the city form is not in line with the law of natural development formation. Therefore, in further research, further correction of the physical city boundary through road network data can be considered to smooth out the jagged city boundary and make it more in line with the form of natural urban development. (2) Population contraction should be relatively irregular, but some areas of population contraction show continuous changes in values. It is possible that during the process of population spatialization in the three northeastern provinces, the night-time light intensity values in individual counties are too small. This may lead to POI data being the dominant dependent variable during modeling, resulting in significant traces of kernel density analysis when identifying population contraction. In the next step of the study, an attempt could be made to improve the kernel density analysis by selecting dependent variables for the corresponding types of POI with different search radii.

Author Contributions

Conceptualization, X.M. and Q.Y.; methodology, X.M.; software, Q.P.; validation, X.M., Q.Y. and Q.P.; formal analysis, X.M.; investigation, Q.P.; resources, Q.P.; data curation, X.C.; writing—original draft preparation, X.M.; writing—review and editing, Q.Y.; visualization, X.C.; supervision, Q.Y.; project administration, X.M. and G.L.; funding acquisition, X.M, Q.Y. and G.L. All authors have read and agreed to the published version of the manuscript.

Funding

This research was funded by the Fundamental Research Funds for the Central Universities (No. 2021ZDPY0205), the Third Comprehensive Scientific Investigation Project of Xinjiang (No. 2022xjkk1004), the National Natural Science Foundation of China (No. 51874306, No. 42101459).

Data Availability Statement

Not applicable.

Acknowledgments

The authors would like to thank the anonymous reviewers and editors for commenting on this paper. Thank you to everyone who contributed to this study.

Conflicts of Interest

The authors declare no conflict of interest.

References

  1. Hartmut, H.; Walter, S. Die Schrumpfende Stadt und die Stadtsoziologie; VS Verlag für Sozialwissenschaften: Wiesbaden, Germany, 1988; pp. 78–94. [Google Scholar]
  2. Sarzynski, A.; Thomas, J. Vicino. Shrinking suburbs: Analyzing the decline of american suburban spaces. Sustainability 2019, 11, 5230. [Google Scholar] [CrossRef] [Green Version]
  3. Wolff, M.; Wiechmann, T. Urban growth and decline: Europe’s shrinking cities in a comparative perspective 1990–2010. Eur. Urban Reg. Stud. 2018, 25, 122–139. [Google Scholar] [CrossRef]
  4. Haase, A.; Bontje, M.; Couch, C.; Marcinczak, S.; Rink, D.; Rumpel, P.; Wolff, M. Factors driving the regrowth of European cities and the role of local and contextual impacts: A contrasting analysis of regrowing and shrinking cities. Cities 2021, 108, 102942. [Google Scholar] [CrossRef]
  5. Mikel, G. Incorporating the life-course approach into shrinking cities assessment: The uneven geographies of urban population decline. Eur. Plan. Stud. 2020, 28, 732–748. [Google Scholar]
  6. Long, Y.; Wu, K.; Wang, J. Shrinking cities in China. Mod. Urban Res. 2015, 30, 14–19. [Google Scholar]
  7. Wu, K.; Sun, D. Progress in urban shrinkage research. Econ. Geogr. 2017, 37, 59–67. [Google Scholar]
  8. Sun, P.J.; Wang, K.W. ldentification and stage division of urban shrinkage in the three provinces of Northeast China. Acta Geogr. Sin. 2021, 76, 1366–1379. [Google Scholar]
  9. Meng, X.; Ma, S.; Xiang, W.; Kan, C.C.; Wu, K.; Long, Y. Classification of shrinking cities in China using Baidu big data. Acta Geogr. Sin. 2021, 76, 2477–2488. [Google Scholar]
  10. Jiang, Z.; Zhai, W.; Meng, X.; Long, Y. Identifying shrinking cities with NPP-VIIRS nightlight data in China. J. Urban Plan. Dev. 2020, 146, 020034. [Google Scholar] [CrossRef]
  11. Zhao, Ch.; Zhao, X.Y. Theoretical Origin, Experience and Enlightenment of the Shrinking of Traditional Industrial Cities in Developed Countries: An Analytic Framework Based on Marxist Spatial Political Economy. J. Lanzhou Univ. 2022, 50, 69–77. [Google Scholar]
  12. Rui, C. Comprehensive measurement and influencing factors analysis of shrinking cities in China. Stat. Decis. 2021, 37, 68–71. [Google Scholar]
  13. Hu, Y.K.; Wang, Zh.Y.; Deng, T.T. Expansion in the shrinking cities: Does place-based policy help to curb urban shrinkage in China. Cities 2021, 113, 103188. [Google Scholar] [CrossRef]
  14. He, H.M.; Zhang, J.X.; Geng, L. Regulative “perforation”: Local shrinkage of the development zones in the context of transformation-based on a case study of the areas along Huanghe Road in Changzhou High-tech Zone. City Plan. Rev. 2018, 42, 47–55. [Google Scholar]
  15. Li, Z. Increasing cities and shrinking regions: Migration in China’s urbanization: Cases from Sichuan Province and Xinyang City in Henan Province. Urban Dev. Stud. 2015, 22, 74–80. [Google Scholar]
  16. Chen, Z.; Yu, B.; Yang, C.; Zhou, Y.; Yao, S.; Qian, X.; Wang, C.; Wu, B.; Wu, J. An extended time series (2000–2018) of global NPP-VIIRS-Like nighttime light data from a cross-sensor calibration. Earth Syst. Sci. Data 2021, 13, 889–906. [Google Scholar] [CrossRef]
  17. Data Platform for Quantitative Research in Urban Spaces (School of Urban and Regional Science). POI Date (2012–2017), East China Normal University. 2020. Available online: https://sdsp.ecnu.edu.cn/data/dv/POIs (accessed on 14 June 2023).
  18. State Information Center. Map POI (Point of Interest) Data; Peking University Open Research Data Platform: Beijing, China, 2017. [Google Scholar] [CrossRef]
  19. Song, X.D.; Liu, P.; Zhou, Y.X. Urban and Rural Area Division: Taking Shanghai as an Example. Acta Geogr. Sin. 2006, 61, 787–797. [Google Scholar]
  20. Li, F.; Yan, Q.; Zou, Y.; Liu, B. Extraction Accuracy of Urban Built-up Area Based on Nighttime Light Dataand POl: A Case Study of Luojia 1-01 and NPP/VIRS Nighttime Light lmages. Geomat. Inf. Sci. Wuhan Univ. 2021, 46, 825–835. [Google Scholar]
  21. Liu, L.B.; Peng, Zh.H.; Wu, H. Classification of POl Natural Cities Scale and Hierarchy Based on Head/TailBreaks. Urban Plan. Int. 2019, 34, 56–64. [Google Scholar]
  22. Liu, B.L. Research on Identification and Driving Factors of Physical Urban Shrinkage in the Yangtze River Delta Based on Multi-source Data. Ph.D. Thesis, China University of Mining and Technology, Xuzhou, China, 2021. [Google Scholar]
  23. Li, H.; Zhang, H.Sh.; Wang, M.L. A Comparative Study of Population Spatialization Based on NPP/VIIRS andLJ1-01 Night Light Data: Taking Beijing for an Example. Remote Sens. Inf. 2021, 36, 90–97. [Google Scholar]
  24. Wang, K.; Cai, H.; Yang, X. Multiple scale spatialization of demographic data with multi-factor linearregression and geographically weighted regression models. Prog. Geogr. 2016, 35, 1494–1505. [Google Scholar]
  25. Zhen, Z.; Zhu, X.; Jian, H. Application of Geographical Weighted Regression in Population Spatial Distribution Research. Remote Sens. Inf. 2018, 33, 128–134. [Google Scholar]
  26. Blanco, H.; Alberti, M.; Olshansky, R.; Chang, S.; Wheeler, S.M.; Randolph, J.; London, J.B.; Hollander, J.B.; Pallagst, K.M.; Schwarz, T. Shaken, shrinking, hot, impoverished and informal: Emerging research agendas in planning. Prog. Plan. 2009, 72, 195–250. [Google Scholar] [CrossRef]
  27. Schetke, S.; Dagmar, H. Multi- criteria assessment of socio- environmental aspects in shrinking cities. Experiences from eastern Germany. Environ. Impact Assess. Rev. 2008, 28, 483–503. [Google Scholar] [CrossRef]
  28. Zhu, D.Q. Study on the Size Distribution of Cities in China: Evolution of and Deviations from Zipf’s Law. Ph.D. Thesis, Yunnan University of Finance and Economics, Kunming, China, 2021. [Google Scholar]
Figure 1. Map of the study area of the three provinces of northeast China.
Land 12 01245 g001
Figure 2. POI kernel density analysis comparison chart.
Land 12 01245 g002
Figure 3. Schematic diagram of urban shrinkage identification.
Land 12 01245 g003
Figure 4. The spatial distribution of physical cities.
Land 12 01245 g004
Figure 5. Zipf’s law.
Land 12 01245 g005
Figure 6. Results of population spatial distribution.
Land 12 01245 g006
Figure 7. Precision validation of population spatialization.
Land 12 01245 g007
Figure 8. Spatial distribution of shrinking cities.
Land 12 01245 g008
Figure 9. Spatial distribution of locally shrinking cities.
Land 12 01245 g009
Table 1. Cumulative distribution function statistical table.
Value Range
(pcs/km2)
Frequency
(pcs)
Frequency
(%)
CDF
(%)
CDF Change (%)Proportion of Physical Cities (%)
(0, 5]396,71934.2365.77/34.23
(5, 10]116,95714.8485.1619.3914.84
(10, 15]22,93111.0488.963.811.04
(35, 40]28956.2193.790.486.21
(40, 45]24265.8094.200.405.80
(45, 50]20045.4794.530.335.47
(2570, 2575]11.66 × 10−6100 0
Table 2. Classification criteria for urban shrinkage.
The Type of Urban ShrinkageConceptClassification Criteria
Land 12 01245 i001completeMost areas within the city limits are experiencing population loss at the same time.The area within the city has been depopulated by more than 50% of the urban area.
Land 12 01245 i002concentratedRegional population loss in one or more areas within a city.The areas of population decline within the city are concentrated in a certain area, showing a distribution state centered on the region.
Land 12 01245 i003perforatedUrban population loss areas are scattered and random.Depopulated areas are scattered across multiple parts of the city.
Land 12 01245 i004peripheralLoss of population around cities.The areas of population decline are distributed on the periphery of cities, and population growth within cities may be relatively stable.
Table 3. Table of the number of physical urban areas included in prefecture-level cities.
ProvinceThe Number of Physical Cities at the Prefecture Level
Heilongjiang ProvinceHarbin (36), Qiqihar (16), Mudanjiang (15), Jiamusi (15), Daqing (18), Jixi (7), Shuangyashan (10), Yichun (18), Qitaihe (5), Hegang (11), Heihe (12), Suihua (11)
Jilin
Province
Changchun (23), Jilin (13), Siping (12), Liaoyuan (3), Tonghua (10), Baishan (11), Songyuan (8), Baicheng (12), Yanbian Korean Autonomous Prefecture (12)
Liaoning ProvinceShenyang (26), Dalian (39), Anshan (15), Fushun (9), Benxi (10), Dandong (13), Jinzhou (16), Yingkou (11), Fuxin (6), Liaoyang (15), Panjin (16), Tieling (11), Chaoyang (11), Huludao (21)
Table 4. Precision evaluation of population spatialization.
DatasetMAERMSE% RMSE
Dataset of population spatialization in 2015366,740.586,478.162123.6%
Dataset of WorldPOP population spatialization in 201572,859.3124140,960.97438.4%
Dataset of population spatialization in 202043,513.169065.619.6%
Dataset of WorldPOP population spatialization in 2020109,372.2141,998.640.2%
Table 5. Classification of shrinking city measures.
ProvinceMild Shrinkage
(−10% < Rs < 0)
Moderate Shrinkage
(20% < Rs <10%)
Severe Shrinkage
(Rs < 20%)
Heilongjiang ProvinceYichun City Meixi District, Harbin City Yilan County 1, Yichun City Xilin District, Shuangyashan City Jixian County, Heihe City Wudalianchi City 3, Harbin City Acheng District, Jiamusi City Tangyuan County 2, Harbin City Wuchang City, Mudanjiang City Yangming District 2, Jiamusi City Tongjiang City 1, Jiamusi City Huannan County 1, Yichun City Jinshan Tun District, Heihe City Sunwu County, Suihua City Suiling County, Mudanjiang City Linkou CountyJiamusi City Suburban, Jiamusi City Fuyuan County 1, Mudanjiang City Hailin City 1, Yichun City Wuying District, Jiamusi City Tangyuan County 1, Jixi City Hengshan District, Qitaihe City Boli County, Yichun City Wumahe District, Harbin City Tonghe County 2, Yichun City Jiayin County, Changchun City Tieli City, Yichun City Nancha District, Daqing City Ranghu Road District 3, Shuangyashan City Baoqing County4, Shuangyashan City Baoqing County 2, Mudanjiang City Muling City 2Yichun City Wuyiling District, Tonghua City Meihekou City 1, Qitaihe City Xinxing District 3, Yichun City Cuiluan District, Mudanjiang City Muling City 1, Yichun City Tangwanghe District, Qitaihe City Xinxing District 1, Harbin City Shuangcheng City 2, Yichun City Shuangcheng City, Harbin City Hulan District 3, Yichun City Xinqing District
Jilin
Province
Jilin City Panshi City 2, Liaoyuan City Main City, Jilin City Yongji County 1, Songyuan City Luosi Autonomous County 1, Songyuan City Changling County 1, Jilin City Fengman District 1, Baishan City Fusong County 5Songyuan City Luosi Autonomous County 2, Baishan City Fusong County 2, Jilin City Changyi District 2, Changchun City Jiutai District 5, Jilin City Shulan City 1, Jilin City Yongji County 2Songyuan City Changling County 2, Jilin City Fengman District 2
Liaoning ProvinceDandong City Donggang City 3, Benxi City Pingshan District, Fuxin City Zhangwu County 1, Liaoyang City Wensheng District 1, Anshan City Qianshan District 1, Shenbei New District of Shenyang City 1, Dandong City Fengcheng City 4, Dalian City Lushunkou District 4, Fushun City Xinbin Autonomous County 1, Fushun City Xinbin Autonomous County 3, Dalian City Ganjingzi District 3, Dandong City Fengcheng City 1, Huludao City Lianshan District 3, Huludao City Longgang District 3, Liaoyang City Liaoyang County 1Huludao City Lianshan District 1, Yingkou City Bayuquan District 2, Panjin City Panshan County 3, Huludao City Nanqiao District 3, Panjin City Shuangtaizi District 2, Benxi City Nanfen District, Huludao City Longgang District 2, Dandong City Kuandian Autonomous CountyFuxin City Zhangwu County 2, Shenyang City Sujiatun District 1, Panjin City Panshan County 5, Fushun City Dongzhou District 2, Panjin City Panshan County 6, Panjin City Panshan County 1, Benxi City Benxi County 1, Panjin City Panshan County 7, Panjin City Panshan County 2, Dandong City Fengcheng City 3
Table 6. Statistics of different types of shrinking cities.
Type of Urban ShrinkageExamples of Different Types of Shrinking Cities
Land 12 01245 i005
complete
Harbin City Shuangcheng District 2, Qitaihe City Xinxing District 3, Yichun City Cuiluan District, Yichun City Hongxing District, Yichun City Tangwanghe District, Yichun City Wuyiling District, Yichun City Xinqing District, Songyuan City Changling County 2, Benxi City Benxi Autonomous County 1, Fushun City Dongzhou District 2, Fuxin City Zhangwu County 2, Panjin City Panshan County 5, Panjin City Panshan County 6
Land 12 01245 i006
concentrated
Harbin City Acheng District 1, Harbin City Hulan District 3, Harbin City Shangzhi City 1, Harbin City Tonghe County 2, Harbin City Wuchang City 2, Heihe City Sunwu County, Jiamusi City Fuyuan County 1, Jiamusi City Huannan County 1, Jiamusi City Suburban, Jiamusi City Tangyuan County 1, Jiamusi City Tangyuan County 2, Jiamusi City Tongjiang City 1, Mudanjiang City Hailin City 3, Mudanjiang City Linkou County, Mudanjiang City Muling City 1, Mudanjiang City Yangming District 1, Mudanjiang City Yangming District 2, Qitaihe City Boli County, Qitaihe City Xinxing District 1, Qiqihar City Gannan County 2, Shuangyashan City Baoqing County 2, Yichun City Jiayin County, Yichun City Meixi District, Yichun City Wumahe District, Changchun City Tieli City, Baicheng City Taobei District 1, Jilin City Changyi District 2, Jilin City Fengman District 1,Jilin City Panshi City 1, Jilin City Yongji County 1, Siping City Gongzhuling City 3, Songyuan City Qianguoros Autonomous County 1, Songyuan City Qianguoros Autonomous County 2, Songyuan Changling County 1, Yanbian City Hunchun City 1, Changchun City Jiutai District 2, Benxi City Nanfen District, Benxi City Pingshan District, Dalian City Jinzhou District 3, Dalian City Pulandian City 1, Dalian City Pulandian City 3, Dalian City Wafangdian City 4, Dandong City Donggang City 3, Dandong City Fengcheng City 1, Dandong City Fengcheng City 3, Dandong City Fengcheng City 4, Dandong City Kuandian Autonomous County, Dandong City Yuanbao District 1, Dandong City Zhenxing District, Fushun City Qingyuan Autonomous County, Fushun City Xinbin Autonomous County 1, Fushun City Xinbin Autonomous County 2, Huludao City Lianshan District 1, Huludao City Nanqiao District 3, Liaoyang City Gongchangling District 2, Liaoyang City Liaoyang County 1, Liaoyang City Liaoyang County 2, Liaoyang City Wensheng District 1, Panjin City Dawa County 1, Panjin City Panshan County 1, Panjin City Panshan County 2, Panjin City Panshan County 3, Panjin City Shuangtaizi District 2, Shenyang City Dongling District 4, Shenyang City Shenbei New District 1, Shenyang City Sujiatun District 1, Daqing City Longfeng District 1, Daqing City Ranghu Road District 3, Daqing City Zhaoyuan County 2, Harbin City Bin County 2, Harbin City Shuangcheng City 1, Harbin City Songbei District 2, Harbin City Songbei District 3, Harbin City Xiangfang District, Harbin City Yilan County 1, Jixi City Hengshan District, Jiamusi City Fujin City 3, Jiamusi City Huachuan County, Mudanjiang City Hailin City 1, Mudanjiang City Muling City 2, Qitaihe City Main City, Shuangyashan City Jixian County, Suihua City SuiNing County, Tonghua City Meihekou City 1, Yichun City Jinshan Tun District, Yichun City Nancha District, Yichun City Xilin District, Baishan City Fusong County 2, Jilin City Changyi District 1, Jilin City Fengman District 2, Jilin City Panshi City 2, Jilin City Shulan City 1, Jilin City Yongji County 2, Liaoyuan City Main City, Anshan City Qianshan District 1, Benxi City Main City, Dalian City Ganjingzi District 4, Fushun City Xinbin Autonomous County 3, Fuxin City Zhangwu County 1, Huludao City Longgang District 1, Huludao City Longgang District 2, Huludao City Suizhong County 1, Panjin City Dawa County 2, Panjin City Panshan County 4,Panjin City Panshan County 7, Shenyang City Dongling District6, Tieling City Tieling County 2, Yingkou City Bayuquan District 2, Yingkou City Gaizhou City 1, Yingkou City Laobian District 1
Land 12 01245 i007
perforated
Daqing City Datong District 3, Daqing City Honggang District 1, Daoqing City Saltu District, Harbin City Daoli District, Harbin City Shangzhi City 3, Harbin City Songbei District 4, Harbin City Wuchang City 4, Hegang City Dongshan District 2, Heihe City Nenjiang County 1, Heihe City Wudalianchi City 1, Heihe City Wudalianchi City 3, Jiamusi City Tongjiang City 3, Shuangyashan City Baodong County 4, Suihua City Zhaodong City 1, Yichun City Dailing District, Yichun City Youhao District, Baicheng City Daan City 2, Shuangliao City Siping City 2, Siping City Gongzhuling City 4, Siping City Lishu County 1, Siping City Shuangliao City 2, Yanbian City Dunhua City 1, Changchun City Dehui City 1, Changchun City Jiutai District 3, Changchun City Jiutai District 4, Changchun City Jiutai District 5, Changchun City Kuancheng District 1, Changchun City Luyuan District 1, Changchun City Luyuan District 2, Changchun City Luyuan District 3, Changchun City Nong’an County 1, Changchun City Yushu District, Anshan City Tai’an County 3, Benxi City Hengren Autonomous County 2, Benxi City Hengren Autonomous County 3, Dalian City Ganjingzi District 2, Dalian City Jinzhou District 2, Dalian City Jinzhou District 5, Dalian City Jinzhou District6, Dalian City Jinzhou District 7, Dalian City Jinzhou District 8, Dalian City Jinzhou District 9, Dalian City Lushunkou District 4, Dalian City Lushunkou District 7, Dalian City Lushunkou District 9, Dalian CIty Pulandian City 4, Dalian City Wafangdian City 2, Dalian City Wafangdian City 7, Dandong City Fengcheng City 2, Fushun City Dongzhou District 1, Fuxin City Fuxin Autonomous County 1, Fuxin City Fuxin Autonomous County 2, Huludao City Lianshan District 2, Huludao City Lianshan District 3, Huludao City Longgang District 3, Huludao City Suizhong County 4, Jinzhou City Linghai City 2, Jinzhou City Linghai City 4, Liaoyang City Gongchangling District 1, Shenyang City Dongling District 5, Shenyang City Kangping County 2, Shenyang City Sujiatun District 2, Shenyang City Xinmin City 6, Yingkou City Dashiqiao City 3, Yingkou City Gaizhou City 2
Land 12 01245 i008
peripheral
Daqing City Honggang District 2, Daqing City Honggang District 3, Harbin City Shangzhi City 4, Harbin City Songbei District 1, Qiqihar City Nianzishan District, Shuangyashan City Baoshan District, Baishan City Fusong County 5, Baishan City Jiangyuan District 1, Siping City Gongzhuling City 5, Siping City Shuangliao City 1, Tonghua City Liuhe County 1, Anshan City Qianshan District 3, Dalian City Ganjingzi District 3, Dalian City Jinzhou District 1, Dalian City Lushunkou District 5, Dalian City Wafangdian City 3, Dalian City Zhuanghe City 1, Dalian City Zhuanghe City 3, Panjin City Shuangtaizi District 1, Tieling City Tieling County 1
Table 7. Examples of different types of shrinking cities.
Type of Urban ShrinkageExamples of Different Types of Shrinking Cities
Land 12 01245 i009
complete
Land 12 01245 i010
Panjin City Panshan County 5
Land 12 01245 i011
Songyuan City Changling County 2
Land 12 01245 i012
Yinchun City Wuyiling District
Land 12 01245 i013
concentrated
Land 12 01245 i014
Fushun City Xinbin Autonomous County
Land 12 01245 i015
Jiamusi City Tongjiang City 1
Land 12 01245 i016
Tonghua City Meihekou City 1
Land 12 01245 i017
perforated
Land 12 01245 i018
Dalian City
Jinzhou District6
Land 12 01245 i019
Yinchun City Dailing District
Land 12 01245 i020
Shenyang City Xinmin City6
Land 12 01245 i021
peripheral
Land 12 01245 i022
Dalian City Zhuanghe City 1
Land 12 01245 i023
Harbin City
Songbei District 1
Land 12 01245 i024
Dalian City Wanfangdian City 3
Disclaimer/Publisher’s Note: The statements, opinions and data contained in all publications are solely those of the individual author(s) and contributor(s) and not of MDPI and/or the editor(s). MDPI and/or the editor(s) disclaim responsibility for any injury to people or property resulting from any ideas, methods, instructions or products referred to in the content.

