Article

Changes in Soil Sulphur Fractions as Influenced by Nutrient Management Practices in Mulberry

by
Dhaneshwar Padhan
1,*,
Dhanushree Shivaraj
2,
Akshitha Doddagenigera Nagaraja
2,
Pragyan Paramita Rout
3,
C. M. Babu
1,
Ravindra Aurade
1,
Sobhana Velayudhan
1 and
Babulal
1
1
Central Sericultural Research and Training Institute, Mysuru 570008, India
2
Department of Chemistry, JSS Science and Technology University, Mysuru 570008, India
3
Department of Soil Science & Agricultural Chemistry, Institute of Agricultural Sciences, Siksha ‘O’ Anusandhan (Deemed to be University), Bhubaneswar 751003, India
*
Author to whom correspondence should be addressed.
Land 2023, 12(6), 1160; https://doi.org/10.3390/land12061160
Submission received: 26 October 2022 / Revised: 9 November 2022 / Accepted: 11 November 2022 / Published: 31 May 2023
(This article belongs to the Special Issue Geochemical Mapping in Land Managing)

Abstract

:
Sulphur (S) plays a vital role in improving the quality of mulberry leaves because of its involvement in protein synthesis. The knowledge of different pools of S in soils and its bioavailability for mulberry nutrition is thus, required for optimizing S fertilization. Hence, the present study was designed to ascertain the influence of chemical fertilizer and farmyard manure (both are S sources) on S fractions and its bioavailability in soils. In this regard, four nutrient management practices viz., control (without any chemical fertilizers and organic manures), recommended doses of N, P and K fertilizers (100% RDF), 80% RDF, 60% RDF with four mulberry varieties viz., V-1, G-4, AGB-8 and MSG-2 besides a fallow were considered for the study. Furthermore, the bioavailability of S in soils was tested using four commonly used chemical extractants viz., CaCl2, NaHCO3, AB-DTPA and Mehlich-3 (with different modes and chemistry of extraction). Organic S was the dominant fraction in the experimental soils accounting for 94.7% of total soil S while the inorganic fraction constituted only 5.3% that includes water soluble, sorbed and carbonate occluded S. Lowest amount of organic S content in soils of unmanured control (579.6 mg kg−1) was observed while the 100% RDF treatment (673.2 mg kg−1) maintained a higher content of soil organic S. High amount of sorbed and occluded S was observed in control plot compared to other fertilizer treatments (100% RDF, 80% RDF and 60% RDF). There was a gradual decline in soil S fractions when the fertilizer inputs were reduced to 60% suggesting that recommended doses of fertilizer inputs could maintain the soil S fractions. In addition, the extractable fractions of S were influenced by the fertilizer application rates and the extractability of all four extractants decreased with the reduction in fertilizer inputs. The amount of S extracted by all four chemical extractants followed the order of NaHCO3 > Mehlich-3 > AB-DTPA > CaCl2 across the tested soils. Dynamic relationships among the extractants indicated that they could extract the S from the same pools in soil. Of the four extractants tested for evaluating plant available S, Mehlich-3 showed a higher degree of correlations with plant tissue S concentration and applied S through chemical fertilizers and farmyard manure. Furthermore, it could maintain strong correlations with water soluble and organic S fractions which were found to contribute significantly to plant S concentration. Thus, Mehlich-3 can be recommended for the assessment of bioavailable S for the nutrition of mulberry.

1. Introduction

Sulphur (S) deficiency is widespread in soils all over the world [1,2], causing a reduction in the yield and quality of crops. It has been reported that about 58.6% of the Indian soils are deficient in S [3]. The deficiency might have resulted from the use of S free chemical fertilizers with less, or no, application of organic manures [2,4,5]. In addition, the intensification of agriculture coupled with the use of high yielding varieties [5] further aggravated the deficiency depleting the soil reserve. Such deficiency caused significant yield reduction in different cropping systems, and it was up to 50% in cereals [6] while the optimum supply of S could enhance the nutritional quality and yield [7]. Deficiency of S could also lower the utilization efficiency of N and deteriorates the crop quality [8]. Moreover, the low use efficiency of applied S, increased the cost of production besides environmental pollution. Improving the use efficiency of applied S along with increasing the bioavailability of S in soils is thus required for sustainable crop production. The knowledge of the distribution pattern of different pools of sulphur in soils and its redistribution into different fractions upon addition of S containing substrates or compounds and/or changes in pools of S due to cultivation practices would be useful in scheduling the fertilizer application and consequently improving the use efficiency.
A few long-term studies on the application of organic and chemical fertilizers on the transformation of S in soils and its availability for crop nutrition were reported [4,9]. Continuous cropping for 7 years with S-free fertilizers depleted the available S by 54.8–67.1% in a Typic Ustochrept soil [10]. The long-term application of superphosphate in grazed pastures influenced the distribution of S fractions allocating >95% of the total S in the organic fraction and remaining in readily-soluble plus adsorbed form [11]. Another study showed that continuous cultivation along with superphosphate application influenced the microbes mediated S mineralization and release of plant available S to soil [12]. The application of chemical fertilizers and organic manures increased the organic S content and improved the S availability [13,14,15]. On the other hand, long-term cultivation over the years decreased the S concentrations in soil by 30–50% [16,17,18].
The availability of S for plant uptake depends upon the soil properties besides the native soil S reserve. Soil properties viz., pH, organic carbon, clay content, presence of oxides of Fe and Al, etc., regulate its availability in soil system [19]. Changes in soil properties could influence the availability of S in soils which can be captured by extracting the soils with a suitable extractant. In conventional method of soil testing, several extractants (0.15% CaCl2, LiCl, KCl, PO42− containing solution, AB-DTPA, Mehlich-3) are being used to evaluate their suitability for estimating plant available sulphur in soils. William and Steinberg [20] proposed that estimating the heat soluble S could be a reliable index in measurement of the labile pool of organic S that could mineralize with cropping cycles. Although, this method served as a good indicator of mineralized S, the method is rarely used because of tortuous pathways of estimation. To mimic this method, Kilmer and Nearpass [21] proposed to use 0.5 M NaHCO3 for extracting the S that could mineralize during cropping period. The justification of using this extractant was that being a high solution pH (8.5), it could solubilize the organically bound labile S. Reddy et al. [14] studied the changes in sulphur fractions and mineralization due to continuous manuring and application of chemical fertilizers for a period of 27 years on a Typic Haplustert and reported that NaHCO3 extractable total, organic, and inorganic S fractions and NaOH-extractable total and inorganic S fractions appear to be better indices of S mineralization than CaCl2 extractable inorganic S which was available to meet the sulphur requirement of plants in a long run. Multi-nutrient extractants are now-a-days becoming popular in soil testing laboratories (having different mechanism of extraction) to reduce the cost and time. Mehlich-3 is one such extractant currently employed for extraction of available S from soils and becoming popular because of the single step extraction procedure with multi-nutrient extraction capacity [22,23]. Rao and Sharma [24] compared the performance of Mehlich-3 with other conventional extractants and found good correlations among them. Calcium phosphate extractable S maintained a good correlation with Mehlich-3 extractable and this can be used as a suitable extractant for estimating plant available S in soils [25]. Ammonium bicarbonate-DTPA is also one such extractant used for routine analysis of soil nutrient status. Malathi and Stalin [26] suggested the use of AB-DTPA extraction method for estimating available S in alkaline soils.
Mulberry is a perennial crop mainly cultivated for its high foliage production which is the sole food materials for the silkworm Bombyx mori L. Sulphur is highly essential for synthesis of protein such as cystine, methionine, cysteine, lanthionine, and cystathionine both in mulberry leaf and silkworm [27]. Mulberry leaf contains 36.4 g S-containing amino acids per kg of proteins [28]. Therefore, sulphur deficiency could result in reduction in growth and development, leaf yield and nutritive value of mulberry [29], which ultimately affect the cocoon production since the S influence the development of cocoon shells and pupae [28]. In the conventional cultivation practices, 5 crops of mulberry are harvested in a year with a biomass yield of 95–105 MT/ha/year under irrigated conditions [30]. Such a high quantum of biomass yield depletes the soil nutritional status at a faster rate, which is replenished by application of recommended doses of chemical fertilizers and organic manures. Chemical fertilizers such as ammonium sulphate and single super phosphate are used as a source for N and P, respectively, in many parts of Southern India. We hypothesized that continuous application of S through chemical fertilizers and organic manures may influence the allocation and distribution of S into different fractions and also its availability for crop nutrition. Therefore, the present study was undertaken to elucidate the changes in soil sulphur fractions upon addition of external S, and also to screen out a suitable extractant for estimating the bioavailable S in soil for mulberry nutrition.

2. Materials and Methods

2.1. Experimental Sites

The experiment was conducted at Central Sericultural Research and Training Institute, Mysuru, Karnataka, India. The detail of the experimental site is presented in Table S1.

2.2. Treatments

The experiment was initiated in 2016 with the imposition of treatments and laid out in a split plot design, with three replications for each of the treatments to compare their relative performance. Five management practices, namely control, 100% RDF (recommended doses of N, P and K fertilizers), 80% RDF and 60% RDF with four mulberry genotypes viz., AGB-8, MSG-2, G-4 and V-1, were chosen for the study in addition to a fallow plot for comparison. The fallow plot was not put under cultivation since the inception of the experiment. However, the natural vegetation of shrubs and grasses were allowed to grow which was later incorporated in situ in the plot. The control plot was maintained without addition of any nutrients either through chemical fertilizers or organic manures, while the 100% RDF treatment received recommended doses of N, P and K (350:140:140 kg/ha/year) through inorganic fertilizers. The nutrients N, P and K were supplied through chemical fertilizers in the form of ammonium sulphate (20.5% N, 24% S), single superphosphate (16% P2O5, 12% S) and muriate of potash (60% K2O), respectively. After physical mixing, the chemical fertilizers were applied in between four plants in the paired row system after 25 days of pruning. Well decomposed farmyard manure (@25 MT/ha/year) was applied uniformly to the fertilized plots (100% RDF, 80% RDF and 60% RDF) on wet-weight basis and mixed well with the soil using tractor.

2.3. Crop Management

Mulberry is cultivated mainly for its higher foliage production which is the sole food material of silkworm. It is cultivated in different climatic conditions and soil types across India. Since mulberry is a perennial fast-growing plant, it is possible to harvest five crops annually under assured irrigated condition. Thus, the average duration of one crop of mulberry is around 70 days. After leaf harvest, the mulberry garden was pruned at 30 cm height above the ground. Mulberry garden was maintained with tillage on an average depth of 0.20 to 0.40 m by using tractor (twice/crop) and bullock plough (one time crosswise direction). After 15 days of pruning, well decomposed FYM was applied to the mulberry garden followed by different levels of chemical fertilizers after attending 25 days of pruning. Irrigation was carried out through a drip system.

2.4. Soil Sampling and Analysis

Soil (0–30 cm) samples from each of the plots of the experiment were collected in the year 2021 after harvest of crop. In each plot, 3–4 representative samples were taken randomly in a zigzag manner and pooled together to make a composite sample. This was carried out for all three of the replications of each of the treatments. After the collection of soil samples, fresh moist soil samples were stored in deep freezer at a temperature of 4 °C and a part of the samples were further processed for analysing different soil properties. Air-dried soil samples that had passed through the 2.0 mm sieve were used for analysis of some important physic-chemical properties and sulphur fractions following standard methods.
The bulk density of soil was determined by the Keen-Raczkowski Box Method [31]. Here, pH was determined by glass electrode method in 1:2. 5:Soil:0.01 M CaCl2 suspension using systronics pH meter as described by Jackson [32]. The electrical conductivity of the soil samples was determined in 1:2 soil:water suspension by using digital conductivity meter [32]. Soil organic carbon (SOC) was determined by Walkley and Black wet oxidation method [33]. Microbial biomass carbon (MBC) was determined by the chloroform fumigation and incubation method as outlined by Vance et al. [34].
Sulphur fractionation was carried out following the method outlined by Morche [35]. The soil samples were extracted with different extractants [36,37] (Table S2) and the extractable S content was measured through turbidimetric method. Microbial biomass sulphur (MBS) was determined by the chloroform fumigation method [38]. Briefly, moist soil (50 g, oven-dry basis) was fumigated with chloroform in a vacuum desiccator for 24 h and a control sample was run simultaneously. The fumigated and unfumigated soils were extracted using 100 mL 10 mM CaCl2 and the filtrate was collected for analysis of microbial biomass sulphur. The filtrate was then oxidized with H2O2 that converted biomass organic sulphur to sulphate which was subsequently measured through turbidimetric method in Spectrophotometer. Arylsulfatase activities in the soil samples were carried out through the method outlined by Tabatabai and Bremner [39]. Briefly, one gram of the soil (particle size < 0.02 mm) was taken in 100 mL Erlenmeyer flask (Borosil, New Delhi, India). In addition to that, 0.2 mL of toluene and 4 mL of 0.5 M acetate buffer (pH 5.8) were added, followed by 1 mL of 0.05 M p-nitrophenyl sulphate solution and swirled the flask for few seconds and kept in an incubator at 37 °C. After 1 h of incubation, 1 mL of 0.5 M calcium chloride and 4 mL of 0.5 M sodium hydroxide was added and swirled for few seconds. The soil suspension was filtered through Whatman Number 42 filter paper (Whatman, Thane, India). The intensity of the yellow colour was measured immediately in an UV-Vis spectrophotometer at 420 nm. The p-nitrophenol content of the filtrate was computed from the standard curve. The enzyme activity was expressed in µg p-nitrophenol per g of soil per hour on dry weight basis at 37 °C at pH 5.8.
Plant samples (leaf) were collected from each plot and dried at 60 °C to a constant weight. The samples were grinded in a Wiley grinding mill and stored for elemental analysis. The plant samples were digested with di-acid mixture following the method outlined by Tandon [40] The plant sulphur was determined by precipitation of sulphate from the digest as barium sulphate with addition of BaCl2 salt and stabilization of turbidity with gum acacia (turbidimetric method), followed by measuring in Spectrophotometer.

2.5. Statistical Analysis

The standard error of the mean (±SEM) and critical difference (CD) at 5% probability were worked out for each character studied to evaluate differences between treatment and varietal means. Pearson correlation was performed between S fractions, extractable S and soil properties to establish their relationships. Multiple linear regression equation was also computed for plant S concentration as the dependent variable and extractable S content and soil properties such as pH, organic C and microbial biomass C as independent variables. Normality and homoscedasticity of the data were tested using normal probability plot and Levene’s test, respectively, before being fitted to the regression model. Similarly, path coefficient analysis was performed to understand the relative contribution of different S fractions on plant S concentration by taking the S fractions as the independent variable and plant S concentration as the dependent variable. All these statistical analyses were carried out following the methodology described by Gomez and Gomez [41] using SPSS Statistics package version 22.

3. Results and Discussion

3.1. Physical, Chemical and Biological Properties of the Experimental Soils

The bulk density values of the soils under different treatments varied from 1.33 to 1.38 Mg m−3 (Table 1). The 60% RDF treatment had the lowest bulk density value, and the highest value was recorded in fallow plot. However, there were no significant difference in bulk density values among the treatments. Intensive tillage followed by intercultural operations after each harvest of crops might be the reason for low bulk density values in the experimental soils. The bulk density values decreased with increases in the intensity of tillage [42], while no tillage results an increase in bulk density values [43]. The applied organic materials on decomposition produced organic acids, which could influence the bulk density through formation of stable soil aggregates [44,45]. The soil of the experimental site was slightly acidic to neutral in reaction. The lowest pHCaCl2 value was recorded with 100% RDF treatment followed by 80% RDF. This might be due to use of high quantity of acid producing chemical fertilizer [46], i.e., ammonium sulphate with equivalent acidity of 110. However, the application of muriate of potash has no or little effect on soil acidification [47]. The electrical conductivity (m mho cm−1) of the experimental soils ranged from 35.5–52.5 (Table 1). The lowest value of electrical conductivity was associated with control plot while the higher values were reported from chemical fertilizer treated plots. This could be because of the addition of soluble salts in the form of fertilizers and solubilization of native minerals due to the reduction in pH of the soils [48]. In the experimental soils, oxidizable organic carbon (g kg−1) ranged from 5.68 in control plot to 7.40 in fallow. Continuous cropping without the use of organics and inorganics (i.e., control) caused a net decrease in oxidizable organic carbon content of 22.3, 17.0 and 10% compared 100% RDF, 80% RDF and 60% RDF, respectively. The application of FYM and chemical fertilizers influenced the oxidizable organic carbon content in soils. Such additions of organic contents in combination with chemical fertilizers could maintain a higher oxidizable organic carbon content compared control, despite long-term perturbation [49,50,51,52]. The higher oxidizable organic carbon content in fallow plot might be due to the least disturbances leading to an improved protective environment for oxidizable organic carbon accumulation. Similar observations were made by Das et al. [53] in soils of different long-term fertility experiments of India. The microbial biomass carbon (MBC) contents of the experimental soils were significantly influenced by the nutrient management practices. The values ranged from 152 µg g−1 in control to 204.2 µg g−1 in fallow. Treatments receiving both organic and inorganic fertilizers showed significantly higher MBC content compared to systems with no inorganic or organic application (i.e., control). The higher magnitude of microbial biomass carbon (MBC) in the former treatments could be due to higher microbial proliferation owing to continuous addition of organics as food supplements to microbial communities [54]. Intensive cropping with no fertilization (control) resulted poor MBC content compared to all other treatments.

3.2. Influence of Nutrient Management Practices on Distribution of Sulphur Fractions in the Experimental Soils

The results showed that the distribution of different fractions of S in soils of the experimental field varied with changes in management practices/treatments and varieties (Table 2). The total S content in the experimental soils was computed irrespective of varieties ranged from 609.6 (control) to 714.8 mg kg−1 in 100% RDF. The total S was lowest in the control treatment with 85.2% of total S in 100% RDF indicating the substantial variability of total S content under different treatments. It was also found that the S associated with the organic moiety of soil organic matter (designated as organic S) was the most dominant fraction accounting for, on average, 94.7% of total S in soils (Table 2). Similar magnitude of organic S in soil was reported in several studies [16,55]. Application of organic as well as inorganic sources of fertilizers had significant influences on organic S content in soil. The values (mg kg−1) ranged from 579.6 in control to 673.2 in 100% RDF treatment. The higher amount of organic S under fertilized treatments could be due to the addition of S through FYM where it remains mainly in the form of proteins and amino acids [56,57]. The pattern of occurrence of organic S in soils mimicked that of organic carbon which was supported by their close relationship (Table 3). Koppitke et al. [58] reported a linear decline trend in organic S content with that of organic C content in soil. The close association of organic S with SOC in soil is due to the fact that soil organic matter (SOM) provides the major non-leachable reserve of S. This indicates that the SOC content could be taken as a fair indicator of the S status in the soils [59]. A sharp decline in organic S content in unmanured control plot could be due to continued crop removal of mineralized sulphate from the labile organic fraction for meeting the crop demand. Organic S constituted about 94.7% of the total S of the experimental soils. The presence of such a major proportion of total S in soils in organic forms [60,61] was mainly because (in contrast with inorganic SO42− S) of its (soil organic S) insolubility in water and non-susceptibility to leaching losses. Organic S was also found to be the dominant S pool in the upper 10 cm of the tropical soils [59]. It is a reserve source of sulphur for plants and must undergo mineralization for becoming available to plants [55,62,63].
The inorganic S fraction (∑ Water soluble S + Sorbed S + Occluded S), which represents the most readily available source of S to the plants, constituted only 4.91 to 5.82% of the total soil S. A similar magnitude of inorganic S fraction was reported in different soil types of India [9,55]. Very low S content in the inorganic fraction in control treatment was probably because of the crop removal. On the other hand, the addition of S through chemical fertilizers and FYM as well as the higher organic carbon content in 100% RDF treatment might be the reason for higher concentrations of S in soil solution. The integration of ammonium sulphate, single superphosphate and FYM could enhance the availability of S in soils [64]. The inorganic S content in the soils showed significant variations among the treatments; the values ranged from 29.9 mg kg−1 in control to 41.6 mg kg−1 in 100% RDF. Although inorganic S shared a little (on average 5.27%) of the total S, it is an indicator of the S supplying capacity of a soil to plants. During growth period, plants not only depend upon the readily available inorganic S (SO42−) already present in soil, but also on the SO42−-S produced due to mineralization of organic S as a result of microbial activities [65]. The availability of S for plant uptake is partly regulated by the organic pools of S through the mechanistic pathway of mineralization-immobilization turnover (MIT) of organic substrates [66]. When the inorganic S fraction was dissected into water soluble, sorbed and occluded S, it was observed that water soluble S shared 51.0 to 71.2% of inorganic S being the dominant fraction, followed by occluded and sorbed fraction. The application of phosphatic fertilizers in the fertilized treatments could displace the sorbed sulphate through ion exchange, which may be the result of a lesser amount of sorbed S in all the fertilized treatments compared to control. Similarly, reduction in pH or production of H+ due to chemical fertilizer application could have solubilized the occluded S over the years resulting lower amount than control (Figure 1).

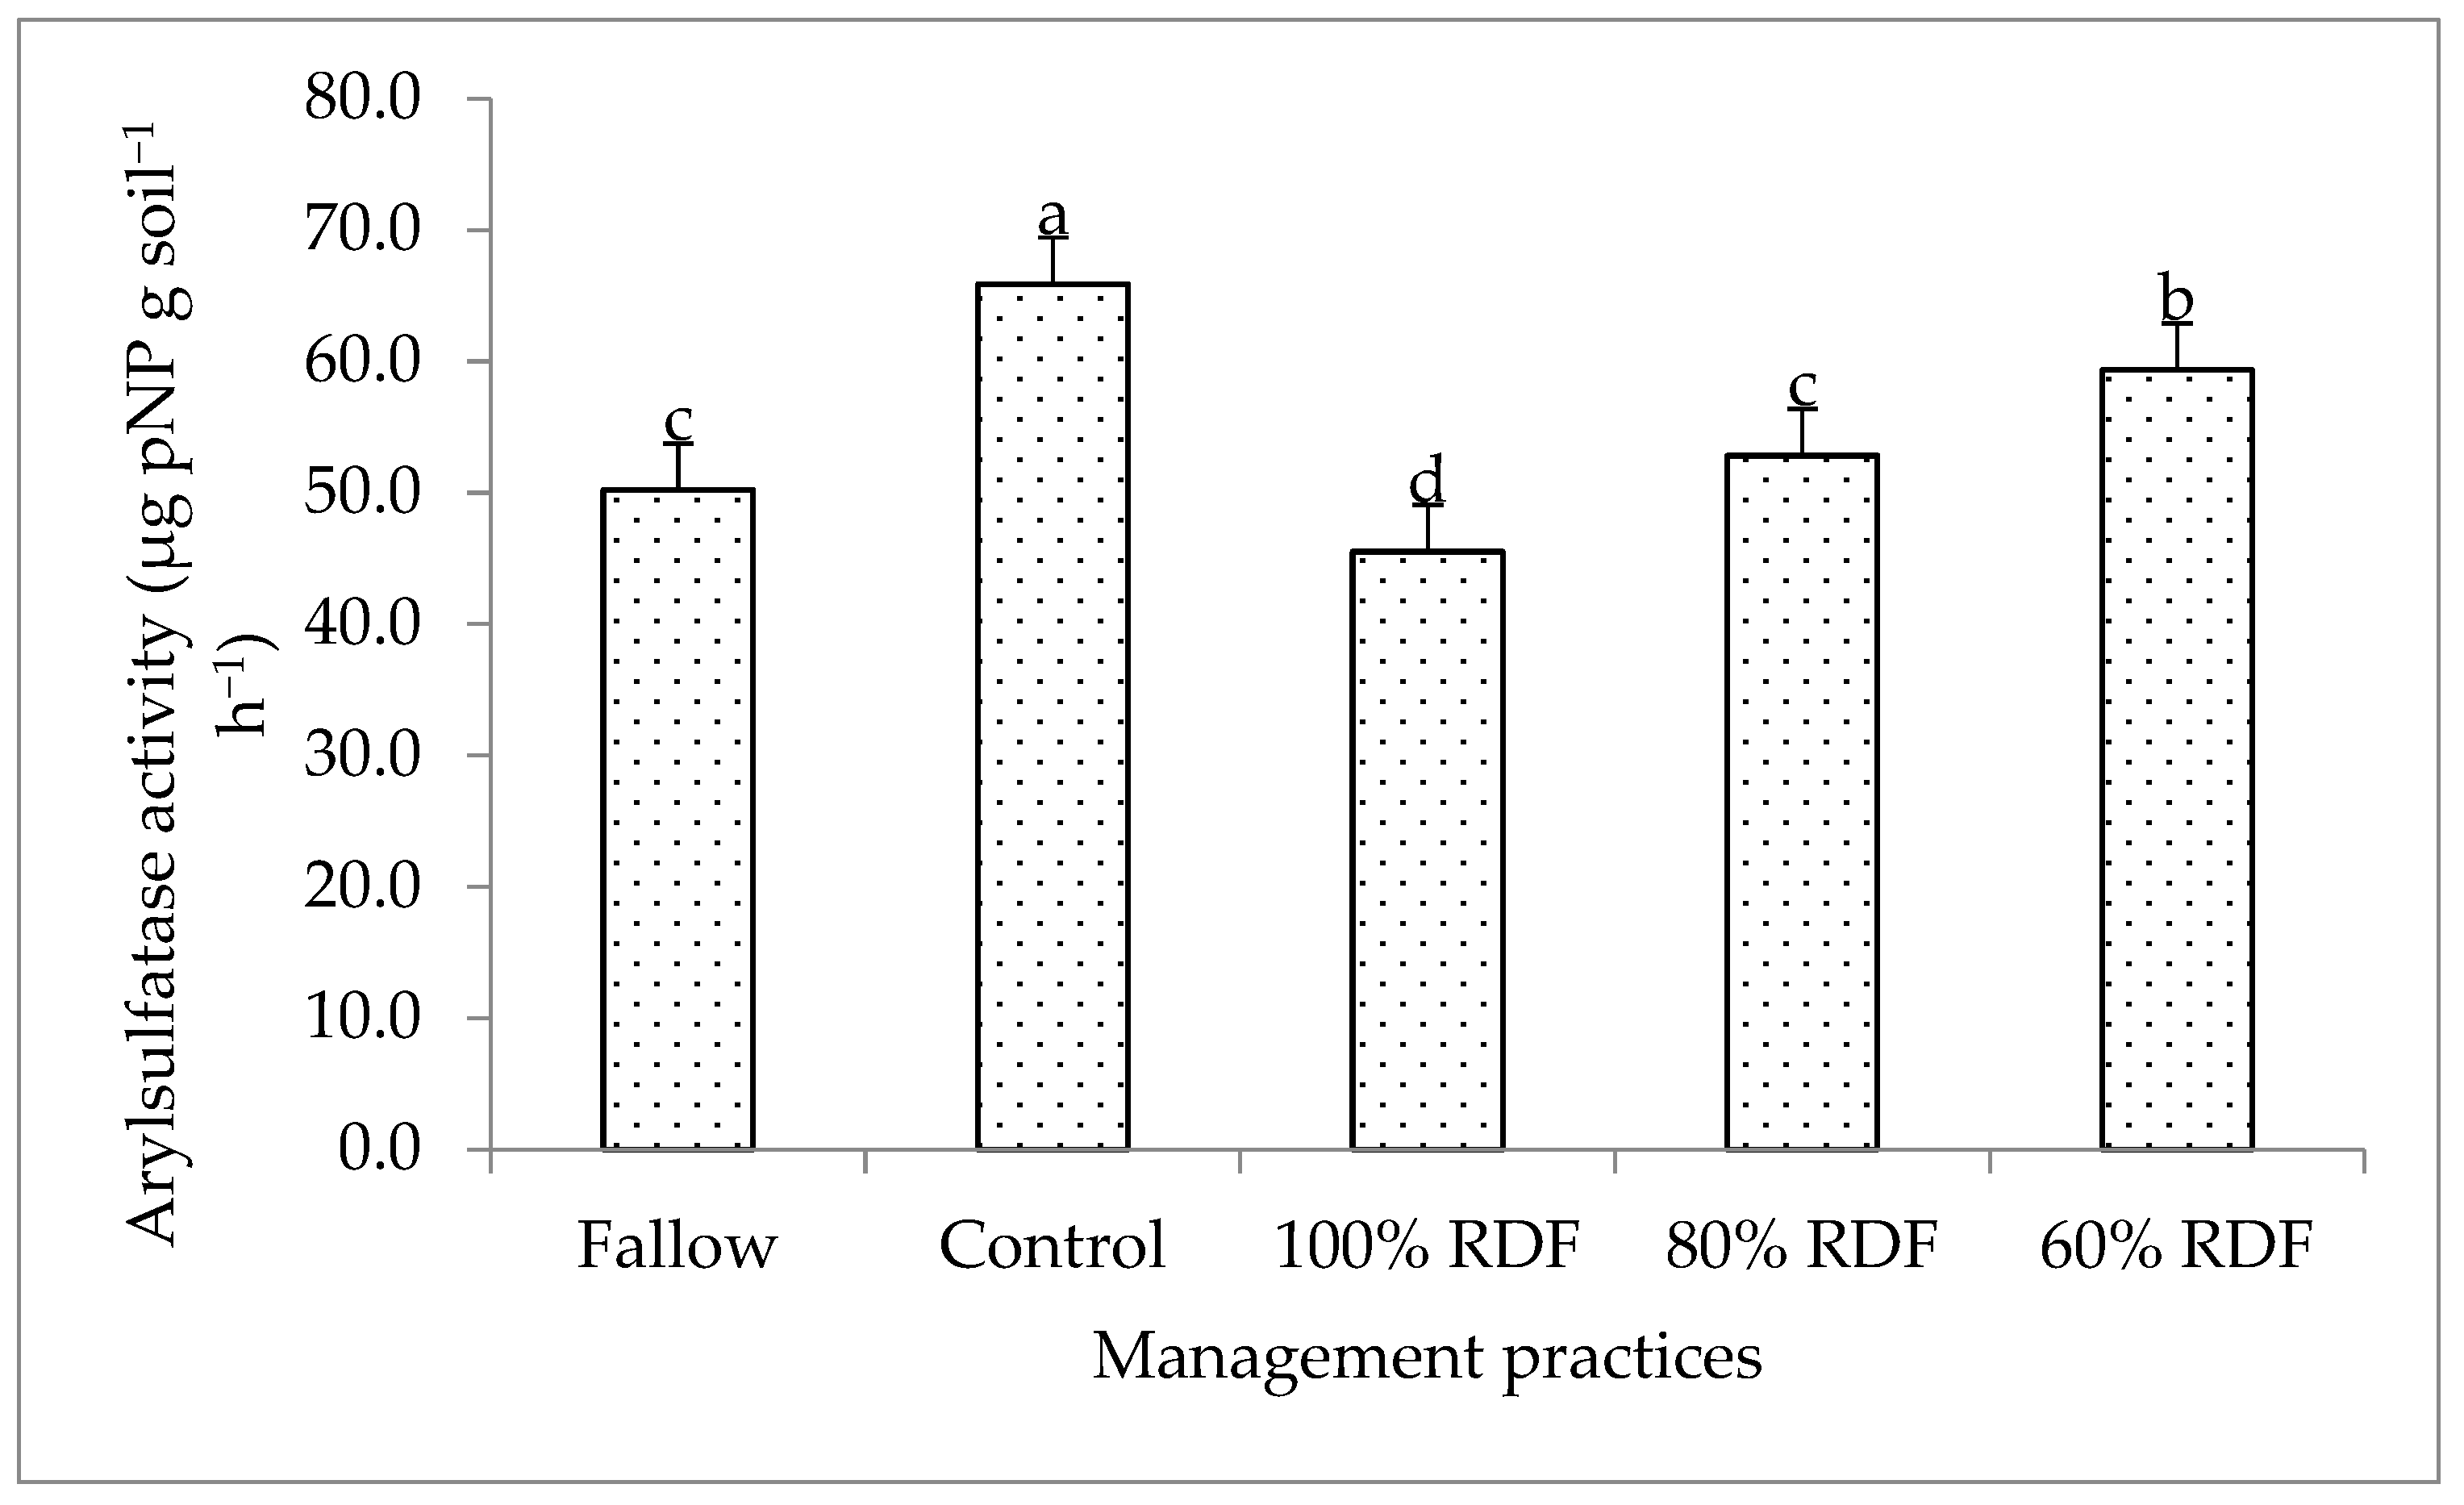
3.3. Influence of Nutrient Management Practices and Mulberry Varieties on Microbial Biomass S and Arylsulfatase Activity in the Experimental Soils

Microbial biomass sulphur (MBS) in soils followed a similar pattern of occurrence to MBC. It ranged from 10.2 µg g−1 in control to 11.5 µg g−1 in 100% RDF treatment contributing on average 1.7% of total organic S in soil (Figure 2). Microbial biomass S found in different studies was 1 to 3% [67] and 1.5 to 5% [68] of organic S. Microbial biomass acts as the sink and source in the S turnover of soils facilitating the availability of S when there are no or limited S inputs [69]. Microbial biomass S was related to the organic S content of soils. Figure S1 showed the relationship between MBS and organic S (60 samples) suggesting that MBS could form a significant proportion of organic S in soils and participates in S cycling [70]. Furthermore, Banerjee and Chapman [70] reported that microbial biomass S originates from both organic and inorganic forms of S, which are metabolized by soil micro-organisms. Although the microbial biomass S shares a relatively small fraction of soil organic S, it serves as the most labile and active pool of S for the turnover of S in soil [70]. The higher share of organic S in biomass results in increased potential for the availability of S to plants [67]. This might be the reason for the stable availability of S in control (having high % of MBS to organic S) despite the continual crop removal without external supplementation. The MBS/organic S ratio reflects the contribution of microbial biomass to organic S of soils. As the MBS is dependent on the labile fraction of organic S, a high MBS/organic S ratio could indicate higher microbial growth which helps in S turnover. A significant relationship was found between microbial biomass C:S and organic C:S of soils (Figure S2). Similarly, the MBS in soils is dependent upon the microbial biomass C (Figure S3). The values for microbial biomass C:S ranged from 13.4 to 19.5, with a mean value of 15.9. It is also important to establish the relationship between the proportion of organic S in MBS and the proportion of organic C in MBC to find out the contribution of both the elements toward the cycling of C and S in soils. However, in our study, no such relationship was observed.
The enzyme arylsulfatase hydrolyses the organic S esters and releases the inorganic sulphate (SO42−) into the soil solution, playing an important role in soil S dynamics [71]. The enzyme is commonly present in soil and is believed to participate in sulphur nutrition to plants [72]. The highest arylsulfatase activity was found in control (65.9 µg pNP g soil−1 h−1) and the lowest in 100% RDF (45.5 µg pNP g soil−1 h−1) (Figure 3). The arylsulfatase activity in soil is linked to the presence of sulphate in soils, with greater availability of sulphate in soil system resulting in lesser arylsulfatase activity [73]. A low concentration of sulphate in soil solution triggered the production and/or activation of sulfatase enzyme by the microbes [74]. This was also confirmed in our study, showing higher content of inorganic S resulting from a decline in arylsulfatase activity (Figure S4). Farmyard manure and mineral nitrogen fertilization could increase the arylsulfatase activity that participates in S cycling [75]. However, the present study showed declined arylsulfatase activity with the application of organic manures and chemical fertilizers over control. This might be because of the addition of S through these fertilizers, which in turn would have resulted in poor arylsulfatase activity. Ziomek et al. [76] reported a decline trend in arylsulfatase activity in nitrogen fertilized soil over non-fertilized plot. Another study also confirmed that elevated nitrogen addition could supress the arylsulfatase activity in soils [77]. Long-term mineral fertilizer application in high rates inhibits the enzymatic reaction (through inactivation of enzyme proteins) due to production of high concentration of ions (especially anions) and also due to lowering of soil pH [78]. The high pH in control compared to fertilized plots showed high arylsulfatase activity in soil. Soil pH can influence the activity of arylsulfatase and the enzyme activity increased with increased soil pH [79]. On average, there were 30.9, 19.8 and 9.9% decreases in arylsulfatase activity in 100% RDF, 80% RDF and 60% RDF over control, respectively (Figure S5). The activity of enzyme arylsulfatase per unit microbial biomass sulphur showed the turnover rate of sulphur by the enzyme (Figure S6).
Arylsulfatase activity (µg pNP g soil−1 h−1) was influenced by the mulberry varieties showing significant differences in activity of this particular enzyme in soils under V-1 (53.1), AGB-8 (57.9) and MSG-2 (60.2) mulberry plantation. This difference might be due to the difference in the release of organic compounds in the rhizosphere soils. The released organic compounds in terms of root exudates alter the biophysical and biochemical properties of soils and trigger the microbial abundance and enzyme activity [80].

3.4. Extractable S in the Experimental Soils

Extractable S contents in the experimental soils were extracted with four different chemical extractants viz., CaCl2, NaHCO3, AB-DTPA and Mehlich-3 having different modes and chemistries of extraction. The results showed that the CaCl2 extractable S (mg kg−1) ranged from 16.3 in control to 32.2 in 100% RDF treatment accounting 2.67 and 4.50% of total soil S, respectively (Table 4). On average, AB-DTPA, NaHCO3 and Mehlich-3 extracted 4.30, 5.48 and 4.83% of total soil S, respectively. The amount of S extracted by CaCl2 was smaller than that extracted by NaHCO3, Mehlich-3 and AB-DTPA in the experimental soils. The extractable S content of the experimental soils followed the order of NaHCO3 > Mehlich-3 > AB-DTPA > CaCl2 irrespective of management practices. Padhan [9] reported that NaHCO3 could extract 1.5–2.0 times more soil S than the amount extracted by 0.15% CaCl2 in Alfisols, Inceptisols and Vertisols of India. Due to high pH, 0.5 M NaHCO3 (pH 8.5) could extract part of organically bound S, particularly the ester sulphate [21] causing the observed increase in S extraction compared with other extractants used. Certainly, the presence of HCO3 in AB-DTPA and 0.5 M NaHCO3 renders them able to release part of the adsorbed S, particularly from the clay matrix [26,81]. Moreover, the HCO3 could solubilize labile insoluble sulphate minerals in soils [82]. The presence of acetate and nitrate anions in Mehlich-3 favoured the extraction of S from soil [83] and thereby increased extractability was observed in the present study compared to the CaCl2 solution. The lower amount of S extracted by 0.15% CaCl2 solution in the experimental soils could be due to the fact that it could only extract the readily available or water-soluble S. Extractants with Cl based extraction could mobilize only the water soluble SO42− [84] in addition having lower extraction power because of their tendency to form slowly soluble CaSO4 [85]. Although the extractable S content in the experimental soils was above the critical limit; the lowest amount of extractable S extracted by all the four extractants was in control and the highest in 100% RDF. The application of FYM in treatments viz., 100% RDF, 80% RDF and 60% RDF add a substantial quantity of S into soils. The continuous cultivation and balanced application of nutrients could increase the availability of S in soils by mineralizing from the native organic pools [12,45].
Significant positive correlations between the amounts of S extracted by the extractants indicated that they extract S from similar pools in soil (Table 5), contributing to plant available amounts. Sulphur extracted by CaCl2, AB-DTPA, NaHCO3 and Mehlich-3 in general, showed significant positive correlations with organic C, but negative correlations with pH of the soils (Table 6). A multiple regression equation was computed for plant S concentration as the dependent variable and extractable S content and soil properties such as pH, organic C and microbial biomass C as independent variables. Normality and homoscedasticity tests of data were performed before fitting to the regression model. The data followed normality and homoscedasticity pattern which supported for fitting the data in linear regression model (Tables S3 and S4; Figures S7–S9). A multiple regression analysis showed that 56.1, 57.7, 58.2 and 56.8% variability in CaCl2, AB-DTPA, NaHCO3 and Mehlich-3 extractable S was determined by soil properties such as pH, organic C and MBC (Table 7). Some of the unmeasured soil properties, especially the oxides of Fe and Al, may have contributed to the unexplained variability.
The nutrient management for 5 years significantly (p < 0.05) influenced the plant available S content of experimental soils as extracted by CaCl2, AB-DTPA, NaHCO3 and Mehlich-3. Of the five management practices tested, 100% RDF always had the highest amount of extractable S compared to control (Table 4). This was true for 80% RDF, 60% RDF and fallow. Moreover, the effects of 100% RDF, 80% RDF and 60% RDF over control were more pronounced when S was extracted with Mehlich-3 (110, 79 and 56), followed by AB-DTPA (101, 78 and 62), CaCl2 (97, 72 and 61) and NaHCO3 (100, 62 and 47) (Figure 4). The continuous application of chemical fertilizers and FYM caused an increase in organic C content (Table 1) that could increase the availability of S in soils, which was captured by the extractants used in the present study. Moreover, the chemical fertilizers viz., ammonium sulphate and single super phosphate along with FYM used in the experiment contained high amount of S that accumulated over the years in soils under 100% RDF, 80% RDF and 60% RDF. These were the reasons for occurrence of higher amount of extractable S in soils with 100% RDF, 80% RDF and 60% RDF over control. Fallow plot was not cultivated over the years, but naturally grown herbs were cut annually leaving the biomass along with accumulated nutrients including S. A higher content of organic C (30.2%) in soils under fallow over the unmanured control could help to retain more S for a longer time. This might be the reason for higher extractable S content in soils under fallow than that under the control.

3.5. Relationship between S Fractions and Extractable S

CaCl2 extractable S was positively correlated to water soluble S (R2 = 0.983 **), organic S (R2 = 0.920 **) and total S (R2 = 0.937 **) but negatively related to sorbed S (R2 = −0.736 *) and occluded S (R2 = −0.173). This indicated that the extractant was able to recover some of the water soluble and organic S but was not able to remove the S associated with oxides of Fe and Al (sorbed S) and carbonate co-precipitated S (occluded S). This was true for AB-DTPA, NaHCO3 and Mehlich-3 extractable S, which could maintain a significant positive relationship with water soluble, organic and total S while negative correlations with sorbed and occluded S (Table 8; Figure 5). Interestingly, the inclusion of sorbed S in the multiple regression analysis indicated that it could improve the predictability of the regression model (Table 9). These relationships indicated that the tested extractants could extract a higher proportion from water soluble and organic S fractions and a small amount from sorbed S while little extractability from the occluded S fraction.

3.6. Soil S Fractions and Plant S Concentration

In order to understand the relative contribution of different S fractions for S nutrition of mulberry, a path coefficient analysis was performed by considering the different S fractions as independent variable while plant S concentration as dependent variable. In the path diagram (Figure S10), the double headed arrows indicated mutual association between the factors (determined by correlation coefficients) while the single headed arrows showed the direct effect of factors on variability of plant S concentration. The results presented in Table S5 and Figure S10 showed that water soluble S directly determines the 34.7% variation in plant S concentration as compared to sorbed and organic S determining 2.2 and 6.8%, respectively. Moreover, the total contribution of water-soluble fraction comprising both the direct and indirect effects through occluded and organic S accounted for 68.7% of the variation in plant S concentration, which suggests the water-soluble fraction of S in soil plays important role in the S nutrition of mulberry plants.
On the other hand, although the direct contribution of organic S fraction is not so high, its indirect contribution through water soluble S fraction is significant (0.530). The total contribution of organic S fraction accounted for 63.8% variability in plant S concentration indicating its importance in mulberry nutrition. The results further showed that the residual causal factor is high contributing to 45.2% of variability in plant S concentration.

3.7. Plant S Concentration and Suitability of Extractants for Assessing Soil Available S

Plant tissue S concentrations indicated the relative plant S availability in soils. The application of organic and inorganic fertilizers had significant effect on S concentrations in mulberry leaf (Table 4). However, there was no significant difference in leaf S concentration among the mulberry varieties. Leaf S concentrations among the treatments ranged from 1.95 g kg−1 in control to 2.10 g kg−1 in 100% RDF. The mean magnitude of increases in leaf S concentrations were 7.69, 4.61 and 3.58% with 100% RDF, 80% RDF and 60% RDF over control, respectively.
The amount of S extracted by all the extractants showed significant positive correlations (r) with S concentration in leaf (Figure 6a–d). On average, the relationships (r) were greater with NaHCO3 ≥ Mehlich-3 and AB-DTPA irrespective of varieties, indicating their superiority over CaCl2 extractant for assessing plant available S in soils. Out of the four extractants tested, Mehlich-3 and AB-DTPA performed better in capturing the effects of management practices on extractable S content in soils. In order to explain the variability and make the assessment of suitable extractant for plant available S in soils robust, the inclusion of some of the soil properties viz., pH, OC and MBC in the stepwise regression analysis is required. As such, the stepwise multiple-regression analyses were computed using the extractable S and the previously mentioned soil properties as independent variables, and S concentration in mulberry leaf as the dependent variable. The inclusion of soil properties in the regression significantly improved R2 values from 0.56 to 0.58 for the extractants, compared with R2 values of 0.51 to 0.55 when excluding soil properties (Table 7). A relationship was also computed between the increase in extractable S in 100% RDF, 80% RDF and 60% RDF over control and the added S through chemical fertilizers and FYM (Figure S11a–d). Although, all the extractants showed significant and positive correlations with the added S, Mehlich-3 extractable S maintaining the highest level of correlation. Due to greater S extractability, the advantage of extracting multi-elements with a single extractant, and shortening the extraction time to 5 min, Mehlich-3 method may be recommended for assessment of available soil S for nutrition mulberry.

4. Conclusions

Mulberry cultivated with different nutrient management practices (with different rates of S application) influenced the S fractions and its bioavailability in soil. The fallow soil, owing to its high organic carbon content, had almost comparable values of extractable S in comparison with other fertilized treatments. It was also found that the S associated with an organic moiety of soil organic matter was the most dominant fraction, accounting on average 94.7% of total S in soils, while inorganic S fraction, which represents the most readily available source of S to the plants, constituted only 5.3% of the total soil S. On average, AB-DTPA, NaHCO3 and Mehlich-3 extracted 4.30, 5.48 and 4.83% of total soil S, respectively. A dynamic equilibrium was found to exist among the extractable S, which is testimony to the fact that they were able to extract the S from almost same pools. The extractable S content of the experimental soils followed the order of NaHCO3 > Mehlich-3 > AB-DTPA > CaCl2. Of the four extractant tested for assessing the bioavailable S in soils, Mehlich-3 was the best in capturing the changes in S availability due to nutrient management practices in mulberry.

Supplementary Materials

The following supporting information can be downloaded at: https://www.mdpi.com/article/10.3390/land12061160/s1, Table S1: Some important characteristics of experimental site; Table S2: Details of the methodologies used for extraction of plant available S content in soils of the experimental site; Table S3: Homoscedasticity test of data grouped by varieties; Table S4: Homoscedasticity test of data grouped by replications; Table S5: Path coefficients between different S fractions and plant S concentration; Figure S1: Relationship between organic S and microbial biomass S in the experimental soils; Figure S2: Relationship between the ratio of microbial biomass C to microbial biomass S and organic C to organic S; Figure S3: Relationship between microbial biomass C and microbial biomass S in the experimental soils; Figure S4: Relationship between inorganic S and arylsulfatase activity in the experimental soils; Figure S5: Relative decrease in arylsulfatase activity over unmanured control in the experimental soils; Figure S6: Relationship between the microbial biomass S and arylsulfatase activity in the experimental soils; Figure S7: Normality test of data; Figure S8: Homoscedasticity test of data grouped by varieties; Figure S9: Homoscedasticity test of data grouped by replications; Figure S10: A path diagram and coefficient of factors influencing plant S concentration Figure S11: (a–d) Relationship between the increase in extractable S content over control and the amount of S applied through chemical fertilizers and farmyard manure.

Author Contributions

Conceptualization, D.P. and P.P.R.; methodology, D.P., D.S. and A.D.N.; software, D.P. and P.P.R.; supervision, C.M.B., R.A., S.V. and B.; writing—original draft preparation, D.P.; writing—review and editing, D.P. and C.M.B. All authors have read and agreed to the published version of the manuscript.

Funding

This research received no external funding.

Data Availability Statement

Not applicable.

Acknowledgments

Authors are highly grateful to Central Sericultural Research & Training Institute, Central Silk Board, Mysuru for providing the facilities to undertake the study. Authors are also thankful to the anonymous reviewers for their critical reviews and suggestions to improve the manuscript.

Conflicts of Interest

The authors declare no conflict of interest.

References

  1. Scherer, H.W. Sulfur in soils. J. Plant Nutr. Soil Sci. 2009, 172, 326–335. [Google Scholar] [CrossRef]
  2. Zenda, T.; Liu, S.; Dong, A.; Duan, H. Revisiting Sulphur—The Once Neglected Nutrient: It’s Roles in Plant Growth, Metabolism, Stress Tolerance and Crop Production. Agriculture 2021, 11, 626. [Google Scholar] [CrossRef]
  3. Shukla, A.K.; Behera, S.K.; Prakash, C.; Tripathi, A.; Patra, A.K.; Dwivedi, B.S.; Trivedi, V.; Rao, C.S.; Chaudhuri, S.K.; Das, S.; et al. Deficiency of phyto-available sulphur, zinc, boron, iron, copper and manganese in soils of India. Sci. Rep. 2021, 11, 19760. [Google Scholar] [CrossRef] [PubMed]
  4. Balik, J.; Kulhanek, M.; Cernyl, J.; Szakoval, J.; Pavlikoval, D.; Cermak, P. Differences in soil sulfur fractions due to limitation of atmospheric deposition. Plant Soil Environ. 2009, 55, 344–352. [Google Scholar] [CrossRef]
  5. Kundu, R.; Adhikary, S.; Padhan, D.; Das, A.; Dutta, J. Extractable Fractions of Sulphur in Major Soils of India. Chem. Sci. Rev. Lett. 2020, 9, 138–145. [Google Scholar]
  6. Zhao, F.J.; McGrath, S.P.; Hawkesford, M.J. Sulphur Nutrition and the Sulphur Cycle; Research report 2000–2001; Institute of Arable Crops (ex Rothamsted Experimental Station): Harpenden, UK, 2001. [Google Scholar]
  7. Yesmin, R.; Hossain, M.; Kibria, M.G.; Jahiruddin, M.; Solaiman, Z.M.; Bokhtiar, S.M.; Hossain, M.B.; Satter, M.A.; Abedin, M.A. Evaluation of Critical Limit of Sulphur in Soils for Wheat (Triticum aestivum L.) and Mustard (Brassica napus L.). Sustainability 2021, 13, 8325. [Google Scholar] [CrossRef]
  8. Carciochi, W.D.; Divito, G.A.; Fernández, L.A.; Echeverría, H.E. Sulfur affects root growth and improves nitrogen recovery and internal efficiency in wheat. J. Plant Nutr. 2017, 40, 1231–1242. [Google Scholar] [CrossRef]
  9. Padhan, D. Sulphur Fractions in Soils of Long-Term Experiments with Various Management Practices and Cropping Systems Under Different Agro-Ecological Zones of India. Master’s Thesis, Bidhan Chandra Krishi Viswavidyalaya, West Bengal, India, 2014; pp. 1–70. [Google Scholar]
  10. Rao, A.S.; Ghosh, A.B. Effect of intensive cropping and fertilizer use on the crop removal of sulphur and zinc and their availability in soil. Fertil. Res. 1981, 2, 303–308. [Google Scholar] [CrossRef]
  11. Nguyen, M.L.; Goh, K.M. Accumulation of soil sulphur fractions in grazed pastures receiving long-term superphosphate applications. N. Z. J. Agric. Res. 1990, 33, 111–128. [Google Scholar] [CrossRef]
  12. Goh, K.M.; Pamidi, J. Effects of cultivation and long-term superphosphate applications on pasture soil sulphur mineralisation and availability in the field. Plant Soil 2004, 264, 299–312. [Google Scholar] [CrossRef]
  13. Eriksen, J.; Mortensen, J.V. Soil sulphur status following long-term annual application of animal manure and mineral fertilizers. Biol. Fertil. Soils 1999, 28, 416–421. [Google Scholar] [CrossRef]
  14. Reddy, K.S.; Singh, M.; Tripathi, A.K.; Swarup, A.; Dwivedi, A.K. Changes in organic and inorganic sulfur fractions and S mineralisation in a Typic Haplustert after long-term cropping with different fertiliser and organic manure inputs. Soil Res. 2001, 39, 737–748. [Google Scholar] [CrossRef]
  15. Pandian, P.S. Effect of long-term manure and fertilizer addition on sulphur forms under rice monoculture. Madras Agric. J. 2011, 98, 219–223. [Google Scholar]
  16. Wang, J.; Solomon, D.; Lehmann, J.; Zhang, X.; Amelung, W. Soil organic sulfur forms and dynamics in the Great Plains of North America as influenced by long-term cultivation and climate. Geoderma 2006, 133, 160–172. [Google Scholar] [CrossRef]
  17. Bettany, J.R.; Saggar, S.; Stewart, J.W.B. Comparison of the amounts and forms of sulfur in soil organic matter fractions after 65 years of cultivation. Soil Sci. Soc. Am. J. 1980, 44, 70–75. [Google Scholar] [CrossRef]
  18. Bhupinderpal, S.; Hedley, M.J.; Saggar, S.; Francis, G.S. Chemical fractionation to characterize changes in sulphur and carbon in soil caused by management. Eur. J. Soil Sci. 2004, 55, 79–90. [Google Scholar] [CrossRef]
  19. Xiao, H.; Li, N.; Liu, C. Source identification of sulfur in uncultivated surface soils from four Chinese provinces. Pedosphere 2015, 25, 140–149. [Google Scholar] [CrossRef]
  20. Williams, C.H.; Steinbergs, H. Soil sulphur fractions as chemical indices of available sulphur in some Australian soils. Aust. J. Agric. Res. 1959, 10, 340–352. [Google Scholar] [CrossRef]
  21. Kilmer, V.J.; Nearpass, D.C. The determination of available sulfur in soils. Soil Sci. Soc. Am. J. 1960, 24, 337–340. [Google Scholar] [CrossRef]
  22. Pradhan, A.K.; Beura, K.S.; Das, R.; Padhan, D.; Hazra, G.C.; Mandal, B.; De, N.; Mishra, V.N.; Polara, K.B.; Sharma, S. Evaluation of extractability of different extractants for zinc and copper in soils under long-term fertilization. Plant Soil Environ. 2015, 61, 227–233. [Google Scholar]
  23. Seth, A.; Sarkar, D.; Datta, A.; Mandal, B.; Chowdhury, A.; Masto, R.E.; Chakravarty, A.K.; Hazra, G.C.; Badole, S.; Batyabal, K.; et al. Suitability of complex extractants for assessment of available soil zinc for nutrition of rice (Oryza sativa L.) in subtropical India. Soil Sci. 2017, 182, 28–35. [Google Scholar] [CrossRef]
  24. Rao, T.N.; Sharma, P.K. Evaluation of Mehlich III as an extractant for available soil sulfur. Commun. Soil Sci. Plant Anal. 1997, 28, 1033–1046. [Google Scholar] [CrossRef]
  25. Ostatek-Boczynski, Z.A.; Lee-Steere, P. Evaluation of Mehlich 3 as a universal nutrient extractant for Australian sugarcane soils. Commun. Soil Sci. Plant Anal. 2012, 43, 623–630. [Google Scholar] [CrossRef]
  26. Malathi, P.; Stalin, P. Evaluation of AB-DTPA extractant for multinutrients extraction in soils. Int. J. Curr. Microbiol. Appl. Sci. 2018, 7, 1192–1205. [Google Scholar] [CrossRef]
  27. Inokuchi, T.; Ito, T. Variations in free amino acid composition of larval hemolymph among varieties of the silkworm, Bombyx mori. J. Sericult. Sci. Jpn. 1973, 42, 105–116. [Google Scholar]
  28. Institute of Sericultural Science; Chinese Academy of Agricultural Science. Mulberry Cultivation in China; Chinese Academy of Agricultural Science: Beijing, China, 1985; pp. 36–38, 251–252. (In Chinese) [Google Scholar]
  29. Shankar, M.A.; Shivashankar, K.; Devaiah, M.C. Effect of feedingmulberry leaves deficient in secondary nutrients on larval growth, development, cocoon weight and silk quality. Sericologia 1994, 34, 511–518. [Google Scholar]
  30. Yadav, V.K.; Padhan, D.; Sen, S.; Gayathri, T.; Praveen Kumar, K.; Tewary, P. Assessment of Carbon Sequestration Potential of Mulberry vis-à-vis Soils under Different Cultivation Practices. Int. J. Curr. Microbiol. Appl. Sci. 2020, 9, 2463–2474. [Google Scholar] [CrossRef]
  31. Keen, B.A.; Raczkowski, H. Relation between the clay content and certain physical properties of a soil. J. Agric. Sci. 1921, 11, 441–449. [Google Scholar] [CrossRef]
  32. Jackson, M.L. Soil Chemical Analysis; Prentice Hall India Pvt. Ltd.: New Delhi, India, 1973; p. 498. [Google Scholar]
  33. Walkley, A.; Black, I.A. An examination of the Degtjareff method for determining soil organic matter, and a proposed modification of the chromic acid titration method. Soil Sci. 1934, 37, 29–38. [Google Scholar] [CrossRef]
  34. Vance, E.D.; Brookes, P.C.; Jenkinson, D.S. An extraction method for measuring soil microbial biomass C. Soil Biol. Biochem. 1987, 19, 703–707. [Google Scholar] [CrossRef]
  35. Morche, L. S-Fluxes and Spatial Alterations of Inorganic and Organic Sulphur Fractions in Soil as well as Their Accumulation and Depletion in the Rhizosphere of Agricultural Crops by Partial Use of the Radioisotope 35S. Ph.D. Thesis, University of Bonn, Bonn, Germany, 2008. (In German). [Google Scholar]
  36. Soltanpour, P.N.; Schwab, A.P. A new soil test for macro- and micro-nutrients in alkaline soils. Commun. Soil Sci. Plant Anal. 1977, 8, 195–207. [Google Scholar] [CrossRef]
  37. Mehlich, A. Mehlich 3 for soil test extractant: A modification of Mehlich 2 extractant. Commun. Soil Sci. Plant Anal. 1984, 15, 1409–1416. [Google Scholar] [CrossRef]
  38. Jenkinson, D.S.; Powlson, D.S. The effects of biocidal treatments on metabolism in soil. I. Fumigation with chloroform. Soil Biol. Biochem. 1976, 8, 167–177. [Google Scholar] [CrossRef]
  39. Tabatabai, M.A.; Bremner, J.M. Arylsulfatase Activity of Soils. Soil Sci. Soc. Am. Proc. 1970, 34, 225–229. [Google Scholar] [CrossRef]
  40. Tandon, H.L.S. (Ed.) Methods of Analysis of Soils, Plants, Waters, and Fertilisers; Fertiliser Development and Consultation Organisation: New Delhi, India, 1993; Volume 63, pp. 1–204. [Google Scholar]
  41. Gomez, K.A.; Gomez, A.A. Statistical Procedures for Agricultural Research, 2nd ed.; John Wiley & Sons: New York, NY, USA, 1984. [Google Scholar]
  42. Amami, R.; Ibrahimi, K.; Znouda, A.; Abrougui, K.; Sayed, C. Influence of tillage systems on soil bulk density and carbon dioxide emissions in the Mediterranean context. Eur.-Mediterr. J. Environ. Integr. 2021, 6, 16. [Google Scholar] [CrossRef]
  43. Zhang, B.; Li, Y.; Ren, T.; Tian, Z.; Wang, G.; He, X.; Tian, C. Short term effect of tillage and crop rotation on microbial community structure and enzyme activities of a clay loam soil. Biol. Fertil. Soils 2014, 50, 1077–1086. [Google Scholar] [CrossRef]
  44. Haydu-Houdeshell, C.A.; Graham, R.C.; Hendrix, P.F.; Peterson, A.C. Soil aggregate stability under chaparral species in southern California. Geoderma 2018, 310, 201–208. [Google Scholar] [CrossRef]
  45. Padhan, D. The Locking and Unlocking of Nutrients in Soils for Plants Under Organic Farming System. Ph.D. Thesis, Bidhan Chandra Krishi Viswavidyalaya, West Bengal, India, 2018; pp. 1–323. [Google Scholar]
  46. Fageria, N.K.; dos Santos, A.B.; Moraes, A.B. Influence of Urea and Ammonium Sulfate on Soil Acidity Indices in Lowland Rice Production. Commun. Soil Sci. Plant Anal. 2008, 41, 1565–1575. [Google Scholar] [CrossRef]
  47. Muthoni, J. Soil Fertility Situation in Potato Producing Kenyan Highlands—Case of KALRO-Tigoni. Int. J. Hortic. 2016, 6, 1–11. [Google Scholar] [CrossRef]
  48. Othaman, N.N.C.; Md Isa, M.N.; Ismail, R.C.; Ahmad, M.I.; Hui, C.K. Factors That Affect Soil Electrical Conductivity (EC) Based System for Smart Farming Application. AIP Conf. Proc. 2019, 2203, 020055-1–020055-6. [Google Scholar]
  49. Majumder, B.; Mandal, B.; Bandyopadhyay, P.K.; Gangopadhyay, A.; Mani, P.K.; Kundu, A.L.; Mazumdar, D. Organic amendments influence soil organic carbon pools and rice–wheat productivity. Soil Sci. Soc. Am. J. 2008, 72, 775–785. [Google Scholar] [CrossRef]
  50. Datta, A.; Mandal, B.; Badole, S.; Chaitanya, A.K.; Majumder, S.; Padhan, D.; Basak, N.; Barman, A.; Kundu, R.; Narkhede, W.N. Interrelationship of biomass yield, carbon input, aggregation, carbon pools and its sequestration in Vertisols under long-term sorghum-wheat cropping system in semi-arid tropics. Soil Tillage Res. 2018, 184, 164–175. [Google Scholar] [CrossRef]
  51. Chaitanya, A.K.; Majumder, S.P.; Padhan, D.; Badole, S.; Datta, A.; Mandal, B.; Reddy, K.G. Carbon dynamics, potential and cost of carbon sequestration in double rice cropping system in semi-arid southern India. J. Soil Sci. Plant Nutr. 2018, 18, 418–434. [Google Scholar]
  52. Chaitanya, A.K.; Majumder, S.P.; Badole, S.; Padhan, D.; Datta, A.; Mandal, B.; Srinivas, C. Pools of organic carbon in soils under a long-term rice–rice system with different organic amendments in hot, sub-humid India. Carbon Manag. 2020, 11, 331–339. [Google Scholar]
  53. Das, R.; Mandal, B.; Sarkar, D.; Pradhan, A.K.; Datta, A.; Padhan, A.; Seth, A.; Kumar, R.; De, N.; Mishra, V.N.; et al. Boron availability in soils and its nutrition of crops under long-term fertility experiments in India. Geoderma 2019, 351, 116–129. [Google Scholar] [CrossRef]
  54. Ademir, S.F.A.; Luiz, F.C.L.; Valdinar, B.S.; Romero, F.V.C. Soil microbial activity in conventional and organic agricultural systems. Sustainability 2009, 1, 268–276. [Google Scholar]
  55. Padhan, D.; Pradhan, A.K.; Chakraborty, M.; Sen, A. Assessment of the effects of land use pattern on distribution of sulphur fractions in soil. J. Nat. Appl. Sci. 2016, 8, 1685–1691. [Google Scholar] [CrossRef]
  56. McNeill, A.M.; Eriksen, J.; Bergström, L.; Smith, K.A.; Marstorp, H.; Kirchmann, H.; Nilsson, I. Nitrogen and sulphur management: Challenges for organic sources in temperate agricultural systems. Soil Use Manag. 2005, 21, 82–93. [Google Scholar] [CrossRef]
  57. Dutta, J.; Sankhyan, N.K.; Sharma, S.P.; Sharma, G.D.; Sharma, S.K. Sulphur fractions in acid soil continuously fertilized with chemical fertilizers and amendments under maize-wheat system. J. Ind. Soc. Soil Sci. 2013, 61, 195–201. [Google Scholar]
  58. Kopittke, P.M.; Dalal, R.C.; Menzies, N.W. Sulfur dynamics in sub-tropical soils of Australia as influenced by long-term cultivation. Plant Soil 2016, 402, 211–219. [Google Scholar] [CrossRef]
  59. Solomon, D.; Lehmann, J.; Tekalign, M.; Fritzsche, F.; Zech, W. Sulfur fractions in particle-size separates of the sub-humid Ethiopian highlands as influenced by land use changes. Geoderma 2001, 102, 41–59. [Google Scholar] [CrossRef]
  60. Janzen, H.H.; Ellert, B.H. Sulfur dynamics in cultivated temperate agroecosystems. In Sulfur in the Environment; Maynard, D.G., Ed.; Dekker: New York, NY, USA, 1998; pp. 11–43. [Google Scholar]
  61. Saggar, S.; Hedley, M.J.; Phimsarn, S. Dynamics of sulfur transformations in grazed pastures. In Sulfur in the Environment; Maynard, D.G., Ed.; Dekker: New York, NY, USA, 1998; pp. 45–94. [Google Scholar]
  62. Srinivasarao, C.; Ganeshamurthy, A.N.; Ali, M.; Singh, R.N.; Singh, K.K. Sulphur fractions, distribution, and their relationships with soil properties in different soil types of major pulse-growing regions of India. Commun. Soil Sci. Plant Anal. 2004, 35, 2757–2769. [Google Scholar] [CrossRef]
  63. Paramanick, B.; Panda, P.; Layek, J.; Chatterjee, D.; Choudhury, A. Forms of sulphur and their relationship in four contrasting agro-climatic zones of West Bengal. Ecoscan 2014, 8, 85–89. [Google Scholar]
  64. Lavanya, K.R.; Kadalli, G.G.; Patil, S.; Jayanthi, T.; Naveen, D.V.; Channabasavegowda, R. Sulphur Fractionation Studies in Soils of Long-Term Fertilizer Experiment under Finger Millet—Maize Cropping Sequence. Int. J. Curr. Microbiol. Appl. Sci. 2019, 8, 1334–1345. [Google Scholar] [CrossRef]
  65. Tabatabai, M.A.; Bremner, J.M. Forms of sulfur, and carbon, nitrogen and sulfur relationships, in Iowa soils. Soil Sci. 1972, 114, 380–386. [Google Scholar] [CrossRef]
  66. Eriksen, J.; Thorup-Kristensen, K.; Askegaard, M. Plant availability of catch crop sulfur following spring incorporation. J. Plant Nutr. Soil Sci. 2004, 167, 609–615. [Google Scholar] [CrossRef]
  67. Stevenson, F.J. Cycles of Soil: Carbon, Nitrogen, Phosphorus, Micronutrients; John Wiley & Sons: New York, NY, USA, 1986. [Google Scholar]
  68. Wu, J.; O’Donnell, A.G.; He, Z.L.; Syers, J.K. Fumigation-extraction method for the measurement of soil microbial biomass-S. Soil Biol. Biochem. 1994, 26, 117–125. [Google Scholar] [CrossRef]
  69. Heinze, S.; Hemkemeyer, M.; Schwalb, S.A.; Khan, K.S.; Joergensen, R.G.; Wichern, F. Microbial Biomass Sulphur—An Important Yet Understudied Pool in Soil. Agronomy 2021, 11, 1606. [Google Scholar] [CrossRef]
  70. Banerjee, M.R.; Chapman, S.J. The significance of microbial biomass sulphur in soil. Biol. Fertil. Soils 1996, 22, 116–125. [Google Scholar] [CrossRef]
  71. Turner, B.L.; Condron, L.M.; France, C.A.; Lehmann, J.; Solomon, D.; Peltzer, D.A.; Richardson, S.J. Sulfur dynamics during long-term ecosystem development. Biogeochemistry 2016, 128, 281–305. [Google Scholar] [CrossRef]
  72. Elsgard, L.; Vinter, F.P. Modeling of the fine-scale temperature response of arylsulfatase activity in soil. J. Plant Nutr. Soil Sci. 2004, 167, 196–201. [Google Scholar] [CrossRef]
  73. Lemanowicz, J.; Siwik-Ziomek, A.; Koper, J. Effects of farmyard manure and nitrogen fertilizers on mobility of phosphorus and sulphur in wheat and activity of selected hydrolases in soil. Int. Agrophys. 2014, 28, 49–55. [Google Scholar] [CrossRef]
  74. Saviozzi, A.; Cardelli, R.; Cipolli, S.; Levi-Minzi, R.; Riffaldi, R. Sulphur mineralization kinetics of cattle manure and green waste compost in soils. Waste Manag. Res. 2006, 24, 545–551. [Google Scholar] [CrossRef] [PubMed]
  75. Ziomek, A.S.; Lemanowicz, J.; Koper, J. Arylsulfatase activity and sulphate content in relation to crop rotation and fertilization of soil. Int. Agrophys. 2016, 30, 359–367. [Google Scholar] [CrossRef]
  76. Ziomek, A.S.; Koper, J. Changes in the content of sulphate sulphur and arylsulfatase activity in soil under potato caused by fertilization. J. Elementol. 2010, 15, 171–176. [Google Scholar]
  77. Mori, T.; Zhou, K.; Wang, C.; Wang, S.; Wang, Y.; Zheng, M.; Lu, X.; Zhang, W.; Mo, J. Effects of 14-year continuous nitrogen addition on soil arylsulfatase and phosphodiesterase activities in a mature tropical forest. Glob. Ecol. Conserv. 2020, 22, e00934. [Google Scholar] [CrossRef]
  78. Piotrowska, A.; Wilczewski, E. Effects of catch crops cultivated for green manure and mineral nitrogen fertilization on soil enzyme activities and chemical properties. Geoderma 2012, 189, 72–80. [Google Scholar] [CrossRef]
  79. Chen, Y.P.; Tsai, C.F.; Rekha, P.D.; Ghate, S.D.; Huang, H.Y.; Hsu, Y.H.; Liaw, L.L.; Young, C.C. Agricultural management practices influence the soil enzyme activity and bacterial community structure in tea plantations. Bot. Stud. 2021, 62, 8. [Google Scholar] [CrossRef]
  80. Ahmadi, K.; Razavi, B.S.; Maharjan, M.; Kuzyakov, Y.; Kostka, S.J.; Cariminati, A.; Zarebanadkouki, M. Effects of rhizosphere wettability on microbial biomass, enzyme activitiesand localization. Rhizosphere 2018, 7, 35–42. [Google Scholar] [CrossRef]
  81. Tabatabai, M.A. Sulfur. In Methods of Soil Analysis: Part 3 Chemical Methods; John Wiley & Sons: New York, NY, USA, 1996; Volume 5, pp. 921–960. [Google Scholar]
  82. Soltanpour, P.N. Use of ammonium bicarbonate DTPA soil test to evaluate elemental availability and toxicity. Commun. Soil Sci. Plant Anal. 1985, 16, 323–338. [Google Scholar] [CrossRef]
  83. Seth, A.; Sarkar, D.; Masto, R.E.; Batabyal, K.; Saha, S.; Murmu, S.; Das, R.; Padhan, D.; Mandal, B. Critical limits of Mehlich 3 extractable phosphorous, potassium, sulfur, boron and zinc in soils for nutrition of rice (Oryza sativa L.). J. Soil Sci. Plant Nutr. 2018, 18, 512–523. [Google Scholar] [CrossRef]
  84. Hu, Z.Y.; Zhao, F.J.; McGrath, S.P. Sulphur fractionation in calcareous soils and bioavailability to plants. Plant Soil 2005, 268, 103–109. [Google Scholar] [CrossRef]
  85. Matula, J. Use of multinutrient soil tests for sulphur determination. Commun. Soil Sci. Plant Anal. 1999, 30, 1733–1746. [Google Scholar] [CrossRef]
Figure 1. The distribution of inorganic sulphur fractions influenced by nutrient management practices in mulberry (WS_S: Water soluble S, Sorbed_S: Adsorbed S, Occluded_S: Ca/MgCO3 occluded S).
Land 12 01160 g001
Figure 2. The effect of nutrient management practices on distribution of microbial biomass S in the experimental soils (different letters indicate significant difference at p ≤ 0.05; Duncan multiple range test).
Land 12 01160 g002
Figure 3. The effect of nutrient management practices on arylsulfatase activity in the experimental soils (different letters indicate significant difference at p ≤ 0.05; Duncan multiple range test).
Land 12 01160 g003
Figure 4. The relative increase in extractable S content over unmanured control in the experimental soils.
Land 12 01160 g004
Figure 5. The relationship between (ad) S fractions and extractable S content in the experimental soil.
Land 12 01160 g005aLand 12 01160 g005b
Figure 6. (ad) The relationship between plant S concentration and extractable S in the experimental soil.
Land 12 01160 g006
Table 1. The impact of mulberry varieties and nutrient management practices on physical, chemical and biological properties of the experimental soils.
TreatmentspH CaCl2EC
(m mho cm−1)
BD
(mg m−3)
SOC
(g kg−1)
MBC
(μg g−1)
Varieties
V-16.5641.51.356.40169.4
AGB-86.6738.31.346.45162.7
MSG-26.6940.31.356.20159.1
G-46.5949.01.356.48171.7
Sem0.1410.7380.0370.1573.78
LSD (0.05)0.2831.490.0750.3177.64
Fertilizer doses
Control6.6435.51.365.68152.0
100% RDF6.5147.71.356.95176.7
80% RDF6.6246.21.356.65171.4
60% RDF6.7339.81.336.25162.7
SEm0.1210.6390.0320.1363.28
LSD (0.05)0.2441.290.0650.2756.62
F × VSEm0.2421.270.0670.2726.55
LSD (0.05)0.4892.580.1310.55113.24
Fallow6.6852.41.387.40204.2
Table 2. The impact of mulberry varieties and nutrient management practices on sulphur fractions (mg kg−1) in the experimental soils.
TreatmentsWater Soluble SSorbed SOccluded SInorganic SOrganic STotal S
Varieties
V-124.24.947.2936.4647.4683.8
AGB-822.94.747.4635.1633.9669.0
MSG-222.64.667.2534.5634.2668.8
G-424.04.817.5336.3645.5681.8
SEm0.4540.0660.1510.6417.829.52
LSD (0.05)0.9170.1350.3041.2915.819.3
Fertilizer doses
Control15.36.887.7829.9579.6609.6
100% RDF29.64.537.4541.6673.2714.8
80% RDF25.84.367.2937.5661.6699.1
60% RDF23.03.387.0033.4646.5679.9
SEm0.3930.0570.1310.5546.788.25
LSD (0.05)0.7940.1150.2641.1213.716.6
F × VSEm0.7860.1140.2611.1113.616.5
LSD (0.05)1.590.2310.5272.2427.433.4
Fallow22.45.489.237.1653.1690.2
Table 3. Pearson correlation coefficients between S fractions and measured soil properties of the experimental site.
Sulphur FractionsSoil Properties
pHCaCl2ECBDOrg CMBC
Water soluble S−0.5150.786 *−0.2720.977 **0.920 **
Sorbed S−0.216−0.4050.819 *−0.604−0.510
Occluded S−0.395−0.0930.758 *−0.291−0.231
Inorganic S−0.6990.812 *−0.0390.972 **0.933 **
Organic S−0.3910.773 *−0.3870.940 **0.903 **
Total S−0.4290.785 *−0.3530.953 **0.915 **
* p < 0.05, ** p < 0.01. pHCaCl2—pH measured with CaCl2 solution, EC—Electrical conductivity, BD—Bulk density, Org C—Organic carbon, MBC—Microbial biomass carbon.
Table 4. The impact of mulberry varieties and nutrient management practices on extractable soil S and plant S content.
TreatmentsCaCl2_SAB-DTPA_SNaHCO3_SMehlich-3_SPlant S
mg kg−1g kg−1
Varieties
V-126.430.138.533.12.04
AGB-825.029.235.831.52.01
MSG-224.928.535.731.01.99
G-426.530.739.133.32.06
SEm0.4150.4960.6170.6970.041
LSD (0.05)0.8391.0031.251.410.083
Fertilizer doses
Control16.318.524.520.01.95
100% RDF32.237.148.942.02.10
80% RDF28.132.939.635.82.04
60% RDF26.229.936.031.12.02
SEm0.3610.4310.5350.6040.034
LSD (0.05)0.7270.8691.081.220.068
F × VSEm0.7190.8621.071.210.069
LSD (0.05)1.451.742.162.450.139
Fallow25.428.638.636.5-
CaCl2_S: CaCl2 extractable S; AB-DTPA_S: Ammonium bicarbonate-diethylene triamine pentaacetic acid extractable S; NaHCO3_S: Sodium hydrogen carbonate extractable S; Mehlich-3_S: Mehlich-3 extractable S.
Table 5. Pearson correlation coefficients among the extractable S content of the experimental soils.
CaCl2_SAB-DTPA_SNaHCO3_SMehlich-3_S
CaCl2_S10.998 **0.981 **0.991 **
AB-DTPA_S 10.978 **0.992 **
NaHCO3_S 0.978 **10.992 **
Mehlich-3_S 0.992 **1
** p < 0.01. CaCl2_S: CaCl2 extractable S; AB-DTPA_S: Ammonium bicarbonate-diethylene triamine pentaacetic acid extractable S; NaHCO3_S: Sodium hydrogen carbonate extractable S; Mehlich-3_S: Mehlich-3 extractable S.
Table 6. Pearson correlation coefficients between extractable S and measured soil properties.
Extractants Soil Properties
pHCaCl2ECBDOrg CMBC
CaCl2−0.4480.775 *−0.3510.961 **0.905 **
NaHCO3−0.5880.806 *−0.2110.967 **0.908 **
AB-DTPA−0.4440.758 *−0.3460.972 **0.928 **
Mehlich−3−0.5350.796 *−0.2430.982 **0.924 **
* p < 0.05, ** p < 0.01. CaCl2_S: CaCl2 extractable S; AB-DTPA_S: Ammonium bicarbonate-diethylene triamine pentaacetic acid extractable S; NaHCO3_S: Sodium hydrogen carbonate extractable S; Mehlich-3_S: Mehlich-3 extractable S; EC: Electrical conductivity, BD: Bulk density; Org C: Organic carbon; MBC: Microbial biomass carbon.
Table 7. A multiple linear regression equation showing the relationship between plant S concentration, soil properties and extractable S content in the experimental soils.
Y = S Concentration in Mulberry LeafR2Adj. R2SE (Est)
CaCl2Y = 1.790 + (0.009) CaCl2 − S ***0.5110.5010.542
Y = 1.976+ (0.007) CaCl2 − S * − (0.053) pH − (0.042) OC + (0.002) MBC0.5610.5210.531
NaHCO3Y = 1.791 + (0.006) NaHCO3 − S ***0.5560.5470.051
Y = 1.882 + (0.005) NaHCO3 − S ** − (0.034)pH − (0.066) OC + (0.001) MBC0.5820.5430.051
AB-DTPAY = 1.795 + (0.008) AB-DTPA − S ***0.5170.5070.053
Y = 2.053 + (0.066) AB-DTPA − S * − (0.061) pH − (0.072) OC + (0.001) MBC0.5710.5310.052
Mehlich-3Y = 1.807 + (0.007) Mehlich-3 − S ***0.5290.5190.053
Y = 1.976 + (0.005) Mehlich-3 − S * − (0.047) pH − (0.094) OC + (0.002) MBC0.5680.5270.052
* p < 0.05, ** p < 0.01, *** p < 0.001. CaCl2_S: CaCl2 extractable S; AB-DTPA_S: Ammonium bicarbonate-diethylene triamine pentaacetic acid extractable S; NaHCO3_S: Sodium hydrogen carbonate extractable S; Mehlich-3_S: Mehlich-3 extractable S; OC: organic carbon; MBC: Microbial biomass carbon.
Table 8. Pearson correlation coefficients between S fractions and extractable S content of the experimental soil.
Sulphur FractionsExtractable Sulphur
CaCl2AB-DTPANaHCO3Mehlich-3
Water soluble0.983 **0.978 **0.982 **0.985 **
Sorbed−0.736 *−0.602 *−0.735 *−0.655 *
Occluded−0.173−0.117−0.174−0.156
Organic0.920 **0.879 **0.928 **0.910 **
Total 0.937 **0.904 **0.945 **0.931 **
* p < 0.05, ** p < 0.01.
Table 9. A multiple linear regression equation relating soil extractable S to soil S fractions.
Regression ModelR2
CaCl2 extractable S = 4.430 + 0.980 (water soluble S) ** − 0.699 (sorbed S) ** + 0.223 (occluded S)0.978
NaHCO3 extractable S = −8.728 + 1.746 (water soluble S) ** + 0.585 (sorbed S) ** + 0.310 (occluded S)0.962
AB-DTPA extractable S = 4.450 + 1.158 (water soluble S) **− 0.821 (sorbed S) ** + 0.266 (occluded S)0.976
Meglich-3 extractable S = −3.986 + 1.510 (water soluble S) ** + 0.040 (sorbed S) ** + 0.088 (occluded S)0.971
** p < 0.01.
Disclaimer/Publisher’s Note: The statements, opinions and data contained in all publications are solely those of the individual author(s) and contributor(s) and not of MDPI and/or the editor(s). MDPI and/or the editor(s) disclaim responsibility for any injury to people or property resulting from any ideas, methods, instructions or products referred to in the content.

