

Machine Learning Techniques to Map the Impact of Urban Heat Island: Investigating the City of Jeddah

1
Department of Civil Engineering, College of Engineering, Prince Sattam bin Abdulaziz University, Alkharj 11942, Saudi Arabia
2
Landscape Architecture Department, Faculty of Architecture and Planning, King Abdulaziz University, Jeddah 21589, Saudi Arabia
Land 2023, 12(6), 1159; https://doi.org/10.3390/land12061159
Submission received: 10 May 2023
/
Revised: 28 May 2023
/
Accepted: 30 May 2023
/
Published: 31 May 2023
(This article belongs to the Special Issue Urban Form and the Urban Heat Island Effect)
Abstract
:Over the last decades, most agricultural land has been converted into residential colonies to accommodate the rapid population expansion. Population growth and urbanization result in negative consequences on the environment. Such land has experienced various environmental issues due to rapid urbanization and population increases. Such expansion in urbanization has a big impact on worsening the residences soon and in the long term, as the population is projected to increase more and more. One such issue is the urban heat island (UHI), which is computed based on land surface temperature (LST). The UHI effect has fundamental anthropogenic impacts on local areas, particularly in rapidly growing cities. This is due to the unplanned shifts in land use and land cover (LUALC) at the local level, which results in climate condition variations. Therefore, proper planning based on concrete information is the best policy in the long run to remedy these issues. In this study, we attempt to map out UHI phenomena using machine learning (ML) algorithms, including bagging and random subspace. The proposed research also fulfills the sustainable development goals (SDGs) requirement. We exploit the correlation and regression methods to understand the relationship between biophysical composition and the UHI effect. Our findings indicate that in the megacity of Jeddah, Saudi Arabia, from 2000 to 2021, the urban area enlarged by about 80%, while the UHI increased overall. Impervious surfaces significantly impact the UHI effect, while vegetation and water bodies have negative implications for the UHI effect. More than 80% of the total parts in Jeddah have been classified by extremely high UHI conditions, as determined by the bagging and random subspace models. In particular, the megacity’s south, north, and central-east parts were categorized by very high UHI conditions. This research is not only expected to assist in understanding the spatial patterns of the UHI in Jeddah, but to assist planners and policymakers in spatial planning. It will help to ensure sustainable urban management and improve life quality.
1. Introduction
Rapid urbanization occurs in various parts of the world [1]. In the mid-20th century, urbanization became a key driver due to human activity [2]. According to the United Nations prediction in 2018, 68% of the population will move towards cities by 2050. Massive-scale influxes of people in urban areas and landscape alteration from green space to impervious surface areas have resulted in imbalances between rural and metropolitan areas [3,4]. Such an imbalance ultimately alters energy and water balances in urban areas, affecting airflow dynamics [5]. As a result of the rapid rate of urbanization, natural and semi-natural landscapes have been transformed into impervious surfaces, resulting in significant land-use and land-cover (LUALC) alterations [6]. Changes in LUALC and deterioration of the regular landscapes (e.g., wetlands, vegetation, and water cover) cause various eco-environmental issues, including ecosystem service (ES) loss, air, water, and soil quality degradation, and the UHI effect, especially in India and China. Therefore, mapping and assessing UHIs is essential to ensure a safe and sustainable urban environment. Understanding the UHI phenomena is also necessary for urban climate management and controlling features affecting the city climate process [7].
The UHI effect is considered an undesirable effect of urbanization, resulting from the conversion of pervious into impervious surfaces [8,9]. The surface UHI is estimated by exploiting the satellite images based on the land surface temperature (LST) [10]. Due to surface thermal properties changes, cities are experiencing the UHI effect and are becoming hotter than rural places [11,12]. Variations primarily influence variations in temperature between rural and urban areas in landscape composition and configuration [13,14]. LUALC alteration due to rapid urbanization has been stated as one of the dominant drivers of global climate change [15]. The authors in [16] conducted a study in Australia and observed an increase in the UHI by 1.20 ± 0.20 °C from 2001 to 2014, associated with a 14.93% increase in built-up areas. The authors in [17] stated that alteration in LUALC is a prime factor of global warming, and the UHI is expected to increase by 0.27 °C per century. Previous studies have considered social and ecological factors significantly affecting UHI phenomena [18,19]. Geographic information systems (GIS) and remote sensing are extensively utilized to determine how socio-ecological variables affect UHI occurrences [20,21]. These socio-ecological variables include vegetation indices, water indices, and impervious indices. These indices based on remote sensing have been routinely utilized to evaluate UHI’s spatial variability [20,22]. Although the abovementioned indices have been utilized previously, no work has mapped and assessed UHI phenomena using machine learning (ML) and deep learning (DL) algorithms. Thus, some accountable research gaps have been identified from a review of the existing literature.
First, previous research on such mapping and modeling was carried out in cities in tropical and subtropical regions, and very few studies have considered hot desert climate areas. The authors in [23] introduce a novel technique for integrating remote sensing data with the available datasets. The methods highlight substantial insights to the planners and policymakers to suggest better sustainable planning. The authors in [24] map the air temperature spatial pattern over a 1 km hourly rate. The study shows good accuracy of UHI at nighttime and a pronounced lower level in a hilly region. It also shows a fall in air temperature compared to the urban fringe in metropolitan areas. Research work in [25] evaluates the effects of UHI using the artificial neural network. The research develops a technique to evaluate the overall risk concerning UHI and minimize the damage to residents’ health. A comprehensive review is presented in [26]. An integrative framework with the help of ML is analyzed. The research discusses urban planning and provides efficient management exploiting the ML technique.
A theoretical approach is presented in [27] to minimize the effects of extreme UHI. An ML approach is utilized to best describe the simulation results. An ML-based prediction of LUALC is used to map the surface temperature changes in Ahmedabad City, India [28]. ANN-based Cellular Automata (CA) model is utilized, and the prediction of the future LUALC shows an accuracy of 89.2%. A broad review of UHI in the sense of thermal data is provided in [29]. The authors include the datasets, concepts, applications, and methodologies to highlight the contribution, focusing on studying the progress on multi-sensor image optimization, computational analysis, image fusion, and DL with the development of novel data metrics. Methods of ML application for predicting the UHI and digital analysis are provided in [30].
Cities in hot desert areas have experienced massive population growth and urbanization. Therefore, it is essential to understand the UHI effect for climate mitigation. Second, in previous studies, UHI phenomena have been modeled from the LST but have not been modeled considering independent factors affecting UHIs. Third, cities in the hot desert climate regions have experienced dramatic urban expansion and have faced serious environmental problems related to heat waves and extreme temperatures. Therefore, it is crucial to comprehend and map out UHI phenomena for UHI mitigation and sustainable urban climate management. To further elaborate on the effects of UHI-discussed research [23,24,25,26,27,28,29,30], the proposed study utilized ML algorithms to map a UHI from remote-sensing-based indices for 2021. In context to the contribution and novelty, in this work, we have tried to show the urban heat island pattern based on the remote sensing indices and the relationship with biophysical indices.
2. Background
Cities and urban regions have a characteristic local climate that differs greatly from that of the surrounding area. Elevated temperatures, polluted air, and poor ventilation are typical characteristics of densely built inner cities [21,22,23]. In cities, the effect of high temperatures can be amplified by local effects: restricted wind circulation due to dense development, the lack of shade and green spaces, the absorption of the incident solar radiation by the many sealed surfaces, as well as waste heat from industry, buildings, and transport, contribute to the UHI. UHI increasing daytime heating and nocturnal heating/cooling is significantly reduced [24,25,26,27,28].
Accordingly, the maximum temperature differences between the core cities and the surrounding rural areas can be seen up to 10 °C [10,11,12,13]. The so-called heat island effect can be found in most cities worldwide and smaller cities with fewer than 100,000 inhabitants [13,14,15]. The UHI effect is one of the most significant man-made changes related to near-surface climate [29,30,31,32,33]. The heat island intensity is the size of the temperature difference, which correlates positively with the size of the city, although there are also differences between cities on individual continents. The heat island is noticeable, especially when walking between the city and the surrounding area in the morning or late at night [34,35,36,37,38]. The increase in air temperatures between the city and the surrounding area is not only limited to the summer but is valid for the whole year. The heat island has been increasing in recent years and is more recognized by the planning authorities as an important urban planning factor and integrated into their planning processes. It is increasingly becoming the focus of discussions about climate change. The UHI was modeled for this study using two popular ML algorithms: bagging and random subspace. The details of these ML algorithms are discussed in the following.
2.1. Bagging
Bagging, proposed by the author in [39], is a widely used ML algorithm broadly categorized within the group of bootstrap sampling techniques. In the previous literature, it has been well-documented that bagging can be successfully applied to predict various environmental issues accurately [40,41]. It is applied by constructing decision trees integrating different subsets combined within the final output [40]. This machine-learning approach enhances alignment accuracy by reducing inconsistency errors [37]. The bagging algorithm has received much attention in landslide exposure [22,37], drought vulnerability [42], air quality modeling, land surface temperature modeling, soil erosion moisture mapping, etc. However, the application of the bagging ML algorithm in the field of UHI modeling remains limited and has not been explored widely to date.
2.2. Random Subspace
Stochastic subspace is one of the popular meta-classifier techniques, which has been widely utilized in environmental and regression problems [43,44]. According to the authors in [45], several training datasets are produced from the random subspace for base training algorithms. Multiple features are utilized in this meta-classifier, while other algorithms use only instance space [46]. Thus, this ML algorithm is considered efficient in terms of the many redundant features and over-fitting problems experienced by others. This algorithm has been widely applied in various environmental modeling contexts [47,48] and air quality prediction [11]. However, the application of this machine algorithm in modeling the UHI effect has not yet been explored.
3. Materials and Methods
3.1. Investigation Zone
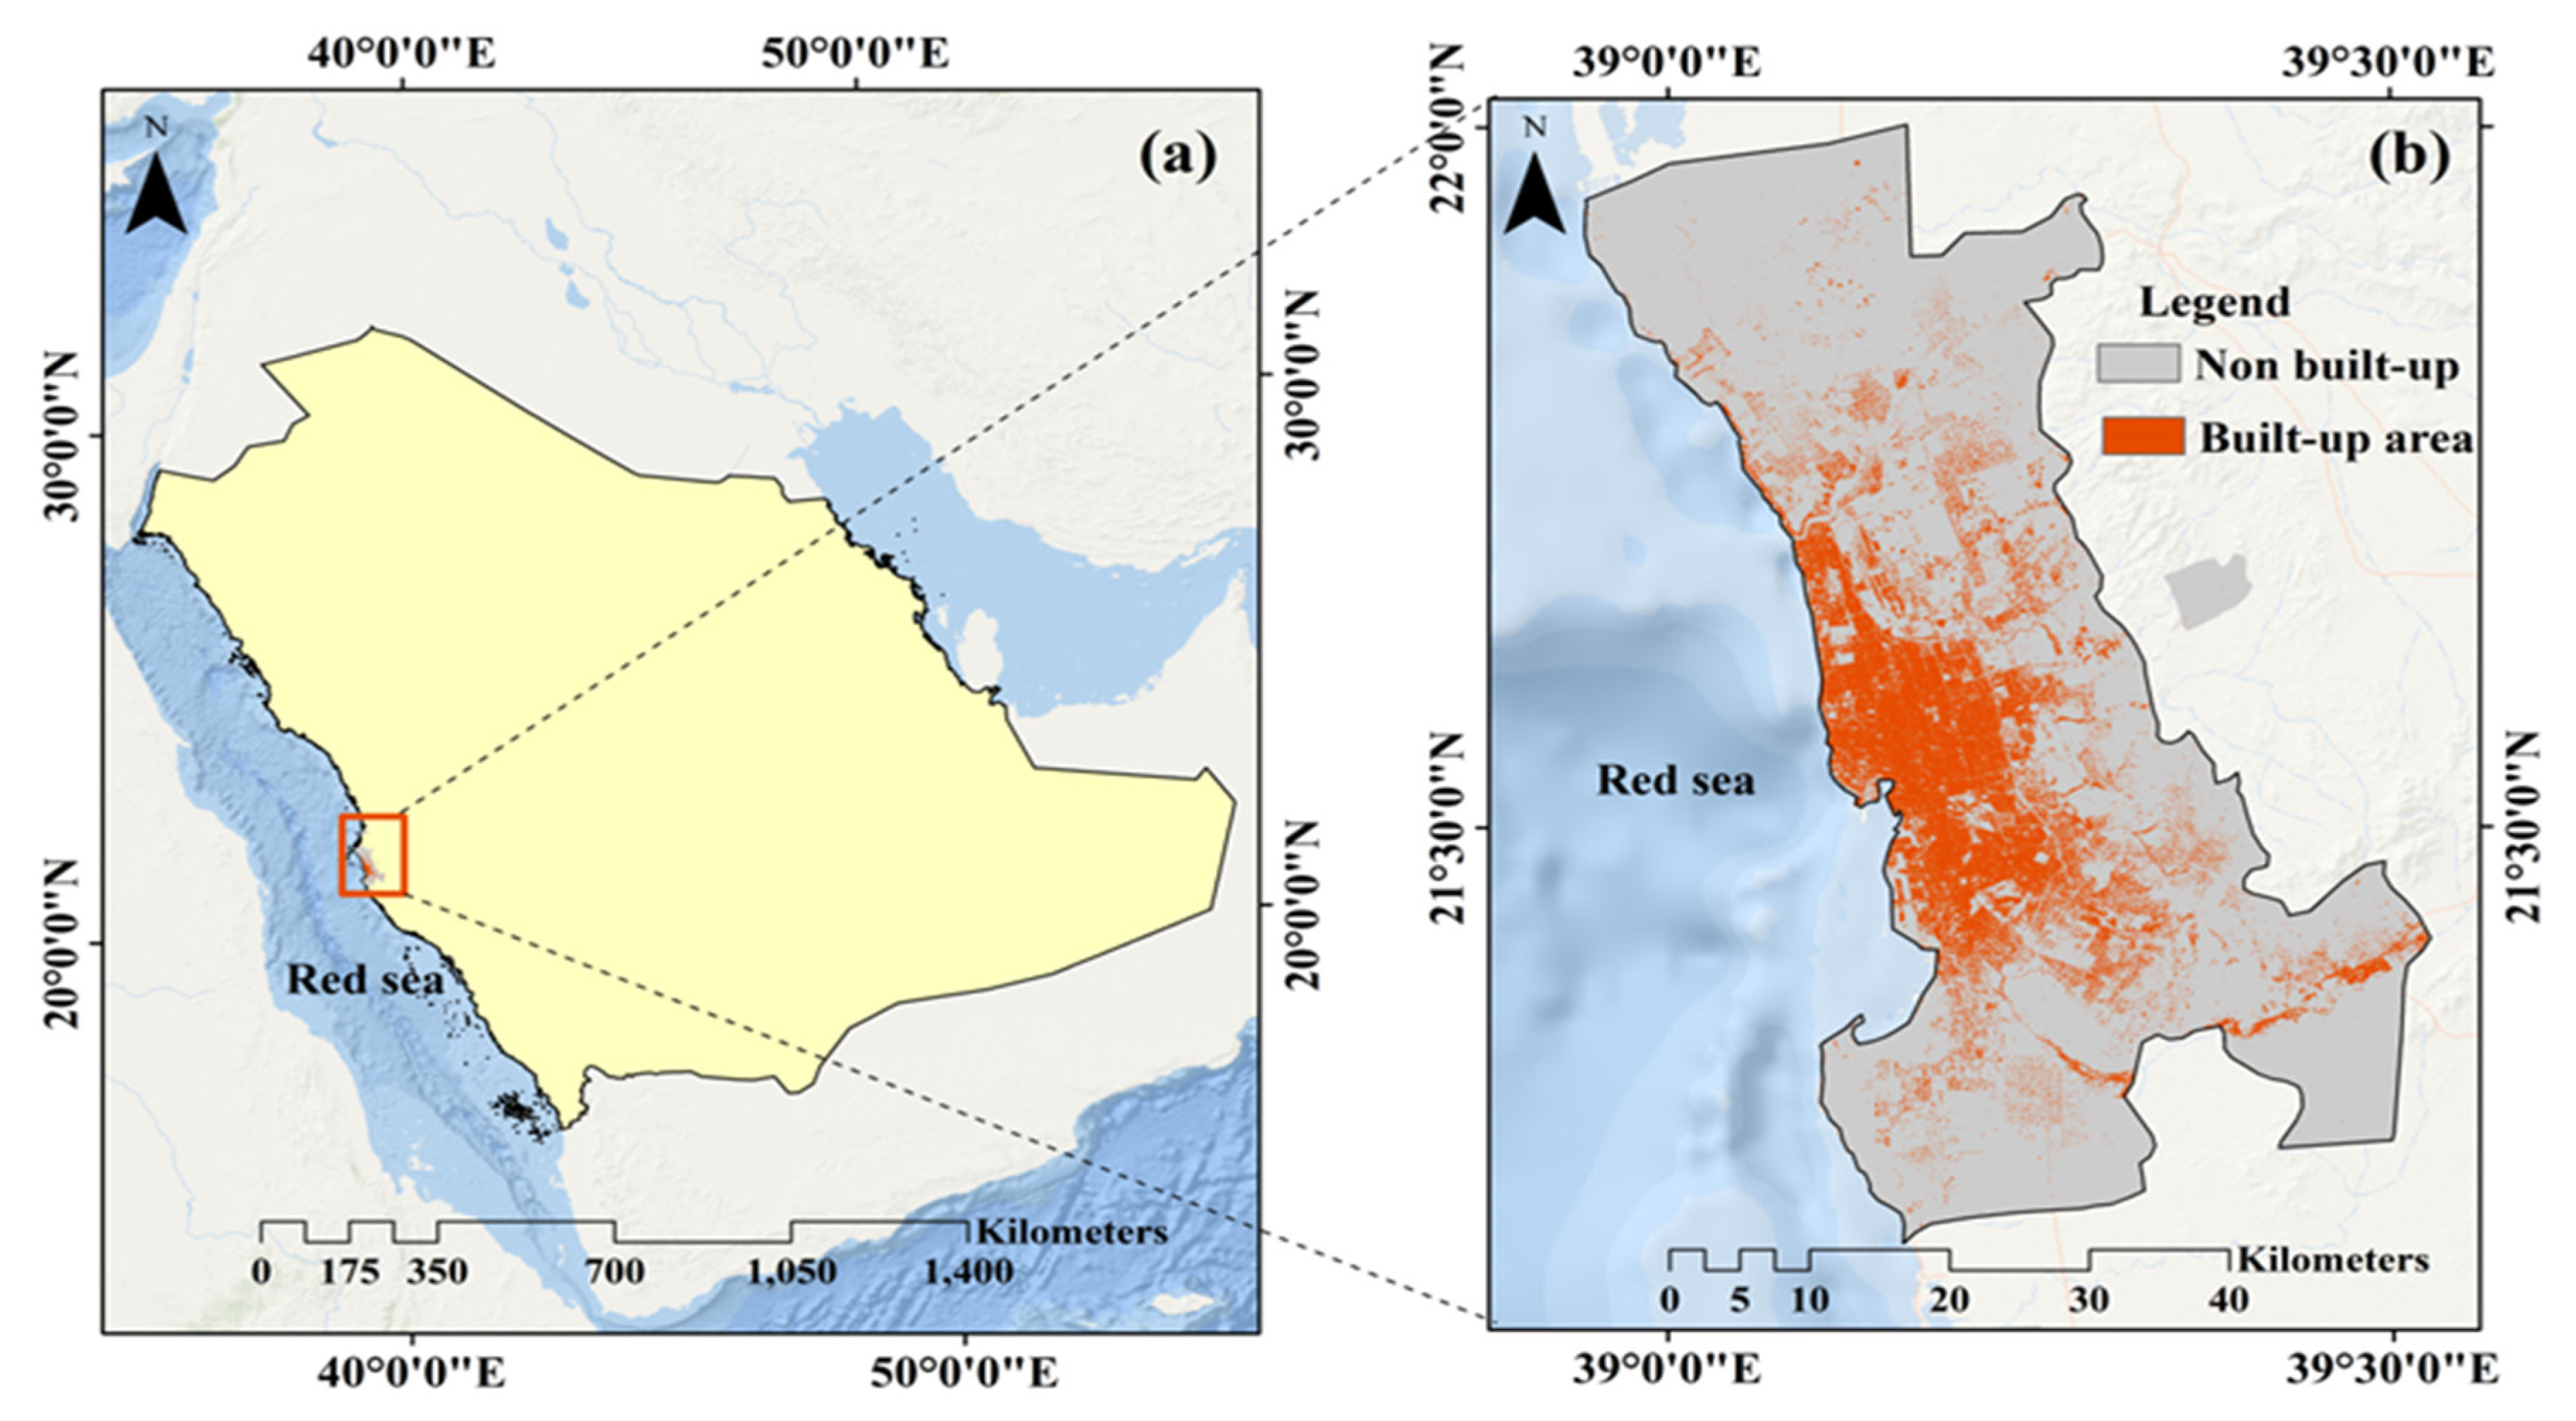
In Saudi Arabia, Jeddah is a populated city that is growing rapidly. It lies on the Red Sea shore and has grown quickly in the last 40 years. Jeddah was chosen for this investigation because of its interest in establishing a connection between LST and town biophysical indices. Jeddah, Saudi Arabia, is the country’s second-largest city on the Red Sea’s western coast. The population density in Jeddah is 5400 people/km2, and the city covers roughly 1600 km2. It is a dry, hot desert, and during the summer, its temperature rises to 40 °C. Approximately 45 mm of mean rainfall is recorded in the megacity.
3.2. Data Gathering Centers
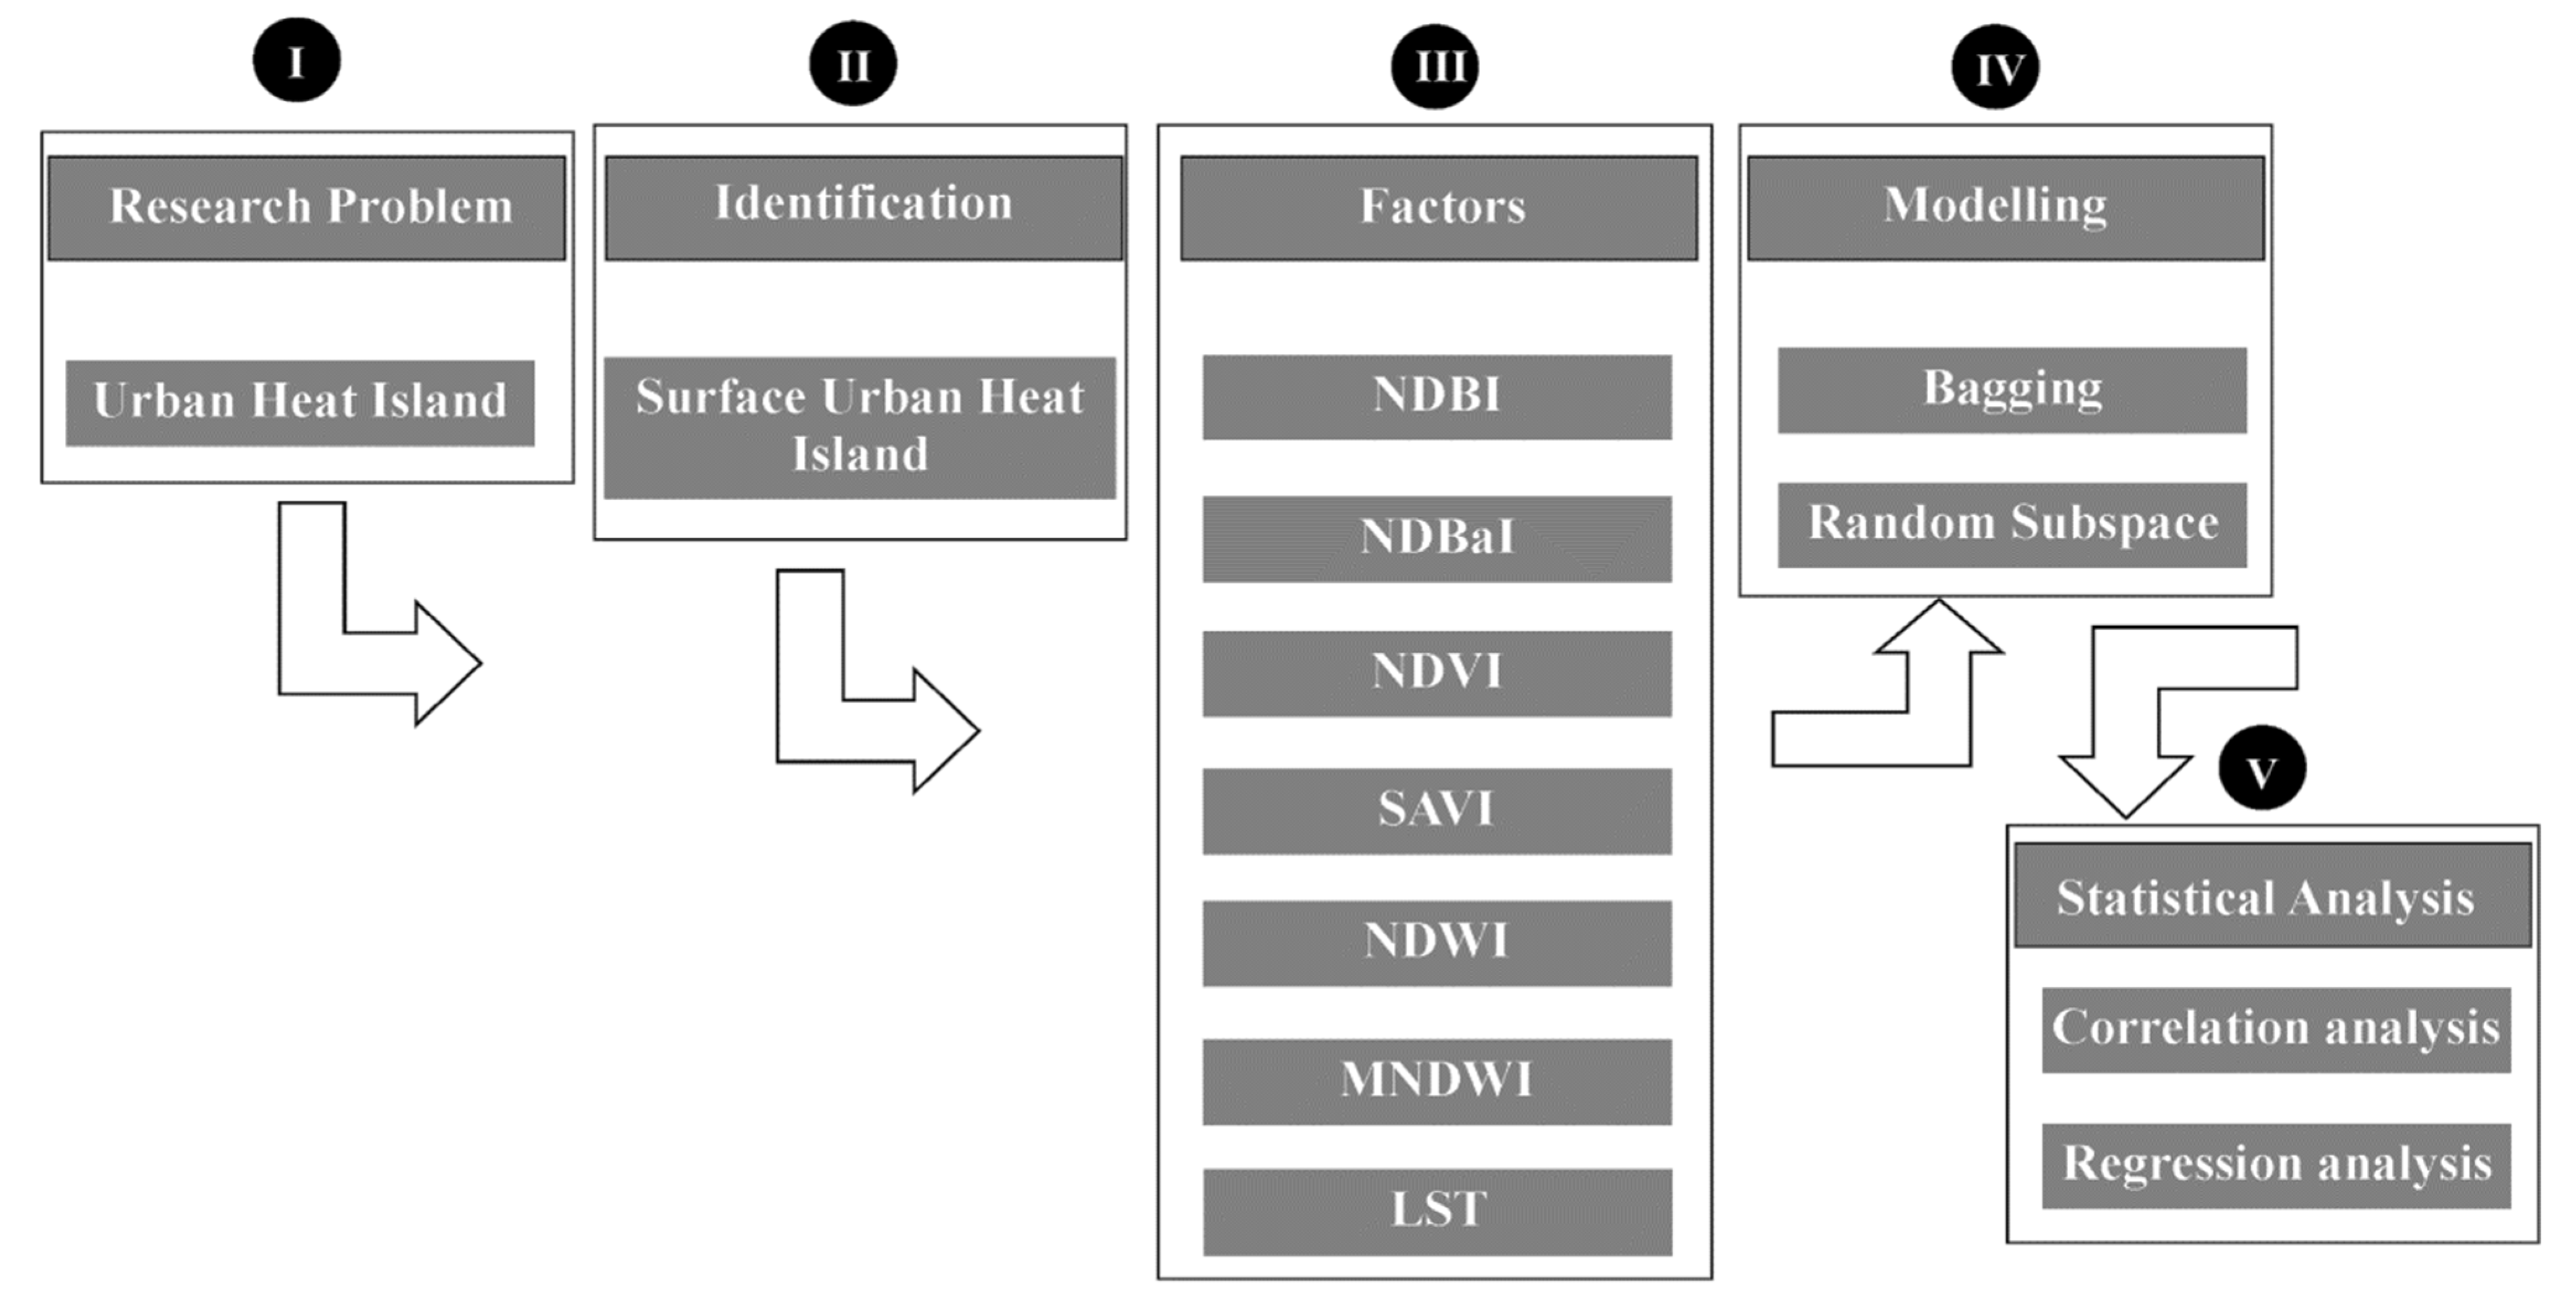
This research used multi-temporal satellite images to develop LUALC, SEV, and UHI maps. The United States geological survey (USGS) provides information to develop the LUALC maps for 2000, 2010, and 2022. There was usage of LANDSAT 5 TM images from 2000 and 2010, as well as LANDSAT 8 OLI imagery from 2021, as shown in Figure 1. The detail of the methodological framework is presented in Figure 2.
3.3. Estimation of UHI
Previous research has broadly used the UHI value to assess the UHI effect quantitatively. Many studies have been done in mapping and assessing UHI phenomena using machine learning (ML) algorithms [49,50,51,52,53,54,55,56]. The UHI value is calculated based on the LST for any area from which the UHI intensity can be estimated. A higher LST value indicates high UHI intensity and vice versa [23]. In many previous studies, the UHI value has been used to estimate the UHI effect, but its application in the hot desert climate areas remains limited. For example, Naim and Al Kafy [24] studied the association between UHI and LUALC in Chattogram City, Bangladesh. To calculate the UHI,
where refers to the LST, Tm refers to the mean LST, and SD refers to the standard deviation of the area.
We computed the urban heat island from the land surface temperature and extracted data from LANDSAT images. However, there are many reasons for increasing temperatures, such as solar radiation. However, in this work, we have tried to show the urban heat island pattern based on the remote sensing indices and the relationship with biophysical indices. In the city’s central part, the urban heat island effect is relatively lower, most likely due to water bodies, as the water bodies have an impact on the temperature. Due to the limitation of this work, we could not incorporate other data, such as solar radiation.
3.4. SEV Affecting UHI
The LST of any area is largely determined by the biophysical composition [23,25]. In urban areas, the spatial distribution of LST is not homogeneous but presents spatial heterogeneity. The spatial heterogeneity of the LST across a city typically varies due to variations in surface properties [26]. In previous pieces of literature, it has been well-recognized that the composition of the landscape, such as impervious surfaces, water bodies, and green spaces (vegetation cover), largely determines the spatial distribution of LST in cities [27]. Therefore, it is essential to incorporate the SEV as an independent factor affecting the UHI in an area. This study used seven SEVs as independent factors affecting UHI phenomena. These SEVs were broadly categorized into four groups: impervious surface (NDBI, NDBaI), vegetation (NDVI, SAVI), water (MNDWI, NDWI), and heat (LST). The details of the parameters are discussed below.
The parameters related to the impervious surfaces are very sensitive to UHI phenomena [22,28]. Areas with a high proportion of impervious surfaces are typically characterized by high UHI intensity [29,30]. Therefore, considering the imperviousness of surfaces is crucial to understanding the relationship between impervious surfaces and UHI intensity. This study utilized two popular indices—NDBI and NDBaI—to determine their impact on the UHI intensity. This study applied the below equations to calculate NDBI and NDBaI:
The mid-infrared band () refers to bands 5 and 6 for LANDSAT TM and OLI 8, while NIR refers to bands 4 and 5. values vary from −1 to +1, → 0 indicates the foliage cover, −ive water bodies, and +ive impermeable planes.
Regarding the vegetation cover, NDVI and SAVI were used to determine the impact on UHI intensity. These parameters have been widely used in the previous literature to observe the influence of vegetation cover on UHI intensity. It has been shown that low UHI intensity occurs in places with high vegetation cover and vice versa [31,32]. Recent studies have also found that vegetation cover has a significant cooling effect in urban areas [33,34]. Therefore, vegetation indices can be very helpful parameters for understanding the UHI intensity in a given area [22]. NDVI and SAVI were used as vegetation parameters, and these are calculated as follows:
LANDSAT TM and OLI 8 are the 5th and 6th bands. LANDSAT TM and OLI 8′s near-infrared and red bands are and , respectively.
Water bodies or blue spaces also significantly impact UHI intensity [35,36]. Previous research has shown that water bodies or blue spaces significantly reduce temperature [35]. Thus, areas with water coverage are characterized by low temperatures. In this study, we used two indices related to water bodies—NDWI and MNDWI—which are calculated as follows:
whereas (i.e., green band) relates to the 2nd and 3rd bands for LANDSAT 5 and OLI 8, corresponds to the 5th and 6th bands for LANDSAT TM and OLI 8, and corresponds to 4th and 5th bands for LANDSAT 5 and OLI 8.
LST is the strongest contributing issue affecting UHI intensity [21]. It is largely influenced by the configuration and composition of the land surface in any area. For example, the imperviousness of the surface is positively associated with LST, while vegetation and water bodies are negatively associated with LST [22]. Thus, alteration of the biophysical composition largely affects the LST [22]. Pockets with high LST in urban areas are characterized by high UHI intensity [37]. Thus, LST has been considered a dominant factor affecting UHI intensity [37]. According to Siddiqui et al. [38], LST can be extracted from the thermal bands of LANDSAT imageries.
Regarding LANDSAT 5 TM and LANDSAT 8 OLI, the 6th and 10th bands retrieve LST from image [23]. Some fundamental steps must be followed to excerpt LST from the thermal bands. These steps are discussed successively in the following.
The first step in retrieving the is to alter the digital number into radiance using the following equation:
where refers to the radiance from the sensor, refers to the maximum radiance from the thermal band, refers to the minimum radiance from the thermal band, refers to the calibrated DN values, and and are the maximum and minimum calibrated pixel values in the DN, respectively.
where and refer to the multiplicative and additive scaling factors, respectively, obtained from the band, and refers to the DN value. In the next step, the satellite temperature (T, in degrees Celsius) is calculated by applying the below equation:
where and refer to the calibration constants of the thermal bands.
Finally, the LST can be retrieved by the equation provided below:
where represents the wavelength of the emitted radiance, T represents the satellite’s temperature, and represents the emissivity evaluated:
where refers to the vegetation cover proportion, calculated as:
where and refer to the maximal and minimal normalized difference vegetation index values.
4. Results
4.1. Statistical Analysis
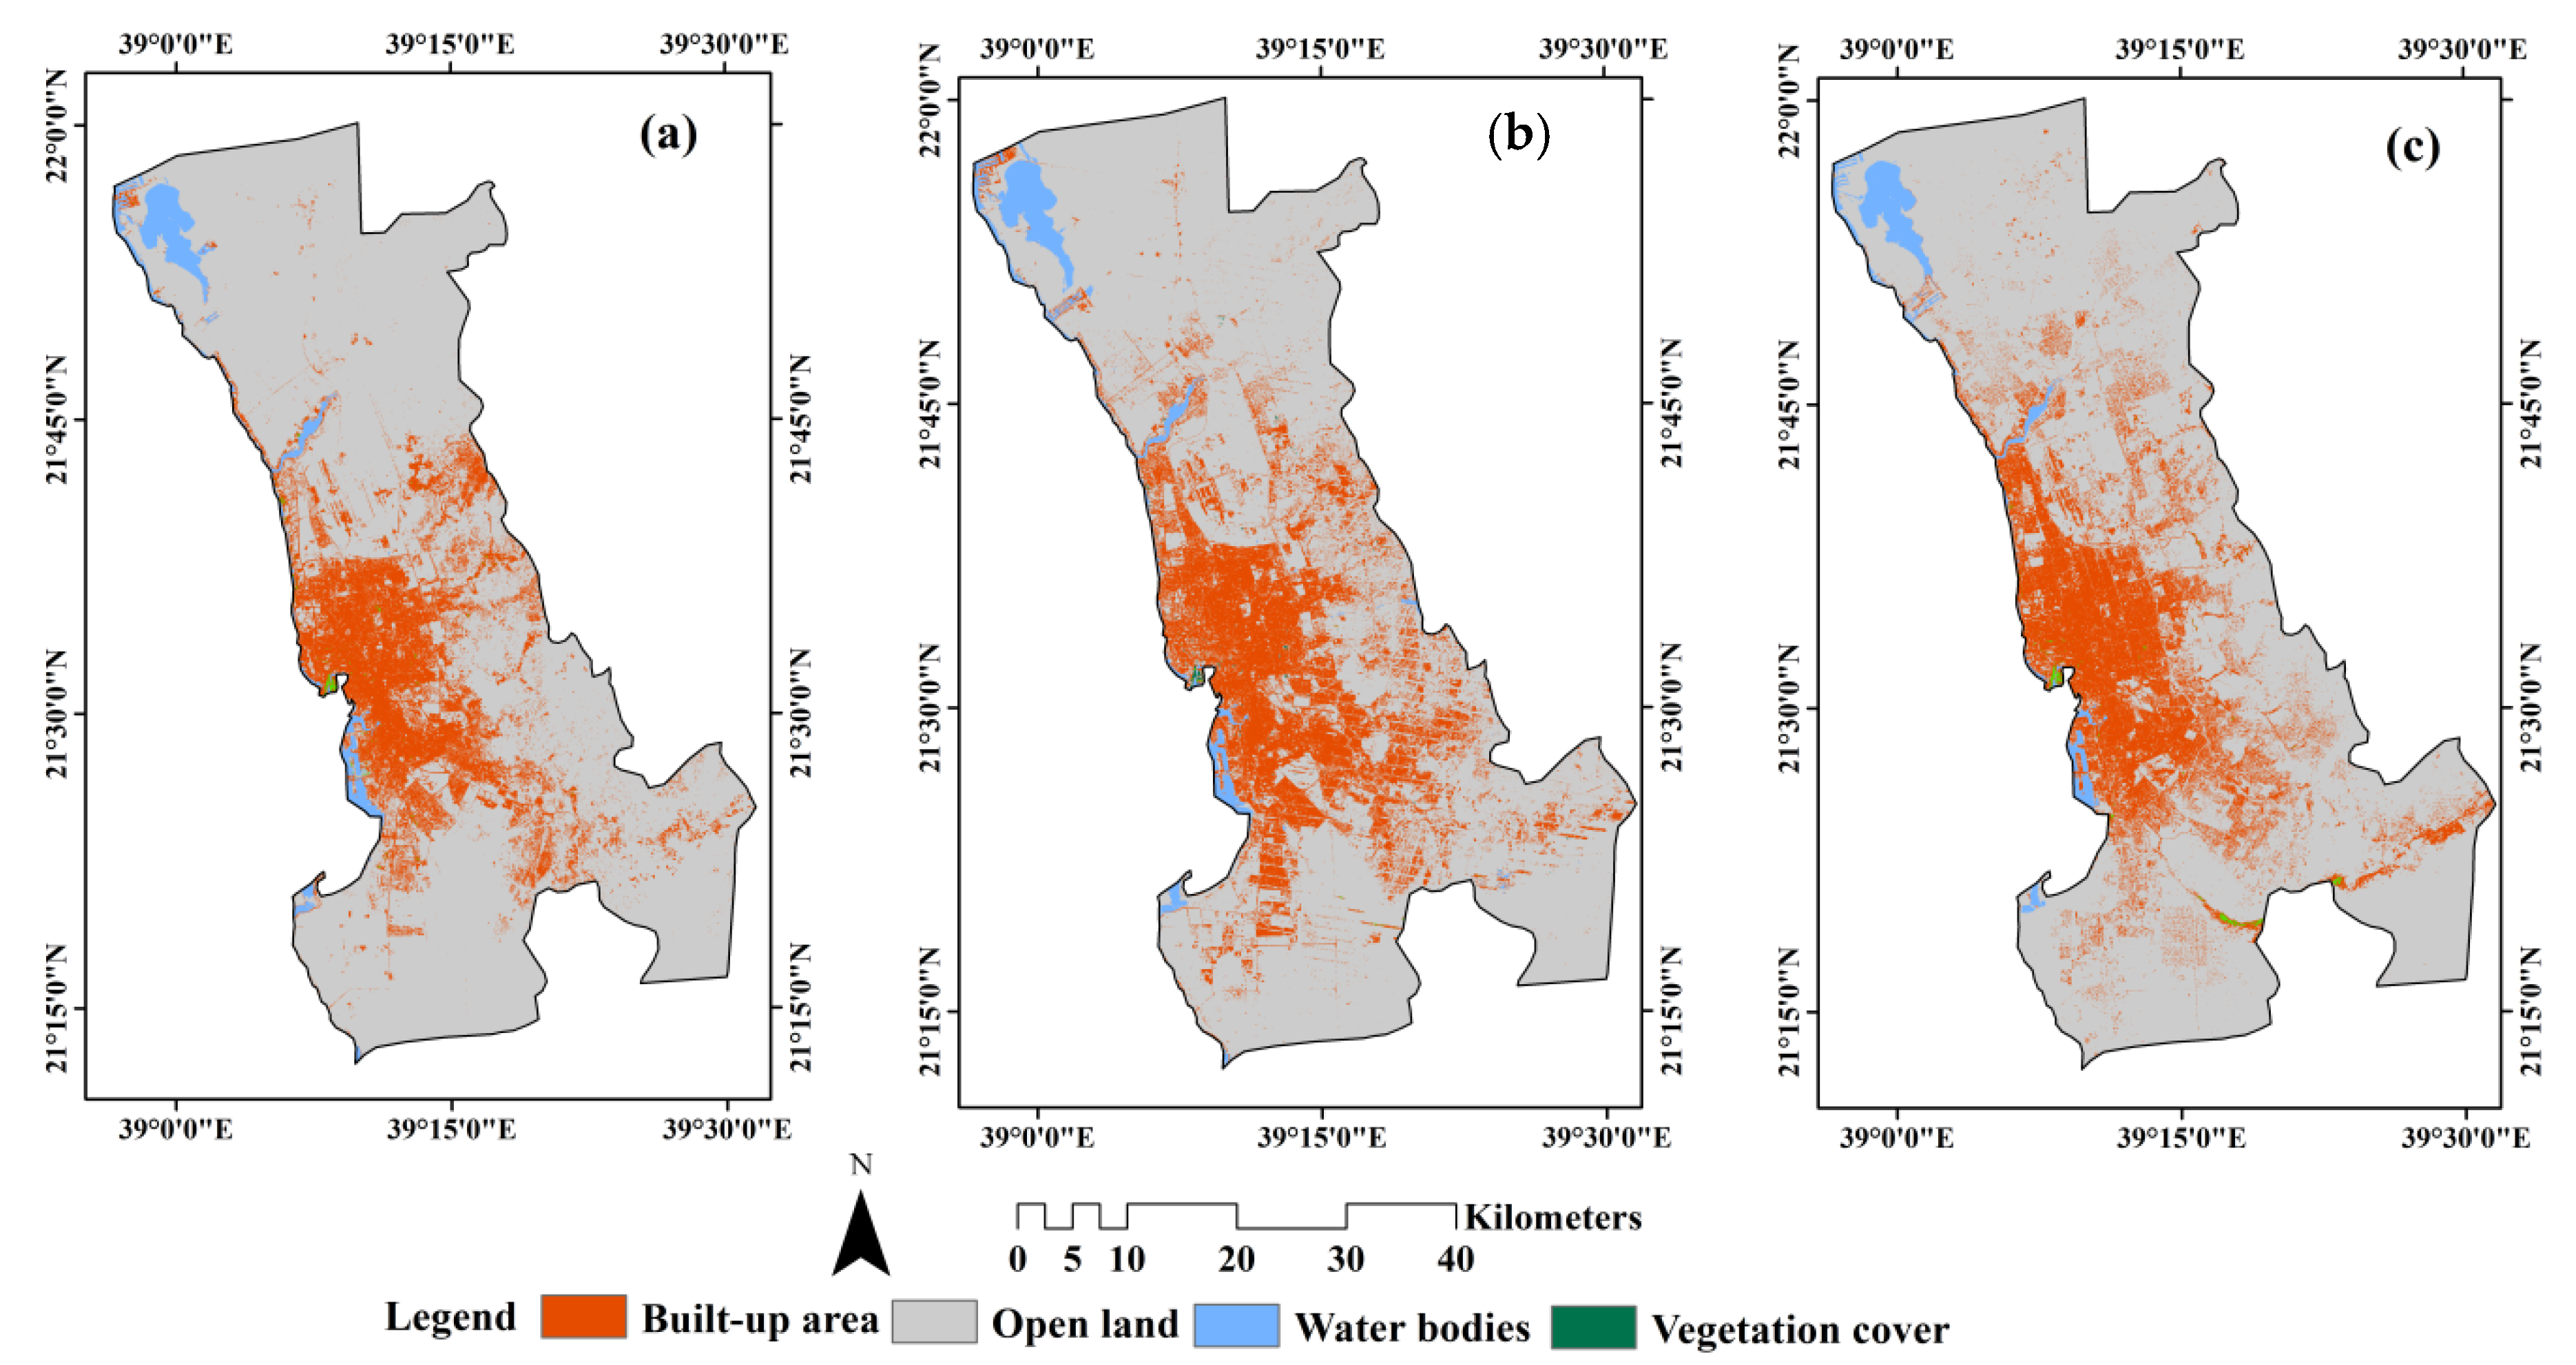
Several statistical analyses were conducted to ascertain the overall pattern of UHI in Jeddah. The Spearman correlation was applied to evaluate the relationship between UHI and SEV. The correlation was found to be noteworthy at the 0.01 level. Ordinary linear regression (OLR) was conducted to examine the impact of SEV on the UHI. Statistical Package for the Social Sciences (SPSS), version 22, performs the statistical analyses. LUALC maps for Jeddah are shown in Figure 3 and Table 1. It is noticed from the results that Jeddah experienced extensive LUALC changes from 2000 to 2021. For example, the developed area was 3085.64 [h] in 2000, augmented by 5557.98 [h] in 2021. This is a growth of about 80% in 20 years. From 2000 to 2021, vegetation grew from 26.23 [h] to 34.66 [h], a 32% rise. Open or bare land from 2000 to 2021 decreased from 18,191.44 [h] to 15,782.32 [h] (reducing by about 30%). The results also indicate that water bodies declined from 653.51 [h] to 578.46 [h] (dropping by about 12%), as shown in Figure 3.
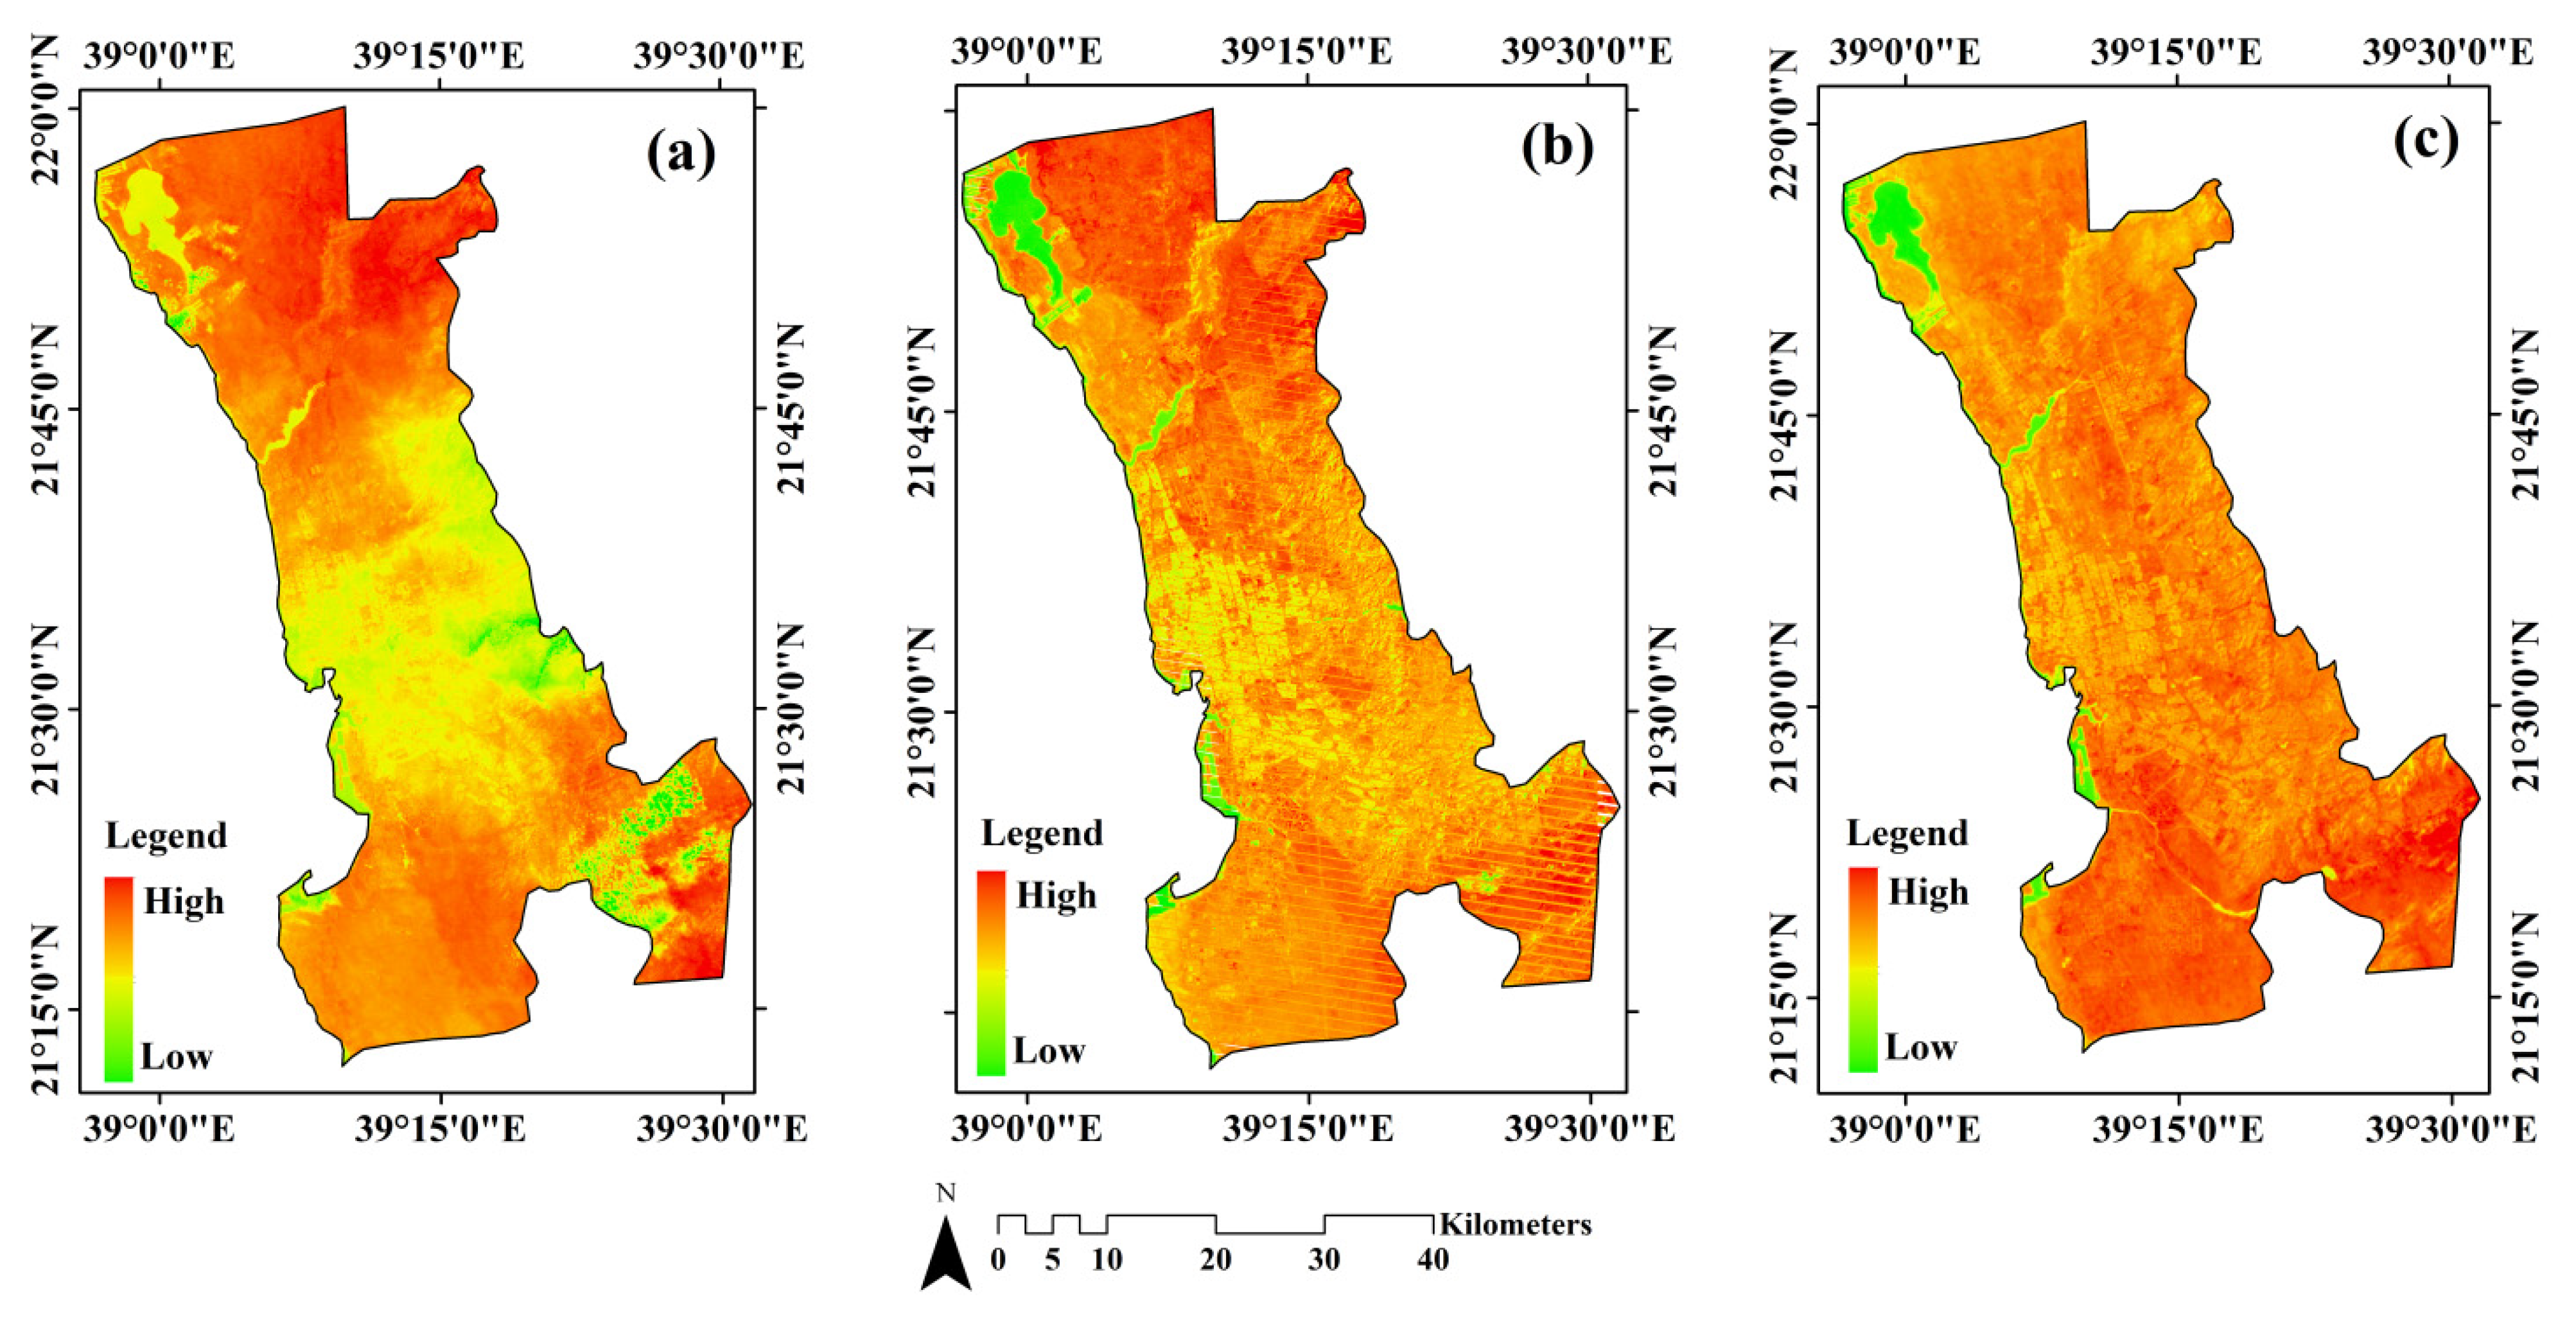
The LST statistics for the years 2000, 2010, and 2021 for Jeddah are provided in Table 2. The results signpost that the mean LST in 2000 was 31.85 °C, increasing to 32.45 °C in 2010 and 34.5 °C in 2021, as shown in Figure 4. From 2000 to 2021, the mean LST increased by about 8.32%. The maximum LST in 2000 was 38.47 °C, while that in 2021 reached 42.4 °C. Thus, the maximum LST in Jeddah has increased by about 10.22% in the last 22 years. Figure 4 displays the LST spatial maps for Jeddah. In particular, the northern, central-eastern, and southern areas of Jeddah are characterized by very high LST, as seen from the maps.
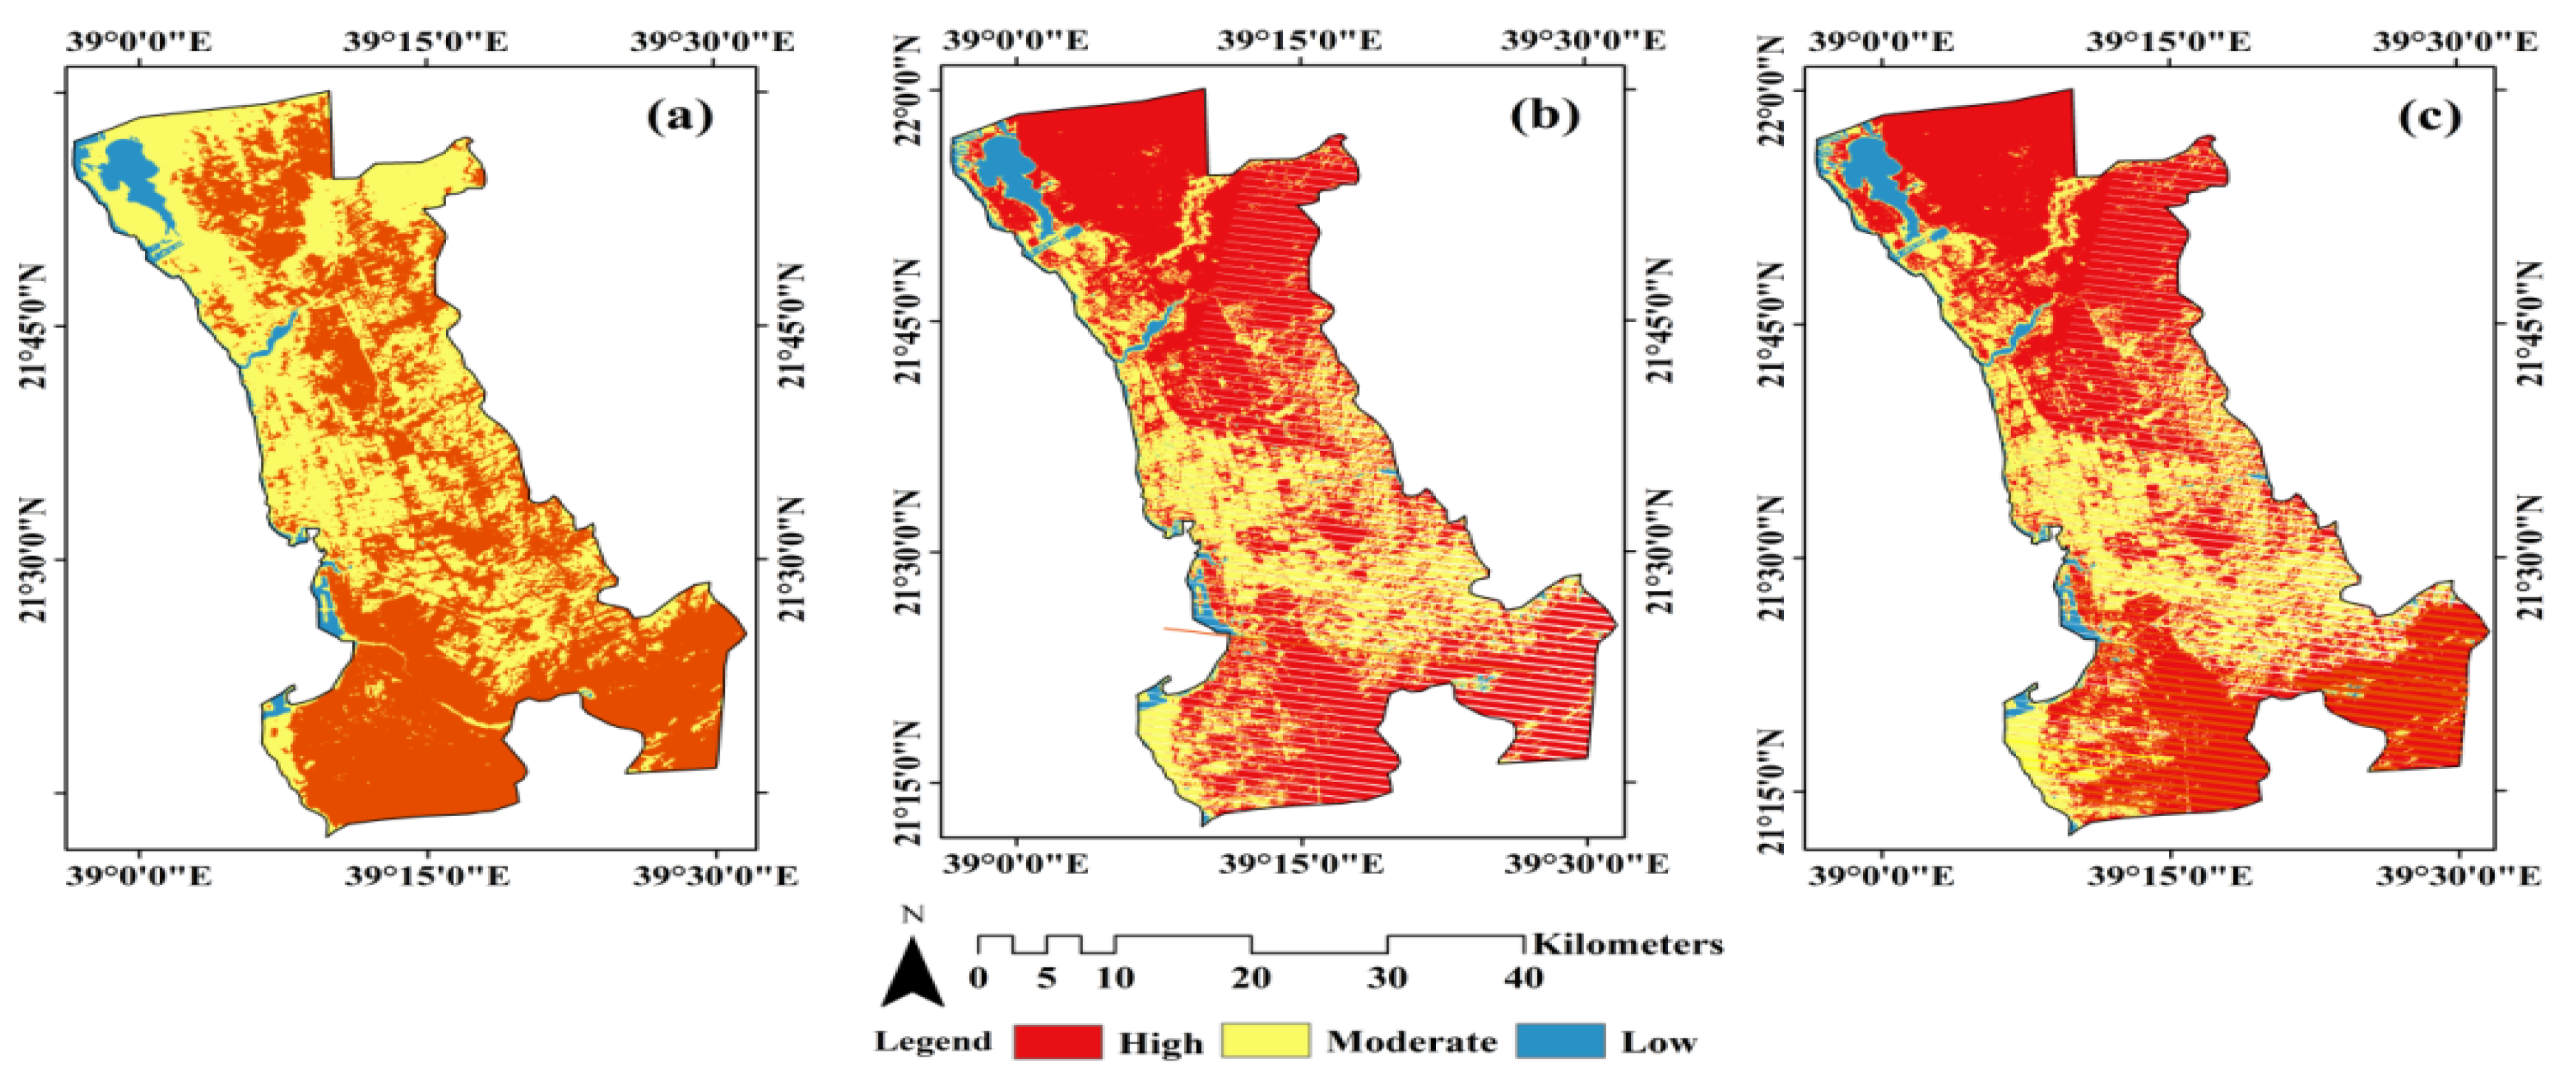
Figure 5 shows the UHI maps for Jeddah in 2000, 2010, and 2021. The UHI maps are classified into low, moderate, and high. The results showed that the areas characterized by high UHI values increased from 2000 to 2021. In 2000, 40.31% of the total area was under high UHI values, which increased to 45.27% by 2021. However, the areas with low UHI values declined (about 15.73%) from 2000 to 2021.
4.2. Impact of SEV on UHI
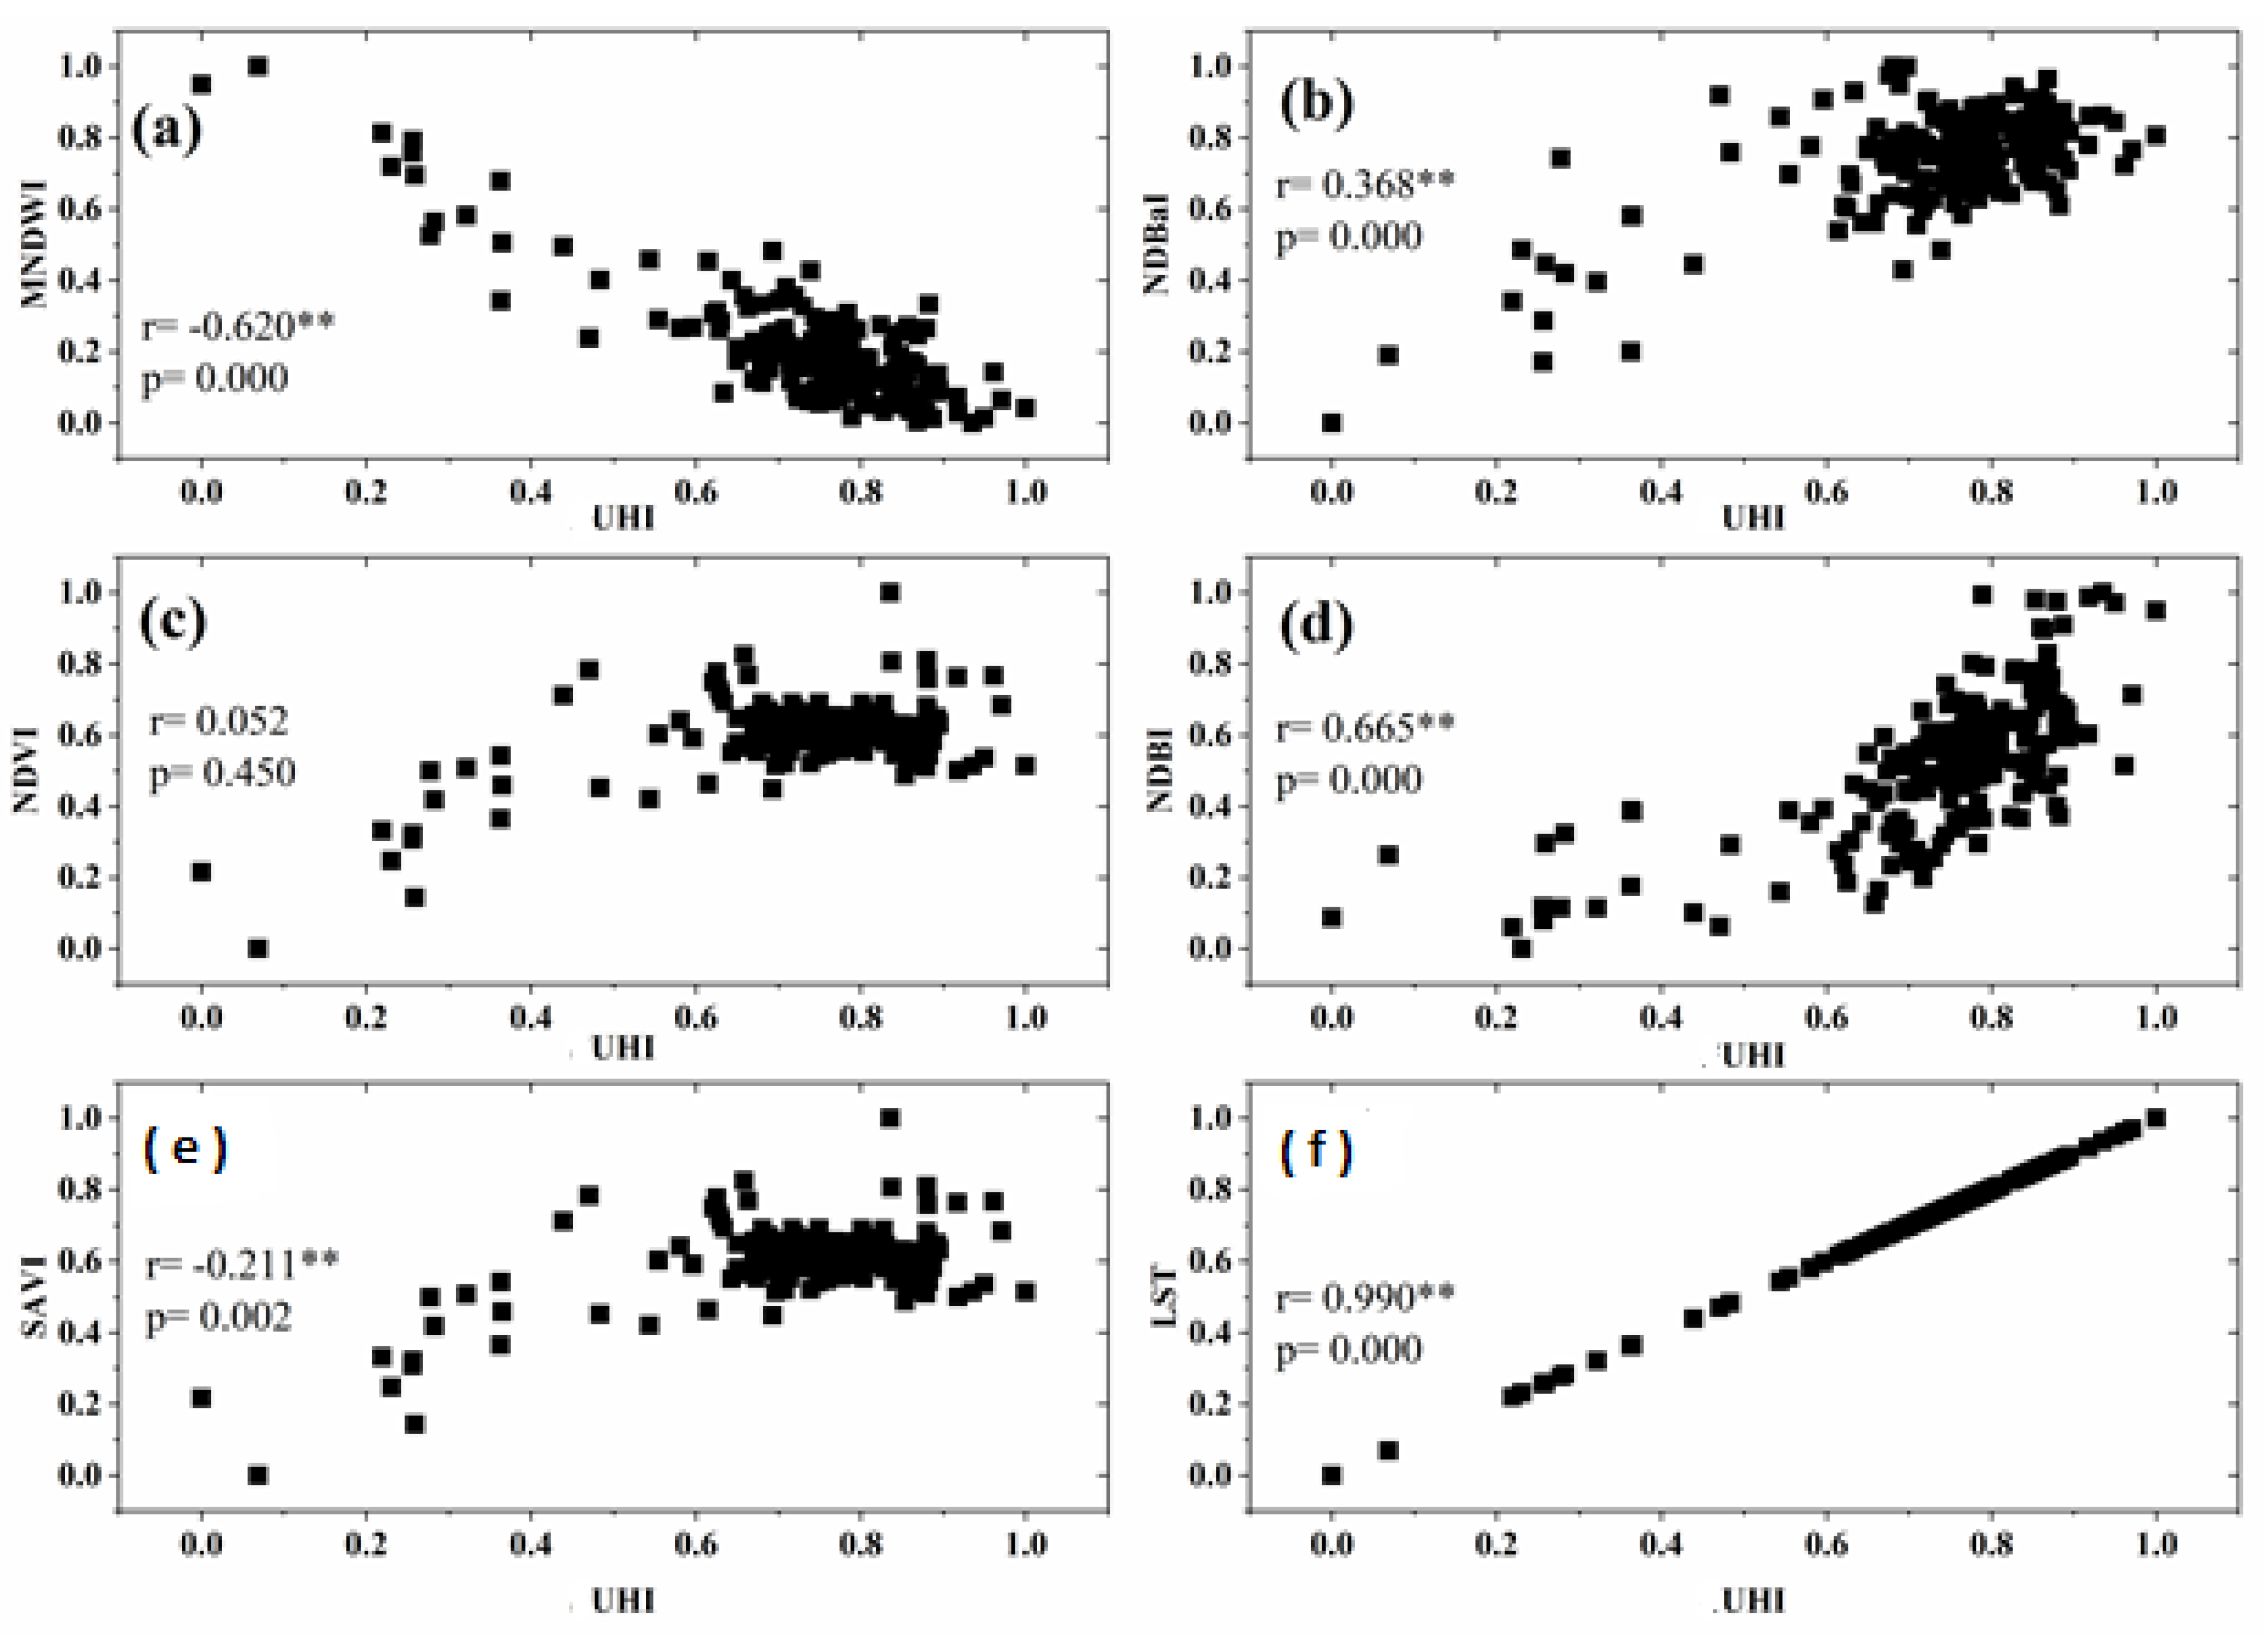
Spearman’s correlation analysis was applied to determine the association between UHI values given in Table 3 and socio-ecological variables (SEVs), as shown in Figure 6a–f. The result makes it easy to determine the correlation between the temperature surface values and the UHI. Figure 6f shows that the LST had very strong positive correlations with UHI and Figure 6b,d shows that NDBI and NDBaI have positive parameter values. However, Figure 6a shows that UHI had strong negative correlations with MNDWI. Figure 6c,e shows that NDVI and SAVI had very weak correlations with UHI. As per the regression model, it was found that the value was 0.763, indicating that this model can be accepted to explain the impact of the SEVs on the UHI.
4.3. Modeling the UHI Based on Bagging and Random Subspace
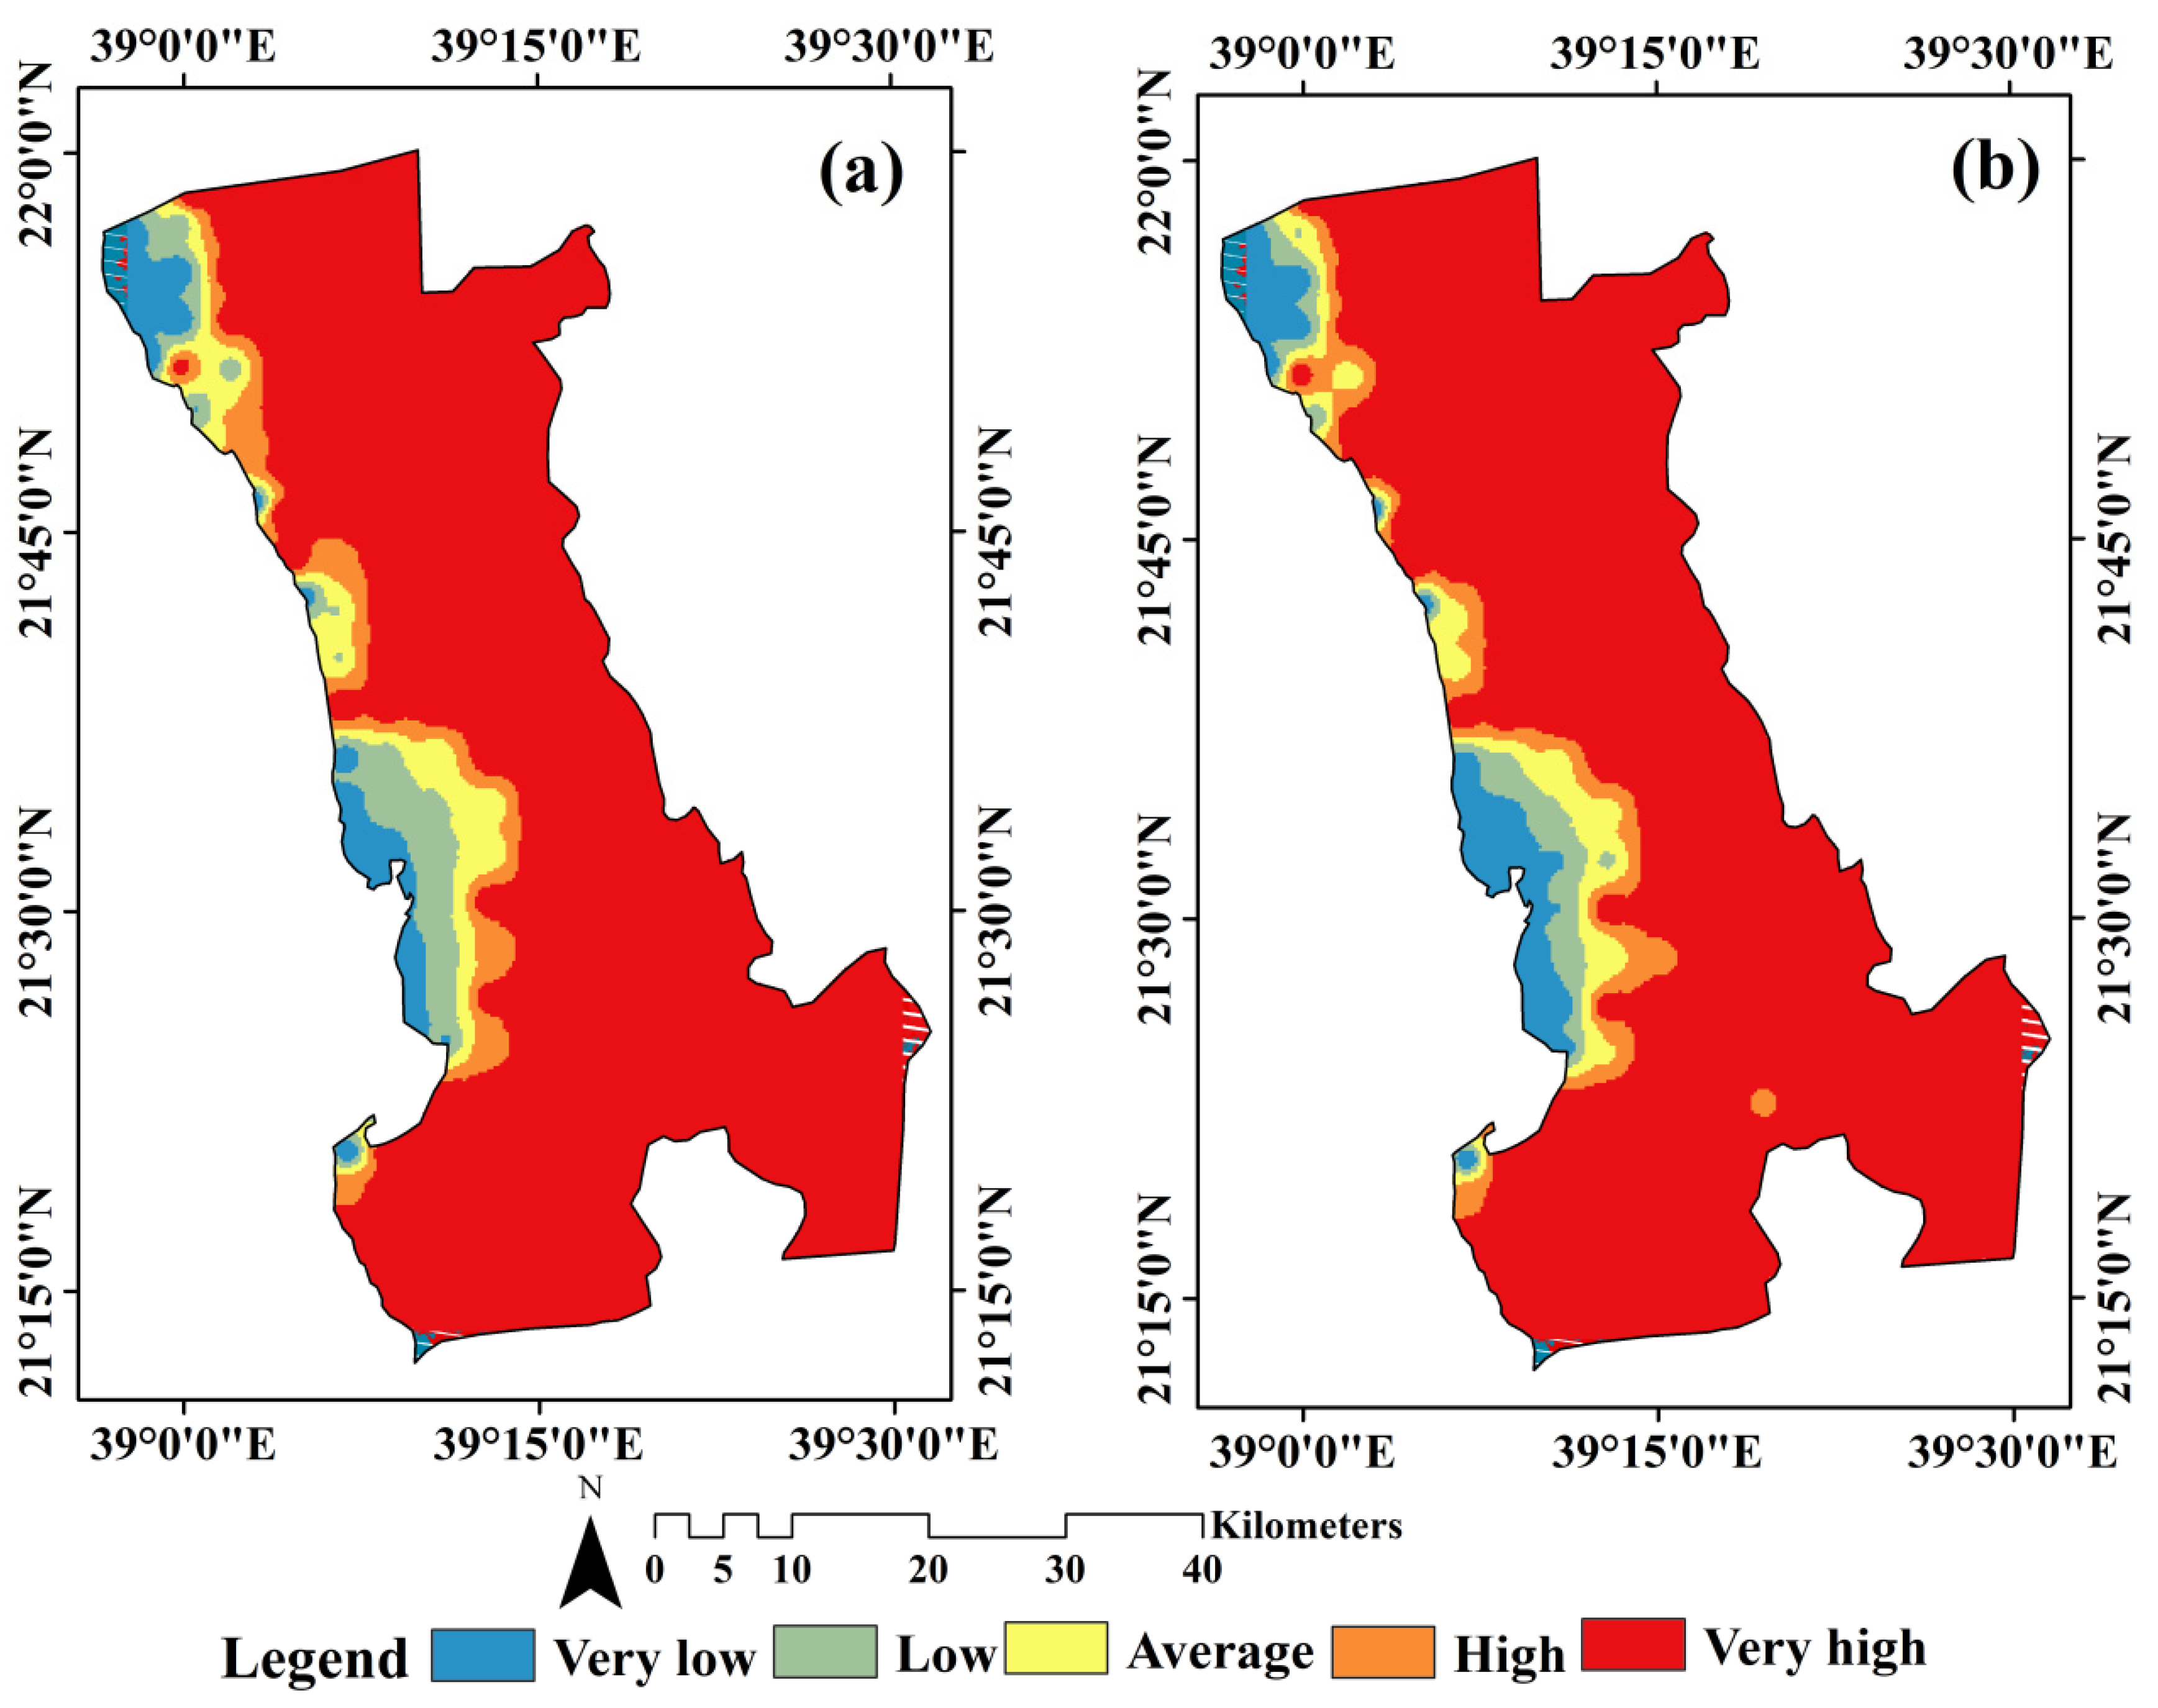
The spatial distributions proposed by the bagging and random subspace models are presented in Figure 7. We found that large and very large UHI values characterized the south, north, and central-east parts of Jeddah. However, the city’s west and central-west parts were characterized by low UHI values. As per the bagging model, it was observed that 5.11% and 82.32% of the megacity were characterized by high and very high UHI values, and 3.32% and 4.82% were under low and very low UHI values, respectively. The random subspace model indicated that 5.24% and 81.68% of the areas were under high and very high UHI values. The areas with low and very low UHI values comprised 3.49% and 4.75%, respectively (Table 4).
5. Discussion
UHI impacts have been linked to the rise in population caused by fast urbanization. [57]. The transformation of the natural landscape into impervious surface areas and the rapid increase in impervious surfaces have enhanced the UHI intensity in cities [57]. In the previous literature, it has been documented that the uplift in the impervious surface area in a city is the crucial factor affecting UHI intensity [22]. In the megacity of Jeddah, impervious surface areas had high UHI intensity, while water-covered areas had low UHI intensity, showing that landscape composition and configuration largely determine UHI intensity. According to research by [57] in Shanghai, China, construction lands had higher UHI intensity than water bodies and green grounds. Authors in [58] researched China and reported that spatial variations in UHI are largely affected by the spatial complexity of built-up areas.
According to [18], the mean LST of impervious surfaces was 3 °C higher than green areas, so the LST significantly correlated with impervious surfaces. This finding was similar to that observed in this study. A study conducted by [4,14] in Shanghai (China) found that LST was affected by landscape patterns and anthropogenic activities. The correlation analysis found that impervious surface areas positively influenced UHI intensity, while vegetation and water indices negatively influenced UHI intensity. The findings of this study were similar to those of various previous research. An author in [57] researched Hangzhou, China, and discovered that impervious surfaces increase the UHI, while vegetation and water bodies decrease it. Therefore, sustainable landscape planning is necessary to mitigate the UHI intensity in cities, particularly in hot desert areas.
Cities have experienced dramatic increases in LST in the past [22,58]. Therefore, effective actions must be implemented to mitigate UHI effects in such cities. Various measures have been suggested in the previous literature to mitigate UHI phenomena, such as urban greening (e.g., development of green roofs and green facades), building design, and changes in building materials [59,60]. In the previous studies, three stakeholder groups/actions have been considered significant in mitigating the UHI effect in cities: government and political engagement at the local and national levels, city planners and city administrations, and public participation [61,62,63]. Furthermore, private sectors play significant roles, as these are built privately.
6. Conclusions
The effect of UHI was modeled and assessed in Jeddah, a megacity under a hot desert climate in Saudi Arabia, via two widely used machine learning approaches—bagging and random subspace. A few notable research findings were captured from the study results. There was a dramatic upsurge in built-up areas in Jeddah from 2000 to 2021. Over the 22 years, there has been an uplift in the urban areas and vegetation cover by 80% and 32%. No previous work has been done in this regard to show the effect of UHI. Secondly, from 2000 to 2021, the LST in Jeddah increased by 10.22% (from 38.47 °C to 42.4 °C). Third, the UHI in the “very high” category increased in Jeddah from 2000 to 2022. The correlation results indicate that impervious surfaces positively affect the UHI, while vegetation and water cover negatively impact the UHI. No such analysis is found in the previous work. As per the bagging and random subspace models, we found that more than 80% of the total area was identified as having very high UHI values. It is projected that the findings of the study will be of great assistance in the process of formulating methods to mitigate UHI exploiting the ML. Statistical analysis and a complete simulation highlighted the presented research’s importance in mapping and evaluating the UHI. The importance of various surface temperature parameters is studied, and the correlation concerning each parameter is investigated. The presented research proposed a quantitative and qualitative analysis with a computational-intensive ML approach.
Funding
Deputyship for Research and Innovation, Ministry of Education, in Saudi Arabia, for funding this research through project number: IF2/PSAU/2022/03/21915.
Data Availability Statement
Not applicable.
Conflicts of Interest
The author declares no conflict of interest.
References
- Sun, L.; Chen, J.; Li, Q.; Huang, D. Dramatic uneven urbanization of large cities throughout the world in recent decades. Nat. Commun. 2020, 11, 5366. [Google Scholar] [CrossRef] [PubMed]
- Pickett, S.T.; Cadenasso, M.L.; Grove, J.M.; Boone, C.G.; Groffman, P.M.; Irwin, E.; Warren, P. Urban ecological systems: Scientific foundations and a decade of progress. J. Environ. Manag. 2011, 92, 331–362. [Google Scholar] [CrossRef] [PubMed]
- Gaur, A.; Eichenbaum, M.K.; Simonovic, S.P. Analysis and modelling of surface Urban Heat Island in 20 Canadian cities under climate and land-cover change. J. Environ. Manag. 2018, 206, 145–157. [Google Scholar] [CrossRef] [PubMed]
- Li, F.; Liu, H.; Huisingh, D.; Wang, Y.; Wang, R. Shifting to healthier cities with improved urban ecological infrastructure: From the perspectives of planning, implementation, governance and engineering. J. Clean. Prod. 2017, 163, S1–S11. [Google Scholar] [CrossRef]
- Berardi, U.; Jafarpur, P. Assessing the impact of climate change on building heating and cooling energy demand in Canada. Renew. Sustain. Energy Rev. 2020, 121, 109681. [Google Scholar] [CrossRef]
- Celik, B.; Kaya, S.; Alganci, U.; Seker, D.Z. Assessment of the relationship between land use/cover changes and land surface temperatures: A case study of thermal remote sensing. FEB Fresenius Environ. Bull. 2019, 3, 541. [Google Scholar]
- Akbari, H.; Cartalis, C.; Kolokotsa, D.; Muscio, A.; Pisello, A.L.; Rossi, F.; Zinzi, M. Local climate change and urban heat island mitigation techniques–the state of the art. J. Civ. Eng. Manag. 2016, 22, 1–16. [Google Scholar] [CrossRef]
- Huang, Q.; Huang, J.; Yang, X.; Fang, C.; Liang, Y. Quantifying the seasonal contribution of coupling urban land use types on Urban Heat Island using Land Contribution Index: A case study in Wuhan, China. Sustain. Cities Soc. 2019, 44, 666–675. [Google Scholar] [CrossRef]
- Peng, X.; Zhou, Y.; Fu, X.; Xu, J. Study on the spatial-temporal pattern and evolution of surface urban heat island in 180 shrinking cities in China. Sustain. Cities Soc. 2022, 84, 104018. [Google Scholar] [CrossRef]
- Karakuş, C.B. The impact of land use/land cover (LULC) changes on land surface temperature in Sivas City Center and its surroundings and assessment of Urban Heat Island. Asia-Pac. J. Atmos. Sci. 2019, 55, 669–684. [Google Scholar] [CrossRef]
- Sun, X.; Xu, W. Deep random subspace learning: A spatial-temporal modeling approach for air quality prediction. Atmosphere 2019, 10, 560. [Google Scholar] [CrossRef]
- Jia, J.; Liu, S.; Zhao, S.; Li, Y.; Zhang, Q.; Tang, W. Influences of landscape composition and configuration on land surface temperature in Wuhan, a” furnace” city in China. In AGU Fall Meeting Abstracts; American Geophysical Union: Washington, DC, USA, 2020; p. GC006–0001. [Google Scholar]
- Du, H.; Ai, J.; Cai, Y.; Jiang, H.; Liu, P. Combined effects of the surface urban heat island with landscape composition and configuration based on remote sensing: A case study of Shanghai, China. Sustainability 2019, 11, 2890. [Google Scholar] [CrossRef]
- Li, W.; Cao, Q.; Lang, K.; Wu, J. Linking potential heat source and sink to urban heat island: Heterogeneous effects of landscape pattern on land surface temperature. Sci. Total Environ. 2017, 586, 457–465. [Google Scholar] [CrossRef]
- Wu, Y.; Li, S.; Yu, S. Monitoring urban expansion and its effects on land use and land cover changes in Guangzhou city, China. Environ. Monit. Assess. 2016, 188, 54. [Google Scholar] [CrossRef]
- Harmay, N.S.M.; Kim, D.; Choi, M. Urban heat island associated with land use/land cover and climate variations in Melbourne, Australia. Sustain. Cities Soc. 2021, 69, 102861. [Google Scholar] [CrossRef]
- Kalnay, E.; Cai, M. Impact of urbanization and land-use change on climate. Nature 2003, 423, 528–531. [Google Scholar] [CrossRef]
- Estoque, R.C.; Murayama, Y.; Myint, S.W. Effects of landscape composition and pattern on land surface temperature: An urban heat island study in the megacities of Southeast Asia. Sci. Total Environ. 2017, 577, 349–359. [Google Scholar] [CrossRef]
- Imhoff, M.L.; Zhang, P.; Wolfe, R.E.; Bounoua, L. Remote sensing of the urban heat island effect across biomes in the continental USA. Remote Sens. Environ. 2010, 114, 504–513. [Google Scholar] [CrossRef]
- Kikon, N.; Singh, P.; Singh, S.K.; Vyas, A. Assessment of urban heat islands (UHI) of Noida City, India using multi-temporal satellite data. Sustain. Cities Soc. 2016, 22, 19–28. [Google Scholar] [CrossRef]
- Bokaie, M.; Zarkesh, M.K.; Arasteh, P.D.; Hosseini, A. Assessment of urban heat island based on the relationship between land surface temperature and land use/land cover in Tehran. Sustain. Cities Soc. 2016, 23, 94–104. [Google Scholar] [CrossRef]
- Zhang, X.; Estoque, R.C.; Murayama, Y. An urban heat island study in Nanchang City, China based on land surface temperature and social-ecological variables. Sustain. Cities Soc. 2017, 32, 557–568. [Google Scholar] [CrossRef]
- Al Kafy, A.; Al Rakib, A.; Akter, K.S.; Rahaman, Z.A.; Jahir, D.M.; Subramanyam, G.; Michel, O.O.; Bhatt, A. The operational role of remote sensing in assessing and predicting land use/land cover and seasonal land surface temperature using machine learning algorithms in Rajshahi, Bangladesh. Appl. Geomat. 2021, 13, 793–816. [Google Scholar] [CrossRef]
- Chen, G.; Shi, Y.; Wang, R.; Ren, C.; Ng, E.; Fang, X.; Ren, Z. Integrating weather observations and local-climate-zone-based landscape patterns for regional hourly air temperature mapping using machine learning. Sci. Total Environ. 2022, 841, 156737. [Google Scholar] [CrossRef] [PubMed]
- Lan, T.; Peng, J.; Liu, Y.; Zhao, Y.; Dong, J.; Jiang, S.; Cheng, X.; Corcoran, J. The future of China’s urban heat island effects: A machine learning based scenario analysis on climatic-socioeconomic policies. Urban Clim. 2023, 49, 101463. [Google Scholar] [CrossRef]
- Li, F.; Yigitcanlar, T.; Nepal, M.; Nguyen, K.; Dur, F. Machine Learning and Remote Sensing Integration for Leveraging Urban Sustainability: A Review and Framework. Sustain. Cities Soc. 2023, 96, 104653. [Google Scholar] [CrossRef]
- Liu, S.; Zhang, J.; Li, J.; Li, Y.; Zhang, J.; Wu, X. Simulating and mitigating extreme urban heat island effects in a factory area based on machine learning. Build. Environ. 2021, 202, 108051. [Google Scholar] [CrossRef]
- Mohammad, P.; Goswami, A.; Chauhan, S.; Nayak, S. Machine learning algorithm based prediction of land use land cover and land surface temperature changes to characterize the surface urban heat island phenomena over Ahmedabad city, India. Urban Clim. 2022, 42, 101116. [Google Scholar] [CrossRef]
- Shi, H.; Xian, G.; Auch, R.; Gallo, K.; Zhou, Q. Urban Heat Island and its regional impacts using remotely sensed thermal data—A review of recent developments and methodology. Land 2021, 10, 867. [Google Scholar] [CrossRef]
- Wang, R. Application of Machine Learning in Prediction of Urban Heat Island. In Digital Analysis of Urban Structure and Its Environment Implication Singapore; Springer Nature: Singapore, 2022; pp. 171–206. [Google Scholar]
- Guo, G.; Wu, Z.; Xiao, R.; Chen, Y.; Liu, X.; Zhang, X. Impacts of urban biophysical composition on land surface temperature in urban heat island clusters. Landsc. Urban Plan. 2015, 135, 1–10. [Google Scholar] [CrossRef]
- Naim, M.N.H.; Kafy, A.A. Assessment of urban thermal field variance index and defining the relationship between land cover and surface temperature in Chattogram city: A remote sensing and statistical approach. Environ. Chall. 2021, 4, 100107. [Google Scholar] [CrossRef]
- Sannigrahi, S.; Bhatt, S.; Rahmat, S.; Uniyal, B.; Banerjee, S.; Chakraborti, S.; Bhatt, A. Analyzing the role of biophysical compositions in minimizing urban land surface temperature and urban heating. Urban Clim. 2018, 24, 803–819. [Google Scholar] [CrossRef]
- Sun, Y.; Gao, C.; Li, J.; Li, W.; Ma, R. Examining urban thermal environment dynamics and relations to biophysical composition and configuration and socio-economic factors: A case study of the Shanghai metropolitan region. Sustain. Cities Soc. 2018, 40, 284–295. [Google Scholar] [CrossRef]
- Odindi, J.O.; Bangamwabo, V.; Mutanga, O. Assessing the Value of Urban Green Spaces in Mitigating Multi-Seasonal Urban Heat using MODIS Land Surface Temperature (LST) and Landsat 8 data. Int. J. Environ. Res. 2015, 9, 9–18. [Google Scholar]
- Rahman, M.H.; Chakraborty, T.; Alam, M.S. Exploring the effect of biophysical composition on land surface temperature to identify urban heat clusters using remote sensing technique: A case study on Dhaka city, Bangladesh. J. Bangladesh Inst. Plan. 2020, 2075, 9363. [Google Scholar]
- Mathew, A.; Khandelwal, S.; Kaul, N. Spatial and temporal variations of urban heat island effect and the effect of percentage impervious surface area and elevation on land surface temperature: Study of Chandigarh city, India. Sustain. Cities Soc. 2016, 26, 264–277. [Google Scholar] [CrossRef]
- Hua, L.; Zhang, X.; Nie, Q.; Sun, F.; Tang, L. The impacts of the expansion of urban impervious surfaces on urban heat islands in a coastal city in China. Sustainability 2020, 12, 475. [Google Scholar] [CrossRef]
- Xian, G.; Shi, H.; Auch, R.; Gallo, K.; Zhou, Q.; Wu, Z.; Kolian, M. The effects of urban land cover dynamics on urban heat Island intensity and temporal trends. GIScience Remote Sens. 2021, 58, 501–515. [Google Scholar] [CrossRef]
- Khamchiangta, D.; Dhakal, S. Time series analysis of land use and land cover changes related to urban heat island intensity: Case of Bangkok Metropolitan Area in Thailand. J. Urban Manag. 2020, 9, 383–395. [Google Scholar] [CrossRef]
- Yu, Z.; Xu, S.; Zhang, Y.; Jørgensen, G.; Vejre, H. Strong contributions of local background climate to the cooling effect of urban green vegetation. Sci. Rep. 2018, 8, 6261. [Google Scholar] [CrossRef]
- Yan, C.; Guo, Q.; Li, H.; Li, L.; Qiu, G.Y. Quantifying the cooling effect of urban vegetation by mobile traverse method: A local-scale urban heat island study in a subtropical megacity. Build. Environ. 2020, 169, 106541. [Google Scholar] [CrossRef]
- Gunawardena, K.R.; Wells, M.J.; Kershaw, T. Utilising green and bluespace to mitigate urban heat island intensity. Sci. Total Environ. 2017, 584, 1040–1055. [Google Scholar] [CrossRef] [PubMed]
- Lin, Y.; Wang, Z.; Jim, C.Y.; Li, J.; Deng, J.; Liu, J. Water as an urban heat sink: Blue infrastructure alleviates urban heat island effect in megacity agglomeration. J. Clean. Prod. 2020, 262, 121411. [Google Scholar] [CrossRef]
- Chapman, S.; Watson, J.E.; Salazar, A.; Thatcher, M.; McAlpine, C.A. The impact of urbanization and climate change on urban temperatures: A systematic review. Landsc. Ecol. 2017, 32, 1921–1935. [Google Scholar] [CrossRef]
- Siddiqui, A.; Kushwaha, G.; Nikam, B.; Srivastav, S.K.; Shelar, A.; Kumar, P. Analysing the day/night seasonal and annual changes and trends in land surface temperature and surface urban heat island intensity (UHII) for Indian cities. Sustain. Cities Soc. 2021, 75, 103374. [Google Scholar] [CrossRef]
- Breiman, L. Bagging predictors. Mach. Learn. 1996, 24, 123–140. [Google Scholar] [CrossRef]
- Hong, H.; Liu, J.; Zhu, A.X. Modeling landslide susceptibility using LogitBoost alternating decision trees and forest by penalizing attributes with the bagging ensemble. Sci. Total Environ. 2020, 718, 137231. [Google Scholar] [CrossRef]
- Hosseinalizadeh, M.; Kariminejad, N.; Chen, W.; Pourghasemi, H.R.; Alinejad, M.; Behbahani, A.M.; Tiefenbacher, J.P. Spatial modelling of gully headcuts using UAV data and four best-first decision classifier ensembles (BFTree, Bag-BFTree, RS-BFTree, and RF-BFTree). Geomorphology 2019, 329, 184–193. [Google Scholar] [CrossRef]
- Arabameri, A.; Chandra Pal, S.; Santosh, M.; Chakrabortty, R.; Roy, P.; Moayedi, H. Drought risk assessment: Integrating meteorological, hydrological, agricultural and socio-economic factors using ensemble models and geospatial techniques. Geocarto Int. 2022, 37, 6087–6115. [Google Scholar] [CrossRef]
- Lee, S.; Kim, J.C.; Jung, H.S.; Lee, M.J.; Lee, S. Spatial prediction of flood susceptibility using random-forest and boosted-tree models in Seoul metropolitan city, Korea. Geomat. Nat. Hazards Risk 2017, 8, 1185–1203. [Google Scholar] [CrossRef]
- Wang, Y.; Hong, H.; Chen, W.; Li, S.; Panahi, M.; Khosravi, K.; Costache, R. Flood susceptibility mapping in Dingnan County (China) using adaptive neuro-fuzzy inference system with biogeography based optimization and imperialistic competitive algorithm. J. Environ. Manag. 2019, 247, 712–729. [Google Scholar] [CrossRef]
- Ho, T.K. The random subspace method for constructing decision forests. IEEE Trans. Pattern Anal. Mach. Intell. 1998, 20, 832–844. [Google Scholar]
- Skurichina, M.; Duin, R.P. Bagging, boosting and the random subspace method for linear classifiers. Pattern Anal. Appl. 2002, 5, 121–135. [Google Scholar] [CrossRef]
- Pham, B.T.; Phong, T.V.; Nguyen-Thoi, T.; Parial, K.K.; Singh, S.; Ly, H.B.; Prakash, I. Ensemble modeling of landslide susceptibility using random subspace learner and different decision tree classifiers. Geocarto Int. 2022, 37, 735–757. [Google Scholar] [CrossRef]
- Luo, X.; Lin, F.; Chen, Y.; Zhu, S.; Xu, Z.; Huo, Z.; Peng, J. Coupling logistic model tree and random subspace to predict the landslide susceptibility areas with considering the uncertainty of environmental features. Sci. Rep. 2019, 9, 15369. [Google Scholar] [CrossRef] [PubMed]
- Wu, Y.; Hou, H.; Wang, R.; Murayama, Y.; Wang, L.; Hu, T. Effects of landscape patterns on the morphological evolution of surface urban heat island in Hangzhou during 2000–2020. Sustain. Cities Soc. 2022, 79, 103717. [Google Scholar] [CrossRef]
- Yue, W.; Liu, X.; Zhou, Y.; Liu, Y. Impacts of urban configuration on urban heat island: An empirical study in China megacities. Sci. Total Environ. 2019, 671, 1036–1046. [Google Scholar] [CrossRef]
- Babalola, O.S.; Akinsanola, A.A. Change detection in land surface temperature and land use land cover over Lagos Metropolis, Nigeria. J. Remote Sens. GIS 2016, 5, 10–4172. [Google Scholar]
- Akbari, H.; Matthews, H.D.; Seto, D. The long-term effect of increasing the albedo of urban areas. Environ. Res. Lett. 2012, 7, 024004. [Google Scholar] [CrossRef]
- Ulpiani, G. On the linkage between urban heat island and urban pollution island: Three-decade literature review towards a conceptual framework. Sci. Total Environ. 2021, 751, 141727. [Google Scholar] [CrossRef]
- Hintz, M.J.; Luederitz, C.; Lang, D.J.; von Wehrden, H. Facing the heat: A systematic literature review exploring the transferability of solutions to cope with urban heat waves. Urban Clim. 2018, 24, 714–727. [Google Scholar] [CrossRef]
- Degirmenci, K.; Desouza, K.C.; Fieuw, W.; Watson, R.T.; Yigitcanlar, T. Understanding policy and technology responses in mitigating urban heat islands: A literature review and directions for future research. Sustain. Cities Soc. 2021, 70, 102873. [Google Scholar]
Figure 1.
The study area (LULC map in Jeddah megacity, 2022) (a) actual (b) Zoom out.

Figure 2.
Proposed methodological framework.

Figure 3.
LST maps for Jeddah: in 2000 (a); in 2010 (b); and in 2021 (c).

Figure 4.
LST maps for Jeddah: in 2000 (a); in 2010 (b); and in 2021 (c).

Figure 5.
UHI maps for Jeddah: in 2000 (a); in 2010 (b); and in 2021 (c).

Figure 6.
Scatter plots show the relationship between UHI values and the SEVs (varying values from (a–f)).
Figure 6.
Scatter plots show the relationship between UHI values and the SEVs (varying values from (a–f)).

Figure 7.
UHI modeling based on (a) random subspace and (b) bagging.


Table 1.
LUALC scenario in Jeddah from 2000 to 2021.
| LULC Types | 2000 | 2010 | 2021 |
|---|---|---|---|
| Built-up | 3085.64 | 4763.96 | 5557.98 |
| Open land | 18,191.44 | 16,519.87 | 15,782.32 |
| Water | 653.51 | 673.47 | 578.46 |
| Vegetation | 26.23 | 22.66 | 34.66 |
Table 2.
Descriptive statistics of LST in Jeddah from 2000 to 2021.
| Statistics | 2000 | 2010 | 2021 |
|---|---|---|---|
| Maximum | 38.47 | 39.51 | 42.4 |
| Minimum | 29.41 | 28.34 | 31.3 |
| Mean | 31.85 | 32.45 | 34.5 |
Table 3.
The correlation of UHI with different surface parameters.
| Quantities | Parameter Values | Correlation with UHI |
|---|---|---|
| MNDWI | = −0.620; significant at 0.001 | Strong Negative |
| NDVI | = 0.052; significant at 0.450 | Weak |
| SAVI | = −0.211; significant at 0.001 | Negative and weak |
| NDBaI | = 0.368; significant at 0.001 | Positive |
| NDBI | r = 0.665; significant at 0.001 | Strong Positive |
| LST | r = 0.999; significant at 0.001 |
Table 4.
UHI levels are determined by bagging and random subspace models.
| Level | % of Area | |
|---|---|---|
| Bagging | Random Subspace | |
| Very low | 4.89 | 3.49 |
| Low | 3.32 | 4.75 |
| Average | 4.37 | 4.84 |
| High | 5.11 | 5.24 |
| Very high | 82.31 | 81.68 |
Disclaimer/Publisher’s Note: The statements, opinions and data contained in all publications are solely those of the individual author(s) and contributor(s) and not of MDPI and/or the editor(s). MDPI and/or the editor(s) disclaim responsibility for any injury to people or property resulting from any ideas, methods, instructions or products referred to in the content. |
© 2023 by the author. Licensee MDPI, Basel, Switzerland. This article is an open access article distributed under the terms and conditions of the Creative Commons Attribution (CC BY) license (https://creativecommons.org/licenses/by/4.0/).
Share and Cite
MDPI and ACS Style
Addas, A. Machine Learning Techniques to Map the Impact of Urban Heat Island: Investigating the City of Jeddah. Land 2023, 12, 1159. https://doi.org/10.3390/land12061159
AMA Style
Addas A. Machine Learning Techniques to Map the Impact of Urban Heat Island: Investigating the City of Jeddah. Land. 2023; 12(6):1159. https://doi.org/10.3390/land12061159
Chicago/Turabian StyleAddas, Abdullah. 2023. "Machine Learning Techniques to Map the Impact of Urban Heat Island: Investigating the City of Jeddah" Land 12, no. 6: 1159. https://doi.org/10.3390/land12061159
Note that from the first issue of 2016, this journal uses article numbers instead of page numbers. See further details here.