Article

How Does New Energy Demonstration City Policy Promote Urban Land Use Efficiency in China? The Mediating Effect of Industrial Structure

1
School of Geographic and Ocean Science, Nanjing University, Nanjing 210023, China
2
College of Public Administration, Huazhong University of Science and Technology, Wuhan 430074, China
*
Authors to whom correspondence should be addressed.
Land 2023, 12(5), 1100; https://doi.org/10.3390/land12051100
Submission received: 5 April 2023 / Revised: 15 May 2023 / Accepted: 19 May 2023 / Published: 20 May 2023
(This article belongs to the Topic Urban Land Use and Spatial Analysis)

Abstract

:
As an effective measure to solve the dilemma of urban energy consumption and economic development, the new energy demonstration city (NEDC) policy in China could greatly promote the development of the new energy industry and urban economy. This study aims to explore how the NEDC policy effectively promotes the growth of urban land use efficiency (ULUE), an essential indicator of economic development, through the urban industrial structure. Based on the panel data of 285 Chinese cities during 2003–2019, this study took the NEDC policy as a quasi-natural experiment and employed the PSM-DID method and the mediating effect model to objectively evaluate its policy effects. We found that the NEDC policy could significantly promote the growth of the ULUE. Specifically, the ULUE has been significantly improved by 17.0%. The NEDC policy could also promote the ULUE indirectly through the mediating effect of industrial structure advancement (ISA), but the mediating effect of industrial structure rationalization (ISR) was not significant. Furthermore, the promotional effect of the NEDC policy on the ULUE has regional heterogeneity. Compared with eastern cities and high-innovation cities, central and western cities and medium-innovation and low-innovation cities can obtain much higher promotion effects. This study may provide some policy inspiration for policymakers to support low-corban and sustainable economic development and urban land use.

1. Introduction

For a long time, the fast and furious development of the global economy has relied on traditional industries with high energy consumption [1], such as coal, oil, and natural gas, resulting in grave urban environmental pollution and inefficiency in urban land utilization [2]. To seek new progress in urban energy and economy, the concept of low carbon economy was initially introduced by the UK in White Paper: Our Energy Future—Creating a Low Carbon Economy in 2003, which garnered international attention toward new energy sources. Although these traditional energy sources are still commonplace in numerous regions, it has become an inevitable global trend to transform energy systems and industrial structures [3]. Given the constraints imposed by limited land resources and the non-renewable nature of traditional energy, enhancing urban land use efficiency (ULUE) has become a profoundly urgent endeavor in realizing sustainable long-term urban development.
As the second largest economy in the world, China actively contributes its wisdom in energy conservation and carbon emissions reduction while advocating for green, eco-friendly, and low-carbon lifestyles [4]. As early as 2012, the National Energy Bureau of China put forward the New Energy Demonstration City (NEDC) policy and resolved to establish 81 NEDCs in 2014, aligning with China’s goals of reaching a carbon peak by 2030 and achieving carbon neutrality by 2060. The NEDC policy aspires to further restrain global warming, reduce carbon emissions and enhance energy efficiency. Furthermore, it represents a pivotal measure in exploring new energy development technologies and refining the urban industrial structure, thereby altering the landscape of urban economic progression and fostering the advancement of the ULUE. The Energy Development Report of China (2020 Edition) highlights that the installed capacity of renewable energy power generation has surpassed 700 million kilowatts, with nuclear power projects under construction and in operation exceeding 58 million kilowatts by September 2020. These figures denote that China has become the world’s largest new energy producer and consumer.
According to the previous literature [5], 70% of global carbon emissions come from urban living and production activities. As an effective countermeasure to solve the conflict between urban energy consumption and urban economic development, the NEDC policy has played an effective role in demonstrating and exemplifying the promotion of new energy production and consumption. This, in turn, could reshape the pathways and frequency of socioeconomic factors, such as urban land resources, ultimately influencing the material cycle and energy flow of the urban land use system and subsequently transforming the pattern and structure of urban land usage [6]. The ULUE serves not only as a direct reflection of urban economic development and the extent of urban land utilization but also as an essential indicator to assess the effective allocation and rational use of socioeconomic factors [7]. Based on the above analysis, it has become apparent that a qualitative assessment of the policy effects of NEDC on the ULUE, from the perspective of industrial structure, holds significant importance. Therefore, this study aimed to explore the influence of NEDC on the ULUE and the mediation effects of the industrial structure by constructing a PSM-DID model and mediating effect model.
This paper may provide the marginal contributions as follows. Firstly, while existing studies predominantly evaluate the economic performance of NEDC from a macroscopic standpoint, this paper centers its focus on the resource allocation impact of NEDC on socioeconomic factors such as urban land. Given China’s rapid urbanization and industrialization, we emphasize that the research on the utilization efficiency of urban land is even more important. Secondly, this paper proposes an analytical framework to understand the mechanism that the NEDC policy may affect the ULUE through the investment-pulling effect, innovation-driving effect, and industrial structure effect. Third, to further explore the impact of NEDC on ULUE, this paper proposes the mediating effect of industrial structure rationalization and industrial structure advancement. Finally, this study revealed that the effect of NEDC on ULUE is heterogeneous, with central and western cities, as well as cities with medium and low levels of innovation, reaping notably higher promotional effects in comparison to their eastern counterparts and cities with high levels of innovation.

2. Literature Review and Analytical Framework

2.1. Literature Review

2.1.1. Literature Review on ULUE

There has been a considerable amount of associated academic research on ULUE, including four primary aspects: the connotation of ULUE, the measurement of ULUE, the factors influencing ULUE, and spatial differentiation, as well as optimization strategies on ULUE. Regarding the connotation of ULUE, scholars have yet to establish a unified criterion for the definition of ULUE based on different constraints. However, on the whole, they agree that the ULUE mainly denotes the sum of all the output values provided per land unit under certain socioeconomic conditions [8]. Some scholars additionally perceive urban land as a vital urban resource, wherein ULUE signifies the non-agricultural economic output per land unit [9]. Consequently, they generally employ a single indicator to measure ULUE. As research has deepened, some scholars start from the goal of urban land use and calculate the ULUE through the employment of index evaluation methodologies and the construction of a multi-objective evaluation system that reflects economic, social, and environmental aspects [10,11]. In addition to the aforementioned multi-index evaluation method, we could divide the methodologies for measuring the ULUE into two categories, namely the SFA method [12] and DEA methods [13], both of which have been broadly acknowledged by scholars. Furthermore, the Super-efficient DEA [14] and Slack-based Measure (SBM) models [6] served as established theoretical foundations for measuring ULUE within this study. Concerning the factors influencing ULUE, certain scholars have explored various factors that may affect the ULUE, such as economic integration [7], government policy regulation [15], transportation infrastructure [16,17], land transfer marketization [18,19], and industrial structure [18,20]. However, they have usually ignored the huge impact of national policies on land use. The government regulations and pilot policies, functioning as institutions through which the central government regulates urban economic development, also exert significant effects on the ULUE in China [15,21]. Since the reform and opening up of China, the central government has issued several nationwide pilot policies that have proven significant in wielding impacts on ULUE, such as the smart city pilot policy [22], innovative city polit policy [23], and low carbon city polit policy [24,25]. However, few scholars have concentrated on the effects of the NEDC policy on ULUE. Therefore, this paper aims to explore how NEDC affects ULUE and quantitatively evaluate the impact of NEDC policy on ULUE.

2.1.2. Literature Review on NEDC Policy

Energy stands as an indispensable resource for a nation’s pursuit of economic growth. Throughout history, the excessive utilization of energy by various nations across the globe has given rise to grave predicaments such as ecological degradation, the depletion of conventional energy sources, and global warming. Developed nations such as France, the United Kingdom, and the United States have initiated an ardent quest to explore energy alternatives, attaining commendable feats of accomplishment [26]. Likewise, some Asian developing countries, including Indonesia and China, have also made substantial strides in the realm of renewable energy development [27,28]. As a critical policy arrangement to achieve sustainable development in China, the NEDC policy has received extensive attention from scholars. The existing literature can be divided into two aspects. Firstly, some scholars have focused on the interpretation of the concept of the NEDC policy. Lou [29] pointed out the connotation and construction status of NEDC and took the lead in proposing the planning method of NEDC based on the “6A” concept. Wang [30] summarized the experience of constructing the NEDC pilot city in Turpan. Wu et al. [31] investigated the willingness and ability to cope with the construction challenges in the NEDC policy. However, this existing literature only conceptually explains the concept of NEDC and has not evaluated its policy effects. Further, some examples in the literature have focused on the evaluation of the NEDC policy effect. Xu [32] believed that the NEDC policy promoted the development of the regional economy and the adjustment of urban industrial structure, and technological innovation is an essential transmission channel. Wang and Yi [33] discussed the impact of NEDC on urban green economic development through the channels of industrial structure, technological innovation, and environmental constraints. Lu and Wang [34] and Yang et al. [2] found that the construction of NEDCs could help reduce the emissions of sewage and exhaust gases, which is conducive to curbing environmental pollution. Zhang et al. [35] empirically analyzed the relationship between the NEDC policy, technological innovation, and Energy-Carbon Performance (ECP) and found that the NEDC policy contributed to improving the ECP. However, few studies have explored the intrinsic interaction between the NEDC policy and ULUE while evaluating the effects of the NEDC policy on ULUE quantitatively from the perspective of industrial structure. Therefore, in this study, we subdivided the industrial structure into industrial structure advancement (ISA) and industrial structure rationalization (ISR) and explored the mediating effects of ISA and ISR, respectively.

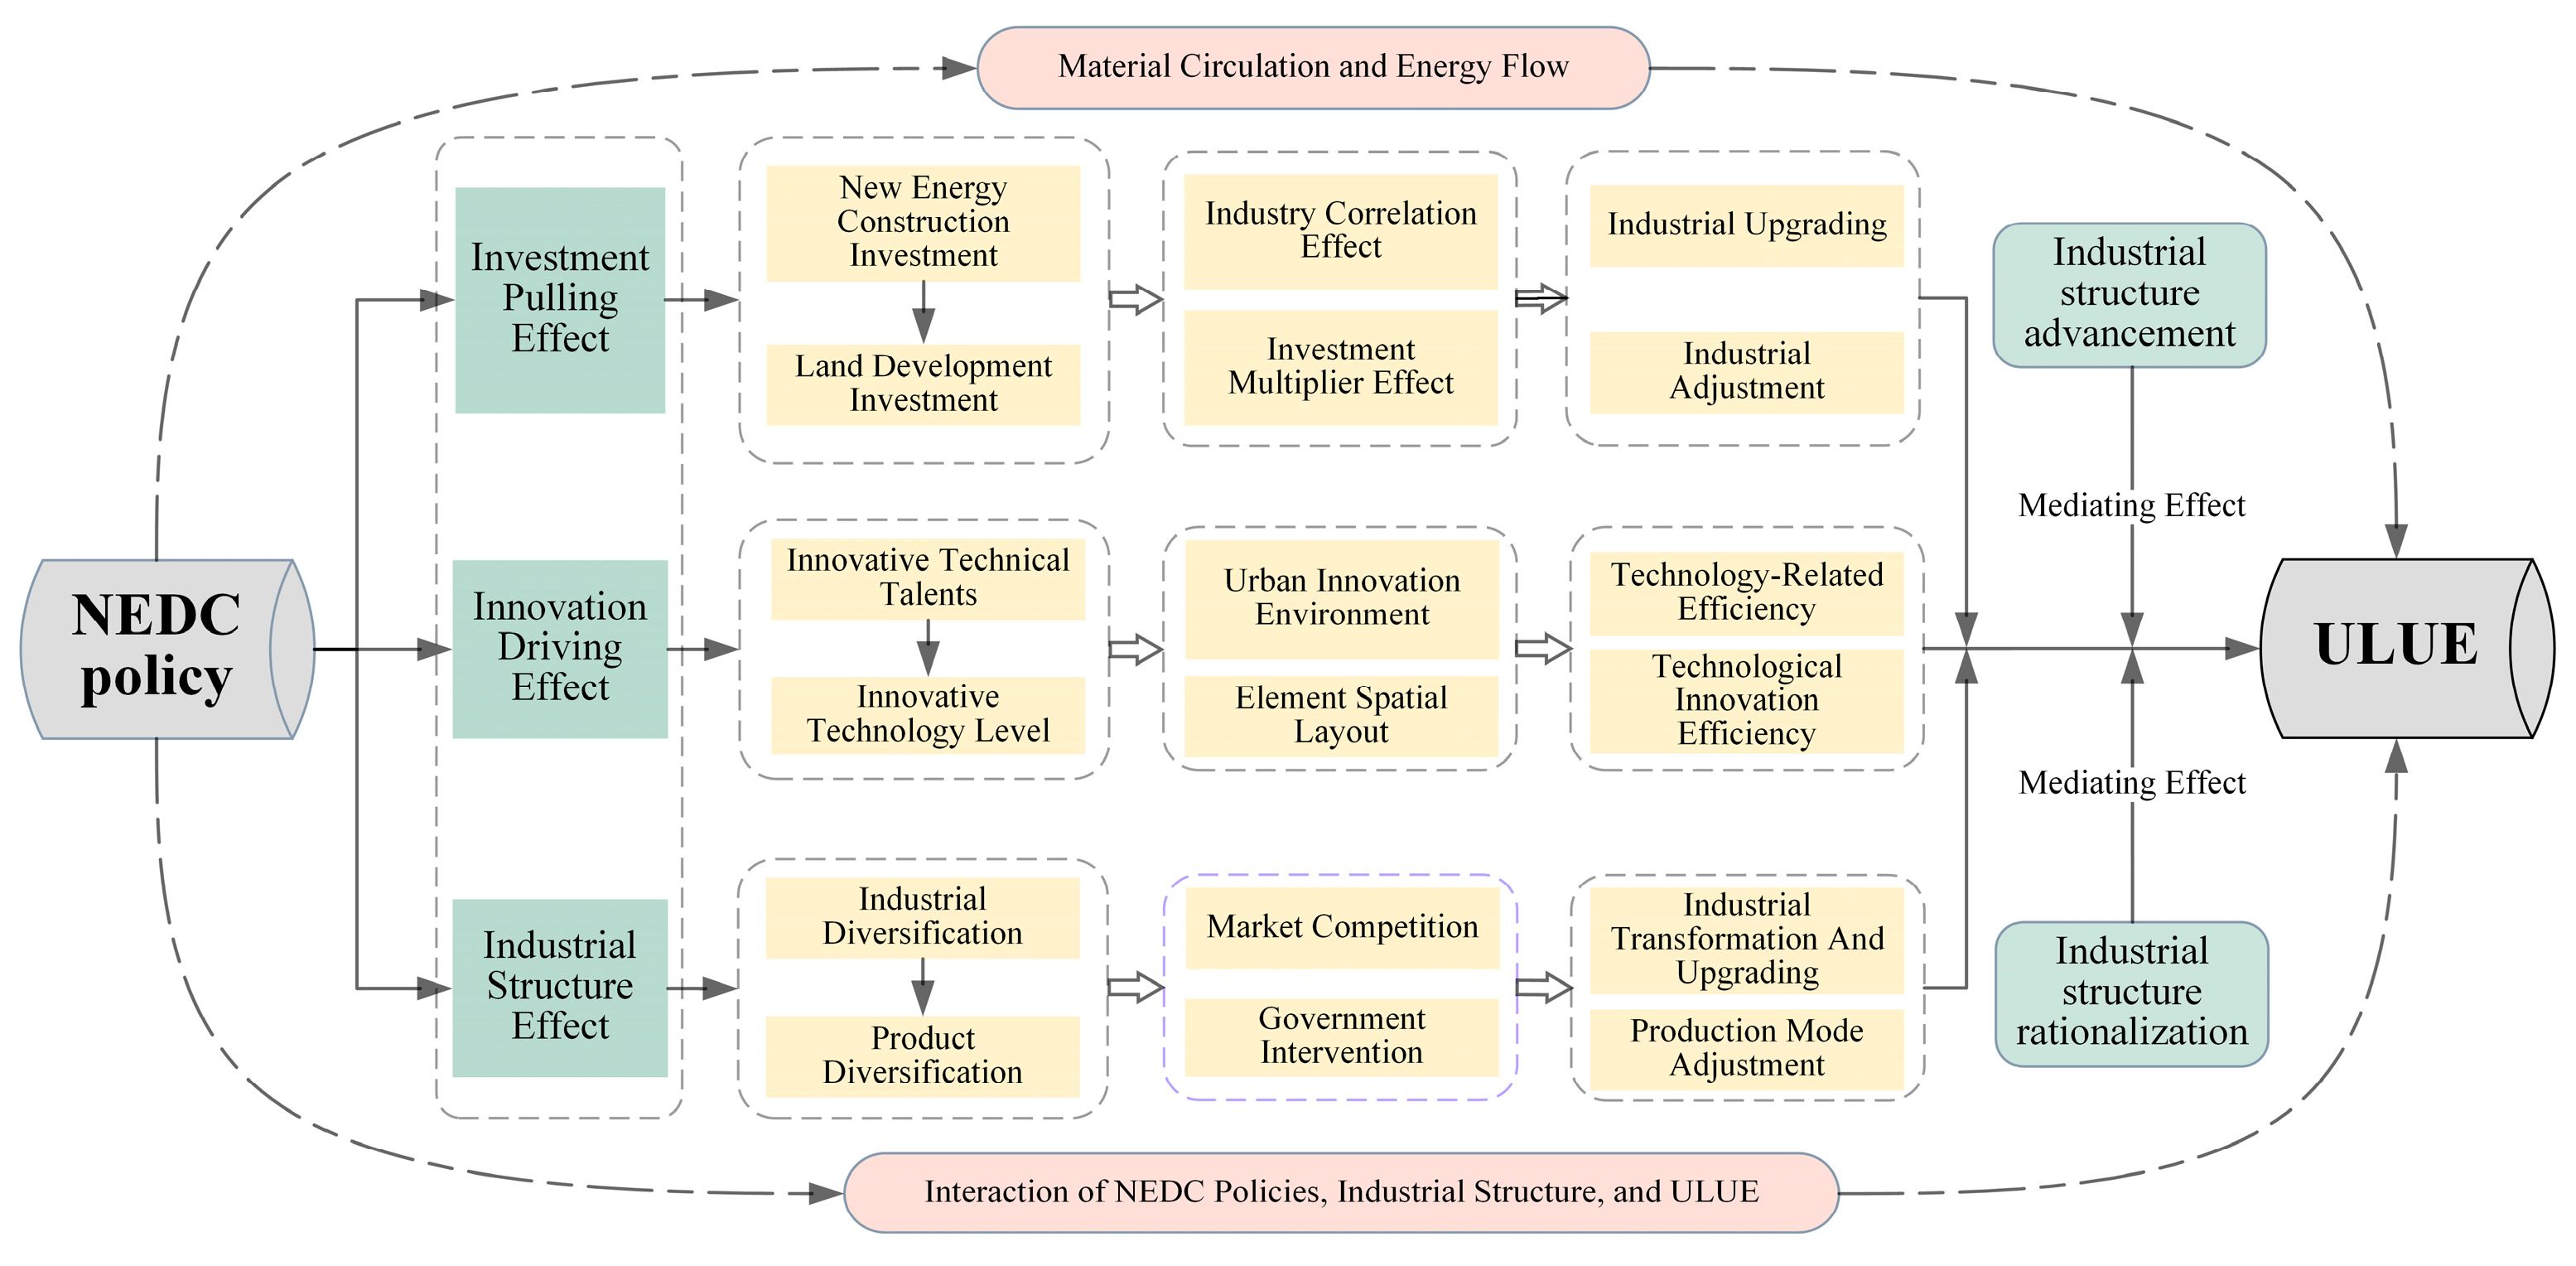
2.1.3. Mechanism Analysis and Research Hypothesis

Although the existing research has yielded several inspiring insights regarding the establishment of NEDCs from diverse perspectives, they primarily focus on the conception and policy effect evaluation of the NEDC. The scholarly community has scarcely explored the influence of the NEDC policy on Urban Land Use Efficiency (ULUE), thereby underscoring a research gap when evaluating the effects of the NEDC policy on the ULUE.
The establishment of NEDCs possesses the potential to alter the urban industrial structure by influencing the material flow and energy circulation, consequently impacting changes in urban land utilization. By conducting a comprehensive review of the existing literature [6,32,33], we have determined that the NEDC policy may affect the ULUE through three primary mechanisms: the investment-pulling effect, the innovation-driving effect, and the industrial structure effect, as illustrated in Figure 1.
Firstly, we considered the investment-pulling effect. Given that the establishment of NEDC can make a huge range of industrial correlation effects, the increased investment in NEDC pilot projects inevitably spurs the upgrading and adjustment of associated industries, increasing the urban industrial output and expanding the driving effect of unit urban land output value through the investment multiplier effect [36]. Second is the innovation-driven effect. The establishment of NEDC has fostered an enhanced innovation environment within urban settings [33], and the government’s intervention and endorsement have propelled the diffusion of new energy technologies, mitigating the risks of innovation failure and bolstering the capital investment’s capacity for risk-taking, which endeavors to facilitate the accelerated flow and integration of urban innovation elements [37]. Furthermore, technological innovation can optimize energy efficiency, curtail environmental pollution, and promote eco-friendly land utilization [35]. Third is the industrial structure effect. The NEDC policy can encourage diversified investments in urban industries, facilitating the development of new energy processes. Local governments may guide the transformation and upgrading of traditional industries through measures such as taxation and financial subsidies, which can help realize industrial structure advancement and rationalization [34]. During this period, local governments may implement differentiated policies and regulations concerning land resource management based on the different land resource conditions and competitive advantages in various locations, thereby fostering the growth of the ULUE [38]. Based on the above analysis, this paper puts forward the following hypothesis:
H1. 
The NEDC policy can significantly promote the growth of ULUE.

2.2. Mediating Effect Mechanism of Industrial Structure

If the above hypothesis is accepted, how does the NEDC policy affect the ULUE? It has been confirmed that there is positive feedback between the establishment of NEDC and the upgrading and adjustment of industrial structures [33]. The NEDC policy is conducive to the development of urban industries by reducing production costs and promoting the development of urban industrial structures in an environmentally sustainable and low-carbon direction. Meanwhile, the transformation of industrial structures could, in turn, help to improve the consumption and efficiency of new energy sources [39]. Liu et al. [40] also pointed out that the agglomeration of urban industries could significantly amplify energy efficiency in China. However, how to achieve the growth of the ULUE by promoting the interactive transformations of energy structure and industrial structure is still unclear and needs further investigation.
Firstly, the industrial agglomeration effect. The NEDC policy provides a good opportunity for industries associated with new energy to adjust and optimize their industrial structure. Specifically, the establishment of NEDCs has changed the urban industrial development environment. Emerging and traditional industries collide with each other, which can accelerate the mutual flow and integration of production factors and eventually form a coordinated development trend. In addition, there is the administrative intervention effect. To construct the NEDCs and realize the fundamental transformation of the industrial structure, the local government could inevitably intervene in the distribution of production factors among industries through administrative regulations, such as taxation and subsidies, and promote the closing, cessation, transfer, and integration of traditional energy-related industries with high-pollution [34], thereby advancing and rationalizing the urban industrial structure. Importantly, such measures can guarantee the sustainable and environmentally friendly development of the NEDCs. Based on this, this paper puts forward the following hypothesis:
H2. 
The NEDC policy can promote the growth of the ULUE through the industrial structure.
To further explore the internal mechanism of the industrial structure in the process of NEDC’s impact on ULUE, in this study, we subdivided the industrial structure into ISA and ISR [41] to explore the mediating effects of ISA and ISR, respectively.

2.2.1. The Mediating Effect of ISA

ISA denotes the dynamic development process in which the industrial structure is dominated by the primary industry to the secondary and tertiary industries [41]. The NEDC policy is conducive to industrial upgrading and adjustment [33]. Upon the establishment of NEDCs, local administrations can direct industrial enterprises toward technology development, carbon neutrality, environmental preservation, and energy-saving measures through pertinent supportive policies. Throughout the process of NEDC construction, the spatial distribution of the industrial structure, urban land utilization patterns, and other socioeconomic factors can be readjusted through territorial spatial planning, industrial planning, and preferential. These efforts can guide the regional industrial structure to shift from labor-intensive to technology-intensive domains. Existing studies have demonstrated that the development of high-tech industries contributes to the improvement of ULUE [6]. Furthermore, the local government can also pay attention to coping with high-pollution industries, achieve coordinated economic development and foster the growth of the ULUE. Based on this, this paper puts forward the following hypothesis:
H2a. 
The NEDC policy promotes the growth of ULUE through ISA.

2.2.2. The Mediating Effect of ISR

ISR refers to the enhancement of inter-industry coordination and the refinement of correlation capability [18]. At the core of ISR lies the effect of production resource allocation, whereby the efficacy of resource allocation directly influences the rationality of the industrial structure. The growth of the new energy industry can drive the development of related industries, promote the integrity of the entire industrial chain, and enable coordinated development and synchronous upgrades across industries. A well-balanced industrial structure is conducive to the coordination of the urban land space layout and industrial development. However, the NEDC policy may also limit the development of high-pollution industrial enterprises, thus exerting a mitigating effect on the economic output and ULUE to a certain extent [42]. If the promoting effect of NEDC on the ULUE is greater than the restricting effect, the establishment of NEDCs could indeed stimulate the growth of the ULUE through ISR. Based on this, this paper puts forward the following positive hypothesis:
H2b. 
The NEDC policy promotes the growth of the ULUE through ISR.

3. Methodology and Data

3.1. Research Methods

3.1.1. PSM-DID Model

In this study, we took the construction of NEDCs as a quasi-natural experiment and used the PSM-DID model to evaluate the policy effects of NEDC on the ULUE. PSM selected the samples that were closest to the treatment group from the total samples, which effectively avoided selection bias [43]. At the same time, the samples that matched satisfied the common trend assumption required by the DID model [33]. In this paper, the cities approved as NEDC are defined as the treatment group, and the non-pilot cities are defined as the control group. To enhance the validity of the research conclusions, we excluded the samples of county-level cities and industrial parks and then generated the treatment group of 56 cities and the control group of 229 cities. The study area and spatial distribution of NEDCs are shown in Figure 2.
According to the existing research [2], this study conducted the PSM-DID model as follows:
ln U L U E i . t = α 0 + α 1 N E D C i . t + α 2 X i . t + A i + T t + ε i t
where i is the city, and t is the year; ULUEi.t represents urban land use efficiency. NEDCi.t represents the new energy demonstration city policy, and α1 is the coefficient of NEDC, which represents the net effect of the NEDC policy on the ULUE. Xi.t represents the control variables, and α2 is their coefficient. At the same time, the city effect Ai and the year effect Tt are both fixed in this model. εi.t represents a random disturbance term.

3.1.2. Mediating Effect Model

The mediating effect model was adopted to explore whether one factor could mediate the effect of the explanatory variable on the explained variable [44,45]. In this study, the construction of NEDCs provided an opportunity to upgrade and adjust the urban industrial structure by driving the development of high-tech industries. To further explore whether NEDC could promote ULUE through the industrial structure, we quantitatively decomposed the mediating effect as follows. Firstly, we took the ULUE as the explained variable and ISA and ISR as the explanatory variables to test the effect of ISA and ISR on the ULUE. Secondly, we took ISA and ISR as the explained variables and NEDC as an explanatory variable to test the effect of NEDC on ISA and ISR. Moreover, to test whether the mediating effects of ISA and ISR were complete or not, we examined the effect of the NEDC policy on the ULUE after controlling the two mediating variables of ISA and ISR, respectively. The mediating models were conducted as follows [45]:
ln U L U E i . t = β 0 + β 1 M + β 2 X i . t + A i + T i + ε i . t
M = γ 0 + γ 1 N E D C i . t + γ 2 X i . t + A i + T t + ε i . t
ln U L U E i . t = σ 0 + σ 1 N E D C i . t + σ 2 M + σ 3 X i . t + A i + T i + ε i . t
where M represents the Industrial Structure Advancement (ISA) and Industrial Structure Rationalization (ISR), respectively. If the NEDC policy affected the ULUE by the mediating variables of ISA and ISR, both β1 and γ1 were significant. Additionally, if the signs of β1 and γ1 were in line with α1 in Formula (1), it meant that NEDC affected the ULUE by the mediating variables of ISA and ISR, and the coefficient of the mediating variables was β1γ1. If the sign of β1γ1 and α1 were opposite, the mediating effect of ISA and ISR could mask the actual impact of NEDC on the ULUE to a certain extent [41].

3.2. Variable Selection

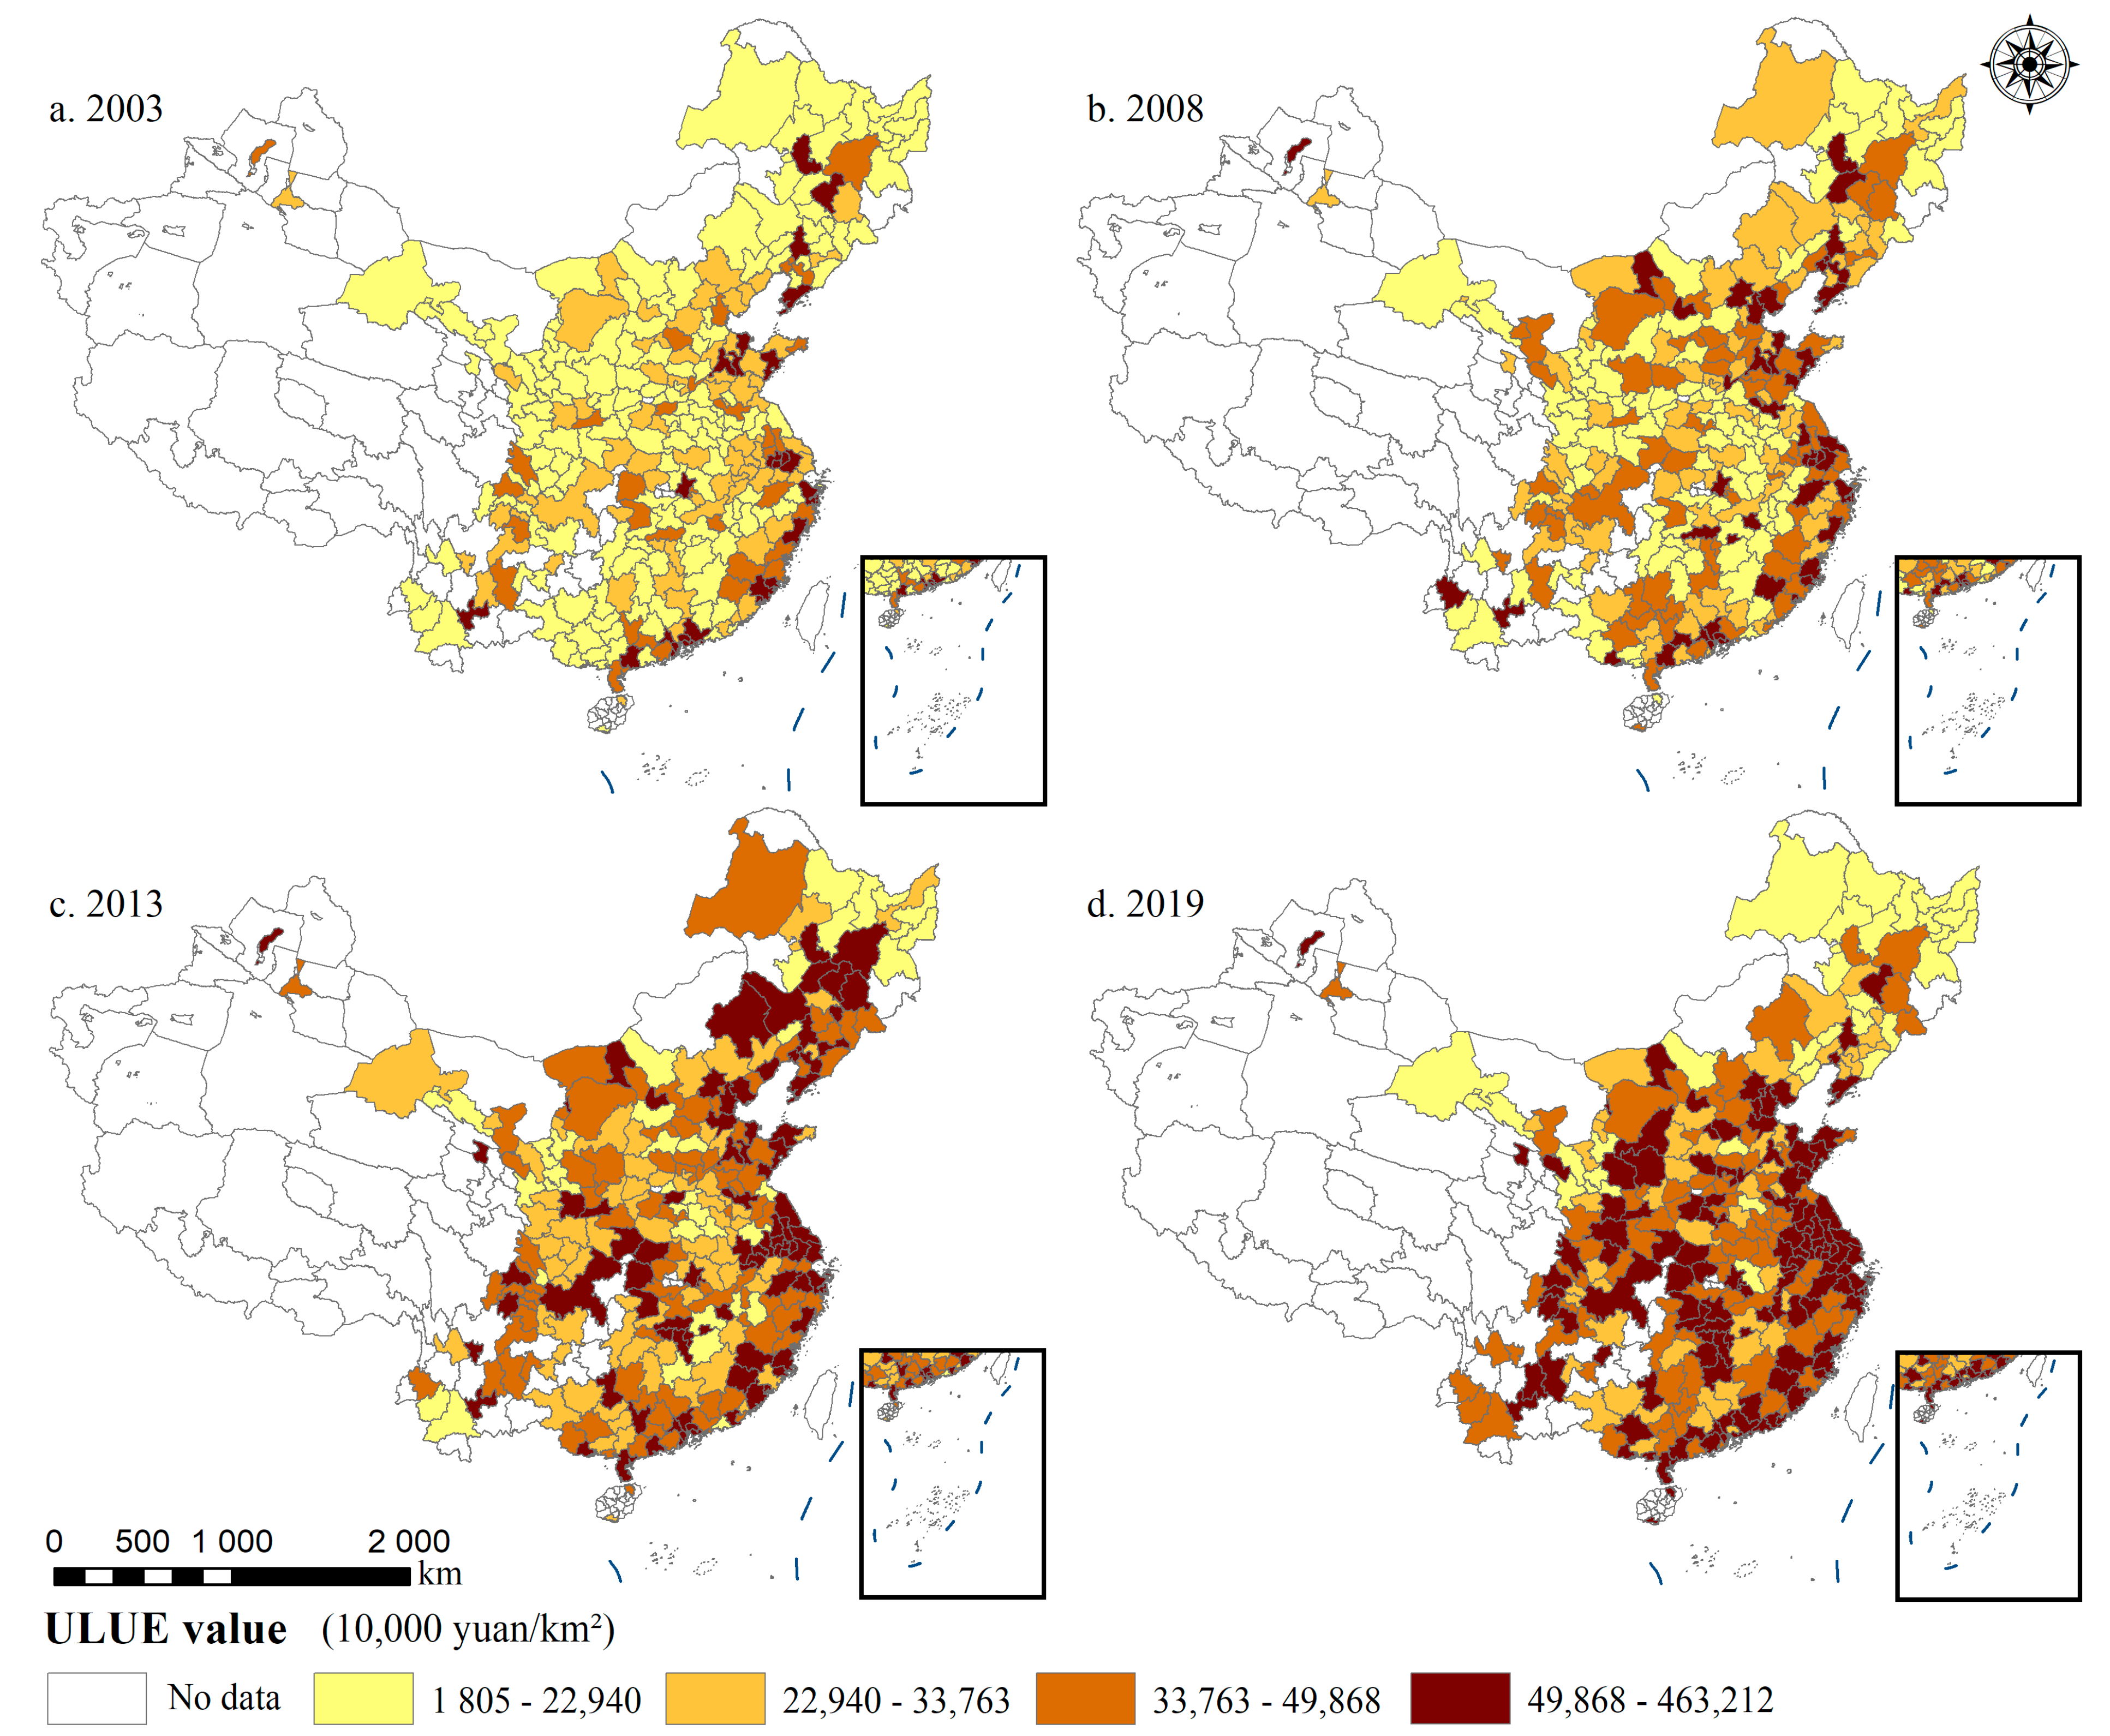
3.2.1. Explained Variable

Urban Land Use Efficiency (ULUE) is an essential indicator that estimates the development level of urban economic and urban land use, which refers to the total social production per land unit [46]. Referring to the existing research [7,47], we selected the ratio of the added value of the secondary and tertiary industries to the urban construction land area to measure the ULUE and took ULUE as the explained variable. First, the ULUE of 285 cities during 2003–2019 was calculated in this paper, and the temporal and spatial evolution of the ULUE is shown in Figure 3.

3.2.2. Explanatory Variable

The concept of NEDC was first introduced in China in 2012. The National Energy Bureau of China formally proposed the pilot policy of establishing NEDC in 2014, and 81 cities were selected as the pilot cities among the 285 city samples. In this paper, we focused on 67 prefecture-level cities (see Figure 2) and formed an interaction term between the policy variable, the treated, and the time variable period (NEDC = Treated × Period). Treated was defined as 1 if the city was approved as NEDC; otherwise, the value was 0. At the same time, considering that the NEDC policy was proposed in the first half of the year 2014, the period was coded as 1 if the period was in or after 2014; otherwise, the value was 0.

3.2.3. Mediating Variables

(1)
Industrial Structure Advancement (ISA)
ISA can reflect the evolution from the dominance of the primary industry to the dominance of the second and tertiary industries [18]. Referring to the research of Tang et al. [41], this paper took the industrial structure hierarchy coefficient to describe ISA. The calculation formula was as follows:
I S A i . t = m = 1 3 Y i . m . t × m , m = 1 , 2 , 3
where ISA represents the industrial structure advancement. m is the weight of three industries, and the first, second, and third industries are assigned as 1, 2, and 3, respectively. Yi.m.t is the ratio of the three industries in the total output value of the city i in t year.
(2)
Industrial Structure Rationalization (ISR)
ISR is an effective indicator that describes whether the socioeconomic factors are in a state of effective allocation between different industries [48]. Economic disequilibrium is very common, especially in many developing countries. The existing research usually uses the degree of industrial structural deviation to measure ISA, but the degree of structural deviation does not take the important roles of different industries in social economic development into consideration. Therefore, we selected the Theil index to describe ISA. The calculation formula was as follows:
I S R i . t = m = 1 3 Y i . m . t L i . t × l n Y i . m . t L i . m . t / Y i . t L i . t = m = 1 3 Y i . m . t L i . t × l n Y i . m . t Y i . t / L i . m . t L i . t , m = 1 , 2 , 3
where ISR represents the industrial structure rationalization, m represents the first, second, and third industries, respectively, Yi.m.t/Yi.t and Li.m.t/Li.t represent the proportion of the output value of the industry m in the city i to the local total output value in year t, respectively, and the labor force of the industry m in the city i.

3.2.4. Control Variables

Drawing on existing research [2,6,33,49], this study selected the following indicators as control variables: (1) Economic openness (OPEN), which is measured by the ratio of the actual use of foreign investment in the regional GDP; (2) the level of human capital (HC), which is measured by the ratio of the number of students in ordinary institutions of higher learning to the total regional population; (3) the level of research and development investment (R&D), which is measured by the proportion of scientific expenditure in the general budget of the local government.

3.2.5. Matching Variables
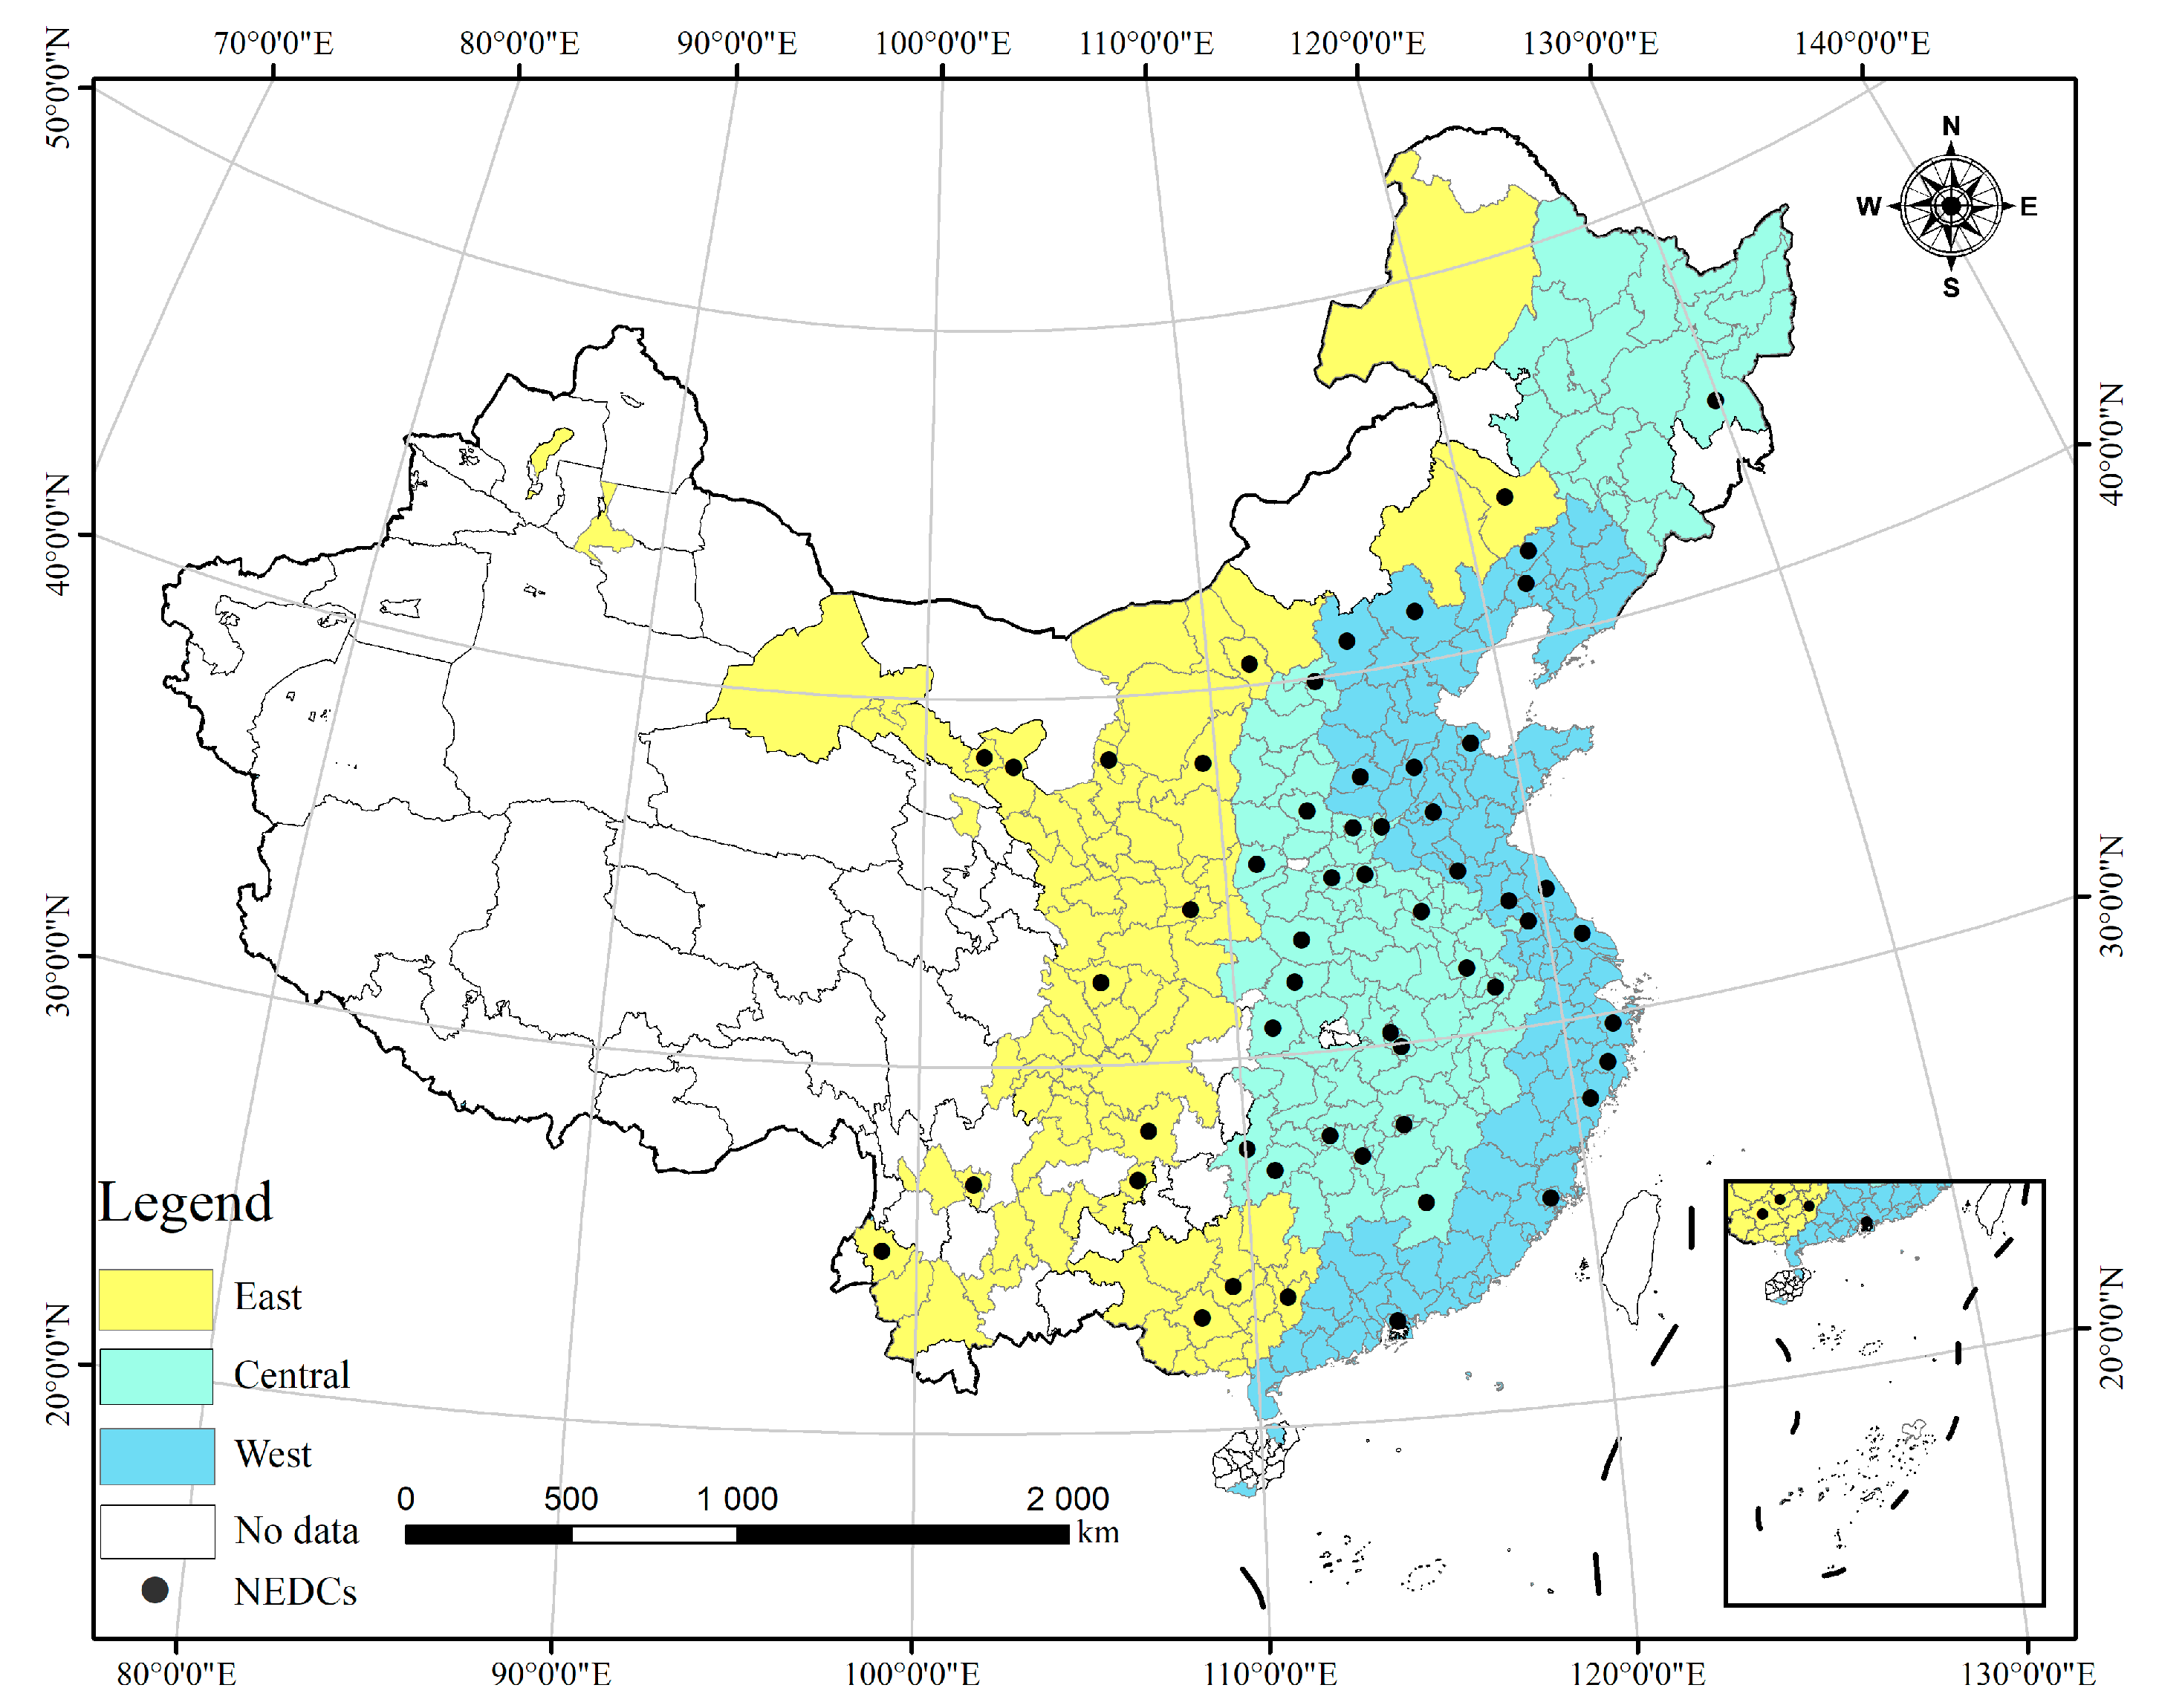
Based on the principle of selecting the matching variables [43], we introduced these variables into the PSM model to improve the estimation accuracy if they had significant impacts on the outcome variable. Following the previous relevant studies [35,50,51], this study selected the five variables: ISA, ISR, OPEN, HC, and R&D.

3.3. Data Sources

Due to data completeness and availability, this paper selected the panel data covering 285 Chinese cities during 2003–2019. All the data were collected from the China Statistical Yearbook (2004–2020), the Statistical Yearbook of Chinese Cities (2004–2020), and the website of the National Energy Bureau of China (http://www.nea.gov.cn/ (accessed on 20 May 2022)). Table 1 shows the descriptive statistics of each variable.

4. Result and Discussion

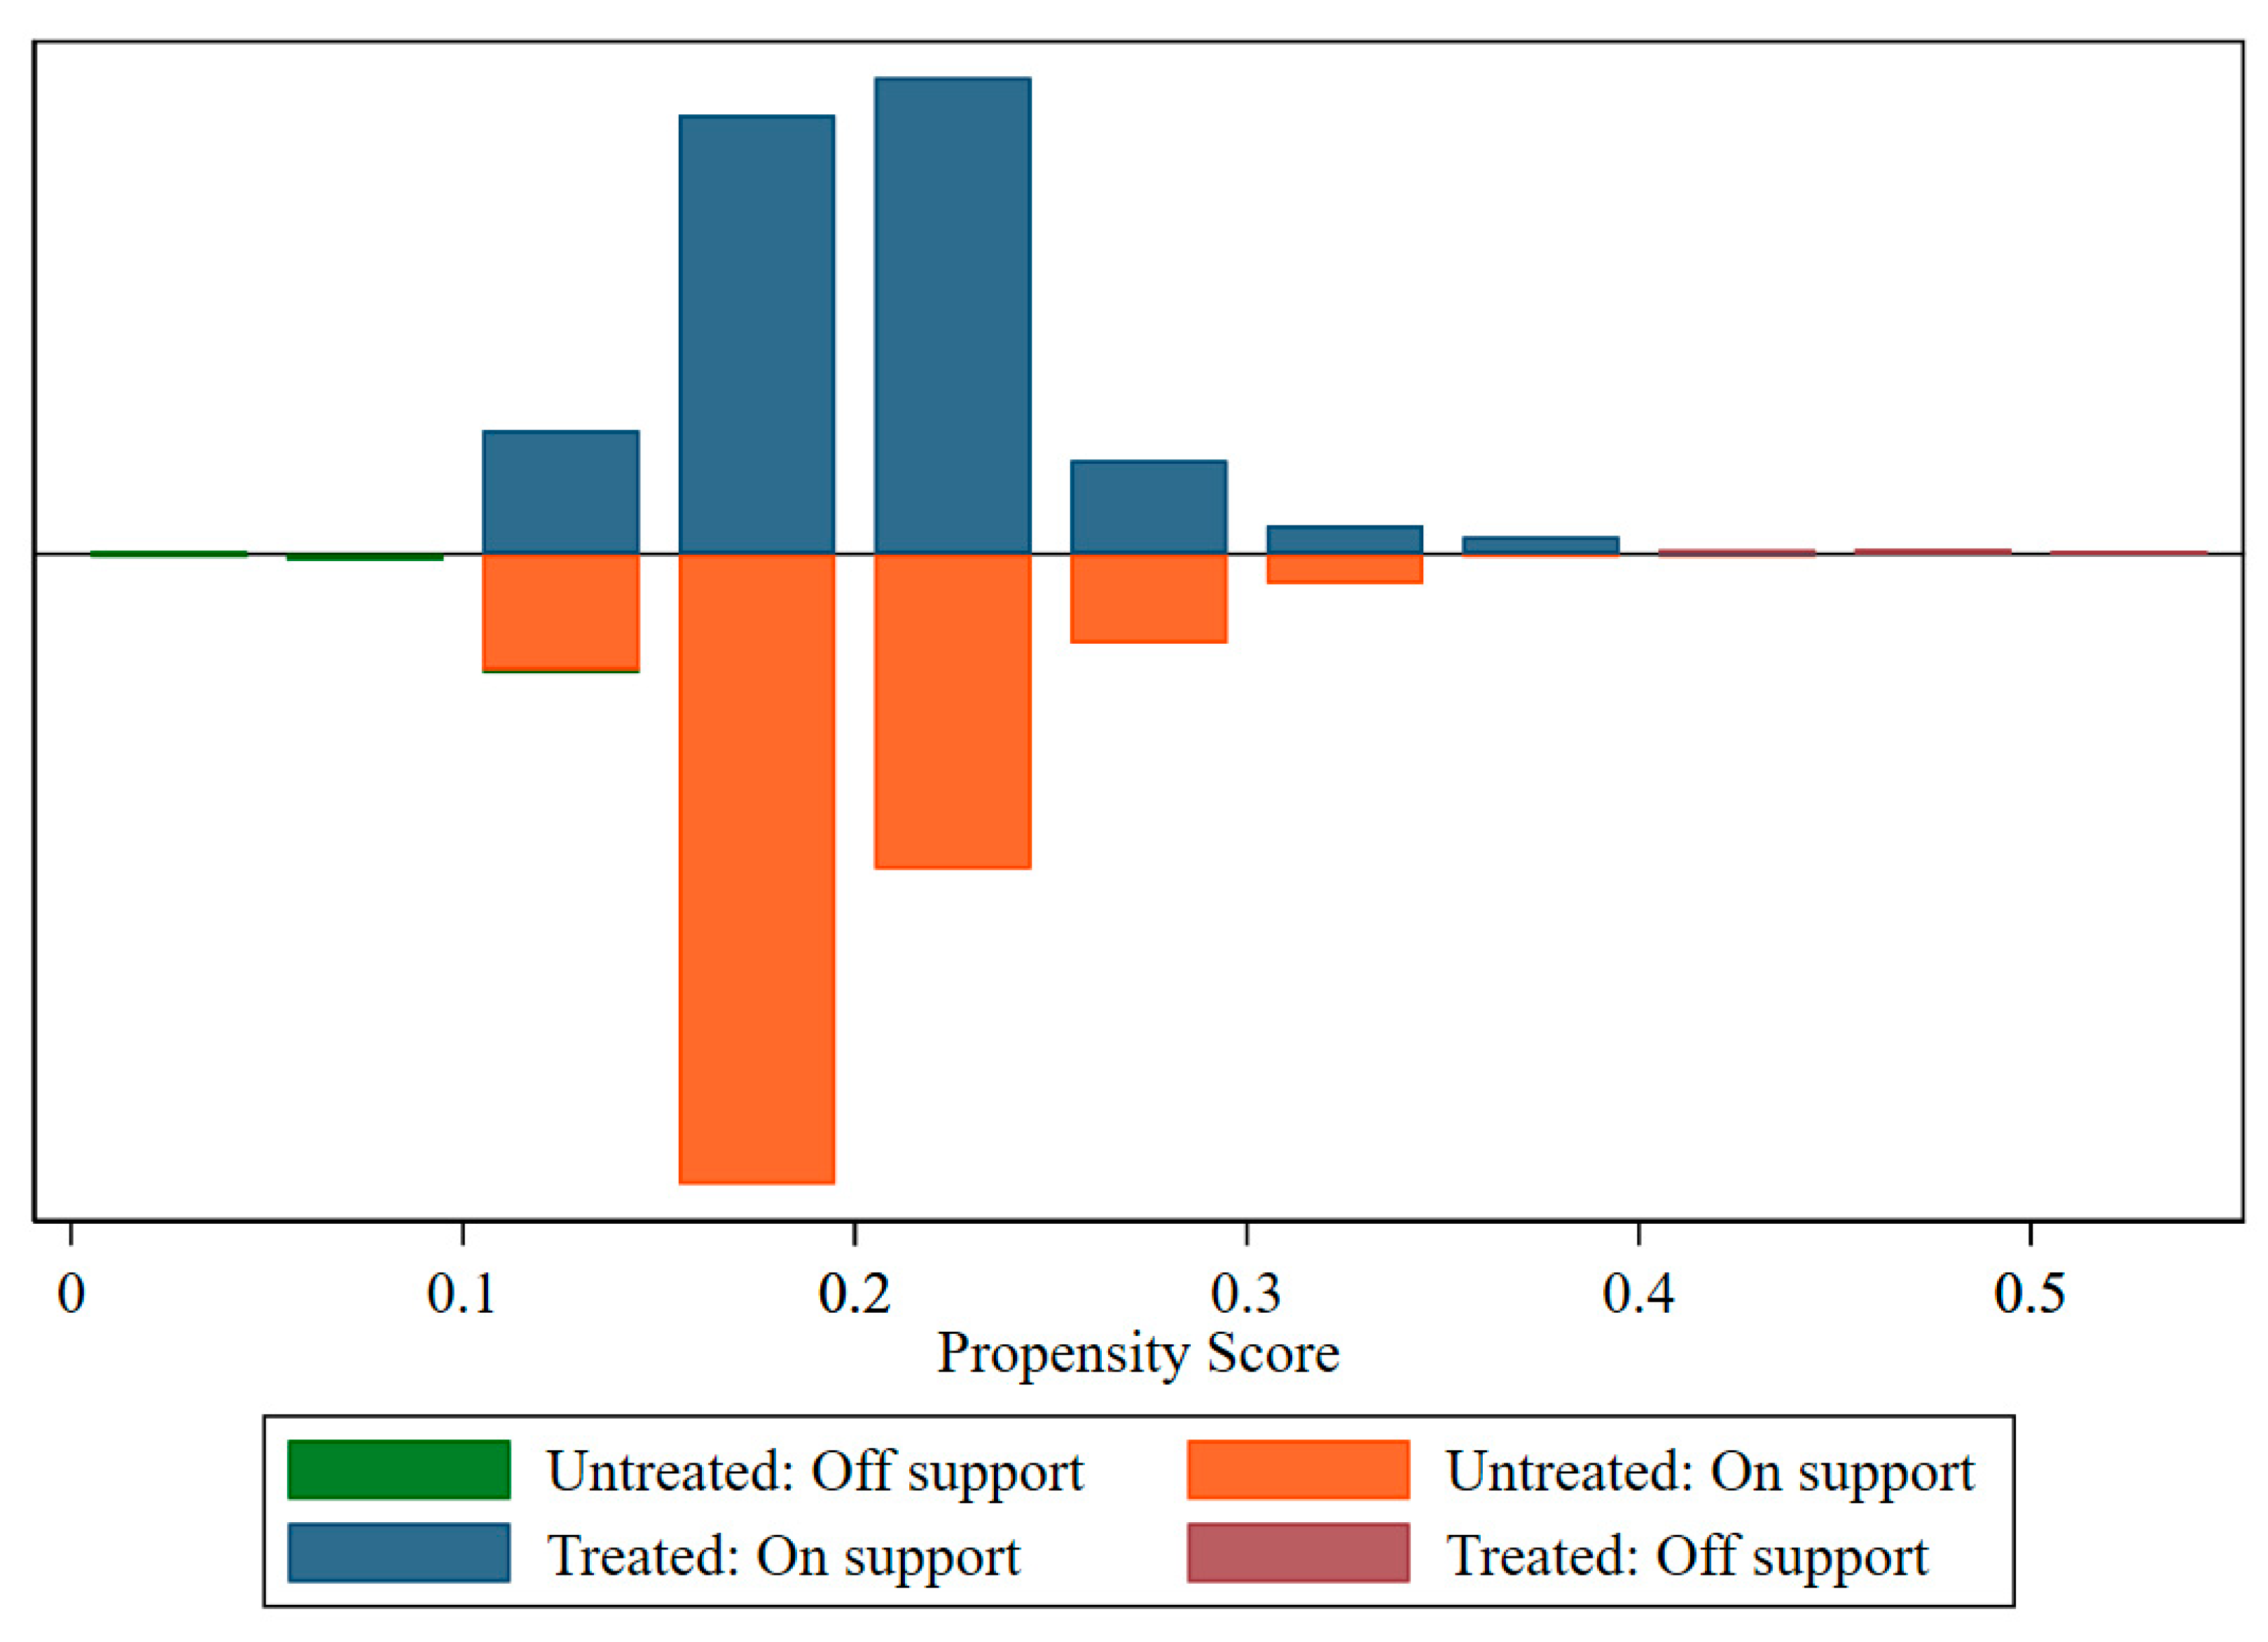
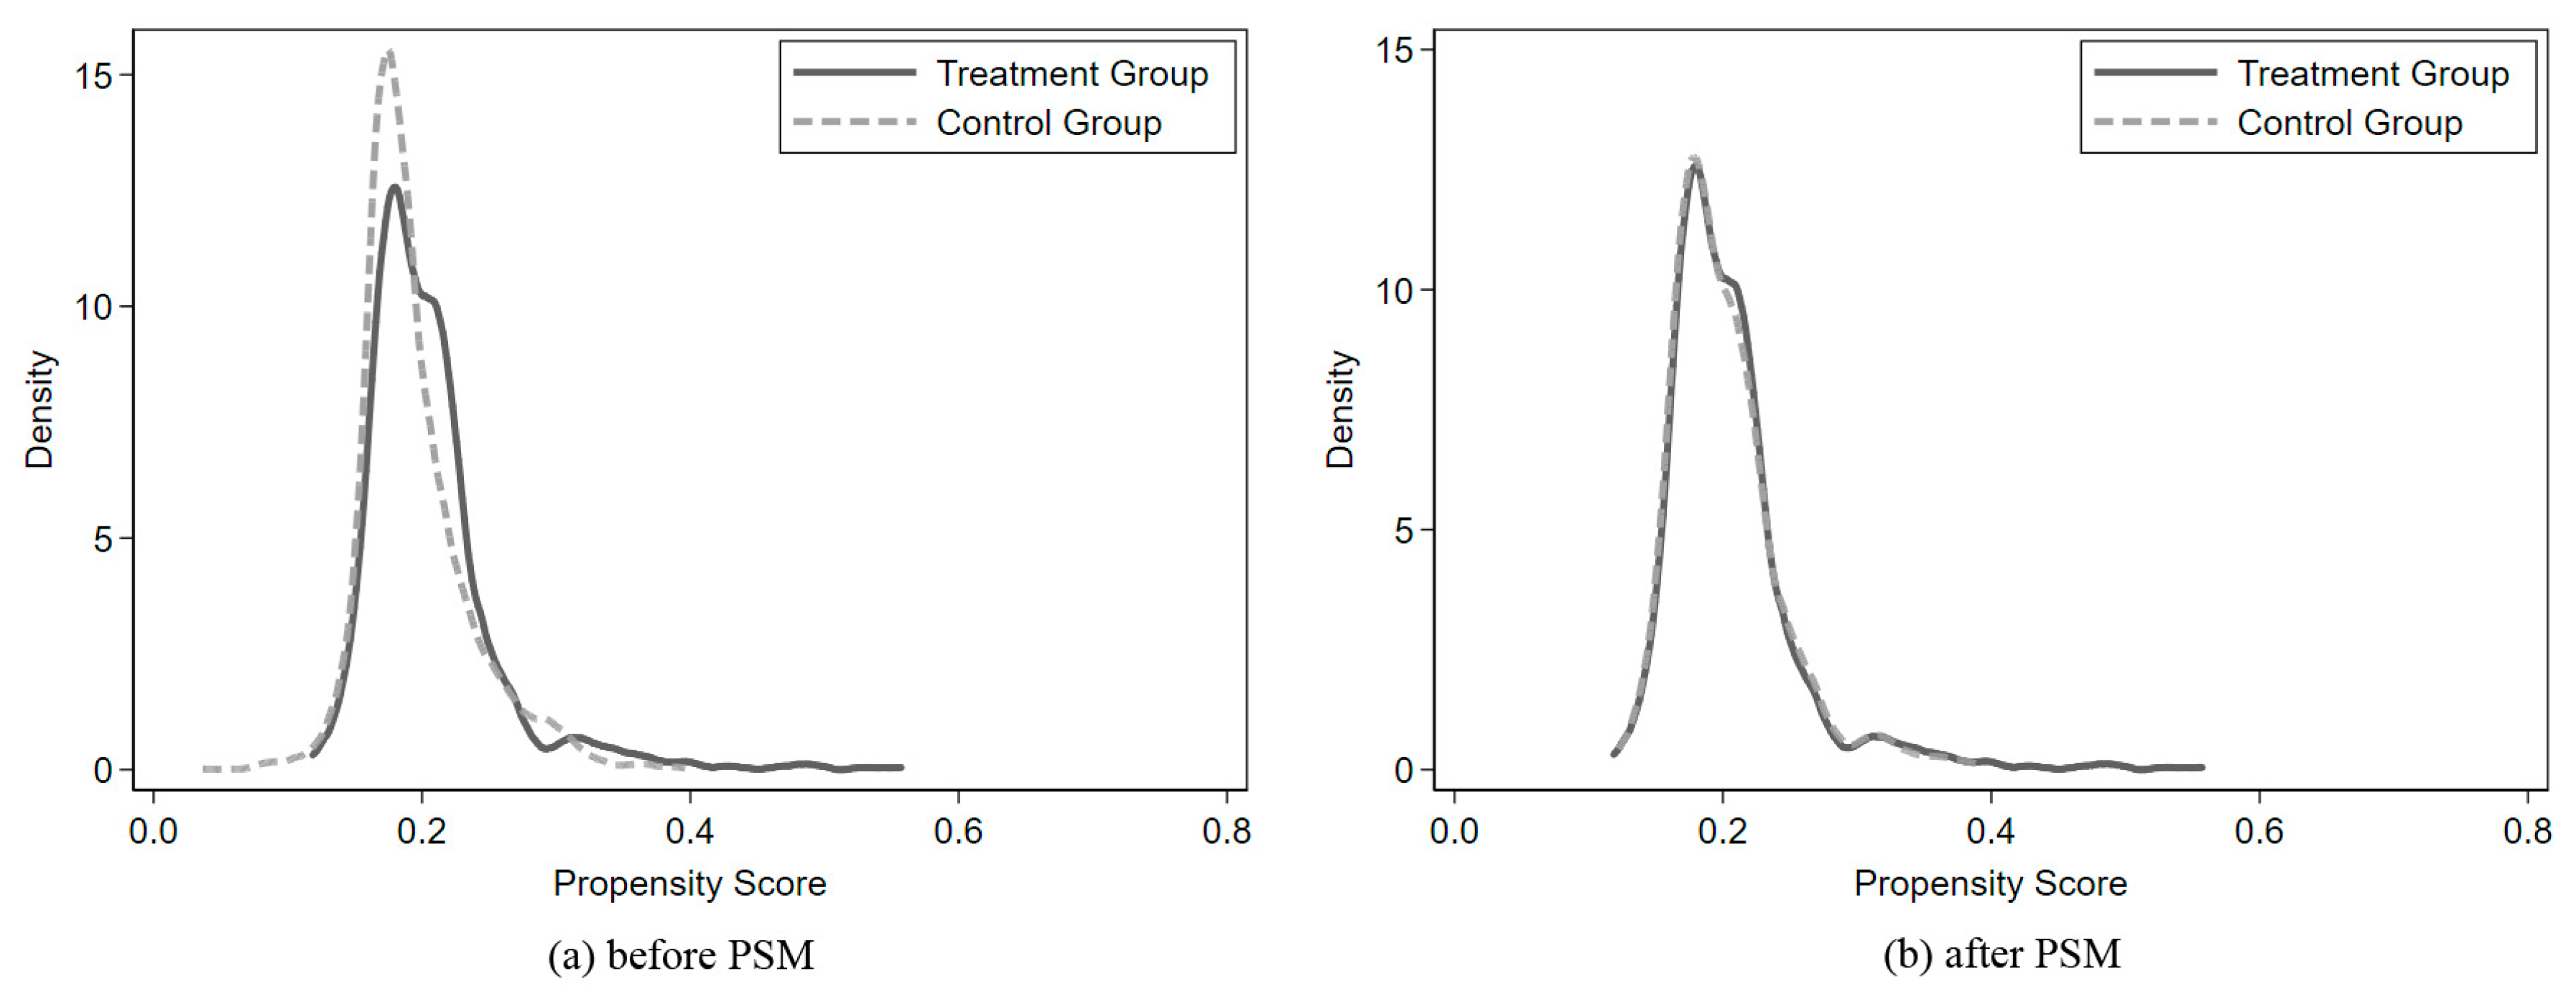
4.1. The Results of PSM

According to the previous theoretical analysis and model setting, the PSM method was employed to match the samples of the control group with similar conditions for each NEDC. Table 2 shows the applicability test results of PSM. The results show that the value of the standard bias of most covariates was smaller than 10%, and the t-test results showed that there was little systematic difference between the two groups. In addition, Figure 4 gives the propensity score distributions of PSM, and we found that most of the observations (99.3%) were supported, and only a few samples (0.7%) were lost in this study. Figure 5 shows the distribution of the propensity score kernel density and the difference between the two groups as being significantly reduced after PSM. The curves even partially coincided with each other, which means the two groups were more similar after matching, indicating the validity of the PSM method.

4.2. The Results of PSM-DID

4.2.1. The Benchmark Regression Analysis

This study takes the NEDC policy as a quasi-natural experiment [2] to identify how ULUE changed when the NEDC policy was applied, and Stata 15.2 software was used to estimate the policy effects. The results are shown in Table 3; columns (1) and (2) represent the regression results without and with the control variables, respectively. The benchmark regression results show that the NEDC policy had a significant positive effect on the ULUE. This is consistent with hypothesis H1. In addition, we also found that the coefficient of NEDC, α1, was significantly positive at the 1% level when the control variables were added to the model. Compared with the non-pilot cities, the NEDC policy promoted the growth of the ULUE by 17.0%. The construction of NEDC further rationalized the spatial allocation of socioeconomic factors, such as urban land and investment, and promoted the flow of urban land and other factors to those industries with comparative advantages, which could lead to industrial structure rationalization and more obvious advancement, ultimately affecting the pattern and structure of urban land. These results also show that opening up, human capital, research, and development investment were important factors affecting the ULUE.

4.2.2. The Dynamic Effect Analysis

We have found from the above analysis that the NEDC policy had significant promoting effects on the ULUE. As is shown in Table 3, the estimates of columns (1)–(2) were only the average treatment effect, which did not distinguish whether the effects of the NEDC policy on the ULUE experienced time lag and persistence. To analyze the dynamic effects of the NEDC policy, we further added the dummy variables of the policy implementation. In this study, we generated a series of dummy variables to indicate the five years before becoming an NEDC (pre_5, pre_4, pre_3, pre_2, and pre_1), the year of being an NEDC (current), and the years after the appointment (aft_1, aft_2, aft_3, aft_4, and aft_5). The dynamic effect estimation equation is as follows:
ln U L U E i . t = θ 0 + θ 1 p r e _ 5 + θ 2 p r e _ 4 + θ 3 p r e _ 3 + θ 4 p r e _ 2 + θ 5 p r e _ 1 + θ 6 c u r r e n t   + θ 7 a f t _ 1 + θ 8 a f t _ 2 + θ 9 a f t _ 3 + θ 10 a f t _ 4 + θ 11 a f t _ 5 + θ 12 X i . t + A i + T t + ε i . t
By constructing the dynamic regression model, we could quantitatively measure the dynamic effects and time lags of the NEDC policy. The results are shown in column (3)–(4) of Table 3. We can find that the coefficients of the dummy years before becoming NEDCs, θi, were not significant, indicating there was no difference between the NEDCs and the non-pilot cities. We also found that the NEDC policy played an essential role in the years of current, aft_1, aft_2, aft_3, aft_4, and aft_5, which means the effect of the NEDC policy was sustainable for the growth of the ULUE. This is in line with the findings of Xu [32]. In conclusion, the NEDC policy had a continuous promotion effect on the ULUE, and there was no lag effect.

4.3. Mediating Effect Analysis

The construction of NEDCs has an impact on the development of local industries by promoting the adjustment and improvement of the industrial structure in terms of advancement and rationalization and finally affecting the growth of the ULUE. To explore the mediating effects of industrial structure, we further decomposed Industrial Structure into ISA and ISR and empirically tested the mediating effect of ISA and ISR separately.

4.3.1. The Mediating Effect of ISA

We tested the mediating effect of ISA next. The mediating effect regression results of ISA are reported in columns (1)–(3) of Table 4. The result of column (4) shows that the effect of ISA on the ULUE was significantly positive at the 1% level, which meant that ISA could significantly promote the growth of the ULUE. Specifically, ISA was not only the driving force but also the specific embodiment of industrial structure upgrading and development. ISA provides new paths for the sustainable development of the social economy and the growth of the ULUE. To further explore the pilot policy effect of NEDC on ISA, the result of column (1) shows that NEDC could significantly affect the development of ISA, and the ISA of the NEDCs has improved by 6.5% compared with the non-pilot cities.
The results of columns (1) and (2) comprehensively show that the NEDC policy could affect the growth of the ULUE by promoting ISA while the mediating effect of ISA was 0.060 (0.065 × 0.926); this means that ISA has mediating effects rather than masking effects on the ULUE. The results verified Hypothesis H2a. The total effect of NEDC on the ULUE was 0.170, and the direct effect of NEDC on the ULUE was 0.110 (0.170–0.060) when we controlled the mediating effects of NEDC on ISA.
To further test whether the mediating effect of ISA was complete or not, this study took the ULUE and ISA into the model simultaneously. The result in column (3) of Table 4 shows that when controlled for the mediating effect of ISA, the impact of NEDC on the ULUE was still significantly positive at the 1% level, and the coefficient of NEDC was slightly smaller than that of the benchmark regression result, which further verified Hypothesis H2b. The existence of the mediating effect of ISA was proved again and adjusted to 0.056 (0.065 × 0.865), while the direct effects of the NEDC policy on the ULUE were adjusted to 0.114. This can be explained as follows. The NEDC policy enables the continuous development of high-tech industries, which helps the upgrading of the industrial structure, slowing down economic fluctuations, enhancing investor confidence, and promoting the steady growth of the urban economy in the long run [33]. This is also consistent with real economic development.

4.3.2. The Mediation Effect of ISR

We first tested the mediating effect of ISR. The mediating effect regression results of ISR are shown in columns (4)–(6) of Table 4. The result in column (4) shows that the effect of ISR on the ULUE was significantly positive, indicating that ISR could also significantly promote the ULUE. This result is also in line with Hypothesis H2.
To further investigate the influence of NEDC on ISR, the result was reported in column (5) of Table 4. The mediating effect of ISR was 0.009 (0.087 × 0.102), and when the effect of NEDC on ISR was controlled, the direct effect of the NEDC policy on the ULUE was 0.161 (0.170–0.009). However, the coefficient of NEDC on ISR was positive but not significant and only reduced by 5.1% compared with the benchmark regression result. Therefore, we can conclude that the mediating effect of ISR was not obvious. When NEDC and ISR were taken into the mediating model simultaneously, the coefficient of ISR was significantly positive at the 1% level, which indicated that ISR has a direct effect rather than a mediating effect on the growth of the ULUE. This is in line with the study of Tang et al. [41] and partially verifies Hypothesis H2b. The explanation may be as follows: ISR represents the relationship and coordination degree between various industries and the spatial distribution pattern of socioeconomic factors, while the impact of NEDC on the industrial structure can be reflected in the development of traditional and backward industries. The transformation and development of Chinese emerging industries are mainly reflected in the concentration of industrial development in the tertiary industry, which can be described as ISA rather than ISR; therefore, the effect of the NEDC policy on ISR maybe not be significant. In addition, there may be time lag effects of NEDC on ISR, meaning that the impact was not significant during the research period of this study.

4.4. Robustness Test

To ensure the robustness of the regression results, we conducted three robustness tests: (1) We considered that relevant policies might have impacts on ULUE. This study excluded the pilot cities of low-carbon city pilot cities [52] and national innovation city pilot policy [53] based on the existing research, and the results are reported in columns (1)–(2) of Table 5; (2) We excluded the core city samples. Cities with higher administrative levels are usually equipped with better infrastructure, more developed economics, and other supporting conditions, which may have imitation effects and demonstration effects on their neighboring regions, resulting in selection heterogeneity. To avoid the influence of extremely developed cities, 33 municipalities, provincial capitals, and sub-provincial cities [54] were eliminated from the total samples in this study. The results are reported in columns (3)–(4) of Table 5. (3) Finally, we eliminated extreme values. To minimize the effect of extreme values, all the continuous variables were winsorized at 1% and 99% [55], and the data below the 1% quantile and above the 99% quantile were replaced by the 1% and 99% quantiles, respectively. The results are reported in columns (5)–(6) in Table 5. It was found that the coefficients of NEDC in all the models were significantly positive, ranging from 0.163 to 0.431, which is in line with the benchmark regression results, indicating the robustness of the conclusions.

5. Discussion: Why Do Urban Characteristics Matter?

To avoid the analysis based on the overall sample and cover the potential impact differences of the NEDC policy for cities with different characteristics, such as regional location and urban innovation capabilities, this study further examined the heterogeneous effects of NEDC on ULUE in cities with different regional locations and different urban innovation capabilities.

5.1. Regional Heterogeneity: The Better the Regional Location, the Stronger the Policy Effect?

The construction of NEDCs must take into account various factors, such as the urban economic structure, resource endowment, and the industrial spatial layout in different regions. The NEDC policy is mainly aimed at the service industry and high-tech industries, and its implementation effects in different regions may be affected by the local policy environment and restrictions. Meanwhile, factors such as the natural environment, topography, and climatic conditions in different locations also have an impact on the construction of new energy demonstration cities. To explore the role of regional location and its effect on the NEDC policy and ULUE, 285 cities are divided were three regions, that is, the eastern, central, and western regions (see Figure 2). We followed the previous research [33,56] and set the following model:
ln U L U E i t = ω 0 + ω 1 N E D C i t × L o c a t i o n + ω 2 X i t + A i + T t + ε i t
where Location refers to the three regional variables, and the coefficient, ω1, describes the effect of NEDC on the ULUE in different regions. The results are reported in columns (1)–(3) of Table 6.
From the perspective of regional location, the coefficients of NEDC were all significantly positive, which showed that even if the geographic locations of cities were different, the NEDC policy could still promote the growth of the ULUE, which proved the robustness of the benchmark regression. Notably, the coefficients of NEDC in columns (2) and (3) of Table 6 were significantly positive at the 5% and 10% levels, respectively, while it was not significant in column (1) of Table 6. These results show that the NEDC policy may have greater effects in less developed areas such as western and central China, while this kind of promoting effect in more developed cities in eastern China is not obvious, showing significant regional heterogeneity. This can be explained as follows. In economically developed areas of eastern China, a well-established energy system and market have been formed due to the early application of advanced technologies and rapid economic development. These mature industrial chains and market systems may impose constraints on the implementation and promotion of policies that aim to build new energy demonstration cities. Additionally, the energy consumption structure in the eastern region is relatively stable, and the demand and acceptance of new energy by residents and businesses may be relatively low, with a correspondingly higher energy substitution cost. These factors could all affect the implementation and effectiveness of the policy. Furthermore, the experience and resources of the government and enterprises in economic development and energy construction are relatively abundant in the eastern region. They may be more inclined to implement mature policies and programs, while the policy of building new energy demonstration cities is relatively novel and may require a longer promotion period and technological adaptation period. In summary, these factors may be among the reasons why the policy’s effectiveness in building new energy demonstration cities is relatively unclear in economically developed areas of eastern China. This finding also indicates that the NEDC policy can not only promote the growth of the ULUE but also help narrow the regional gaps and promote coordinated regional development if the spatial layout of NEDCs is reasonable.

5.2. Urban Innovation Heterogeneity: The Higher the Urban Innovation, the Stronger the Policy Effect?

The objective of the NEDC policy is to promote sustainable energy development, including land use planning and management. The capacity for urban innovation encompasses diverse dimensions such as economy, technology, talent, and policy, significantly influencing the potential for development and competitiveness of the city. Therefore, it is crucial to consider the impact of urban innovation capacity when examining the effects of NEDC policies on ULUE. Urban innovation capacity directly affects the research and development of technology and the application of sustainable energy, as well as its comprehension and responsiveness to new energy policies. This examination enabled a thorough exploration of the influence mechanism of urban innovation capacity on the implementation of pilot city policies and land use efficiency, ultimately facilitating the provision of scientific policy recommendations and references for the construction of NEDCs. Present studies tend to employ the number of patents applied or authorized to measure the urban innovation capacity [57,58]; however, these kinds of data are lacking in the openness, timeliness, and completeness of the information. Therefore, in this study, we learned from the research of Kou and Liu [59], selected the urban innovation index, and calculated it in the following years according to the computational model put forward by FIND to enlarge the sample. Further, took take the 75% quantile and 50% quantile of the urban innovation index as the division criterion to divide the sample city into high-innovation cities, medium-innovation cities, and low-innovation cities. The model was set as follows:
ln U L U E i t = η 0 + η 1 N E D C i t × I n n o v a t i o n + η 2 X i . t + A i + T t + ε i t
where Innovation represents urban innovation capacity, the coefficient, η1, describes the effect of NEDC on the ULUE of cities with different urban innovation capacities. The results are reported in columns (4)–(6) of Table 6.
From the perspective of urban innovation, the regression coefficients of medium-innovation cities and low-innovation cities were both significantly positive, while high-innovation cities were positive but not significant, which means that the NEDC policy in low-innovation cities and medium-innovation cities could greatly promote the growth of the ULUE. This conclusion is consistent with that of Liu and Zhao [60]. Cities with higher innovation capabilities enjoy superior advantages in technology, talent, and policy, enabling them to respond and adapt more swiftly to NEDC pilot policies, and are more likely to achieve policy objectives. However, such cities may also encounter specific challenges that could mitigate the effectiveness of these policies. For example, in these regions, the developmental pace of new energy technologies may be faster, but concurrently, it could be more complex and diverse, with heightened competition among various technologies, resulting in increased challenges when selecting the appropriate technologies and investment directions during policy implementation. Moreover, regions with higher innovation capabilities typically have higher levels of economic development, which could translate into the lower demand and willingness of residents to adopt new energy sources and comparatively higher energy substitution costs. These factors may also impede the implementation effectiveness of NEDC pilot policies. Therefore, when implementing such policies in regions with higher innovation capabilities, it is crucial to consider the local context comprehensively and develop corresponding policies and measures that can maximize policy effectiveness. Additionally, it is imperative to conduct regular evaluations of policy effectiveness throughout the implementation process to identify and address these issues promptly, ensuring that policies achieve the intended effects.

5.3. Limitations and Future Perspectives

In this study, we explored the effects of the NEDC policy on the ULUE from the perspective of the mediating effect of ISA and ISR. However, there are still some limitations that need to be further explored in future research. Firstly, considering the availability of the sample data, we excluded the cities with new energy demonstration industrial parks, which could lead to missing data. Secondly, the selection of the ULUE indicator and control variables all came from previous studies, which might not reflect the orientation of green and low-carbon utilization of urban land. Therefore, future research should choose these indicators according to the research background and research questions to enhance the rationality of the research design and the validity of the policy recommendations. Thus, researchers need to use more methods (e.g., synthetic control method and instrumental variable method) to expand our understanding of the interaction between the NEDC policy and ULUE.

6. Conclusions and Policy Implications

6.1. Conclusions

Amidst the escalating gravity of global environmental pollution, climate change, and fossil energy dependence, nations worldwide are persistently engaging in recalibrating their energy infrastructure to align with the clarion call of the United Nations Climate Change Conference (UNCCC) and their Sustainable Development Goals (SDGs). Their collective endeavor seeks to contribute to China’s pursuit of carbon peaking and carbon neutrality while concurrently fostering sustainable socioeconomic development on a global scale. Since the NEDC policy was first proposed in 2012, the past decade has witnessed the rapid development of the NEDC construction and urban industrial structure, which has further affected the growth of the ULUE. In this regard, the PSM-DID model was employed to empirically explore the mechanism and effect of the NEDC policy on the ULUE based on a dataset of 285 Chinese cities during 2003–2019. Moreover, a mediating model was conducted to verify the mediating effects of ISA and ISR. Furthermore, rigorous robustness tests and heterogeneity analyses were undertaken. The key findings of this study are summarized as follows:
(1)
The establishment of NEDCs yielded a substantial enhancement in ULUE. By the investment-pulling effect, innovation-driven effect, and industrial structure effect, the construction of these demonstration cities exerted a transformative influence on the flow of urban economic production factors, thereby impacting the intricate fabric and configuration of urban land use. The results of the PSM-DID model show that the NEDC policy increased the ULUE by 17.0%, indicating that the NEDC policy was beneficial to the growth of the ULUE. This dynamic effect analysis also showed that the dynamic effect of NEDC on ULUE experienced a steady growth trend from the implementation of the NEDC policy.
(2)
It is noteworthy to mention that the process of NEDC construction engendered a mediating effect on the ULUE through the prism of industrial structure. Among these effects, the mediating impact of industrial structure advancement was the most pronounced, while the mediating impact of industrial structure rationalization did not manifest a statistically significant effect.
(3)
Remarkable disparities arise in the influence of the NEDC policy on the ULUE, which is contingent upon urban geographic location and innovative capacity. The heterogeneity analysis revealed the sequential augmentation of the promotion effect on ULUE, moving from eastern to central to western cities, as well as from cities with high innovation capacities to those with medium and low innovation capacities. Furthermore, in comparison to eastern cities and cities with high innovation ability, the central and western regions, along with cities possessing a medium and high innovation capacity, experienced substantial improvements in ULUE through the implementation of demonstration city construction initiatives.

6.2. Policy Implications

Drawing upon the aforementioned conclusions, this paper presents the following policy implications with a global perspective and dimension that could serve as a reference for countries intending to explore the construction of new energy demonstration cities:
(1)
The government in developing countries should steadfastly adhere to the New Energy Demonstration City (NEDC) policy and endeavor to expand its pilot program on a national scale. When recognized as a vital measure to bolster high-quality development, the governments should enhance the selection criteria for NEDC designation. Local governments, leveraging their regional characteristics, should actively vie for recognition as NEDC pilot cities, thereby enjoying associated policy incentives, including tax benefits, financial subsidies, and technological support. These incentives could attract high-tech enterprises and stimulate social investment, thereby elevating the productivity and efficiency of urban land. Simultaneously, customized selection criteria should be established to accommodate temporal and local conditions, guiding all regions to proactively apply for pilot city status, fostering a competitive environment, and propelling the harmonized development of regional land use and urban economy.
(2)
Recognizing the considerable positive mediating effect of the Industrial Structure Adjustment (ISA) in the relationship between the NEDC policy and ULUE, local governments should prudently steer the development trajectory of local high-tech industries, contributing to the advancement of regional new energy and low-carbon economies. On one hand, local governments should enhance talent support and infrastructure development for new energy initiatives, facilitating the unhindered flow of socioeconomic factors and fostering the growth of high-tech industries. On the other hand, local governments should support an effective transition from primary and secondary industries to tertiary industries, as well as a shift from high-pollution industries to low-carbon industries through strategic industrial development planning. This approach could ultimately fuel the progress of ULUE.
(3)
The establishment of NEDCs should duly account for heterogeneity among cities. The governments of various countries should formulate targeted support policies according to the location conditions of different types of cities in different countries, accurately locate the development direction, and systematically expand the scope of demonstration cities, with particular emphasis on less developed countries and cities, as well as cities with low innovation capabilities. Concurrently, local governments should diligently monitor and evaluate their policy’s impact, implementing effective NEDC monitoring and a withdrawal mechanism to ensure the long-term efficacy of the NEDC policy, which is of great significance for the realization of SDGs and China’s goals of carbon peaking and carbon neutrality.

Author Contributions

Conceptualization: M.W.; Methodology: M.W. and Y.D.; Formal analysis and investigation: N.L. and Y.T.; Writing—original draft preparation: M.W.; Writing—review and editing: M.W.; Funding acquisition: M.W.; Resources: Y.T. and M.W. All authors have read and agreed to the published version of the manuscript.

Funding

This research was funded by the Special Fund of Jiangsu Province Carbon Peak and Carbon Neutral Technology Innovation [BK20220037] and Science and Technology Project of Jiangsu Provincial Natural Resources Department [KJXM2022035].

Institutional Review Board Statement

Not applicable.

Informed Consent Statement

Not applicable.

Data Availability Statement

Data are available on request. The detailed experimental data presented in this study are available on request from the corresponding author.

Acknowledgments

The authors would like to thank the reviewers for their expertise and valuable input.

Conflicts of Interest

The authors declare no conflict of interest.

References

  1. Alam, M.M.; Murad, M.W.; Noman, A.H.M.; Ozturk, I. Relationships among carbon emissions, economic growth, energy consump-tion and population growth: Testing Environmental Kuznets Curve hypothesis for Brazil, China, India and Indonesia. Ecol. Indic. 2016, 70, 466–479. [Google Scholar] [CrossRef]
  2. Yang, X.; Zhang, J.; Ren, S.; Ran, Q. Can the new energy demonstration city policy reduce environmental pollution? Evidence from a quasi-natural experiment in China. J. Clean. Prod. 2020, 287, 125015. [Google Scholar] [CrossRef]
  3. Su, Y.; Yu, Y.-Q. Spatial agglomeration of new energy industries on the performance of regional pollution control through spatial econometric analysis. Sci. Total. Environ. 2019, 704, 135261. [Google Scholar] [CrossRef] [PubMed]
  4. Fan, F.; Zhang, X. Transformation effect of resource-based cities based on PSM-DID model: An empirical analysis from China. Environ. Impact Assess. Rev. 2021, 91, 106648. [Google Scholar] [CrossRef]
  5. Lai, L.; Huang, X.; Yang, H.; Chuai, X.; Zhang, M.; Zhong, T.; Chen, Z.; Chen, Y.; Wang, X.; Thompson, J.R. Carbon emissions from land-use change and management in China between 1990 and 2010. Sci. Adv. 2016, 2, e1601063. [Google Scholar] [CrossRef]
  6. Lu, X.; Chen, D.; Kuang, B.; Zhang, C.; Cheng, C. Is high-tech zone a policy trap or a growth drive? Insights from the perspective of urban land use efficiency. Land Use Policy 2020, 95, 104583. [Google Scholar] [CrossRef]
  7. Gao, X.; Zhang, A.; Sun, Z. How regional economic integration influence on urban land use efficiency? A case study of Wuhan metropolitan area, China. Land Use Policy 2019, 90, 104329. [Google Scholar] [CrossRef]
  8. Wang, H.; Wang, L.; Su, F.; Tao, R. Rural residential properties in China: Land use patterns, efficiency and prospects for reform. Habitat Int. 2012, 36, 201–209. [Google Scholar] [CrossRef]
  9. Au, C.; Henderson, J.V. Are Chinese Cities Too Small? Rev. Econ. Stud. 2006, 73, 549–576. [Google Scholar] [CrossRef]
  10. Xie, H.; Wang, W. Spatiotemporal differences and convergence of urban industrial land use efficiency for China’s major economic zones. J. Geogr. Sci. 2015, 25, 1183–1198. [Google Scholar] [CrossRef]
  11. Wu, C.; Wei, Y.D.; Huang, X.; Chen, B. Economic transition, spatial development and urban land use efficiency in the Yangtze River Delta, China. Habitat Int. 2017, 63, 67–78. [Google Scholar] [CrossRef]
  12. Liu, S.; Xiao, W.; Li, L.; Ye, Y.; Song, X. Urban land use efficiency and improvement potential in China: A stochastic frontier analysis. Land Use Policy 2020, 99, 105046. [Google Scholar] [CrossRef]
  13. Zhu, X.; Li, Y.; Zhang, P.; Wei, Y.; Zheng, X.; Xie, L. Temporal–spatial characteristics of urban land use efficiency of China’s 35mega cities based on DEA: Decomposing technology and scale efficiency. Land Use Policy 2019, 88, 104083. [Google Scholar] [CrossRef]
  14. Long, L.-J. Eco-efficiency and effectiveness evaluation toward sustainable urban development in China: A super-efficiency SBM–DEA with undesirable outputs. Environ. Dev. Sustain. 2021, 23, 14982–14997. [Google Scholar] [CrossRef]
  15. Cheng, L.; Liu, C. Modelling urban growth under contemporary China’s transferable development rights programme: A case study from Ezhou, China. Environ. Impact Assess. Rev. 2022, 96, 106830. [Google Scholar] [CrossRef]
  16. Lu, X.; Wang, M.; Tang, Y. The Spatial Changes of Transportation Infrastructure and Its Threshold Effects on Urban Land Use Efficiency: Evidence from China. Land 2021, 10, 346. [Google Scholar] [CrossRef]
  17. Cui, X.; Fang, C.; Wang, Z.; Bao, C. Spatial relationship of high-speed transportation construction and land-use efficiency and its mechanism: Case study of Shandong Peninsula urban agglomeration. J. Geogr. Sci. 2019, 29, 549–562. [Google Scholar] [CrossRef]
  18. Lu, X.-H.; Jiang, X.; Gong, M.-Q. How land transfer marketization influence on green total factor productivity from the approach of industrial structure? Evidence from China. Land Use Policy 2020, 95, 104610. [Google Scholar] [CrossRef]
  19. Jiang, X.; Lu, X.; Liu, Q.; Chang, C.; Qu, L. The effects of land transfer marketization on the urban land use efficiency: An empirical study based on 285 cities in China. Ecol. Indic. 2021, 132, 108296. [Google Scholar] [CrossRef]
  20. Wu, M. Measurement of Regional Industrial Ecological Efficiency in China and an Analysis of Its Influencing Factors. J. World Econ. Res. 2020, 9, 33–40. [Google Scholar]
  21. Koroso, N.H.; Zevenbergen, J.A.; Lengoiboni, M. Urban land use efficiency in Ethiopia: An assessment of urban land use sus-tainability in Addis Ababa. Land Use Policy 2020, 99, 105081. [Google Scholar] [CrossRef]
  22. Wang, A.; Lin, W.; Liu, B.; Wang, H.; Xu, H. Does Smart City Construction Improve the Green Utilization Efficiency of Urban Land? Land 2021, 10, 657. [Google Scholar] [CrossRef]
  23. Liu, J.; Feng, H.; Wang, K. The Low-Carbon City Pilot Policy and Urban Land Use Efficiency: A Policy Assessment from China. Land 2022, 11, 604. [Google Scholar] [CrossRef]
  24. Shen, L.; Wu, Y.; Lou, Y.; Zeng, D.; Shuai, C.; Song, X. What drives the carbon emission in the Chinese cities?—A case of pilot low carbon city of Beijing. J. Clean. Prod. 2018, 174, 343–354. [Google Scholar] [CrossRef]
  25. Dong, L.; Fujita, T.; Zhang, H.; Dai, M.; Fujii, M.; Ohnishi, S.; Geng, Y.; Liu, Z. Promoting low-carbon city through industrial symbiosis: A case in China by applying HPIMO model. Energy Policy 2013, 61, 864–873. [Google Scholar] [CrossRef]
  26. Nesta, L.; Vona, F.; Nicolli, F. Environmental policies, competition and innovation in renewable energy. J. Environ. Econ. Manag. 2014, 67, 396–411. [Google Scholar] [CrossRef]
  27. Kaygusuz, K. Energy for sustainable development: A case of developing countries. Renew. Sustain. Energy Rev. 2012, 16, 1116–1126. [Google Scholar] [CrossRef]
  28. Shahbaz, M.; Hye, Q.M.A.; Tiwari, A.K.; Leitão, N.C. Economic growth, energy consumption, financial development, international trade and CO2 emissions in Indonesia. Renew. Sustain. Energy Rev. 2013, 25, 109–121. [Google Scholar] [CrossRef]
  29. Lou, W. The Study on New Energy City Planning Methods Based on “6A” Concept. J. Huazhong Univ. Sci. Technol. (Soc. Sci. Ed.) 2014, 28, 54–59. [Google Scholar]
  30. Wang, G. Studying and popularizing demonstration achievements to promote energy system reform and energy-saving city construction: Summarizing the experience of Turpan new energy demonstration area in combination with the spirit of central urban work conference. City Plan. Rev. 2016, 40, 9–13. [Google Scholar]
  31. Wu, J.; Zuidema, C.; Gugerell, K. Experimenting with decentralized energy governance in China: The case of New Energy Demonstration City program. J. Clean. Prod. 2018, 189, 830–838. [Google Scholar] [CrossRef]
  32. Xu, H. New Energy Demonstration Cities and Regional Economic Growth. East China Econ. Manag. 2021, 35, 76–85. [Google Scholar]
  33. Wang, Q.; Yi, H. New energy demonstration program and China’s urban green economic growth: Do regional characteristics make a difference? Energy Policy 2021, 151, 112161. [Google Scholar] [CrossRef]
  34. Lu, J.; Wang, E. Impact of new energy demonstration city construction on regional environmental pollution control. Resour. Sci. 2019, 41, 2107–2118. [Google Scholar] [CrossRef]
  35. Zhang, X.; Zhang, R.; Zhao, M.; Wang, Y.; Chen, X. Policy Orientation, Technological Innovation and Energy-Carbon Performance: An Empirical Study Based on China’s New Energy Demonstration Cities. Front. Environ. Sci. 2022, 10, 846742. [Google Scholar] [CrossRef]
  36. Li, X.; Yao, X.; Guo, Z.; Li, J. Employing the CGE model to analyze the impact of carbon tax revenue recycling schemes on em-ployment in coal resource-based areas: Evidence from Shanxi. Sci. Total Environ. 2020, 720, 137192. [Google Scholar] [CrossRef]
  37. Zhang, J.; Lyu, Y.; Li, Y.; Geng, Y. Digital economy: An innovation driving factor for low-carbon development. Environ. Impact Assess. Rev. 2022, 96, 106821. [Google Scholar] [CrossRef]
  38. Xie, H.; Chen, Q.; Lu, F.; Wu, Q.; Wang, W. Spatial-temporal disparities, saving potential and influential factors of industrial land use efficiency: A case study in urban agglomeration in the middle reaches of the Yangtze River. Land Use Policy 2018, 75, 518–529. [Google Scholar] [CrossRef]
  39. Proque, A.L.; Dos Santos, G.F.; Betarelli Junior, A.A.; Larson, W.D. Effects of land use and transportation policies on the spatial dis-tribution of urban energy consumption in Brazil. Energ. Econ. 2020, 90, 104864. [Google Scholar] [CrossRef]
  40. Liu, J.; Cheng, Z.; Zhang, H. Does industrial agglomeration promote the increase of energy efficiency in China? J. Clean Prod. 2017, 164, 30–37. [Google Scholar] [CrossRef]
  41. Tang, M.; Li, Z.; Hu, F.; Wu, B. How does land urbanization promote urban eco-efficiency? The mediating effect of industrial structure advancement. J. Clean. Prod. 2020, 272, 122798. [Google Scholar] [CrossRef]
  42. Lu, X.; Kuang, B.; Li, J. Regional difference decomposition and policy implications of China’s urban land use efficiency under the environmental restriction. Habitat Int. 2018, 77, 32–39. [Google Scholar] [CrossRef]
  43. Beck, T.; Levine, R.; Levkov, A. Big Bad Banks? The Winners and Losers from Bank Deregulation in the United States. J. Finance 2010, 65, 1637–1667. [Google Scholar] [CrossRef]
  44. Gonzalez, O.; MacKinnon, D.P. A Bifactor Approach to Model Multifaceted Constructs in Statistical Mediation Analysis. Educ. Psychol. Meas. 2016, 78, 5–31. [Google Scholar] [CrossRef] [PubMed]
  45. Baron, R.M.; Kenny, D.A. The moderator-mediator variable distinction in social psychological research: Conceptual, strategic, and statistical considerations. J. Pers. Soc. Psychol. 1986, 51, 1173–1182. [Google Scholar] [CrossRef] [PubMed]
  46. Barbosa, J.A.; Bragança, L.; Mateus, R. Assessment of Land Use Efficiency Using BSA Tools: Development of a New Index. J. Urban Plan. Dev. 2015, 141, 4014020. [Google Scholar] [CrossRef]
  47. Jiao, L.; Xu, Z.; Xu, G.; Zhao, R.; Liu, J.; Wang, W. Assessment of urban land use efficiency in China: A perspective of scaling law. Habitat Int. 2020, 99, 102172. [Google Scholar] [CrossRef]
  48. Zhang, G.; Zhang, P.; Xiu, J.; Chai, J. Are energy conservation and emission reduction policy measures effective for industrial structure restructuring and upgrading? Chin. J. Popul. Resour. Environ. 2018, 16, 12–27. [Google Scholar] [CrossRef]
  49. Xie, X.; Fang, B.; Xu, H.; He, S.; Li, X. Study on the coordinated relationship between Urban Land use efficiency and ecosystem health in China. Land Use Policy 2020, 102, 105235. [Google Scholar] [CrossRef]
  50. Chen, Z.; Chen, S.; Liu, C.; Nguyen, L.T.; Hasan, A. The effects of circular economy on economic growth: A quasi-natural experiment in China. J. Clean. Prod. 2020, 271, 122558. [Google Scholar] [CrossRef]
  51. Sun, C.; Zhan, Y.; Du, G. Can value-added tax incentives of new energy industry increase firm’s profitability? Evidence from financial data of China’s listed companies. Energ. Econ. 2020, 86, 104654. [Google Scholar] [CrossRef]
  52. Song, Q.; Qin, M.; Wang, R.; Qi, Y. How does the nested structure affect policy innovation? Empirical research on China’s low carbon pilot cities. Energ. Policy 2020, 144, 111695. [Google Scholar] [CrossRef]
  53. Muniba, M.; Yu, B. Does Innovative City Pilot Policy Stimulate the Chinese Regional Innovation: An Application of DID Model. Int. J. Environ. Res. Public Health 2023, 20, 1245. [Google Scholar] [CrossRef] [PubMed]
  54. Yang, X.; Lin, S.; Zhang, J.; He, M. Does High-Speed Rail Promote Enterprises Productivity? Evidence from China. J. Adv. Transp. 2019, 2019, 1279489. [Google Scholar] [CrossRef]
  55. Tan, Y.; Tian, X.; Zhang, X.; Zhao, H. The real effect of partial privatization on corporate innovation: Evidence from China’s split share structure reform. J. Corp. Financ. 2020, 64, 101661. [Google Scholar] [CrossRef]
  56. Lin, J.; Long, C.; Yi, C. Has central environmental protection inspection improved air quality? Evidence from 291 Chinese cities. Environ. Impact Assess. Rev. 2021, 90, 106621. [Google Scholar] [CrossRef]
  57. Ning, L.; Wang, F.; Li, J. Urban innovation, regional externalities of foreign direct investment and industrial agglomeration: Evidence from Chinese cities. Res. Policy 2016, 45, 830–843. [Google Scholar] [CrossRef]
  58. Wang, J.; Cai, S. The construction of high-speed railway and urban innovation capacity: Based on the perspective of knowledge Spillover. China Econ. Rev. 2020, 63, 101539. [Google Scholar] [CrossRef]
  59. Kou, Z.; Liu, X. FIND Report on City and Industrial Innovation in China (2017); Fudan University: Shanghai, China, 2017. [Google Scholar]
  60. Liu, R.; Zhao, R. Do National High-tech Zones Promote Regional Economic Development? Verification Based on Double Dif-ference Method. J. Manag. World 2015, 8, 30–38. [Google Scholar]
Figure 1. The theoretical framework of the NEDC policy affecting the ULUE.
Land 12 01100 g001
Figure 2. The spatial distribution of NEDCs and the study area.
Land 12 01100 g002
Figure 3. Urban land use efficiency (ULUE) in 2003, 2008, 2013, and 2019.
Land 12 01100 g003
Figure 4. Propensity score distributions of PSM.
Land 12 01100 g004
Figure 5. Propensity score kernel density distribution.
Land 12 01100 g005
Table 1. Descriptive statistics of each variable.
VariableDefinitionObsMeanStd. Dev.MinMax
ln ULUEUrban land use efficiency484510.4120.6217.49813.046
NEDCNew energy demonstration city48450.1960.39701
ISAIndustrial structure advancement48452.3690.1451.7102.832
ISRIndustrial structure rationalization48452.6091.274−0.31610.657
OPENEconomic openness48452.0812.465029.358
HCHuman capital48454.4234.103028.730
R&DResearch and development investment48451.4401.6260.00320.907
Table 2. Applicability test of PSM method.
VariableUnmatchedMeanBias
(%)
Reduct |Bias|
(%)
t-Test
MatchedTreatmentControltp > |t|
ISAU2.3852.36513.960.43.910.000
M2.3842.3765.5 1.220.223
ISRU2.7122.58410.180.82.790.005
M2.7002.6751.9 0.420.672
OPENU1.9822.106−5.441.7−1.390.165
M1.9631.8913.1 0.760.449
HCU5.0974.25820.149.15.670.000
M5.0124.58510.2 2.200.028
R&DU1.6671.38414.975.24.820.000
M1.5551.4853.7 0.910.365
Table 3. Results of the benchmark regression.
Variable(1)(2)(3)(4)
NEDC0.308 ***0.170 ***
(7.03)(4.12)
pre_5 0.1960.077
(3.87)(1.65)
pre_4 0.2450.116 *
(4.84)(2.48)
pre_3 0.3050.175
(6.03)(3.73)
pre_2 0.310 *0.172
(6.12)(3.66)
pre_1 0.3530.195 *
(6.97)(4.16)
current 0.403 ***0.232 ***
(7.96)(4.94)
aft_1 0.406 ***0.222 ***
(8.03)(4.72)
aft_2 0.456 ***0.226 ***
(9.01)(4.77)
aft_3 0.439 ***0.253 ***
(8.69)(5.38)
aft_4 0.438 ***0.210 ***
(8.65)(4.44)
aft_5 0.499 ***0.276 ***
(9.86)(5.83)
OPEN −0.008 −0.012 ***
(−1.37) (−4.25)
HC 0.043 *** 0.043 ***
(5.69) (14.13)
R&D 0.101 *** 0.085 ***
(11.63) (20.02)
Constant10.393 ***10.083 ***10.37 ***10.10 ***
(3448.13)(291.99)(1765.59)(654.53)
City effectYESYESYESYES
Year effectYESYESYESYES
R-squared0.0360.203−0.0030.148
Note: t statistics in parentheses. * p < 0.10, *** p < 0.01.
Table 4. Results of the mediating effect model regression.
Variable(1)(2)(3)(4)(5)(6)
ln ULUEISAln ULUEln ULUEISRln ULUE
M0.926 *** 0.865 ***0.102 *** 0.101 ***
(6.56) (5.91)(5.84) (5.83)
NEDC 0.065 ***0.113 * 0.0870.160 ***
(6.54)(2.46) (0.93)(4.17)
OPEN−0.006 *−0.003 *−0.006 *−0.008 *−0.010 *−0.007 *
(−1.05)(−2.34)(−0.94)(−1.48)(−0.76)(−1.26)
HC0.036 ***0.009 ***0.035 ***0.040 ***0.0480 ***0.038 ***
(4.86)(6.94)(4.84)(5.51)(3.68)(5.38)
R&D0.094 ***0.012 ***0.091 ***0.096 ***0.101 ***0.091 ***
(11.44)(6.18)(11.00)(11.80)(6.64)(10.92)
Constant7.943 ***2.311 ***8.085 ***9.851 ***2.263 ***9.855 ***
(24.18)(353.28)(23.69)(176.27)(34.02)(178.81)
City effectYESYESYESYESYESYES
Year effectYESYESYESYESYESYES
R-squared0.2290.1430.2330.2270.0560.236
Note: t statistics in parentheses. * p < 0.10, *** p < 0.01.
Table 5. Results of robustness tests.
VariableEliminate the Interference of Relevant PoliciesExclude Core CitiesEliminate Extreme Values
(1)(2)(3)(4)(5)(6)
NEDC0.305 ***0.431 ***0.282 ***0.169 ***0.311 ***0.163 ***
(6.27)(9.86)(5.73)(3.63)(7.32)(4.08)
OPEN −0.042 *** −0.009 −0.009
(−6.35) (−1.13) (−1.49)
HC −0.042 *** 0.048 *** 0.049 ***
(−4.15) (4.94) (6.92)
R&D −0.112 *** 0.098 *** 0.118 ***
(−10.16) (8.46) (14.08)
Constant−3.451 ***−3.031 ***10.340 ***10.050 ***10.390 ***10.050 ***
(−1040.54)(−69.19)(3141.56)(269.16)(3617.15)(309.34)
City effectYESYESYESYESYESYES
Year effectYESYESYESYESYESYES
R-squared0.0210.1470.0280.1780.0400.233
Note: t statistics in parentheses. *** p < 0.01.
Table 6. Results of heterogeneity analysis.
VariableRegional LocationUrban Innovation Heterogeneity
(1)(2)(3)(4)(5)(6)
NEDC × Eastern0.081
(1.52)
NEDC × Central 0.193 **
(3.08)
NEDC × Western 0.224 *
(2.42)
NEDC × High 0.054
(0.93)
NEDC × Medium 0.205 ***
(4.19)
NEDC × Low 0.250 ***
(3.67)
OPEN−0.009−0.010 *−0.009 *−0.010−0.008 *−0.009 *
(−1.50)(−1.62)(−1.51)(−1.58)(−1.36)(−1.56)
HC0.045 ***0.044 ***0.043 ***0.045 ***0.044 ***0.042 ***
(5.83)(5.70)(5.68)(5.80)(5.70)(5.51)
R&D0.106 ***0.103 ***0.106 ***0.107 ***0.100 ***0.103 ***
(12.21)(11.88)(12.52)(12.48)(11.35)(12.04)
Constant10.08 ***10.09 ***10.08 ***10.08 ***10.08 ***10.09 ***
(285.89)(286.96)(292.28)(286.45)(291.42)(291.81)
City effectYESYESYESYESYESYES
Year effectYESYESYESYESYESYES
Obs481348134813481348134813
R-squared0.1930.1980.1970.1920.2030.203
Note: t statistics in parentheses. * p < 0.10, ** p < 0.05, *** p < 0.01.
Disclaimer/Publisher’s Note: The statements, opinions and data contained in all publications are solely those of the individual author(s) and contributor(s) and not of MDPI and/or the editor(s). MDPI and/or the editor(s) disclaim responsibility for any injury to people or property resulting from any ideas, methods, instructions or products referred to in the content.

