Article

A Framework for a User-Perception-Based Approach to Integrate Landscape Protection in Soft Mobility Planning

by
Irina Di Ruocco
1,*,
Alessio D’Auria
2,
Rosaria R. D’Alterio
2 and
Agostino De Rosa
2
1
Department of Economics, University of Insubria, 21100 Varese, Italy
2
Faculty of Humanities, Università degli Studi Suor Orsola Benincasa, 80134 Naples, Italy
*
Author to whom correspondence should be addressed.
Land 2023, 12(5), 1048; https://doi.org/10.3390/land12051048
Submission received: 6 March 2023 / Revised: 8 May 2023 / Accepted: 9 May 2023 / Published: 11 May 2023
(This article belongs to the Special Issue Feature Papers for Land Planning and Architecture Section)

Abstract

:
The relationship with bike infrastructure is missing in the current examination of user perception, which places a great deal of emphasis on visual aesthetic quality or surveys. Italy is experiencing the great development of cycling infrastructures, and the related plans, in line with sustainability objectives, have the task of examining users in various aspects. The purpose of this study is to examine users’ criteria based on perceptions of the landscape in the presence of cycling infrastructures and to analyze the current infrastructures and understand their alignment with sustainable plans. One of the multiple-criteria decision analysis (MCDA) methods based on fuzzy comprehensive evaluation (FCE) was utilized, and it entails identifying the factors that constitute an index and assessing the priority of these factors in relation to other components. The findings demonstrate that the primary variables are distinct aspects of the landscape that are objective. We discovered that these components perform better for urban than metropolitan sectors in this study, as we divided the scenarios into metropolitan and general (urban, suburban, and coastal urban) scenarios.

1. Introduction

The gradual increase in evidence from the literature, as well as the spread of programs (such as sustainable urban mobility plans and regional plans for cycling mobility) aimed at environmental protection, ecological transition, and the link between landscape and sustainable transportation infrastructure planning, have all played an important and rapidly growing role. Recommendations provided by the UN in the Agenda 2030 and Habitat Agenda [1,2], through the SDGs (SDG 3 on well-being, 9 on “resilient infrastructure”, and 11 on “sustainable cities”), and the European Guidelines for the ecological transition [3], as also fostered by the new European Bauhaus, have highlighted the importance of green networks, the need to focus on the quality of the landscape by enhancing the urban environment, and the improvement of soft mobility measures.
The move towards more sustainable mobility measures that combine mobility systems with natural and green spaces is underlined by the presence of sustainability goals to promote quality of life, well-being, and the preservation of natural spaces. With the new changes taking place, mobility and nature are becoming a unique system influenced by factors such as the urban structure and climate change [4,5]. With this premise, the role of landscape changes and the need more careful planning require appropriate choices and evaluations regarding the impact of these plans and infrastructures on the landscape. The need for cross-sectional studies also draws our attention to the combination of different user needs regarding soft mobility and the challenges to which the landscape is subjected.
Further support for this transition can be seen in local-level programs such as “SUMPs” [6,7] that aim to facilitate the implementation of sustainability measures. In terms of the research subject, the new goals of sustainable mobility and environmental protection need to be balanced with the creation of soft infrastructure that has less impact on the surrounding environment.
With rapid economic development and urbanization, the demand for soft mobility spaces has increased tremendously in recent decades. The development of such spaces in conjunction with green spaces has become one of the most important ways to meet the need for greener mobility with positive environmental and landscape impacts and to reduce traffic congestion and pollution in urban areas. The functions of soft mobility infrastructure are becoming more diverse as it expands. In addition to the space dedicated to users, they are integrated into different spatial contexts; they are associated with a certain well-being, but they are also introduced according to the landscape value of the area, so that new functions have quickly developed.
As the cycling infrastructure is an important area for commuting, shopping, entertainment, and recreation in urban communities, a thorough understanding of users’ perceptions of the environment is needed. Landscape and bicycle infrastructure cause a different perception as psychological factors interact based on the function of use. Bicycle spaces are small, enclosed, and lack contact with nature because they are often designed with inappropriate criteria. If contact with nature is present, the bicycle infrastructure is observed in full synergy and potential with the landscape. These physical characteristics, combined with cultural and psychological factors, influence the types of landscape- or user-oriented policies and measures that aim at landscape promotion for the former and user satisfaction levels for the latter.
In the current debate, environmental protection is focused on green spaces within the urban areas of natural reserved regions. The inclusion of new soft mobility infrastructures could be a problem if the change lacks the promotion of conservation measures to protect the environment [8].
This trend is escalating, but there are still many aspects that are not analyzed in the literature because it involves analyzing the landscape through the psychology and habits of the users who experience this space. The interest in this research is shared across many countries that focus on environmental protection with the promotion of zero-emission policies. The difficulty with this topic lies in the perception of the landscape. This perception is not equally displayed by all users because there are endogenous variables that affect their perceptions.
Users’ perceptions of the landscape have changed, especially as this element influences the design of a landscape plan that corresponds to the different characteristics and traditions of different communities. Landscape characteristics are the result of the interaction between the environment and the community that inhabits the place, so, in some cases, environmental impact assessments can highlight critical issues in the process [9].
Assessing the impact of different types of soft mobility and different types of infrastructure on the environment is considered important in analyzing the relationship between people and the landscape and the way in which it performs, as well as being an important tool when designing projects for the sustainable development of all the above-mentioned elements, to protect the landscape and historic centers for future generations.
While environmental challenges are becoming increasingly critical, and the size of green spaces is shrinking daily, the value of natural resources is being more widely recognized in today’s world. As a result, it is possible to recognize that the landscape is not merely an economic issue to analyze and discuss, but also an aesthetic one [10]. When discussing landscape as an aesthetic entity, “visual quality evaluation” becomes an essential study issue.
Studies on the perceptions of landscape users, from the liminal experiences described by Cullen [11], Lynch [12], Sell and Zube [13], and Porteus [14], up to the most recent studies of environmental aesthetic and environmental psychology, have always focused on the built environment and on the perceptions of pedestrians. Currently, there are few studies concerning landscape users’ perceptions related to cycling infrastructure, and none of them have been conducted in Italy. First, this contribution aims to focus on offering a framework for the Italian context. Additionally, the literature points out that regulation needs new contemporary guidance related to the revolutionary change to which the landscape is subjected.
The paper contributes to academic research by introducing and exploring mobility-based approaches that have not previously been used in landscape perception and preference studies related to landscape evaluations. Specifically, the paper addresses approaches that are relevant to advancing theory and allowing respondents to create their own classifications and concepts, rather than relying solely on constructs provided by the researcher.
To fill the knowledge gaps in the literature, this research aims to create evaluation indices for users’ perceptions of the landscape and to apply a mixed evaluation method, to assess soft mobility infrastructure in Italy. This study enriches the literature on cycling infrastructures, offering an overview of Italy, applying a method that is rarely used in decision-making processes.

2. Literature Review

Currently, the notion of sustainability (also known as a sustainable city or sustainable urban development) is included into the larger concept of smart and sustainable cities [15,16]. In particular, Höjer and Wangel [17] edit and reformulate the well-known Brundtland definition, by taking into account a smart sustainable city as a place “that meets the needs of its present inhabitants without compromising the ability for other people or future generations to meet their needs, and thus, does not exceed local or planetary environmental limitations, and where this is supported by ICT” ([17]; p. 10).
The sustainability concept introduces long-term goals for passenger and freight transport and environmental protection and considers a new human-centered approach; the Urban Mobility Plans (UMPs) have adapted to the new paradigm, gradually shifting to Sustainable Urban Mobility Plans (SUMPs), in which the notion of sustainability is linked not only to the challenge of reducing emissions in the atmosphere but encompasses a wide-ranging perspective with also economic and social issues. It is an opportunity to reflect on habits and tangible actions to promote sustainable development; in fact, UMPs are no longer focused on the notion of “mobility” as infrastructure realization, but rather on “sustainability”, by presenting a human-centered strategy that places the individual and his needs at the center of the project, rather than the physical infrastructures that result from it.
Taking this into account, the SUMPs emphasize the significance of people’ quality of life by recommending the integration of passenger and freight transport demands [16,17,18,19,20].
As a result, a SUMP may be defined as “a strategic plan designed to meet the mobility needs of people and businesses in cities and their surroundings to improve their quality of life. It expands on existing planning practices while taking integration, participation, and evaluation concepts into account” ([21], p. 9).
Strategic environmental assessment is carried out throughout the planning process until it is approved. Indeed, because the SUMP is a strategic plan with a substantial environmental effect, its eligibility for the SEA method must be examined to provide a high degree of environmental protection and promote sustainable development.
One of the key benefits of using SEA in the development of soft mobility networks is that it allows for the identification of potential environmental impacts at an early stage in the decision-making process. This allows for the development of strategies and mitigation measures that can be integrated into the design of the network to minimize its environmental impact. For example, SEA can be used to identify areas where the construction of new infrastructure may have a negative impact on biodiversity or protected habitats. In these cases, alternative routes or designs can be developed that avoid these areas or minimize the impact.
The use of SEA in the development of soft mobility networks can also help to ensure that the network is developed in a way that is socially sustainable. This means that the network is developed in a way that meets the needs of all members of the community, including those who may be more vulnerable or marginalized. For example, SEA can be used to identify areas where the network may have a negative impact on local businesses or where the network may not be accessible to people with disabilities. In these cases, measures can be developed to mitigate the impact or alternative routes can be developed that better meet the needs of these groups. Overall, the use of SEA in the development of soft mobility networks is an important tool in ensuring that these networks are developed in a way that is environmentally and socially sustainable. By identifying potential environmental impacts at an early stage in the decision-making process and developing strategies and measures to mitigate these impacts, SEA can help to ensure that soft mobility networks are developed in a way that supports broader environmental and social goals.
As the European Landscape Convention has stated, landscape perception by people who live and produce the landscape is one of the key elements of sustainability at a local level.
Landscape elements of visual attraction based on human visual characteristics are the basis of the landscape space evaluation of visual quality. Regarding visual perception, an extensive body of literature analyzes user perception, visual value, and landscape value [22,23]. However, it still lacks the connection of the landscape with city features, such as bicycle infrastructure, which, in line with the ecological transition, is becoming increasingly common [24].
As is well known, in the EU, a landscape is an area experienced by people, and its features are the product of human and environmental variables acting and interacting [25]. Landscape is a complex and multidimensional concept [26] that encompasses a wide range of aesthetic, cultural, and environmental elements.
Regarding this, one initiative at the European level is the Green Deal (EGD), adopted by the European Commission in 2019, by which targets are set for the categories of biodiversity, climate change, and sustainable agriculture, including uncultivated agricultural areas, where the implementation of specific land management policies, can contribute to the achievement of these targets, as well as rural development to reduce the impact on the environment [27].
More specifically, the most recent Green Deal sets as a goal the preservation of species and their respective habitats, but, above all, sustainability even in rural areas, with increased goals in terms of decreasing greenhouse gas emissions caused mainly by the transportation sector, which produces a large amount of air and noise pollution, in addition to the fact that the infrastructure dedicated to transportation is the cause of the segmentation of the ever decreasing green areas [28]. However, these goals, as already mentioned, must be accompanied by scrupulous land management and the continuous evolution of the practices to be implemented so that progress can be made in the conservation of all natural resources [29,30].
A European Union instrument that dovetails with the goals of the Green Deal with regard to farmland planning is the Common Agricultural Policy (CAP), whose new reform foresees results from 2023 to 2027 and proposes initiatives that can support sustainable development, although the fact that the CAP does not have suitable planning methods makes the risks to biodiversity more evident as the legislative framework supports farmers who use synthetic products, making it difficult to properly develop sustainable practices [31].
Many topics in sustainability science [32,33] place a strong emphasis on heterogeneous landscapes [34,35,36].
The landscape is changing, but it should be remembered that the landscape should always be considered as a greenway, as a type of urban or suburban corridor that uses natural elements as its main component and combines open spaces with recreational and leisure functions, such as a bicycle path. The concept of the greenway originated in the 1970s [37]. It refers to corridors of linear green open space with ecological significance, leisure and recreation functions, and even historical and cultural value.
It is highlighted by scholars that bike routes with continuous bike lanes, safety awareness, open landscapes, and a large amount of human activity create a positive perception. Among visual elements, the landscape still plays an important role in users’ perceptions. Research results show that the formation of cyclists’ landscape images on greenways is influenced by visual cognitive factors, and special attention should be paid to cyclists’ mental perceptions when designing greenways.
Despite advances in the study of human needs regarding the environment, there are still some limitations regarding landscape users’ perceptions, because researchers tend to study people’s perceptions of outdoor, green, and environmental spaces in terms of quality assessment, impacts, and land use. As a result, systematic research on users’ perceptions is limited.
User perceptions of soft mobility, such as cycling infrastructure, are based on environmental impressions, and environmental psychology studies are concerned with the interrelationship between people (users) and the physical (built) environment [38,39]. Thus, research on the spatial environment can be combined with research on environmental factors and cognitive behavioral mechanisms to provide user-friendly design suggestions for the optimization and enhancement of these spaces.
The distribution of green corridors and their importance in perception refer to ecologically important linear green space corridors. The importance and awareness of these issues have led to proposals to improve urban greenway systems and ecological infrastructure based on landscape ecology principles to implement soft mobility.

2.1. The Relevance of Perception in Landscape Framework

As Porteous [14] has observed, “Psychologists, urban designers, landscape architects and advertisers all stress vision as the chief mode of knowing about the world. So much so, indeed, that when we use the term perception, we almost always mean ‘visual perception’”.
Cycling is a type of motion, and greenway bikers frequently pedal at speeds ranging from 10 to 25 km/h, transforming the greenway into a fast-moving landscape [40]. This varies from prior visual perception studies on moving objects [41,42], in that bikers are moving subjects. The cyclist–environment interaction can also alter depending on the pedaling speed, viewing direction, and angle of sight [43,44].
Most of the current studies on the greenway bicycling environment are based on a thorough assessment of the components of the bicycling environment and the subjective evaluations of bicyclists [45]. The difficulty with studies of bicycling on greenways lies in users’ perceptions that bicycling on greenways and other physical activities are not fully considered soft mobility and that the effects of landscape features on bicycling are insufficient. Quantitative analyses of the environmental components of cognitive appraisal are insufficient [46,47]. The small number of case studies with sufficient consideration of bicyclists’ behavioral perceptions and evaluations limits the evaluation of the bicycling environment. The user participates in the landscape and environment by incorporating various factors. This includes the visual approach. Visual perception is a physiological function that provides the user with a sense of well-being, safety, and belonging. In the field of landscape, the study of visual perception essentially explores the nature of beauty (liking, attractiveness, or preference).
Another means of evaluating landscapes is through the interaction between the environment and the user. Landscape evaluation is inseparable from the analysis of multisensory elements, especially visual elements [48]. There are two research problems related to the visual perception of cycling infrastructure: the first one lies in the identification of physical elements for visual perception, as not all types of visual information can be accurately identified on the bicycle route [49].
The other research difficulty is the quantification of visual perception results. Liu’s [50] research emphasizes the presence of objective–subjective indicators by explaining the principle of subjective perception in the translation of objective environmental information about landscapes. He established a quantitative evaluation standard and index system and proposed a technical method to measure and simulate landscape openness and the degree of serenity. This work plays an important role in the further development of a multi-level weighted assessment system.
Furthermore, in terms of user perceptions, the analysis of user perceptions highlights landscape image research that focuses more on the perception of the physical environment of the landscape and reflects a consensus on landscape awareness [51,52].
There is a rich body of scholarly research that attempts to identify the concepts of visual landscape characteristics from the perspective of landscape perception and value. In relation to the concept of landscape perception and evaluation, Tveit et al. [53] identified nine key visual concepts by proposing a four-level framework related to the evaluation of visual characteristics: concepts > dimensions > landscape attributes > indicators. Their visual characteristic identifications are in line with the landscape guidelines and were used by Zhang et al. [54] and Liu et al. [55], who proposed a method to define visual landscape attraction elements by collecting elements of varying visual attraction based on a questionnaire approach, finding that the visual attraction level for the proportion of elements in the landscape was different and would elicit different visual sensations. The abundance of visual attraction elements in the landscape space provided an important basis for the evaluation of the visual landscape and laid the theoretical foundation for studies on landscape aesthetics.
However, a very frequent aspect of the literature analysis is the value of landscape as a tourist attraction. Li et al. [56] estimated how landscape perception varies with the temporal variation of tourists and suggested that photo-based methods have clear advantages, providing a new perspective in analyzing the distribution of tourist flows and tourist hotspots and being useful for tourism resource and landscape planning. Relative to the visual value of a landscape, it has also been analyzed primarily in its visual role by Steen Jacobsen [57], who provides a review of photo-based landscape perception research approaches that can be used to assess tourists’ visual perceptions of the landscape.
Since 2019 there has been a landscape shock due to the COVID-19 pandemic, the consequences of which could lead to several changes, especially as the increasing digitization of work has limited the reasons for travel and thus fossil energy consumption.
Of course, this landscape shock has produced a further change with regard to policies and interventions aimed at sustainability, which are expected to continue to evolve for the same reason. For the mobility sector, some countries have already taken a step forward by introducing low-carbon and electric transport or seeking solutions to limit the use of personal transportation, such as, for example, Sweden, which has made peer-to-peer ridesharing services available as shared mobility services [58].

2.1.1. Users, Landscape, and Sustainable Mobility

In the crucial field of visual aesthetic quality (VAQ), which is a natural resource base for human physical and psychological health [59,60], the assessment of the relationship between bicycle paths and the landscape is relevant in safeguarding cultural heritage [61].
Regarding landscape protection, many scholars have shown over the years how impact assessment can help to analyze the interactions between humans and the landscape around them, while providing additional value for sustainable development projects for the use of territories whose landscapes serve different functions depending on their geophysical and socioeconomic characteristics.
However, the landscape is characterized by multifunctionality, so that its study and analysis have been conducted in various fields, such as architecture, cultural anthropology, and law [62].
This is especially the case for urban centers, which are a key part of cultural tourism in Europe, since the movement of visitors is mainly concentrated in large urban centers and old towns, and the flow of tourists also produces consequences so that, in major European cities, a concern has arisen regarding the negative effects that a large influx of tourists may have, because of the sudden increase in tourists in urban areas and the explosion of rental accommodation for tourism purposes [63].
The science of sustainability, together with the international programs of the United Nations, aims to encourage the correct use of human actions and the improvement of life, which includes, among other aspects, a greater synergy between humans and nature and a connection between near and far urban and rural areas. This science also promotes connections between people, reducing the ecological footprint.
Landscape qualities are considered fundamental to urban development and user well-being. Many infrastructure-related environments are undergoing significant changes, so it is essential to study and identify users’ landscape perceptions and evaluations in relation to landscape planning, maintenance, and restoration.
Many authors argue that progress must be made toward more sustainable urban planning that protects the surrounding landscape and natural resources in general, with landscape, energy, and transportation as the main parameters [64]. Because the issue of sustainability is topical internationally, there have been numerous in-depth studies and research projects conducted by leading international experts around the world. Critical studies have called attention to a number of issues with resilience processes and evaluation techniques, questioning, for instance, the resilience pathways’ frequently implicit linearity [65].
Regarding transportation, soft mobility, i.e., soft, or rather slow modes of travel that are compatible with the new vision of a sustainable community, still have a latent connection for academic research with the landscape. Soft mobility, as Chapman [4] points out, is a type of mobility that occurs in contact with open areas and places and is greatly influenced by the urban structure.
Thus, sustainable mobility is closely related to other goals regarding sustainable development; this category is composed of several areas, such as accessibility and safety, which contribute to the creation of sustainable cities and are also important for the evolution of infrastructure and achieving energy that is clean and affordable [66].
The role of sustainable infrastructure is to increase the resilience of ecosystems, which in turn affects human well-being and perception: social interactions take place within a landscape, and therefore the landscape, if in a state of neglect, can negatively affect social interactions and thus perception itself.
Furthermore, between mobility and health, there is a close link in that a possible intervention in the field of mobility can be understood as a possible moment of improvement in public health, so that more and more cities have decided to implement systems and interventions to address urban mobility. This has allowed the creation of a model of mobility that is usually extended on a global scale and that is characterized by displacements due to different motivations and by a shift in production activities.
Through the analysis of different analysis, urban areas consume a large part of the natural resources on the planet, and, for this reason, efforts must be made to create a new model of cities that is as sustainable as possible. This is why, nowadays, public interventions aimed at creating urban areas and environmentally friendly ways of moving have entered the scope of debate, so that more and more governments are concerned with reconfiguring public spaces by including new routes intended for the passage of bicycles.
From this, it can be deduced that the landscape has always been a fundamental element as an expression of a community’s characteristics through its buildings and morphology, but that, today, its perception has changed as we look at the landscape as something to be preserved. This is where the domain of soft mobility arises—through the creation of bike paths and less polluting means of transportation, and sustainable infrastructure projects that can coexist with new green areas such as gardens, parks, etc.

2.1.2. Guidelines for Mobility Integration within Landscape Framework

By analyzing various testimonies, Europe is continuously proposing guidelines for sustainable mobility.
Such guidelines concerning mobility and landscape sustainability are emblematic of new thinking on issues concerning the landscape, concerned also with users’ perceptions, giving rise to new strategies adopted at both national and local levels.
The new, possible forecasts of intervention in the area by means of bicycle infrastructure derive mainly from landscape, environmental, and cultural heritage management issues, to which must be added the indicators of users’ perceptions of their journeys.
Thus, in this case, light infrastructure plays a role in connecting territories.
To date, there are many parameters and tools available to assess the perception of the landscape and the well-being that users achieve when looking at it, including the second edition of the European SUMP.
These works [18,67] aims to achieve continuing developments in the fields of urban mobility regarding the experience achieved through the implementation of a sustainable urban mobility plan.
A SUMP is a strategic approach that can help to effectively address urban transportation issues to improve quality of life. A SUMP, therefore, advocates for a decision-making process that is based primarily on a long-term vision of soft and sustainable mobility.
Based on this, it is understood that there is a need for detailed assessments regarding the current state and possible future implications, and that this approach is designed to pursue the objectives of
  • Planning for sustainable mobility in the urban area;
  • Cooperating by going beyond institutional boundaries, by involving citizens as well as all stakeholders;
  • Evaluating current functionality and possible functionality in the future;
  • Creating a vision that is long-term, with a precise plan of action;
  • Developing means of mobilization in the urban area;
  • Creating a precise implementation plan;
  • Organizing monitoring arrangements and setting up a parametric evaluation;
  • Conducting quality assurance of the project.
Thus, it can be said that with this plan, the relationship with the landscape takes on a role of greater influence, since SUMPs see citizens as entities related to their surroundings and therefore territorial extension should always be based on the idea of a “functional urban area”. Consequently, following the conditions of the locality under consideration, it could focus on a city and its provinces, or a bike path, or, again, a region or a set of municipalities, since sustainable planning has its foundation in the flow of people and the integration of infrastructure into the environment.
From this, it can be understood that SUMPs aim to improve accessibility and develop soft mobility for the entire urban area, resulting in a transportation system that relies on collaboration to ensure that the SUMP is in harmony with the policies and plans of the aspects that accompany transportation, such as land use and land use planning.
Thus, it can be said that the objectives of the SUMPs make it clear that any investment in the creation of a bicycle infrastructure in both urban and suburban settings should consider what is established in the SUMPs and that all projects should be designed to fit into an urban mobility strategy that is in line with land use choices.
Supporting this is bike sharing, a recent and evolving form of sustainable transportation, a means of traveling that can offer users a high level of well-being and a low-carbon lifestyle. The advantages of this type of mobility include flexibility, cost savings, and positive effects on health.
Today, the various evolutions of bike sharing are divided into docked, which is a service that has several locations for the parking of bicycles, and dockless, a service in which bicycles can be parked anywhere.
However, this mode of travel is, similarly to the traditional ones, also influenced by the built environment into which it enters, so, if the urban center is not functional for this type of mobility, there is a need for the system to evolve and be able to coexist with public transport. To better understand the actual benefits and devise a strategic plan to improve the service, there is a need to conduct analyses, first on the bikeshare station and then on the travel experience. The first type of analysis seeks to investigate the usage patterns of such stations, while the second allows a deeper understanding of aspects of each trip, such as the pace, duration, and the well-being experienced [68].

2.1.3. National Guidelines for Mobility Bicycle Infrastructure

The ecological transformation and infrastructure are the two primary components of Italy’s National Recovery and Resilience Plan (NRRP). The Ministry of Ecological Transition and the Ministry of Infrastructure and Sustainable Mobility make up the majority of the PNRR resources. Of the many projects that the MIMS is involved in, the one that seeks to increase bicycle accessibility for environmental protection objectives is particularly significant. Increased bicycle use in cities is crucial to decreasing the climate impacts of one of the most polluting industries—transportation—since bicycles are an emission-free mode of transportation. We examined the availability of bike lanes across Italy in accordance with the most current Italian National Statistical Institute (Istat) report for 2019 to contextualize the situation of our country at the beginning of these allocations.
The Italian Recovery Plan (NRRP) has nine programs for local public transportation and “soft mobility”. Istat records show that there were around 4730 km of bicycle pathways in Italian urban areas as of 2019. Nearly 75 percent of these were discovered in Northern Italy. In particular, 72.5%, 18.2%, and 9.3% of the bike lanes in Italy’s capital cities are located in the north, center, and south, respectively (2019).
This is a national average of 24.2 km per 100 square kilometers if we link the extension to that of the territory on which they are located. In the case of municipalities in the northwestern area, the average rises to approximately 58 km per 100 square kilometers and falls to 15.7 and 5.4 km per 100 square kilometers, respectively (Figure 1).
There was a general improvement from 2013 to 2019. There was a 20.8% rise in the northern macro area, from 2839 km in 2013 to 3430 km in 2019. The increase in the center (+18.3%), from 729 to 863 km in this same timeframe, was marginally less (Figure 1). With EUR 400 million allocated to regions and autonomous provinces for the years 2021 to 2026, including 150 million in state funding under current law, the NRRP measures for cycling promotion aim to build tourist cycleways (measure M2C2: Enhancing mobility sub-investment). By 30 June 2026, there must be at least 1235 additional kilometers of tourist cycleways constructed, in addition to any additional funds from the federal, state, local, and local budgets for the components of ongoing projects that must be scheduled and reported on the NRRP. Urban cycleways and works of extensive maintenance are included in the measures for an investment of EUR 200 million for the fiscal years 2022 to 2026, of which 50 million is public money under current law (measure M2C2: Improving mobility). The funds are designated to the improvement of cycling accessibility, namely to build an extra 565 km of urban and metro lines in locations with significant university populations and connecting them to rail or metropolitan hubs. By 31 December 2023, 200 km more of urban and metropolitan bicycle lanes are expected to be built, with another 365 km by 30 June.

2.1.4. Soft Mobility Governance: The Legislative Framework in Italy

The interest has moved toward understanding values, analyzing users’ perceptions and how they interact with the landscape when bicycle infrastructure is present, which should be considered in the context of not only regulatory but also the psychophysical evolution of perception. Many bicycle infrastructures pass through high-value territories, which makes it essential to consider the land and cultural heritage value.
Since 2015, Italy has seek the remarkable development of cycling mobility plans. At the national level, the General Plan for Bicycle Mobility (GPBM) was issued according to the provisions of Law No. 2 of 11 January 2018 of bicycle mobility and the implementation of the national pathway network. The plan has specific objectives, such as the following.
  • The design of the economic and resource framework, as also outlined in the cycling mobility plans of the Autonomous Regions and Provinces of Metropolitan Cities and Municipalities.
  • Defining annual targets for each year of the reporting period. The objectives are set for each of the two aforementioned areas of intervention with regard to the overall demand for mobility.
  • The design of a set of interventions aimed at progressively implementing routes of national interest, starting with the System of National Tourist Cycle Routes (SNTCR), which are part of the “Bicitalia” National Cycle Network (BNCN), referred to in Article 4 of Law No. 2/2018. Guidelines are also set for the definition and implementation of projects under regional jurisdiction aimed at the implementation of the bicycle network.
  • The national and integration of road and rail with local public transport systems, planning the lines of action for the implementation at the local level of cycleways that complement the design of the network.
  • The administrative and regulatory guidelines necessary to ensure the effective coordination of the administrative action of the government, the Regions and Autonomous Provinces, and the Metropolitan Cities Ministry of Infrastructure and Sustainable Mobility—General Plan of Cycling Mobility 5 and Municipalities concerning cycling mobility and related infrastructure.
  • Methods to promote user participation in the planning, implementation, and management of the bicycle network and the actions necessary to develop a culture of road safety and sustainable mobility.
  • The lines of action to be put in place to achieve the objectives set by the PGMC and support the development of the SNMC in urban areas (with reference to the safety of cyclists and the modal interchange between cycling, rail transport, and local public transport).
  • The description of a model to evaluate goals and procedures that support the control plan. According to the directive of the Law No. 208/2015, this collection of resources made it possible to start developing the network of national interest as a priority, starting with the System National Tourist Cycle Routes (SNTCR), encouraging the financing of the ten priority national tourist cycleways, and also financing, particularly in the 2020–2021 biennium, specific interventions aimed at improving urban and metropolitan cycling mobility. This amounts to EUR 1154 million, of which EUR 754 million has been obtained from existing sources and EUR 400 million within Recovery Plan resources.

3. Materials and Methods

3.1. Study Area

The study area is the primary Italian national bicycle network, which consists of the metropolitan-level bicycle paths of regional capitals, in urban areas, and those promoted at the tourism level. Secondary bicycle infrastructure (in mountainous and peripheral areas, or for small stretches) is not considered because it is under construction and has not been affected by significant regeneration investment.
Bicycle infrastructure represents a new mode of travel known as soft mobility. It is a widespread mode in Italy, where, in addition to the transportation aspect, the infrastructure has an increasing impact on the environment and landscape from an ecological point of view, such as vulnerability and the risk of climate change, but also positive impacts because it reconnects humans with nature.
Soft mobility with bicycle paths is a new means of integrating landscape and infrastructure. These motivations include attention to how users perceive the landscape and impact assessment (visual and participatory, non-participatory). Promotion measures for bicycle mobility have also triggered incentives to improve the landscape (urban, metropolitan, suburban, rural, coastal).

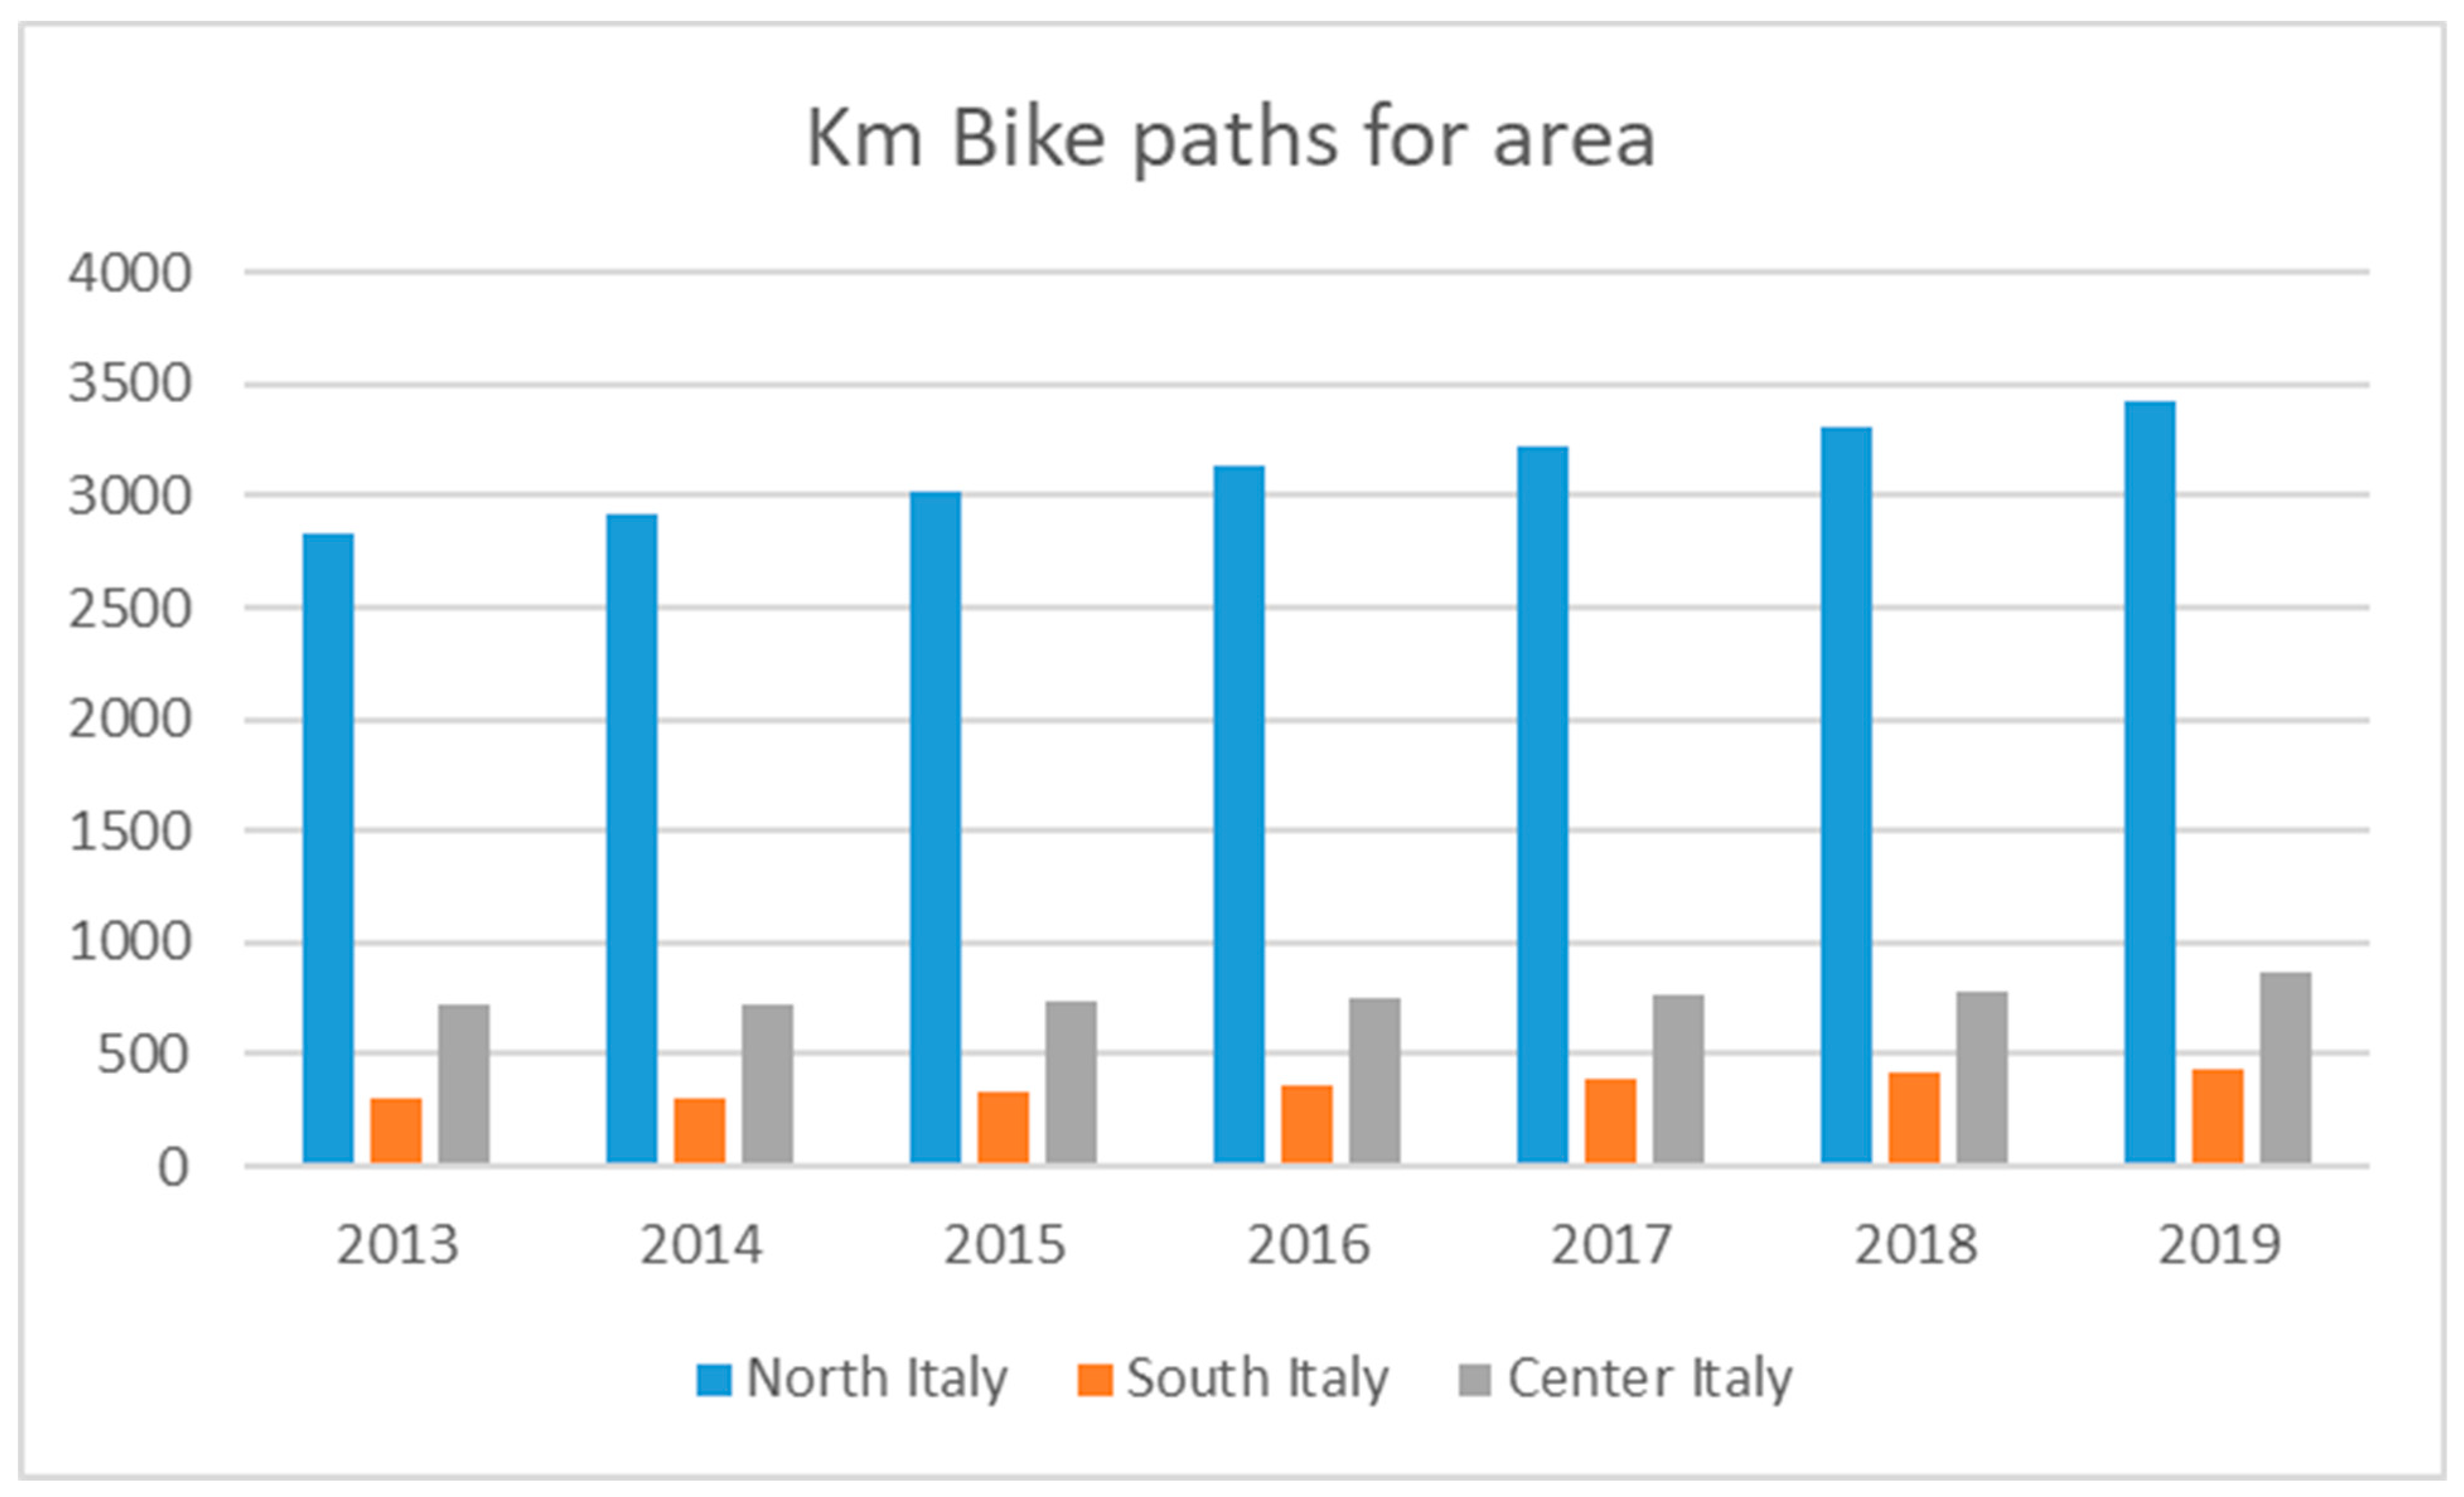
3.1.1. Cycling Mobility Infrastructure: The National Italian Context

Prioritizing and integrating bicycle transportation on a local level, the objective is to promote greater enjoyment of the region’s key cultural, ecological, and aesthetic resources while respecting the local environment and the need for connectivity between the major urban centers. Since individuals also utilize cargo bikes, pedal-assisted cycles, or other sharing platforms to move around in metropolitan areas, the reference is to cycling, which must gain greater traction. This necessitates a high degree of adaptability and demand responsiveness. The goal is to consider the urban space as a whole and in terms of the interactions between various actors, giving representatives of active mobility, such as bicycles and pedestrians, special consideration. Starting with a review of the major regional plans, we may determine how users perceive cycling. Bicycle pathways are included in the regional plans at the provincial and municipal levels, according to planning. Second, urban metropolitan centers and coastal regions are where most of the infrastructure development is taking place. Except for a few kilometers, inland areas remain devoid of bicycle pathways; however, planning work is under progress. Table 1 shows the current plans being discussed for the Lombardia, Veneto, and Puglia regions in Italy. The other Italian regions are developing a plan procedure, in which some of the routes are implemented on the Eurovelo and Bicitalia network; thus, for our project, we have considered the current Eurovelo in force at the regional level.

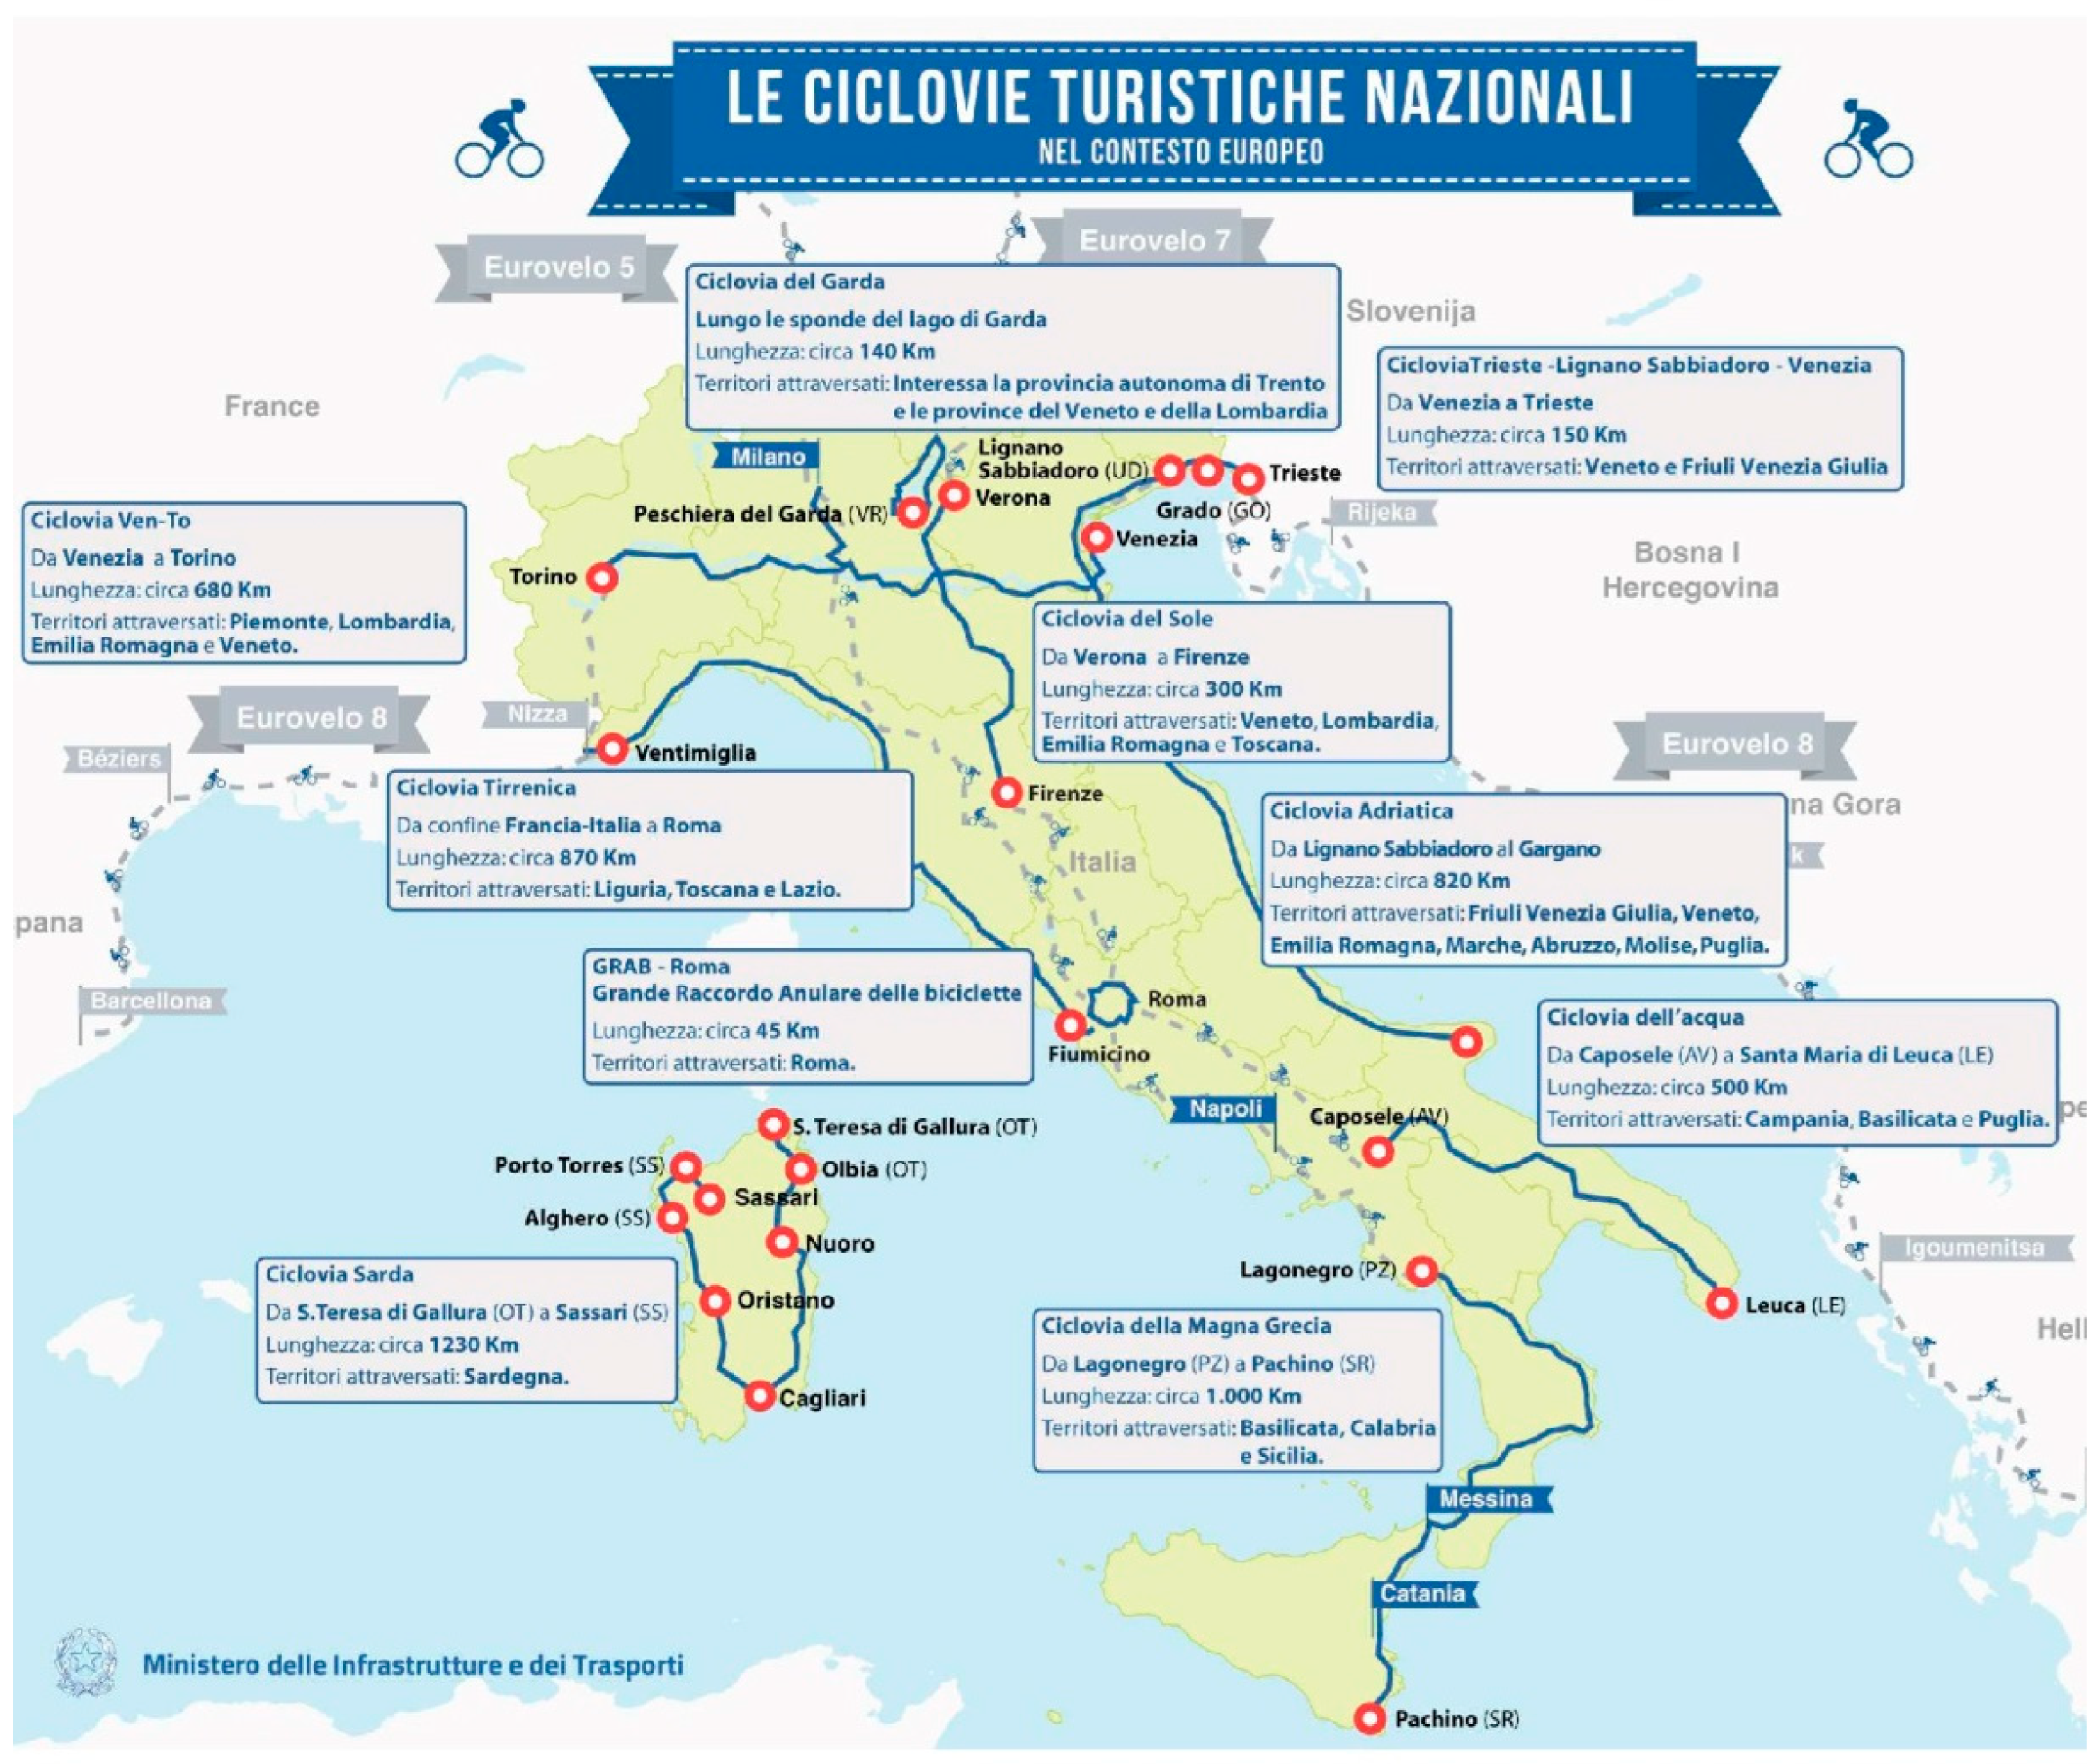
3.1.2. Landscape and Bike Path Infrastructure

In the context of landscape as a key, sensitive component of the Italian context, the analysis of infrastructure in relation to landscape connections is crucial. Landscape and tourist cycleways frequently contrast one other. However, considering the extensive infrastructure development in metropolitan areas, it is essential to examine cycleways considering user perception. Soft mobility first emerged between 2015 and 2018 as a sustainable method of fusing active transportation with the landscape. The network of national tourist cycleways (Figure 2) is promoted by the Italian Ministry of Infrastructure and Transport [69].
It aims to support the growth of bike tourism in Italy, in addition to being a component of a policy for sustainable and soft mobility and to generally increase bicycle use, which in Italy amounts to only 3.8%.
Touristic bike paths are listed below:
  • Bike path Ven-To, 680 km from Venice to Torino;
  • Bike path Sole, 300 km from Verona to Firenze;
  • Bike path Acqua, 500 km from Caposele (AV) to Santa Maria of Leuca (LE);
  • Bike path GRAB Roma—Grande Raccordo Anulare delle Biciclette, 44 km to Rome;
  • Bike path of Garda, 140 km along river of Lake Garda;
  • Bike path of Magna Grecia, 1000 km from Lagonegro (PZ) to Pachino (SR);
  • Bike path of Sardinia, 1230 km from S. Teresa of Gallura (OT) to Sassari via Cagliari;
  • Bike path Adriatica, 820 km from Lignano Sabbiadoro (UD) to Gargano;
  • Bike path Trieste-Lignano Sabbiadoro-Venezia, 150 km from Venice to Trieste;
  • Bike path Tirrenica, 870 km France–Italy to Rome.
In line with the guidelines previously described, we conducted an analysis of the financing environment for Italian cycleways. At a national scale, the resources designated for cycling infrastructure amount to EUR 1154 M, of which EUR 716 M are devoted to bike paths for tourism purposes. The resource framework for 14 metropolitan cities (according to Ministerial Decree n. 344/2020) of the Italian network is EUR 39,510,000.

3.2. Research Methodology

This study explores the role of users’ perceptions of the landscape in soft mobility infrastructure, analyzing how land use for bicycle infrastructure has an influence on the user’s perception of the landscape and which components of perception, either objective or subjective, have more weight. At the same time, it provides support for the literature on this topic. The overall methodology is mainly divided into five parts: (1) a qualitative step based on the analysis of the regional plans of large cities, analyzing their objectives and their compatibility with users’ perceptions; (2) an analysis of the funds made available for bicycle infrastructure; (3) an analysis of indicators consistent with the theme of this article, both related to soft mobility and user perception; (4) exploring the correlations among indicators and users’ perceptions in the regional plans; (5) an evaluation of the components of the indicators impacting user perception in the landscape characterized. The Italian bicycle infrastructure analyzed in this study is mainly of two types: standard bicycle–pedestrian infrastructure in urban and metropolitan areas and tourism infrastructure. Many bicycle paths are designed for territories with significant tourist flows, in parks and for sports activities. In addition to the analysis in the relevant regional plans, the bicycle infrastructure should also be analyzed by considering whether it offers a user-based perspective in SUMPs.
Compared to urban mobility plans such as SUMPs, the analysis of tourist-type cycleways present aspects of design that are closer to the user perception and landscape than the infrastructure in urban cities. Therefore, the division into subjective and objective aspects of urban plan goals was applied to bicycle infrastructure to understand whether metropolitan ones are different from tourism ones in terms of user priority and user perception. After analyzing the mobility plans and the sustainability objectives, we divided the objectives of the mobility and sustainability plans into two categories, objective and subjective, to identify which objectives are closest to the perception of the user of the landscape with the cycling infrastructure. The subjective aspects consider the presence of elements in the users’ perceptions, such as comfort, travel safety, etc., while the objective aspects consider the elements of the environment and the landscape. This article considers the methodology adopted by [70,71], building a user-based perception landscape index, in agreement with some literature studies. The indicator was constructed using the FCE methodology to objectively evaluate the different components of the indicator.
For this article, a mixed, qualitative approach is used, which includes phases 1–3 of the methodology; starting from a qualitative analysis of the urban mobility plans and the sustainability objectives, the components of the indicator are extrapolated from the analyzed plans, represented by phases 4 and 5. The last methodological phase ends with a quantitative analysis of the indicator of the user’s perception of the landscape (4 and 5).

3.3. The Fuzzy Evaluation Method (FCE)

The FCE evaluation approach for the land user perception indicators used in this paper is based on fuzzy mathematics, known as the fuzzy comprehensive evaluation (FCE) method. The FCE evaluation approach applies fuzzy mathematics to a set of factors or objects to produce an overall evaluation; it is based on the notion of a fuzzy mathematical degree of belonging from qualitative evaluation to quantitative evaluation.
With some systematic and convincing aspects, this method has an advantage in assessment over the AHP of decision analysis, resulting in an acceptable replacement for the unclear and difficult quantification problem and suitable for handling nondeterministic issues.
The FCE method can be used to address multi-criteria decision-making (MCDM) problems.
The fuzzy evaluation method is employed to analyze multiple factors in the scientific literature [70]. Among the most recent results, the FCE has been used for landscape analysis in underground environments to support decision making in the face of problems of ambiguity and imprecision [72,73]. According to fuzzy mathematics theory, the FCE method [74] is valid for converting fuzzy qualitative analysis into quantitative evaluation. This toole allows an overall assessment of the aspects influenced by many factors using fuzzy mathematics. The method has been used for various purposes in urban space evaluation and tourism perception [75,76,77], and, due to the variety of data, the global fuzzy evaluation approach is highly recommended.

3.3.1. FCE Algorithm for Urban-Based Landscape Perception Evaluation

The approach used regarding the quantitative section is based on the implementation of the FCE to examine the user’s perception level. The FCE is generally structured in two main stages. The first phase involves the construction of the components that will provide an overview of the state of the Italian cycling structures. The second phase, discussed in the Results section, involves the evaluation of the indicators to identify the main elements that influence users’ perceptions of the environment in the presence of cycling infrastructures.
The fundamental four steps to apply the FCE are the following:
  • Determination of the criteria set;
  • Establishment the linguistic grade set and the evaluation set;
  • Development of the evaluation hierarchy to assess weight vectors;
  • Building of the evaluation matrix.
The first few steps are based on determining the set of criteria and developing the evaluation hierarchy, and the rest incorporate a fuzzy composition method that aggregates these results.
The fuzzy comprehensive evaluation follows the procedure of four steps as proposed by [78].
The first step is the definition of vector U, representing the object being evaluated through m evaluation factors. m is the number of evaluation factors as follows:
U = u 1 ,   u 2 ,   ui , ,   un
where ai is the i-th evaluation index.
In the second step, the evaluation set of the index set V is constructed as follows:
V = {v1, v2, vi, …, vn}
where V is the evaluation set and vj is the j-th evaluation rank, which reflects the various levels of the evaluation object ui, where vi is the first evaluation of the results of j for j = 1, 2,…, n. For n, FCE considers the total number of the evaluation results, mainly divided into 5 grades (5 = excellent to 1 = very poor).
Third, the set of weights A of the set of indices of U is determined by the method of information entropy and principal component analysis. Then, in step 4, the index vector Ui is evaluated based on the evaluation set V to determine the degree of membership of rij, determining the fuzzy evaluation matrix Ri of the i-th index. The weight vector is designed starting from the definition of set A = (a1, a2, …, am), where A is the weight distribution of the fuzzy vector with two conditions: (1) ai > 0 and (2) ∑ ai = 1. The fuzzy evaluation is used to establish the fuzzy relationship matrix R, as follows:
R = r 11 r 1 n r mn r mn
Expression (3) for the definition of R includes rmn elements. The rmn represents a single factor matrix that is evaluated from the point of “membership” of the ui level of fuzzy subsets vj from the set V. From the fuzzy weight vector A and fuzzy evaluation matrix R, we obtain the result of the evaluation object vector B, which is used with respect to the grade scale (excellent, good, general, moderate, poor) to determine the level of the validity index.
According to [77], the index weights of the “user-based landscape perception” evaluation can be determined through the evaluation of the normalized vector and the weight of the index, with the entropy approach. Entropy is a tool used to calculate the weights in the fuzzy evaluation and assess how much information from known data can be related to the degree of difference between each index value, which determines the weight of each index as follows:
Y ij = X ij j = 1 n X ij
W ij = 1 E i i = 1 nm 1 E i
The Ei index is the entropy index value calculated as follows:
E i   = j = 1 n Y nm   Y ij ln n
Then, using the fuzzy evaluation matrix R and the weight set A, the fuzzy comprehensive evaluation vector B can be obtained according to Equation (7):
B = Ax = b 1 ;   b 2 ;   b 3 ;   ,   b n  

3.3.2. Users’ Perception Components for User-Based Landscape Perception Index

We chose several explanatory variables in defining the set U to investigate the relationship between user perceptions and the landscape within a bicycle infrastructure area. The variables were chosen starting from the analyzed cycle mobility and sustainable mobility plans (SUMPs), to combine both the naturalistic and environmental aspects with the mobility and sustainability goals (Table 2).
From the set of variables, we identified, as in the literature, the different components to evaluate the indicators for which to apply the FCE.
Each indicator, as will be discussed, was evaluated for two scenarios: one scenario estimated the perceptions of landscape users and urban mobility for a generic context; the second applied the FCE to a metropolitan context in which the components of the indicators are different, such as the presence, in order to better highlight the division between subjective and objective values of perception, with reference to the objective and subjective aspects analyzed in the mobility plans. As described in the previous paragraphs, the two scenarios arise from the consideration of two types of regions, namely metropolitan and non-metropolitan, referred to as “scenario 1: metropolitan area” and “scenario 2: general land area”. As a result of cycling routes’ cross-regional and cross-area nature, the subdivision allows for the evaluation of perception in two distinct settings.
Table 2 describes other environmental variables that may influence how people perceive the landscape [79,80,81,82]. These characteristics arise from associations in the environment and mobility fields (such Eurovelo, Bicitalia, FIAB, CIAB, etc.).
To use FCE, we must build the vector “u”. We next conducted an examination starting with the plans and objectives and their coherence, moving on to potential indicators that could be incorporated into the FCE judgment matrix.
For the construction of this vector, we collected Table 2, for each sector, the relevant and significant attributes, understood as proxy measures of user perceptions. Age and income are not included in the variables used for fuzzy logic analysis (FCE) as they can cause bias in the FCE model [76,83,84]. The variables constitute the components shown in Table 2. According to the research evidence, the attributes (also called components) can be subdivided into microscale and mesoscale attributes [83,85]. In this research, these components are identified at the macroscale level to understand the variables used for the construction of the analysis of the indicators for user perception, considering environmental and landscape issues.
From the qualitative examination of the sustainability objectives and mobility plans pertinent to this case study, Table 2 displays the linked indicators for each environmentally inclusive user field that are taken into consideration. The U set is defined using the set of fields that we refer to when the FCE is applied. Considering the findings of the work of [83,84,85,86,87], the components of user-based landscape perception in this study have been divided into six main fields: bikeway conditions, mobility safety, comfort, attractiveness, natural resources, and urban settlement. These categories are shown in Table 2. For our research, we considered those that emerged from the qualitative analysis, The variables account for the key environmental, technological, and safety elements that can affect how the user perceives the environment.
The quality of the pavement, the presence of obstructions, and nearby aircraft, as well as continuous cycle paths, must all be considered when determining the physical space. In the technological field, the presence of devices that could support and assist the user during traveling is also important. Space, connectivity, and landscape are the factors that are most pertinent to our landscape when considering the brightness, greenery, cleanliness, and aesthetic value of the landscape. Finally, it is crucial for users to consider security in terms of travel and incident security, as well as the presence of service structures in terms of proximity and accessibility.

4. Results

4.1. Results from Qualitative Analysis

The analyses carried out show which actions and measures identified in the mobility plans and sustainable measures are coherent with the promotion of user perception and lay the foundations for understanding which aspects are considered and which points are still weak, to pursue the aims of this research.
The first methodological part, based on qualitative analyses, considers the coherence between the superordinate plans, which include the coherence between the general objectives of the master plan for cycle mobility, the European objectives of the SUMPs, and the sustainability of the Agenda 2023 objectives (SDGs).
This coherence analysis between superordinate plans (Table 3 and Table 4) aims to reveal the extent to which the user is at the center of cycling planning strategies, with the aim of blending cycle paths into the landscape in a synergistic way. We compared the regional mobility plan with the urban mobility plans and the sustainability objectives and assessed their consistency following an evaluation scale ranging from −1 to 1 (−1 = low and 1 = maximum), as proposed in the classic consistency analysis. The construction of the evaluation grid is based on the concept of external coherence, an approach well known in planning practice [88,89] and also in the context of strategic environmental assessment (SEA) [90,91]. Coherence analysis facilitates the establishment of complementary relationships between the objectives of a single plan and the objectives of other plans, including government-funded directives and evaluations with overarching policies (for example, European or global policies). This coherence analysis is presented in Table 3 and Table 4, which include two different tables. The first is Table 3, which concerns the coherence between regional plans and SUMPs, and the second is Table 4, which is related to the external aspects in relation to the SDGs to ensure the plans’ coherence with other policies to develop synergies.
Table 3 and Table 4 include an external consistency analysis, which is currently employed in SEA processes and is classed as “vertical” [92]. The external vertical consistency analysis aids in verifying the coherence of a given plan or program’s objectives with regional, national, and European environmental sustainability objectives.
The General Mobility Plan’s general objectives, reported in Table 3, are listed below:
(a)
Transport systems resilient to climate change, pandemics, and other disasters;
(b)
Efficient, clean, safe, and quiet transportation with zero net emissions, implementing policies and actions for healthy, active, and safer mobility;
(c)
A social inclusion process that ensures access to mobility and transportation;
(d)
Investments that can use digitization of transport and mobility services; infrastructure to support sustainable mobility; integrated local public transport;
(e)
The more equitable use of public space.
The SUMPs’ general goals in Table 3 are listed as follows:
I.
Ensure that all residents are offered transport options that enable access to key destinations and services;
II.
Improve safety and security;
III.
Reduce air and noise pollution, greenhouse gas emissions, and energy consumption;
IV.
Improve the efficiency and cost-effectiveness of the transportation of persons and goods;
V.
Contribute to enhancing the attractiveness and quality of the urban environment for the benefit of residents, the economy, and society.
The SDGs’ goals on the user perception side, shown in Table 4, are as follows:
  • Responsible consumption;
  • Reduce climate action and impacts;
  • Ensure well-being at all ages;
  • Achieve gender equality;
  • Make cities safer, more resilient, and connected.
The strategy suggested for Table 3 and Table 4 only evaluates the vertical coherence between the SUMPs, SDGs, and GMP objectives. In this regard, it will be determined whether the SUMPs’ adaptation recommendations are consistent with the GMP and SDGs’ priority objectives regarding improving users’ perceptions. The comparison between the GMP objectives, SUMPs, and SDGs is based on the concept of external coherence and on the use of evaluation grids (or matrices). In this case study, consistency will be recognized when an objective of the SUMPs is consistent with at least one objective of the GMPs and SDGs. We have chosen to compare the SUMPs with the GMP and SDGs because these tools have become fundamental for the promotion of cycling mobility and will be adopted by all Italian regions in further planning.
We examined this coherence in relation to the user’s perception.
We observe coherence when the objectives of the SUMPs respond to those of the GMP and the SDGs; we observe indifference when an objective of the SUMPs does not directly affect the choices of the GMP and SDGs; we observe inconsistency when an objective of the SUMPs hinders the implementation of the choices identified in the GMP and SDGs [77]. The consistency analysis between the SUMPs/GMP and SDGs is carried out in three phases:
  • Identification of the sustainable development objectives relevant to the case study;
  • Identification of the user’s perception objectives;
  • Comparison between the objectives of the SUMPs and the objectives of environmental protection and environmental resilience, as well as the inclusiveness of the SDGs (phase 3).
The assessment of the SUMPs’ consistency with respect to the GMP and SDGs is carried out through an objective by objective comparison: the comparison aims to highlight whether the SUMPs’ objectives converge with respect to the issues of sustainable development in the SDGs (consistency between objectives, value +1), if they diverge (inconsistency value 0), or if there is no relationship (value −1) between the objectives at all in terms of sustainability and coherence with the aim of this research, as the findings of user perception. As proposed by [93,94,95,96,97,98], in the comparison of the SUMPs/GMP/SDGs’ objectives, for this research, the qualitative judgment will be associated with a quantitative judgment, ranging from −1 (inconsistency) to +1 (excellent consistency).
The methodological approach proposed and adopted in this work can be replicated in other contexts and be potentially useful as a reference point for the coherence verification procedure.
The coherence presented in Table 3 and Table 4 relates to the regional, metropolitan, and urban plans and to the sustainability objectives. Another method to check consistency is the heatmap method, in which we analyzed the tourist cycle paths (on the left) with the SDGs and SUMPs and the regional plan’s sustainability objectives. In this case, to evaluate the consistency, we divided the goals as follows:
  • Subjective goals: objectives that pursue the user’s perception from the user’s side;
  • Objective goals: objectives that promote the promotion of the environment and the landscape.
Subsequently, the objectives of the SUMPs and SDGs were also collected by macro category relating to the landscape and user side. The macro categories are as follows:
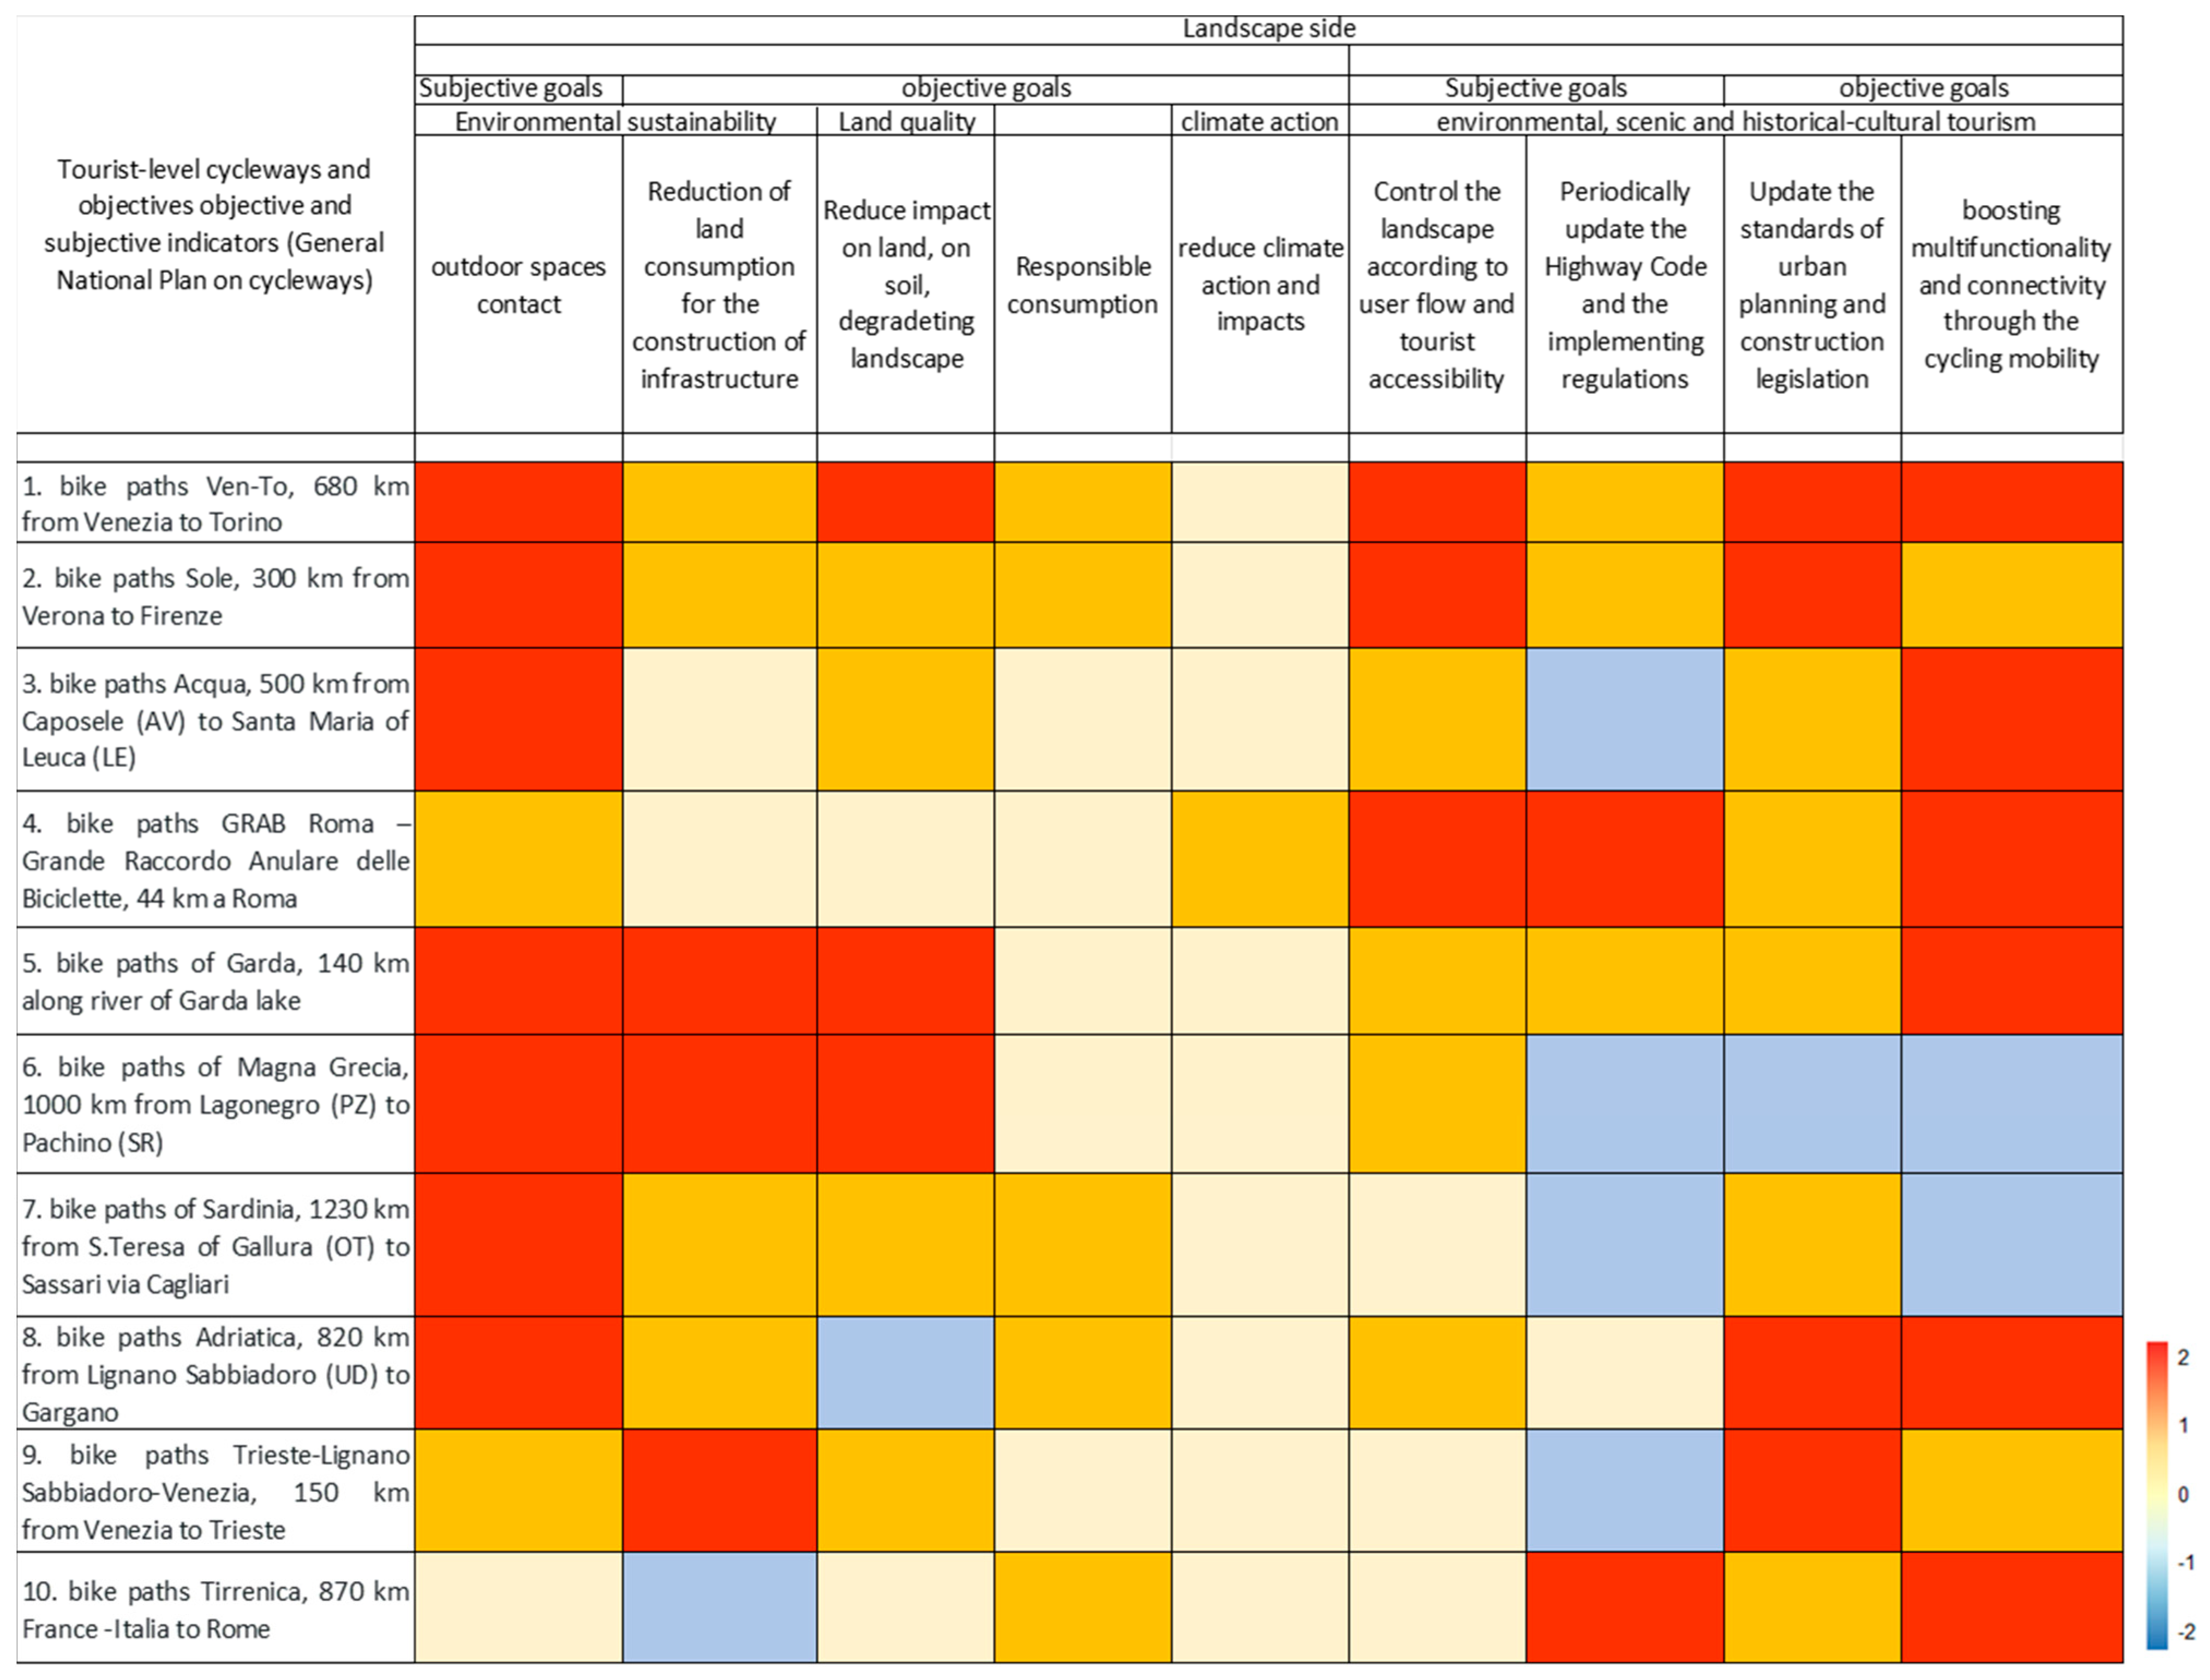
  • Environmental sustainability;
  • Land quality;
  • Climate action;
  • Environmental, landscape, and historical–cultural tourism.
The objectives in evaluating the coherence between cycle paths and the landscape, taking into consideration the objectives of the SUMPs and SDGs relating only to the environmental sector, are as follows:
  • Access to outdoor spaces;
  • Reduction in land consumption for the construction of infrastructure;
  • Reduction in impact on land, soil, and abandoned landscapes;
  • Responsible consumption;
  • Reduced climate action and impacts;
  • Control of the landscape according to user flow and tourist accessibility;
  • Periodic updates of the Highway Code and the implementing regulations;
  • Updates of the standards of urban planning and construction legislation, boosting multifunctionality and connectivity through cycling mobility.
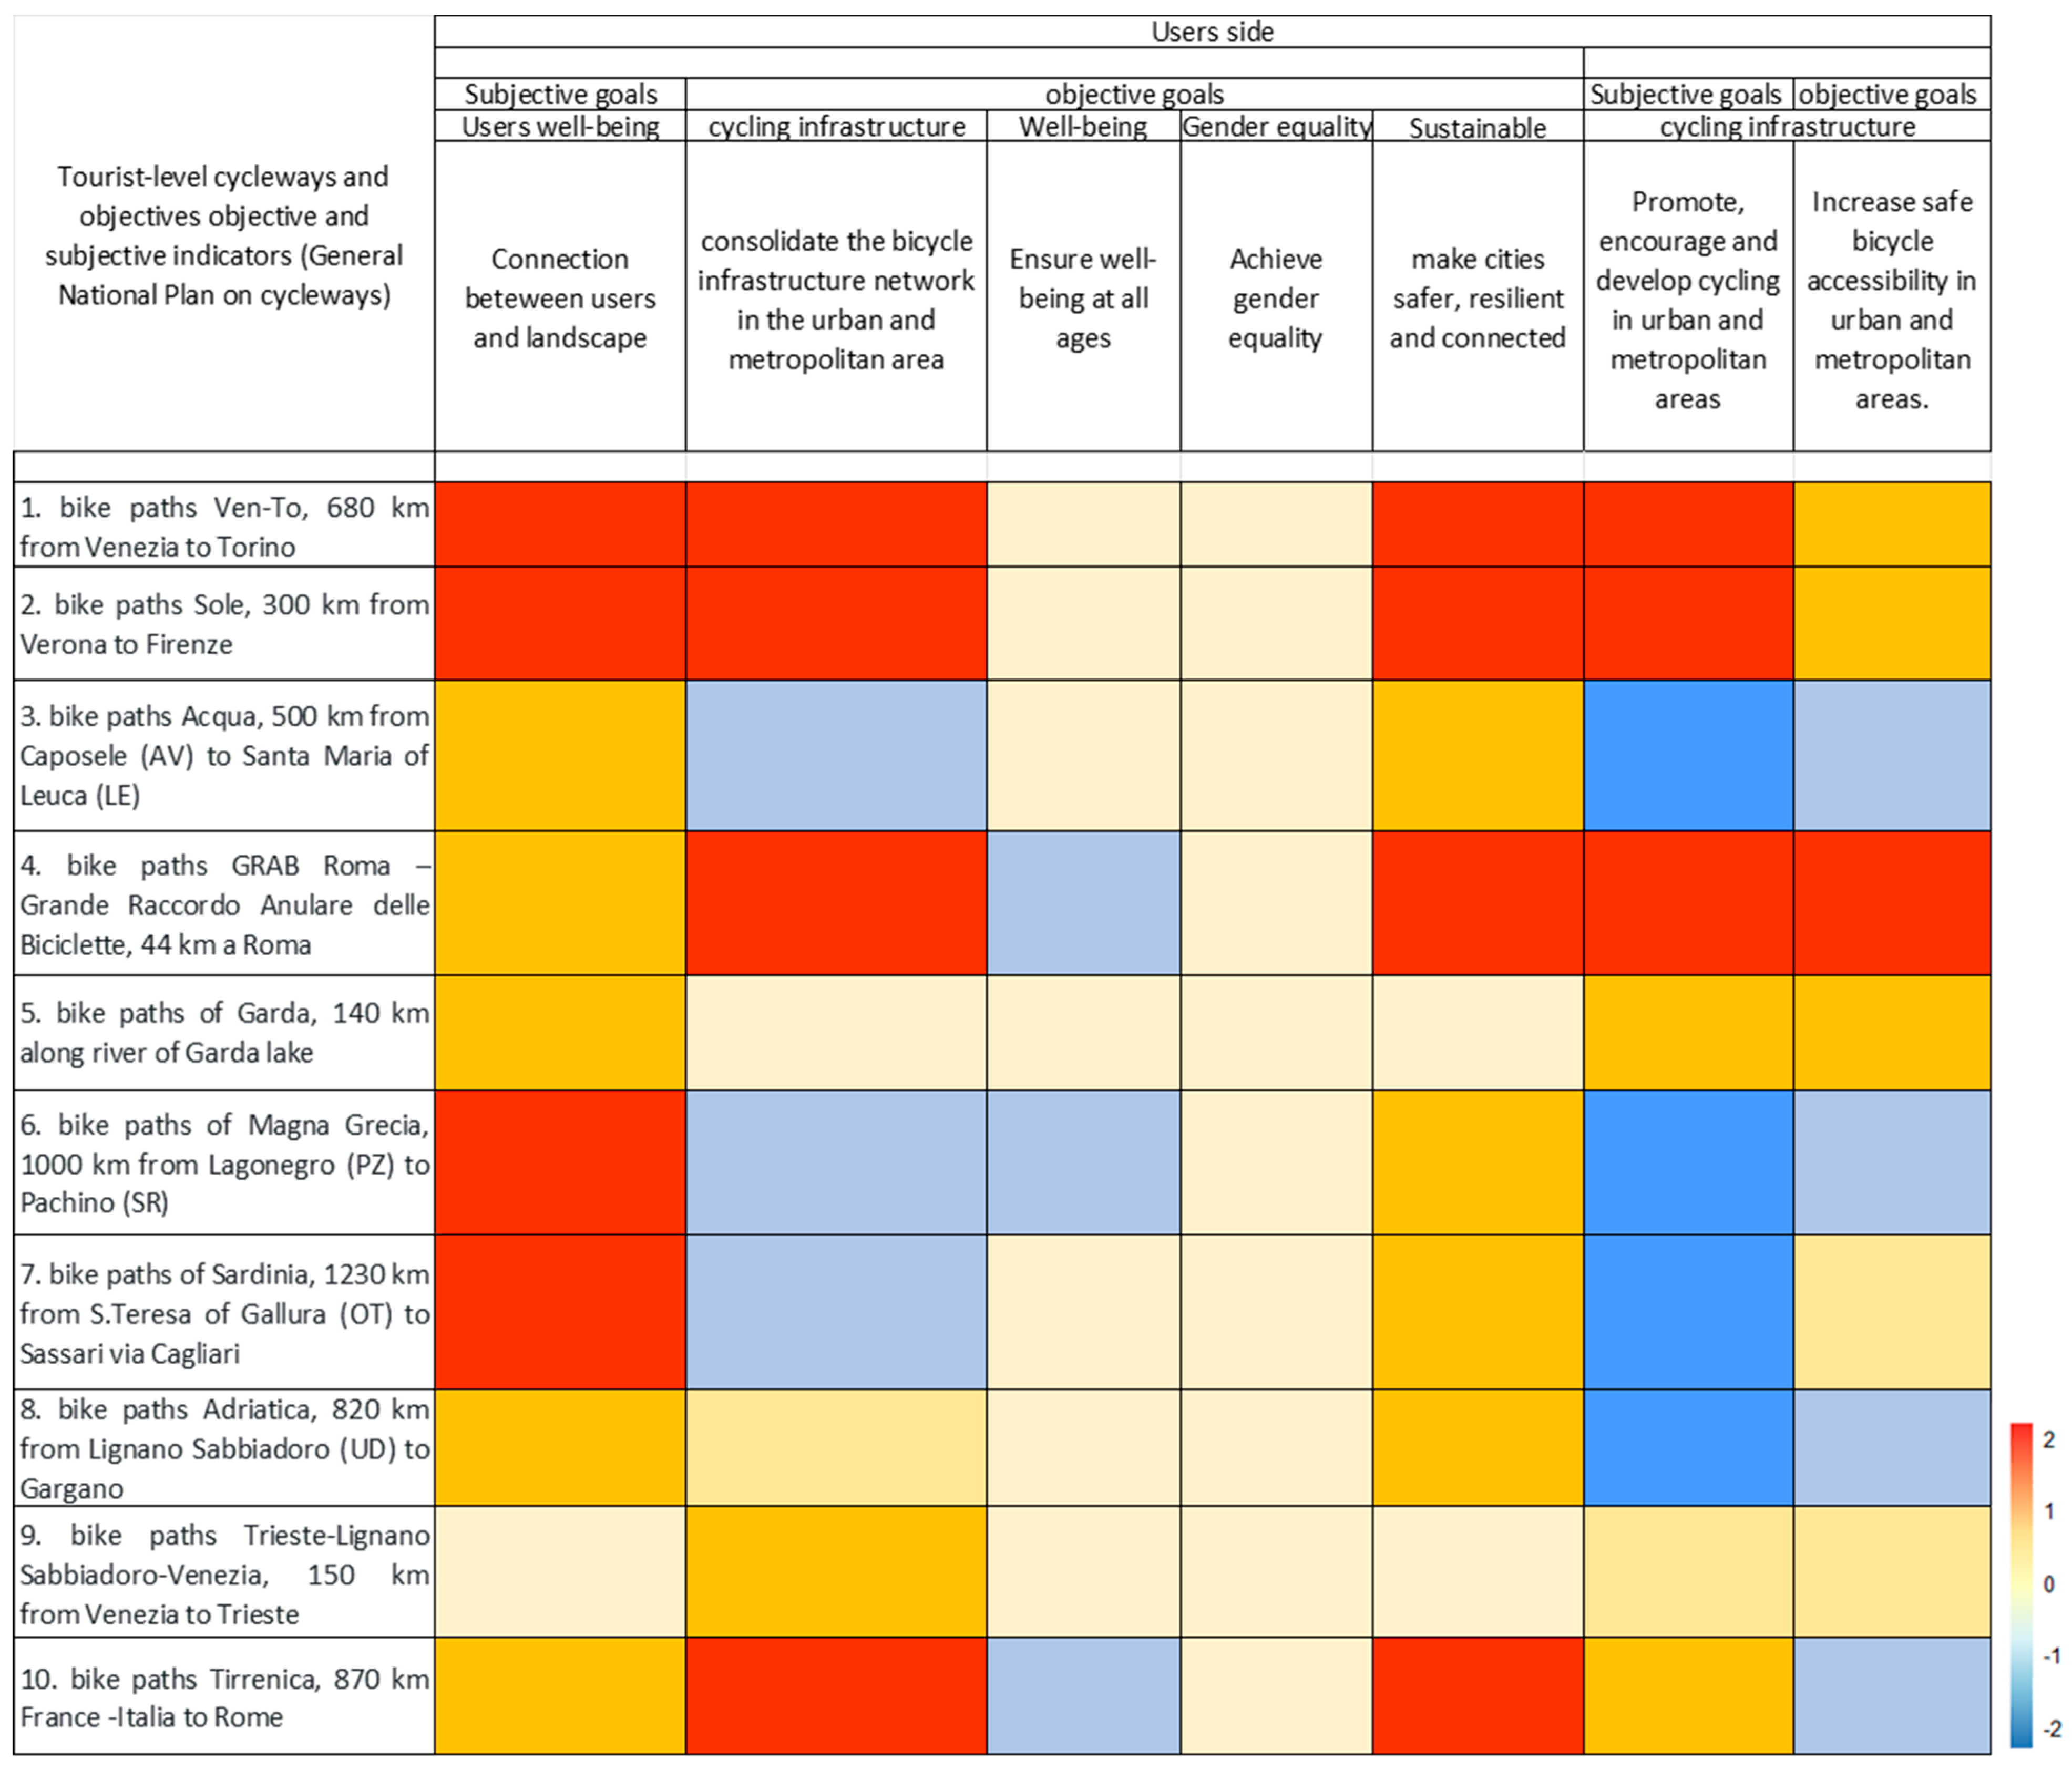
The same procedure was implemented to evaluate the role of the user and how the tourist cycleways relate to the user in relation to sustainability and the environment.
The objectives were collected in the following sectors:
  • Users’ well-being;
  • Cycling infrastructure;
  • Well-being;
  • Gender equality;
  • Sustainable cities;
  • Cycling infrastructure.
Figure 3 and Figure 4 give an overview of the construction of landscape and user indicators considering the generic and specific objectives of the plans (regional and SUMP plans, SDGs).
We have considered such goals if they fall under the subjective or objective goals sections. For each of these goals, we have entered the related goal component and a description. The selection was carried out according to the “heatmap” procedure, which, similar to a clustering, compared the cycle paths in relation to the landscape and user indicators. The components are, both for the landscape and for the users, environmental sustainability, the quality of the territory, action for the climate, and environmental and historical–cultural tourism.

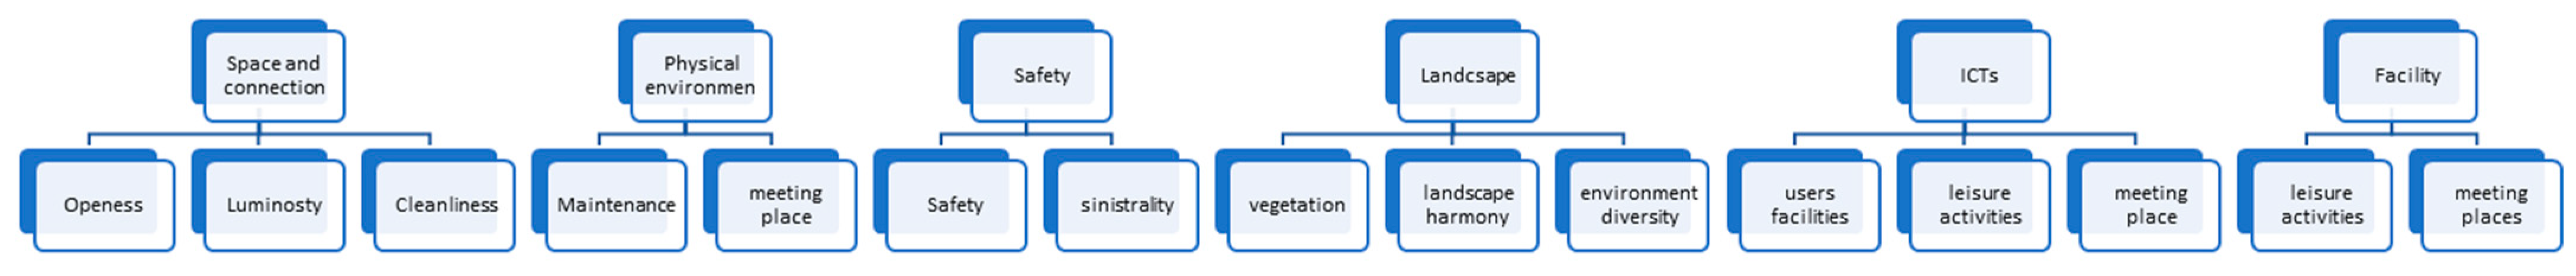
4.2. User-Based Landscape Perception Results from FCE Method

Based on the coherence of the SUMPs, GRPs, and SDGs’ objectives, the qualitative assessment was the first stage to determine which FCE qualities were legitimate. Based on the consistency results from the qualitative assessment that emerged from Table 3 and Table 4 and Figure 3 and Figure 4, and in line with the indicators shown in Table 2, 10 attributes of set U (u1,…, u10) were selected among the environmental components of sustainability, user, safety, landscape, and technology to apply the FCE. The factors identified to construct the first vector U are as follows (Table 5).
The fuzzy evaluation matrixes display the linked vector B based on the qualitative analysis and quantitative assessment of the UBLP’s index.
The factors analyzed for the FCE to compare scenarios 1 and 2 always refer to Figure 4 and Figure 5; in the FCE, the weights that are given during the step of calculating the entropy index change.
Figure 5 explains the identification of factors for vector U. From Table 2, user perception was analyzed separately, and some common areas emerged. In our research work, by identifying the consistency between objectives and content, some of these areas coincided, while others were introduced for our case study. Figure 5 lists the six main areas for user perception, which are
  • Space and connections;
  • The physical environment;
  • Safety;
  • Landscape;
  • ICTs;
  • Facilities.
For each of these, we have reported the attributes that represent the relevant indicators for each individual area. In space and connections, the key attributes are open spaces and the cleanliness of the environment, which translate into openness, luminosity, and cleanliness. For the safety domain, we considered attributes that emerged from the mobility plans but also from experience, such as travel safety and the risks associated with travel, such as accidentality (which we referred to as sinistrality). Technologies enhance user perceptions in the landscape by improving the services available, to promote activities, and to enhance inclusionary goals (called meeting places).
Finally, applying the FCE, we derived the vector B, which combines the vector u, the vector of ratings (from very bad to very good), into a rating matrix to return a vector (Table 6).
Vector B1 collects the final grade based on ratings 1 to 5, for the vector u and its relative components. The same B2 analyzes the vector “u”, where the attributes described are applied in a general spatial context, neither valuable nor urban.

5. Discussion

This section provides an overview of the findings, as well as some recommendations for future research and policy. The main goals of this study were to explore the users’ perceptions of the landscape and soft mobility and provide a preliminary assessment for further criteria based on perceived levels. According to the study’s analysis based on principal component analysis, users’ perceptions are heavily influenced by natural aspects, whereas subjective aspects (satisfaction, age, money, and trip objectives) are unexplored. The primary determinants are clear space, light, and secure travel conditions.

5.1. Results of the Coherence Analysis between Plans and Objectives

The first step was to conduct a qualitative analysis to determine how the objectives and goals align with each other so that any gaps in local and regional planning may be identified. The analysis was conducted first at several levels, which included the regional, urban, and sustainability goals.
Given that the bicycle infrastructure was developed in Italy for tourism-related purposes as well, we examined the most important urban and regional cycle routes separately and then compared them against the sustainability goals.
The clustering between targets and tourist cycleways is displayed in Table 3 and Table 4 and Figure 4. Numerous cycleways constructed in Italy are based on sections of tourist cycling routes supported by the Eurovelo/Bicitalia/Fiab organizations.
Many cycleways are found on tourist-oriented trails (around lakes, at the seaside, and along religious routes such as the Via Francigena), where they connect to the existing network, as well as cycleways that are currently being built.
Figure 3 and Figure 4 show the consistency between the strategies of the regional plans and the regional mobility plan and the benchmark for the environmental sustainability goals identified in Table 3 and Table 4 and Figure 3 and Figure 4. The following levels of consistency are displayed in Table 3 and Table 4 in terms of significance if there is a relationship between elements of analysis. Level 1 of significance represents good consistency where there is full coherence between the plan strategies and the underlying environmental sustainability goals. Level 2 of significance is secondary consistency, where consistency with the reference environmental sustainability goals is not directly related to the plan strategies but may result as a side effect of the strategies. Level 3 of significance indicates nonconsistency, where there is no consistency between the plan strategies and reference environmental sustainability goals. The analysis was carried out only on the components consistent with this study, to capture any strong links between user perceptions and planning strategies, as these last and baseline environmental sustainability goals are not comparable.
The components in Table 6 contribute to improving the attractiveness and quality of the urban environment for the benefit of residents, the economy, and society. They are as follows: consuming responsibly; reducing climate action and impacts; ensuring well-being for all ages; achieving gender equality; and making cities safer, more resilient, and connected. They are aimed at creating the conditions for social well-being, understood as better and more equitable access to services and housing availability and improved quality of life and environmental conditions.
The analyses show “high/moderate” consistency with the environmental sustainability goals of reference for the user perception assessment, which are more aimed at environmental, land, and landscape protection.
Finally, moderate consistency is noted for strategies aimed at digitizing the mobility system.
In Figure 3 and Figure 4, the heatmap shows the further consistency clustering. The analyses show “moderate” consistency with the benchmark environmental sustainability goals for the user perception assessment, more aimed at environmental, land, and landscape protection. In fact, these strategies are specifically aimed at contributing to the achievement of most of the objectives considered, incorporating those of the SDGs into only a few general objectives. The heatmap in Figure 3 shows that the strongest environmental components are outdoor, land consumption, and land use impact reduction, which are among the strongest present for cycleways. This aspect should not only be understood from an environmental point of view but in terms of the impacts on perception.
The presence of user perception can also be seen in Figure 4, where the “connection between users and landscape” component is very strong, with considerable frequency in the 10 cycle routes analyzed. Similarly, the components related to the sustainable city and development in urban areas for cycleways appear to be of considerable importance.
Specifically, a multifaceted relationship between land and open space, and a relationship between the environment and the user, emerges, which is completely in line with the objectives of increasing user participation and promoting sustainable land use through the implementation of measures to reduce congestion and traffic and provide support for active mobility, highly related to the quality of life that is influenced by active movement.
By increasing the endowment of public green areas and fortifying ecological links, the same components fully concur with the goals of enhancing biodiversity and upgrading the landscape quality. The adoption of urban green area concepts is fully consistent with the objectives of climate change adaptation and mitigation. The enhancement of the “user perception” element for the improvement of environmental sustainability, including through the project of making cycle paths safer and more connected, is consistent with both the goals of improving the landscape quality and improving the quality of environmental resources.

5.2. FCE Results

The total fuzzy assessment result R was determined as R = B(5, 4, 3, 2, 1)T based on the approach and the FCE evaluation set V = {5, 4, 3, 2, 1}. The R outcome for scenario 1 is 2.274 and for scenario 2 is 3.179, demonstrating the index’s “moderate” to “good” range. From the perspective of the user, soft mobility, when grouped by factors, appears to be more relevant to the user’s judgment of a good level in scenario 2 than in scenario 1. The index component for user perception based on the landscape development effect is of good significance for both scenarios, according to the FCE principle.
The observation that the B values for the two scenarios differ leads us to believe that the index construction that has been suggested can adequately capture a metropolitan scenario while neglecting a more generic scenario. Hence, to increase the level of user perception control, a more thorough set of metrics and analyses is required. The vector has been estimated for two scenarios: scenario 1 for a metropolitan context and scenario 2 for a general context, encompassing both a suburban and coastal scope. This assumption for Italian cycleways can be considered valid because the coastal belts crossed by cycleways have a population density. Since many cycleways pass through inland areas, but not for many kilometers, they were excluded from this analysis.
The FCE is widely used as an analysis for decision-making processes but is still rarely used for landscape analysis. In the presented research, since there was no direct questionnaire, we used FCE as a means of alternatively evaluating the priority of indices in one context rather than another.
Among some advantages in common with the literature, as in our case, is the association of results by the importance of indices from scales of values and associated weights.
The proposed analysis allows us to evaluate, for the purpose of identifying objective criteria, new proposals for planning with user perception in mind.
The integrated user perception evaluation method is highly relevant according to this study. Each environment has unique characteristics due to the significant variety of perception assessments, so an improvement in indicators is necessary.
The comprehensive fuzzy assessment method is appropriate in assessing how users perceive their immediate surroundings, including both urban and rural settings.
During the step of calculating weights, the user-based perception evaluation indices were given various weights in this study using the information entropy method, which did not employ a questionnaire and instead received a direct evaluation, which has the advantage of objective weighting and can prevent the divergence of the weights produced by subjective assessment. Criteria measured for user perception, based on the outdoor spaces and safety and maintenance features that are considered important, are proposed:
  • Objective conditions of safety are a basic requirement in metropolitan, urban, and general areas. This condition is beneficial when the user is in a congested area or one lacking open spaces, where the health and safety of driving is weak.
  • Considerable effort should be made to reduce the gender gap that emerges from the coherence analyses, but it is not yet quantifiable in terms of factors, since, at present, cycleways are a type of travel infrastructure, and they lack facilities for users of different genders.
  • Landscape impacts perception through the elements of vegetation, luminosity, diversity, and space. Cleanliness and maintenance are also crucial, which is in line with sustainability goals regarding the development of safe and resilient cities.
As a result, although some of the plans’ objectives serve as the primary criteria, it is recommended that the evaluation of the user’s perspective is focused on subjective indications such as the rise in overall well-being during the bike journey (less tiring, vegetation for shade, rest, rest areas).
Based on this study, the work carried out by [70] appears to confirm that there are some common characteristics in the users’ perceptions of the landscape, with the difference that they have analyzed a closed space, while, in our case, the user is placed in an open space. Studies on visual perception [10,15,28] show that users have a positive impact on the environment and the space is functional regarding psychological characteristics.
Regarding the effectiveness of the evaluation for user-based perception, the findings demonstrate that there are natural aspects that users and landscapes share to facilitate a sense of involvement in the landscape. These results are consistent with the sustainable goals. In line with [85], our study also considers the landscape culture, which has components of both protection and conservation.
Public service facilities are also a part of the quality of the landscape because they can enhance customer satisfaction and boost bike network usage.
Regarding the perception of safety, we find a common link with what was identified by [88], who analyzed experiences with e-bikes, which, in their research, was not found to have any significant effect on perceived safety, differently from [89], which reported that greater e-bike experience improved perceived safety. A further development of the research would be to improve the role of participation and to re-evaluate the user perception component also from this point of view, to understand the presence of protected areas as identified by [90].
Future studies should focus on better comprehending how user experiences may affect how people view e-cycling, while taking sociodemographic and travel preferences into account. Business trips are associated with incidents and stress, and, for instance, negative experiences are studied in the literature [91,93]. A future proposal for analysis is to enrich the literature and the user perception framework to understand how a person’s perception of bicycle choices changes when applying a panel/longitudinal survey.

6. Conclusions

This article offers a perspective that combines soft mobility with landscape, considering the user at the center. When analyzing the landscape, establishing significant components for its evaluation is not easy; even when following planning guidelines, we often fail to include some factors that are important, such as indicators that place the user at the center (inclusion, well-being, socio-economic indicators, visual and sensory perception).
The work presented by [70] analyzes user perception in closed settings, while other authors have identified user perception in the landscape by evaluating environmental aspects such as the presence of green areas or forests. In this study, we proposed an interpretation considering the existence of soft mobility infrastructure and how the perception of the landscape varies according to the presence of these infrastructures on land. To achieve this analysis, we placed ourselves in the position of assessing the type of landscape in which cycling infrastructure is encountered: urban, suburban, provincial, or coastal/longshore.
In relation to the future regional plans to be adopted by the regions and the opening of the bicycle paths currently under construction, to maintain features such as maintenance, safe travel, and brightness, it is necessary to consider a strategy for landscape preservation and enhancement, on the one hand, and maintenance on the other. Some of the indicators utilized in the analysis are not always included in the mobility targets and plans, resulting in the promotion of some areas while other zones are not under examination.
We can identify the strengths and limitations of mobility planning and the role of the user based on the FCE results obtained. The importance of safety and the quality of vegetation and the environment cannot be overestimated. However, there are not many measures related to safety. Bicycle infrastructure has a wide range of actions, and our research starts at the regional spatial level; however, it is necessary to diversify the indices and methods of analysis.
It is also necessary to assess perceived disparities in rural and remote settings, which were excluded from this study.
This analysis demonstrates the need to work at the local level with safety, air quality, and quality of life in mind. Considering that local infrastructure is growing, the major limitation and opportunity of this study is to broaden the objectives to better vary the levels of investigation.

Author Contributions

Conceptualization, I.D.R. and A.D.; methodology, I.D.R.; software, I.D.R.; validation, I.D.R.; formal analysis, I.D.R. and A.D.; investigation, I.D.R. and A.D.; resources, I.D.R.; data curation, I.D.R.; writing—original draft preparation, I.D.R.; writing—review and editing, I.D.R., A.D., R.R.D. and A.D.R.; visualization, I.D.R. and A.D.; supervision, I.D.R. and A.D. All authors have read and agreed to the published version of the manuscript.

Funding

This research received no external funding.

Data Availability Statement

Data are available from the corresponding authors upon request.

Conflicts of Interest

The authors declare no conflict of interest.

References

  1. United Nations. Trasformare il Nostro Mondo: L’Agenda 2030 per lo Sviluppo Sostenibile; Risoluzione Adottata Dall’assemblea Generale; United Nations: New York, NY, USA, 2015. [Google Scholar]
  2. United Nations Human Settlements Programme. New Urban Agenda, Illustrated; UN-Habitat: Nairobi, Kenya, 2020. [Google Scholar]
  3. Von der Leyen, U. Political Guidelines for the Next European Commission 2019–2024 Opening Statement in the European Parliament Plenary Session Speech in the European Parliament Plenary Session; Publication Office of the European Union: Luxembourg, 2019; ISBN 9789276143802. [Google Scholar]
  4. Chapman, D. Urban Design of Winter Cities: Winter Season Connectivity for Soft Mobility. Ph.D. Thesis, Luleå Tekniska Universitet, Luleå, Sweden, 2018. [Google Scholar]
  5. Hedblom, M.; Hedenås, H.; Blicharska, M.; Adler, S.; Knez, I.; Mikusiński, G.; Svensson, J.; Sandström, S.; Sandström, P.; Wardle, D.A. Landscape perception: Linking physical monitoring data to perceived landscape properties. Landsc. Res. 2020, 45, 179–192. [Google Scholar] [CrossRef]
  6. European Commission. A concept for sustainable urban mobility plans. In Annex to the Communication from The Commission to the European Parliament, the Council, the European Economic and Social Committee and the Committee of the Regions Together towards Competitive and Resource-Efficient Urban Mobility COM 913; European Commission: Brussels, Belgium, 2013. [Google Scholar]
  7. Consult, R.; Beratung, F. Guidelines for Developing and Implementing a Sustainable Urban Mobility Plan. 2019. Available online: https://www.eltis.org/sites/default/files/sump_guidelines_2019_interactive_document_1.pdf (accessed on 8 May 2023).
  8. Conti, A.; Ruggeri, D.; Bartolomei, L. Soft infrastructure as landscape—A methodology for the assessment and improvement of the user experience of soft mobility. Transp. Res. Procedia 2016, 14, 2314–2323. [Google Scholar] [CrossRef]
  9. Niţă, A.; Buttler, A.; Rozylowicz, L.; Pătru-Stupariu, I. Perception and use of landscape concepts in the procedure of Environmental Impact Assessment: Case study—Switzerland and Romania. Land Use Policy 2015, 44, 145–152. [Google Scholar] [CrossRef]
  10. Erdönmez, M.Ö.; Kaptanoğlu, A. Landscape Aesthetic and Visual Quality Assessment. J. Fac. For. Istanb. Univ. Ser. B 2008, 58, 39–51. [Google Scholar]
  11. Cullen, G. Concise Townscape, 1st ed.; Routledge: Oxford, UK, 1961. [Google Scholar] [CrossRef]
  12. Lynch, K. The image of the environment. Image City 1960, 11, 1–13. [Google Scholar]
  13. Sell, J.L.; Zube, E.H. Perception of and response to environmental change. J. Archit. Plan. Res. 1986, 3, 33–54. [Google Scholar]
  14. Porteous, J.D. Environmental Aesthetics: Ideas, Politics and Planning; Routledge: Oxford, UK, 2013. [Google Scholar]
  15. Garau, C.; Pavan, V.M. Evaluating urban quality: Indicators and assessment tools for smart sustainable cities. Sustainability 2018, 10, 575. [Google Scholar] [CrossRef]
  16. Pinna, F.; Masala, F.; Garau, C. Urban policies and mobility trends in Italian smart cities. Sustainability 2017, 9, 494. [Google Scholar] [CrossRef]
  17. Höjer, M.; Wangel, J. Smart Sustainable Cities: Definition and Challenges. In ICT Innovations for Sustainability. Advances in Intelligent Systems and Computing; Hilty, L., Aebischer, B., Eds.; Springer: Cham, Switzerland, 2015; Volume 310, pp. 333–349. [Google Scholar] [CrossRef]
  18. Lindenau, M.; Böhler-Baedeker, S. Citizen and stakeholder involvement: A precondition for sustainable urban mobility. Trans. Res. Procedia 2014, 4, 347–360. [Google Scholar] [CrossRef]
  19. Louro, A.; da Costa, N.M.; da Costa, E.M. Sustainable urban mobility policies as a path to healthy cities—The case study of LMA, Portugal. Sustainability 2019, 11, 2929. [Google Scholar] [CrossRef]
  20. Broseta, M.T. Urban quality improvement programs in the Sustainable urban Mobility Plan of Valencia (Spain). WIT Trans. Built Environ. 2015, 146, 351–362. [Google Scholar]
  21. Ignaccolo, M.; Inturri, G.; Giuffrida, N.; Torrisi, V. A sustainable framework for the analysis of port systems. Eur. Trans. Int. J. Transp. Econ. Eng. Law 2020, 78, 7. [Google Scholar] [CrossRef]
  22. Purcell, A.T.; Lamb, R.J. Landscape perception: An examination and empirical investigation of two central issues in the area. J. Environ. Manag. 1984, 19, 31–63. [Google Scholar]
  23. Otahel, J. Visual landscape perception: Landscape pattern and aesthetic assessment. Ecol. J. Ecol. Probl. Biosph. 1999, 18, 63–74. [Google Scholar]
  24. Dramstad, W.E.; Tveit, M.S.; Fjellstad, W.J.; Fry, G.L. Relationships between visual landscape preferences and map-based indicators of landscape structure. Landsc. Urban Plan. 2006, 78, 465–474. [Google Scholar] [CrossRef]
  25. Council of Europe. European Landscape Convention and Reference Documents. 2000. Available online: https://rm.coe.int/european-landscape-convention-book-text-feb-2008-en/16802f80c6 (accessed on 28 May 2022).
  26. D’Auria, A.; De Toro, P.; Fierro, N.; Montone, E. Integration between GIS and multi-criteria analysis for ecosystem services assessment: A methodological proposal for the National Park of Cilento, Vallo di Diano and Alburni (Italy). Sustainability 2018, 10, 3329. [Google Scholar] [CrossRef]
  27. Fayet, C.M.; Reilly, K.H.; Van Ham, C.; Verburg, P.H. The potential of European abandoned agricultural lands to contribute to the Green Deal objectives: Policy perspectives. Environ. Sci. Policy 2022, 133, 44–53. [Google Scholar] [CrossRef]
  28. Griscom, B.W.; Adams, J.; Ellis, P.W.; Houghton, R.A.; Lomax, G.; Miteva, D.A.; Fargione, J. Natural climate solutions. Proc. Natl. Acad. Sci. USA 2017, 114, 11645–11650. [Google Scholar] [CrossRef]
  29. European Commission. Communication from the Commission to the European Parliament, the Council, the European Economic and Social Committee and the Committee of the Regions a Farm to Fork Strategy for a Fair. Healthy and Environmentally-Friendly Food System; European Commission: Brussels, Belgium, 2020. [Google Scholar]
  30. Alipour, D.; Dia, H. A Systematic Review of the Role of Land Use, Transport, and Energy-Environment Integration in Shaping Sustainable Cities. Sustainability 2023, 15, 6447. [Google Scholar] [CrossRef]
  31. Fernández-Aguilar, C.; Brosed-Lázaro, M.; Carmona-Derqui, D. Effectiveness of Mobility and Urban Sustainability Measures in Improving Citizen Health: A Scoping Review. Int. J. Environ. Res. Public Health 2023, 20, 2649. [Google Scholar] [CrossRef]
  32. Kates, R.W.; Clark, W.C.; Corell, R.; Hall, J.M.; Jaeger, C.C.; Lowe, I.; McCarthy, J.J.; Schellnhuber, H.J.; Bolin, B.; Dickson, N.M.; et al. Sustainability science. Science 2001, 292, 641–642. [Google Scholar] [CrossRef]
  33. Kates, R.W. What kind of a science is sustainability science? Proc. Natl. Acad. Sci. USA 2011, 108, 19449–19450. [Google Scholar] [CrossRef] [PubMed]
  34. Daly, H.E. On Wilfred Beckerman’s critique of sustainable development. Environ. Values 1995, 4, 49–55. [Google Scholar] [CrossRef]
  35. Van den Bergh, J.C. Externality or sustainability economics? Ecol. Econ. 2010, 69, 2047–2052. [Google Scholar] [CrossRef]
  36. Wu, J. Landscape sustainability science: Ecosystem services and human well-being in changing landscapes. Landsc. Ecol. 2013, 28, 999–1023. [Google Scholar] [CrossRef]
  37. Charles, E.L. Greenways for America; Johns Hopkins University Press: Baltimore, MD, USA, 1995. [Google Scholar]
  38. Gifford, R.; Steg, L.; Reser, J.P. Environmental Psychology; Wiley Blackwell: Hoboken, NJ, USA, 2011. [Google Scholar]
  39. Yulian, L.; Zhengfan, H. Environmental Psychology; Construction Industry Press: Beijing, China, 2001. [Google Scholar]
  40. Jian, C. Study on Landscape Design of the City Waterfront Green Space Bike Lane. Ph.D. Thesis, Chinese Academy of Forestry, Beijing, China, 2017. [Google Scholar]
  41. Sachsenweger, M. Testing visual perception of three-dimensionally moving objects (dynamic stereoscopy). Doc. Ophthalmol. 1986, 64, 379–385. [Google Scholar] [CrossRef] [PubMed]
  42. Lopez-Moliner, J.; Smeets, J.B.; Brenner, E. Components of motion perception revealed: Two different after-effects from a single moving object. Vis. Res. 2004, 44, 2545–2549. [Google Scholar] [CrossRef]
  43. Wang, L.; Hu, W.M.; Tan, T.N. A survey of visual analysis of human motion. Chin. J. Comput. Chin. Ed. 2002, 25, 225–237. [Google Scholar]
  44. Santillán, J.E.; Barraza, J.F. Distance perception during self-movement. Hum. Mov. Sci. 2019, 67, 102496. [Google Scholar] [CrossRef]
  45. Shih, T.; Lin, Y. The relationship between greenway’s function and users’ satisfaction in Taichung. J. Taiwan Soc. Hortic. Sci. 2007, 53, 251–264. [Google Scholar]
  46. He, H.; Lin, X.; Yu, Y. Research on greenway riding environment perception assessment based on semantic differential method: The case of the first phase of East Lake Greenway in Wuhan. New Arch. 2019, 4, 33–37. [Google Scholar]
  47. Liu Song, L.I.; Wanchen, C.K. Environmental Perception Evaluation for Huangpu Riverside Cycling Greenway. J. Chin. Urban Forest. 2020, 18, 39–43. [Google Scholar]
  48. Gan, Y.; Luo, T.; Breitung, W.; Kang, J.; Zhang, T. Multi-sensory landscape assessment: The contribution of acoustic perception to landscape evaluation. J. Acoust. Soc. Am. 2014, 136, 3200–3210. [Google Scholar] [CrossRef]
  49. Yang, J.; Zhao, L.; Mcbride, J.; Gong, P. Can you see green? Assessing the visibility of urban forests in cities. Landsc. Urban Plan. 2009, 91, 97–104. [Google Scholar] [CrossRef]
  50. Liu, J.; Lughofer, E.; Zeng, X. Toward model building for visual aesthetic perception. Comput. Intell. Neurosci. 2017, 2017, 1292801. [Google Scholar] [CrossRef] [PubMed]
  51. Nohl, W. Sustainable landscape use and aesthetic perception–preliminary reflections on future landscape aesthetics. Landsc. Urban Plan. 2001, 54, 223–237. [Google Scholar] [CrossRef]
  52. Lei, Z. Research on the Theory of Image in Landscape. Ph.D. Thesis, Harbin Institute of Technology, Harbin, China, 2014. [Google Scholar]
  53. Tveit, M.; Ode, Å.; Fry, G. Key concepts in a framework for analysing visual landscape character. Landsc. Res. 2006, 31, 229–255. [Google Scholar] [CrossRef]
  54. Zhang, X.; Xu, D.; Zhang, N. Research on Landscape Perception and Visual Attributes Based on Social Media Data—A Case Study on Wuhan University. Appl. Sci. 2022, 12, 8346. [Google Scholar] [CrossRef]
  55. Liu, B.; Fan, R. Quantitative analysis of the visual attraction elements of landscape space. J. Nanjing For. Univ. 2014, 38, 149–152. [Google Scholar]
  56. Li, C.; Zhao, Y.; Sun, X.; Su, X.; Zheng, S.; Dong, R.; Shi, L. Photography-based analysis of tourists’ temporal–spatial behaviour in the Old Town of Lijiang. Int. J. Sustain. Dev. World Ecol. 2011, 18, 523–529. [Google Scholar] [CrossRef]
  57. Steen Jacobsen, J.K. Use of landscape perception methods in tourism studies: A review of photo-based research approaches. Tour. Geogr. 2007, 9, 234–253. [Google Scholar] [CrossRef]
  58. Dillman, K.J.; Heinonen, J.; Davíðsdóttir, B. A development of intergenerational sustainability indicators and thresholds for mobility system provisioning: A socio-ecological framework in the context of strong sustainability. Environ. Sustain. Indic. 2023, 18, 100240. [Google Scholar] [CrossRef]
  59. Velarde, M.D.; Fry, G.; Tveit, M. Health effects of viewing landscapes—Landscape types in environmental psychology. Urban For. Urban Green. 2007, 6, 199–212. [Google Scholar] [CrossRef]
  60. Kurdoglu, O.; Kurdoglu, B.C. Determining recreational, scenic, and historical–cultural potentials of landscape features along a segment of the ancient Silk Road using factor analyzing. Environ. Monit. Assess. 2010, 170, 99–116. [Google Scholar] [CrossRef] [PubMed]
  61. Jessel, B. Elements, characteristics and character—Information functions of landscapes in terms of indicators. Ecol. Indic. 2006, 6, 153–167. [Google Scholar] [CrossRef]
  62. Mastrangelo, M.E.; Weyland, F.; Villarino, S.H.; Barral, M.P.; Nahuelhual, L.; Laterra, P. Concepts and methods for landscape multifunctionality and a unifying framework based on ecosystem services. Landsc. Ecol. 2014, 29, 345–358. [Google Scholar] [CrossRef]
  63. Kanda, W.; Kivimaa, P. What opportunities could the COVID-19 outbreak offer for sustainability transitions research on electricity and mobility? Energy Res. Soc. Sci. 2020, 68, 101666. [Google Scholar] [CrossRef]
  64. Banister, D. Barriers to the implementation of urban sustainability. Int. J. Environ. Pollut. 1998, 10, 65–83. [Google Scholar] [CrossRef]
  65. Wilson, G.A. Community resilience, globalization, and transitional pathways of decision-making. Geoforum 2012, 43, 1218–1231. [Google Scholar] [CrossRef]
  66. García-Hernández, M.; De la Calle-Vaquero, M.; Yubero, C. Cultural heritage and urban tourism: Historic city centres under pressure. Sustainability 2017, 9, 1346. [Google Scholar] [CrossRef]
  67. Torrisi, V.; Garau, C.; Ignaccolo, M.; Inturri, G. “Sustainable urban mobility plans”: Key concepts and a critical revision on SUMPs guidelines. In Computational Science and Its Applications–ICCSA 2020: 20th International Conference, Cagliari, Italy, 1–4 July 2020; Proceedings, Part VII 20; Springer International Publishing: Cham, Switzerland, 2020; pp. 613–628. [Google Scholar]
  68. Zhu, L.; Ali, M.; Macioszek, E.; Aghaabbasi, M.; Jan, A. Approaching sustainable bike-sharing development: A systematic review of the influence of built environment features on bike-sharing ridership. Sustainability 2022, 14, 5795. [Google Scholar] [CrossRef]
  69. Italian Minister of Infrastructure and Transport. Ciclovie Turistiche Nazionali. 2022. Available online: https://www.mit.gov.it/connettere-litalia/ciclovie-turistiche-nazionali (accessed on 8 May 2023).
  70. Wang, X.; Shen, L.; Shi, S. Evaluation of underground space perception: A user-perspective investigation. Tunn. Undergr. Space Technol. 2023, 31, 104822. [Google Scholar] [CrossRef]
  71. Zhang, P.; Feng, G. Application of fuzzy comprehensive evaluation to evaluate the effect of water flooding development. J. Petrol. Explor. Prod. Technol. 2018, 8, 1455–1463. [Google Scholar] [CrossRef]
  72. European Commission. Recovery Plan. 2019. Available online: https://commission.europa.eu/strategy-and-policy/recovery-plan-europe_en (accessed on 8 May 2023).
  73. Chan, F.T.; Kumar, N. Global supplier development considering risk factors using fuzzy extended AHP-based approach. Omega 2007, 35, 417–431. [Google Scholar] [CrossRef]
  74. Xie, J.; Liu, C. Fuzzy Mathematics Method and Its Application; Huazhong University of Science and Technology Press: Wuhan, China, 2006. [Google Scholar]
  75. Zadeh, L.A. Fuzzy sets as a basis for a theory of possibility. Fuzzy Sets Syst. 1978, 1, 3–28. [Google Scholar] [CrossRef]
  76. Zhang, D.; Yang, S.; Wang, Z.; Yang, C.; Chen, Y. Assessment of ecological environment impact in highway construction activities with improved group AHP-FCE approach in China. Environ. Monit. Assess. 2020, 192, 1–18. [Google Scholar] [CrossRef]
  77. Wang, W.; Dong, C.; Dong, W.; Yang, C.; Ju, T.; Huang, L.; Ren, Z. The design and implementation of risk assessment model for hazard installations based on AHP–FCE method: A case study of Nansi Lake Basin. Ecol. Inform. 2016, 36, 162–171. [Google Scholar] [CrossRef]
  78. Li, J.; Wu, W.; Jin, Y.; Zhao, R.; Bian, W. Research on environmental comfort and cognitive performance based on EEG+ VR+ LEC evaluation method in underground space. Build. Environ. 2021, 198, 107886. [Google Scholar] [CrossRef]
  79. Cui, L. Applying fuzzy comprehensive evaluation method to evaluate quality in crisis and emergency management. Commun. Stat. Theory Methods 2012, 41, 3942–3959. [Google Scholar] [CrossRef]
  80. Gehring, K. Landscape Needs and Notions: Preferences, Expectations, Leisure Motivation, and the Concept of Landscape from a Cross-Cultural Perspective; Swiss Federal Research Institute, WSL: Birmensdorf, Switzerland, 2006. [Google Scholar]
  81. Soliva, R.; Bolliger, J.; Hunziker, M. Differences in preferences towards potential future landscapes in the Swiss Alps. Landsc. Res. 2010, 35, 671–696. [Google Scholar] [CrossRef]
  82. Wartmann, F.M.; Frick, J.; Kienast, F.; Hunziker, M. Factors influencing visual landscape quality perceived by the public. Results from a national survey. Landsc. Urban Plan. 2021, 208, 104024. [Google Scholar] [CrossRef]
  83. Wang, X.; Li, X.R.; Zhen, F.; Zhang, J. How smart is your tourist attraction? Measuring tourist preferences of smart tourism attractions via a FCEM-AHP and IPA approach. Tour. Manag. 2016, 54, 309–320. [Google Scholar] [CrossRef]
  84. Arellana, J.; Saltarín, M.; Larrañaga, A.M.; Alvarez, V.; Henao, C.A. Urban walkability considering pedestrians’ perceptions of the built environment: A 10-year review and a case study in a medium-sized city in Latin America. Transp. Rev. 2020, 40, 183–203. [Google Scholar] [CrossRef]
  85. Arellana, J.; Saltarín, M.; Larrañaga, A.M.; González, V.I.; Henao, C.A. Developing an urban bikeability index for different types of cyclists as a tool to prioritise bicycle infrastructure investments. Transp. Res. Part A Policy Pract. 2020, 139, 310–334. [Google Scholar] [CrossRef]
  86. Raad, N.; Burke, M.I. What are the most important factors for pedestrian level-of-service estimation? A systematic review of the literature. Transp. Res. Rec. 2018, 2672, 101–117. [Google Scholar] [CrossRef]
  87. Alfonzo, M.A. To walk or not to walk? The hierarchy of walking needs. Environ. Behav. 2005, 37, 808–836. [Google Scholar] [CrossRef]
  88. Marincek, D. Comparing E-Bike Users’ Perceptions of Safety: The Case of Lausanne, Switzerland. Act. Travel Stud. 2023, 3. [Google Scholar] [CrossRef]
  89. Haustein, S.; Møller, M. E-bike safety: Individual-level factors and incident characteristics. J. Transp. Health 2016, 3, 386–394. [Google Scholar] [CrossRef]
  90. Lee, S.; Son, Y. Mapping of user-perceived landscape types and spatial distribution using crowdsourced photo data and machine learning: Focusing on Taeanhaean National Park. J. Outdoor Recreat. Tour. 2023, 100616. [Google Scholar] [CrossRef]
  91. Lee, A.; Underwood, S.; Handy, S. Crashes and other safety-related incidents in the formation of attitudes toward bicycling. Transp. Res. Part F Traffic Psychol. Behav. 2015, 28, 14–24. [Google Scholar] [CrossRef]
  92. Pareglio, S.; Radaelli, R. La VAS nella Regione Lombardia. In Valutare i Piani. Efficacia e Metodi Della Valutazione Ambientale Strategica; Mariolina, B., Grazia, B., Marcello, M., Eds.; Bruno Mondadori: Torino, Italy, 2013. [Google Scholar]
  93. Sanders, R.L. Perceived traffic risk for cyclists: The impact of near miss and collision experiences. Accid. Anal. Prev. 2015, 75, 26–34. [Google Scholar] [CrossRef] [PubMed]
  94. Oliveira, V.; Pinho, P. Measuring success in planning: Developing and testing a methodology for planning evaluation. Town Plan. Rev. 2010, 81, 307–332. Available online: http://www.jstor.org/stable/40660727 (accessed on 24 December 2020). [CrossRef]
  95. Navarro-Yáñez, C.J.; Rodríguez-García, M.J.; Guerrero-Mayo, M.J. Evaluating the Quality of Urban Development Plans Promoted by the European Union: The URBAN and URBANA Initiatives in Spain (1994–2013). Soc. Indic. Res. 2020, 149, 215–237. [Google Scholar] [CrossRef]
  96. ISPRA. Indicazioni Operative a Supporto Della Valutazione e Redazione dei Documenti Della VAS; Istituto Superiore per la Protezione e la Ricerca ambientale. Manuali e Linee Guida, 124/2015; ISPRA: Ispra, Italy, 2015; ISBN 978-88-448-0713-9. Available online: https://www.isprambiente.gov.it/files/pubblicazioni/manualilineeguida/MLG_124_15.pdf (accessed on 8 May 2023).
  97. Isola, F.; Pira, C.; Zoppi, C. Indirizzi Metodologici per L’estensione del Piano Paesaggistico Regionale Della Sardegna Agli Ambiti Interni. XXXVIII CONFERENZA ITALIANA DI SCIENZE REGIONALI. 2017. Available online: https://www.aisre.it/images/aisre/5971ab8f3490f6.24057473/Isola.pdf (accessed on 8 May 2023).
  98. England, M.I.; Dougill, A.J.; Stringer, L.C.; Vincent, K.E.; Pardoe, J.; Kalaba, F.K.; Mkwambisi, D.D.; Namaganda, E.; Afionis, S. Climate change adaptation and cross-sectoral policy coherence in southern Africa. Reg. Environ. Change 2018, 18, 2059–2071. [Google Scholar] [CrossRef]
Figure 1. Extent of bike routes per area in Italy from 2013 to 2019. Source: Istat (2020), with authors’ elaboration.
Land 12 01048 g001
Figure 2. National bike route network in Italy. Source: Ministry of Transport and Infrastructure.
Land 12 01048 g002
Figure 3. Heatmap for landscape components. Source: authors’ elaboration.
Land 12 01048 g003
Figure 4. Heatmap for landscape components. Source: authors’ elaboration.
Land 12 01048 g004
Figure 5. Components of factors. Source: authors’ elaboration.
Land 12 01048 g005
Table 1. Mobility regional plan in Italy. Source: authors’ elaboration.
RegionPlan Description
Lombardia RegionThe Regional Bicycle Mobility Plan (PRMC) defines guidelines on updating local government planning and technical standards for the implementation of the bicycle network of regional interest with the aim of encouraging and promoting sustainable approaches in daily and leisure travel. There are 17 region-wide bicycle routes.
Veneto RegionThe Regional Plan of Cycling Mobility (RPCM) of the region of Veneto has, as its fundamental objectives, the development of a system oriented toward the protection of the environment and the territory, aiming at sustainable mobility, also encouraging the use of the bicycle as an environmentally friendly means of transport. Through this plan, the framework of the regional bicycle network and the main routes to be built and existing ones will be identified, creating a network of bicycle routes of different hierarchical levels and functions and the types of interventions, and quantifying the related implementation costs.
Puglia RegionThe Regional Bicycle Plan of Apulia is a Regional Bicycle Mobility Plan that provides a bicycle network of the Mediterranean, consisting of the routes of the Bicitalia and Eurovelo networks, which cross the project partner territories.
Sardinia RegionRecent recognition by the region of Sardinia of the significance of sustainable mobility for the island’s development has given cycling and related infrastructure a strategic role in regional planning for priority infrastructure projects and promoted cycle paths as “true and legitimate infrastruttures of sustainable mobility with low environmental impact” (Sardinia Autonomous Region).
Table 2. Fields and indicators for the case study. Source: authors’ elaboration based on SUMPs, SDGs.
FieldPhysical EnvironmentICTsSpace and ConnectionsFacilityLandscapeSafety
IndicatorsQuality of pavementtraffic devicesgreen areascommercial areasclean airheritage buildings
Ostacles on routeusers facilitiespresence of treesresidential zonessilence and no congestiongreen areas
Presence of vehiclespublic lightcleanliness of routeparkes, green zonesunesco heritage sitesplaces proximity
Infrastructure continuitysignals, devicesaesthetics of buildingsaccessibility facilitiesimmaterial value sitesSinistrality
Table 3. Consistency analysis between SUMPs and GMP. Source: authors’ elaboration.
SUMPs IndicatorsGeneral Objectives of National General Mobility Plan Indicators
Major General Objectives for National General Mobility Plan for Bike Paths
Transport systems resilient to climate change, pandemics, and other disastersEfficient, clean, safe, quiet transportation with zero net emissions, implementing policies and actions for healthy, active, and safer mobilityA social inclusion process that ensures access to mobility and transportationInvestments that can use digitization of transport and mobility services; infrastructure to support sustainable mobility; integrated local public transportThe more equitable use of public space
SUMPsEnsure that all residents are offered transport options that enable access to key destinations and services−1−1101
Improve safety and security10011
Reduce air and noise pollution, greenhouse gas emissions, and energy consumption11011
Improve the efficiency and cost-effectiveness of the transportation of persons and goods11010
Contribute to enhancing the attractiveness and quality of the urban environment for the benefit of residents, the economy, and society as a whole01101
Note: Legend for level of significance: high = 1, moderate = 0, few = −1.
Table 4. Consistency analysis between SUMPs and SDGs’ goals. Source: authors’ elaboration.
Major General Objective for National General Mobility Plan for Bike Paths
Transport systems resilient to climate change, pandemics, and other disastersEfficient, clean, safe, quiet transportation with zero net emissions, implementing policies and actions for healthy, active, and safer mobilityA social inclusion process that ensures access to mobility and transportationInvestments that can use digitization of transport and mobility services; infrastructure to support sustainable mobility; integrated local public transportThe more equitable use of public space
Responsible consumption1−1−1−10
Reduce climate action and impacts10111
Ensure well-being at all ages11001
Achieve gender equality01−1−11
Make cities safer, more resilient, and connected11111
Note: Legend for level of significance: high = 1, moderate = 0, few = −1.
Table 5. Components of set Un factors. Source: authors’ elaboration.
Components of Set UFactors
u1Vegetation
u2Environmental diversity
u3Landscape harmony
u4Openness
u5Luminosity
u6Facility
u7Cleanliness
u8Maintenance
u9Leisure activities
u10Meeting place
u11Safety
u12Sinistrality
Table 6. Results of factors for user-based perception. Source: authors’ elaboration.
Resulting Vector of FCE for User’s Perception
V1V2V3V4V5
Very Good = 5Good = 4Moderate = 3Poor = 2Very Poor = 1 RScenario
B10.1120.1240.1080.2380.418->2274Scenario 1:
“metropolitan area”
B20.2540.1250.3380.1120.171->3179Scenario 2:
“general land area”
Disclaimer/Publisher’s Note: The statements, opinions and data contained in all publications are solely those of the individual author(s) and contributor(s) and not of MDPI and/or the editor(s). MDPI and/or the editor(s) disclaim responsibility for any injury to people or property resulting from any ideas, methods, instructions or products referred to in the content.

