
Assessment of the Impacts of Urbanization on Landslide Susceptibility in Hakha City, a Mountainous Region of Western Myanmar

 ,
,
Abstract
:1. Introduction
2. Materials and Methods
3. Results
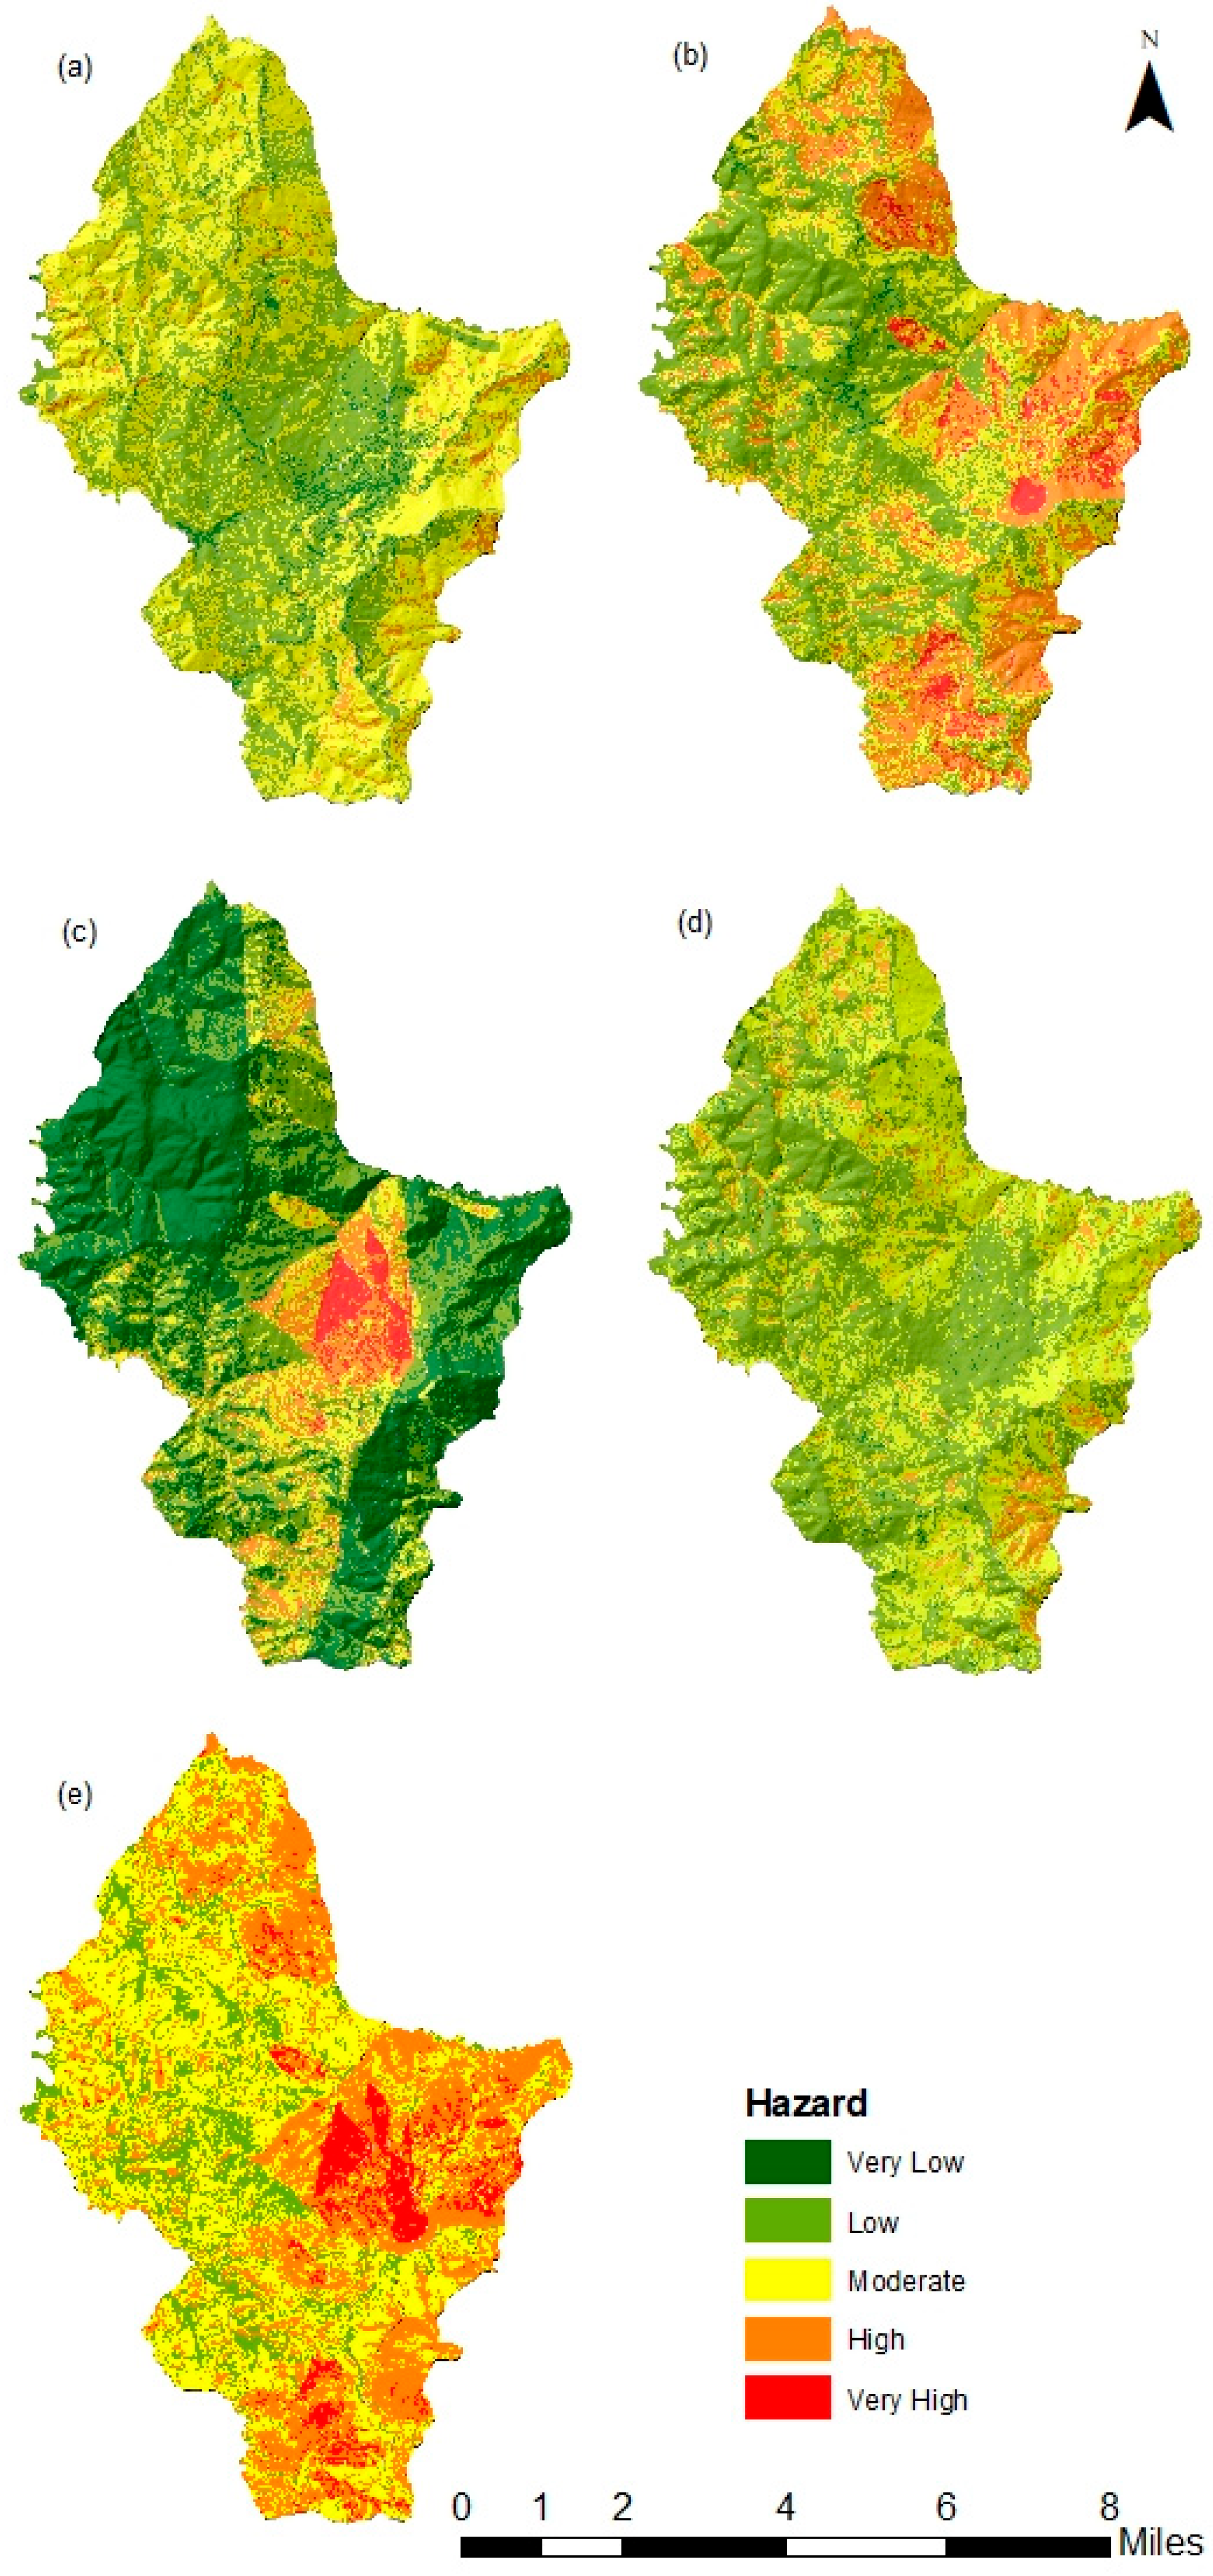
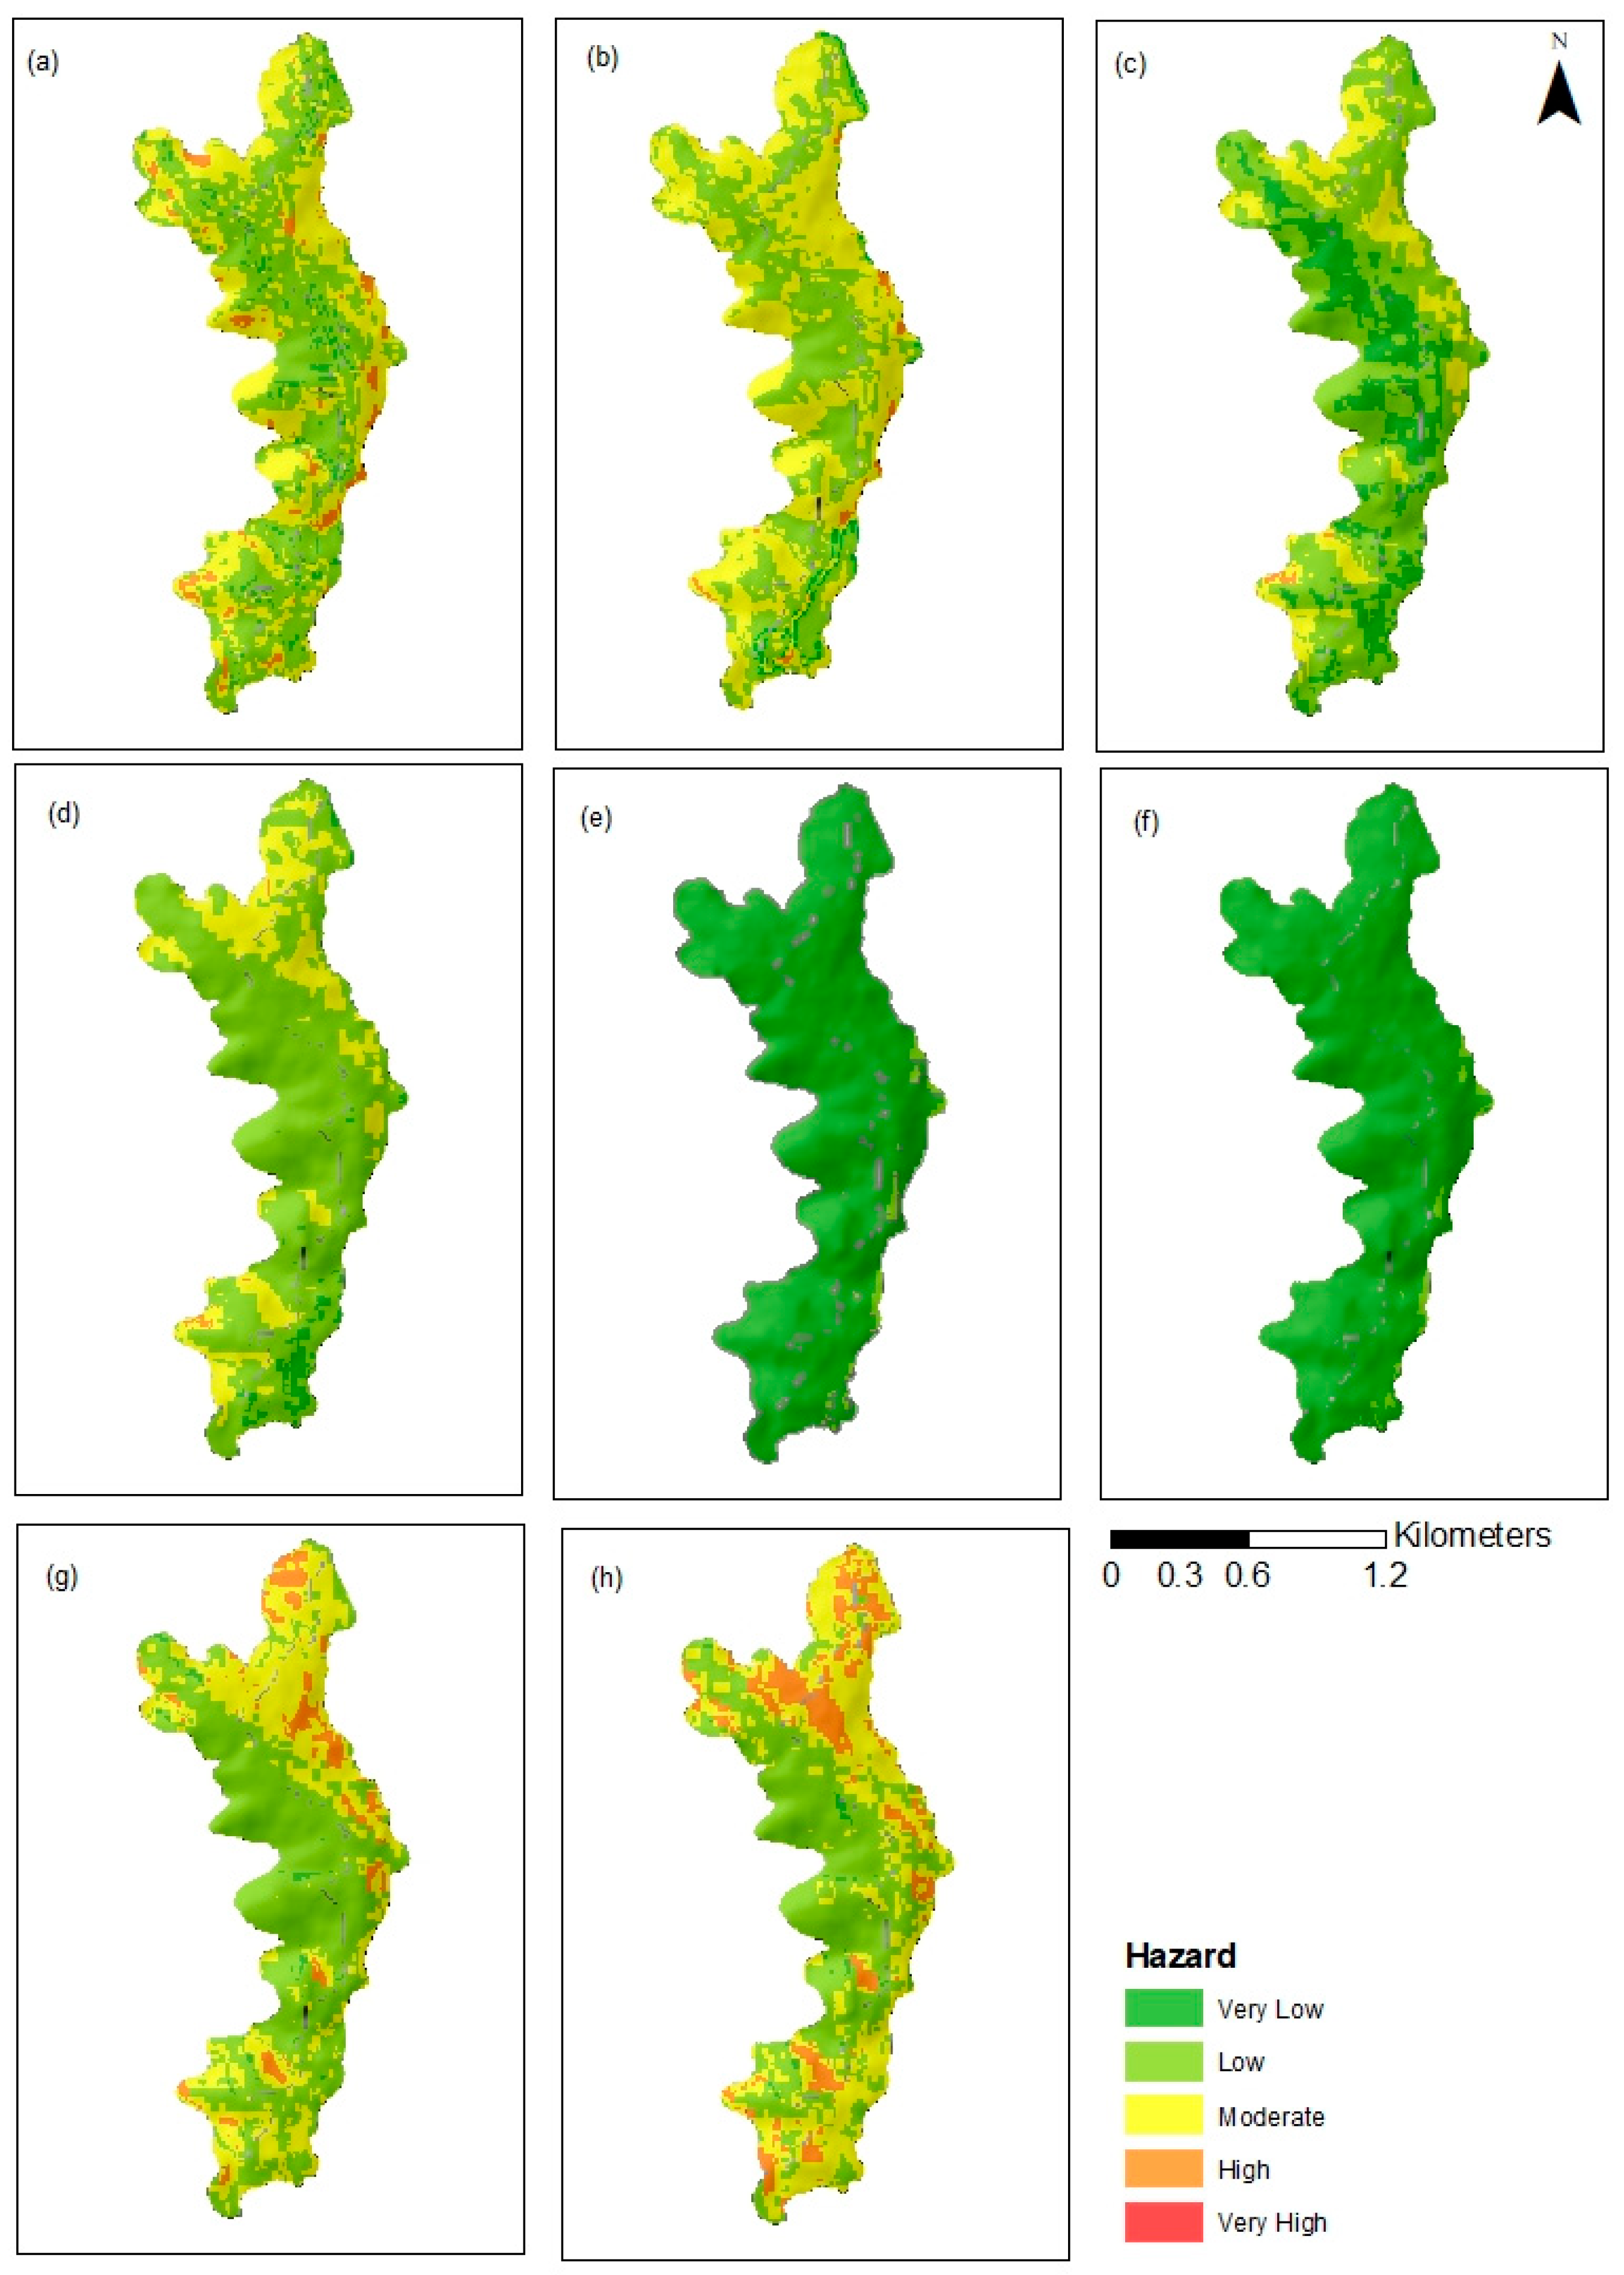
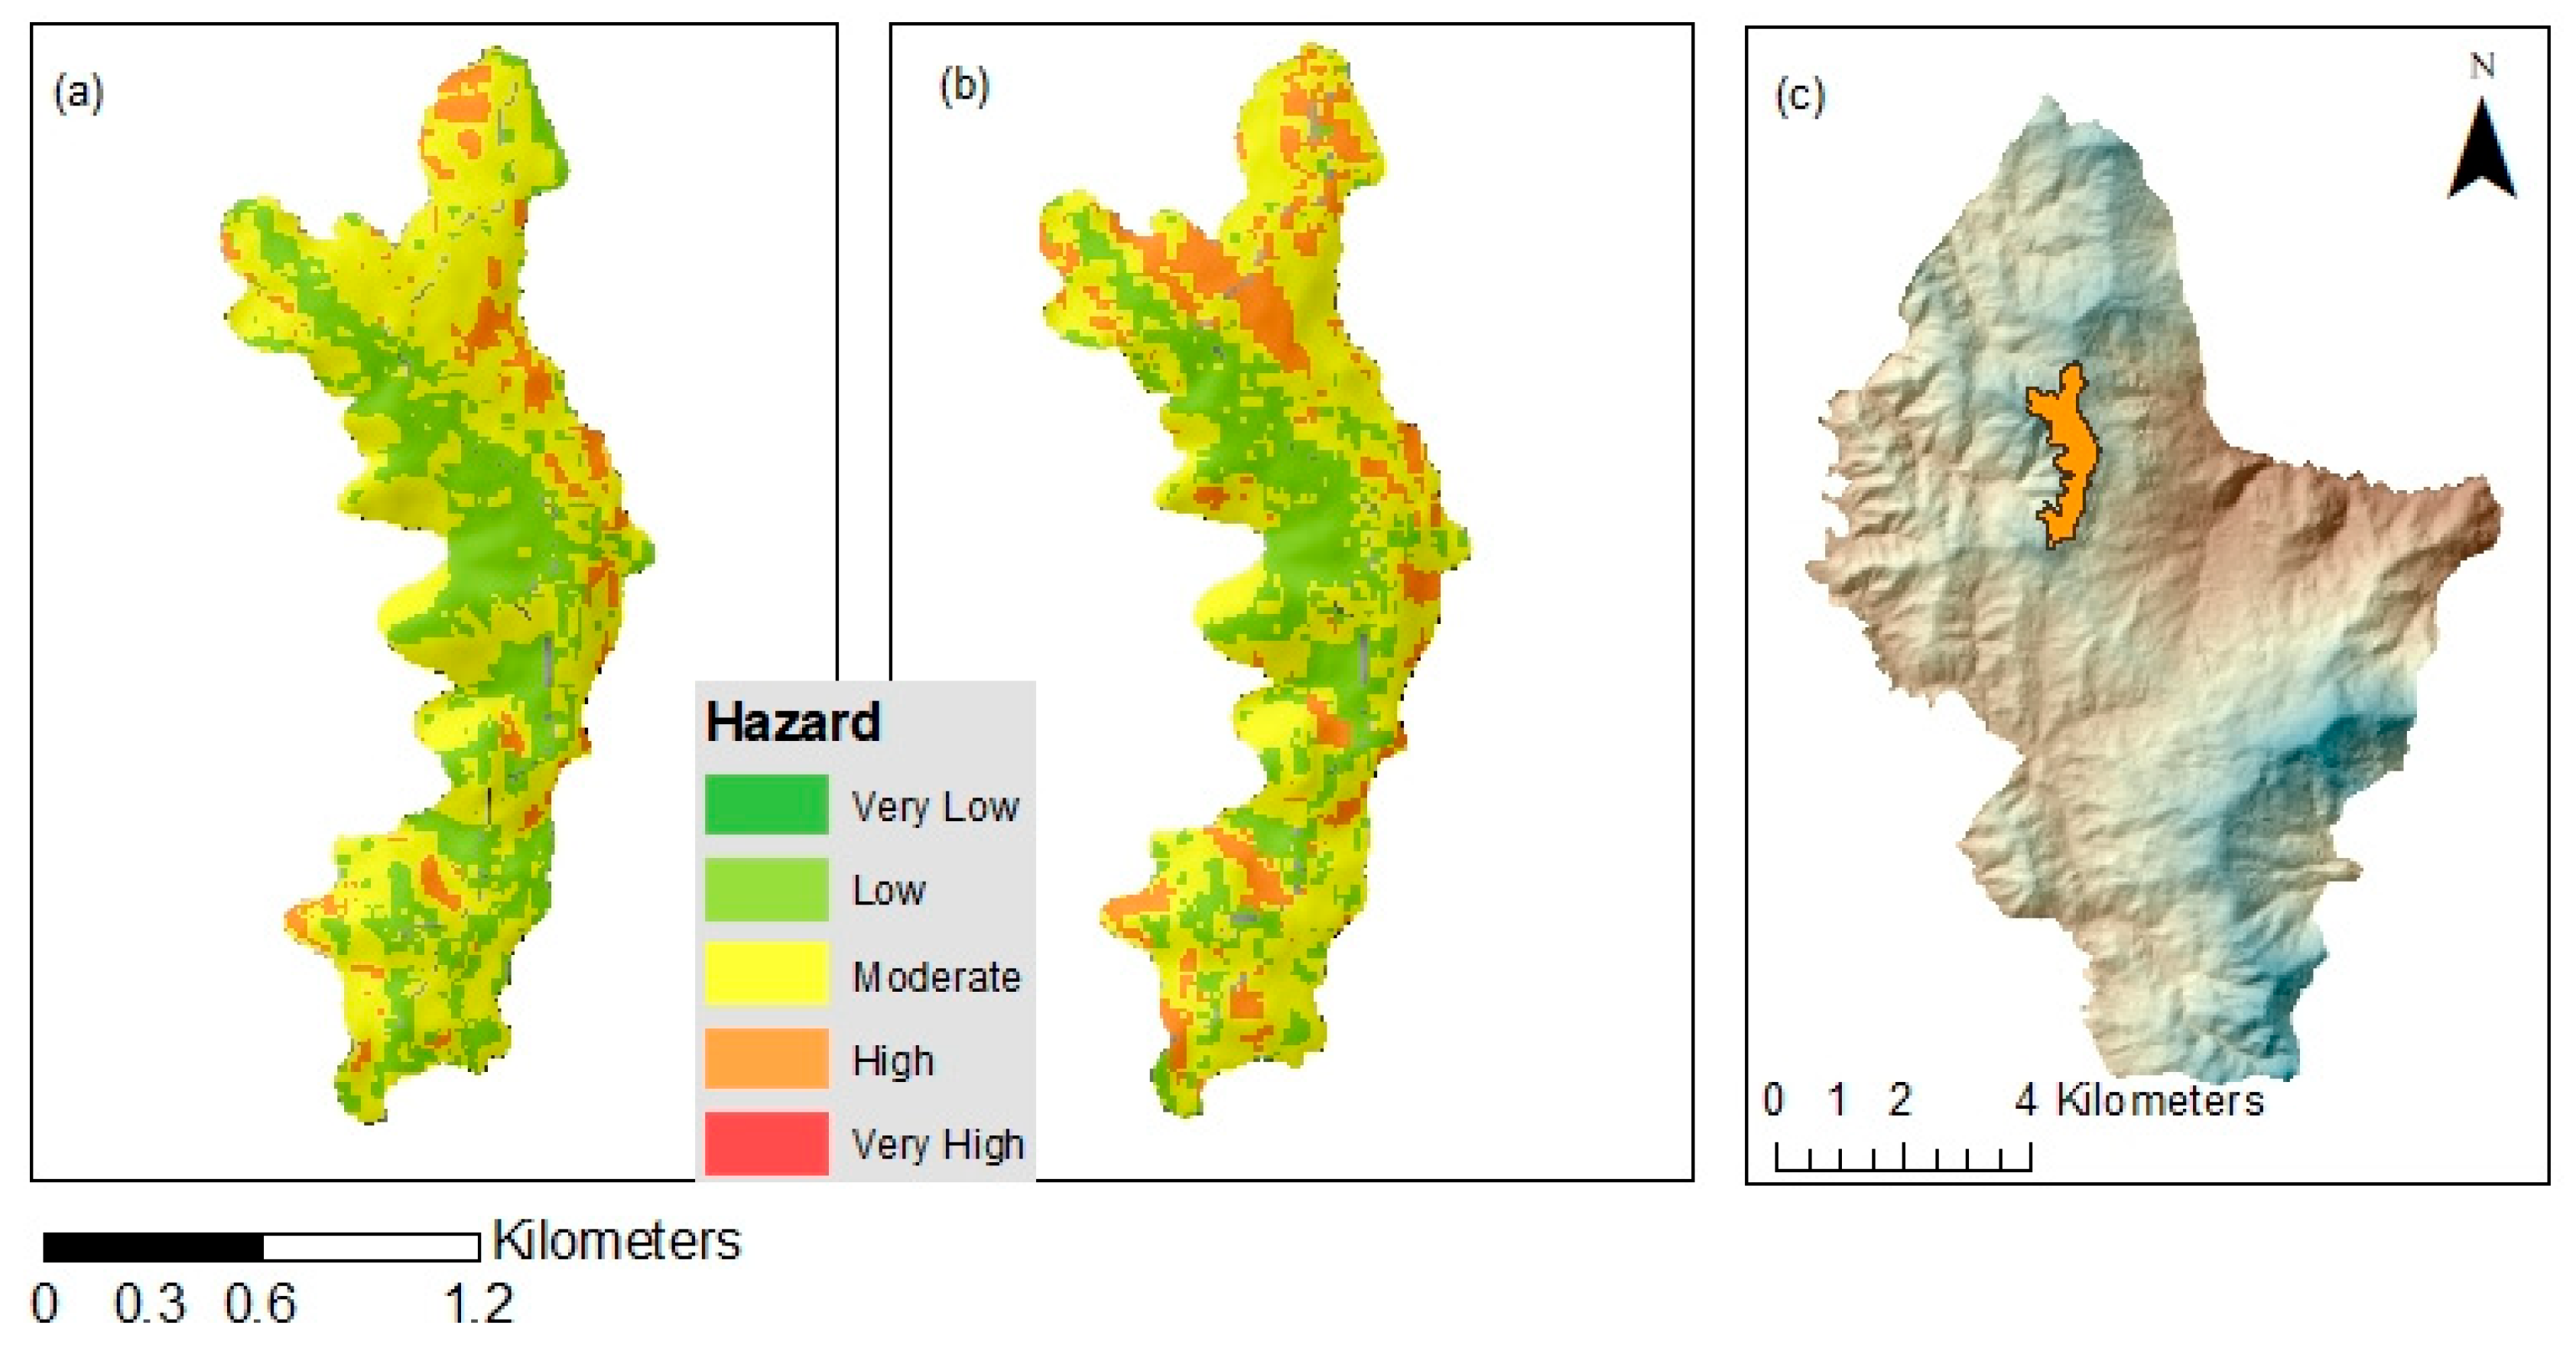
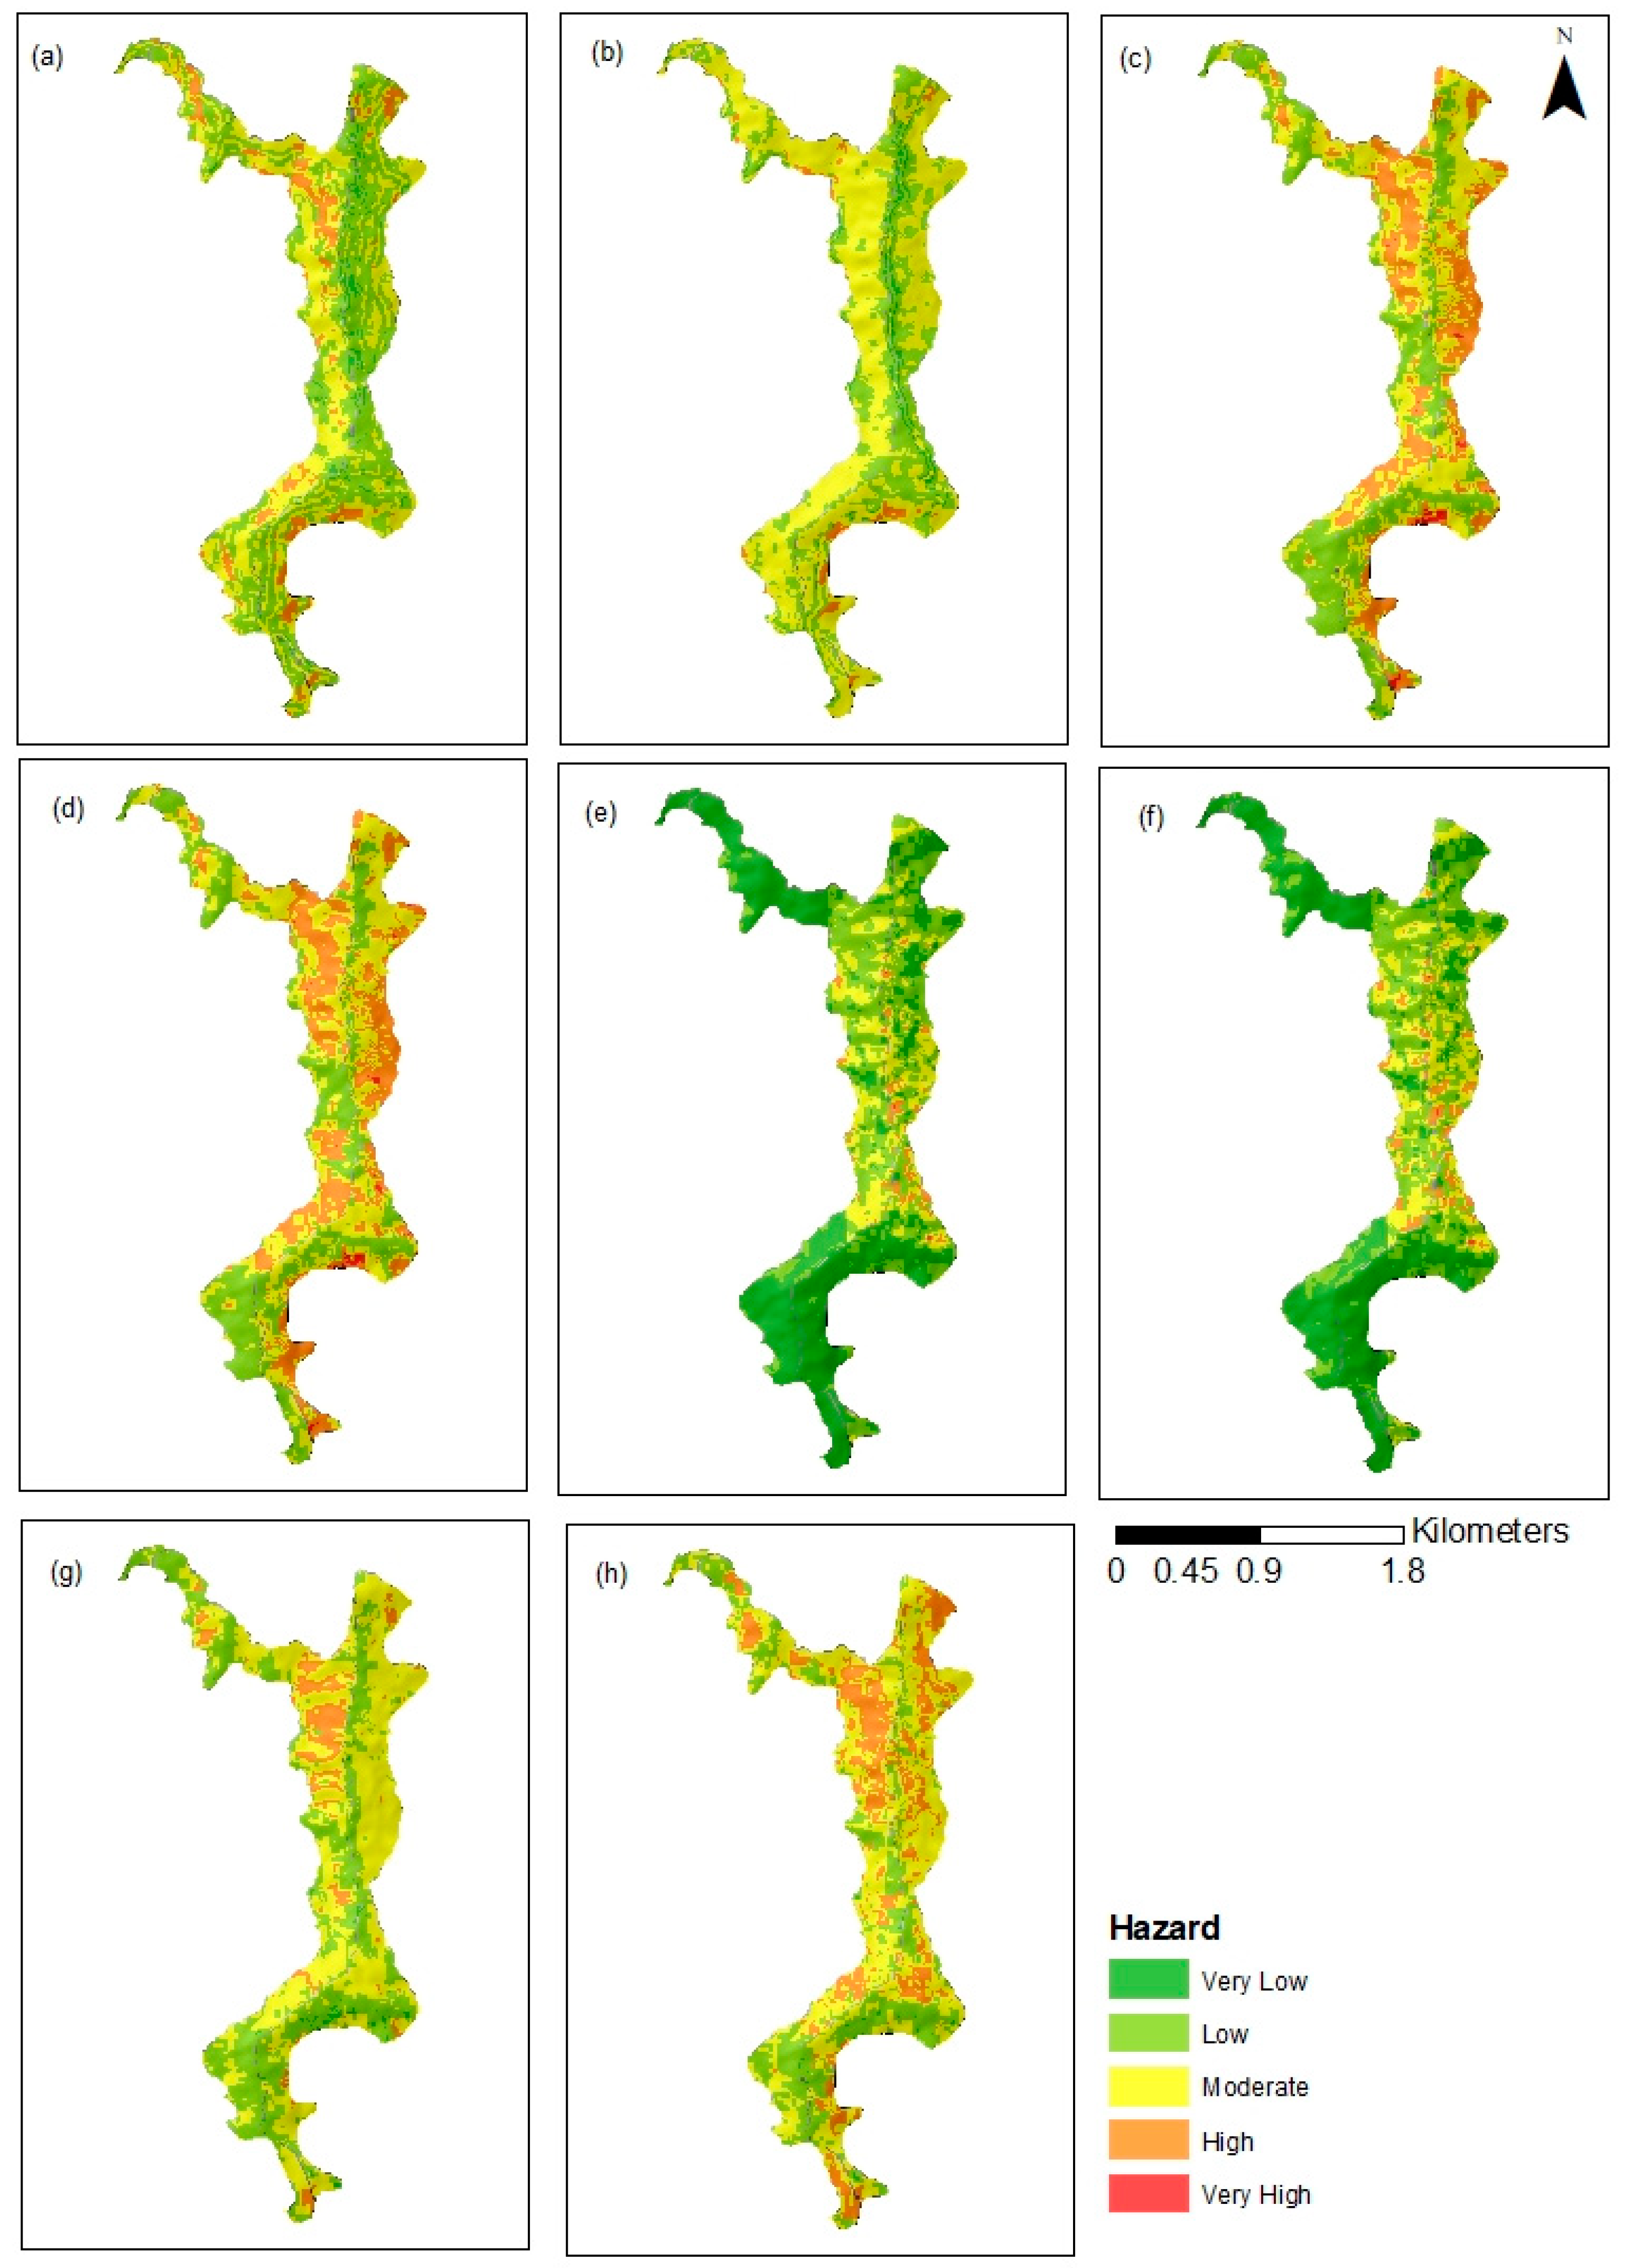
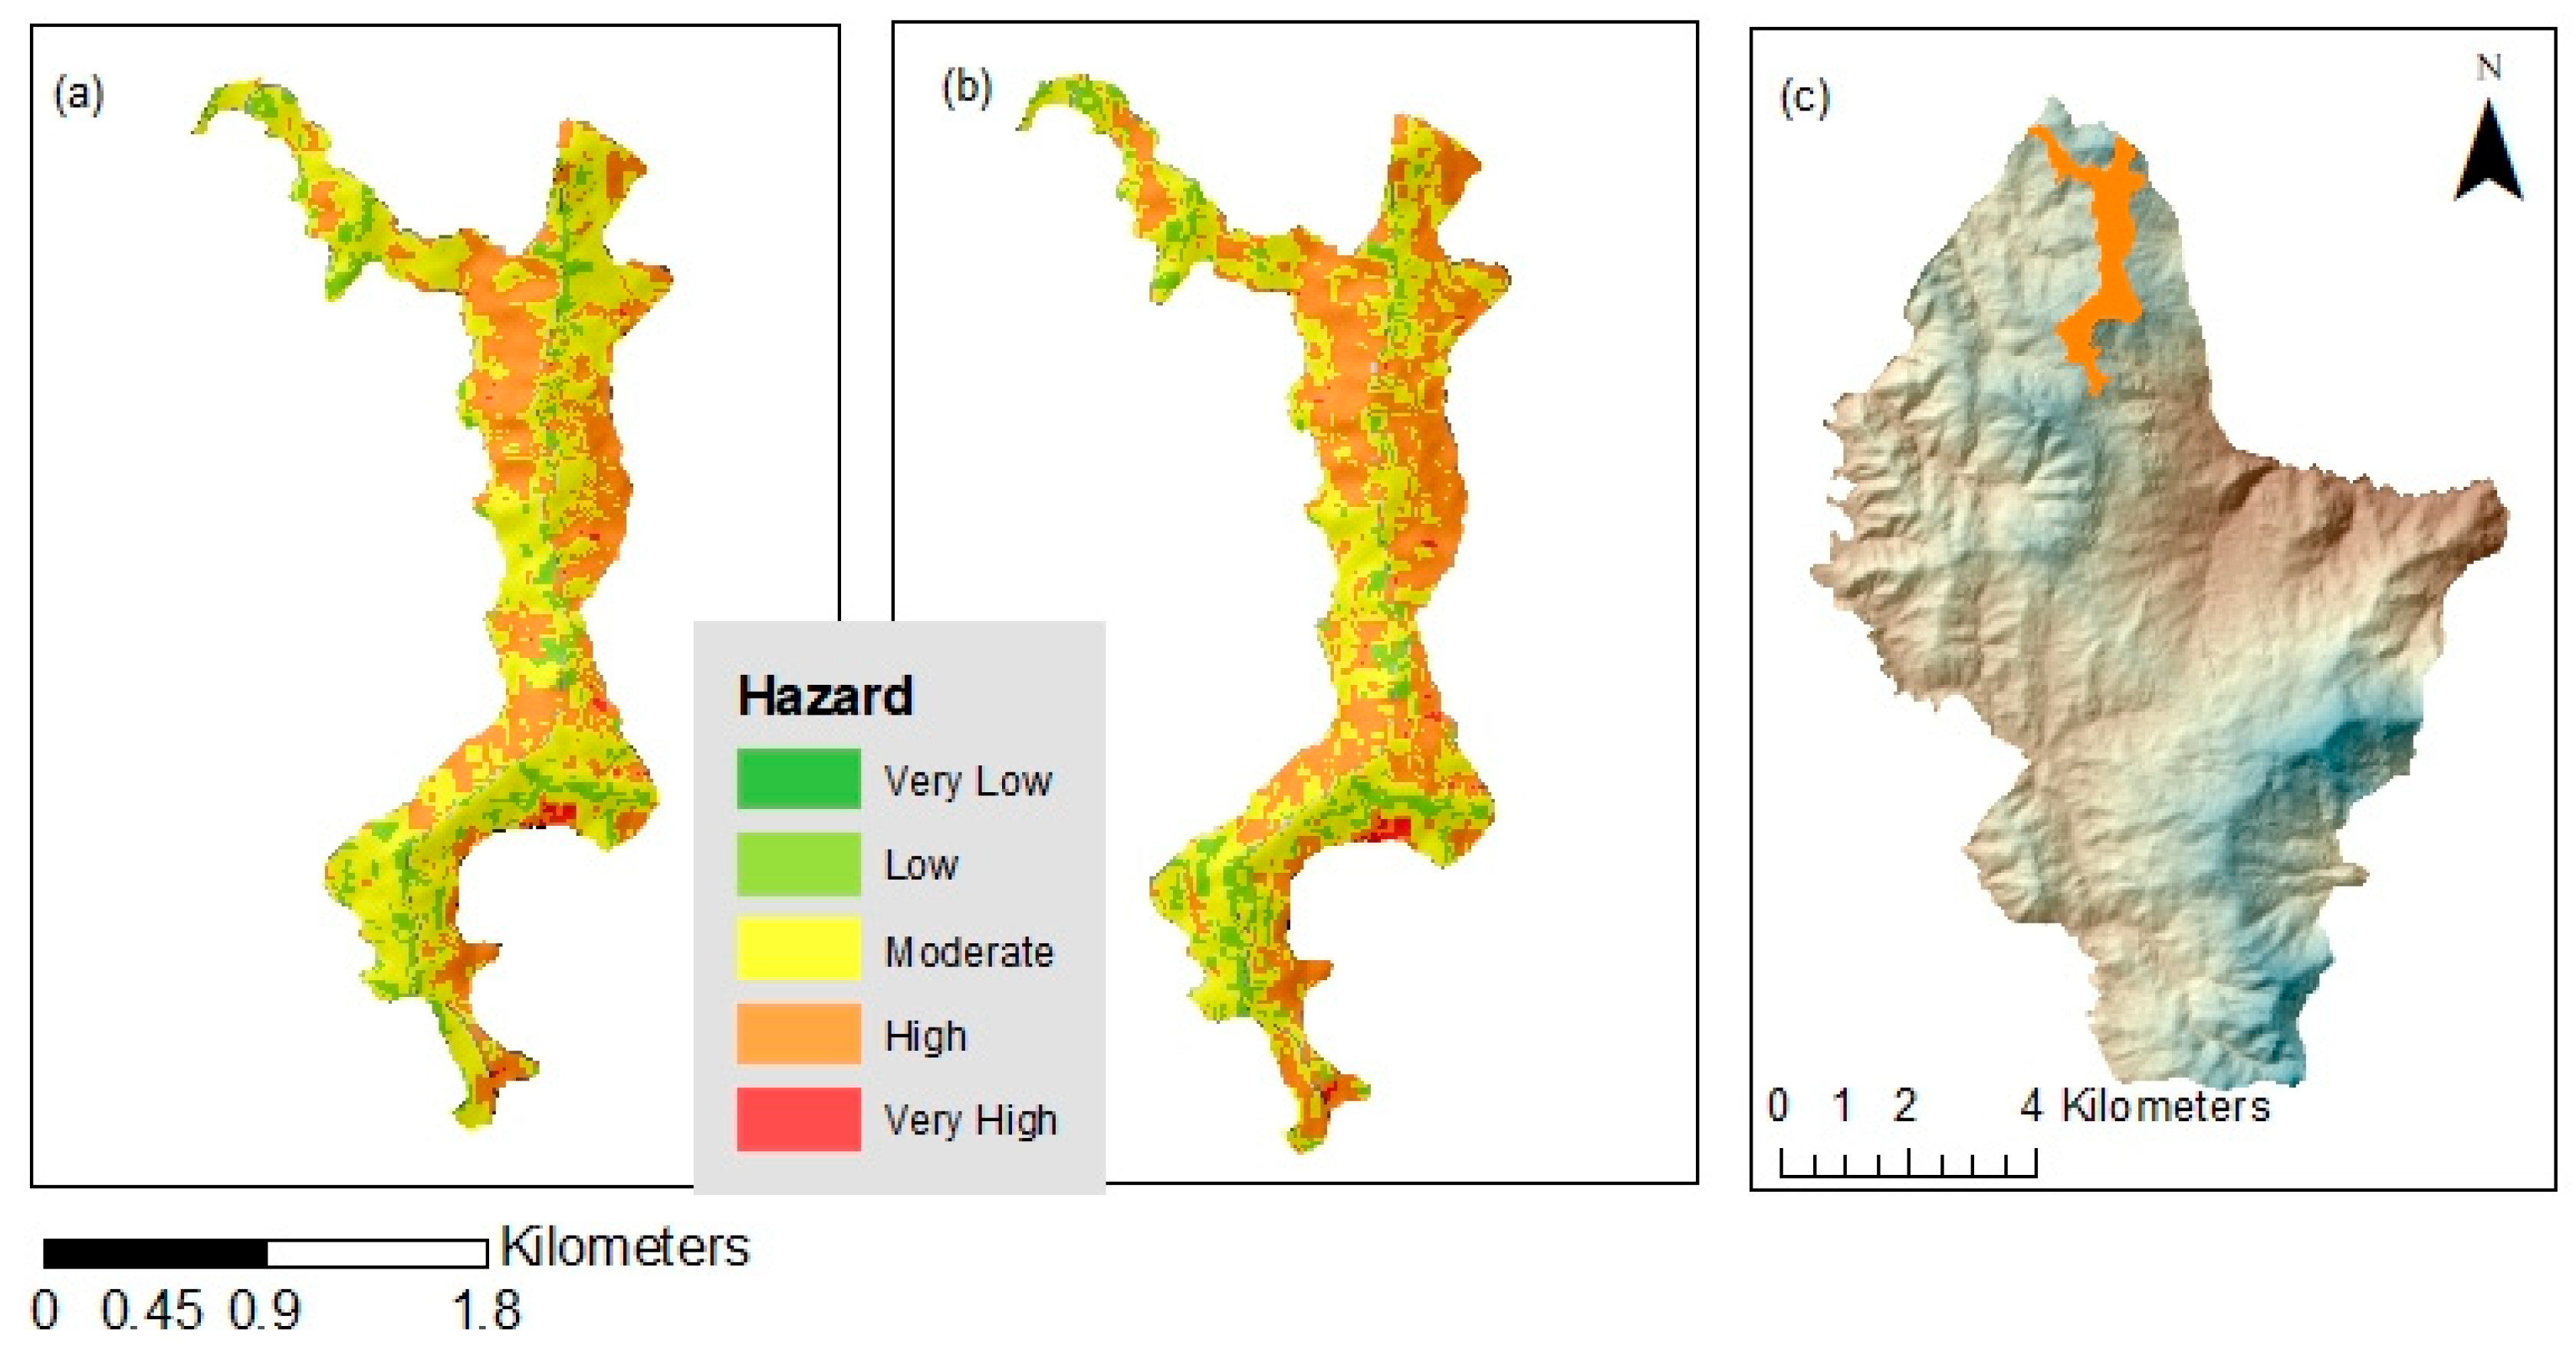
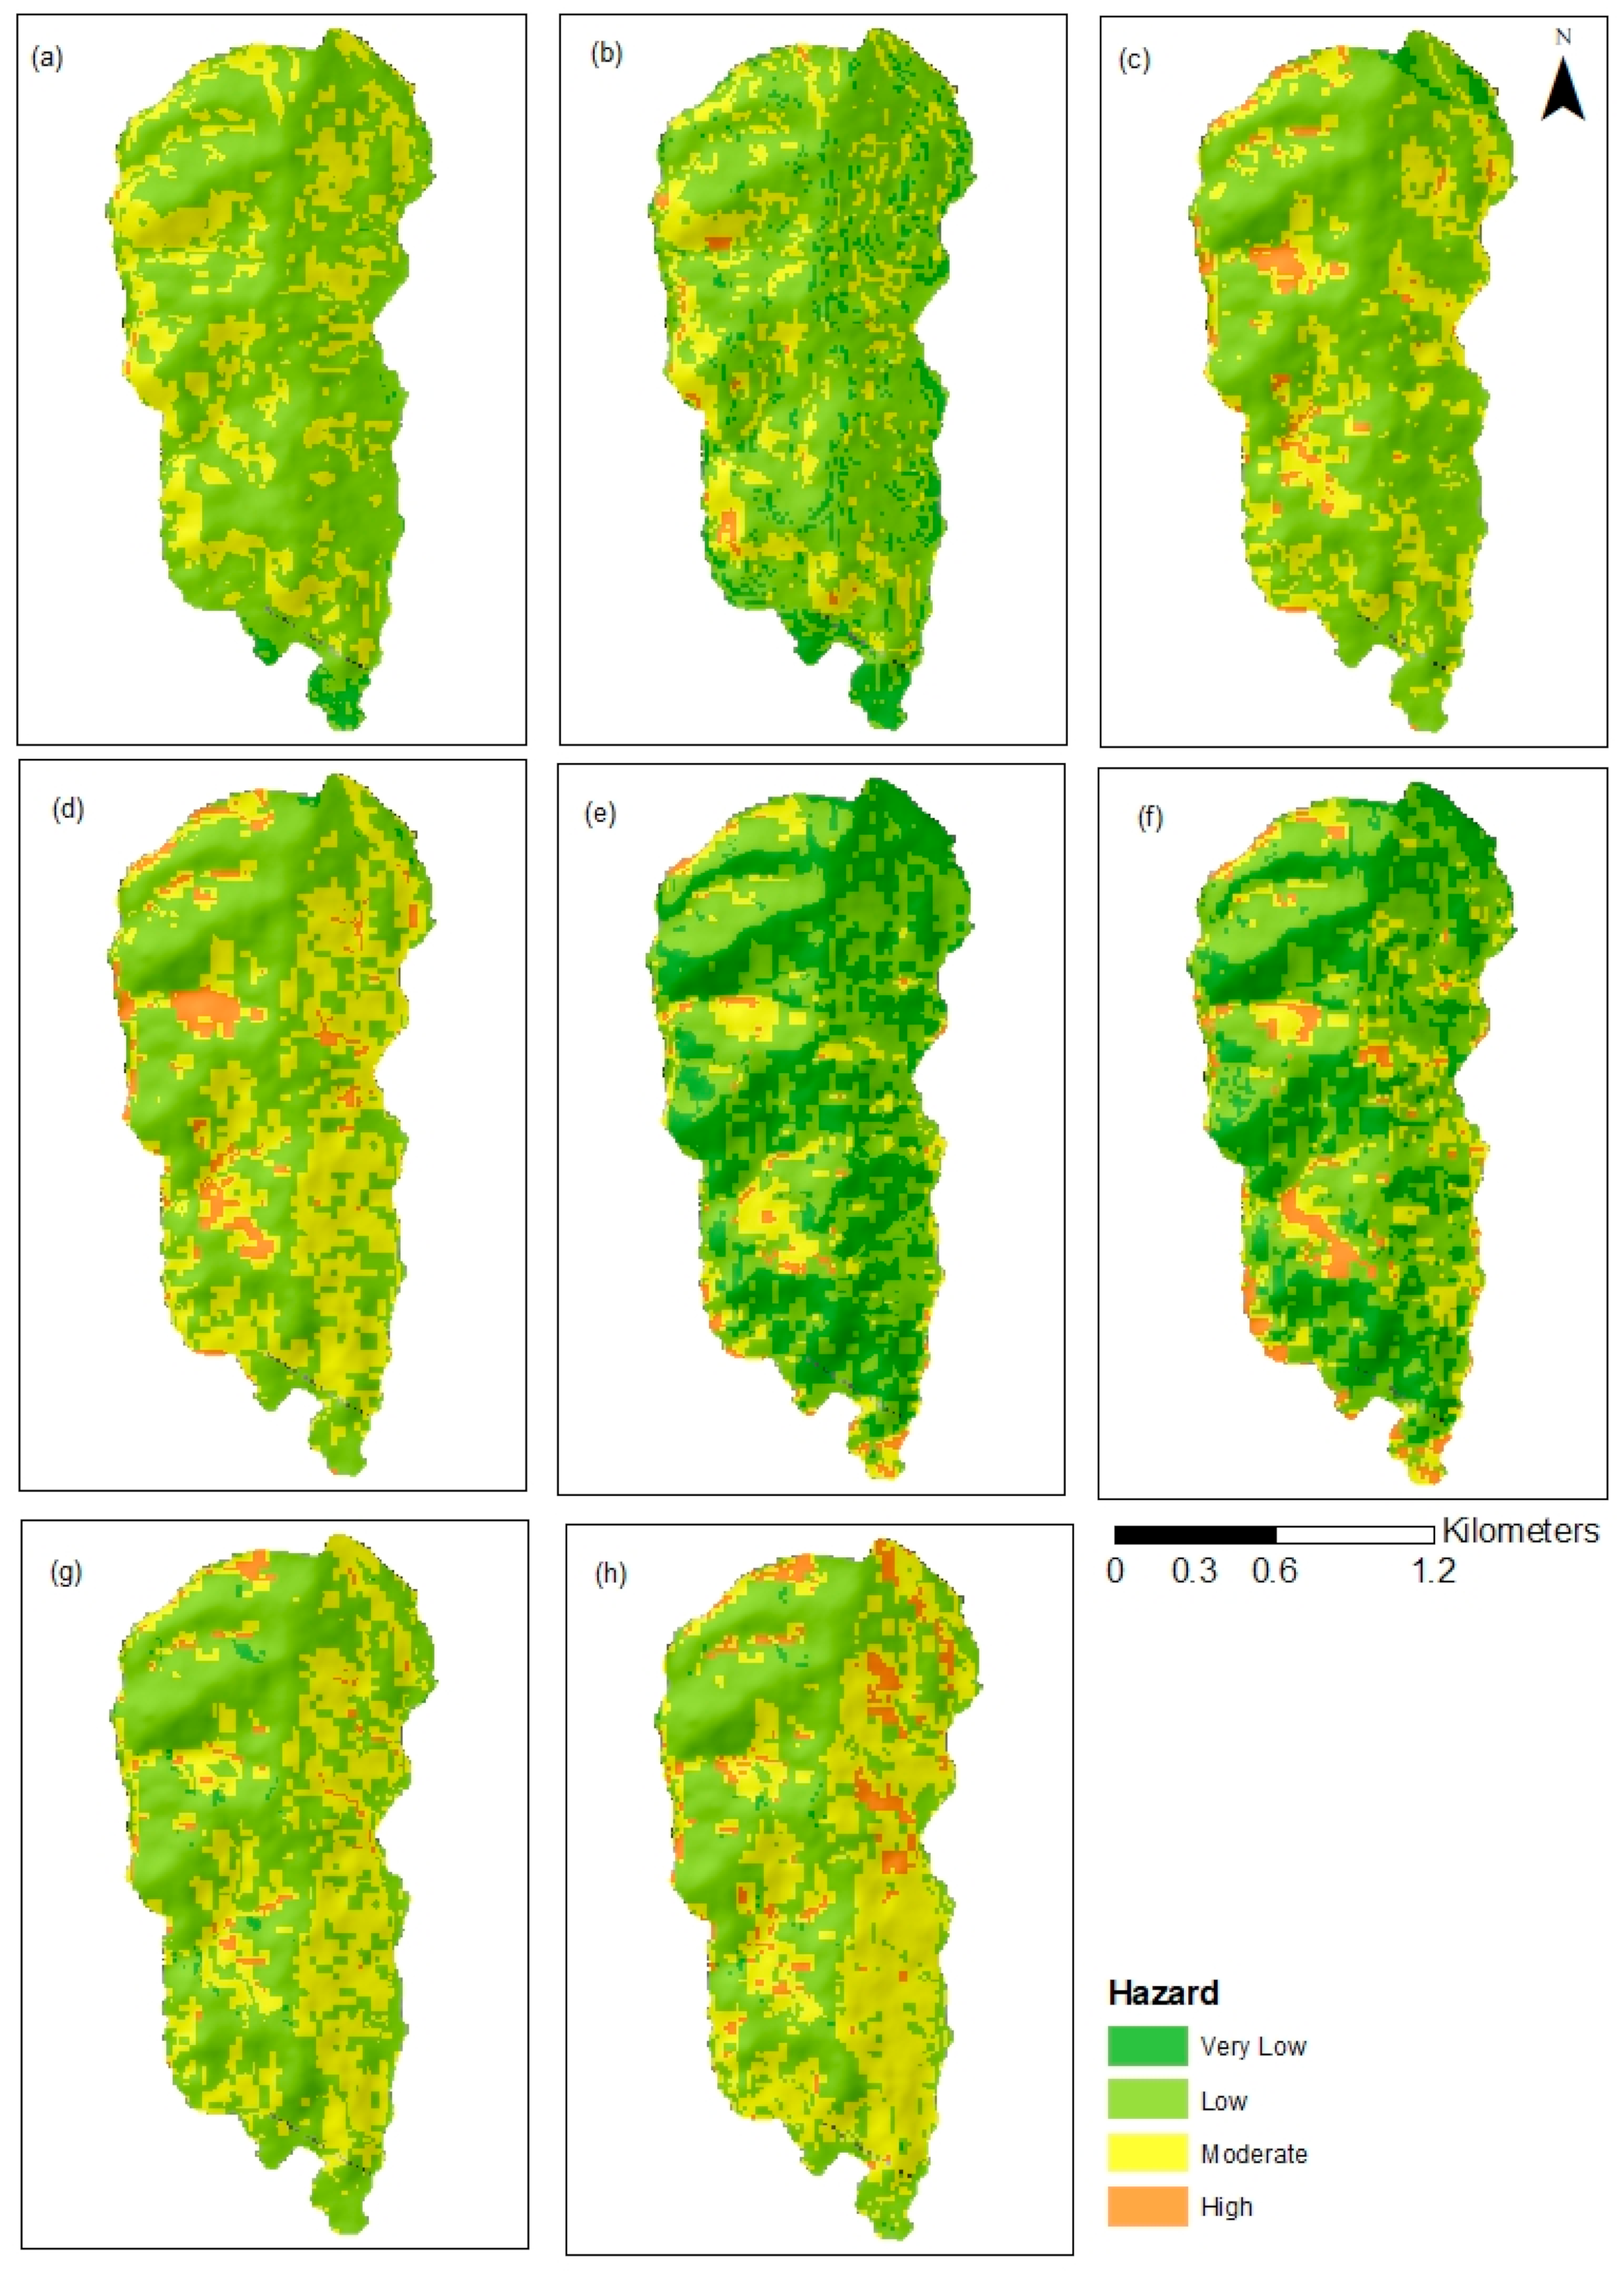
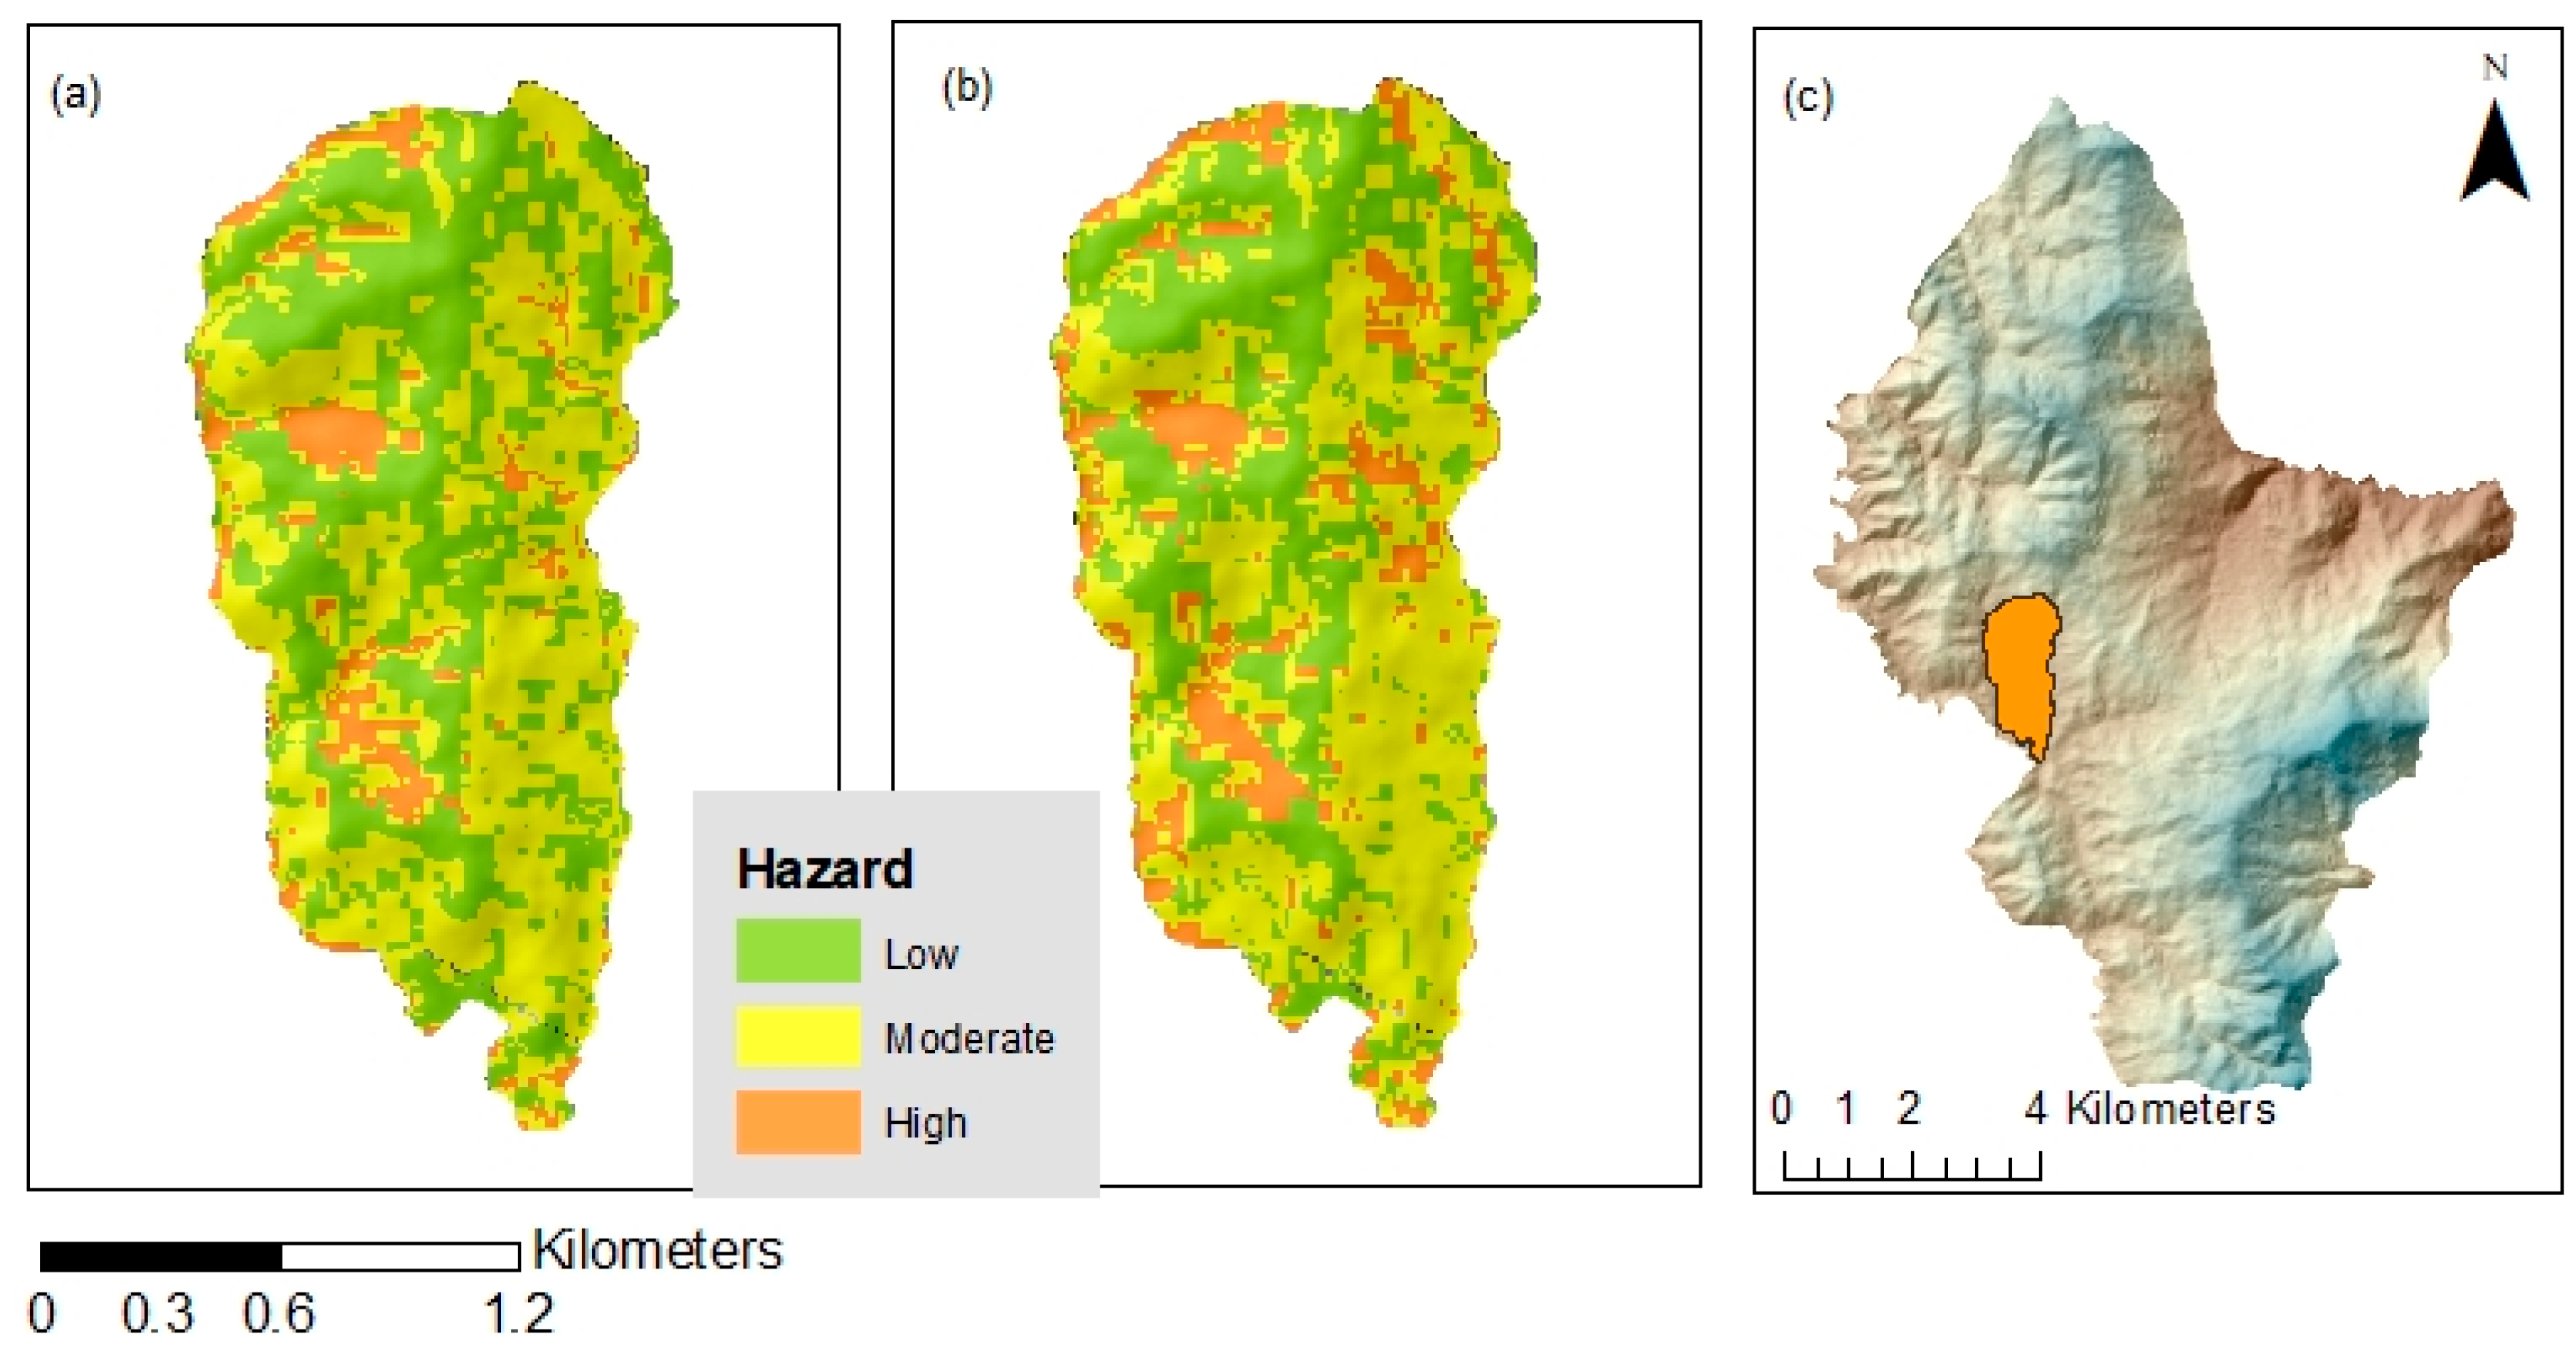
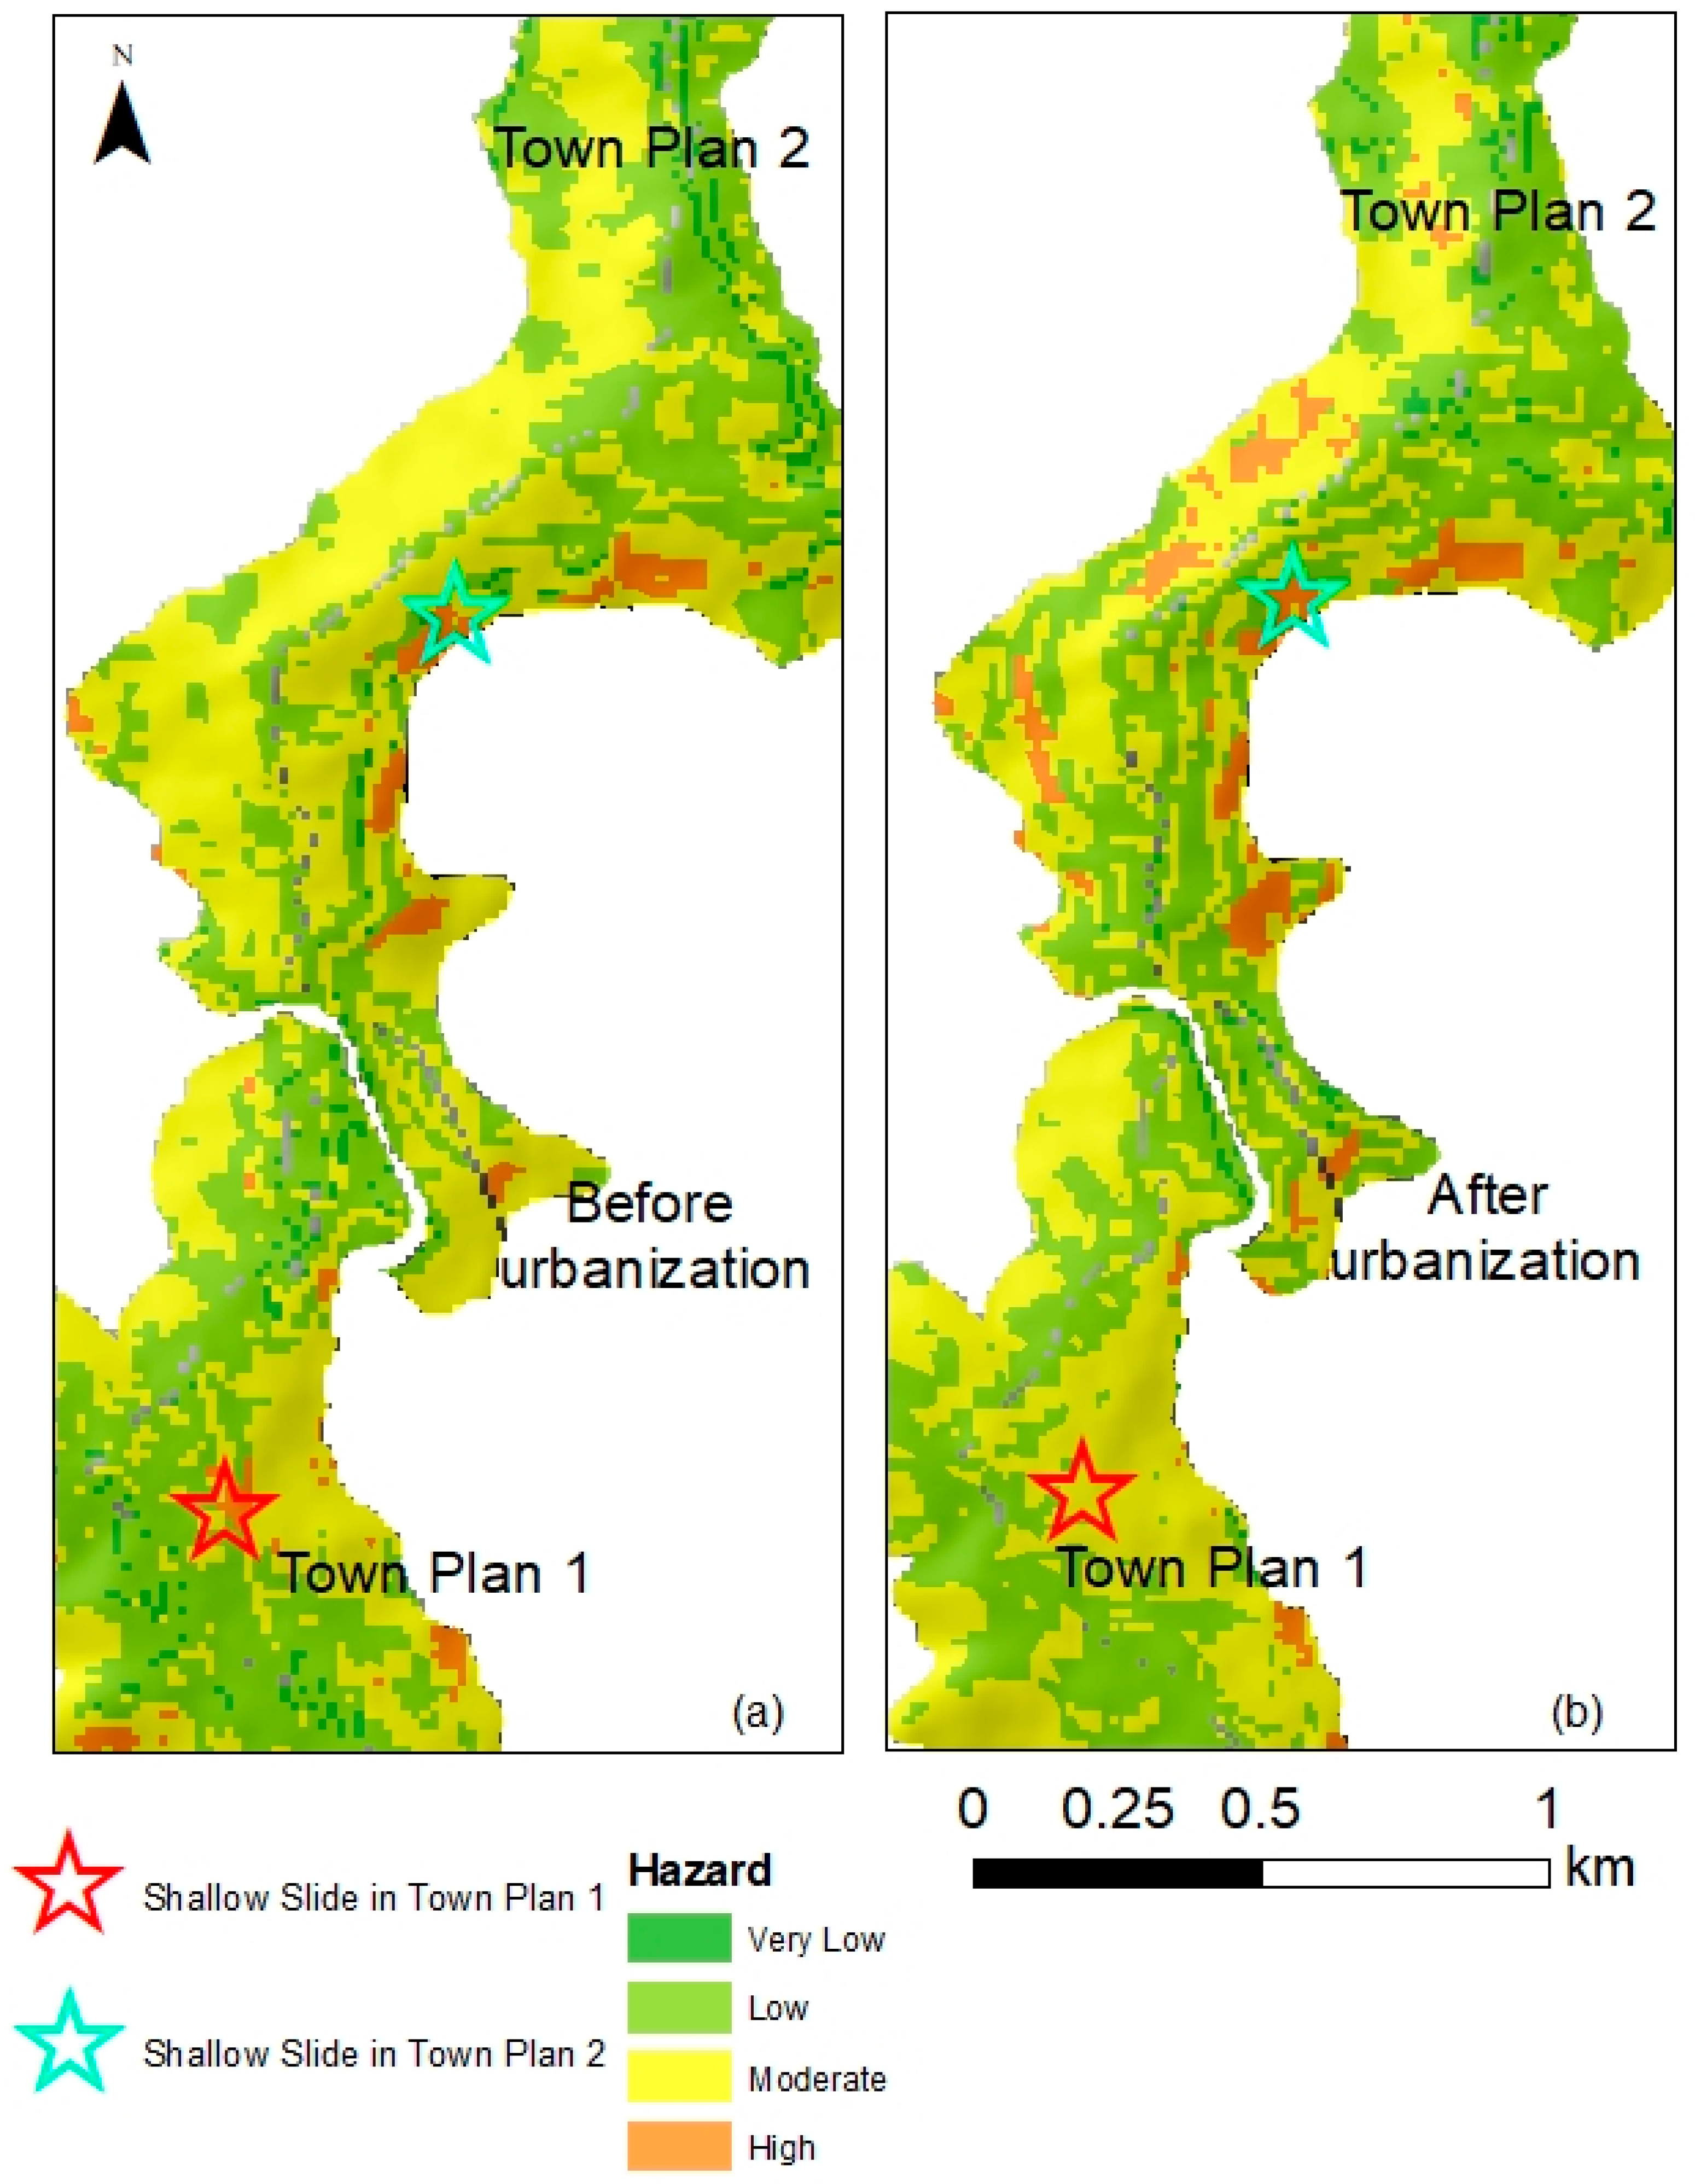
3.1. Landslide Susceptibility Pre-Urbanization
3.2. Landslide Susceptibility Post-Urbanization
3.3. Discussion
4. Conclusions
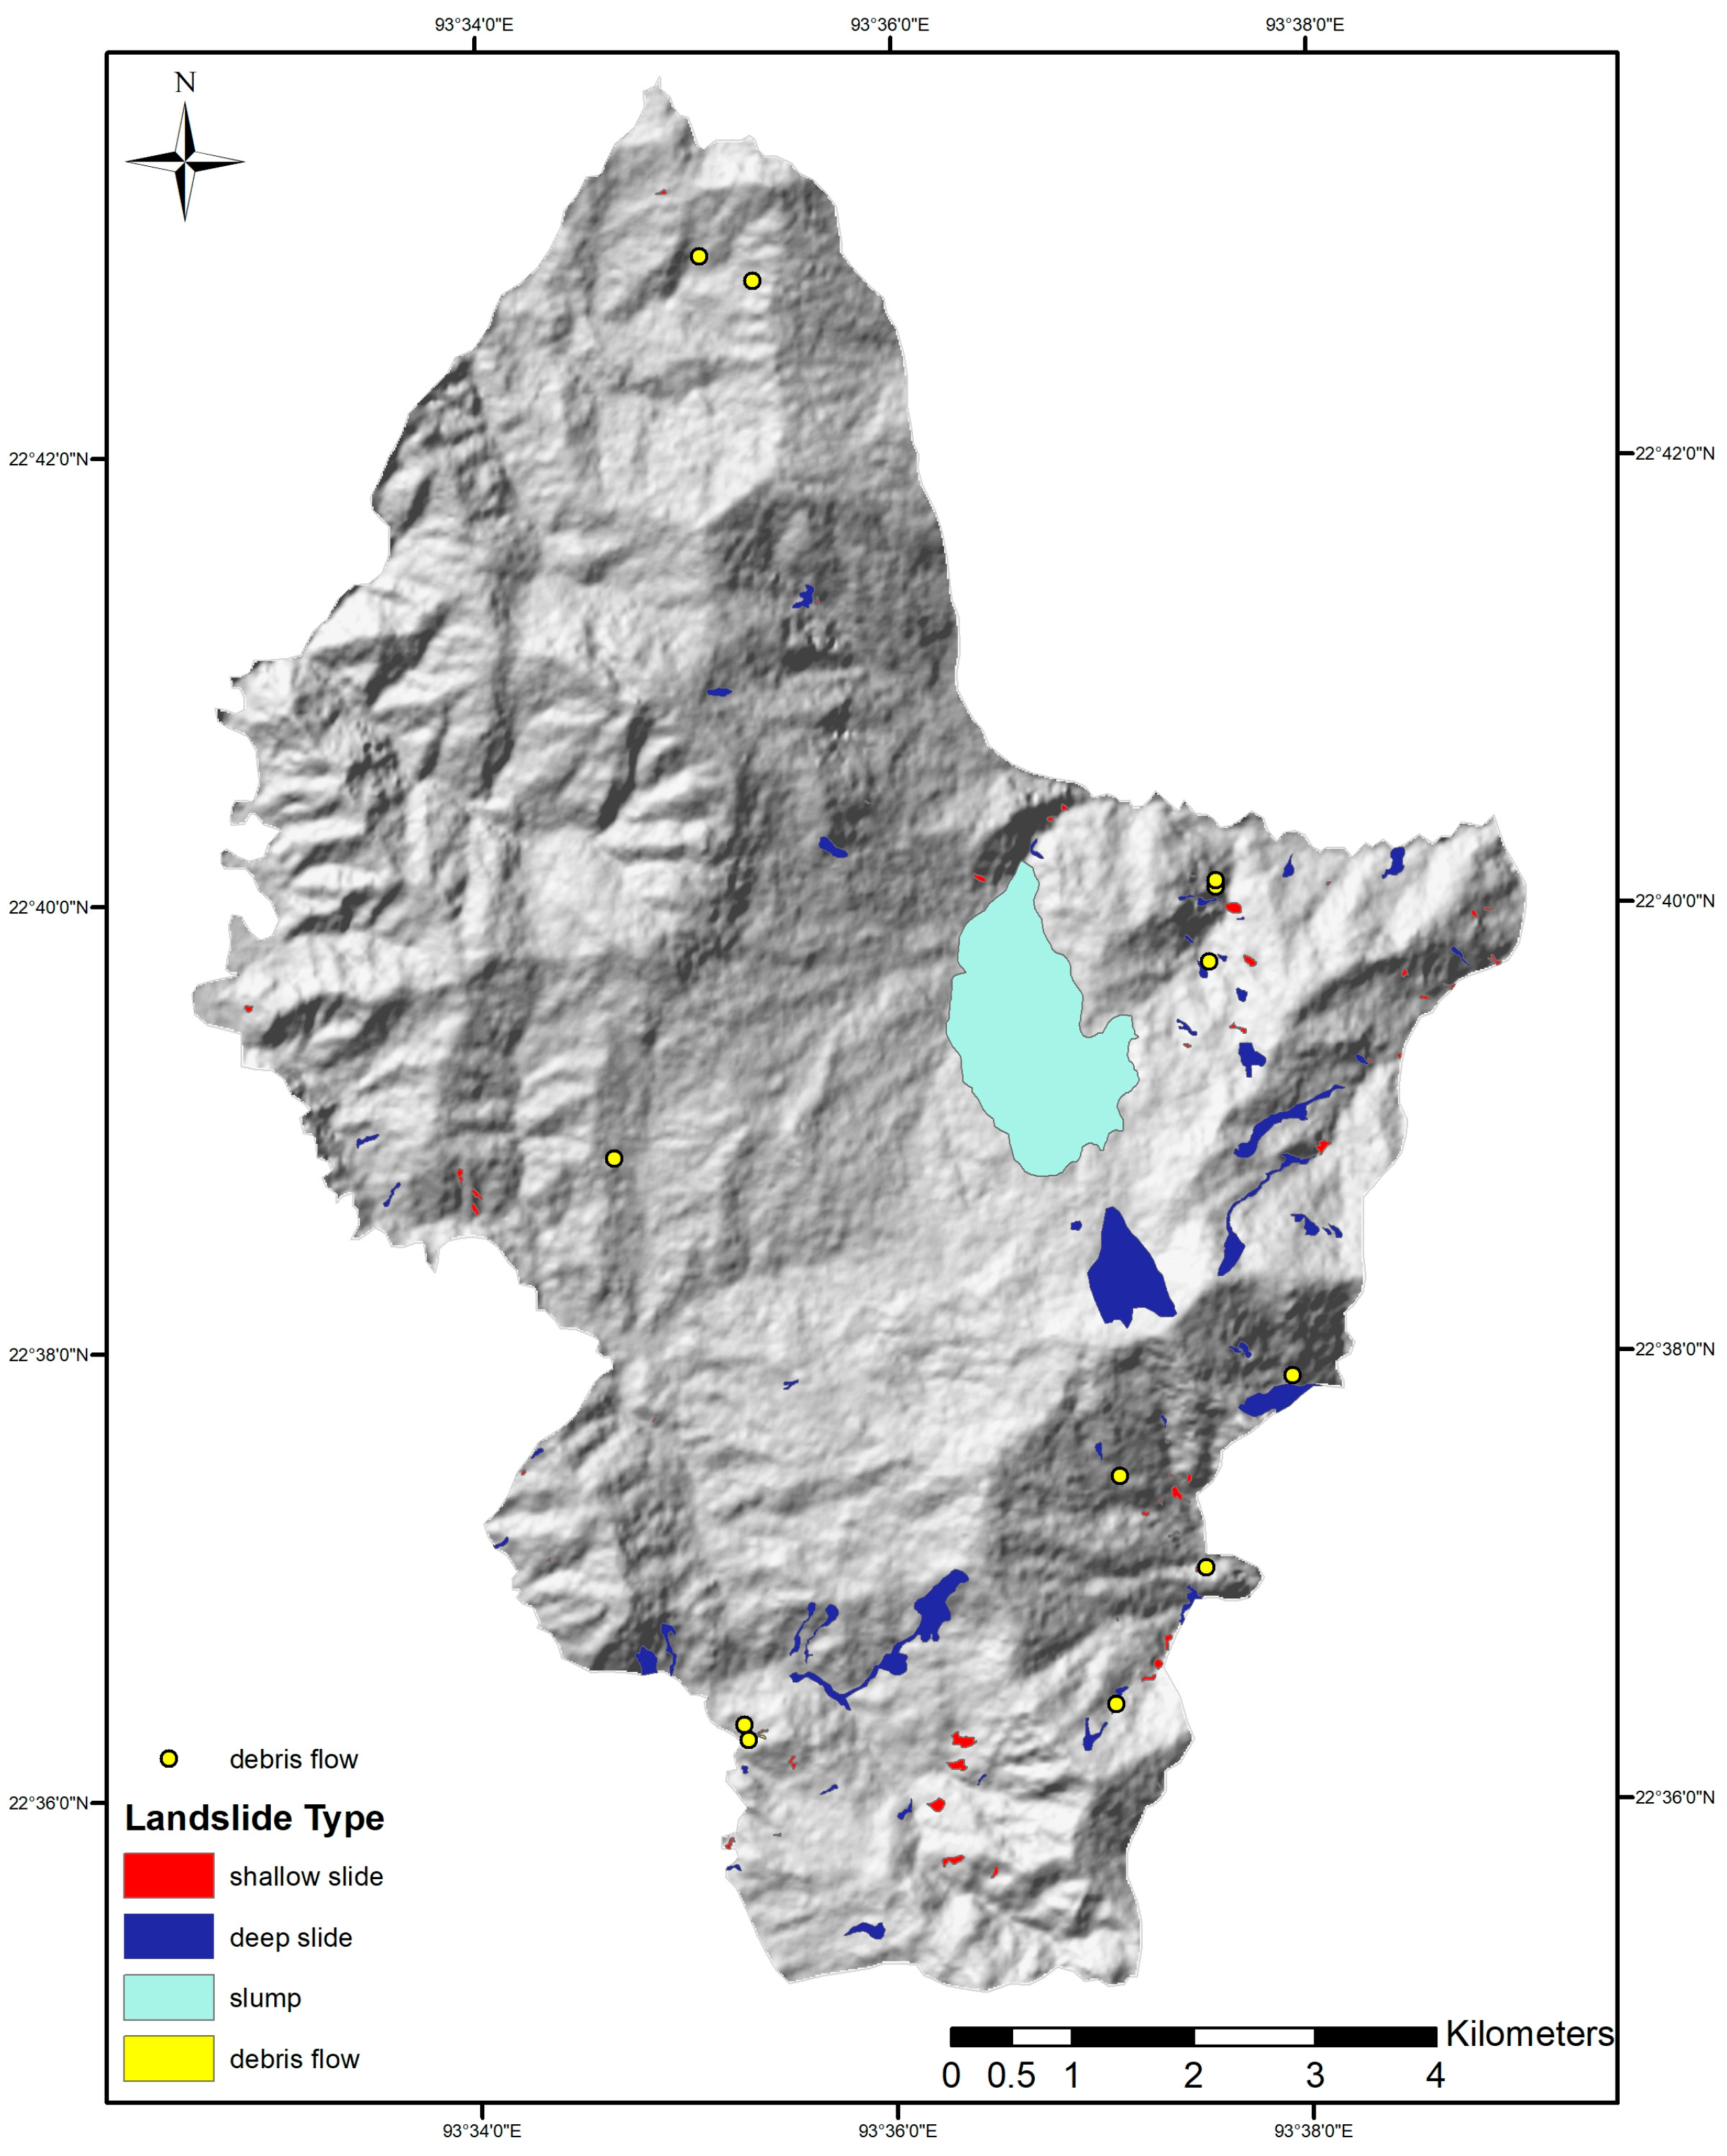
- Shallow slides were commonly observed as follows: on slopes between 20° and 50°, within 40 m from streams, at approximately a 50 m radius from natural springs, with a soil thickness of over 15 m, within urban and forest areas, and within 40 m from road cuts.
- Deep-seated slides were often induced by groundwater fluctuation and were abundantly observed as follows: in slope gradients of 30–40°, within 20 m from streams, within 100 m from natural springs, where colluvium soil more than 10 m deep is deposited, in forest areas, and within 40 m from road cuts.
- Slumps were commonly observed as follows: in slopes of less than 20°, within 100 m from natural springs, where colluvium soil of more than 10 m in depth is deposited, and in urban areas.
- Debris flows, caused by running water, were commonly observed as follows: within 20 m from streams, in forest lands or areas with dense vegetation, and within 40 m from an eroded slope.
Author Contributions
Funding
Institutional Review Board Statement
Data Availability Statement
Acknowledgments
Conflicts of Interest
Correction Statement
References
- Turner, A.K.; Schuster, R.L. Landslides: Investigation and Mitigation. Special Report 247; Transportation Research Board, National Academy Press: Washington, DC, USA, 1996; Volume 678, pp. 129–130. [Google Scholar]
- Ozdemir, A.; Altural, T. A comparative study of frequency ratio, weights of evidence and logistic regression methods for landslide susceptibility mapping: Sultan Mountains, SW Turkey. J. Asian. Earth Sci. 2013, 64, 180–197. [Google Scholar] [CrossRef]
- Xu, C.; Xu, X.; Dai, F.; Xiao, J.; Tan, X.; Yuan, R. Landslide hazard mapping using GIS and weight of evidence model in Qingshui river watershed of 2008 Wenchuan earthquake struck region. J. Earth Sci. 2012, 23, 97–120. [Google Scholar] [CrossRef]
- Terlien, M.T.J.; van Westen, C.J.; van Asch, T.W.J. Deterministic modelling in GIS-based landslide hazard assessment. In Advances in Natural and Technological Hazards Research; Springer: Berlin/Heidelberg, Germany, 1995; Volume 5, pp. 57–77. [Google Scholar] [CrossRef]
- Bender, F. Geology of Burma. In Beiträge zur Regionalen Geologie der Erde, Band 16; Bannert, D., Ed.; Gebrüder Borntraeger: Berlin, Germany, 1983; pp. 22–27. [Google Scholar]
- The Global New Light of Myanmar. Cyclone Komen Weakens, Heavy Rain Continue across Myanmar. Available online: https://reliefweb.int/report/myanmar/cyclone-komen-weakens-heavy-rainfall-continues-across-myanmar (accessed on 14 November 2018).
- UNICEF. Chin Situation Report; WASH Cluster Myanmar: Yangon, Myanmar, 2015. [Google Scholar]
- Chin Committee for Emergency Response and Rehabilitation (CCERR). The Chin State Floods & Landslides: A Community-Led Response and Assessment. Available online: http://themimu.info/sites/themimu.info/files/assessment_file_attachments/CCERRpublicationEng.pdf (accessed on 14 November 2018).
- National Natural Disaster Management Committee. Situation Report 2, Republic of the Union of Myanmar. 2015. Available online: https://reliefweb.int/report/myanmar/situation-report-no2-national-natural-disaster-management-committee-17-august-2015 (accessed on 2 May 2016). (Unpublished Report).
- Alaska Satellite Facility. About ALOS PALSAR. Available online: https://www.asf.alaska.edu/sar-data/palsar/terrain-corrected-rtc/ (accessed on 26 January 2016).
- Van Westen, C.; Alkema, D.; Damen, M.C.J.; Kerle, N.; Kingma, N.C. Multi-hazard Risk Assessment: Distance Education Course Guidebook; Version 2011; United Nation University–ITC School on Disaster Geo-information Management: Enschede, The Netherlands, 2011; pp. 3-67–3-74. [Google Scholar]
- Win, M.; Kyaw, H. Report on the Engineering Geology Aspects of Landslides and Road Subsidence in Hakha Township and Surrounding Areas, Chin State, Myanmar. Department of Geological Survey and Mineral Exploration (DGSME), Ministry of Mines, Republic of the Union of Myanmar, in Collaboration with the Myanmar Geosciences Society; MGS: Naypyidaw, Myanmar, 2015; (Unpublished report). [Google Scholar]
- USGS. Landsat Normalized Difference Vegetation Index. Available online: https://www.usgs.gov/landsat-missions/landsat-normalized-difference-vegetation-index (accessed on 18 April 2019).
- Xu, D.; Guo, X. Compare NDVI extracted from Landsat 8 imagery with that from Landsat 7 imagery. Am. J. Rem. Sens. 2014, 2, 10–14. [Google Scholar] [CrossRef] [Green Version]
- Ke, Y.; Im, J.; Lee, J.; Gong, H.; Ryu, Y. Characteristics of Landsat 8 OLI-derived NDVI by comparison with multiple satellite sensors and in-situ observations. Remote Sens. Environ. 2015, 164, 298–313. [Google Scholar] [CrossRef]
- Yuan, F.; Wang, C.; Mitchell, M. Spatial patterns of land surface phenology relative to monthly climate variations: US Great Plains. GIScience Remote Sens. 2014, 51, 30–50. [Google Scholar] [CrossRef]
- Yin, K.L. Statistical prediction model for slope instability of metamorphosed rocks. In Proceedings of the 5th International Symposium on Landslides; Bonnard, C., Ed.; Balkema: Rotterdam, The Netherlands, 1988; Volume 2, pp. 1269–1272. [Google Scholar]
- Kanungo, D.P.; Arora, M.K.; Sarkar, S.; Gupta, R.P. Landslide Susceptibility Zonation (LSZ) Mapping–A Review. J. South Asia Disaster Stud. 2012, 2, 81–105. [Google Scholar]
- Sarkar, S.; Kanungo, D.P.; Patra, A.K.; Kumar, P. GIS Based Landslide Susceptibility Mapping–A Case Study in Indian Himalaya. Disaster Mitig. Debris Flows Slope Fail. Landslides 2012, 617–624. [Google Scholar]
- Chen, W.; Li, W.; Hou, E.; Zhao, Z.; Deng, N.; Bai, H.; Wang, D. Landslide susceptibility mapping based on GIS and information value model for the Chencang District of Baoji, China. Arab. J. Geosci. 2014, 7, 4499–4511. [Google Scholar] [CrossRef]
- Zhu, C.; Wang, X. Landslide susceptibility mapping: A comparison of information and weights-of-evidence methods in Three Gorges Area. In 2009 International Conference on Environmental Science and Information Application Technology; IEEE: Piscataway, NJ, USA, 2009; Volume 3, pp. 342–346. [Google Scholar]
- Ba, Q.; Chen, Y.; Deng, S.; Wu, Q.; Yang, J.; Zhang, J. An improved information value model based on gray clustering for landslide susceptibility mapping. Int. J. Geo-Inf. 2017, 6, 18. [Google Scholar] [CrossRef]
- Corominas, J.; van Westen, C.; Frattini, P.; Cascini, L.; Malet, J.P.; Fotopoulou, S.; Catani, F.; Van Den Eeckhaut, M.; Mavrouli, O.; Agliardi, F.; et al. Recommendations for the quantitative analysis of landslide risk. Bull. Eng. Geol. Environ. 2014, 73, 209–263. [Google Scholar] [CrossRef] [Green Version]
- TIBCO. Data Science Team User’s Guide. Available online: https://docs.tibco.com/pub/sfire-dsc/6.5.0/doc/html/TIB_sfire-dsc_user-guide/GUID-07A78308-525A-406F-8221-9281F4E9D7CF.html (accessed on 16 December 2018).
- Varnes, D.J. Slope Movement Types and Processes: Special Report, 176; Transportation Research Board, US National Research Council: New York, NY, USA, 1978; pp. 11–33. [Google Scholar]
- Highland, L.; Bobrowsky, P.T. The Landslide Handbook: A Guide to Understanding Landslides; Geological Survey: Reston, VA, USA, 2008; pp. 10–30. [Google Scholar]
- Australian Geomechanics Society. The Australian GeoGuides for Slope Management and Maintenance. J. News Aust. Geomech. Soc. 2007, 42, 168–169. [Google Scholar]
- Fabbri, A.G.; Chung, C.F.; Napolitano, P.; Remondo, J.; Zêzere, J.L. Prediction rate functions of landslide susceptibility applied in the Iberian Peninsula. WIT Trans. Model. Simul. 2002, 31, 703–718. [Google Scholar]
- Cruden, D.M.; Varnes, D.J. Landslide Types and Processes, Special Report 247; Transportation Research Board, National Academy of Sciences: New York, NY, USA, 1993; pp. 36–75. [Google Scholar]
- Kim, M.S.; Onda, Y.; Uchida, T.; Kim, J.K. Effects of soil depth and subsurface flow along the subsurface topography on shallow landslide predictions at the site of a small granitic hillslope. Geomorphology 2016, 271, 40–54. [Google Scholar] [CrossRef]
- Swanston, D.N.; Lienkaemper, G.W.; Mersereau, R.C.; Levno, A.B. Timber harvest and progressive deformation of slopes in southwestern Oregon. Bull. Assoc. Eng. Geol. 1988, 25, 71–381. [Google Scholar]
- Forbes, K.; Broadhead, J.; Brardinoni, A.D.; Gray, D.; Stokes, B.V. Forests and landslides: The role of trees and forests in the prevention of landslides and rehabilitation of landslide-affected areas in Asia Second edition. Rap. Publ. 2013, 2, 1–61. [Google Scholar]
- Hales, T.C. Modelling biome-scale root reinforcement and slope stability. Earth Surf. Process. Landf. 2018, 43, 2157–2166. [Google Scholar] [CrossRef] [Green Version]
- Cohen, D.; Schwarz, M. Tree-root control of shallow landslides. Earth Surf. Dyn. 2017, 5, 451–477. [Google Scholar] [CrossRef] [Green Version]
- Vergani, C.; Giadrossich, F.; Buckley, P.; Conedera, M.; Pividori, M.; Salbitano, F.; Rauch, H.S.; Lovreglio, R.; Schwarz, M. Root reinforcement dynamics of European coppice woodlands and their effect on shallow landslides: A review. Earth-Sci. Rev. 2017, 167, 88–102. [Google Scholar] [CrossRef]
- Riechard, J.S. Environmental Geology: Mass Wasting and Related Phenomena; The McGraw Hill Companies: New York, NY, USA, 2011; pp. 194–221. [Google Scholar]


| No. | Parameter Map | Sources |
|---|---|---|
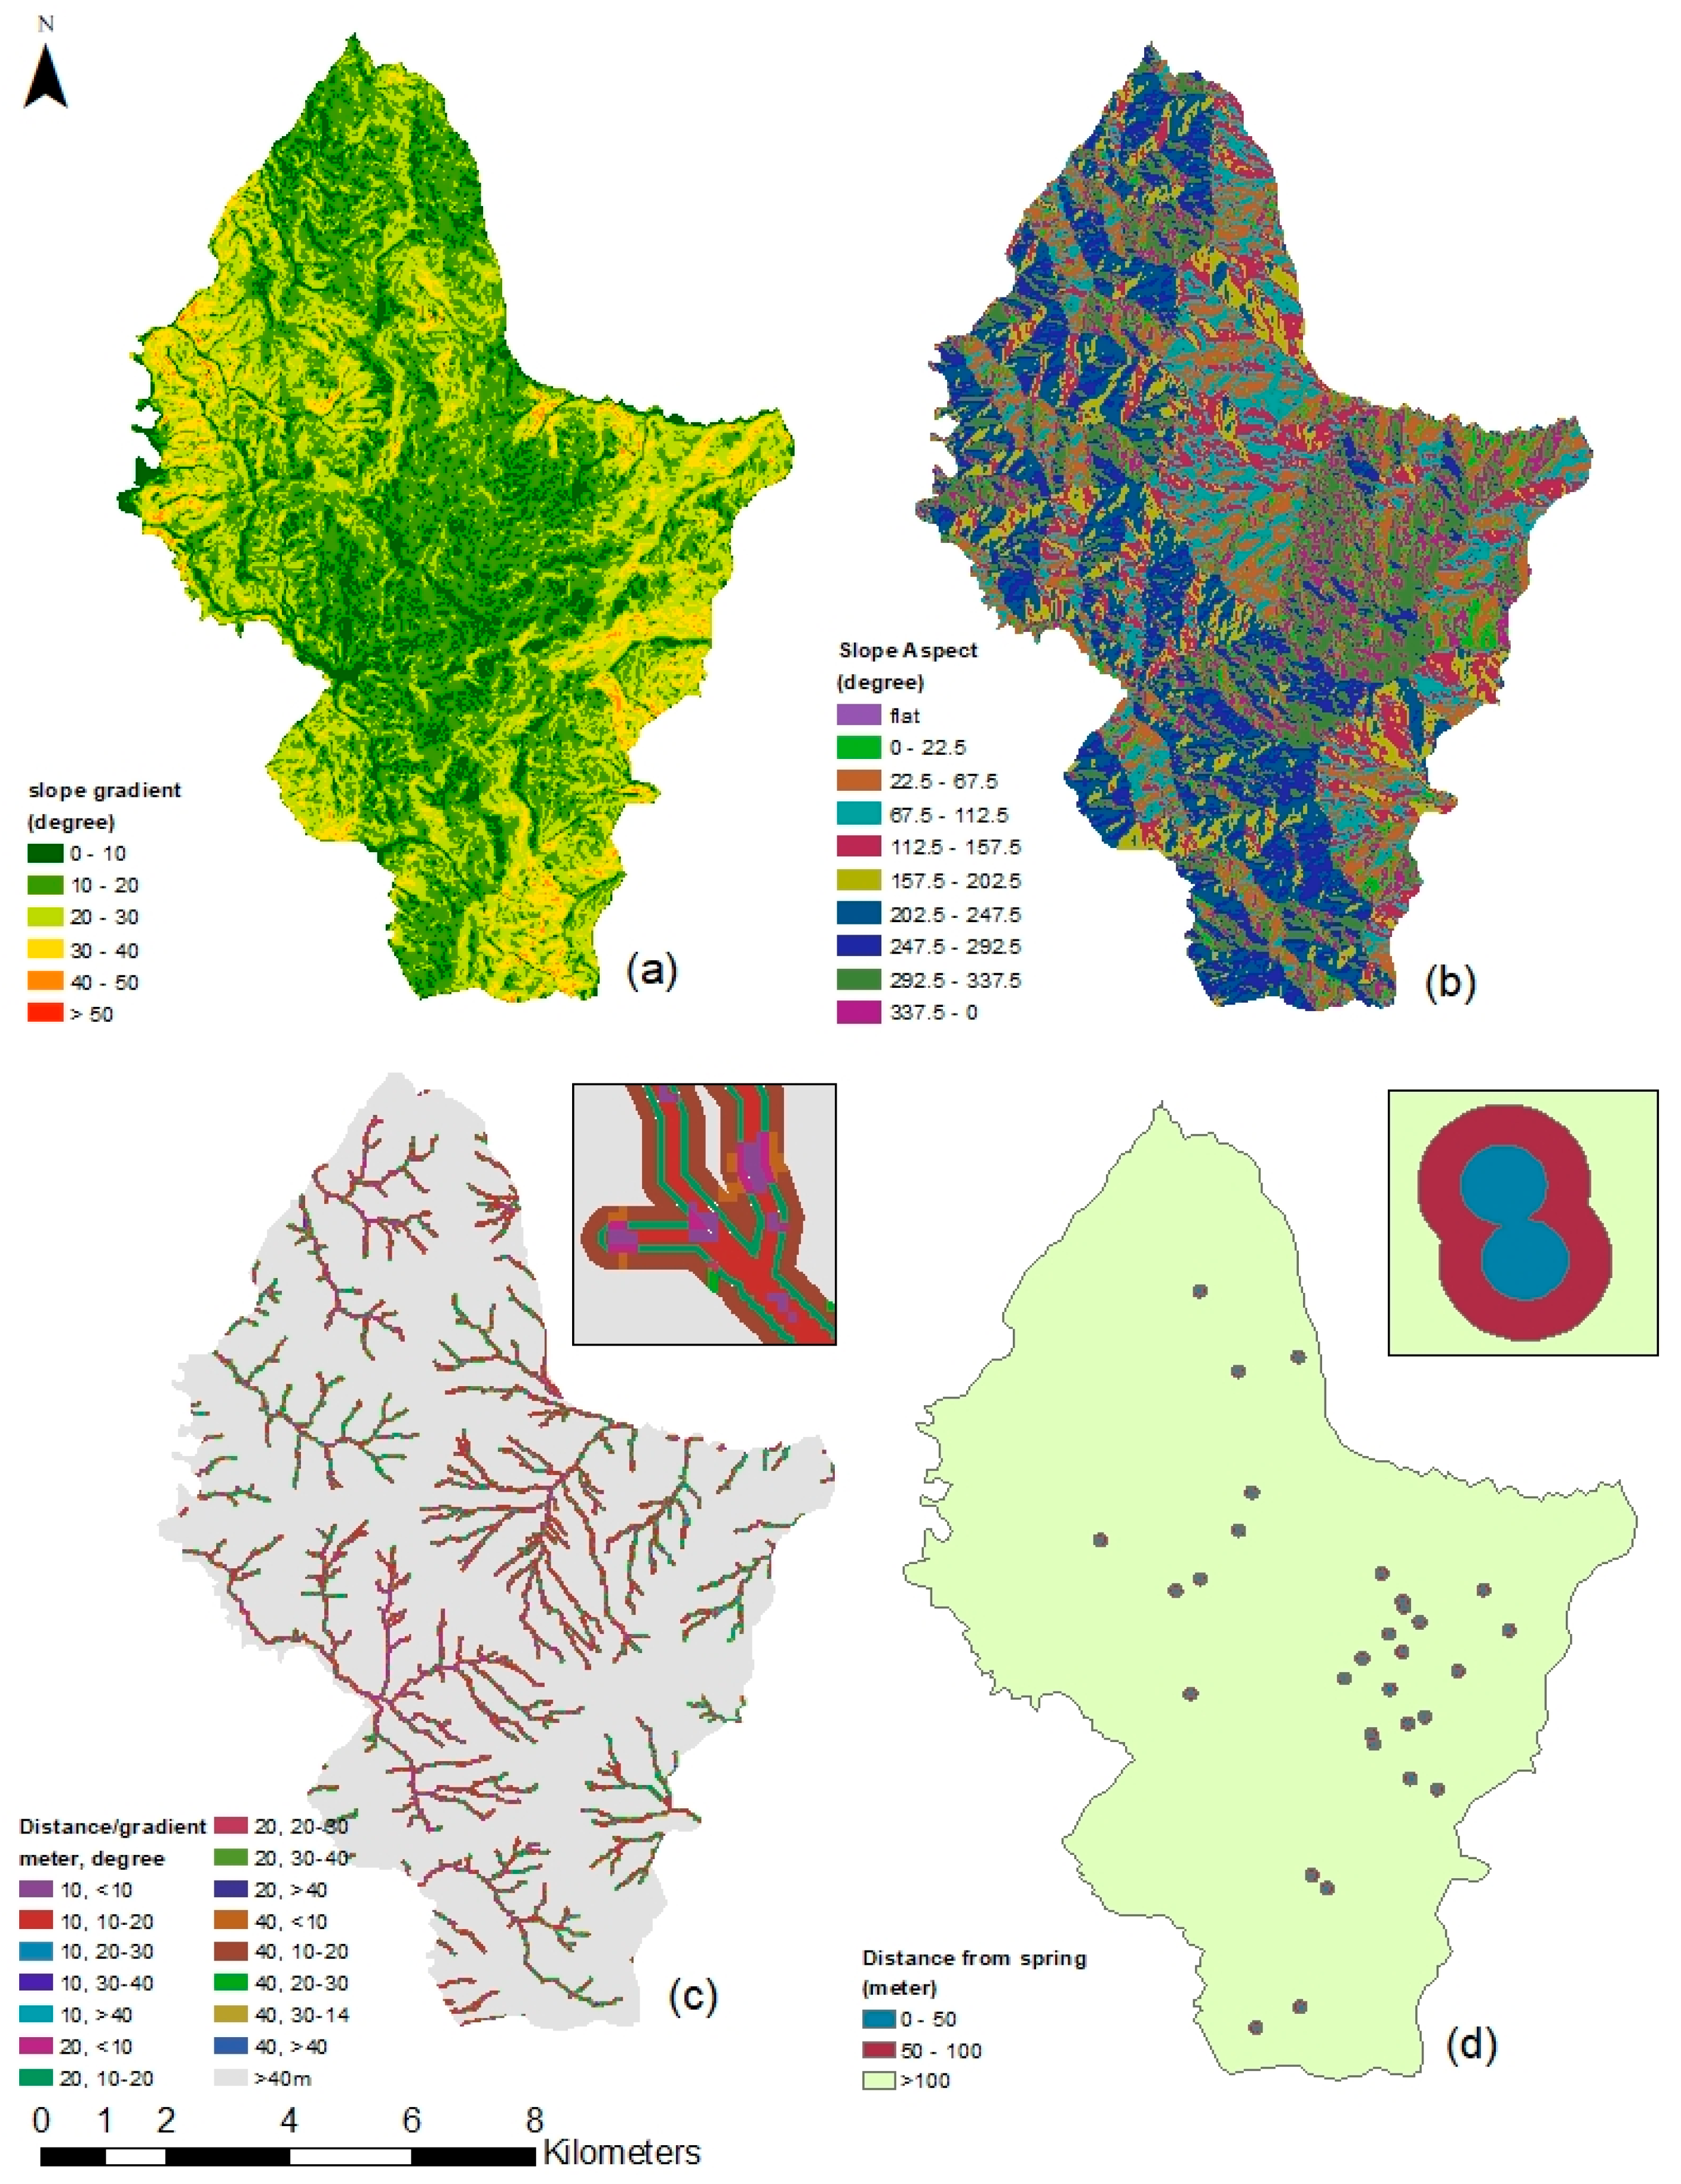
| 1. | Slope gradient | ALOS PALSAR DEM |
| 2. | Slope direction | ALOS PALSAR DEM |
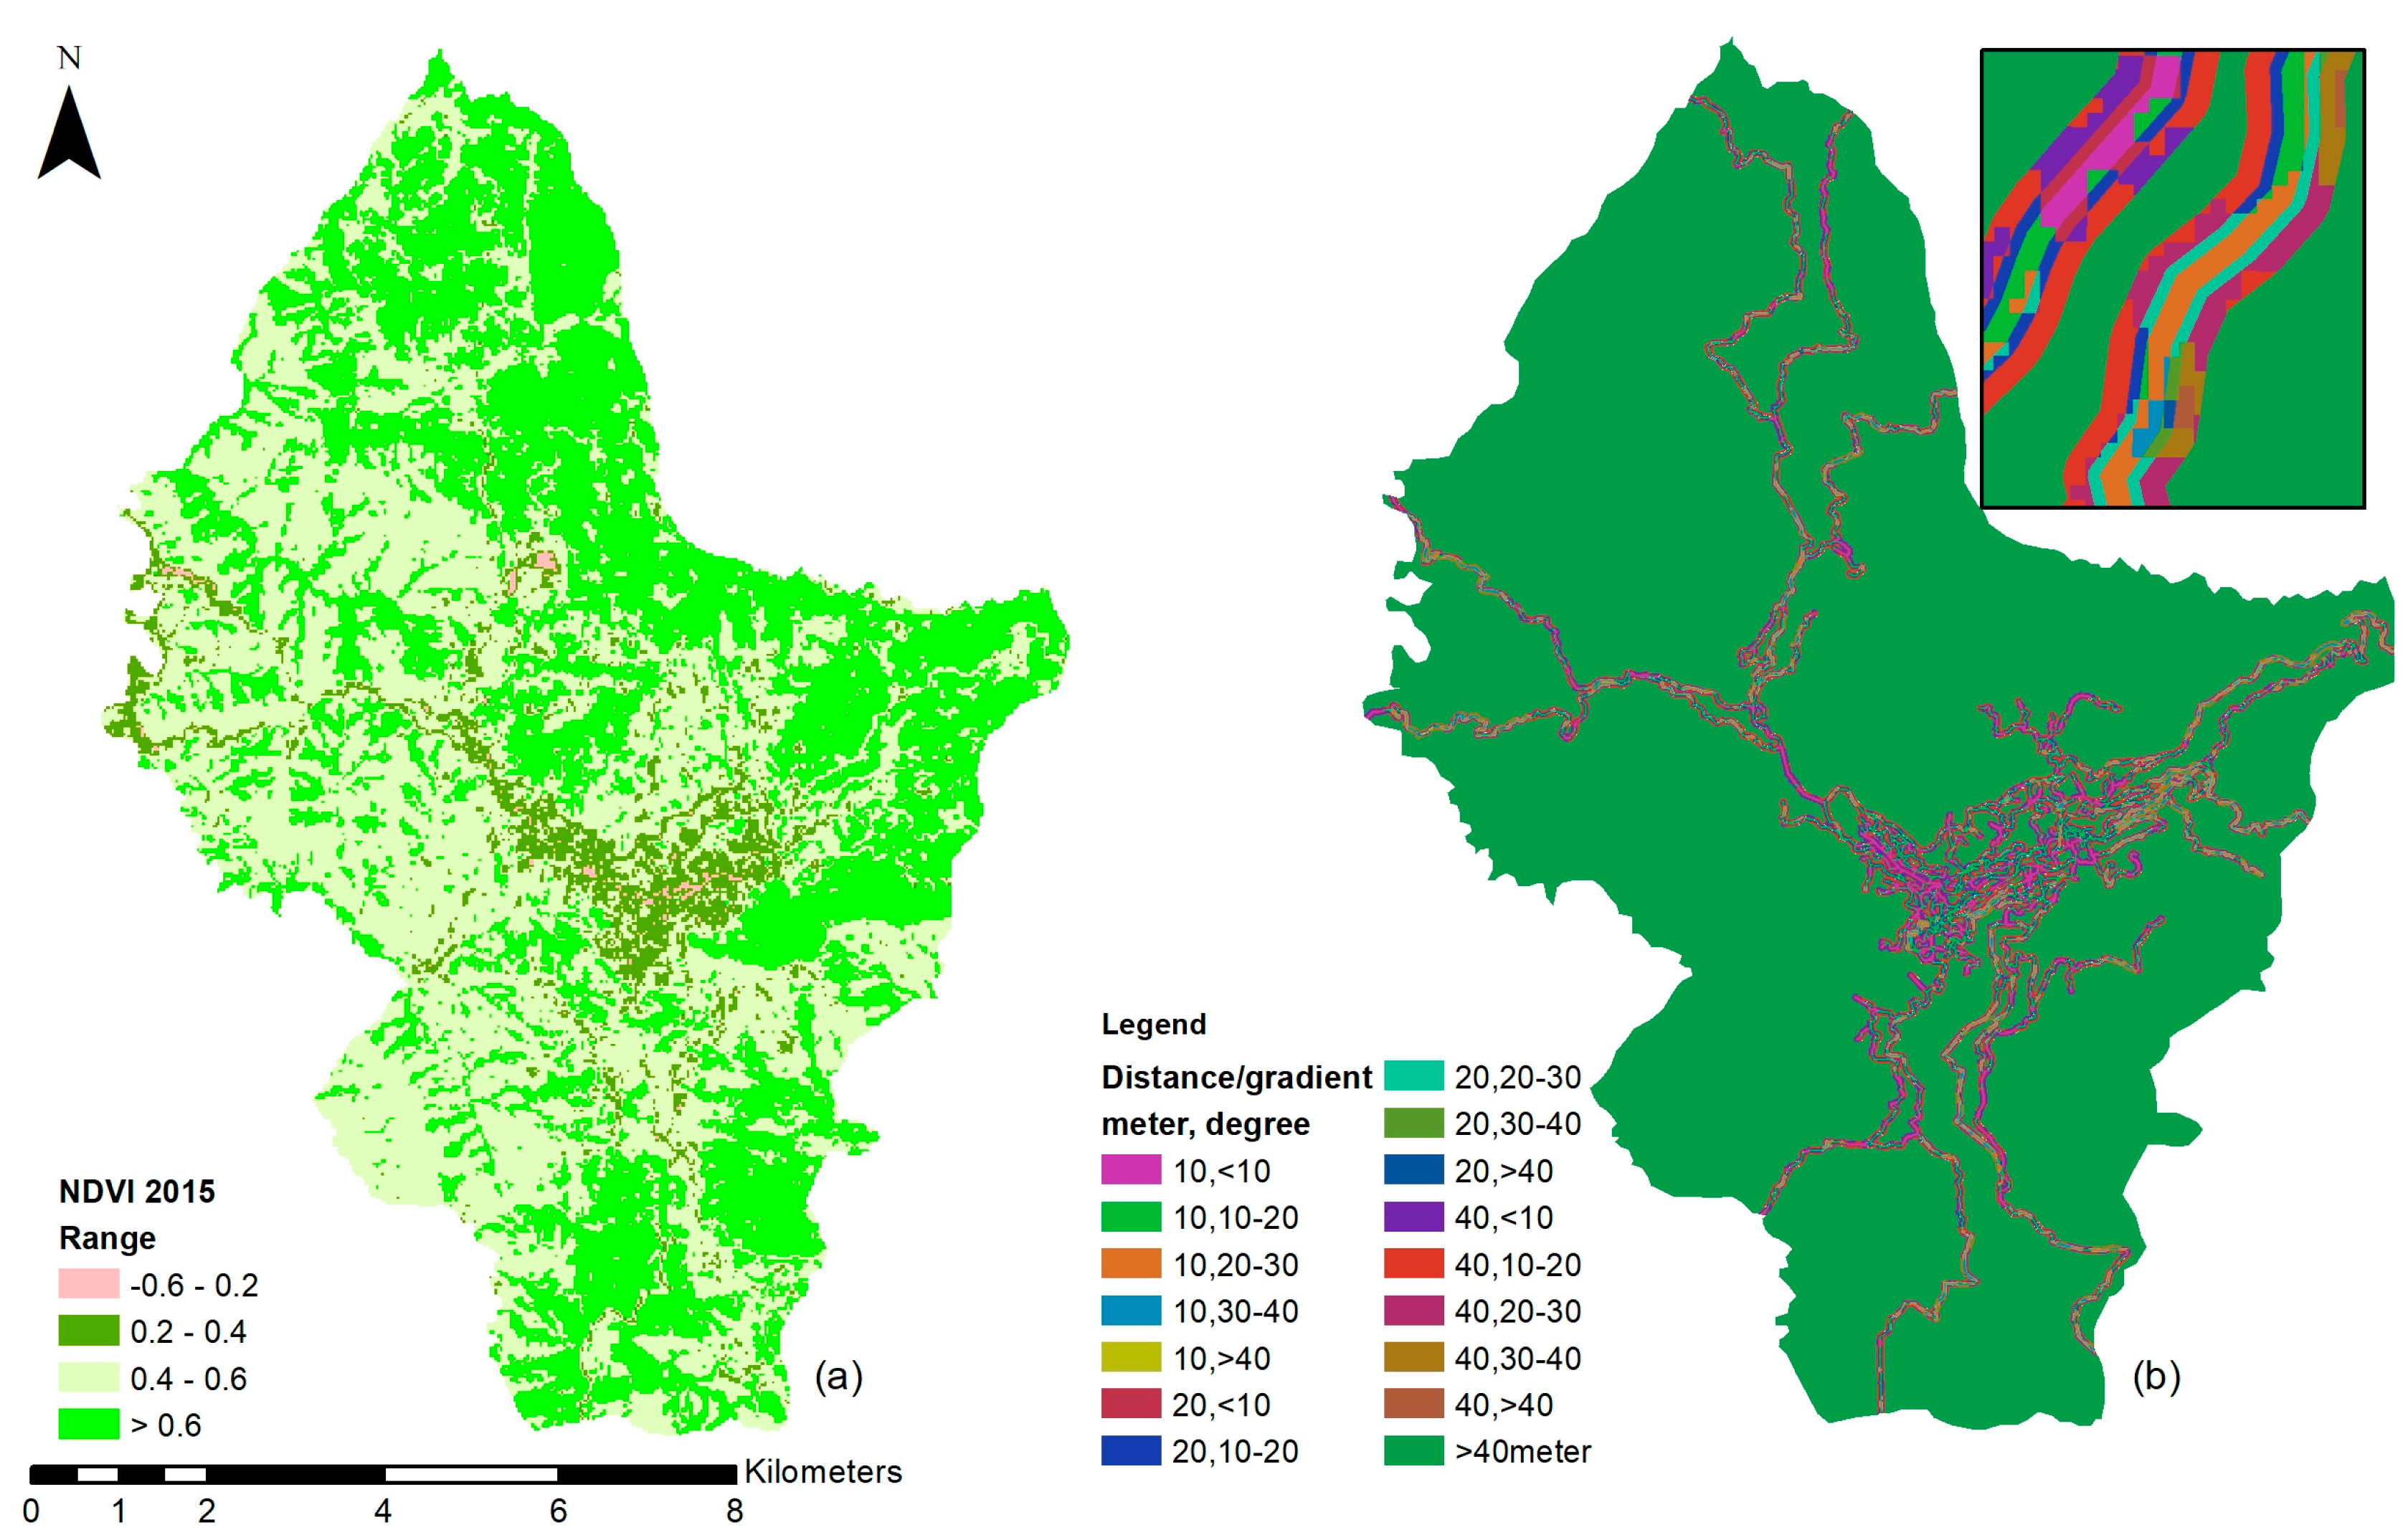
| 3. | Distance from stream | ALOS PALSAR DEM |
| 4. | Distance from seepage | Ground survey |
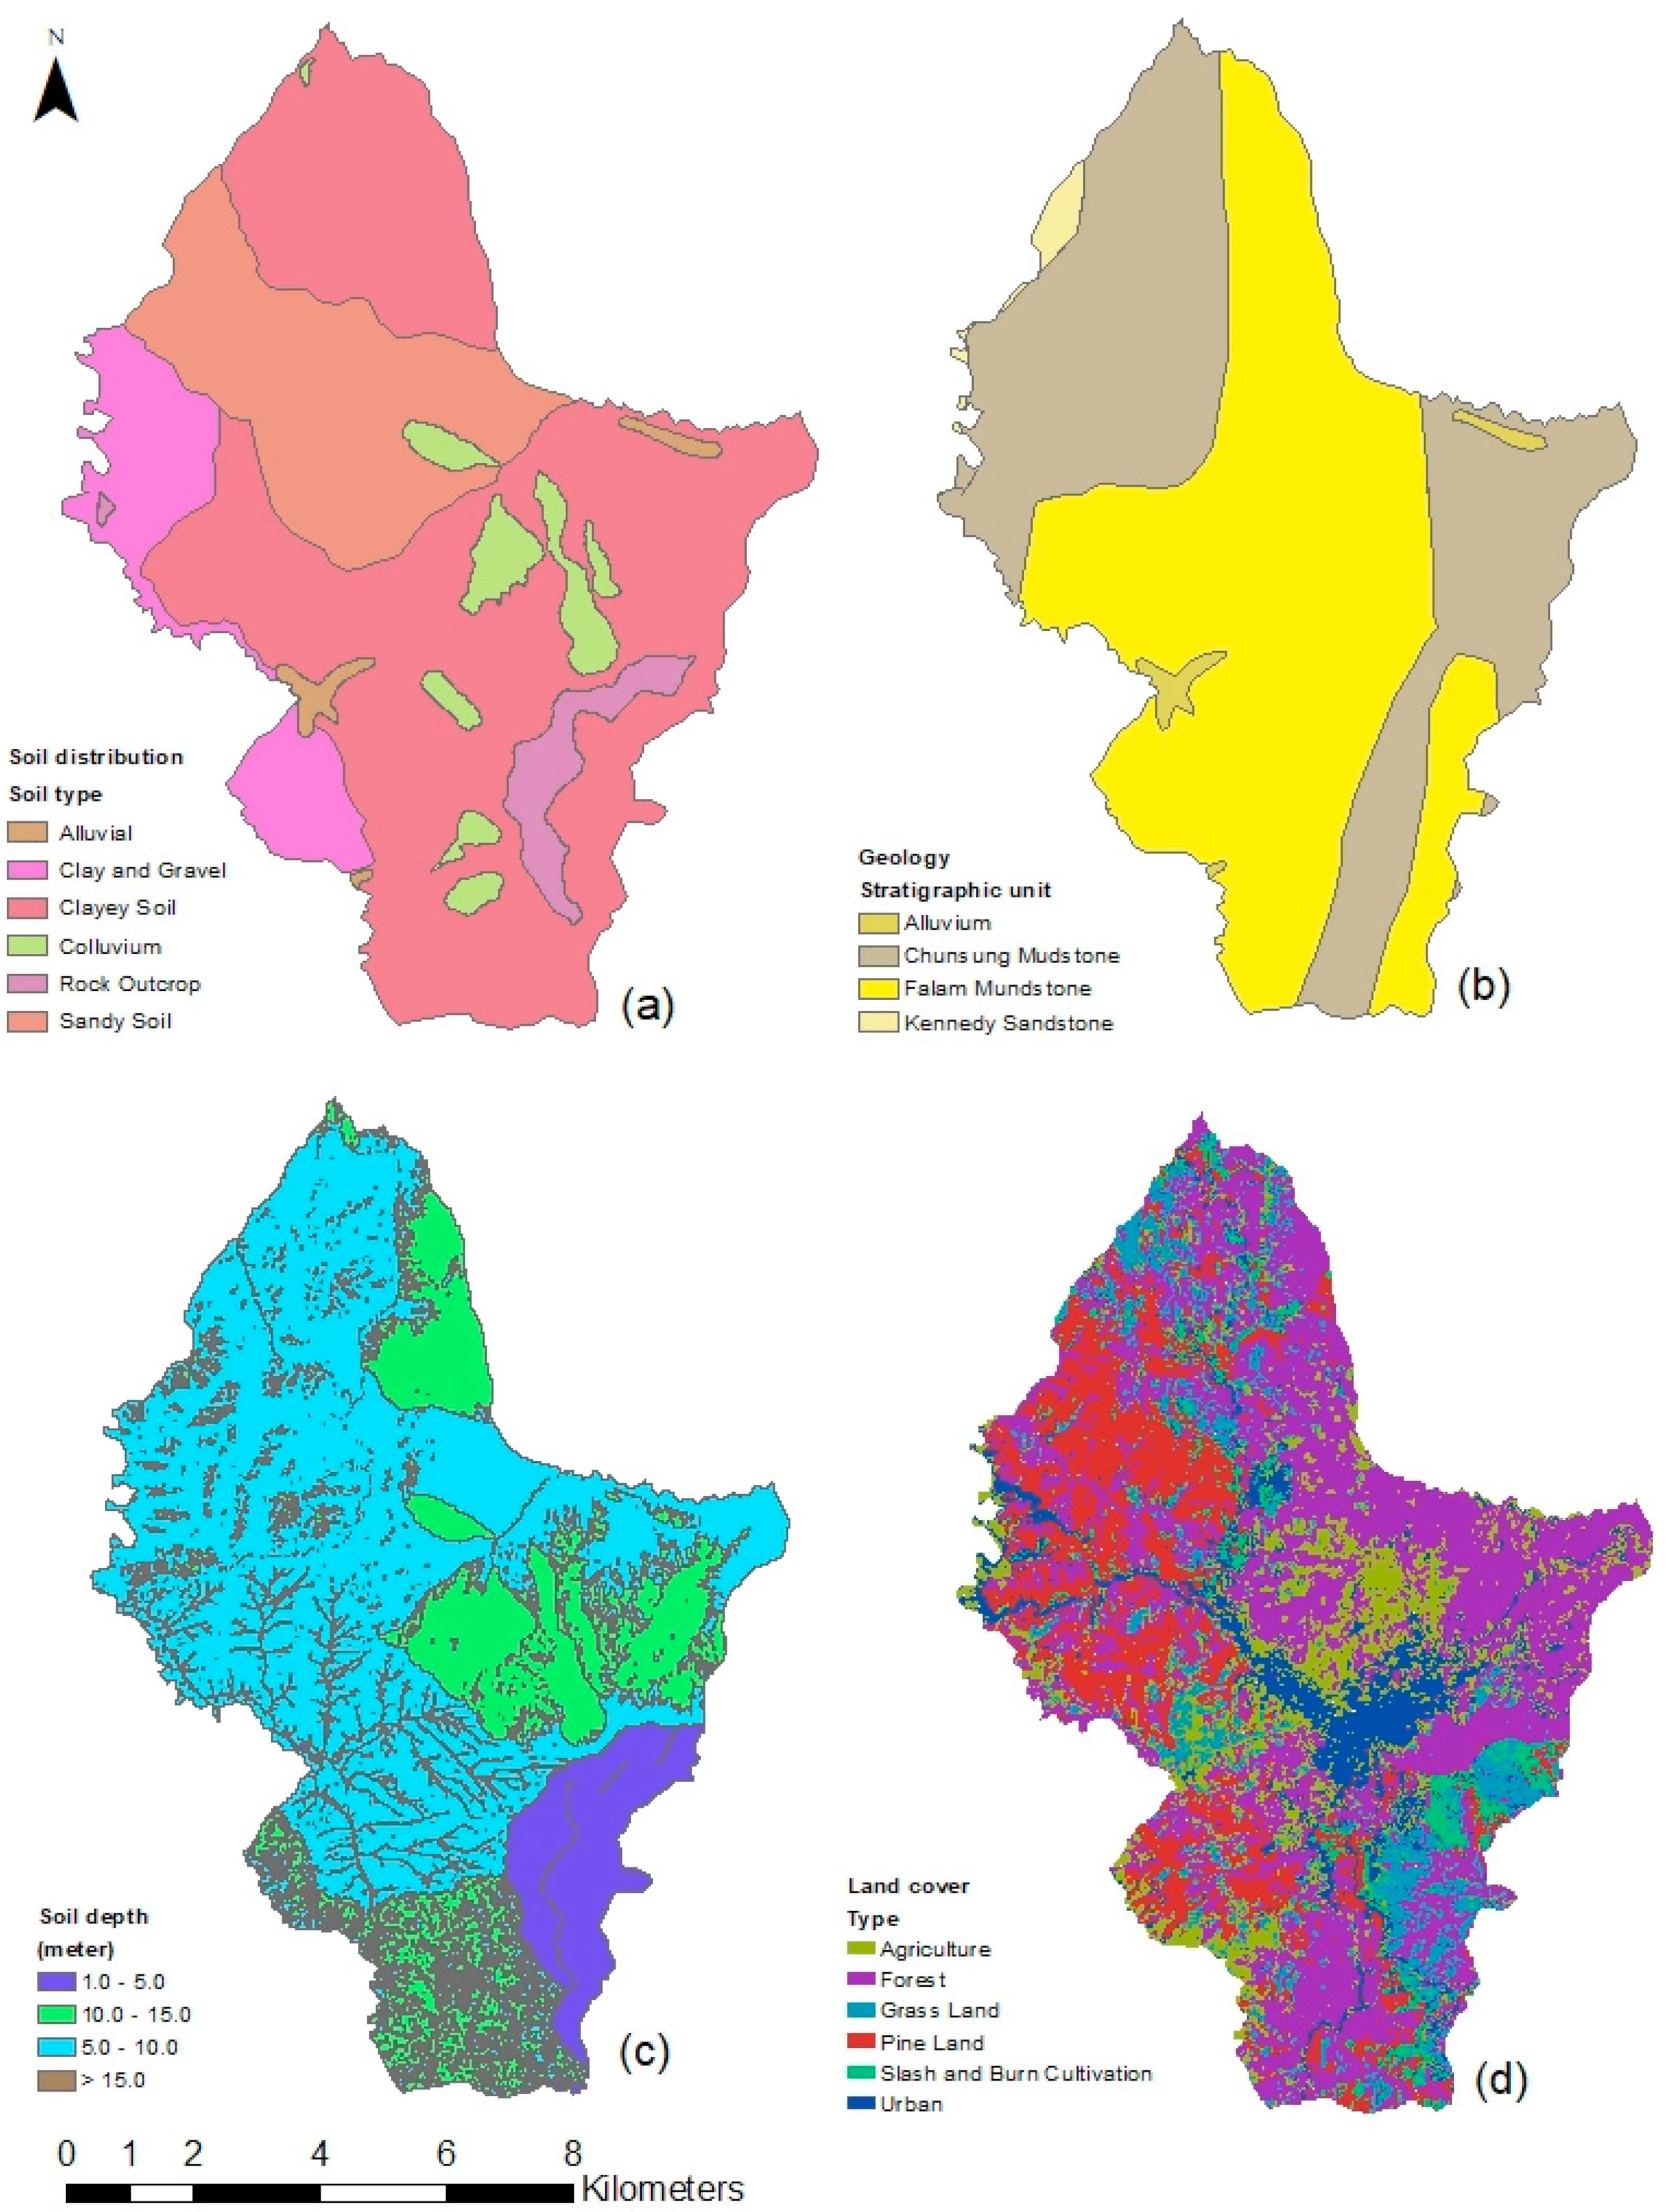
| 5. | Soil distribution | Ground survey and laboratory tests |
| 6. | Geological | Ground survey |
| 7. | Soil depth | Ground survey and modeling |
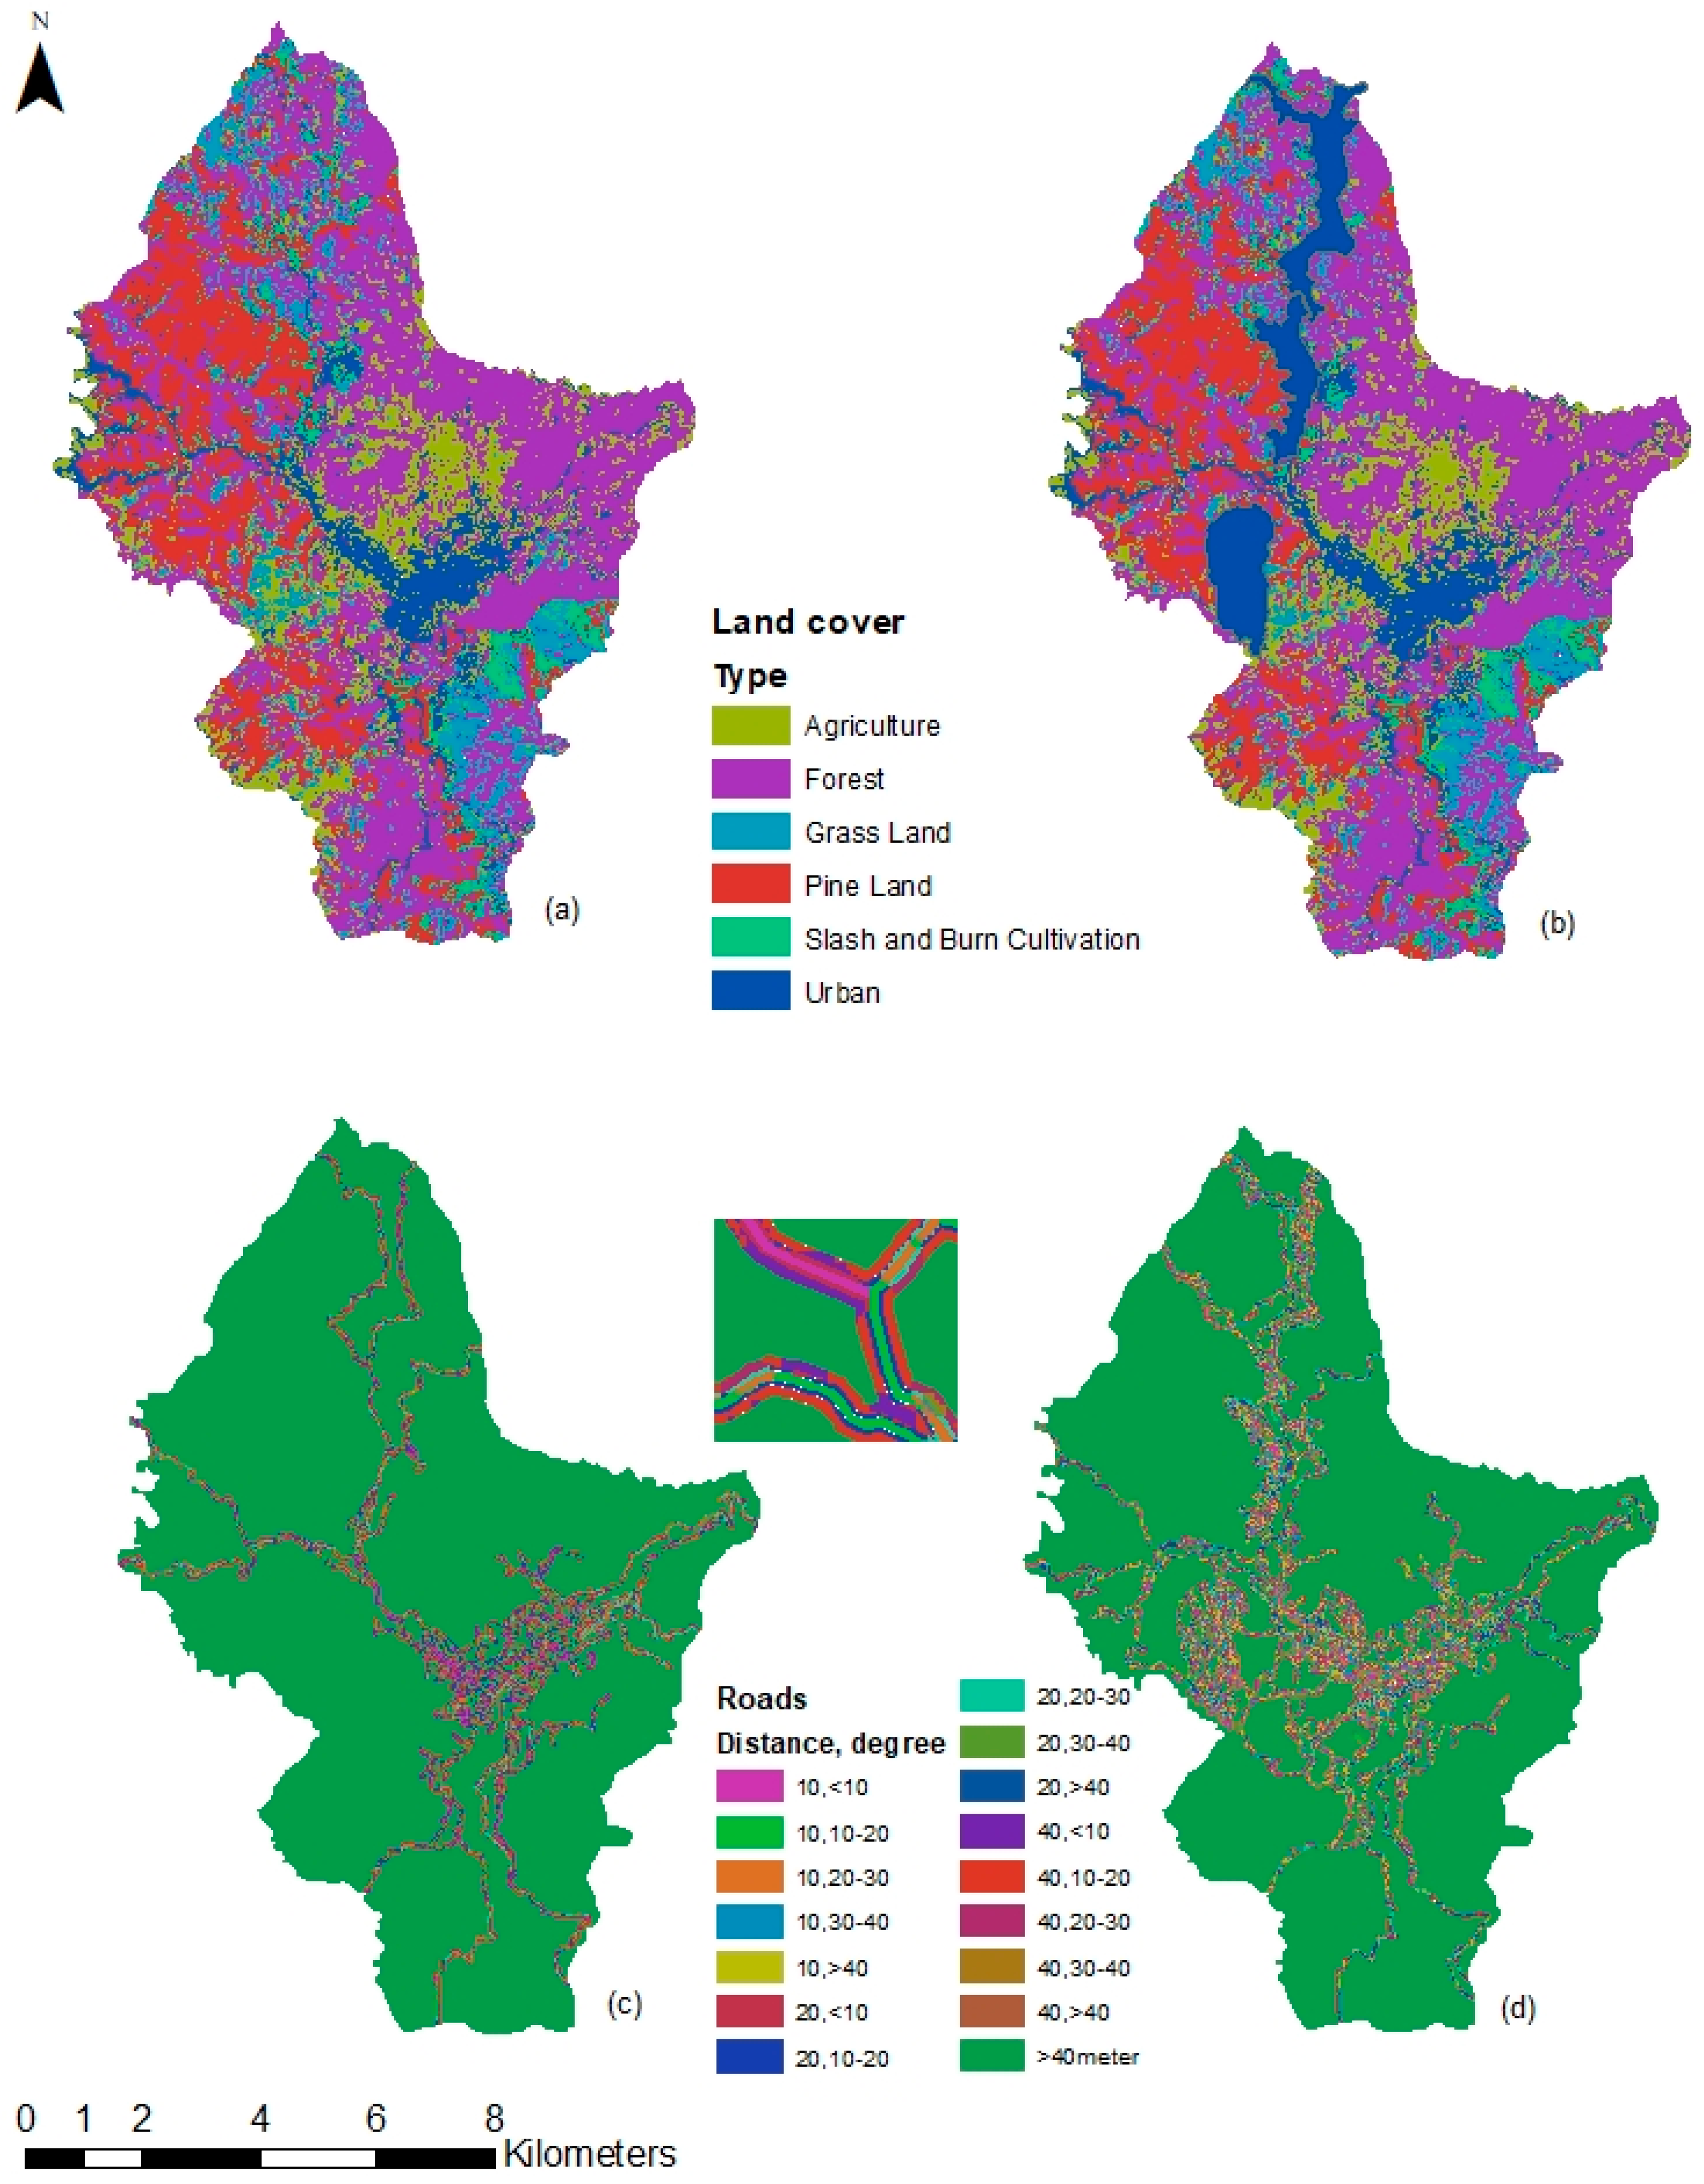
| 8. | Land cover | Landsat 8 |
| 9. | NDVI | Landsat 8 |
| 10. | Distance from the road network | Open Street Map, Google Earth |
| 11. | Landslide inventory | Google Earth, ground survey |
| Layer (Parameter Map) | Thematic Layer | Information Value (Weight) | |||
|---|---|---|---|---|---|
| Shallow Slide | Deep Slide | Slump | Debris Flow | ||
| Slope gradient | 0–10 | −1.75 | −0.60 | 0.58 | −0.44 |
| (degree) | 10–20 | −0.79 | −0.54 | 0.35 | −0.06 |
| 20–30 | 0.50 | 0.37 | −1.19 | 0.26 | |
| 30–40 | 0.99 | 0.85 | −2.88 | −0.20 | |
| 40–50 | 1.62 | 0.72 | −6.42 | −0.50 | |
| >50 | 0.00 | 0.00 | −3.87 | 0.21 | |
| Slope aspect | Flat (−1) | 0.00 | −0.67 | −0.87 | 0.00 |
| (degree) | North (0–22.5) | −0.74 | 0.20 | 0.83 | −0.12 |
| Northeast (22.5–67.5) | −0.79 | 0.27 | −0.30 | 0.25 | |
| East (67.5–112.5) | 0.04 | −0.50 | −2.78 | 0.45 | |
| Southeast (112.5–157.5) | 0.67 | −0.51 | −4.13 | −0.03 | |
| South (157.5–202.5) | 0.45 | −0.15 | −5.27 | −1.47 | |
| Southwest (202.5–247.5) | −0.06 | −0.09 | −4.01 | −0.26 | |
| West (247.5–292.5) | 0.39 | −0.57 | −0.81 | 0.74 | |
| Northwest (292.5–337.5) | −0.67 | 0.50 | 1.08 | −0.77 | |
| North (337.5–360.0) | −0.85 | 0.35 | 1.30 | −2.75 | |
| Stream | 10, <10 | −0.84 | 0.43 | 0.54 | −0.87 |
| (distance/gradient) | 10, 10–20 | 0.86 | 0.66 | 0.62 | −0.67 |
| (m/degree) | 10, 20–30 | 1.46 | 0.76 | −0.44 | 1.72 |
| 10, 30–40 | 1.33 | 0.60 | −0.56 | 0.00 | |
| 10, >40 | 0.00 | 0.00 | 0.00 | 0.00 | |
| 20, <10 | −0.94 | 0.25 | 0.62 | −1.22 | |
| 20, 10–20 | 0.38 | 0.48 | 0.64 | 0.00 | |
| 20, 20–30 | 1.62 | 0.70 | −0.64 | 1.36 | |
| 20, 30–40 | 2.20 | −0.51 | −0.30 | 0.00 | |
| 20, >40 | 4.02 | 0.00 | 0.03 | 0.00 | |
| 40, <10 | −2.31 | 0.12 | 0.86 | −0.67 | |
| 40, 10–20 | −0.16 | −0.02 | 0.70 | 0.43 | |
| 40, 20–30 | 1.04 | 0.44 | −0.77 | 0.42 | |
| 40, 30–40 | 2.26 | −0.46 | −1.89 | −3.47 | |
| 40, >40 | 3.84 | 0.00 | −5.28 | 0.00 | |
| >40 | −0.15 | −0.08 | −0.13 | −0.04 | |
| Spring | 0–50 | 0.79 | 2.65 | 1.84 | 0.00 |
| (m) | 50–100 | −0.90 | 2.19 | 1.74 | 0.00 |
| >100 | 0.00 | −0.11 | −0.06 | 0.01 | |
| Soil type | Colluvium | −0.05 | 2.13 | 2.20 | 0.00 |
| Rock outcrop | −2.37 | −0.87 | 0.00 | 0.00 | |
| Alluvial | −1.53 | −0.60 | 0.00 | 0.00 | |
| Clayey soil | 0.12 | −0.19 | −0.11 | 0.48 | |
| Sandy soil | −0.39 | −2.85 | −3.94 | 0.00 | |
| weathered rock | 0.18 | −0.87 | 0.00 | 0.00 | |
| Geology | Alluvium | −1.49 | −0.56 | 0.00 | 0.00 |
| Kennedy Sandstone | 0.00 | 0.00 | 0.00 | 0.00 | |
| Chunsung Mudstone | 0.41 | 0.09 | −6.16 | −0.44 | |
| Falam Mudstone | −0.43 | −0.04 | 0.58 | 0.26 | |
| Soil depth | 1.0–5.0 | 0.54 | 0.15 | 0.00 | 0.76 |
| (m) | 5.0–10.0 | −0.10 | −1.03 | −0.76 | 0.08 |
| 10.0–15.0 | −0.05 | 0.92 | 0.99 | −0.85 | |
| >15.0 | 2.50 | 0.98 | 0.00 | 0.00 | |
| Land cover | Agriculture | −1.10 | −1.13 | 0.35 | −0.50 |
| Grass land | 0.23 | 0.82 | −4.26 | 0.72 | |
| Urban | 0.87 | −0.18 | 0.60 | −0.69 | |
| Forest | 0.54 | 1.03 | 0.05 | 0.92 | |
| Pine land | −0.29 | −1.85 | −4.85 | −2.99 | |
| Slash and burn cultivation | 0.23 | −1.35 | 0.00 | −0.25 | |
| NDVI | −0.6 to 0.2 | −6.66 | −2.48 | −2.65 | 0.00 |
| 0.2–0.4 | −0.97 | −2.01 | −0.49 | 0.00 | |
| 0.4–0.6 | −0.01 | −0.74 | 0.24 | −0.48 | |
| >0.6 | 0.49 | 1.11 | −0.27 | 1.04 | |
| Road | 10, <10 | 0.00 | −0.85 | 1.17 | 0.71 |
| (distance, slope) | 10, 10–20 | −2.15 | −0.98 | 1.04 | 0.81 |
| (m, degree) | 10, 20–30 | 1.37 | 0.39 | 0.30 | 1.36 |
| 10, 30–40 | 2.15 | 0.48 | −0.82 | 0.00 | |
| 10, >40 | 0.00 | 2.10 | 0.00 | 0.00 | |
| 20, <10 | 0.00 | −0.69 | 1.15 | 0.72 | |
| 20, 10–20 | −2.96 | −0.87 | 1.08 | 0.77 | |
| 20, 20–30 | 1.36 | 0.50 | 0.15 | 1.51 | |
| 20, 30–40 | 2.05 | 0.54 | −1.48 | 0.00 | |
| 20, >40 | 0.00 | 1.54 | 0.00 | 0.00 | |
| 40, <10 | 0.00 | −0.58 | 1.18 | 1.20 | |
| 40, 10–20 | −3.30 | −0.55 | 1.14 | 0.88 | |
| 40, 20–30 | 1.23 | 0.55 | −0.05 | 1.33 | |
| 40, 30–40 | 1.88 | 0.61 | −1.70 | 0.00 | |
| 40, >40 | 0.00 | 0.69 | 0.00 | 0.00 | |
| >40 | −0.06 | 0.02 | −0.19 | −0.24 | |
| Type | Timing | Very Low | Low | Moderate | High | Very High |
|---|---|---|---|---|---|---|
| Area (m2) | Area (m2) | Area (m2) | Area (m2) | Area (m2) | ||
| Shallow slide | Before: | 30,036 | 699,034 | 799,473 | 19,737 | 0 |
| After: | 73,153 | 786,321 | 620,134 | 69,843 | 0 | |
| Deep slide | Before: | 54,001 | 1,152,972 | 335,259 | 6047 | 0 |
| After: | 353,632 | 921,389 | 269,064 | 5367 | 0 | |
| Slump | Before: | 1,520,002 | 29,449 | 0 | 0 | 0 |
| After: | 1842 | 26,437 | 0 | 0 | 0 | |
| Debris flow | Before: | 14,080 | 894,448 | 532,939 | 106,812 | 0 |
| After: | 12,099 | 733,879 | 582,227 | 221,021 | 225 | |
| All landslide types | Before: | 0 | 538,620 | 881,660 | 127,999 | 0 |
| After: | 0 | 455,547 | 824,030 | 269,649 | 225 |
| Type | Timing | Very Low Area (m2) | Low Area (m2) | Moderate Area (m2) | High Area (m2) | Very High Area (m2) |
|---|---|---|---|---|---|---|
| Shallow slide | Before: | 81,104 | 746,407 | 1,385,489 | 55,705 | 0 |
| After: | 71,984 | 1,076,039 | 911,798 | 207,854 | 0 | |
| Deep slide | Before: | 1623 | 768,948 | 893,545 | 587,136 | 16,423 |
| After: | 1320 | 710,300 | 904,167 | 638,845 | 14,073 | |
| Slump | Before: | 1,043,835 | 784,197 | 374,972 | 64,451 | 1250 |
| After: | 953,501 | 821,535 | 390,028 | 100,811 | 1800 | |
| Debris flow | Before: | 22,938 | 856,371 | 1,201,496 | 187,848 | 0 |
| After: | 8008 | 624,575 | 1,120,472 | 514,621 | 0 | |
| All landslide types | Before: | 1319 | 710,301 | 904,167 | 638,845 | 14,073 |
| After: | 0 | 256,783 | 1,001,610 | 991,059 | 18,223 |
| Type | Timing | Very Low Area (m2) | Low Area (m2) | Moderate Area (m2) | High Area (m2) | Very High Area (m2) |
|---|---|---|---|---|---|---|
| Shallow slide | Before: | 34,208 | 1,503,177 | 646,079 | 2187 | 0 |
| After: | 255,800 | 1,461,052 | 444,457 | 24,750 | 0 | |
| Deep slide | Before: | 4113 | 1,242,731 | 802,327 | 136,481 | 0 |
| After: | 19,300 | 1,540,382 | 542,585 | 83,791 | 0 | |
| Slump | Before: | 908,505 | 1,009,594 | 223,229 | 44,325 | 0 |
| After: | 715,116 | 1,064,542 | 288,331 | 118,070 | 0 | |
| Debris flow | Before: | 18,893 | 1,357,271 | 762,314 | 47,174 | 0 |
| After: | 13,680 | 1,114,673 | 917,397 | 140,309 | 0 | |
| All landslide types | Before: | 0 | 933,535 | 1,054,640 | 197,477 | 0 |
| After: | 0 | 801,143 | 1,065,198 | 319,717 | 0 |
Disclaimer/Publisher’s Note: The statements, opinions and data contained in all publications are solely those of the individual author(s) and contributor(s) and not of MDPI and/or the editor(s). MDPI and/or the editor(s) disclaim responsibility for any injury to people or property resulting from any ideas, methods, instructions or products referred to in the content. |
© 2023 by the authors. Licensee MDPI, Basel, Switzerland. This article is an open access article distributed under the terms and conditions of the Creative Commons Attribution (CC BY) license (https://creativecommons.org/licenses/by/4.0/).
Share and Cite
Thein, K.S.M.; Nagai, M.; Nakamura, T.; Phienwej, N.; Pal, I. Assessment of the Impacts of Urbanization on Landslide Susceptibility in Hakha City, a Mountainous Region of Western Myanmar. Land 2023, 12, 1036. https://doi.org/10.3390/land12051036
Thein KSM, Nagai M, Nakamura T, Phienwej N, Pal I. Assessment of the Impacts of Urbanization on Landslide Susceptibility in Hakha City, a Mountainous Region of Western Myanmar. Land. 2023; 12(5):1036. https://doi.org/10.3390/land12051036
Chicago/Turabian StyleThein, Kyaw Swar Myint, Masahiko Nagai, Tai Nakamura, Noppadol Phienwej, and Indrajit Pal. 2023. "Assessment of the Impacts of Urbanization on Landslide Susceptibility in Hakha City, a Mountainous Region of Western Myanmar" Land 12, no. 5: 1036. https://doi.org/10.3390/land12051036