Article

An Independent Validation of SoilGrids Accuracy for Soil Texture Components in Croatia

1
Faculty of Agrobiotechnical Sciences Osijek, Josip Juraj Strossmayer University of Osijek, Vladimira Preloga 1, 31000 Osijek, Croatia
2
Department of Geography, University of Zadar, Trg kneza Višeslava 9, 23000 Zadar, Croatia
*
Author to whom correspondence should be addressed.
Land 2023, 12(5), 1034; https://doi.org/10.3390/land12051034
Submission received: 11 April 2023 / Revised: 27 April 2023 / Accepted: 8 May 2023 / Published: 9 May 2023
(This article belongs to the Special Issue Geospatial Data in Land Suitability Assessment)

Abstract

:
While SoilGrids is an important source of soil property data for a wide range of environmental studies worldwide, there is currently an extreme lack of studies evaluating its accuracy against independent ground truth soil sampling data. This study aimed to provide a comprehensive insight into the accuracy of SoilGrids layers for three physical soil properties representing soil texture components (clay, silt, and sand soil contents) using ground truth data in the heterogeneous landscape of Croatia. These ground truth data consisted of 686 soil samples collected within the national project at a 0–30 cm soil depth, representing the most recent official national data available. The main specificity of this study was that SoilGrids was created based on zero soil samples in the study area, according to the ISRIC WoSIS Soil Profile Database, which is very sparse for the wider surroundings of the study area. The accuracy assessment metrics indicated an overall low accuracy of the SoilGrids data compared with the ground truth data in Croatia, with the average coefficient of determination (R2) ranging from 0.039 for silt and sand to 0.267 for clay, while the normalized root-mean-square error (NRMSE) ranged from 0.362 to 2.553. Despite the great value of SoilGrids in a vast range of environmental studies, this study proved that the accuracy of its products is highly dependent on the presence of ground truth data in the study area.

1. Introduction

Digital soil mapping refers to the collection and analysis of data to produce detailed maps of soil properties such as soil type, texture, and organic matter content [1]. These maps are essential for understanding the physical, chemical, and biological characteristics of soils in a particular area, which is critical for making informed decisions about land use and management [2]. For this reason, digital soil mapping at the country level provides a comprehensive overview of the soil conditions across a nation and allows the development of effective policies to manage this vital resource. Supporting agricultural production is one of the primary reasons for soil mapping’s importance at the country level [3]. In most countries, agriculture is a key source of income and employment, and soil conditions are important for optimizing crop yields and minimizing environmental impacts [4,5]. Soil maps can also indicate areas that are vulnerable to erosion, nutrient depletion, and other factors that can negatively affect crop yield [6]. In addition to supporting agricultural production, soil mapping can also help to mitigate the effects of climate change [7]. Soils are the major component of the global carbon cycle, and soil mapping provides valuable information on soil organic matter content, which is a key indicator of carbon sequestration potential [8]. Similarly, soil mapping is important for managing natural resources such as forests, wetlands, and grasslands. These ecosystems rely on healthy soils to support their functioning and provide valuable ecosystem services such as water regulation and biodiversity conservation [9,10,11]. Soil maps provide information on soil conditions in these areas, which can be used to develop effective management strategies that maintain soil health and support ecosystem functioning. Another important reason for soil mapping is to support land use planning and infrastructure development at the country level [12]. Understanding soil conditions can help to identify areas that are suitable for different land uses, such as agriculture, urban development, or conservation. This information can be used in the planning process and to ensure sustainable development [13], in addition to being able to improve soil health.
Despite the importance of soil mapping at the country level, many countries still lack comprehensive soil maps [14,15]. This is often due to a lack of resources or expertise, as soil mapping can be a complex and time-consuming process [16]. However, technological advances and the availability of global soil databases, such as SoilGrids [17,18,19], have made soil mapping more accessible and cost-effective than ever before. SoilGrids is a global soil mapping platform that uses machine learning algorithms and environmental covariate data to produce high-resolution maps of soil properties, produced by the International Soil Reference and Information Center (ISRIC) [17]. SoilGrids provides a range of data products that provide information on soil properties, including soil texture components (clay, silt, and sand soil contents). This information is essential for the development of sustainable land management practices and can be used by farmers, land managers, and policymakers to make informed decisions about land use [20]. One of the key advantages of SoilGrids is its global coverage. The platform provides soil information for every country in the world, and the data are available at resolutions of up to 250 m [18]. Another advantage of SoilGrids is its accessibility, as all SoilGrids data are available online free of charge. The platform is also user-friendly, with a number of tools and resources available to help users navigate and interpret the data, including its availability on Google Earth Engine [21].
However, there are also some potential issues with using SoilGrids. SoilGrids relies on a range of data sources, including soil profile data, remote sensing data, and climate data, which may be inaccurate or outdated [22]. The accuracy of SoilGrids has been validated via numerous studies comparing its predicted soil properties with ground truth data as a part of its development, with an R2 ranging from 0.540 to 0.834 [18]. Additionally, de Sousa et al. [23] determined the root-mean-square error of SoilGrids in the range of 4.6–5.1% for soil organic matter. Poggio et al. [24] produced median model efficiency coefficients within the 0.22–0.73 range based on 9 soil parameters. Besides studies by the SoilGrids developers, as well as many instances in which SoilGrids rasters were used as covariates in machine learning prediction [25,26], there has been no independent comprehensive validation of these products according to independent ground truth soil sampling data. Another potential limitation of SoilGrids is its reliance on environmental covariate data, which may not always accurately capture soil properties. SoilGrids has been developed using global data, and while this approach is useful for broad-scale studies, its application in local conditions may not always be accurate [27]. In addition, SoilGrids is also limited by the quality and quantity of the soil data used to train the machine learning algorithms. Soil data are often limited, particularly in developing countries where access to soil data is scarce, meaning that the accuracy of SoilGrids may be limited due to the lack of adequate training data [28].
The aim of this study is to evaluate to provide an accurate representation of physical soil parameters based on the most recent ground truth soil sampling data in Croatia, according to independent ground truth soil sampling data. Since there are currently no comprehensive studies on SoilGrids’s accuracy using an independent soil sampling dataset, these results are expected to aid in developing a comprehensive and independent outlook on the ability of SoilGrids to provide an accurate representation of physical soil parameters.

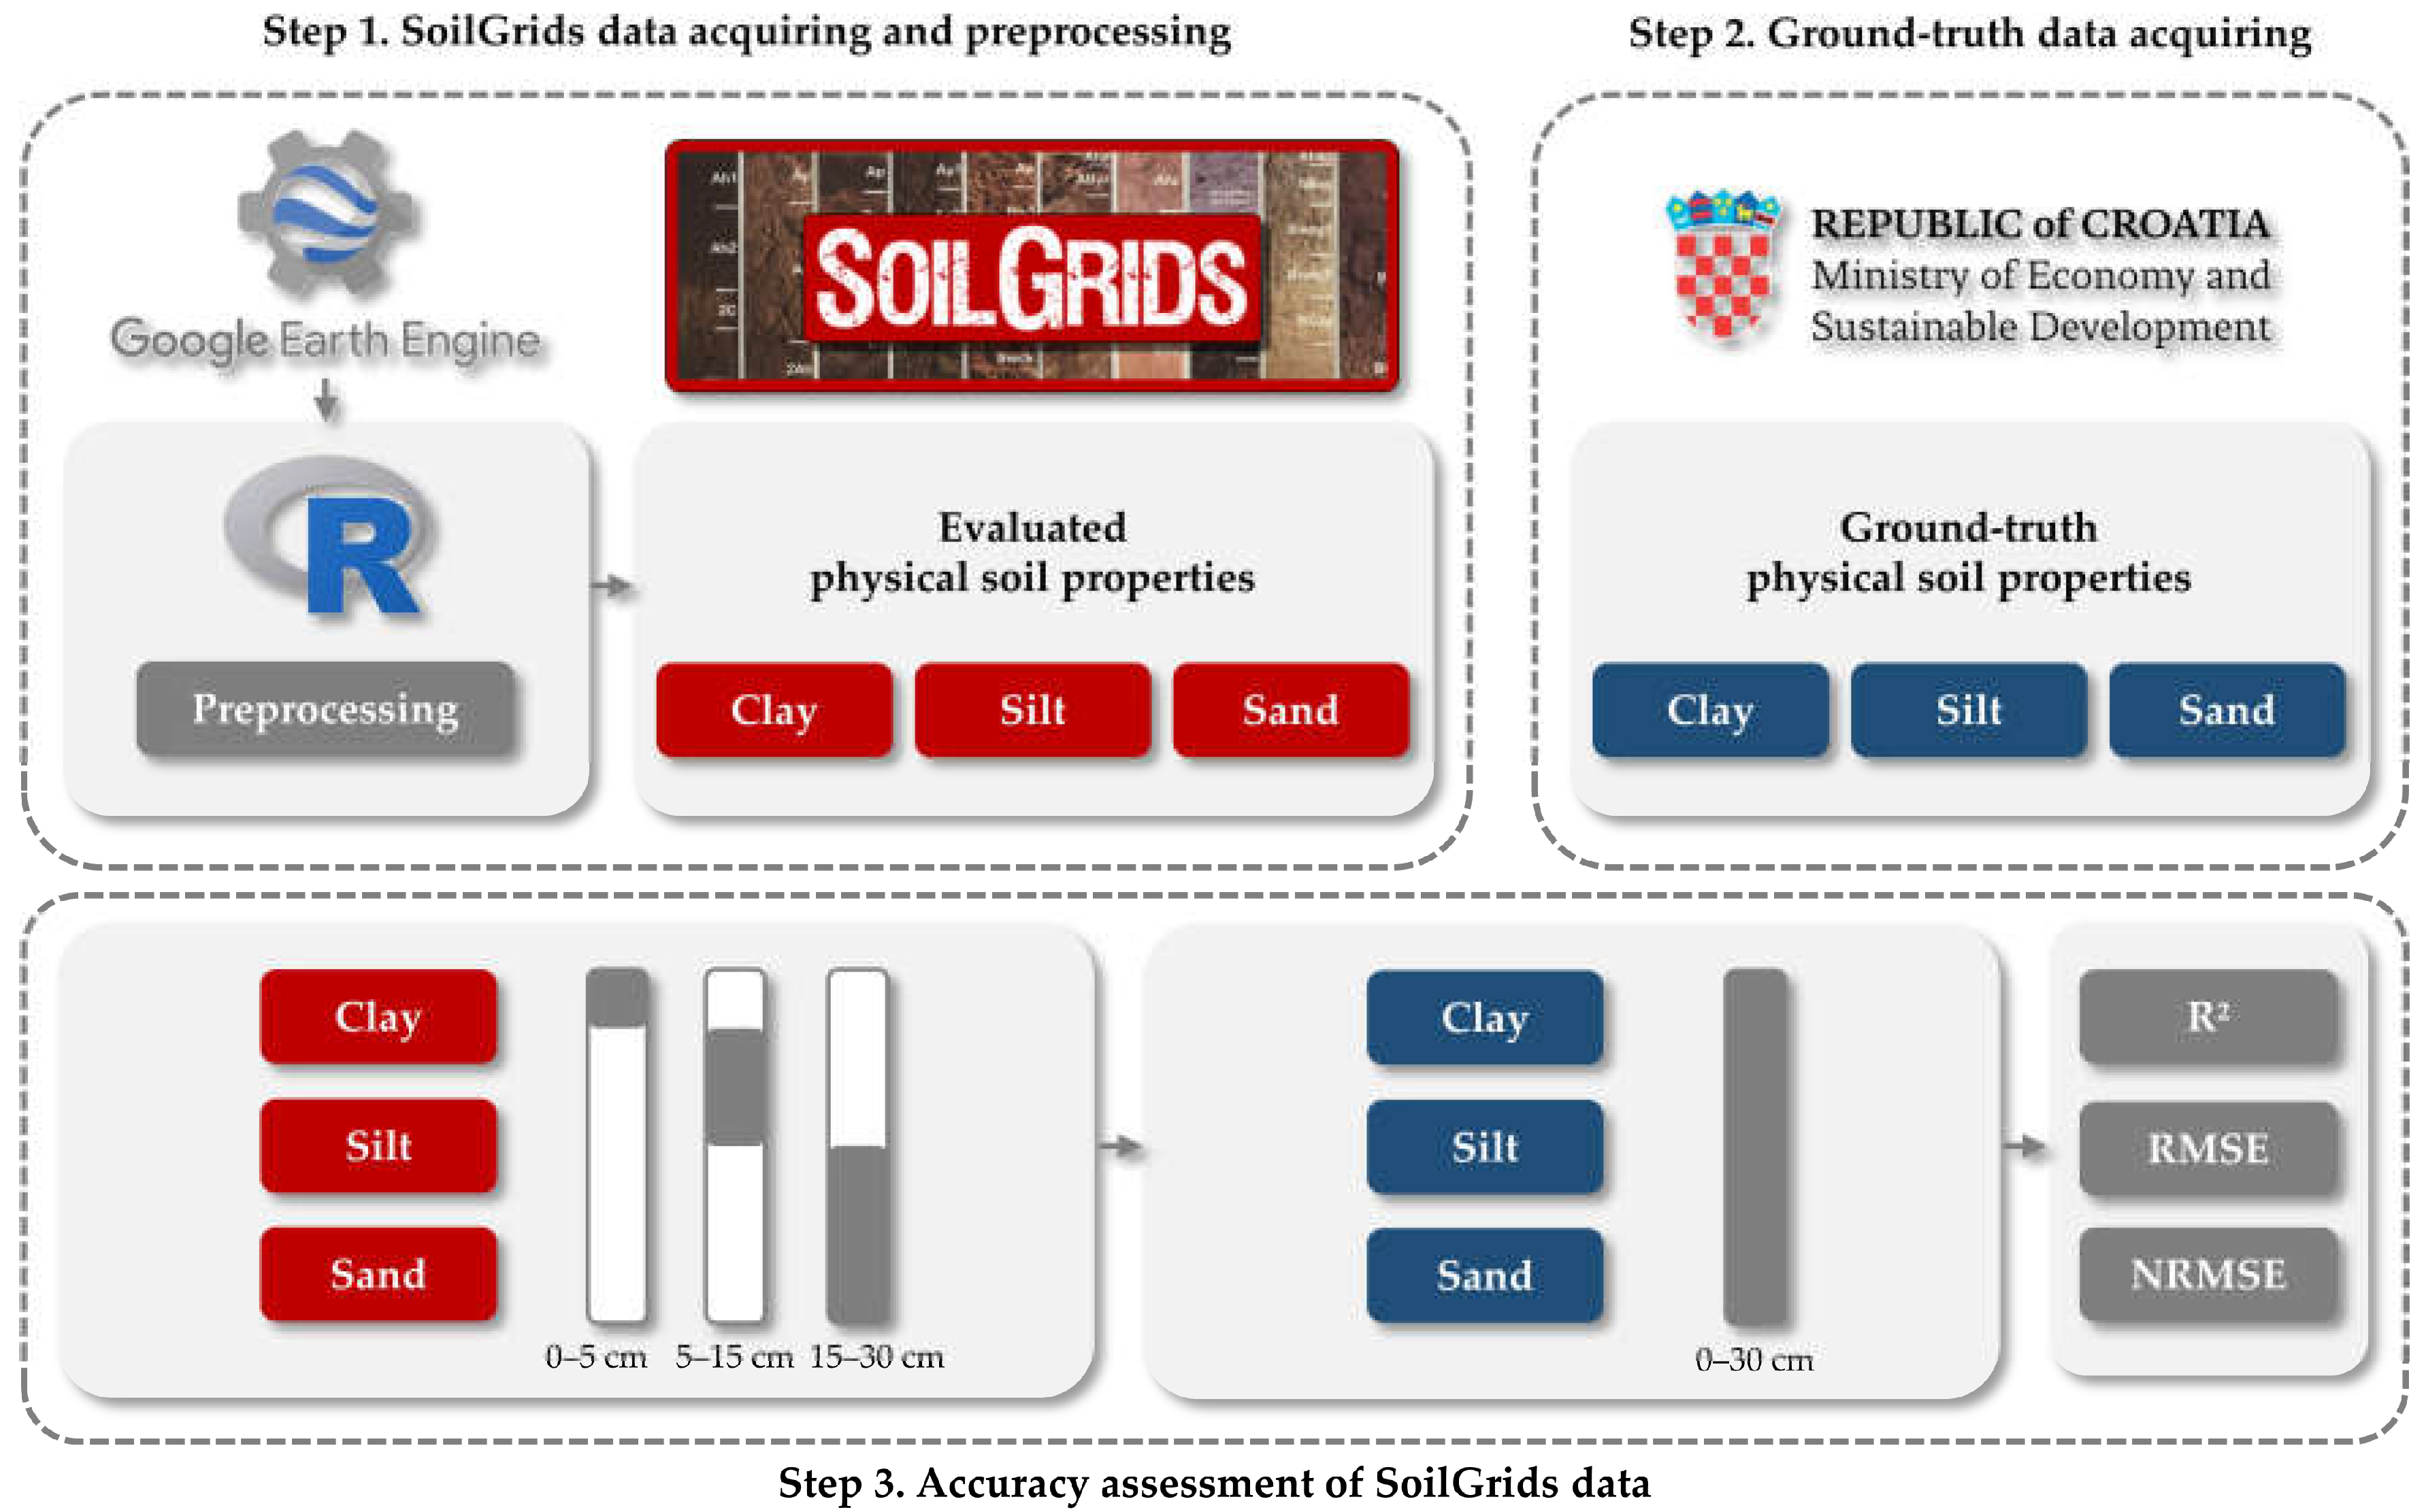
2. Materials and Methods

The study workflow for the SoilGrids accuracy analysis in Croatia was divided into three steps: (1) acquisition and preprocessing of SoilGrids data, (2) acquisition of the ground truth soil sampling data, and (3) accuracy assessment of SoilGrids based on the ground truth data (Figure 1). A total of three physical soil properties were evaluated, including clay, silt, and sand soil contents. Despite the availability of several chemical soil properties in the ground truth data, soil texture components were selected for the accuracy assessment of SoilGrids as very stable soil properties [29] with a tendency to remain stable over several years [30,31]. Therefore, the potential effect of temporal discrepancy in the soil sampling was minimized.

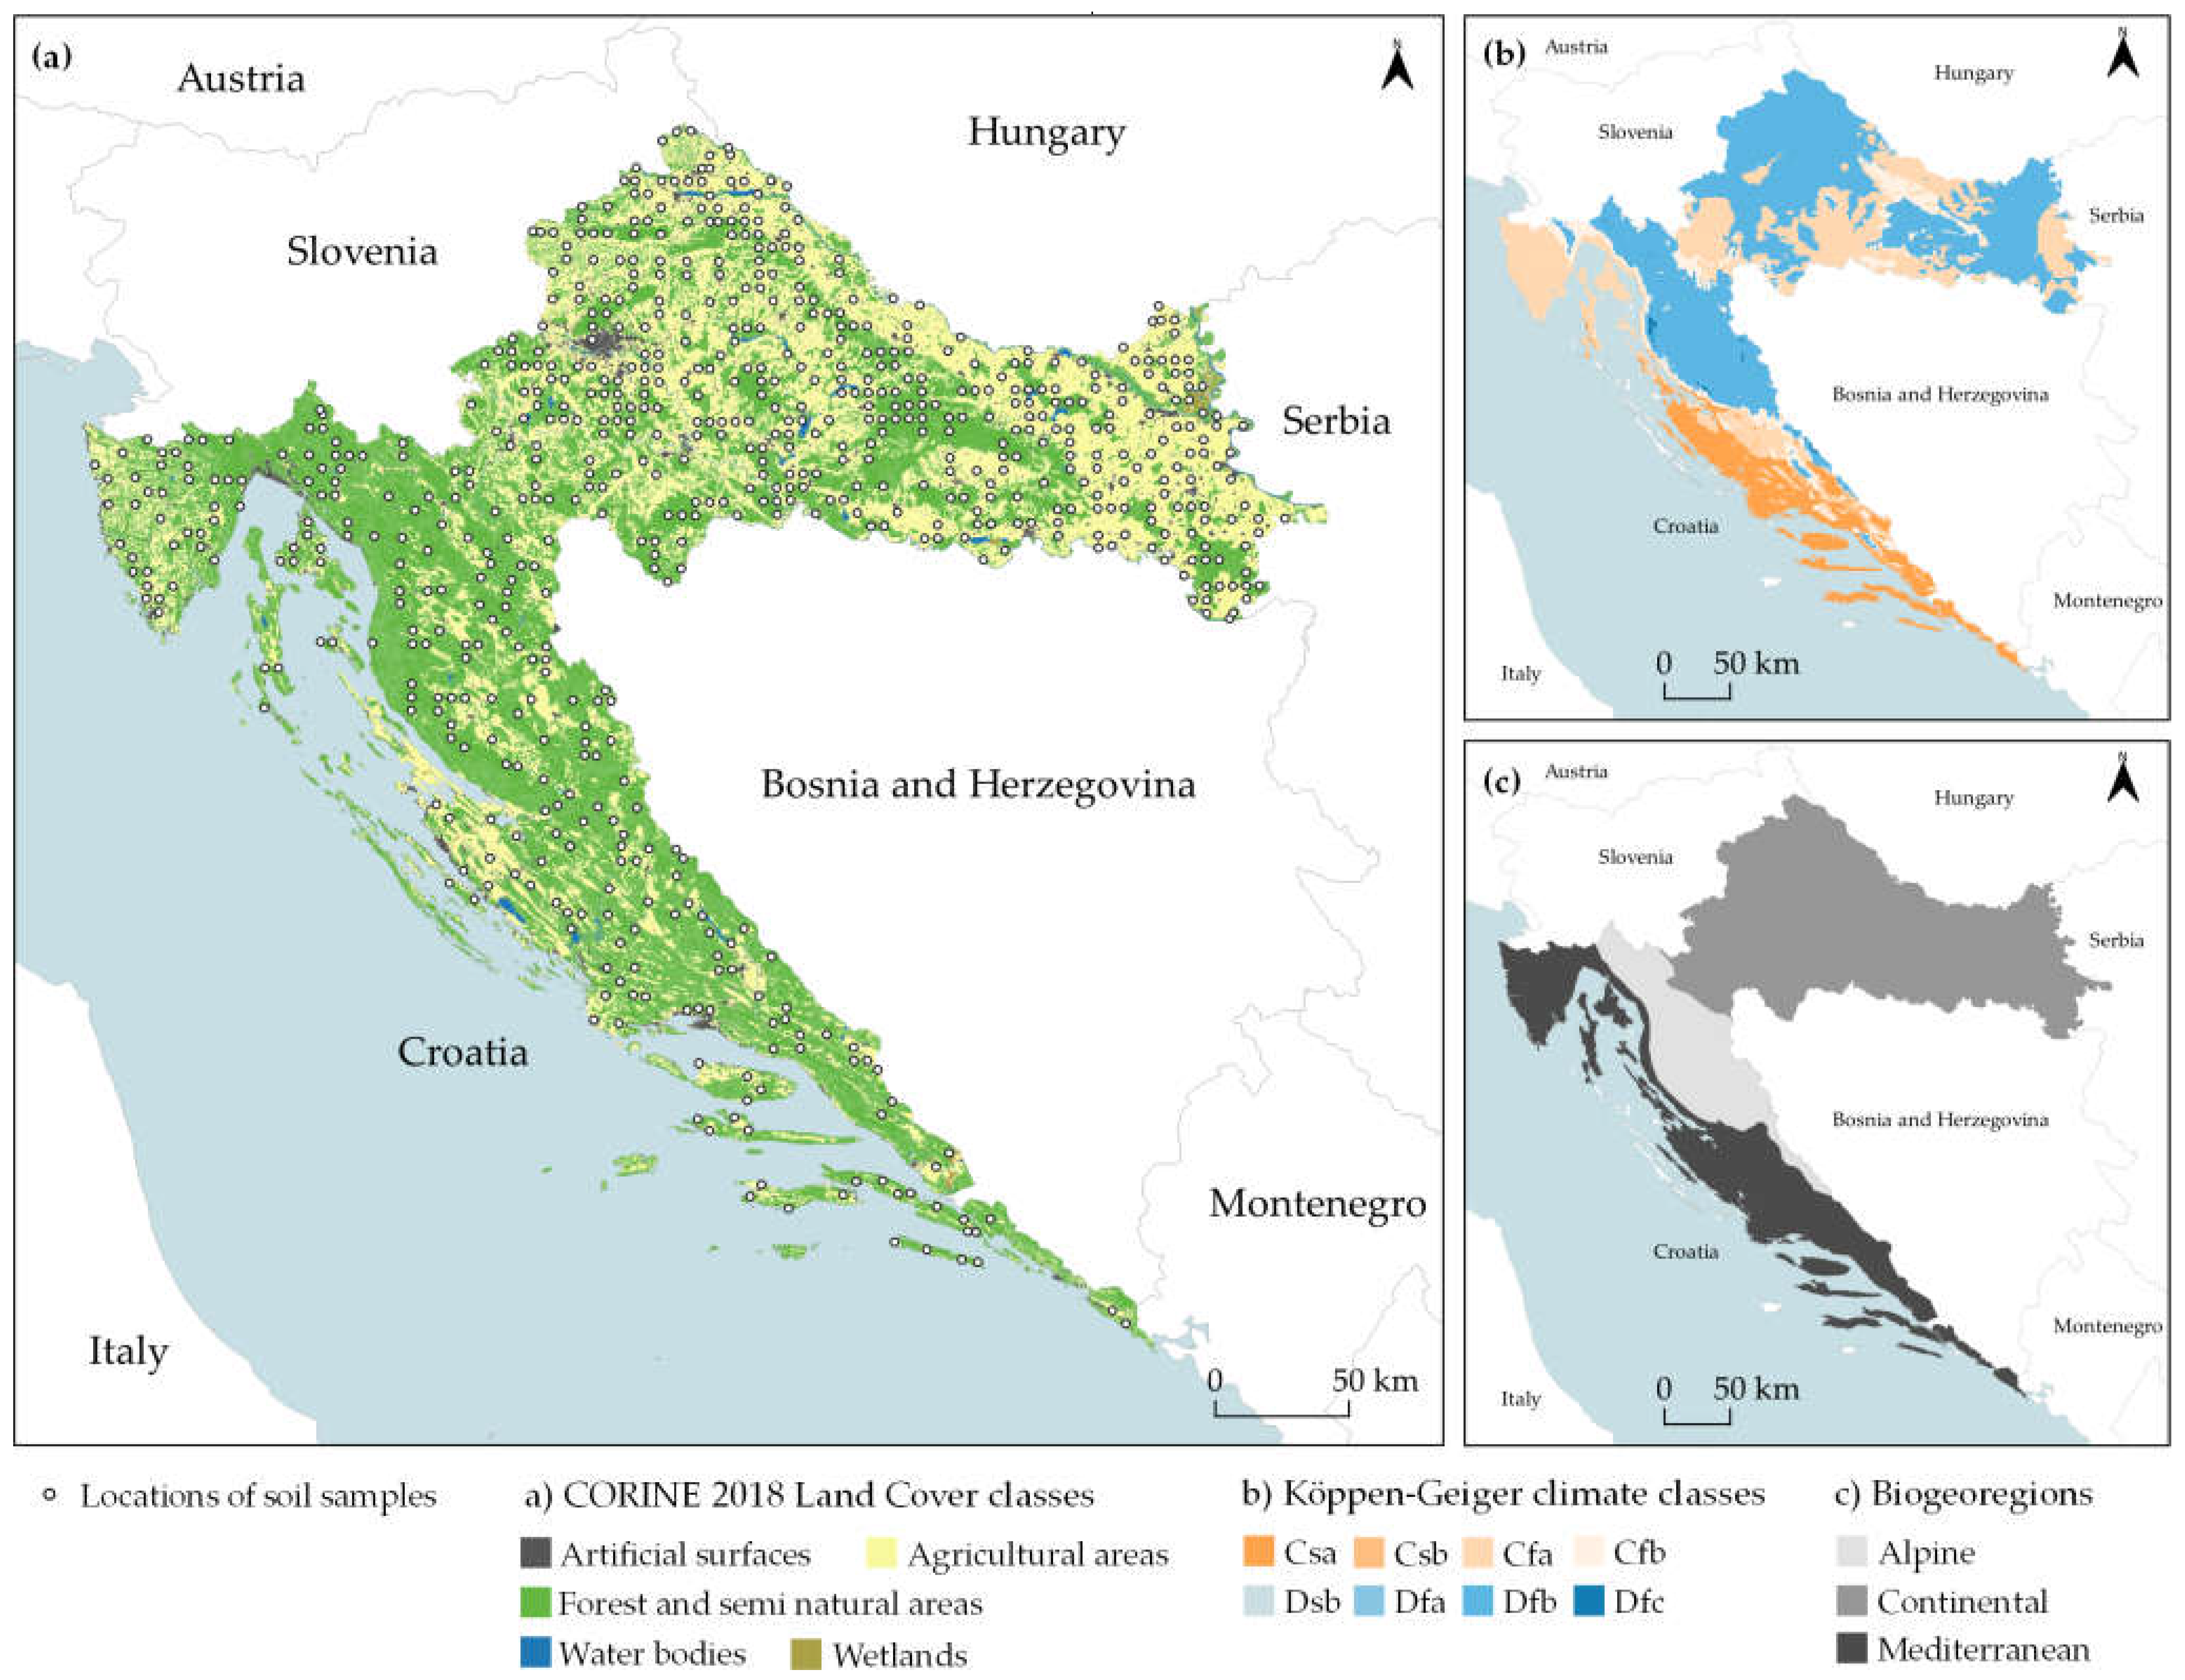
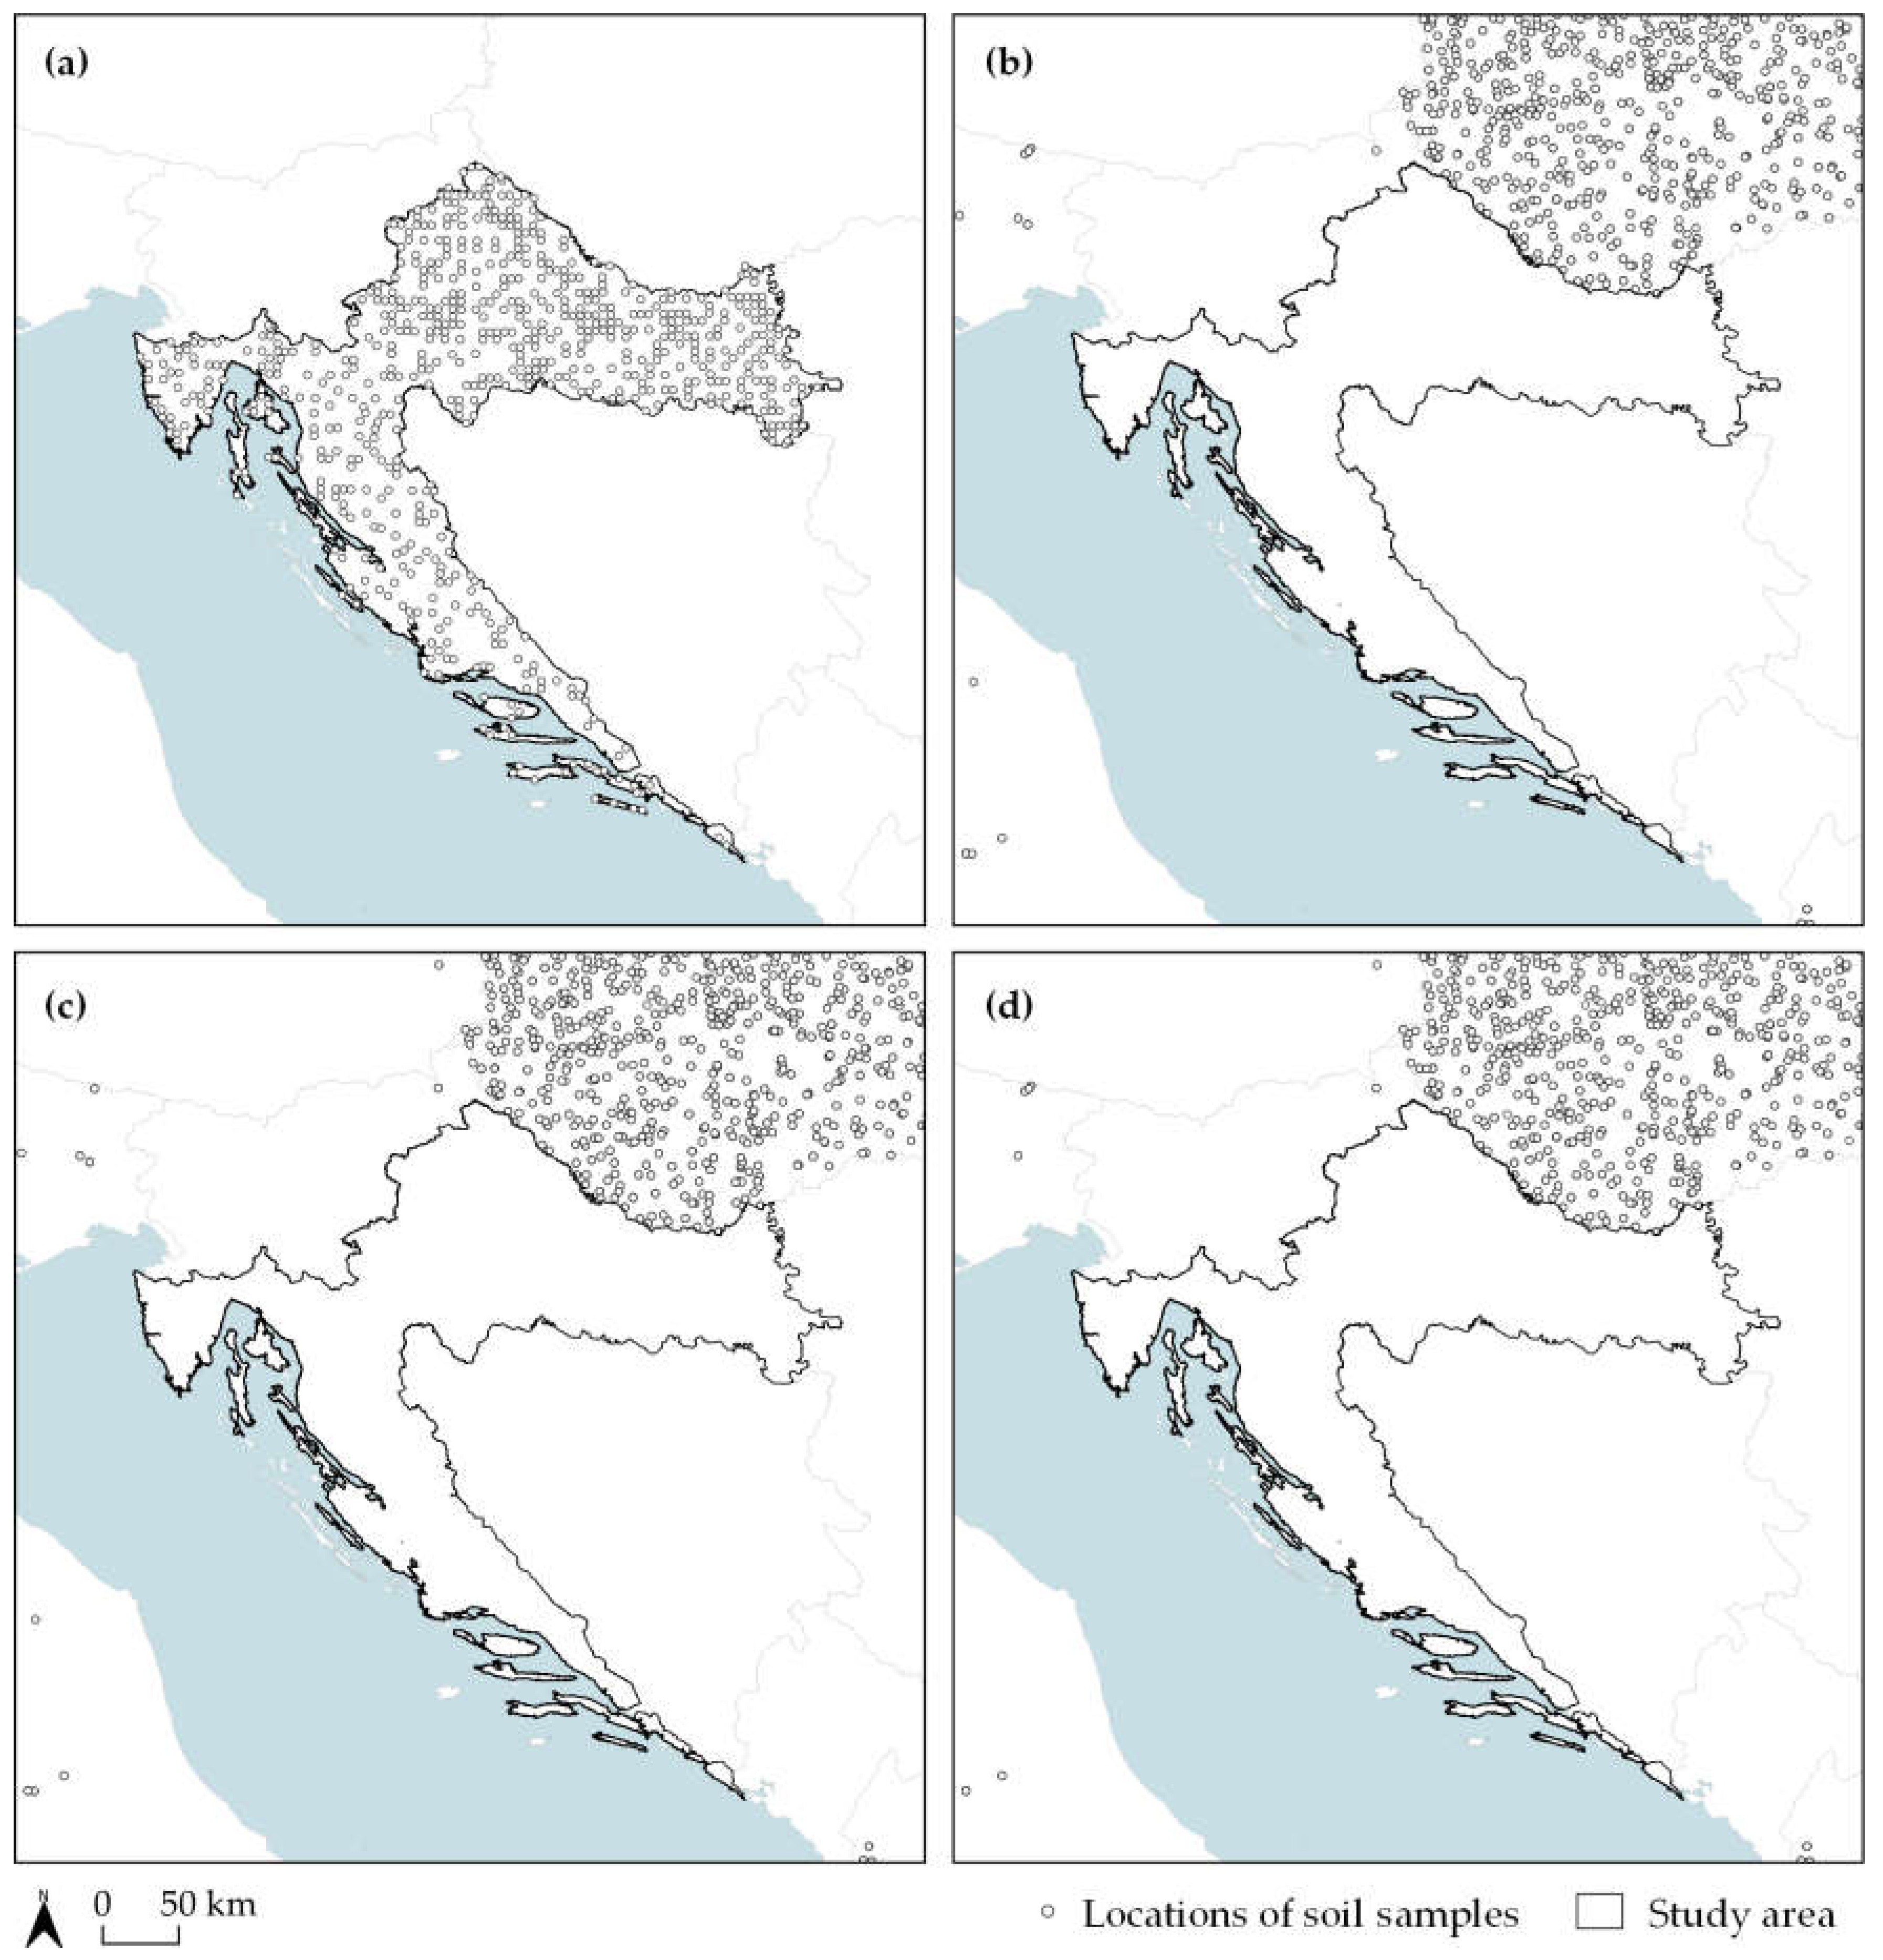
2.1. Study Area and Ground Truth Soil Sampling Data

The study area covered the Republic of Croatia, a 56,594 km2 area that includes three distinct biogeoregions: the Continental, Alpine, and Mediterranean regions (Figure 2). According to Corine 2018 Land Cover data, the terrestrial land cover classes are dominantly represented by forest and semi-natural areas (55.7%) and agricultural areas (40.1%), while artificial surfaces and wetlands cover 3.8% and 0.4%, respectively. Previous studies in Croatia noted the high heterogeneity of soil properties on a national level, including the components of soil texture [32]. Other soil properties, such as soil organic carbon, total nitrogen [33], and soil organic matter [34] yielded similar observations. Climate conditions are also very heterogeneous in the study area, ranging from a temperate climate with dry and hot summers to a cold climate with no dry season and cold summers, as per the Köppen–Geiger classification by Beck et al. [35] (Table 1, Figure 3).
The ground truth soil sampling data were acquired from the openly available web feature service (WFS) provided by the Ministry of Economy and Sustainable Development of the Republic of Croatia [36]. The field soil sampling was performed between April 2015 and October 2016 as a part of the national project “Change in soil carbon stocks and calculation of total nitrogen and soil organic carbon trends and C:N”. The soil sampling methodology was performed according to the “Soil Sampling Protocol to Certify the Changes of Organic Carbon Stock in Mineral Soils Of European Union” by the Joint Research Centre of the European Commission [37]. According to this protocol, soil samples were georeferenced using the global positioning system (GPS) with a positioning accuracy of a few meters and were distributed as point vector data. Each collected soil sample was collected as a composite of 25 soil sampling points within the sampling grid, representing the aggregated value of clay, silt, and sand soil contents in the specified proximity of each point displayed in Figure 2. A total of 686 soil samples at a 0–30 cm soil depth were filtered from the original 725 samples according to land cover classes which included agricultural areas, forests and seminatural areas, and wetlands as per the CORINE classification [38]. Soil samples collected from artificial surfaces were removed from the analysis as SoilGrids did not include soil data in these areas.

2.2. Acquiring and Preprocessing of SoilGrids Data

SoilGrids data were acquired from the Google Earth Engine SoilGrids 250m v2.0 Application Programming Interface (API) [39]. Clay, silt, and sand soil contents were acquired in the native 250 m spatial resolution and reprojected to WGS 84/Pseudo-Mercator projection (EPSG: 3857) and clipped to the study area. Each soil property was downloaded in 3 layers to match the soil depth of the ground truth data, with 0–5 cm, 5–15 cm, and 15–30 cm data. While SoilGrids provides more soil depth information, these layers were selected to match the 0–30 cm soil information from the ground truth data. The units of SoilGrids data were converted to the units of the ground truth data, as presented in Table 2. The harmonized preprocessed SoilGrids layers are displayed in Figure 3.
Figure 4 displays a comparison of the locations of the soil samples from the ground truth data with those used for SoilGrids creation according to the ISRIC World Soil Information Service (WoSIS) Soil Profile Database. It represented a data source of soil samples for the latest SoilGrids products evaluated in this study [24] and was downloaded from the webpage specified by the authors for clay [40], silt [41], and sand [42]. The WoSIS Soil Profile Database included zero soil samples in the study area for SoilGrids, so the ground truth data used in this study represent a fully independent dataset for its accuracy assessment. The temporal range of the field soil sampling from the WoSIS Soil Profile Database samples displayed in Figure 4 ranges from May 1963 to April 2009, but over 80% of them lacked temporal field sampling metadata. Therefore, it was assumed that the ground truth data also represented more recent soil sampling results in the study area.

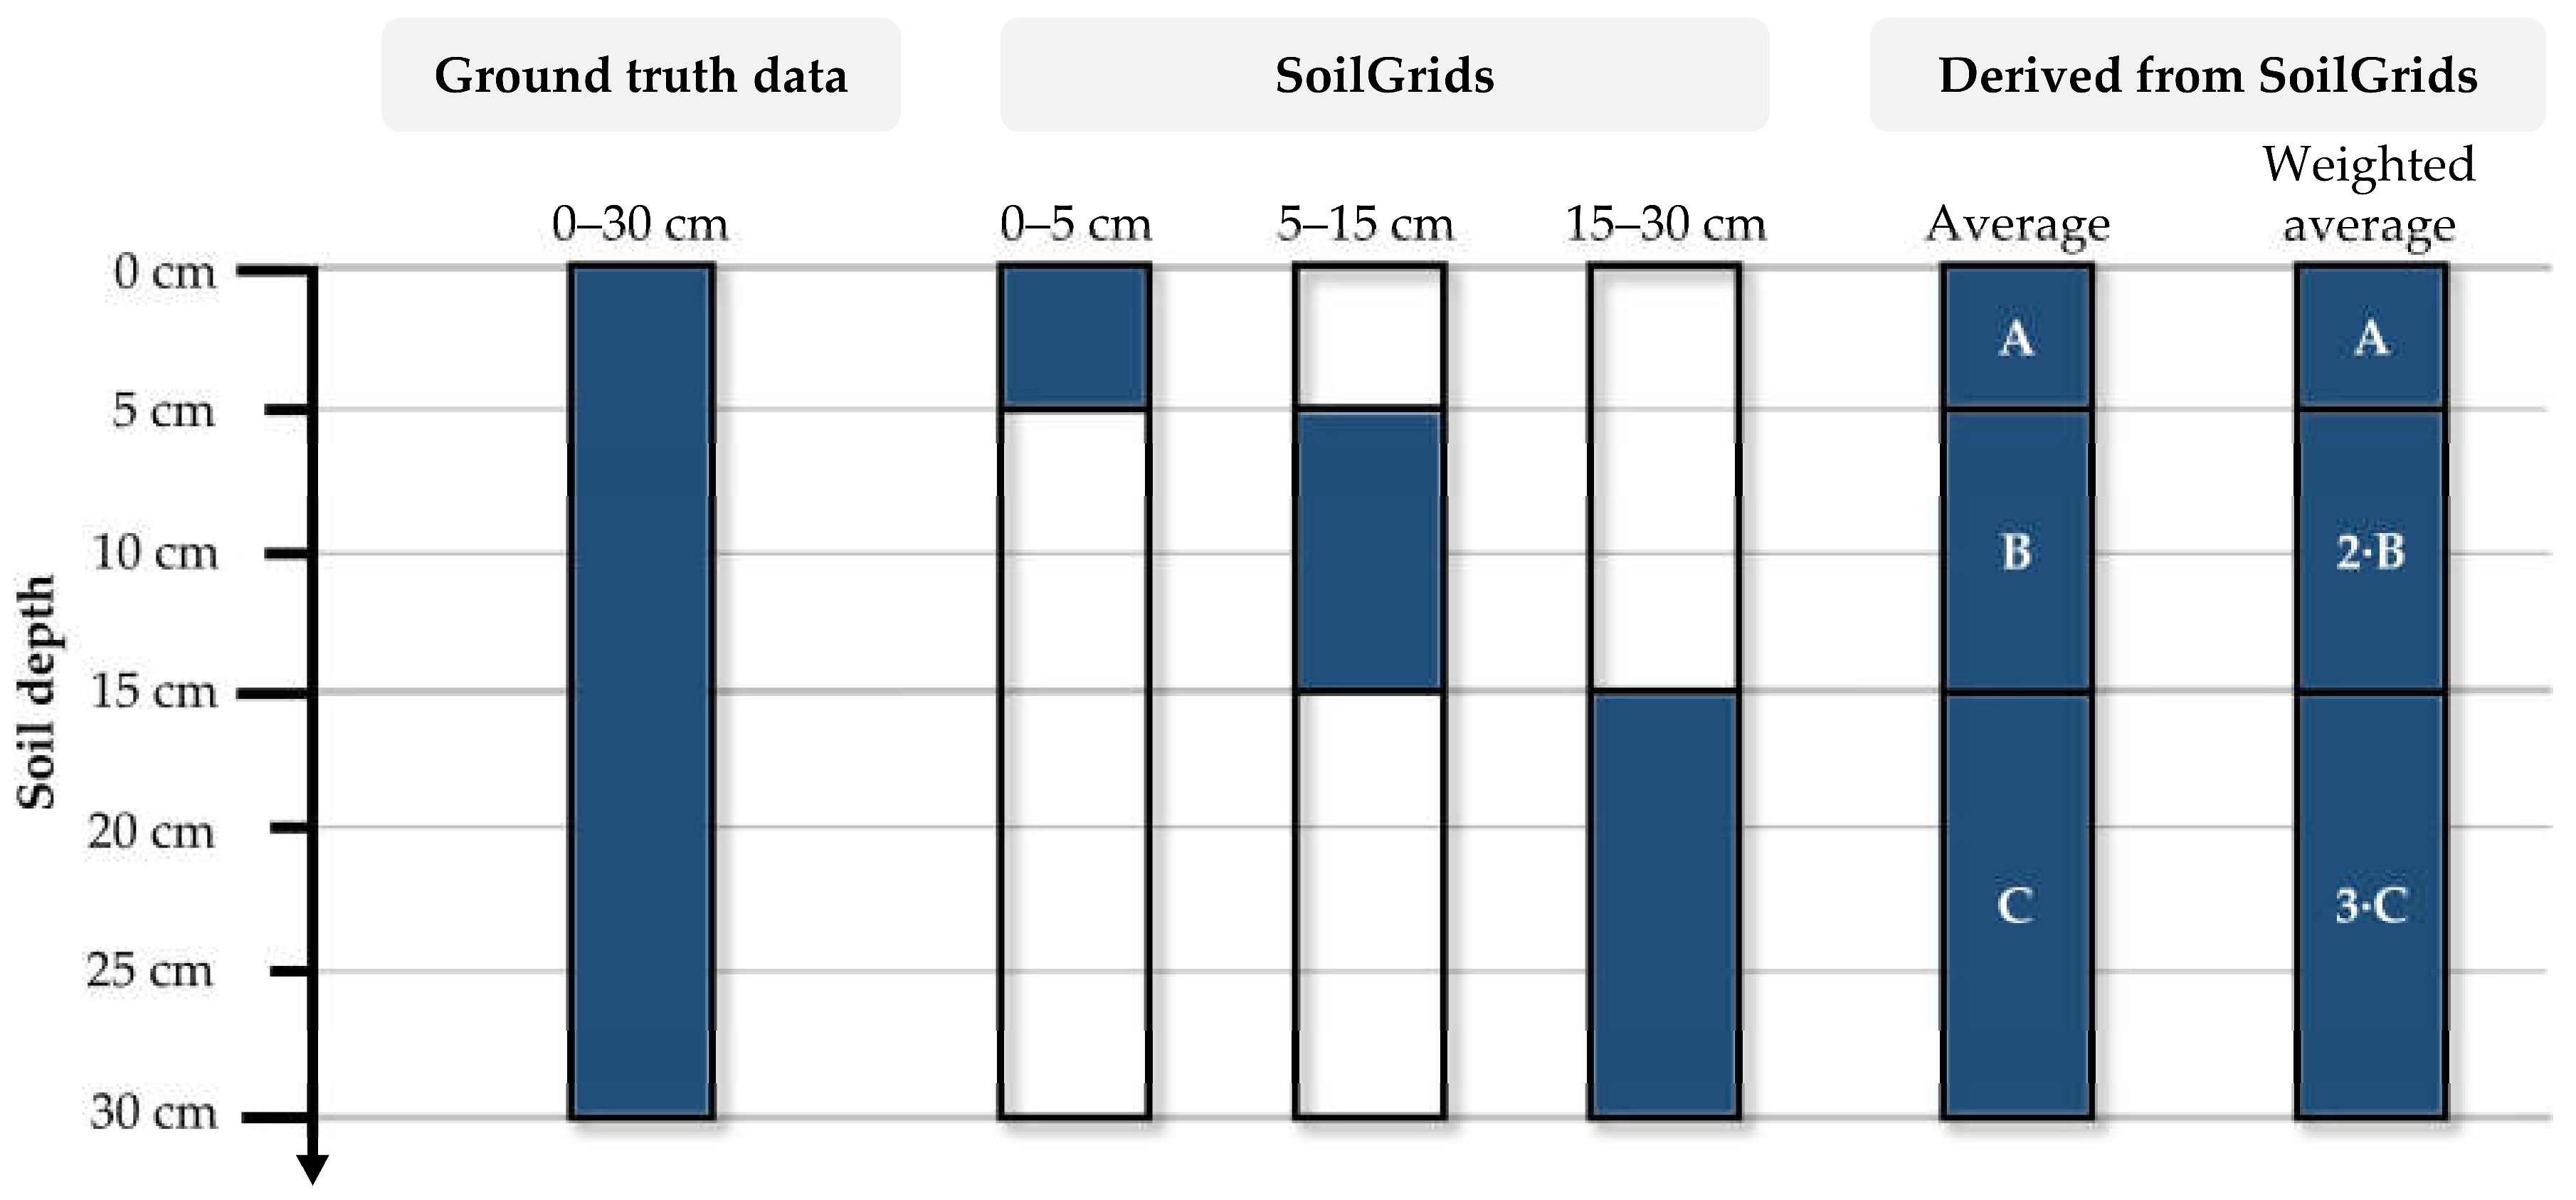
2.3. Accuracy Assessment of SoilGrids Based on the Ground Truth Soil Sampling Data
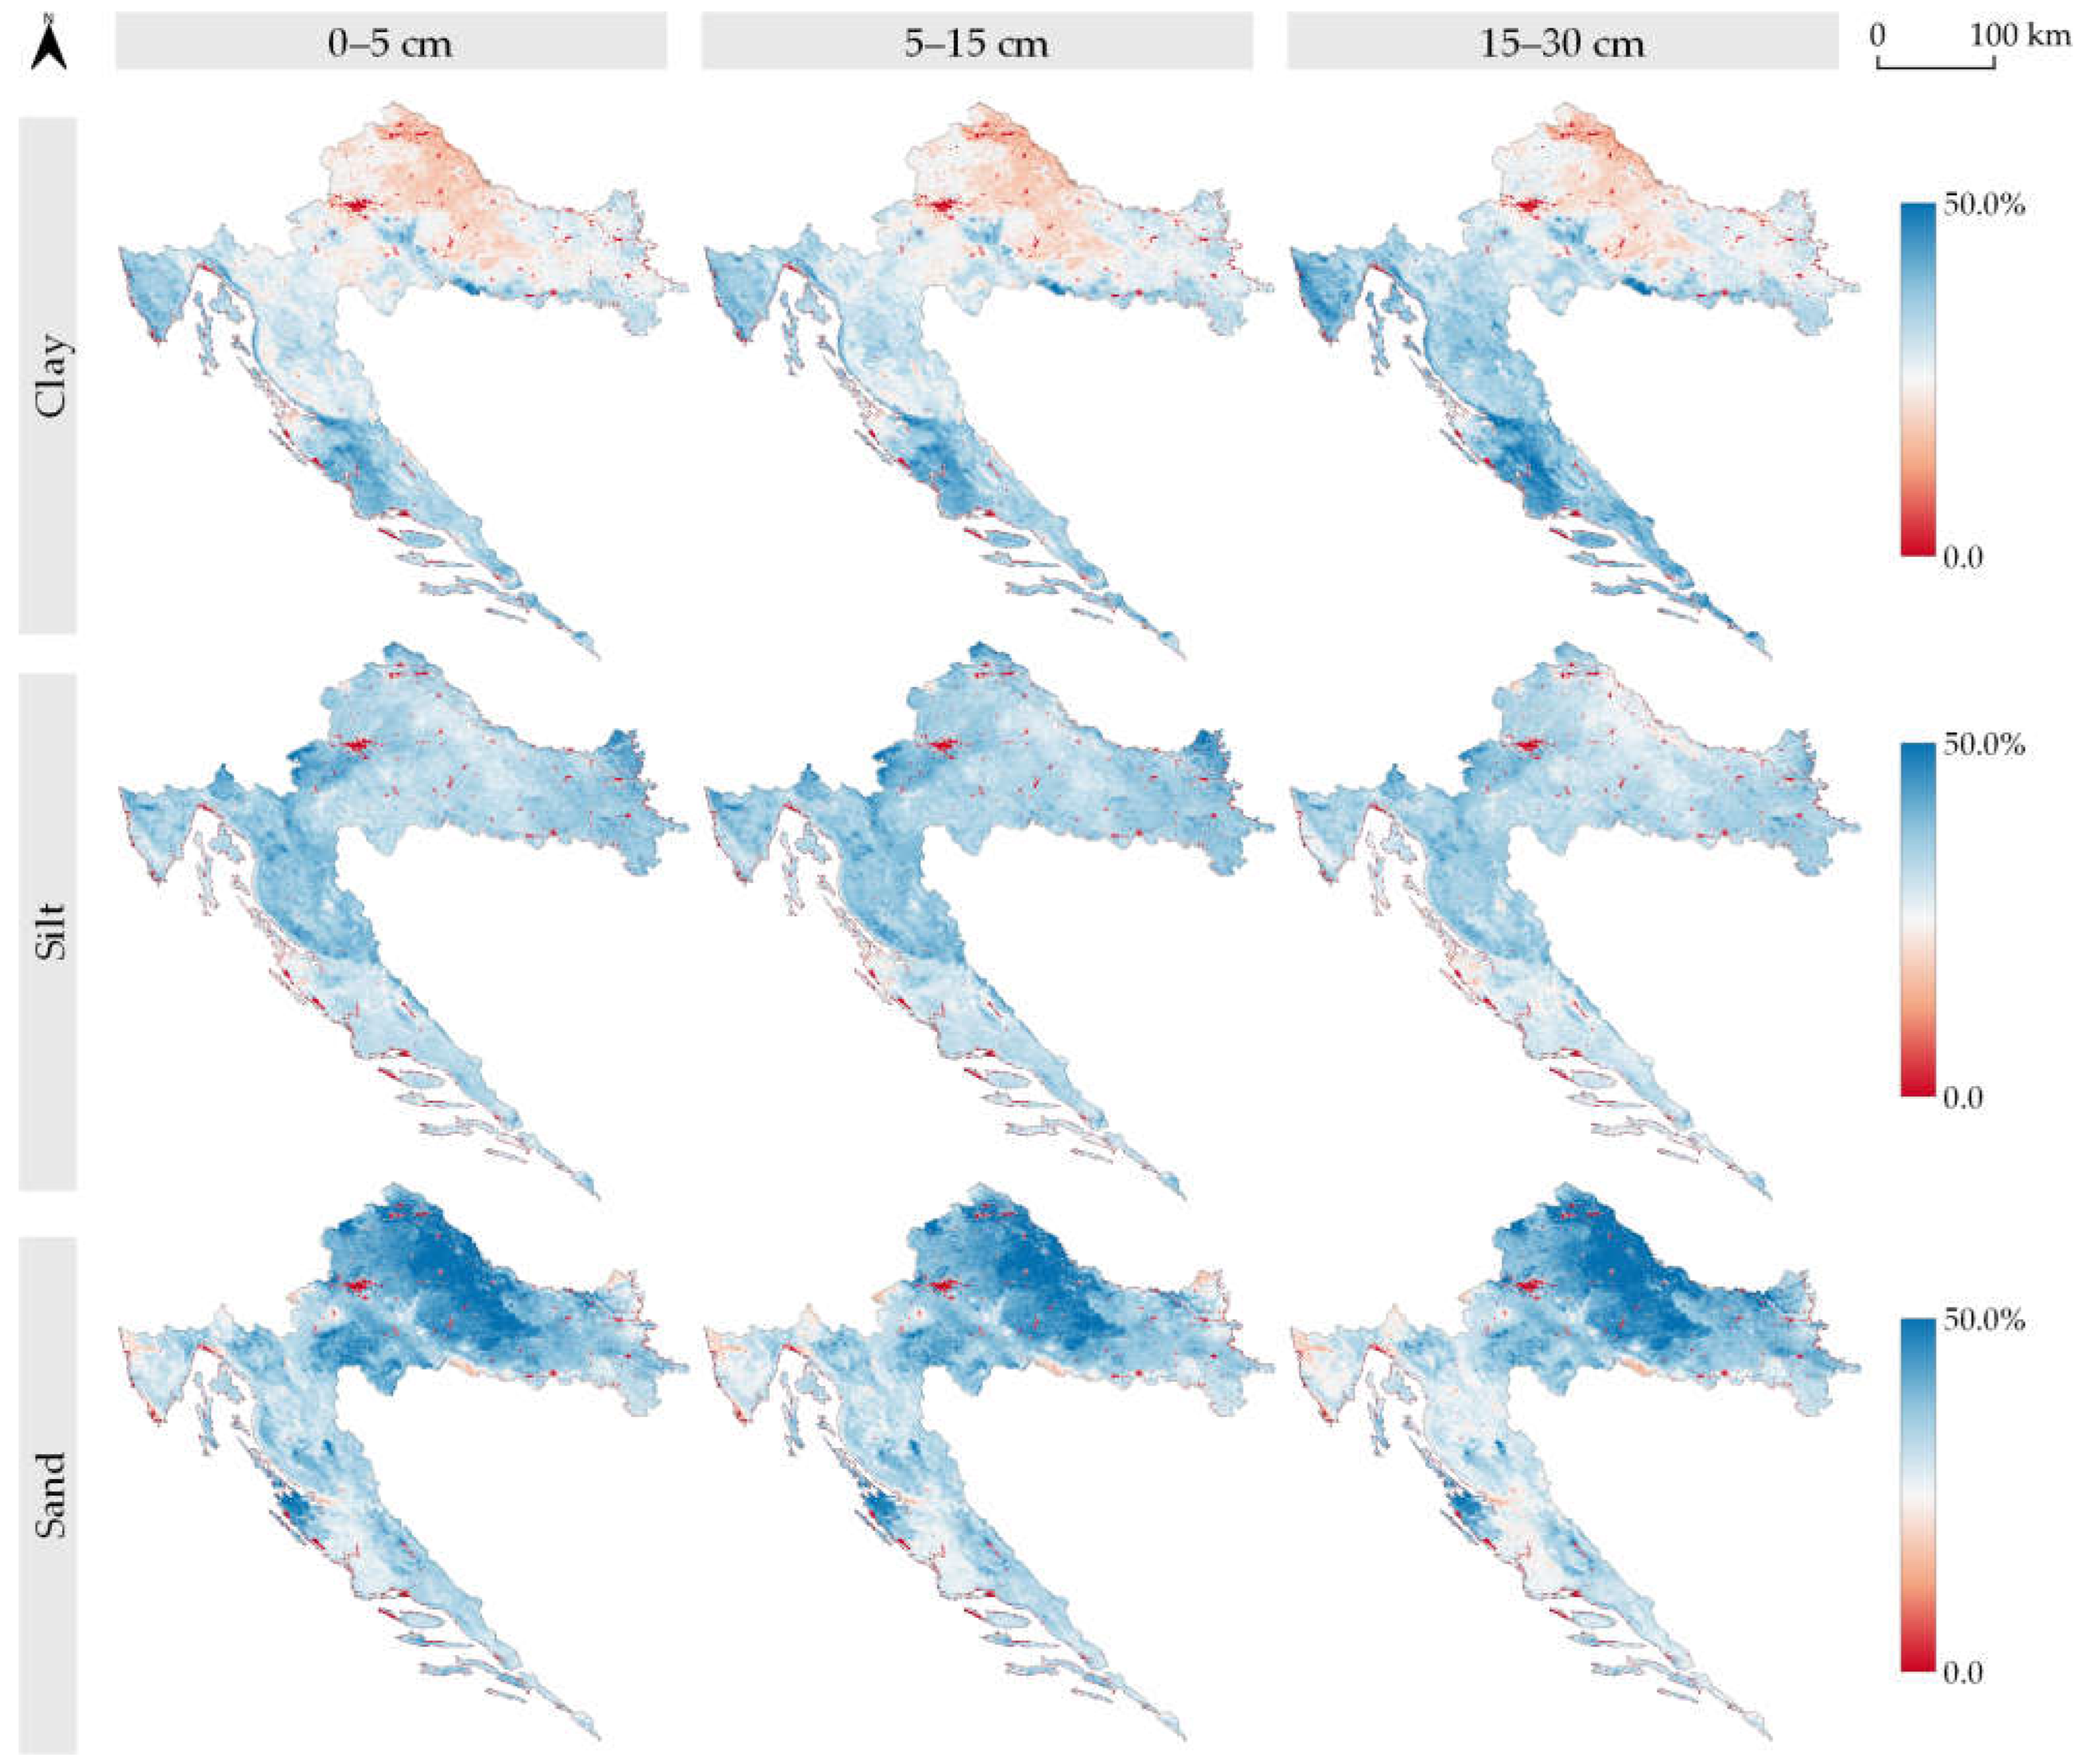
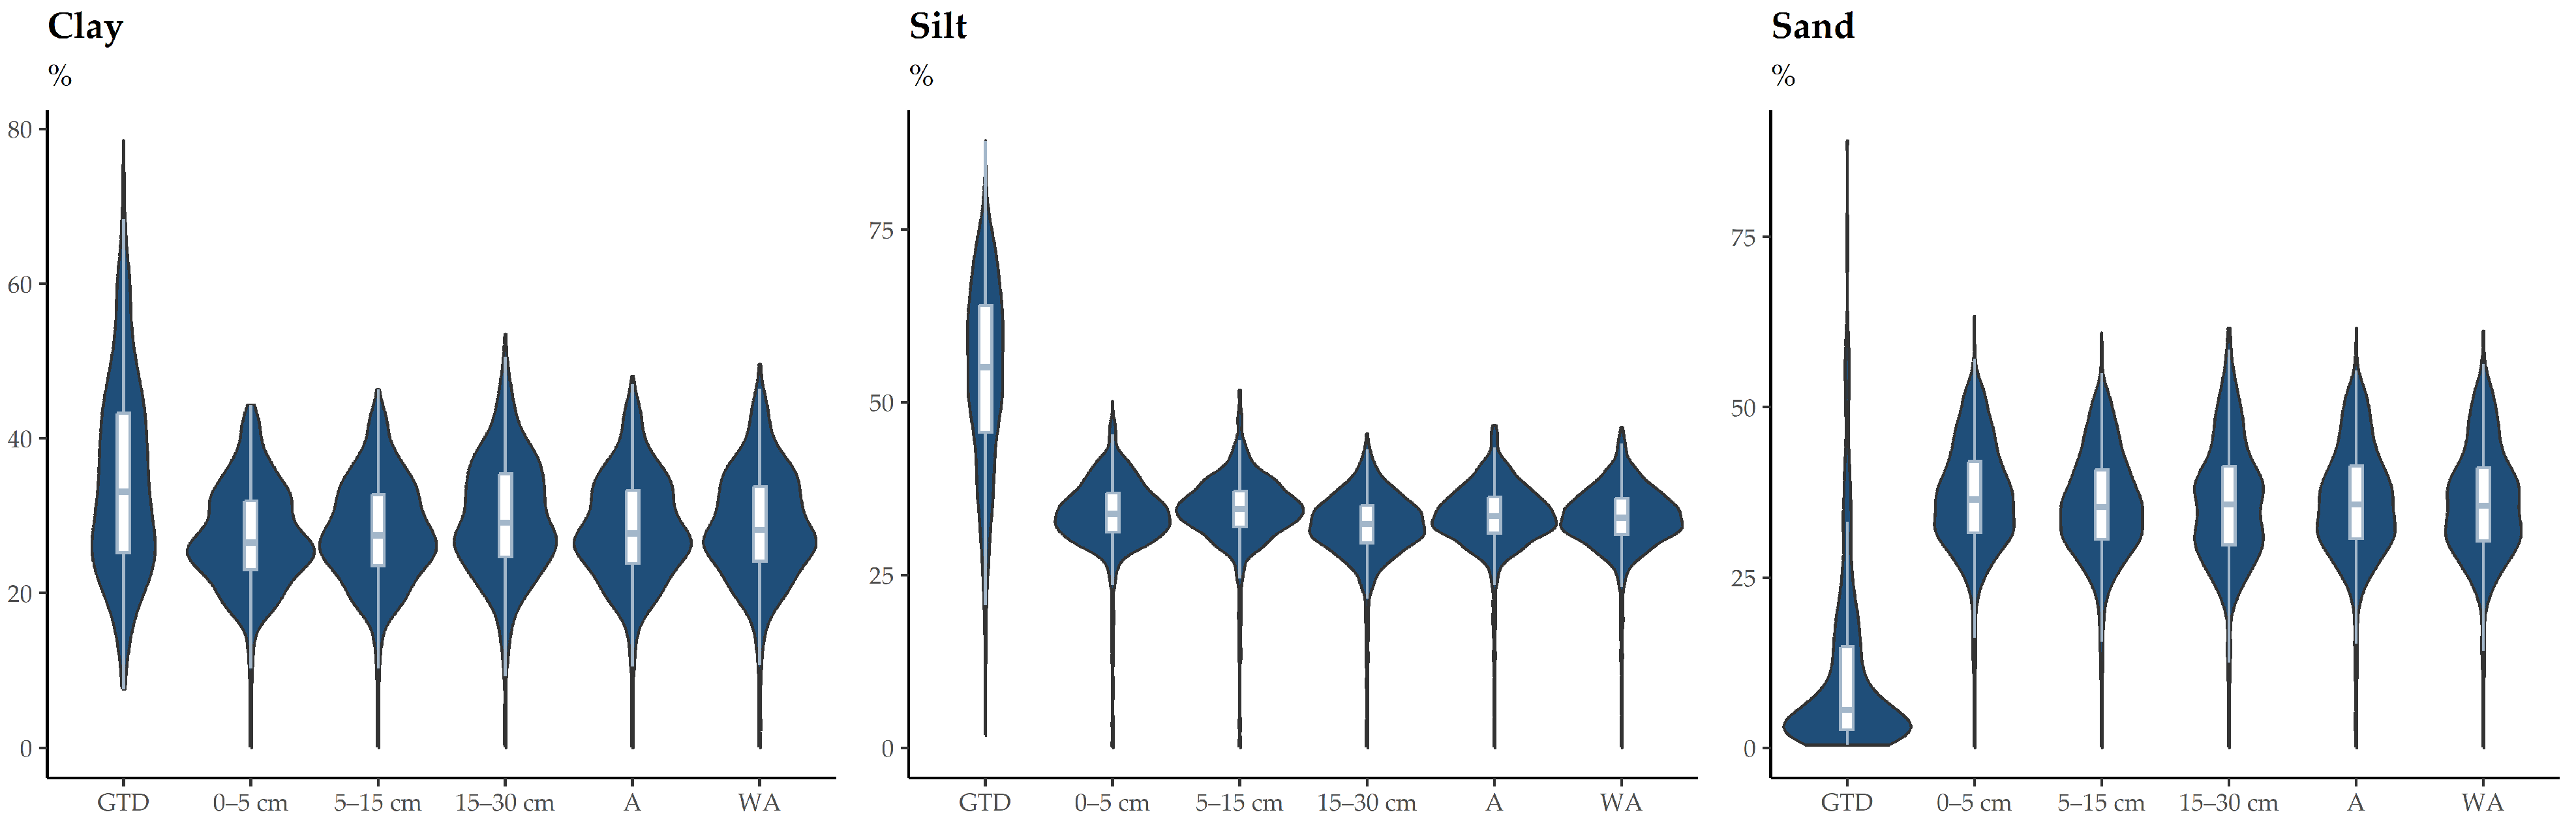
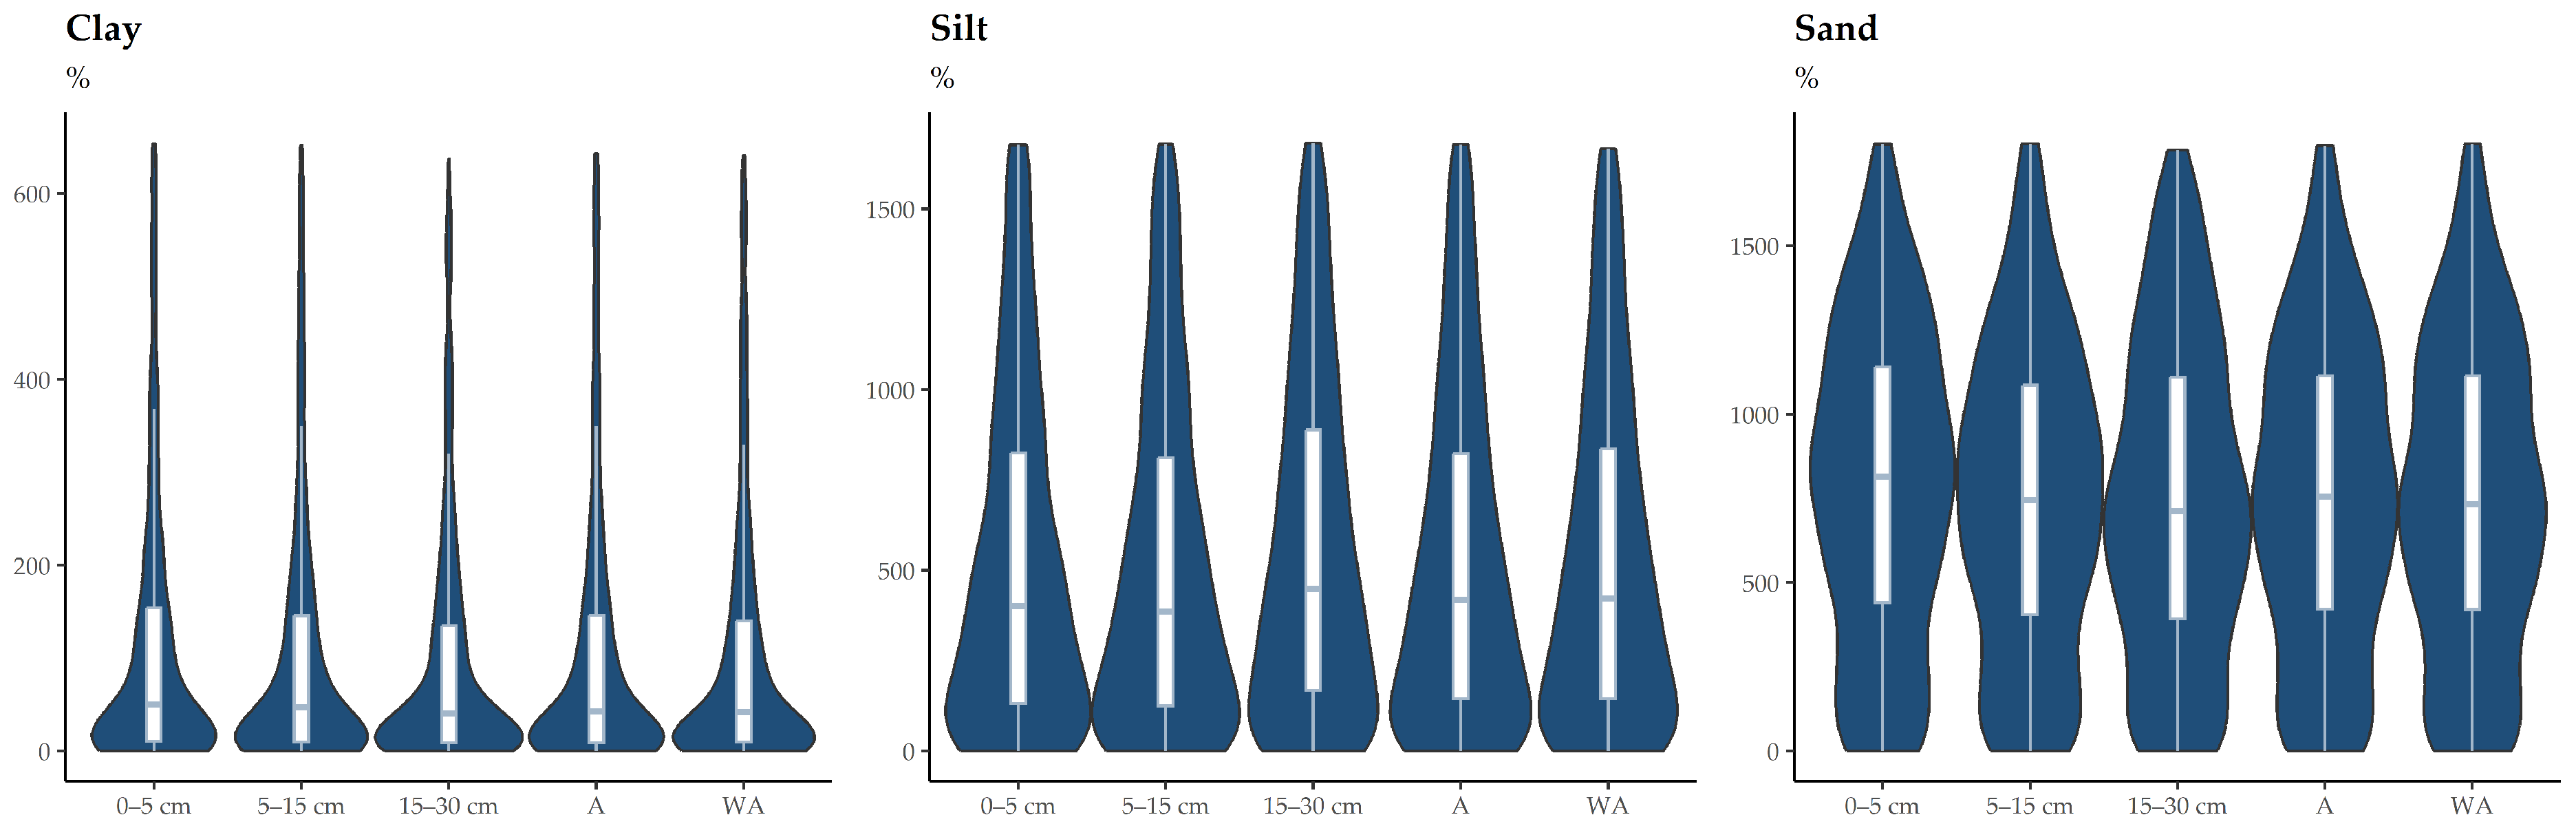
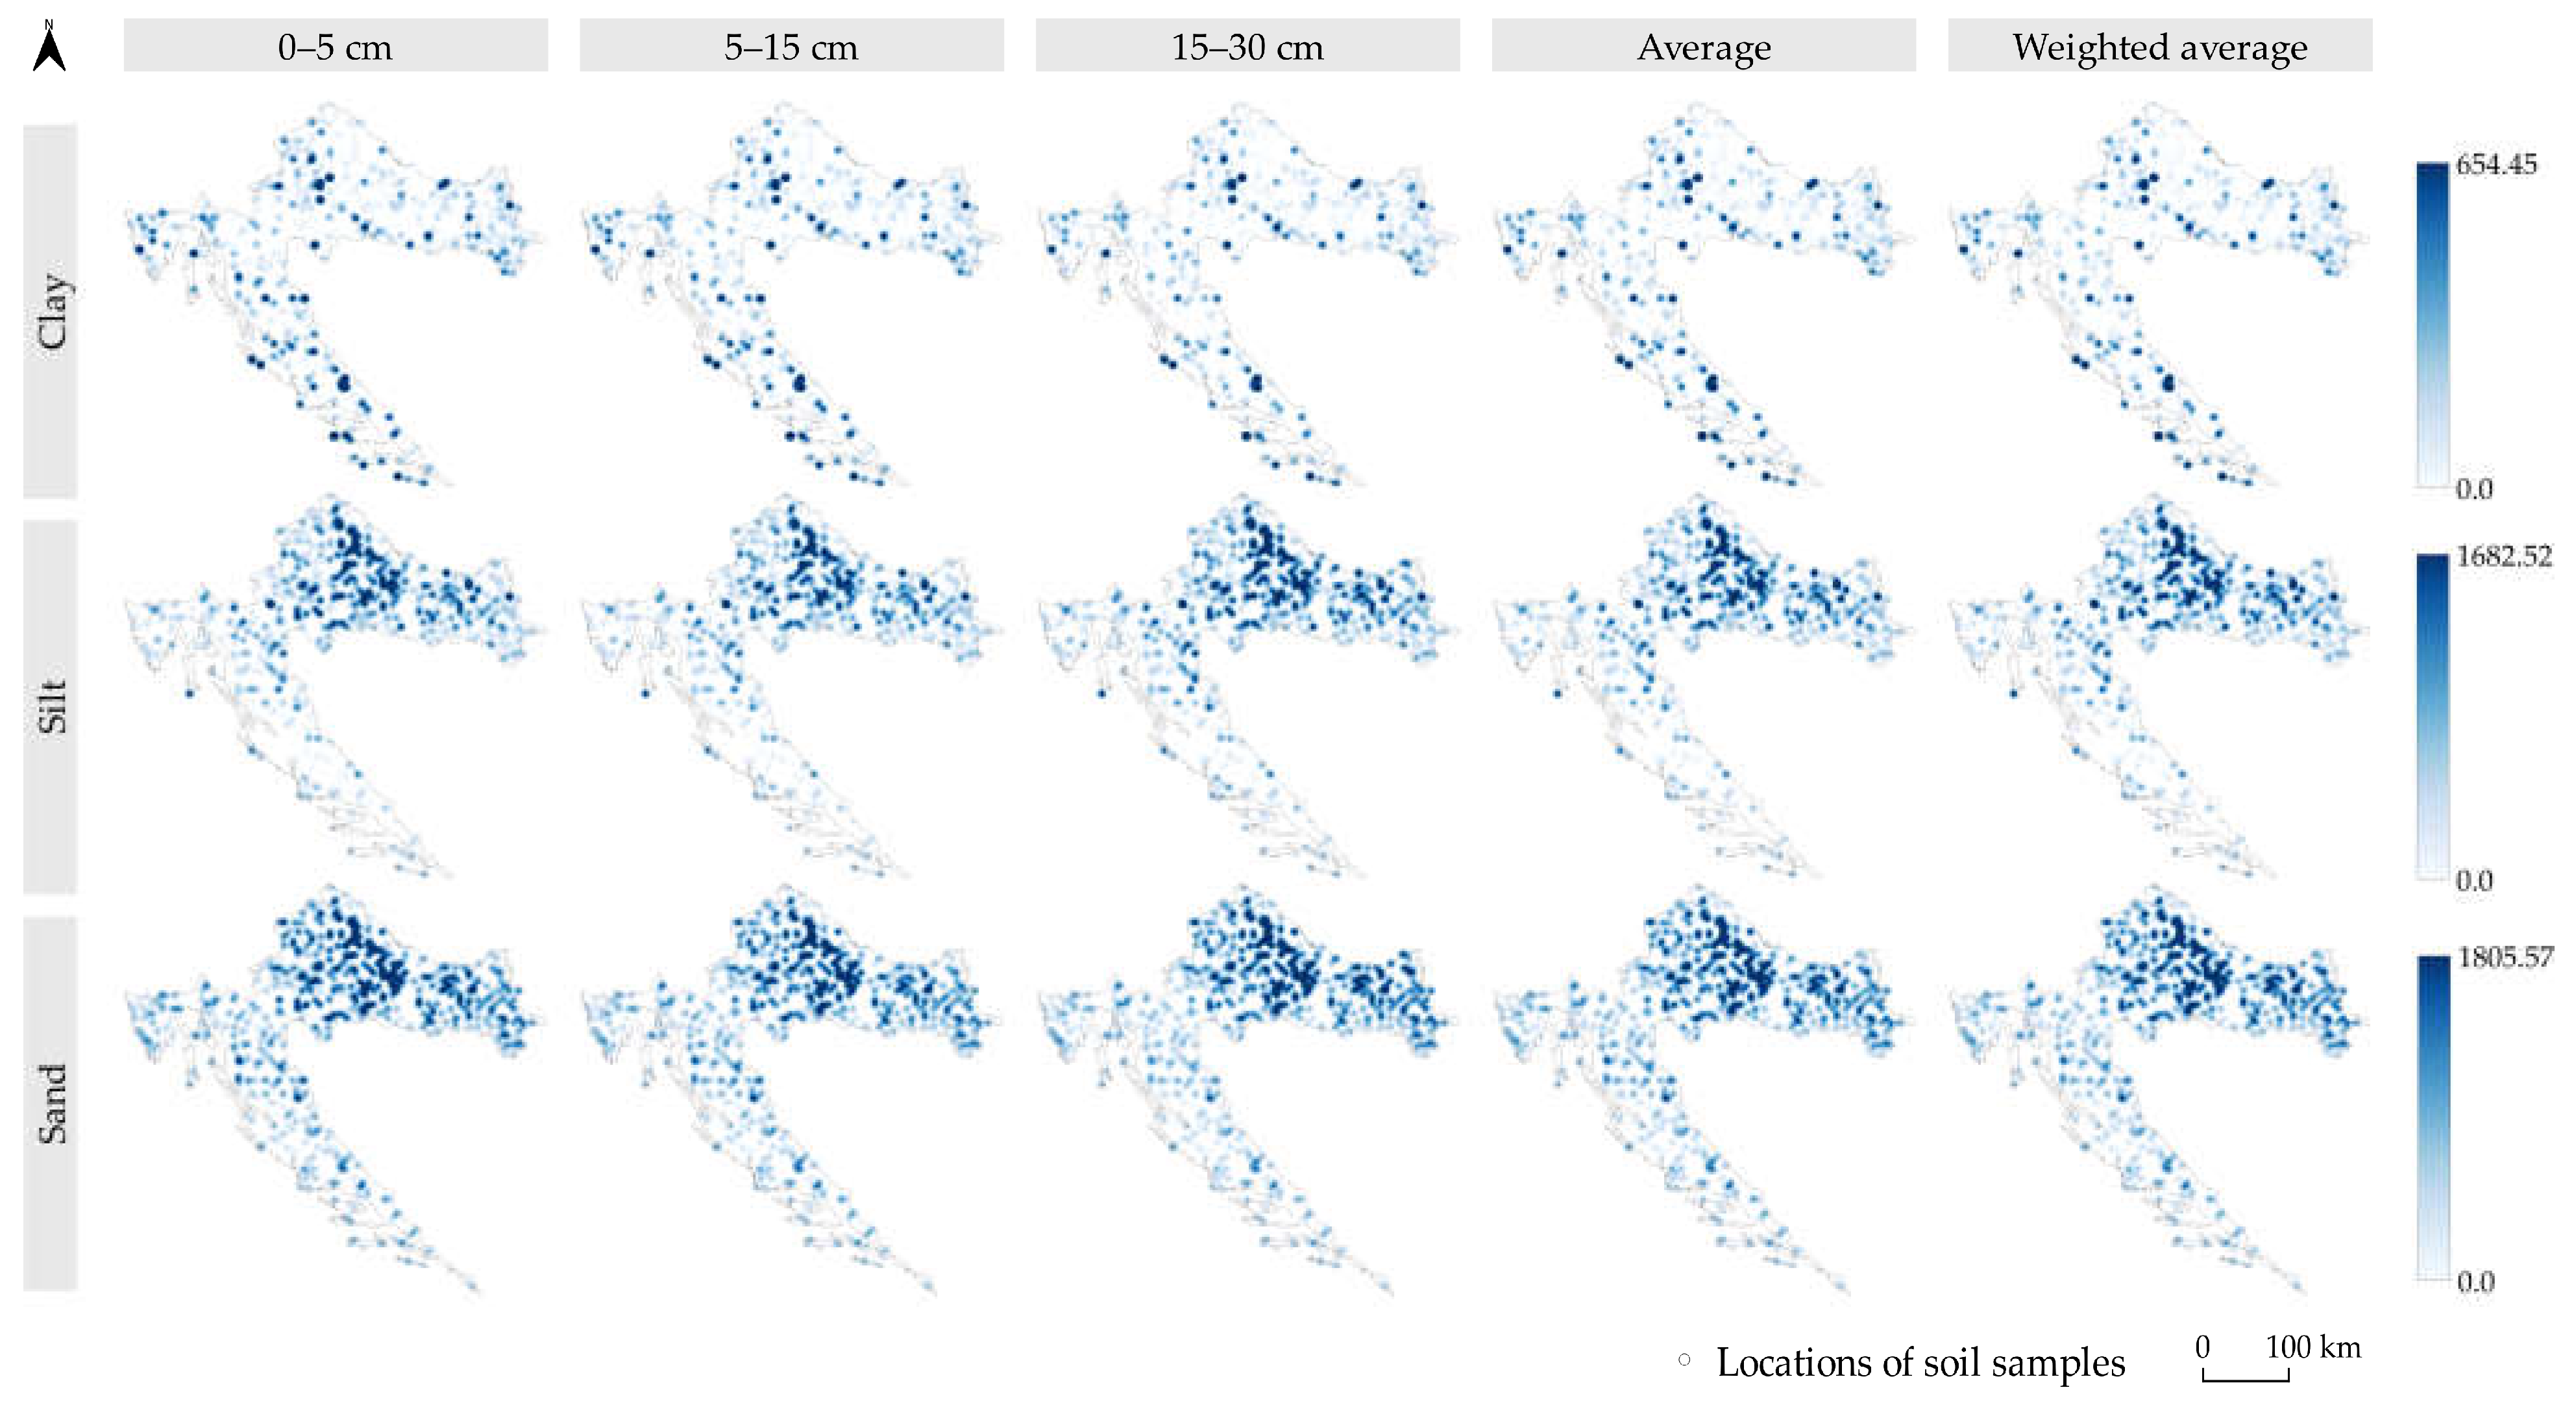
To minimize the effect of the unevenness of soil depths from the ground truth soil sampling data and SoilGrids layers, the accuracy assessment was performed according to 5 evaluated layers for each soil property (Figure 5): (1) 0–5 cm layer; (2) 5–15 cm layer; (3) 15–30 cm layer; (4) an average of 0–5 cm, 5–15 cm, and 15–30 cm data; and (5) a weighted average according to the coverage of the ground truth 0–30 cm soil depth, in which 0–5 cm data had a weight of 1, 5–15 cm data had a weight of 2, and 15–30 cm data had a weight of 3.
The three statistical metrics selected for the accuracy assessment were the coefficient of determination (R2), root-mean-square error (RMSE), and normalized RMSE (NRMSE), which are complementary metrics for the accuracy assessment of soil properties as they provide different aspects of accuracy [43,44]. The R2 provided an indication of the goodness of fit of the evaluated soil data, the RMSE provided information on the absolute magnitude of the errors, and the NRMSE provided a relative measure of the accuracy of the evaluated SoilGrids data. RMSE is sensitive to outliers, and it emphasizes large errors more than small errors, while NRMSE ensures that the RMSE metric is comparable across different soil properties [45]. Higher R2 values and lower RMSE and NRMSE values indicated a proportionally higher accuracy of the SoilGrids data according to the ground truth soil sampling data. The R2, RMSE, and NRMSE values for the accuracy assessment of the SoilGrids data according to the ground truth soil sampling data were calculated according to Equations (1)–(3):
R 2 = 1   -   1 n y i   -   y ^ i 2 1 n y i   -   y - i 2 ,
RMSE = 1 n ( y i   -   y ^ i ) 2 n ,
NRMSE = RMSE y - i ,
where y i is the ground truth soil sampling data, y ^ i is the evaluated SoilGrids data, y - i is the average of ground truth soil sampling data per soil parameter, and n is the number of ground truth soil samples.

3. Results

The medians and value ranges of the evaluated SoilGrids layers resulted in high variability in comparison with the ground truth soil sampling data. These are presented in violin plots (Figure 6) containing the density information about the ground truth data and evaluated SoilGrids rasters, as well as boxplots, which indicate the median, minimum, maximum, and first and third quartile values [46]. The median values based on the average of 3 SoilGrids layers per soil parameter differed from the medians of the ground truth data by 19.4%, 64.1%, and 84.5% for clay, silt, and sand, respectively. Moreover, the SoilGrids layers had much lower value ranges for the evaluated soil texture components, with a maximum average clay value of 48.04% (78.51% for the ground truth data) and a maximum average silt value of 46.62% (87.89% for the ground truth data). The values of the SoilGrids layers per soil texture component had similar value ranges regardless of the soil depth.
Based on the 686 ground truth soil samples, the SoilGrids layers had a low average accuracy represented as R2, which varied from 0.039 for silt and sand to 0.267 for clay (Table 3). The average NRMSE ranged from 0.362 for clay to 2.553 for sand soil content. Overall, the SoilGrids did not show a tendency for any individual native soil depth to be superior in terms of accuracy, while all soil parameters resulted in slightly higher accuracy for either the 5–15 cm or 15–30 cm layer. The average and weighted average only performed better for clay compared with the most accurate individual layers of evaluated soil parameters. The accuracy of the weighted average values was particularly less affected by the lower accuracy of the 0–5 cm data for silt in comparison with the 5–15 cm and 15–30 cm soil layers. The absolute accuracy represented by the RMSE and NRMSE values and the relative accuracy represented by R2 generally matched in terms of ranking the evaluated SoilGrids layers per soil parameter. A slight exception occurred for clay and sand, which had similar R2, RMSE, and NRMSE values for individual soil layers, but their mutual rankings in terms of absolute and relative accuracy were in disagreement. The accuracy assessment of the native SoilGrids layers according to the Köppen–Geiger climate classes and major CORINE Land Cover 2018 classes is presented in Appendix A. Overall, the Csb climate class resulted in the highest accuracy for all 3 evaluated soil parameters, but its coverage of 1.0% of the study area possibly skewed the results. Among other climate classes, consistently low accuracy was achieved for the temperate Csa class with hot and dry summers. The land cover classes had a minor effect on the accuracy per soil property, while no consistent effect was observed for their respective soil depth layers.
Figure 7 displays the value distributions of the square residuals according to the ground truth soil sampling data. All evaluated soil properties showed a very similar distribution of values across the soil depths, while the medians and value ranges per soil property only slightly differed. The spatial distributions of the square residuals according to the ground truth soil samples from which they were calculated are presented in Figure 8. The largest squared residuals for clay were observed at distinct locations in the entire study area, which was not related to the biogeoregions. The northern part of Croatia, dominantly present in the Continental biogeoregion, contained the largest residuals for silt and sand.

4. Discussion

The accuracy assessment of SoilGrids, as well as future potential soil parameter prediction products, can generally be conducted using cross-validation and independent validation. Out of the two, cross-validation’s accuracy is well documented as part of the scientific papers on SoilGrids 1km [17], SoilGrids 250m [18], and SoilGrids 250m v2.0 [24], of which the latter was evaluated in this study. This approach involved dividing the soil sampling data into training and test sets, using the training set to develop the SoilGrids model, and testing its accuracy using the test set. These soil sampling data sets were created by harmonizing the data from several national and international agencies [17], as comparable to the source of the independent ground truth soil sampling dataset used in this study. The first official SoilGrids product resulted in an amount of explained variation values ranging from 22.9% to 50.5%, based on the 5-fold cross-validation [17]. While this metric was based on the RMSE values, it included additional parameters for its calculation [47], which does not allow objective comparison with the accuracy assessment results from this study. However, the comparable metrics were calculated in SoilGrids 250m [18], which is also represented in the same spatial resolution as the products analyzed in this study. The results of repeated 10-fold cross-validation ranged from 0.635 to 0.834, represented by R2 for the soil properties evaluated in this study, which is significantly higher than the results from the independent evaluation in this study. The RMSE values for the physical soil parameters were in the range of 9.5–10.9, which is comparable to the accuracy results for clay in this study, while silt and sand had more than double the RMSE values of these. The 10-fold cross-validation accuracy assessment results for SoilGrids 250m v2.0 [24], which was evaluated in this study, had higher RMSE values for clay, silt, and sand in comparison with the previous version of SoilGrids. However, these results ranging from 13.0–18.0 are comparable to the results from this study, while silt and sand still performed with lower accuracy than the cross-validation results. Their results across the soil depths were mutually similar with slightly more accurate predictions in the top 0–5 cm soil layer, which is contrary to the observations in this study.
The independent validation involved the accuracy assessment of SoilGrids according to soil sampling data, which were not used for the prediction of soil properties as a part of SoilGrids’ creation. This approach provided an unbiased estimate of the accuracy of SoilGrids, and it is essential to ensure that the model is valid for use in the study area [48]. One of the critical factors in accuracy assessment is the selection of appropriate ground truth data [49]. The ground truth soil sampling data used for the validation of SoilGrids data in this study met the criteria of representativeness of the soil variability within the study area. They were also collected using a robust sampling design that accounts for the spatial variability of soil properties [36]. However, the main specificity of this study was that SoilGrids was created based on zero soil samples in the study area, according to the ISRIC WoSIS Soil Profile Database. Additionally, the minor limitation of the used approach was that the soil sampling depths of the ground truth data did not directly match the soil depths of the SoilGrids layers. The high heterogeneity of the landscape and climate classes in the study area, as well as the presence of three distinct biogeoregions, also potentially affected the accuracy assessment. The 250 m spatial resolution of SoilGrids likely disabled the representation of local variations in soil properties that were otherwise contained in the ground truth data. The cause of such challenges in the independent accuracy assessment of SoilGrids is the lack of a comprehensive global soil sampling program. Global soil sampling programs, such as the Global Soil Partnership [50], the Harmonized World Soil Database [51], and the SoilGrids program, provide valuable data for validation. The spatial coverage and density of soil sampling data are often limited, which can affect the accuracy of SoilGrids predictions, particularly in areas with high soil variability. Despite the great value of SoilGrids in a vast range of environmental studies, this study proves that the accuracy of its products is highly dependent on the presence of ground truth data in the study area.
The major challenge of achieving the uniform accuracy of SoilGrids products remains, as recent and independent soil sampling data are scarce, which is the reason this study is among the very few of its kind. SoilGrids has often been used in previous studies as an important soil covariate for total carbon stock estimates [52], soil mapping [25], and cropland suitability prediction [26], but its reliability has not been considered. Soil properties can vary significantly at different spatial scales, from small-scale variations within fields to large-scale variations across continents [53,54,55]. Therefore, the accuracy of SoilGrids predictions should be assessed at multiple spatial scales to ensure that it is suitable for various applications. In heterogeneous landscapes, such as Croatia, where soil properties can vary widely over short distances [56], the reliability of SoilGrids predictions may be a concern. Additionally, the temporal offset between the ground truth soil sampling data between 2015 and 2016 from the soil sampling of the training data used for SoilGrids’ creation could provide further discrepancy in future studies in evaluating chemical soil properties [57]. The potential upgrades of this study in terms of accuracy assessment according to soil types, biogeoregions, climate classes, and land cover classes could provide a more thorough insight into SoilGrids and potential similar future programs. Future studies will also aim to perform digital soil mapping of physical soil parameters using ground truth soil sampling data on a national level. This will likely provide a supplement to SoilGrids for areas with existing soil samples not included in the training of SoilGrids, as was the case in Croatia.

5. Conclusions

The results of the SoilGrids accuracy evaluation in Croatia based on independent ground truth soil sample data show a low level of accuracy for all three evaluated components of soil texture. Despite low resulting R2 values, the RMSE values were similar to those of the cross-validation as part of the SoilGrids creation process. The main feature of this validation was that SoilGrids used zero soil samples in the study area, based on the ISRIC WoSIS Soil Profile Database. This implies that a similar accuracy for soil texture components in the 0–30 cm soil layer from SoilGrids can be expected in other study areas that were sparsely represented in soil samples during the training process and have a high heterogeneity in terms of landscape and climate properties. Moreover, future global mapping initiatives based on environmental data might encounter similar unevenness in terms of mapping accuracy in areas sparsely represented in the ground truth data. Additionally, the time frames of the field sampling of the ground truth data and data used to create SoilGrids did not match, as the ground truth data represented significantly more recent field data. This study minimized this potential problem by using the most recent official ground truth soil sampling data in Croatia, as well as the most recent SoilGrids data. The minor limitation of this study was a minor discrepancy in the soil sampling depths of the ground truth data (0–30 cm) and the native soil depth of the SoilGrids layers, which were segmented into 0–5 cm, 5–15 cm, and 15–30 cm soil depths. Finally, due to the high heterogeneity of the landscape, climate, and biogeoregions in the study area, the variability in soil texture components in Croatia likely could not be contained in the globally trained SoilGrids data at a 250 m spatial resolution.
Despite a few limitations, this study represents an important contribution to the very few studies that have evaluated the accuracy of SoilGrids using independent soil sampling data. The proposed approach of evaluating SoilGrids in various study areas globally, as well as for similar global mapping projects, can be systematically performed with the sole requirement of independent and reliable ground truth data. SoilGrids currently represents the most comprehensive global open-source soil data, and its reliability affects scientific studies in several environmental disciplines. With respect to the SoilGrids accuracy assessment results from this study and their potential limitations, further studies are needed to provide a reliable and independent conclusion on SoilGrids’s accuracy in more locations, globally. Besides an independent validation of SoilGrids in study areas with varying densities of soil samples from the ISRIC WoSIS Soil Profile Database, the inclusion of soil properties from deeper soil layers will likely aid in developing a more complete knowledge of the accuracy of SoilGrids and similar future initiatives.

Author Contributions

Conceptualization, D.R.; methodology, D.R.; software, D.R.; validation, D.R., M.J., I.R. and I.P.; formal analysis, M.J., F.D., R.M. and I.P.; investigation, D.R.; resources, D.R.; data curation, D.R.; writing—original draft preparation, D.R.; writing—review and editing, D.R., M.J., I.R., F.D., R.M. and I.P.; visualization, D.R.; supervision, M.J. and I.P.; project administration, M.J.; funding acquisition, D.R., M.J. and I.P. All authors have read and agreed to the published version of the manuscript.

Funding

This research received no external funding.

Data Availability Statement

Publicly available datasets were analyzed in this study. These data can be found at https://data.europa.eu/data/datasets/a89e910c-cfd1-444e-9fbe-12e929dba19a?locale=en (accessed on 11 April 2023).

Acknowledgments

This work was supported by the Faculty of Agrobiotechnical Sciences Osijek as part of the scientific project ‘AgroGIT—technical and technological crop production systems, GIS and environment protection’.

Conflicts of Interest

The authors declare no conflict of interest.

Appendix A

Table A1. The accuracy assessment of native SoilGrids layers per Köppen–Geiger climate classes in the study area according to Beck et al. [35].
Soil PropertyStatistical MetricSoil LayerCsaCsbCfaCfbDfb
ClayR20–5 cm0.0090.5720.3540.1380.247
5–15 cm0.0080.4560.3440.1260.251
15–30 cm0.0140.8130.3370.1270.248
RMSE0–5 cm12.4024.24310.61810.9439.511
5–15 cm12.4134.78410.69611.0209.489
15–30 cm12.3712.80610.75211.0179.507
SiltR20–5 cm0.0260.4780.0100.1290.000
5–15 cm0.0240.4490.0140.1310.000
15–30 cm0.0120.5960.0190.1650.000
RMSE0–5 cm11.0044.62113.46912.48112.159
5–15 cm11.0174.74913.44212.46912.160
15–30 cm11.0804.06713.40912.21812.160
SandR20–5 cm0.0200.4160.0140.0940.078
5–15 cm0.0220.5360.0120.0910.070
15–30 cm0.0300.2380.0130.0740.090
RMSE0–5 cm16.3470.66712.74211.13112.994
5–15 cm16.3330.59512.75311.14413.049
15–30 cm16.2640.76212.74911.24812.907
Csa: temperate, dry summers, and hot summers; Csb: temperate, dry summers, and warm summers; Cfa: temperate, no dry season, and hot summers; Cfb: temperate, no dry season, and warm summers; Dfb: cold, no dry season, and warm summers.
Table A2. The accuracy assessment of native SoilGrids layers per major CORINE Land Cover 2018 classes in the study area.
Soil PropertyStatistical MetricSoil LayerAgricultural AreasForests and Seminatural Areas
ClayR20–5 cm0.3030.271
5–15 cm0.3070.256
15–30 cm0.2910.262
RMSE0–5 cm9.88610.862
5–15 cm9.85710.971
15–30 cm9.97510.927
SiltR20–5 cm0.0200.049
5–15 cm0.0250.055
15–30 cm0.0320.049
RMSE0–5 cm13.90112.375
5–15 cm13.86812.333
15–30 cm13.81612.370
SandR20–5 cm0.0280.080
5–15 cm0.0270.073
15–30 cm0.0300.087
RMSE0–5 cm13.19612.863
5–15 cm13.20312.909
15–30 cm13.18212.814

References

  1. Piikki, K.; Söderström, M. Digital Soil Mapping of Arable Land in Sweden—Validation of Performance at Multiple Scales. Geoderma 2019, 352, 342–350. [Google Scholar] [CrossRef]
  2. Harden, J.W.; Hugelius, G.; Ahlström, A.; Blankinship, J.C.; Bond-Lamberty, B.; Lawrence, C.R.; Loisel, J.; Malhotra, A.; Jackson, R.B.; Ogle, S.; et al. Networking Our Science to Characterize the State, Vulnerabilities, and Management Opportunities of Soil Organic Matter. Glob. Chang. Biol. 2018, 24, e705–e718. [Google Scholar] [CrossRef] [PubMed]
  3. Žížala, D.; Minařík, R.; Skála, J.; Beitlerová, H.; Juřicová, A.; Reyes Rojas, J.; Penížek, V.; Zádorová, T. High-Resolution Agriculture Soil Property Maps from Digital Soil Mapping Methods, Czech Republic. CATENA 2022, 212, 106024. [Google Scholar] [CrossRef]
  4. Xie, H.; Huang, Y.; Chen, Q.; Zhang, Y.; Wu, Q. Prospects for Agricultural Sustainable Intensification: A Review of Research. Land 2019, 8, 157. [Google Scholar] [CrossRef]
  5. Jurišić, M.; Radočaj, D.; Plaščak, I.; Rapčan, I. A Comparison of Precise Fertilization Prescription Rates to a Conventional Approach Based on the Open Source Gis Software. Poljoprivreda 2021, 27, 52–59. [Google Scholar] [CrossRef]
  6. Alewell, C.; Ringeval, B.; Ballabio, C.; Robinson, D.A.; Panagos, P.; Borrelli, P. Global Phosphorus Shortage Will Be Aggravated by Soil Erosion. Nat. Commun. 2020, 11, 4546. [Google Scholar] [CrossRef]
  7. Amelung, W.; Bossio, D.; de Vries, W.; Kögel-Knabner, I.; Lehmann, J.; Amundson, R.; Bol, R.; Collins, C.; Lal, R.; Leifeld, J.; et al. Towards a Global-Scale Soil Climate Mitigation Strategy. Nat. Commun. 2020, 11, 5427. [Google Scholar] [CrossRef]
  8. Tang, H.; Liu, Y.; Li, X.; Muhammad, A.; Huang, G. Carbon Sequestration of Cropland and Paddy Soils in China: Potential, Driving Factors, and Mechanisms. Greenh. Gases Sci. Technol. 2019, 9, 872–885. [Google Scholar] [CrossRef]
  9. Bardgett, R.D.; Bullock, J.M.; Lavorel, S.; Manning, P.; Schaffner, U.; Ostle, N.; Chomel, M.; Durigan, G.; Fry, E.L.; Johnson, D.; et al. Combatting Global Grassland Degradation. Nat. Rev. Earth Environ. 2021, 2, 720–735. [Google Scholar] [CrossRef]
  10. Zhao, Y.; Liu, Z.; Wu, J. Grassland Ecosystem Services: A Systematic Review of Research Advances and Future Directions. Landsc. Ecol. 2020, 35, 793–814. [Google Scholar] [CrossRef]
  11. Jurišić, M.; Radočaj, D.; Plaščak, I.; Rapčan, I. A UAS and Machine Learning Classification Approach to Suitability Prediction of Expanding Natural Habitats for Endangered Flora Species. Remote Sens. 2022, 14, 3054. [Google Scholar] [CrossRef]
  12. Vasu, D.; Srivastava, R.; Patil, N.G.; Tiwary, P.; Chandran, P.; Kumar Singh, S. A Comparative Assessment of Land Suitability Evaluation Methods for Agricultural Land Use Planning at Village Level. Land Use Policy 2018, 79, 146–163. [Google Scholar] [CrossRef]
  13. Radočaj, D.; Jurišić, M.; Antonić, O.; Šiljeg, A.; Cukrov, N.; Rapčan, I.; Plaščak, I.; Gašparović, M. A Multiscale Cost–Benefit Analysis of Digital Soil Mapping Methods for Sustainable Land Management. Sustainability 2022, 14, 12170. [Google Scholar] [CrossRef]
  14. Arrouays, D.; McBratney, A.; Bouma, J.; Libohova, Z.; Richer-de-Forges, A.C.; Morgan, C.L.S.; Roudier, P.; Poggio, L.; Mulder, V.L. Impressions of Digital Soil Maps: The Good, the Not so Good, and Making Them Ever Better. Geoderma Reg. 2020, 20, e00255. [Google Scholar] [CrossRef]
  15. Bouma, J.; Montanarella, L.; Evanylo, G. The Challenge for the Soil Science Community to Contribute to the Implementation of the UN Sustainable Development Goals. Soil Use Manag. 2019, 35, 538–546. [Google Scholar] [CrossRef]
  16. Owens, P.R.; Dorantes, M.J.; Fuentes, B.A.; Libohova, Z.; Schmidt, A. Taking Digital Soil Mapping to the Field: Lessons Learned from the Water Smart Agriculture Soil Mapping Project in Central America. Geoderma Reg. 2020, 22, e00285. [Google Scholar] [CrossRef]
  17. Hengl, T.; de Jesus, J.M.; MacMillan, R.A.; Batjes, N.H.; Heuvelink, G.B.M.; Ribeiro, E.; Samuel-Rosa, A.; Kempen, B.; Leenaars, J.G.B.; Walsh, M.G.; et al. SoilGrids1 km—Global Soil Information Based on Automated Mapping. PLoS ONE 2014, 9, e105992. [Google Scholar] [CrossRef]
  18. Hengl, T.; de Jesus, J.M.; Heuvelink, G.B.M.; Gonzalez, M.R.; Kilibarda, M.; Blagotić, A.; Shangguan, W.; Wright, M.N.; Geng, X.; Bauer-Marschallinger, B.; et al. SoilGrids250m: Global Gridded Soil Information Based on Machine Learning. PLoS ONE 2017, 12, e0169748. [Google Scholar] [CrossRef]
  19. de Sousa, L.M.; Poggio, L.; Batjes, N.H.; Heuvelink, G.B.; Kempen, B.; Riberio, E.; Rossiter, D. SoilGrids 2.0: Producing Quality-Assessed Soil Information for the Globe. SOIL Discuss. 2020, 1–37. [Google Scholar] [CrossRef]
  20. Bünemann, E.K.; Bongiorno, G.; Bai, Z.; Creamer, R.E.; De Deyn, G.; de Goede, R.; Fleskens, L.; Geissen, V.; Kuyper, T.W.; Mäder, P.; et al. Soil Quality—A Critical Review. Soil Biol. Biochem. 2018, 120, 105–125. [Google Scholar] [CrossRef]
  21. Ivushkin, K.; Bartholomeus, H.; Bregt, A.K.; Pulatov, A.; Kempen, B.; de Sousa, L. Global Mapping of Soil Salinity Change. Remote Sens. Environ. 2019, 231, 111260. [Google Scholar] [CrossRef]
  22. Ding, J.; Yang, S.; Shi, Q.; Wei, Y.; Wang, F. Using Apparent Electrical Conductivity as Indicator for Investigating Potential Spatial Variation of Soil Salinity across Seven Oases along Tarim River in Southern Xinjiang, China. Remote Sens. 2020, 12, 2601. [Google Scholar] [CrossRef]
  23. de Sousa, L.; van den Berg, F.; Heuvelink, G.B.M. A Soil Organic Matter Map for Arable Land in the EU; Wageningen University and Research: Wageningen, The Netherlands, 2022. [Google Scholar] [CrossRef]
  24. Poggio, L.; De Sousa, L.M.; Batjes, N.H.; Heuvelink, G.B.M.; Kempen, B.; Ribeiro, E.; Rossiter, D.S. SoilGrids 2.0: Producing Soil Information for the Globe with Quantified Spatial Uncertainty. SOIL 2021, 7, 217–240. [Google Scholar] [CrossRef]
  25. Liang, Z.; Chen, S.; Yang, Y.; Zhou, Y.; Shi, Z. High-Resolution Three-Dimensional Mapping of Soil Organic Carbon in China: Effects of SoilGrids Products on National Modeling. Sci. Total Environ. 2019, 685, 480–489. [Google Scholar] [CrossRef] [PubMed]
  26. Radočaj, D.; Jurišić, M.; Gašparović, M.; Plaščak, I.; Antonić, O. Cropland Suitability Assessment Using Satellite-Based Biophysical Vegetation Properties and Machine Learning. Agronomy 2021, 11, 1620. [Google Scholar] [CrossRef]
  27. Wimalasiri, E.M.; Jahanshiri, E.; Suhairi, T.A.S.T.M.; Udayangani, H.; Mapa, R.B.; Karunaratne, A.S.; Vidhanarachchi, L.P.; Azam-Ali, S.N. Basic Soil Data Requirements for Process-Based Crop Models as a Basis for Crop Diversification. Sustainability 2020, 12, 7781. [Google Scholar] [CrossRef]
  28. Radočaj, D.; Jug, I.; Vukadinović, V.; Jurišić, M.; Gašparović, M. The Effect of Soil Sampling Density and Spatial Autocorrelation on Interpolation Accuracy of Chemical Soil Properties in Arable Cropland. Agronomy 2021, 11, 2430. [Google Scholar] [CrossRef]
  29. Upadhyay, S.; Raghubanshi, A.S. Chapter 16—Determinants of Soil Carbon Dynamics in Urban Ecosystems. In Urban Ecology; Verma, P., Singh, P., Singh, R., Raghubanshi, A.S., Eds.; Elsevier: Amsterdam, The Netherlands, 2020; pp. 299–314. ISBN 978-0-12-820730-7. [Google Scholar]
  30. Corwin, D.L.; Lesch, S.M.; Oster, J.D.; Kaffka, S.R. Monitoring Management-Induced Spatio–Temporal Changes in Soil Quality through Soil Sampling Directed by Apparent Electrical Conductivity. Geoderma 2006, 131, 369–387. [Google Scholar] [CrossRef]
  31. Nouri, M.; Homaee, M.; Bannayan, M.; Hoogenboom, G. Towards Modeling Soil Texture-Specific Sensitivity of Wheat Yield and Water Balance to Climatic Changes. Agric. Water Manag. 2016, 177, 248–263. [Google Scholar] [CrossRef]
  32. Radočaj, D.; Jurišić, M.; Zebec, V.; Plaščak, I. Delineation of Soil Texture Suitability Zones for Soybean Cultivation: A Case Study in Continental Croatia. Agronomy 2020, 10, 823. [Google Scholar] [CrossRef]
  33. Radočaj, D.; Jurišić, M.; Antonić, O. Determination of Soil C:N Suitability Zones for Organic Farming Using an Unsupervised Classification in Eastern Croatia. Ecol. Indic. 2021, 123, 107382. [Google Scholar] [CrossRef]
  34. Trevisani, S.; Bogunovic, I. Diachronic Mapping of Soil Organic Matter in Eastern Croatia Croplands. Land 2022, 11, 861. [Google Scholar] [CrossRef]
  35. Beck, H.E.; Zimmermann, N.E.; McVicar, T.R.; Vergopolan, N.; Berg, A.; Wood, E.F. Present and Future Koppen-Geiger Climate Classification Maps at 1-Km Resolution. Sci. Data 2018, 5, 180214. [Google Scholar] [CrossRef]
  36. Data Europa. Changes in Soil Carbon Stocks and Calculation of Trends in Total Nitrogen and Organic Carbon in Soil and C:N Ratios. 2021. Available online: https://data.europa.eu/data/datasets/zaliha-ugljika-u-tlu-izracun-trendova-ukupnog-dusika-i-organskog-ugljika-te-odnosa-c-n?locale=en (accessed on 11 April 2023).
  37. Stolbovoy, V.; Montanarella, L.; Filippi, N.; Jones, A.; Gallego, P.F.; Grassi, G. Soil Sampling Protocol to Certify the Changes of Organic Carbon Stock in Mineral Soils of European Union—Version 2. Available online: https://publications.jrc.ec.europa.eu/repository/handle/JRC36917 (accessed on 11 April 2023).
  38. CORINE Land Cover User Manual. Available online: https://land.copernicus.eu/user-corner/technical-library/clc-product-user-manual (accessed on 10 September 2022).
  39. Soil Grids 250m v2.0 API. Available online: https://gee-community-catalog.org/projects/isric/#citation (accessed on 9 March 2023).
  40. ISRIC Data Hub, WoSIS Latest—Clay Total. Available online: https://data.isric.org/geonetwork/srv/eng/catalog.search#/metadata/60e38d53-6958-408f-b674-8abbaf743fa8 (accessed on 11 April 2023).
  41. ISRIC Data Hub, WoSIS Latest—Silt Total. Available online: https://data.isric.org/geonetwork/srv/eng/catalog.search#/metadata/1a8f1290-f75a-4c86-bf7a-7b44d03089c3 (accessed on 11 April 2023).
  42. ISRIC Data Hub, WoSIS Latest—Sand Total. Available online: https://data.isric.org/geonetwork/srv/eng/catalog.search#/metadata/f4e4b68c-ee1a-40ca-9ca6-d71109c78794 (accessed on 11 April 2023).
  43. Zeraatpisheh, M.; Ayoubi, S.; Mirbagheri, Z.; Mosaddeghi, M.R.; Xu, M. Spatial Prediction of Soil Aggregate Stability and Soil Organic Carbon in Aggregate Fractions Using Machine Learning Algorithms and Environmental Variables. Geoderma Reg. 2021, 27, e00440. [Google Scholar] [CrossRef]
  44. Das, B.; Murgaonkar, D.; Navyashree, S.; Kumar, P. Novel Combination Artificial Neural Network Models Could Not Outperform Individual Models for Weather-Based Cashew Yield Prediction. Int. J. Biometeorol. 2022, 66, 1627–1638. [Google Scholar] [CrossRef]
  45. Khaledian, Y.; Miller, B.A. Selecting Appropriate Machine Learning Methods for Digital Soil Mapping. Appl. Math. Model. 2020, 81, 401–418. [Google Scholar] [CrossRef]
  46. Wickham, H.; Chang, W.; Henry, L.; Pedersen, T.L.; Takahashi, K.; Wilke, C.; Woo, K.; Yutani, H.; Dunnington, D.; Posit, P.; et al. Ggplot2: Create Elegant Data Visualisations Using the Grammar of Graphics. Available online: https://cran.r-project.org/web/packages/ggplot2/index.html (accessed on 25 April 2023).
  47. Hengl, T.; Nikolić, M.; MacMillan, R.A. Mapping Efficiency and Information Content. Int. J. Appl. Earth Obs. Geoinf. 2013, 22, 127–138. [Google Scholar] [CrossRef]
  48. Brus, D.J.; Kempen, B.; Heuvelink, G.B.M. Sampling for Validation of Digital Soil Maps. Eur. J. Soil Sci. 2011, 62, 394–407. [Google Scholar] [CrossRef]
  49. Skidmore, A.K. Accuracy Assessment of Spatial Information. In Spatial Statistics for Remote Sensing; Remote Sensing and Digital Image Processing; Stein, A., Van der Meer, F., Gorte, B., Eds.; Springer: Dordrecht, The Netherlands, 2002; pp. 197–209. ISBN 978-0-306-47647-1. [Google Scholar]
  50. Montanarella, L. The Global Soil Partnership. IOP Conf. Ser. Earth Environ. Sci. 2015, 25, 012001. [Google Scholar] [CrossRef]
  51. Nachtergaele, F.O.; van Velthuizen, H.; Wiberg, D.; Batjes, N.H.; Dijkshoorn, J.A.; van Engelen, V.W.P.; Fischer, G.; Jones, A.; Montanarela, L.; Petri, M.; et al. Harmonized World Soil Database (HWSD) 2014. In Proceedings of the 19th World Congress of Soil Science, Soil Solutions for a Changing World, Brisbane, Australia, 1–6 August 2010. [Google Scholar]
  52. Tifafi, M.; Guenet, B.; Hatté, C. Large Differences in Global and Regional Total Soil Carbon Stock Estimates Based on SoilGrids, HWSD, and NCSCD: Intercomparison and Evaluation Based on Field Data From USA, England, Wales, and France. Glob. Biogeochem. Cycles 2018, 32, 42–56. [Google Scholar] [CrossRef]
  53. Wang, X.; Sun, X.; Sun, L.; Chen, N.; Du, Y. Small-Scale Variability of Soil Quality in Permafrost Peatland of the Great Hing’an Mountains, Northeast China. Water 2022, 14, 2597. [Google Scholar] [CrossRef]
  54. Lu, L.; Li, S.; Wu, R.; Shen, D. Study on the Scale Effect of Spatial Variation in Soil Salinity Based on Geostatistics: A Case Study of Yingdaya River Irrigation Area. Land 2022, 11, 1697. [Google Scholar] [CrossRef]
  55. Liakos, L.; Panagos, P. Challenges in the Geo-Processing of Big Soil Spatial Data. Land 2022, 11, 2287. [Google Scholar] [CrossRef]
  56. Bogunovic, I.; Trevisani, S.; Seput, M.; Juzbasic, D.; Durdevic, B. Short-Range and Regional Spatial Variability of Soil Chemical Properties in an Agro-Ecosystem in Eastern Croatia. Catena 2017, 154, 50–62. [Google Scholar] [CrossRef]
  57. Mahmood, F.; Khan, I.; Ashraf, U.; Shahzad, T.; Hussain, S.; Shahid, M.; Abid, M.; Ullah, S. Effects of Organic and Inorganic Manures on Maize and Their Residual Impact on Soil Physico-Chemical Properties. J. Soil Sci. Plant Nutr. 2017, 17, 22–32. [Google Scholar] [CrossRef]
Figure 1. The workflow for the accuracy analysis of the SoilGrids data in Croatia.
Land 12 01034 g001
Figure 2. The location of the study area according to: (a) soil sampling locations and CORINE 2018 Land Cover classes; (b) Köppen–Geiger climate classes according to Beck et al. [35]; (c) biogeoregions.
Land 12 01034 g002
Figure 3. The display of harmonized preprocessed SoilGrids data used in this study.
Land 12 01034 g003
Figure 4. The comparative display of soil samples used for (a) ground truth data for the accuracy assessment of SoilGrids and SoilGrids prediction based on ISRIC WoSIS Soil Profile Database for (b) clay, (c) silt, and (d) sand.
Land 12 01034 g004
Figure 5. The soil datasets used for the accuracy assessment, including three native SoilGrids layers and two derived layers.
Land 12 01034 g005
Figure 6. The violin plots of the value distributions for the ground truth soil sampling data and evaluated SoilGrids layers. GTD: ground truth data, A: average, and WA: weighted average.
Land 12 01034 g006
Figure 7. The violin plots of square residuals for evaluated SoilGrids layers. GTD: ground truth data, A: average, and WA: weighted average.
Land 12 01034 g007
Figure 8. The heatmap of square residuals for evaluated SoilGrids layers in the range up to the 95th percentile of maximum square residual per soil parameter.
Land 12 01034 g008
Table 1. The coverage of Köppen–Geiger climate classes in the study area according to Beck et al. [35].
Köppen–Geiger Climate ClassDescriptionCoverage of Study Area (%)
CsaTemperate, dry summers, and hot summers12.5
CsbTemperate, dry summers, and warm summers1.0
CfaTemperate, no dry season, and hot summers28.4
CfbTemperate, no dry season, and warm summers7.6
DsbCold, dry summers, and warm summers0.1
DfaCold, no dry season, and hot summers0.1
DfbCold, no dry season, and warm summers50.1
DfcCold, no dry season, and cold summers0.2
Table 2. Unit conversion coefficients of the acquired SoilGrids data according to their native units [24].
Soil ParameterNative UnitsConversion CoefficientConverted Units
Clayg/kg10g/100 g (%)
Siltg/kg10g/100 g (%)
Sandg/kg10g/100 g (%)
Table 3. The accuracy of SoilGrids layers according to the ground truth soil sampling data.
Soil PropertyAccuracy MetricEvaluated SoilGrids Layers
0–5 cm5–15 cm15–30 cmAverageWeighted Average
Clay (%)R20.2640.2580.2600.2670.266
RMSE13.17312.86612.01612.59412.398
NRMSE0.3780.3700.3450.3620.356
Silt (%)R20.0340.0410.0380.0390.040
RMSE24.31123.79025.69824.57024.799
NRMSE0.4510.4410.4770.4560.460
Sand (%)R20.0370.0350.0430.0390.040
RMSE29.32428.27928.74428.74228.642
NRMSE2.6052.5122.5532.5532.544
The statistical metrics indicating the highest accuracy per evaluated soil property are bolded.
Disclaimer/Publisher’s Note: The statements, opinions and data contained in all publications are solely those of the individual author(s) and contributor(s) and not of MDPI and/or the editor(s). MDPI and/or the editor(s) disclaim responsibility for any injury to people or property resulting from any ideas, methods, instructions or products referred to in the content.

