Article

Factors Influencing Four Decades of Forest Change in Guizhou Province, China

1
School of Design, Shanghai Jiao Tong University, Shanghai 200240, China
2
Department of Environmental and Geographical Science, University of Cape Town, Cape Town 7701, South Africa
3
School of Geography and Ocean Sciences, Nanjing University, Nanjing 210023, China
4
School of Agriculture and Biology, Shanghai Jiao Tong University, Shanghai 200240, China
5
School of Life Science and Technology, Central South University of Forestry and Technology, Changsha 410004, China
*
Author to whom correspondence should be addressed.
Land 2023, 12(5), 1004; https://doi.org/10.3390/land12051004
Submission received: 29 March 2023 / Revised: 15 April 2023 / Accepted: 27 April 2023 / Published: 3 May 2023
(This article belongs to the Special Issue Karst Land System and Sustainable Development)

Abstract

:
Globally, the loss of forest vegetation is a significant concern due to the crucial roles that forests play in the Earth’s system, including the provision of ecosystem services, participation in biogeochemical cycles, and support for human well-being. Forests are especially critical in mountains environments, where deforestation can lead to accelerated biodiversity loss, soil erosion, flooding, and reduced agricultural productivity, as well as increased poverty rates. In response to these problems, China has implemented a series of ecological restoration programs aimed at restoring forests. However, there is a lack of knowledge as to whether the forest cover is increasing or decreasing, as well as the relative roles played by natural and human factors in forest change. Here, we aim to address these issues by analyzing the pattern and process of the forest changes in Guizhou province, a typical mountainous karst area with a fragile environment in southwestern China, between 1980 and 2018, and evaluating the extent to which these forest changes were influenced by natural and anthropogenic driving forces. Using a temporal sequence of satellite images and a Markov model, we found that the forest cover increased by 468 km2, and that over 33% of the cropland in Guizhou province was converted into forest between 1980 and 2018, with the most significant increases in the forest cover occurring in Qiandongnan. Through correlation analyses and generalized linear model (GLM) regression, we demonstrate that management factors exerted a more significant positive impact on the forest cover than climate change. While the mean annual precipitation and temperature were mostly stable during the period studied, the effects of population and gross domestic product (GDP) on the forest changes weakened, and the influence of land-use change markedly increased. These findings provide valuable information for resource managers engaging in forest protection, deforestation prevention, and ecological restoration in similar regions.

1. Introduction

Globally, forest loss due to plantation forestry, agriculture, mining-related wildfires, and urbanization has enormous implications, particularly for climate change and biodiversity. As a result, governments, conservationists, and even private corporations are engaged in efforts to curb these losses and promote forest recovery [1,2,3,4]. In China, a series of ecological restoration programs have been implemented at the national, regional, and local scales over the past several decades, including the Grain for Green Program (1999–2020) and the Rocky Desertification Treatment Program (2008–2020) [5]. These interventions have greatly improved the sustainability of China’s land systems, with the rate of forest cover increasing from 8.6% in 1949 to 23.04% in 2020 [6]. Substantial forest recovery has been detected through remote-sensing imagery, revealing an overall increase in greening since 2000, most notably in China and India [7]. This trend is particularly prominent in certain provinces, including Guizhou province, where the forest cover increased from 11.98% in 1949 to 61.5% in 2020 [8]. Ecological restoration interventions have significantly increased the vegetation growth and carbon stock in China more generally [9,10]. It is clear that continuous and long-term ecological restoration projects can, among other benefits, help forests accumulate nutrients [11], and that embracing the implications of restoration interventions can contribute to the United Nation’s Sustainable Development Goals. It is the interaction between the natural environmental and socio-economic factors that determines forest dynamics, including recovery. Natural factors include those related to soil [12] and climate, especially the mean annual temperature and rainfall [13,14,15]. However, the spatial and temporal aspects of forest change in remote and environmentally fragile regions are not fully understood, and the trajectory of the forest changes in China as a whole is still subject to debate. While some locations have undergone ‘greening,’ others remain subject to forest clearance [16,17,18]. Therefore, it is important to establish the details of recent trends in forest cover, and their driving forces, especially in environmentally vulnerable regions, such as the karst area of southwestern China, which has historically endured significant levels of rocky desertification [19].
Guizhou province has a total area of 176,167 km2, of which 92.5% is hilly and 61.9% is karst [20], and it is considered to be among the most environmentally vulnerable regions in China. Karst topsoil is typically shallow, so if the forest vegetation is cleared, it is highly susceptible to erosion [21] and produces a particular form of land degradation, known as rocky desertification, which, in turn affects regional socioeconomic development. This has led Guizhou to become the least developed province in China [22]. China has responded to this land-degradation crisis in the karst region of its southwestern area, including Guizhou province, through an integrated portfolio of ecosystem-restoration programs since the 1980s. A number of previous studies described rocky desertification and associated spatio-temporal variations in land-use change, the mechanisms underlying these processes, and restoration responses [23,24,25]. Accelerated soil erosion and its underlying causes have been a particular focus [26,27,28]. However, relatively little attention has been paid to forest loss, which is an important element in land degradation and rocky desertification, particularly in Guizhou province. The forests of Guizhou Province, lying in the central part of southwestern China’s karst area, play a crucial role in the ecological security and ecosystem services of a region that forms a part of an ecological safety barrier between the Pearl River and the Yangtze River catchments, which makes it ecologically critical, but highly vulnerable [29]. Understanding forest change is central to achieving sustainability and providing support for decisions regarding land-use management in the region.
Land-use and land-cover change (LULCC) is the alteration of natural or semi-natural landscapes due to human activities, such as urbanization, agricultural expansion, and deforestation [30]. In previous research, developed numerous models were developed to explore LULCC, in order to detect the changes in land use at specific locations and analyze its drivers [31,32]. From the perspective of landscape ecology, these models can be classified into three types: whole-landscape models, distributional models, and spatial-landscape models [33]. However, these focus mainly on ecological processes while tending to underplay or even ignore the role of human decision-making [34]. By the end of the 1990s, a considerable amount of tropical-deforestation-modeling work, represented by Lambin [35] and Kaimowitz and Angels [36] emerged that considered the role of human decision-making. Models of LULCC, including empirical–statistical models, stochastic models, optimization models, dynamic simulation models, and integrated models [37], can be categorized according to different criteria. Agarwal et al. [38] listed 19 models, including Markov models, spatial-simulation models, and regression models, based on their space, time, and decision-making characteristics. Among these, the Markov chain (MC) model is widely used in the spatiotemporal evaluation of LULC changes [39]. The choice of the model depends, to a large extent, on the particular scientific questions to be answered, along with data availability. Although LULCC modeling has made significant progress in understanding the dynamics and effects of land-use change [40], there remains a pressing need for more interdisciplinary research that integrates multiple drivers and factors affecting land-use decisions. This includes the development of more advanced modeling techniques that combine multiple methods [41]. The understanding of the interaction between scales and across scales is likely to remain the research frontier of the modeling of land-use/cover changes in the future.
The aim of this paper is to evaluate the change in forest cover and the relative importance of selected contributing factors in Guizhou province over four decades (1980–2018), with a view to determining the relative influence of human and natural factors. Using a remote-sensing monitoring dataset of multi-period land use and land cover from Landsat, we employed a Markov model to analyze the forest change in the study area. Additionally, we considered a range of environmental (e.g., soil erosion, karstification intensity, drought index) and socio-economic (e.g., population, gross domestic product (GDP), and accessibility) data to investigate the factors that influence forest change through a correlation analysis and a generalized linear model (GLM) regression. The systematic understanding of the forest change in Guizhou province in this paper has the potential to be used more widely to develop ecological restoration strategies and promote more sustainable land-use management in the future.

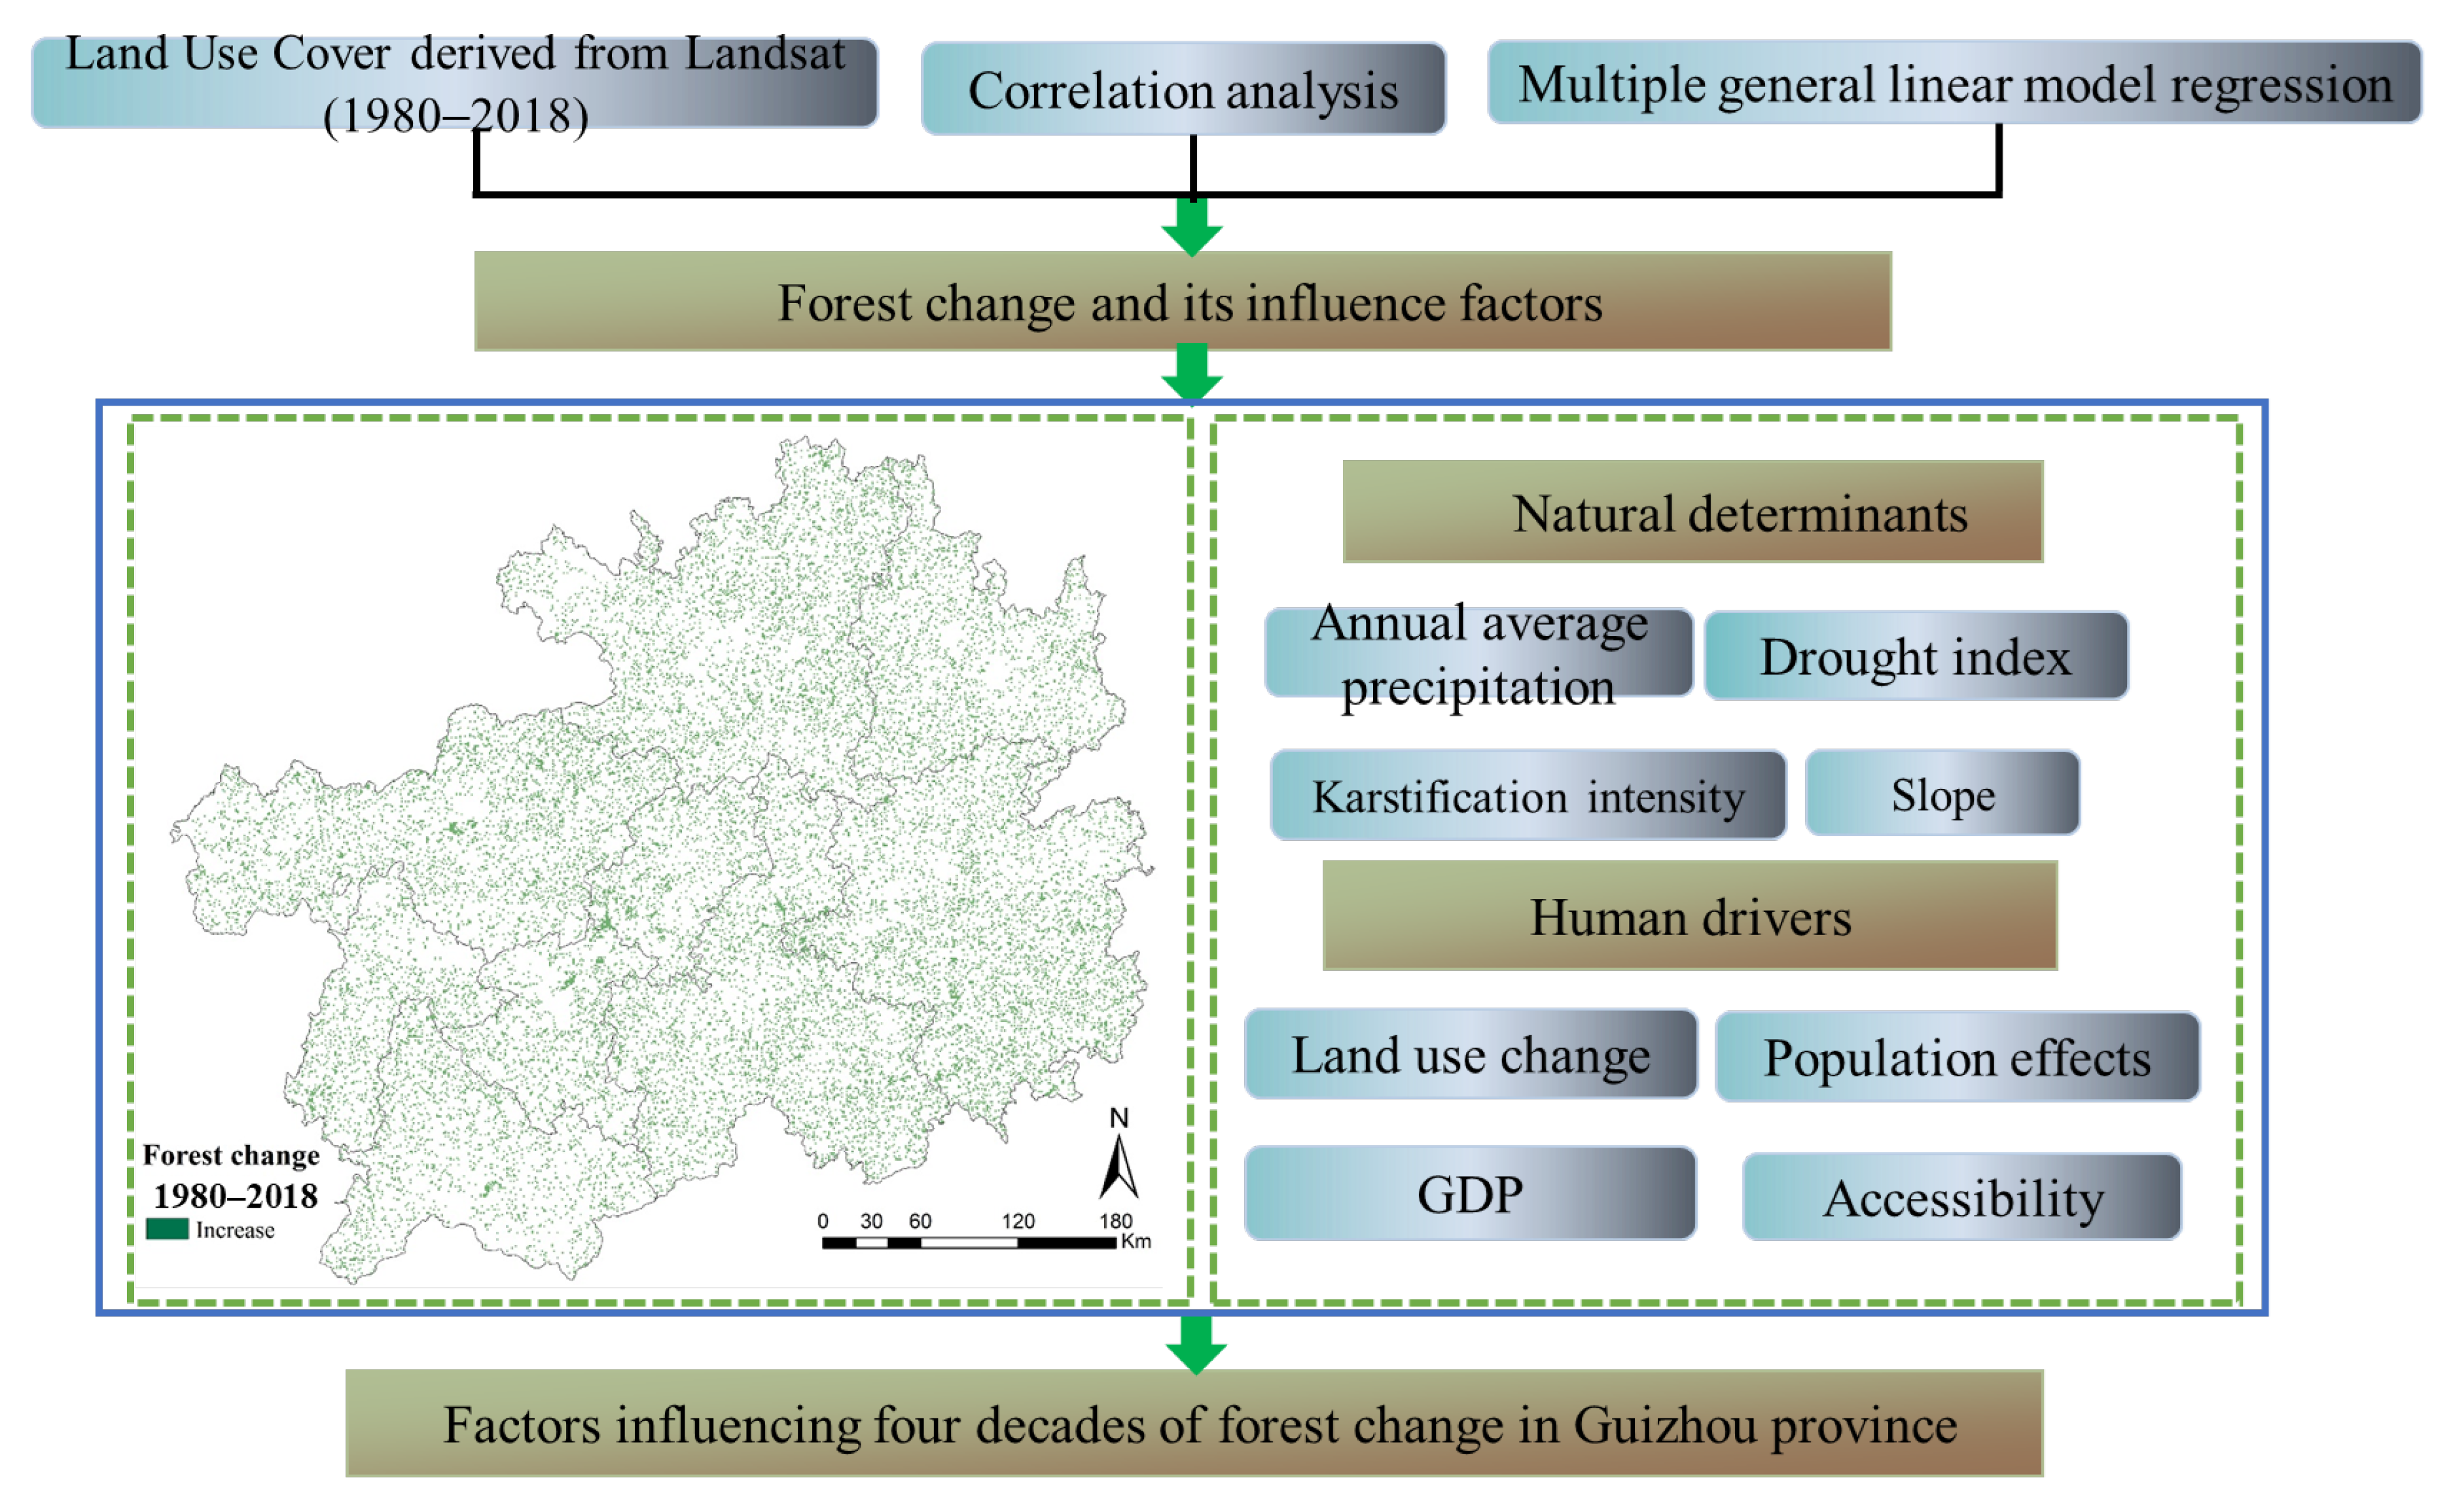
2. Materials and Methods
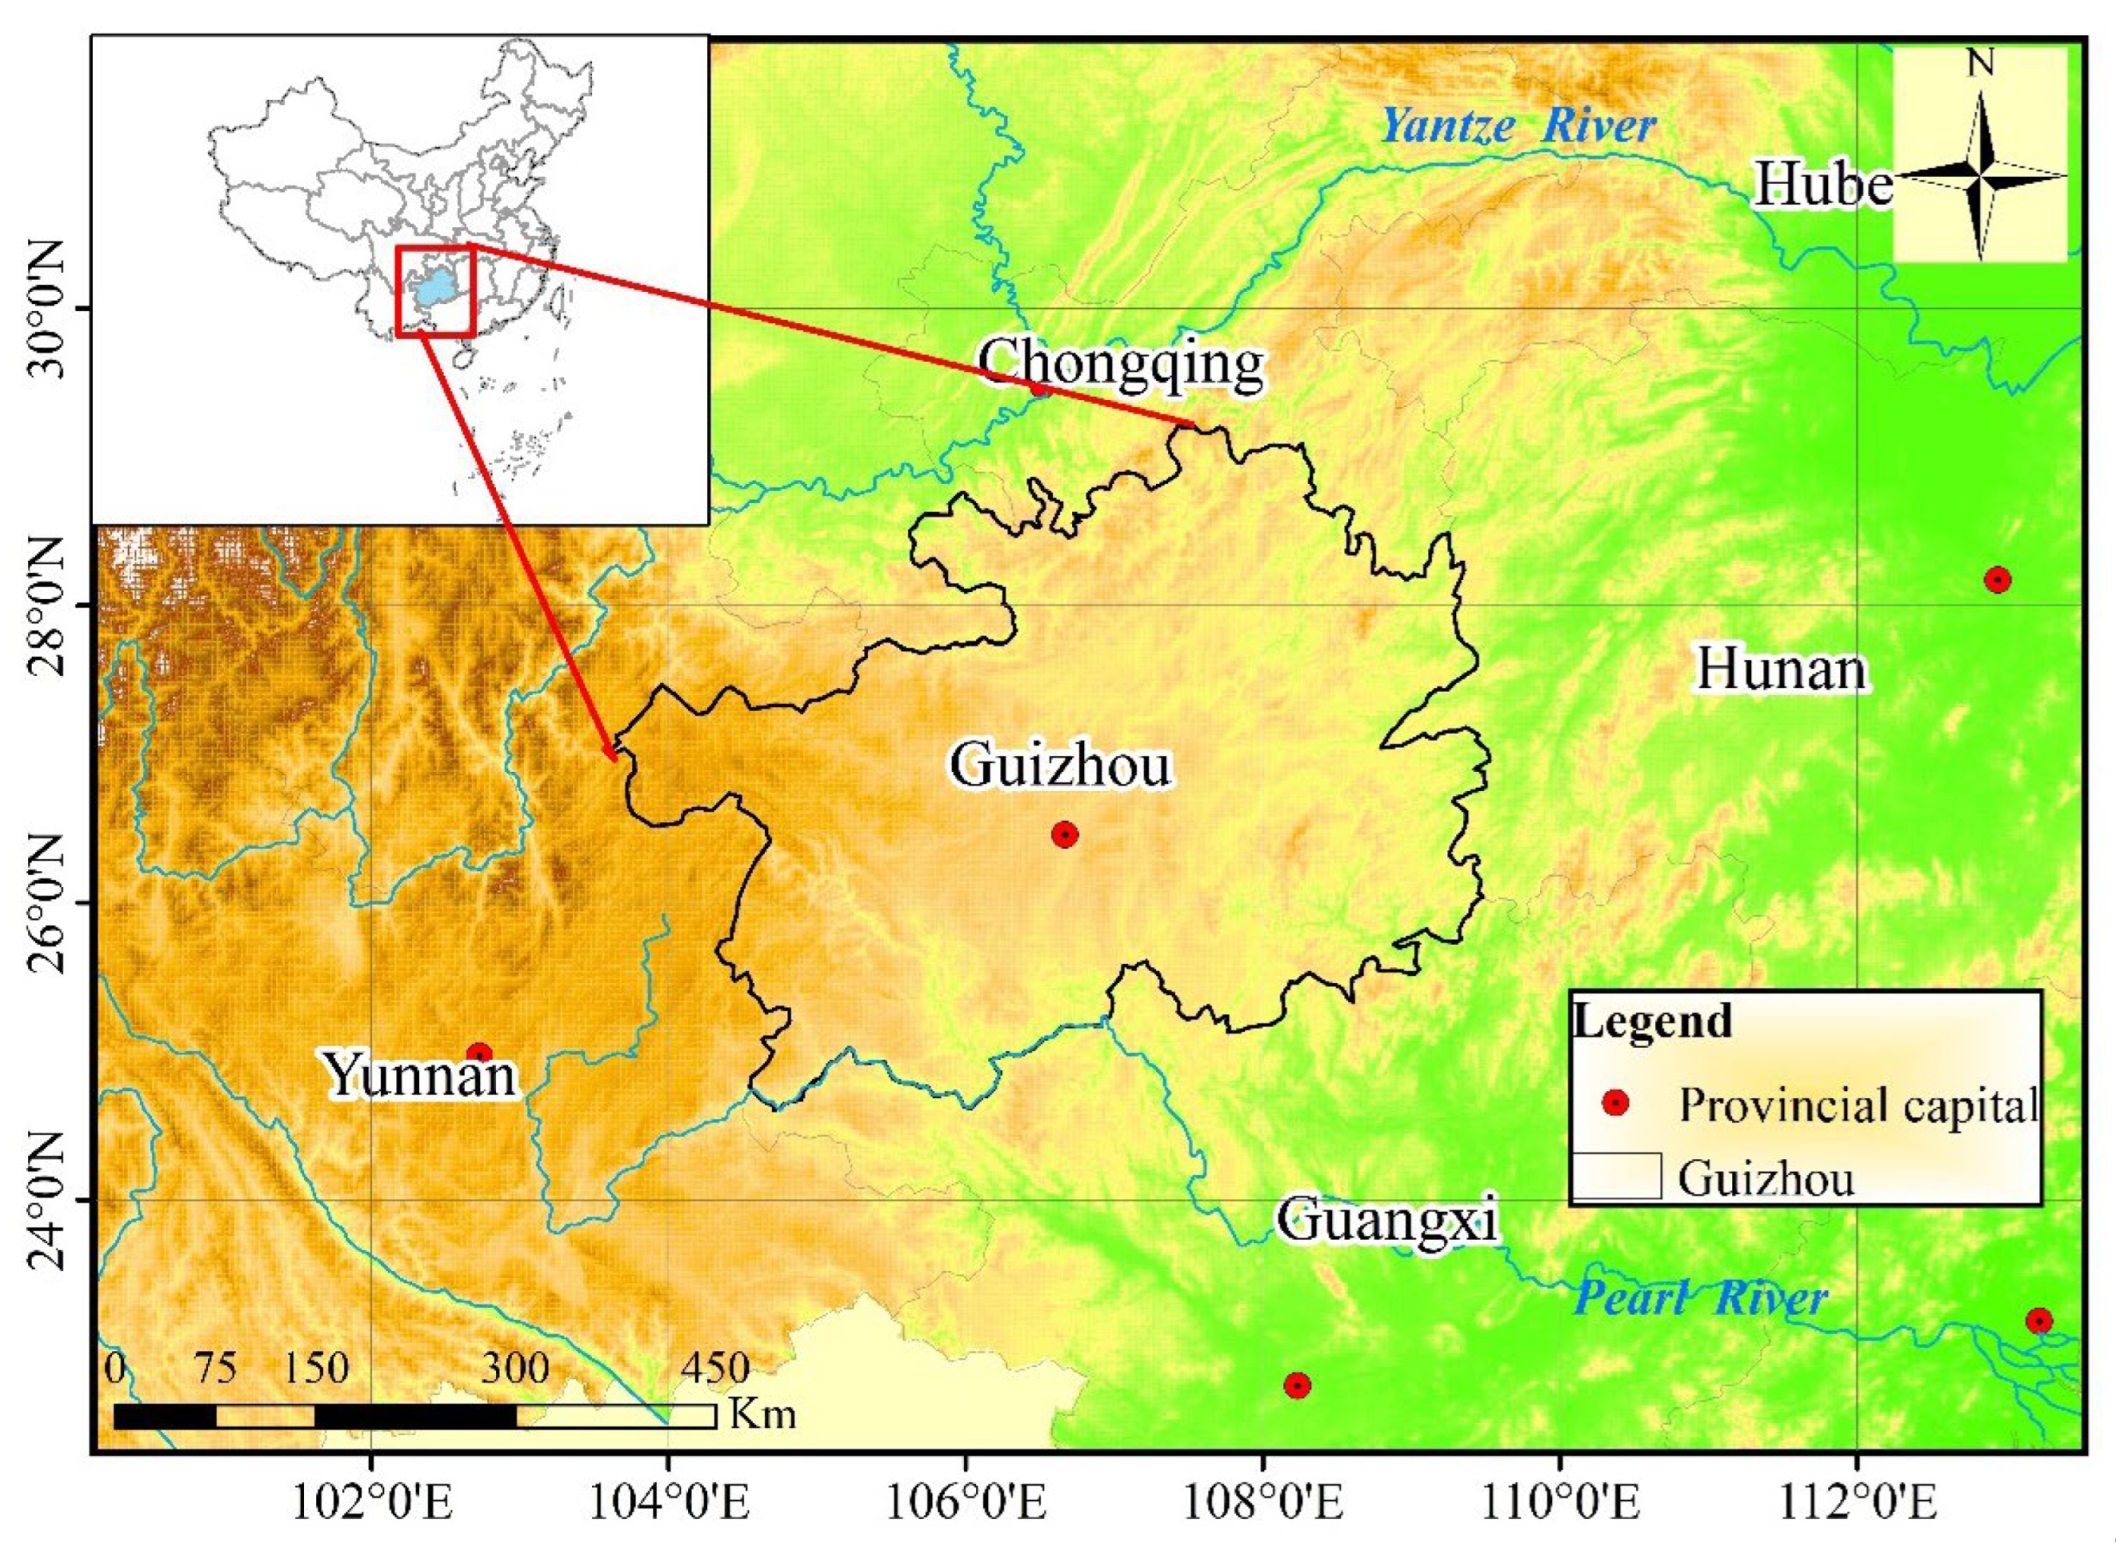
2.1. Study Area

Guizhou (24°37′–29°13′ N, 103°36′–109°35′ E) is representative of China’s southwestern karst region, with over 60% of its land area consisting of the karst landform [42] (Figure 1). The region encompasses a variety of landforms, including mountains, hilly areas, plateaus, basins, and river valleys. Unlike other karst provinces, there are no extensive plain areas, and the mean elevation is approximately 1100 m. The climate is classified as subtropical humid monsoon, with an average annual temperature of around 15 °C and an annual precipitation of approximately 1200 mm [43]. The environment is highly susceptible to degradation, and it is particularly prone to accelerated soil erosion, resulting in rocky desertification [44]. By 2016, karst-rock desertification in Guizhou was reported to extend across almost 250,000 km2 of the province, making it was the most degraded karst province in the country [45]. The region’s economy has experienced significant growth in recent years. Agriculture, particularly cash crops such as oranges, peaches, and dragon fruit, contributes greatly to rural livelihoods, although, due to the area’s ecological vulnerability, this focus on agriculture has led to environmental problems, such as ecosystem fragmentation, a decline in biodiversity, soil erosion, and reduced surface runoff [46]. With a population of 360 million in 2018, including a rural population of 189 million, the pressure on the land has become unbearable, exacerbating land degradation in the study area [47]. Furthermore, national policies have led to the improvement and proliferation of highways and high-speed railways, which have contributed to economic development, but they have also led to the removal of vegetation and loss of ecosystem services [44].

2.2. Data

2.2.1. Land-Use Data

Land use (1-km-resolution raster) data, based on visual interpretation of Landsat TM/ETM imagery, were obtained for the years 1980, 1990, 2000, 2010, and 2018 from the Resource and Environment Data Cloud Platform (China’s multi-period land-use–land-cover remote-sensing data-monitoring set (CNLUCC); Resource and Environment Data Registration and Publishing System) [48]. The dataset is the most freely available dataset in China and has been widely used for detecting land-use change and analyzing ecosystem services from local to national scale. Its accuracy in identifying cropland and built-up areas is over 85%; its average accuracy for other land-use types exceeds 75%. Primary land-use categories identified were cropland, forest, grassland, water, built-up, and ‘others’ (Table 1); secondary categories included 25 sub-types of land use.

2.2.2. Forest-Change Drivers

In addition to the mapping of land-use changes, several other drivers were considered in developing the model. Given the vulnerability of the region to rocky desertification, karstification intensity (KI) was included as a potentially important factor. The KI was obtained from the Guizhou Institute of Mountain Resources. Slopes were also considered important, as these influence the spread of forests that affect forest growth [49]. We derived the slope factor from a digital elevation model (DEM) (2009) at a 30-m resolution from Geospatial Data Cloud (https://www.gscloud.cn/ (accessed on 30 January 2020)). Climate characteristics, particularly drought frequency and intensity, also have a significant impact on vegetation cover [50], and Guizhou is frequently affected by drought, which restricts forest growth. As a result, both the drought index (the ratio of annual evaporation capacity to annual precipitation) and mean annual precipitation were included as potential drivers. The drought index was provided by the Guizhou Institute of Mountainous Climate and Environment. Other factors relating to human activities, including urbanization, are known to play significant roles in forest change [51]. Land-use change and ecological restoration projects are considered direct human-activity factors [52,53] and, given that Guizhou has been at the forefront of China’s economic growth since 2000, with the highest growth rate in the country for the last three consecutive years, balancing economic development with environmental protection is highly challenging [54]. Accordingly, we also included factors associated the anthropogenic influence: GDP, population, and accessibility for analyzing forest dynamics. The mean annual temperature/precipitation, accessibility, population (people/km2), and GDP of nine municipalities in Guizhou were obtained from the Resource and Environment Data Cloud Platform (REDCP) [48].

2.3. Methods

2.3.1. Data Preprocessing

Primary data were obtained and processed according to the methods presented in Table 2, while a flow chart illustrating the methodology employed in this study is presented as Figure 2:
Forest change: Based on a Markov transition matrix [55] and spatial analysis function of ArcGIS, a transfer matrix of different land types was obtained, and on this basis, land-use changes, including forest cover, were estimated. Chord diagrams of land transformation were constructed for Guizhou province and each of its nine major municipalities using R.
Land-use transition involves the changes in regional land-use patterns, and they are significant components of land-use-transition studies [56]. Markov modeling is commonly used to consider the processes and mechanisms of landscape-dynamics changes over the longer term [55,57]. We adopted a transition matrix as the core part of the Markov model (see Formula (1)), which is generally applied in estimations of land-cover changes [58,59]. While different types of conversion may occur, more attention was paid to those that account for most of the forest change. In addition, we calculated the conversion ratio of the main converted types through Formula (2). All analyses were conducted by ArcGIS and R.
T = D 11 D 12 D 1 n D 21 D 22 D 2 n D n 1 D n 2 D n n
where T refers to the conversion matrix of different types of land-use change from 1980 to 2018, D n n refers to the change in the area (unit: km2) from one land-use type to another during the study period, and n refers to the area of a certain type of land that was involved in the computation.
R i j = A i j / B i
where R i j refers to the rate of the i type of land use converted to j type,   A i j represents the area of i type of land use converted to j grade, and B i is the total area of i type of land in 1980 (unit: km2).
Population and Gross Domestic Product (GDP): These data were analyzed spatially in ArcGIS 10.3. According to REDCP, population data were processed as follows:
POP i j = POP × Q i j / Q
where POP i j is the population-spatial-distribution data in a 1 km × 1 km grid, Q i j is the total weighting of land-use type, night light, and settlement density in a grid,   POP is the population of the county-level administrative unit in which the grid is located, and Q is the total weighting of land-use type, night light, and settlement density for the county-level administrative unit in which the grid is located.
According to REDCP, GDP data were processed as follows:
GDP i j = GDP × Q i j / Q
where GDP i j is the GDP-spatial-distribution data in a 1 km × 1 km grid, Q i j is the total weighting of land-use type, night light, and settlement density in a grid, GDP is the GDP of the county-level administrative unit in which the grid is located, and Q is the total weighting of land-use type, night light, and settlement density for the county-level administrative unit in which the grid is located.
Accessibility (A): This parameter refers to the accessibility of a location in terms of transportation, including national, provincial, county, and township roads. The Euclidean distance was calculated for each of the different levels of road, weighted according to ranking of their importance (national > provincial > county > township), and then analyzed spatially.
Karstification intensity (KI): The degree of karstification was classified as follows, according to the purity of carbonate: detrital carbonate-reservoir rock (DCRR), carbonate-reservoir rock with detrital reservoir rock (CRR-DRR), and non-carbonate rock (NCR). Weights were assigned according to karstification intensity, whereby DCRR > CRR-DRR > NCR.
Drought index and mean annual precipitation/temperature: A drought index [60] was obtained from Formulae (5)–(7). Next, based on Kriging interpolation in ArcGIS10.3, the map of drought index was made.
K =   E / P
P = P / P P
E = E / E P
where K denotes the drought index of any period, P′ describes the relative rate of change in precipitation during the period (1980–2015), P represents annual total precipitation for 2015, PP is the mean annual precipitation during the period (1980–2015), E′ describes the relative rate of change in evaporation during the period (1980–2015), E represents the evaporation in 2015, and EP is the mean annual evaporation during the period (1980–2015).
Slope: Following image cutting and splicing, DEM was used to classify slopes, as follows: 0–6°, 6–15°, 15–25°, 25–35°, and >35°.

2.3.2. Analysis of Drivers

Firstly, we explored the relationship between forest area in 2018 and its drivers. Data for the most recent available year were used to consider potential drivers as indicated: land use change (2018), population (2015), gross domestic product (GDP, 2015), accessibility (2010), karstification intensity (2010), drought index (2015), mean annual precipitation (2015), and slope (2009). Using them as baseline values, we then determined the influence of these factors on forest change over time.
To assess the influence of these factors on forest change over time, we conducted a correlation analysis between forest changes and the various drivers and then applied generalized linear model (GLM) regression to quantify the relative contribution of each variable. The GLM regression extends linear model regressions by expanding the distribution range of dependent variables and introducing a continuous function, and it is generally applicable to non-normally distributed data [61]. As Formulae (8)–(10) show, the model is a function of mean μ with a linear combination xβ formed from regressor x and coefficient vector β.
μ i = E ( Y I | X 1 , X 2 , , X k ) ,   i = 1 , , n
η i = g μ i
g μ i = η i = β 0 + β 1 X i 1 + β 2 X i 2 + β 3 X i 3 + + β k X i k
where X is explanatory variables (factors driving forest change), YI is dependent variables (the area of forest), μi is n independent samples subject to exponential distribution; η i represents k linear combinations of explanatory variables; g μ i refers to a function linking μi and η i , and k is the number of explanatory variables.

3. Results

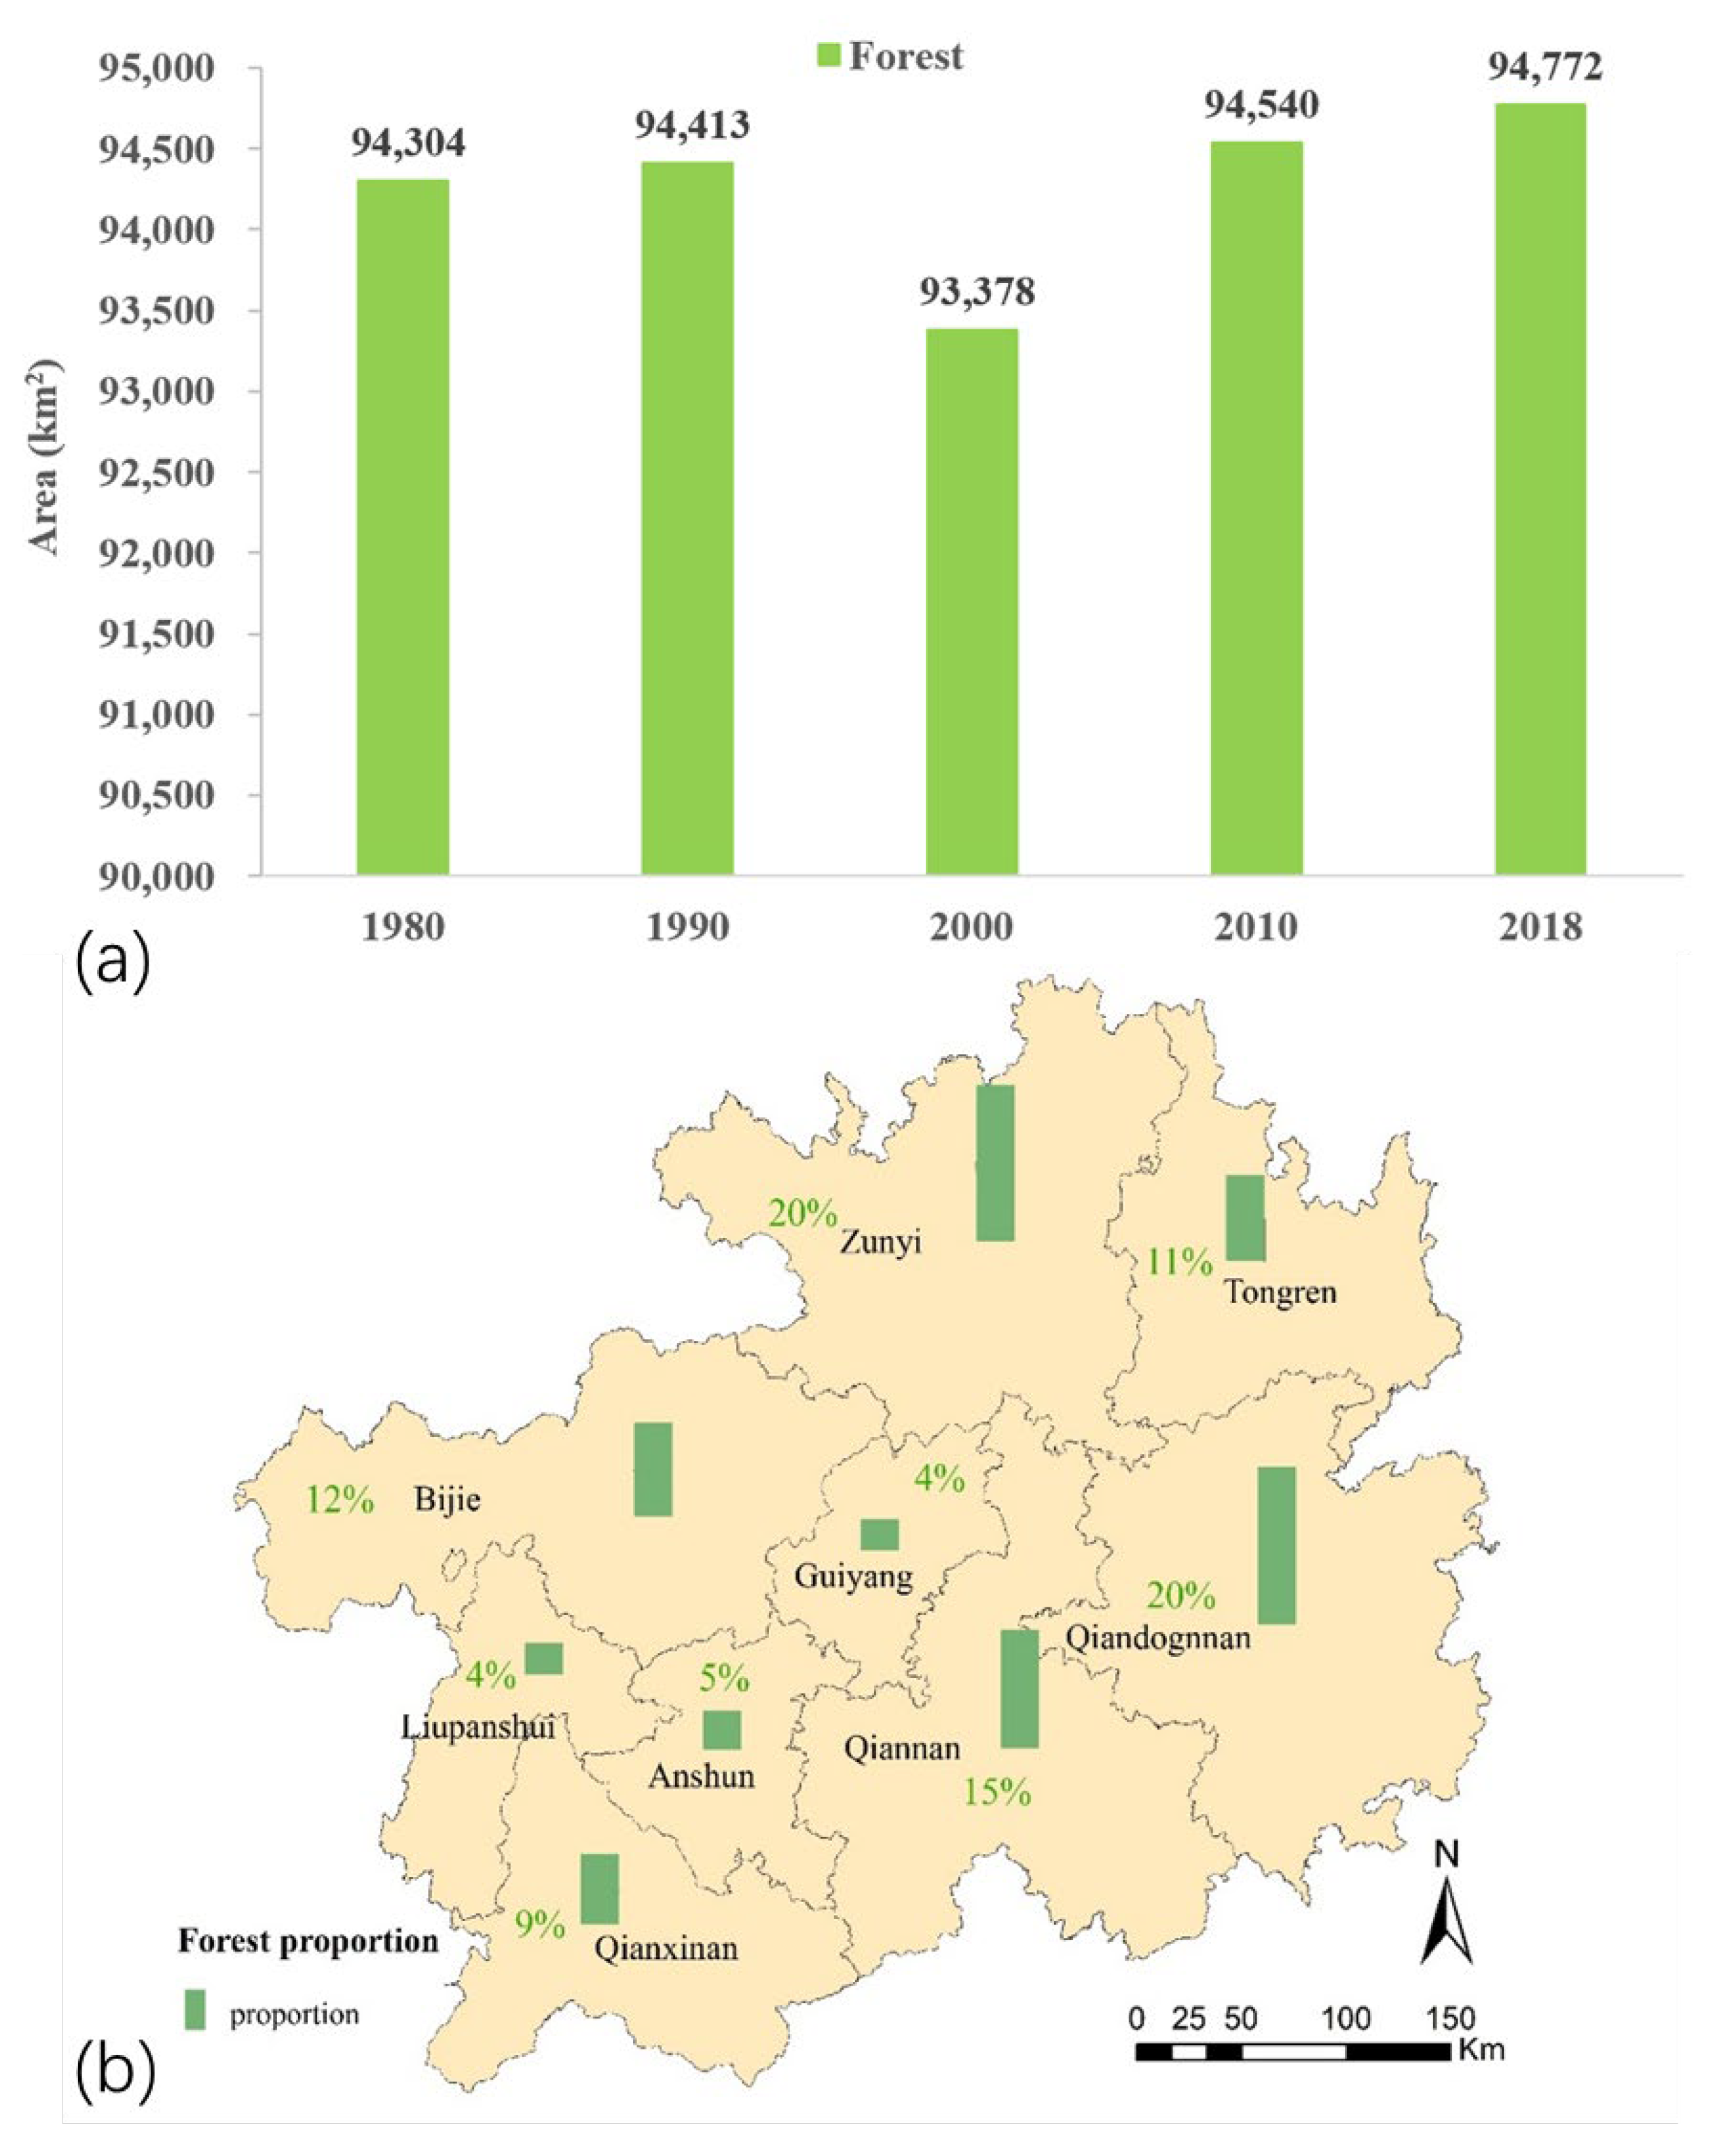
3.1. Spatio-Temporal Patterns of Forest Change in Guizhou Province

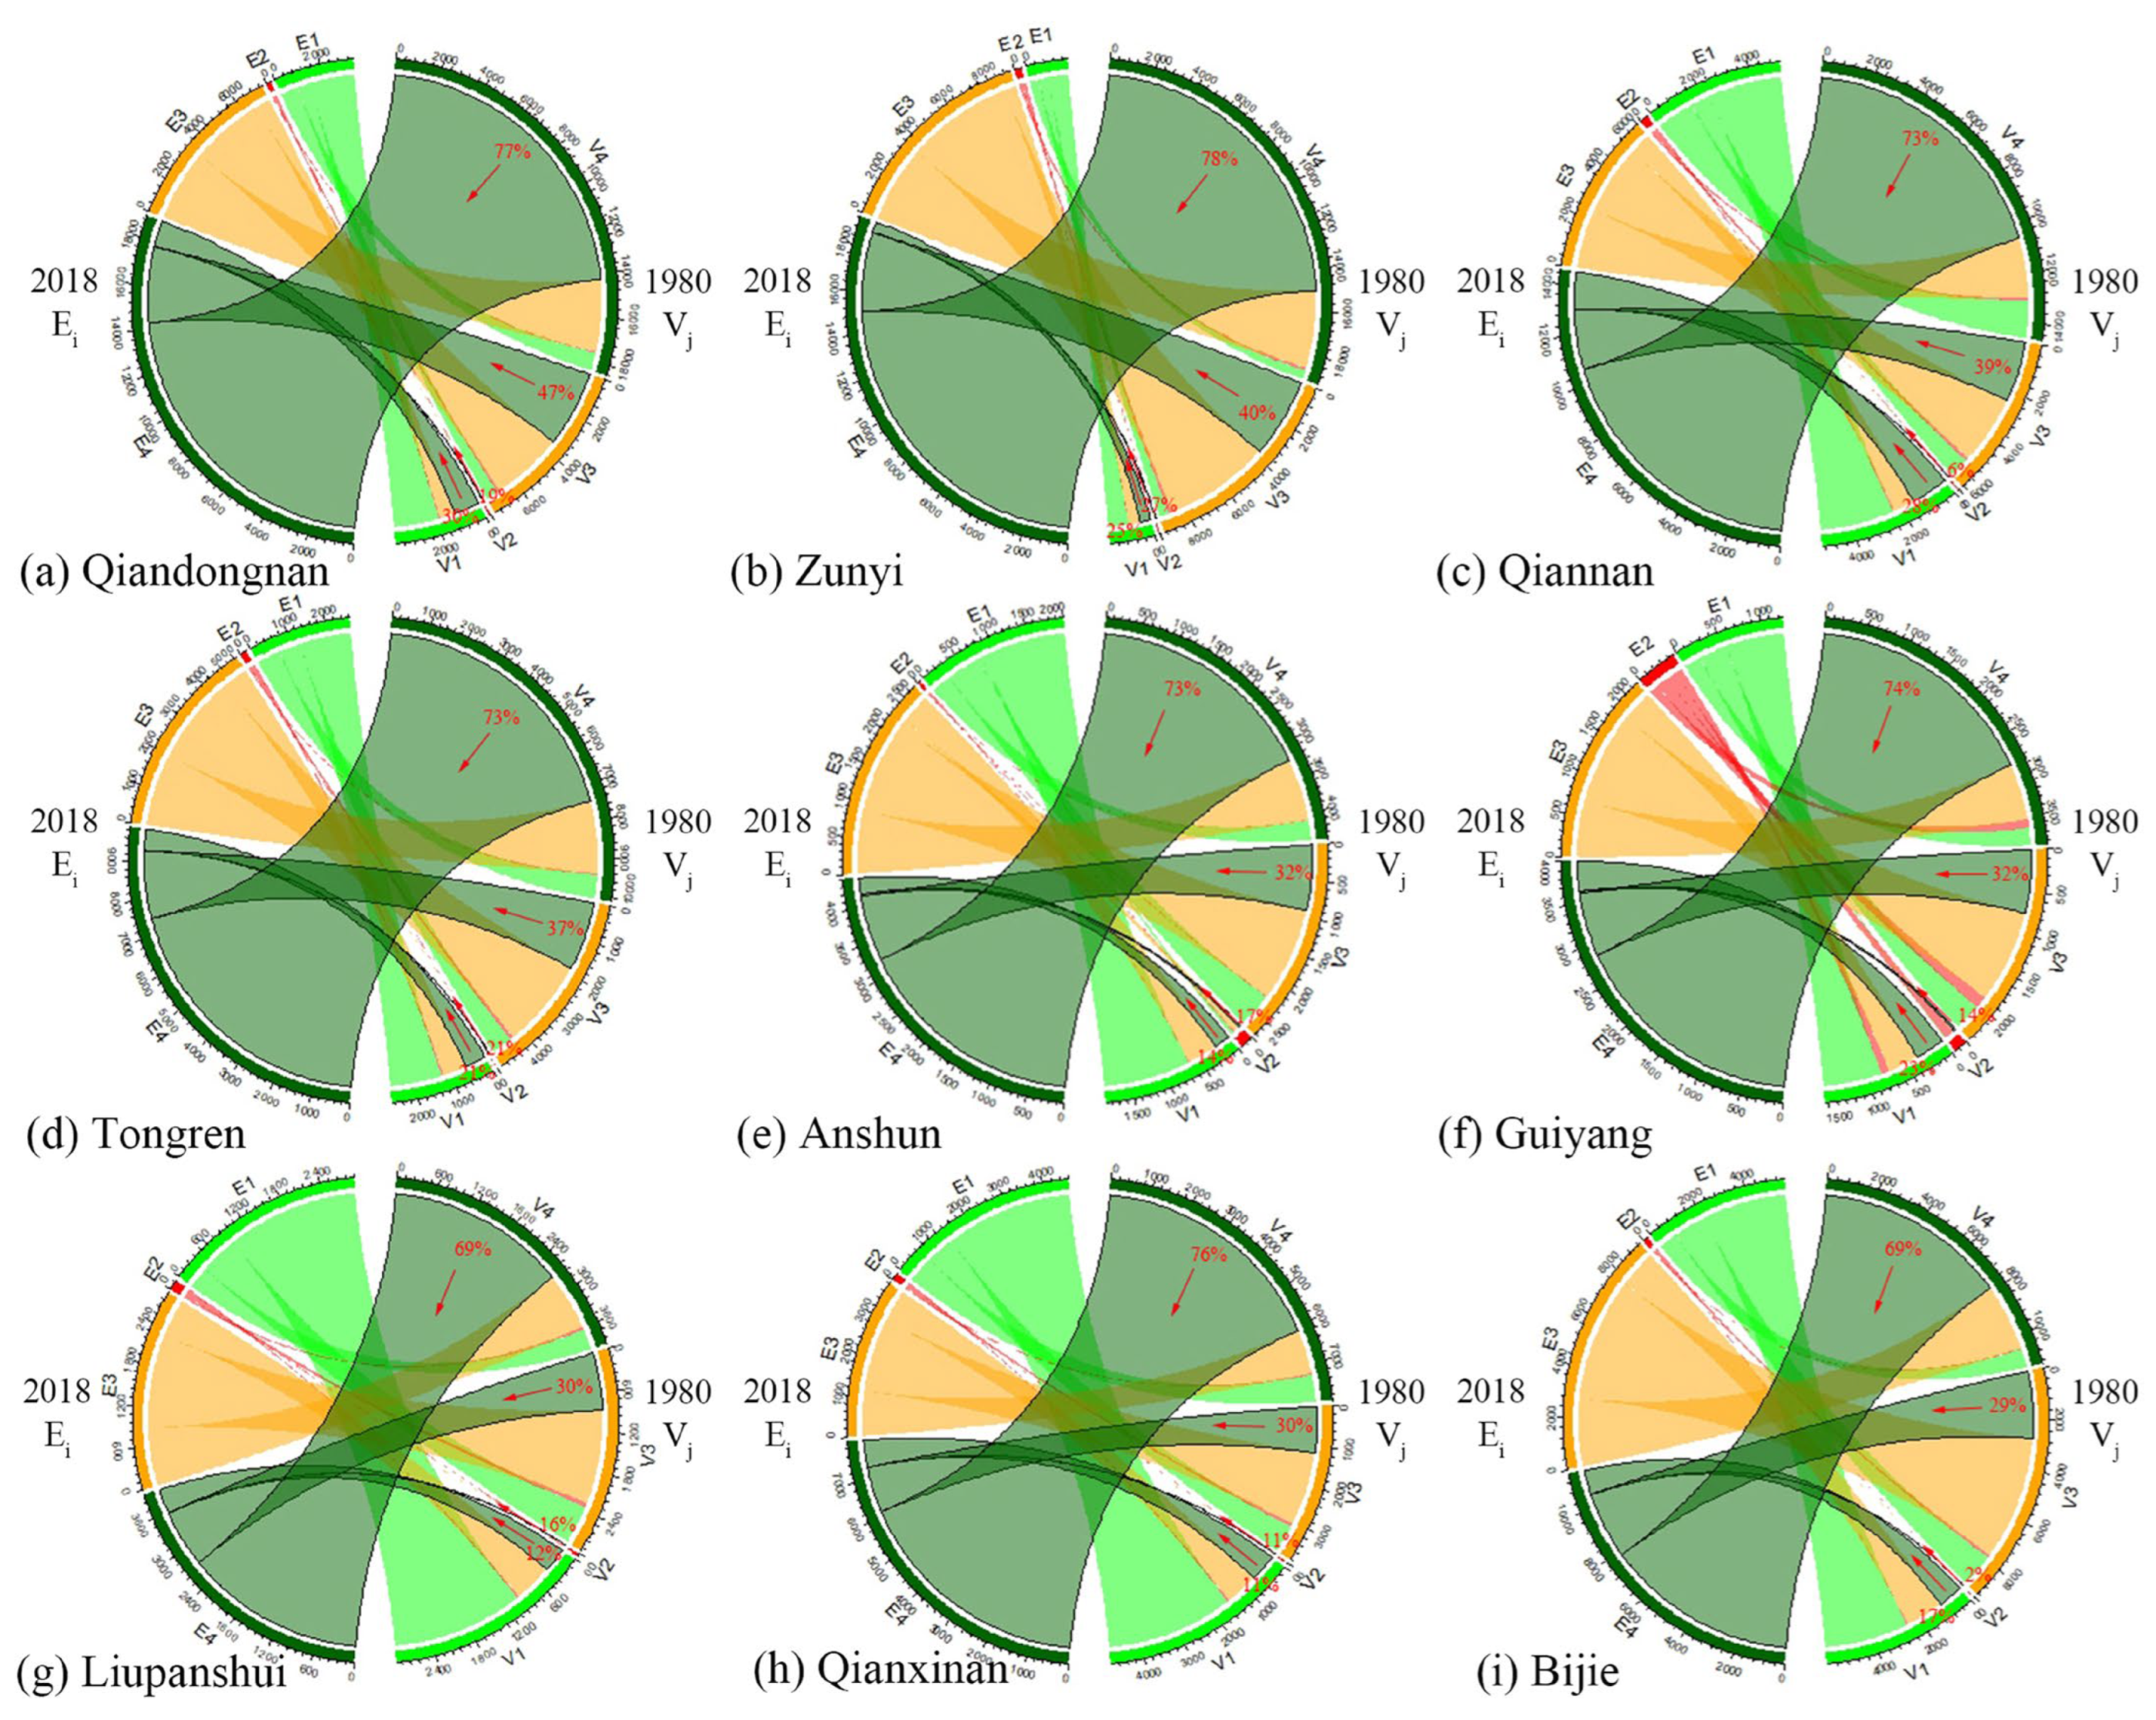
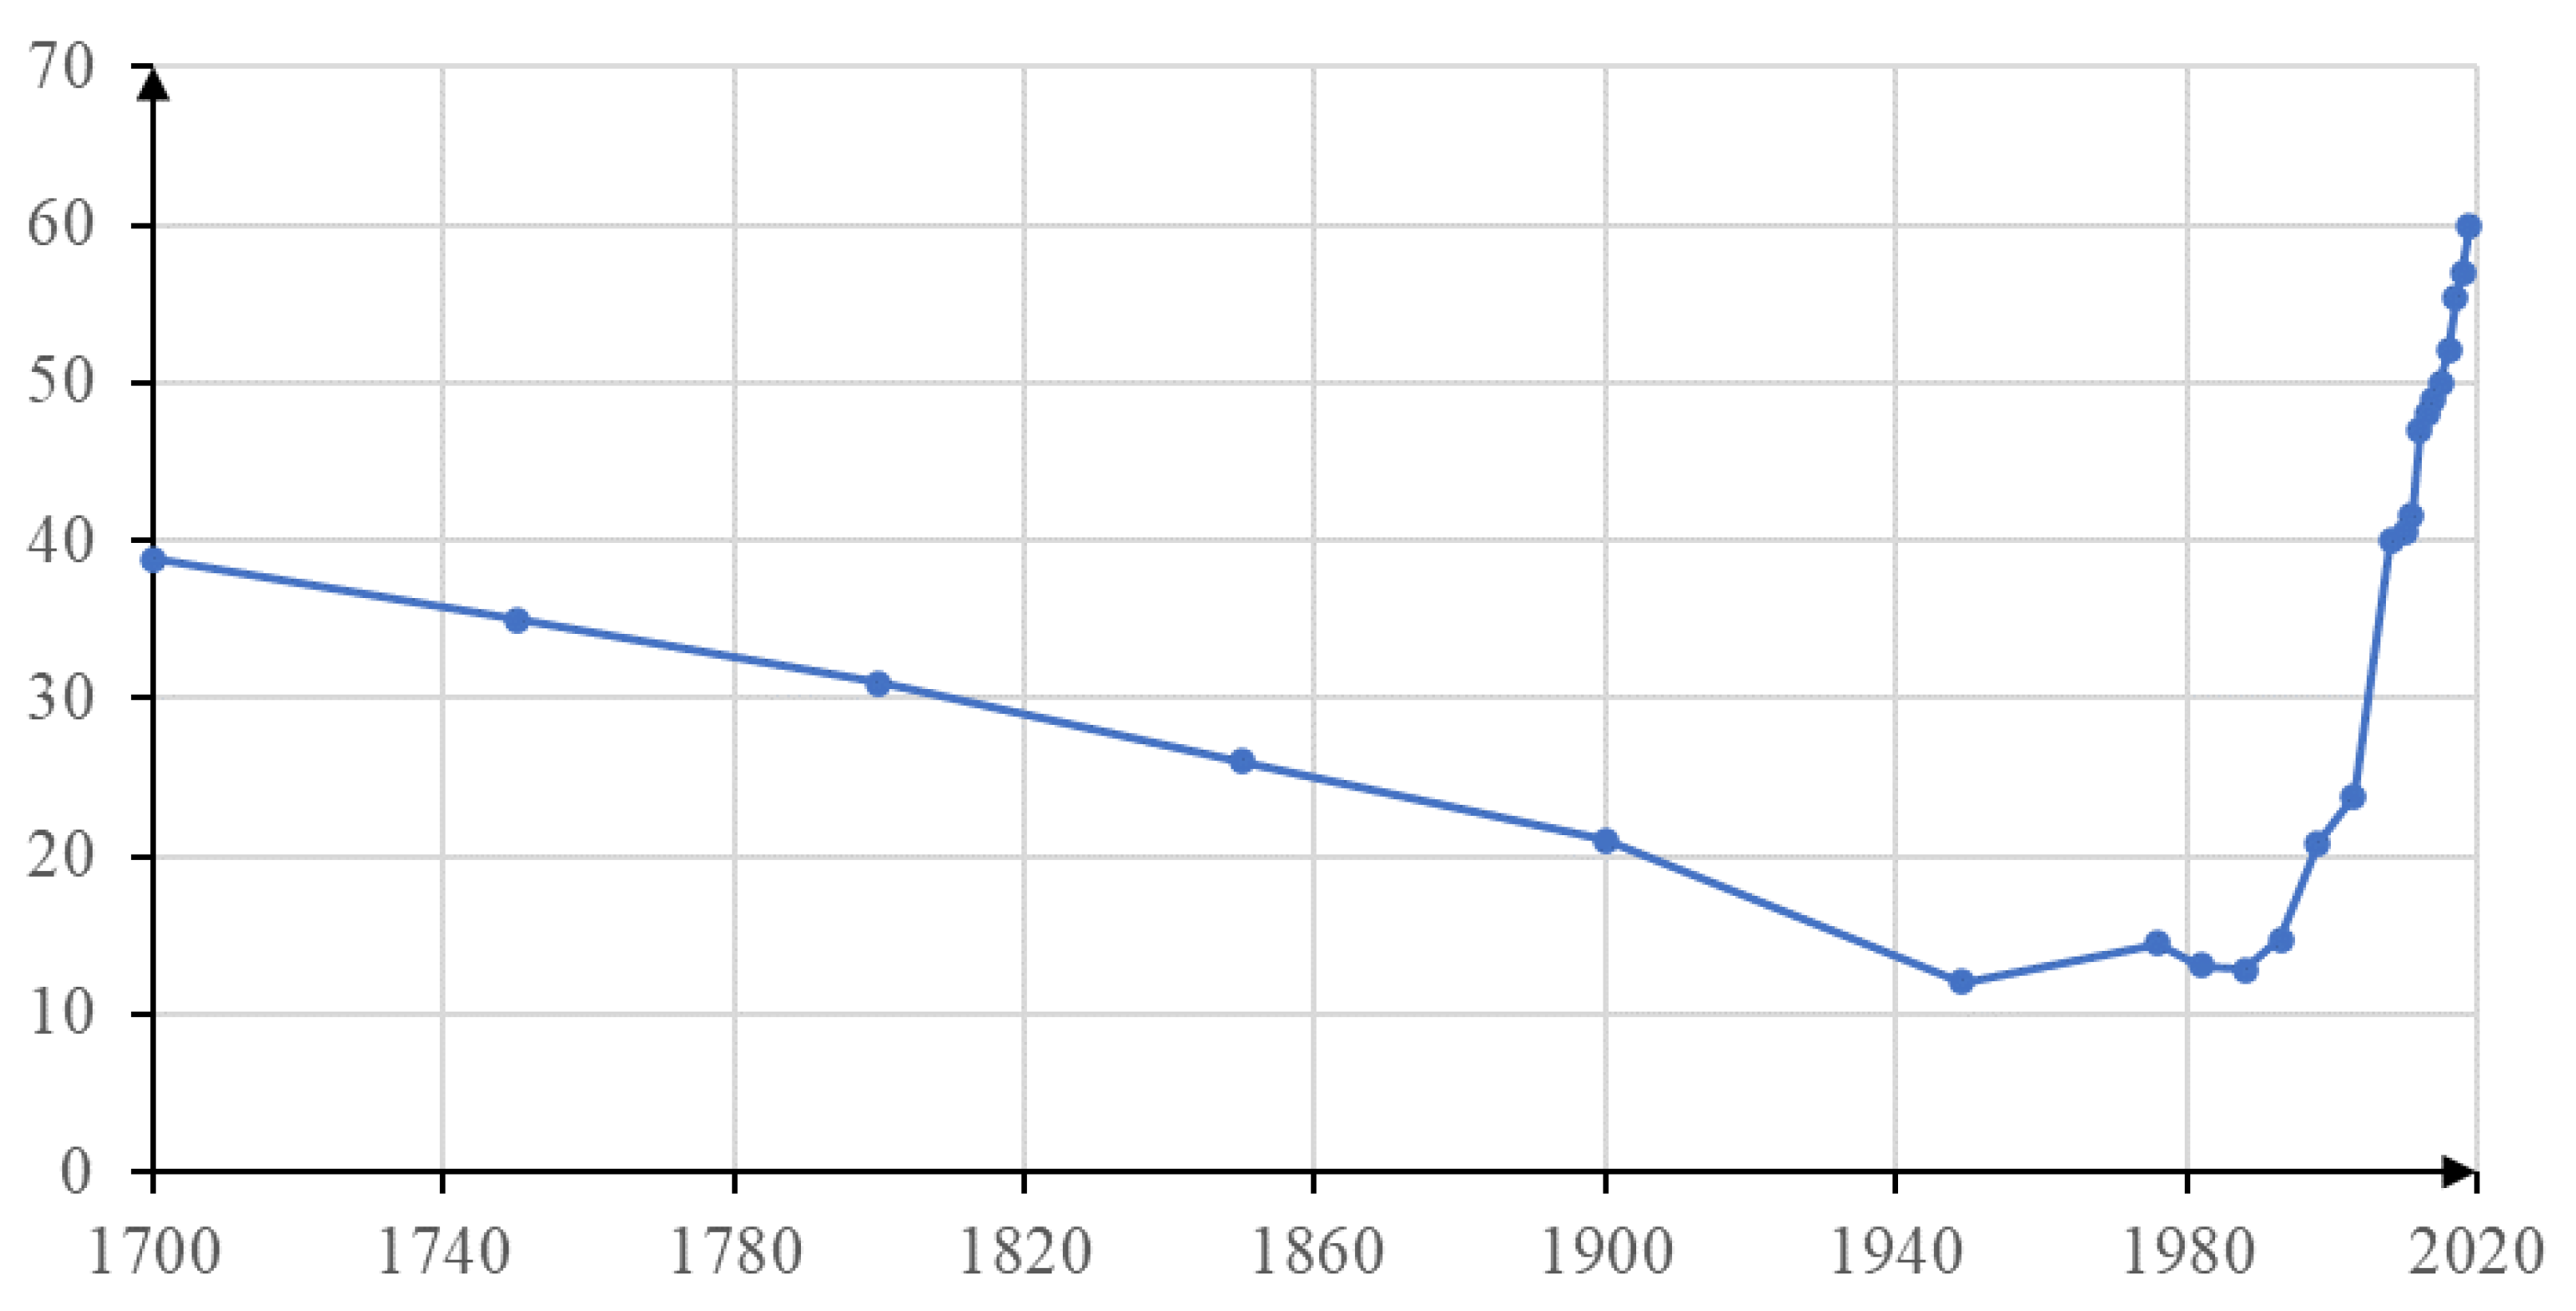
3.1.1. Forest Transition

Forest transition describes the range of forest change, from shrinking to expansion [62,63]. According to Table 3, forests were the largest land-use type (53%) from 1980 to 2018 and, while their distribution remained relatively stable, some increases over time were evident (Figure 3a: Forest change in Guizhou Province). Notably, the forest cover reached its lowest value in 2000. In terms of the forest subtypes, Table 4 shows that the greatest increase was in the category ‘forest land’ (i.e., forests with greater biomass and substantial tree-canopy cover).

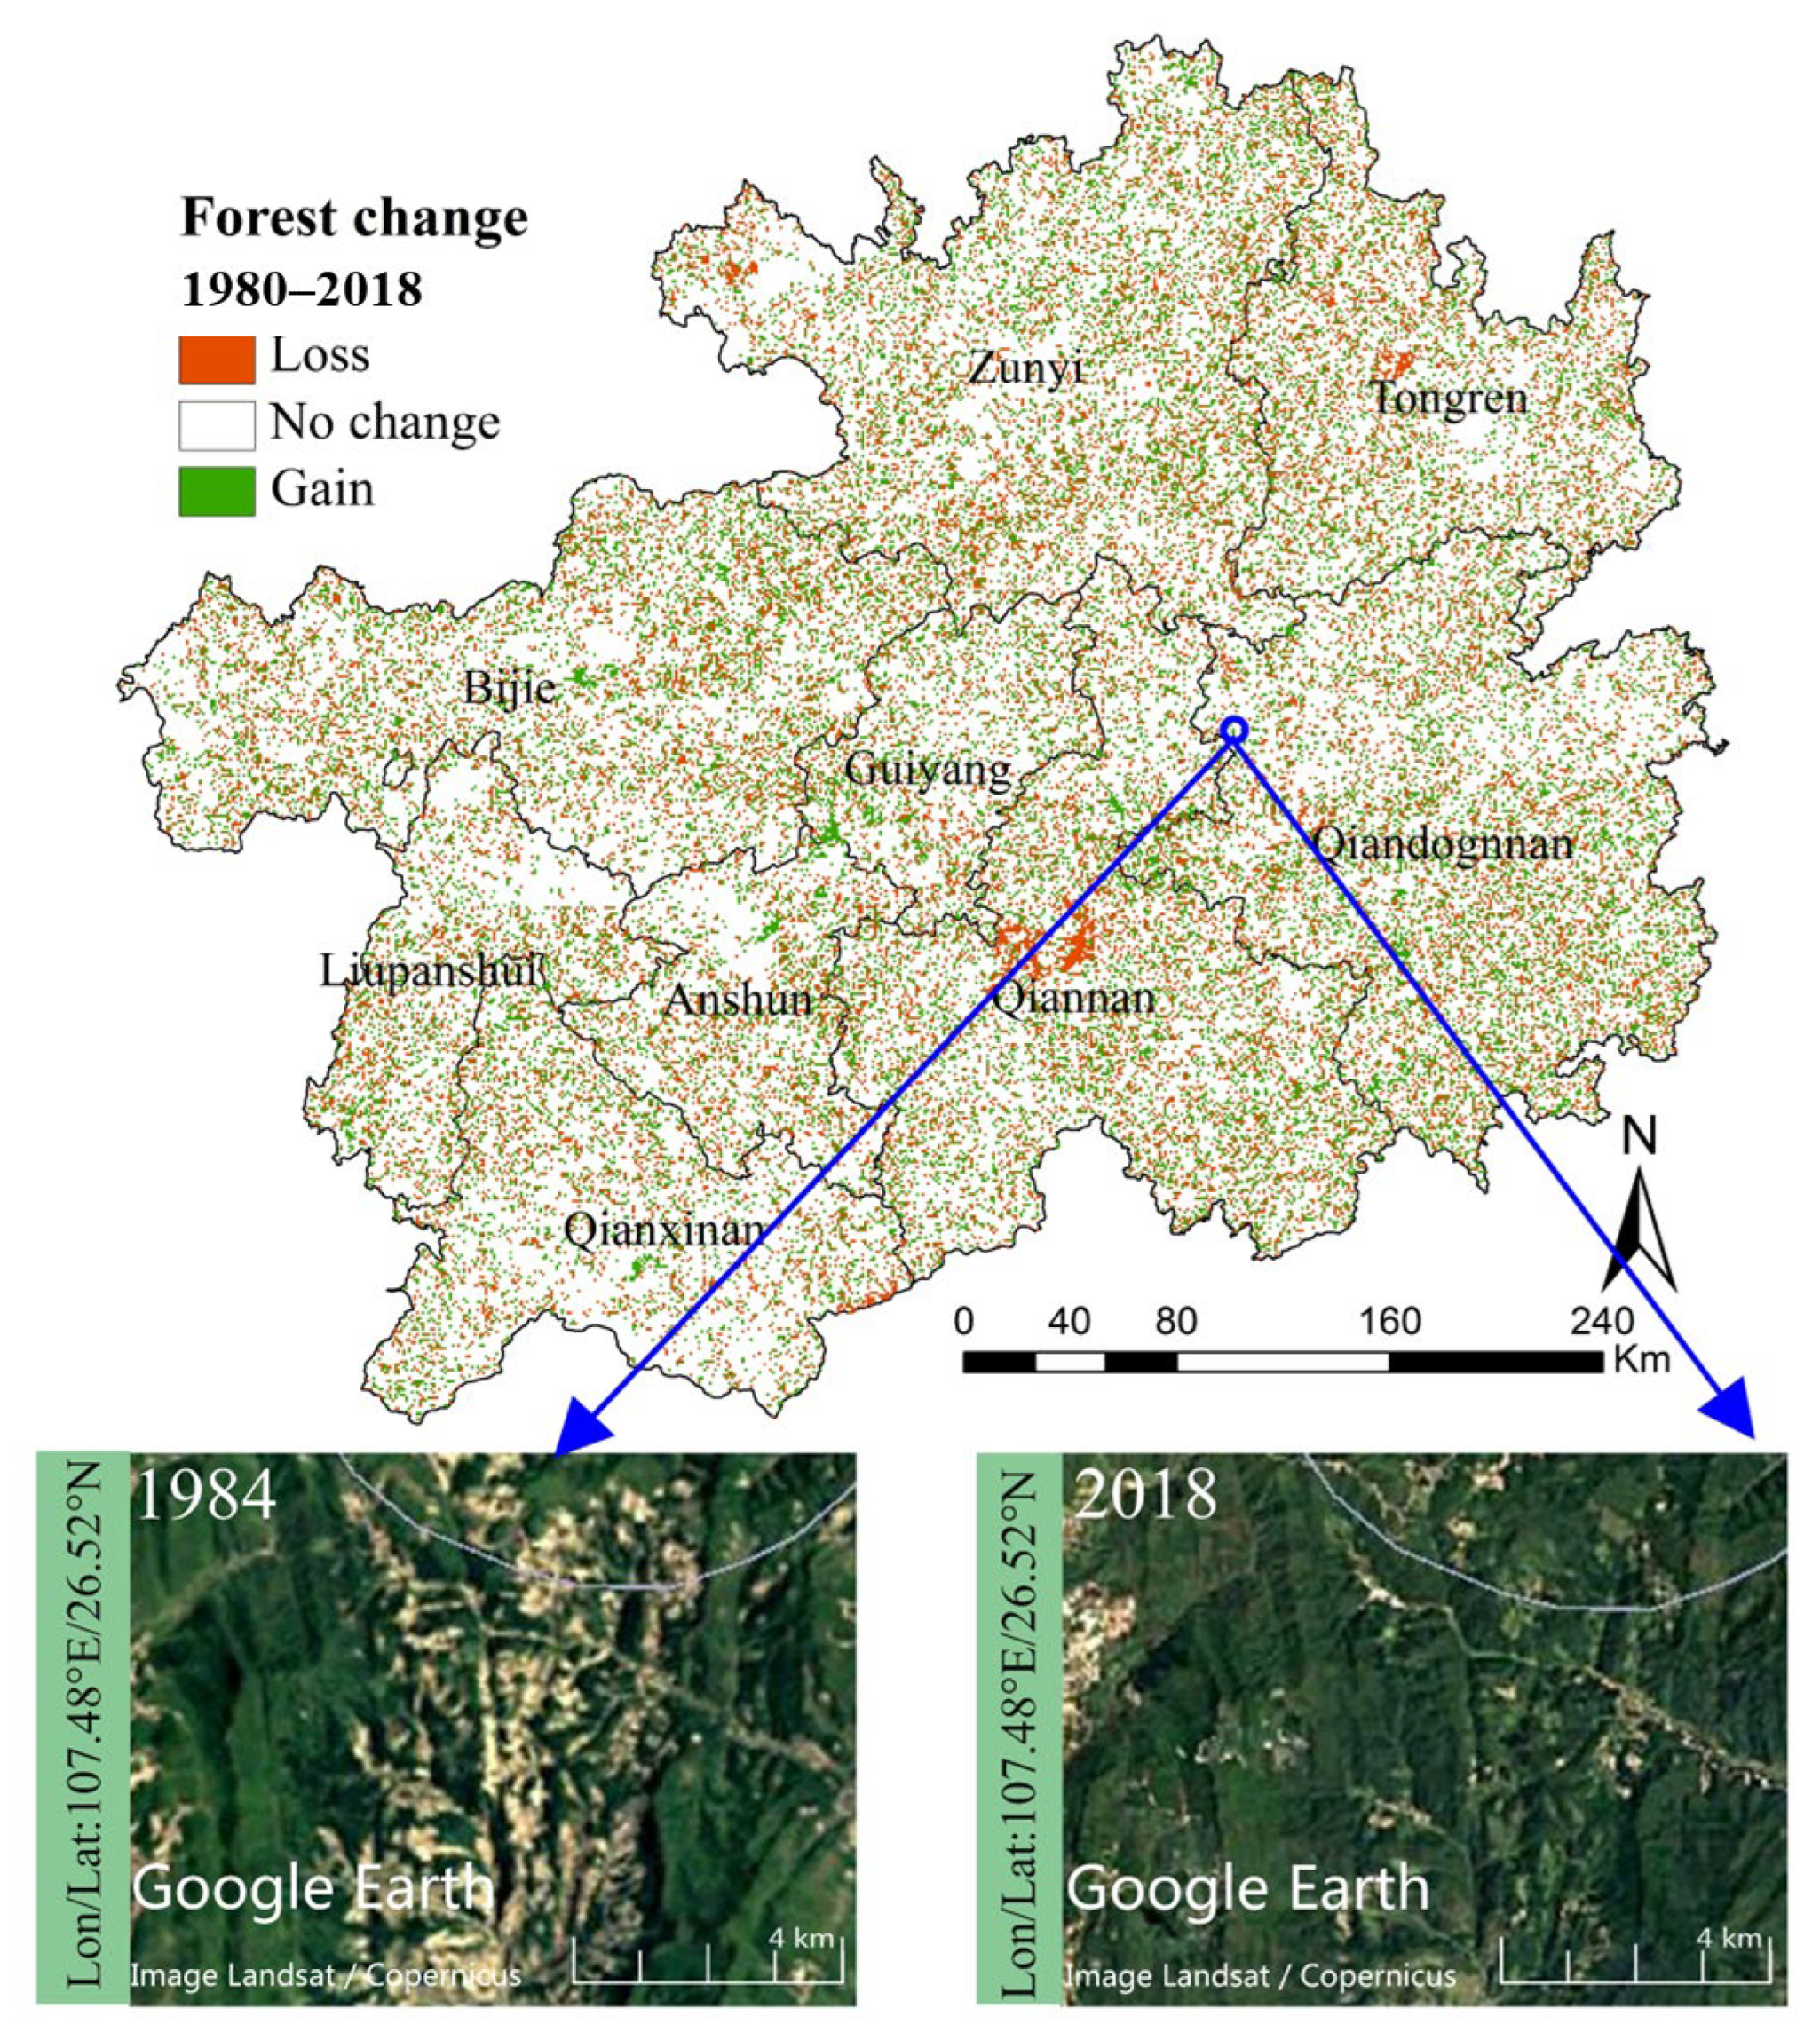
3.1.2. Spatial Changes

The distribution of the forest area in Guizhou is uneven, decreasing from east to west. Figure 3b shows the mean annual proportion of total forest cover in the province’s nine major municipalities from 1980 to 2018. Qiandongnan, in the southeast, and Zunyi, in the north, have the greatest forest cover, accounting for 40% of the overall total, followed by Qiannan (south), Bijie (northwest), Tongren (northeast), and Qianxinan (southwest) with 15%, 12%, 11%, and 9%, respectively. Liupanshui (west), Anshun (next to Liupanshui), and Guiyang (central) have the lowest forest cover.
Based on temporal changes over the last 40 years, Figure 4 and Table 5 suggest that the forest cover was either maintained or increased, with the exception of Tongren, Qiannan, Qianxinan, and Anshun, all of which experienced some degree of forest loss. Qiandongnan experienced the greatest degree of forest increase, with 478 km2 (2.6%), followed by Bijie and Guiyang, with increases of 202 km2 (2.5%) and 138 km2 (3.6%), respectively. Zunyi and Liupanshui both experienced only very limited increases in forest area (34 km2 and 14 km2, respectively).

3.2. Possible Drivers of Forest Change

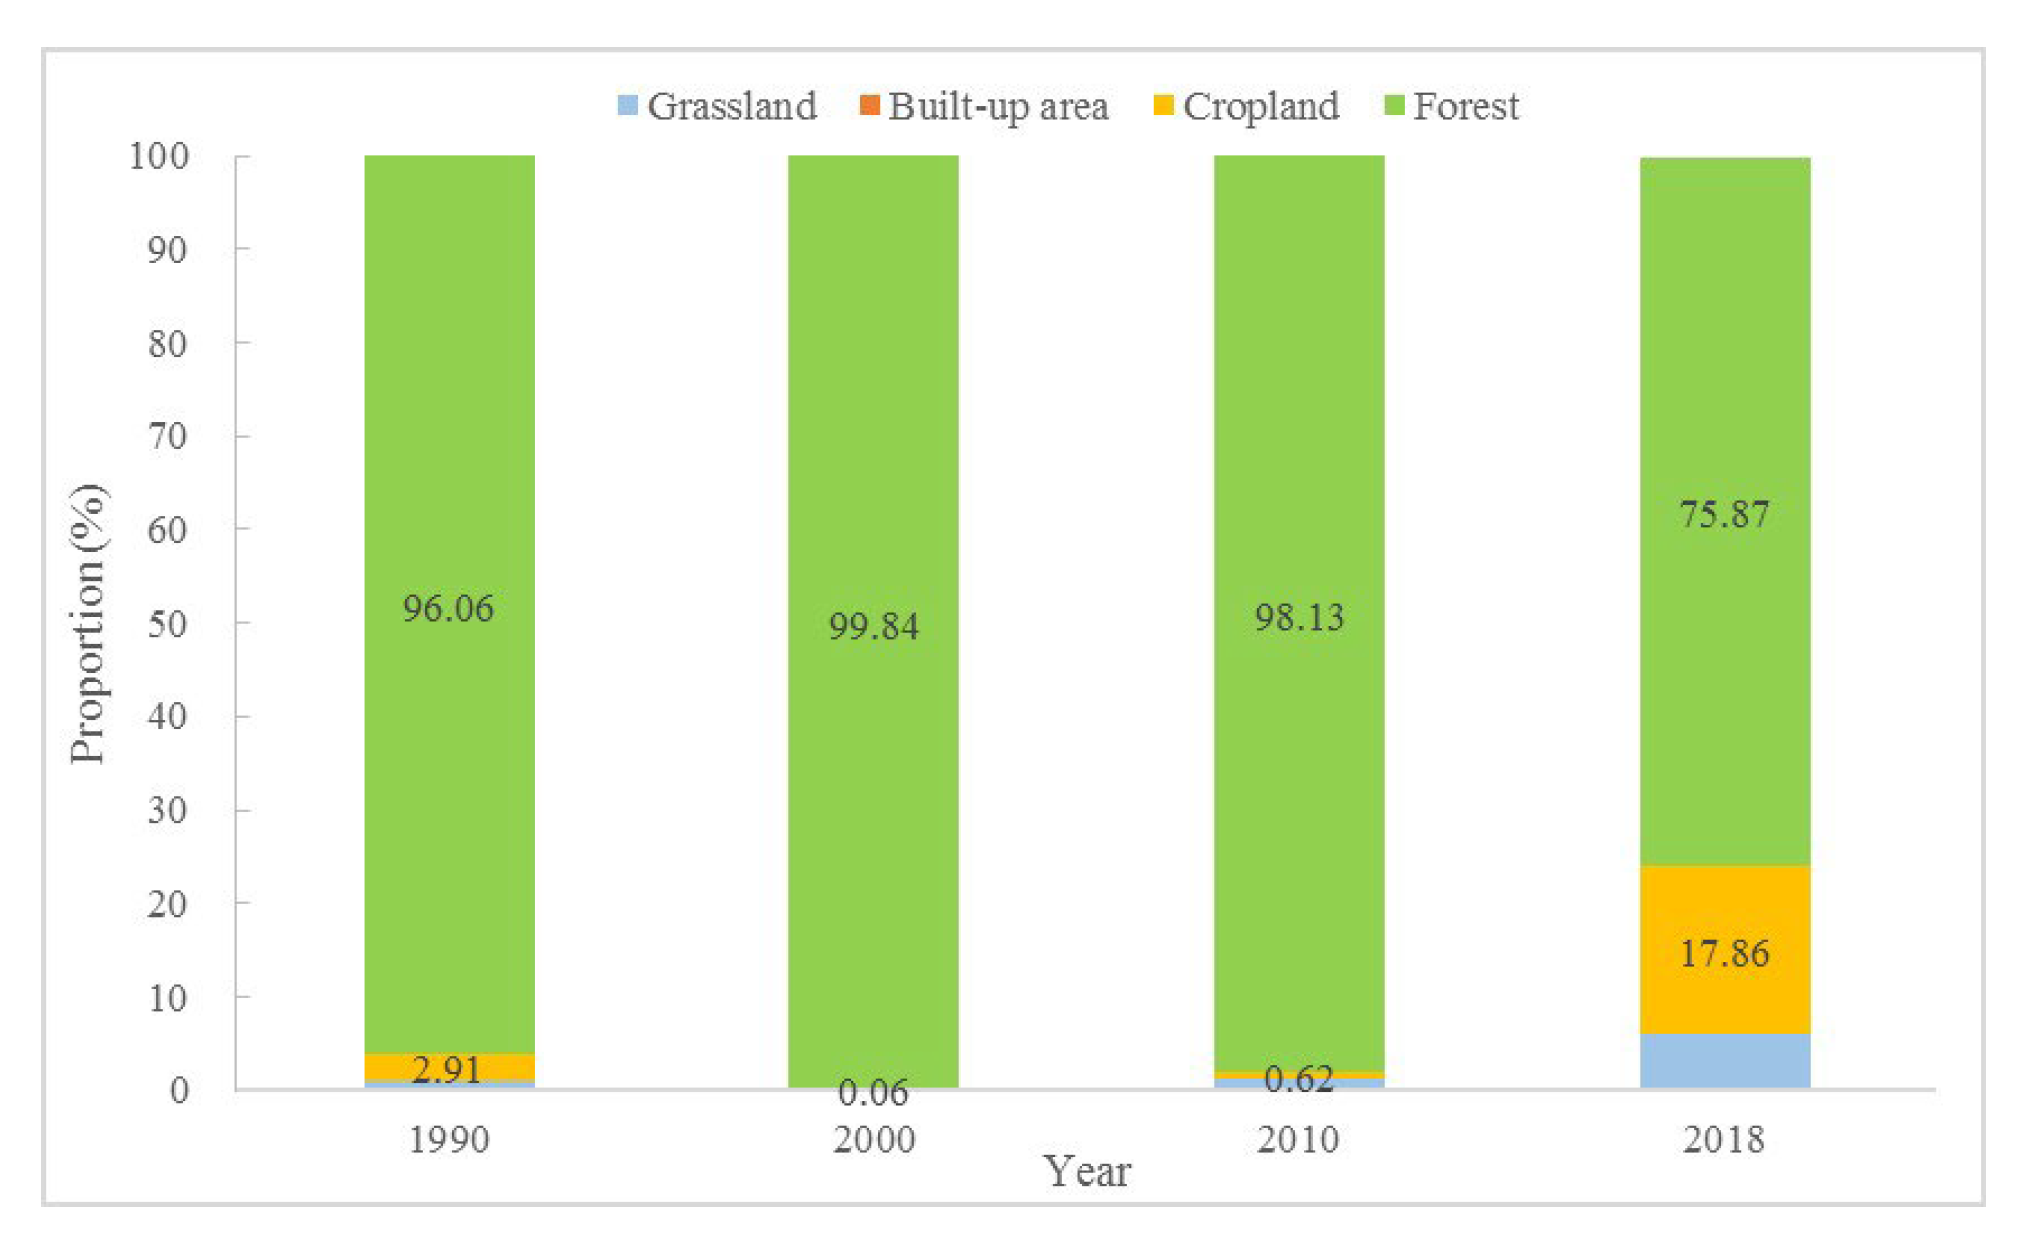
3.2.1. Land-Use Change

Although the overall forest increase during the study period was relatively small across the province as a whole, in very substantial areas, forests replaced agriculture. Figure 5 demonstrates that forests replacing cropland happened in all nine municipalities in Guizhou Province, which is attributable largely to the implementation of the Grain for Green (GFG) project. Indeed, 36% of the cropland was converted into forests, which is significantly higher than the equivalent values for the grassland and construction land. With respect to individual municipalities, 47% of the farmland was converted into forests in Qiandongnan, followed by Zunyi, Qiannan, and Tongren, where 40%, 39%, and 37% of the land, respectively, was converted from agricultural land. Bijie had the smallest portion of cropland converted into forest land (29%).
The implementation of the Grain for Green program accounts for a considerable, and indeed increasing, proportion of the total forest changes in Guizhou (Figure 6). Prior to the implementation of this policy in Guizhou in 2000, the forest cover was largely unchanged. For instance, the forest area increased by only 109 km2 from 1980 to 1990, which was much less than the change during the periods of 1990–2000, 2000–2010, and 2010–2018 (see Figure 3a) and, indeed, the forest cover actually decreased across the province in 2000. In Figure 6, it can be seen that, in 2018, 17% of the cropland was converted into forests in Guizhou. Given that Guizhou is located in the upper and middle reaches of the Yangtze and Pearl Rivers, the forest-cover change has also been brought about by the implementation of two of China’s eight major shelterbelt projects (the Shelterbelt Program for Upper and Middle Reaches of the Yangtze River, 1989 and the Shelterbelt Program for the Pearl River, 1996).

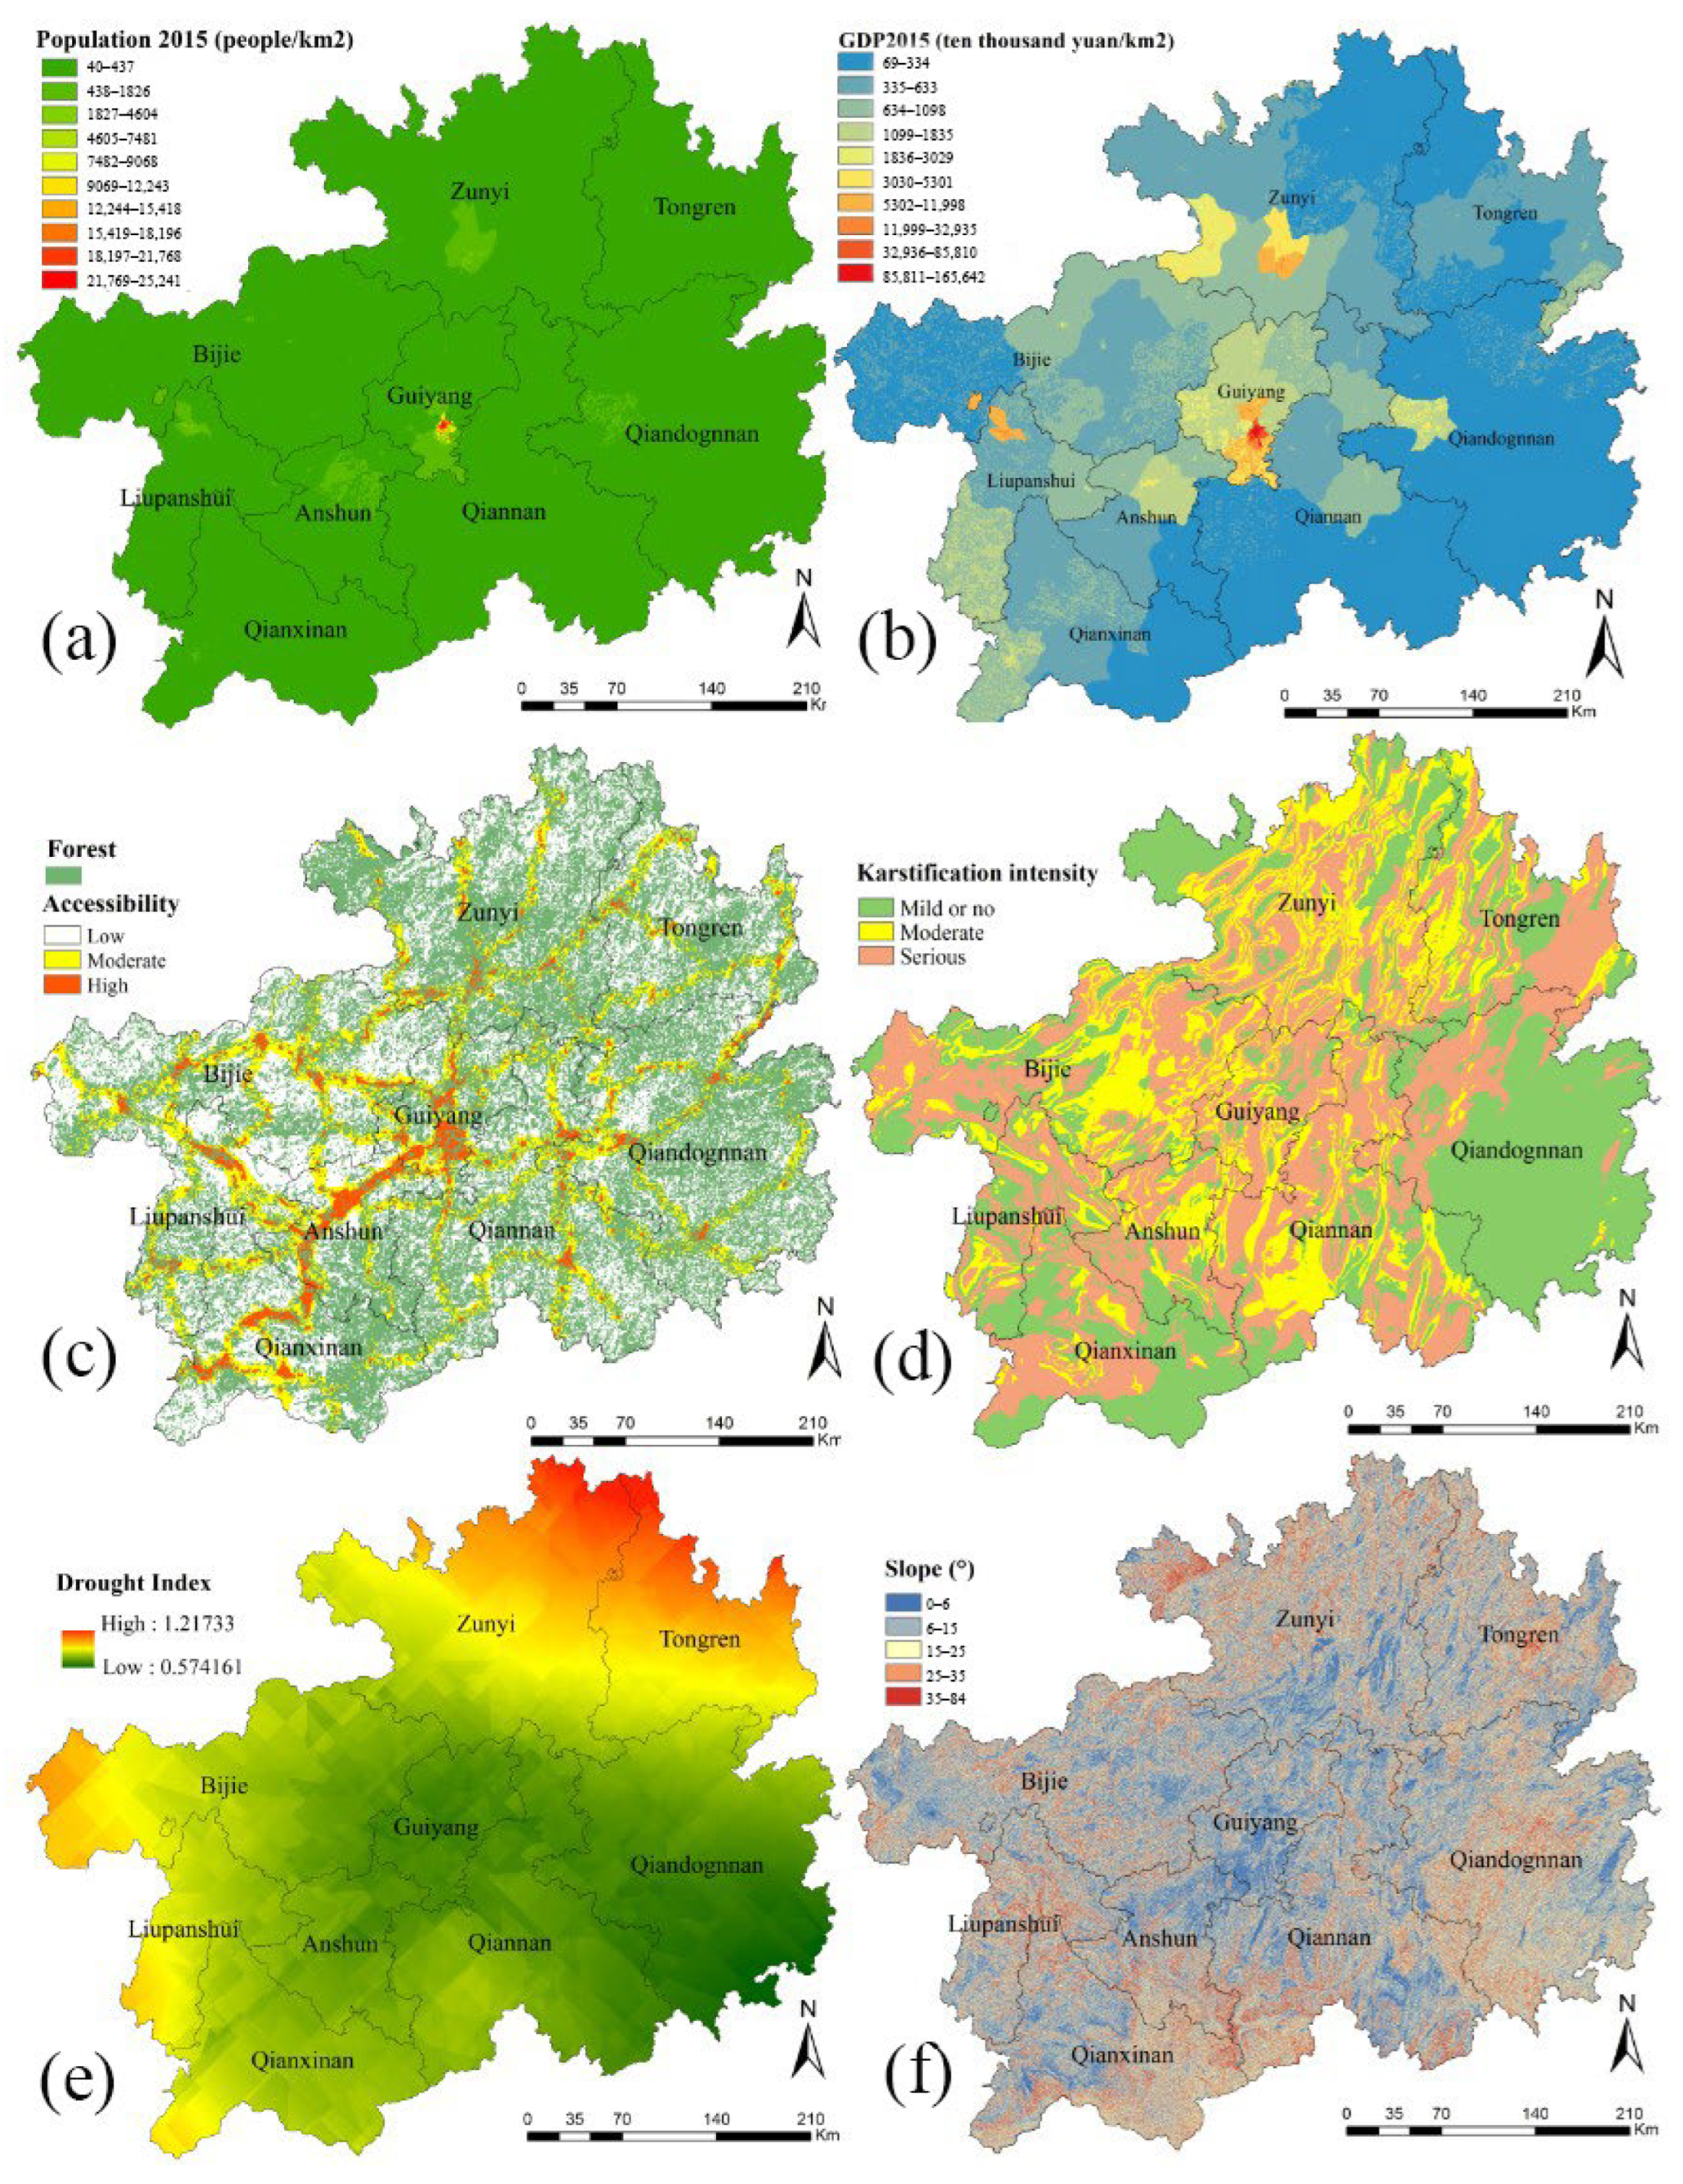
3.2.2. Population Effects

Figure 7a indicates that the population densities are generally higher in the western part of the province and this, in effect, reflects the forest distribution. At a very basic level, therefore, population density influences forest disturbance or clearance, a relationship that is further illustrated through the correlation analysis in Table 6.

3.2.3. GDP

Figure 7b illustrates the GDP per km2, which also takes land use, night light, and settlement density into account (for more details, see sections on methods and data). In parallel with the population density, the western parts of Guizhou province also have high GDP values and lower forest cover, so there is an inverse relationship between GDP and forest area (Table 5). The areas with higher GDP exhibit forest loss as a consequence of economic development and urban expansion.

3.2.4. Accessibility

Figure 7c indicates that access to local transport routes negatively influences forest cover. The road and railway density are greatest in the western and southwestern parts of the province, and the effect of this on forest change is clearly evident. Qiandongnan is characterized by lower accessibility levels and is richer in forest resources, while Guiyang, Anshun, and Liupanshui have greater densities of both road and railway routes, which negatively affect forest recovery.

3.2.5. Karstification Intensity

The substantial karst area in Guizhou province is an important factor because the lack of surface water and relatively thin soils constrain forest development. Indeed, the distribution of karst (Figure 7d) has a negative influence on the forest cover (Table 6).

3.2.6. Drought Index (DI)

The balance between moisture inputs, in the form of precipitation, and outputs, in the form of evaporation, is a key determinant of the vegetation type, and the drought index is used here to account for this balance. Figure 7e illustrates marked spatial patterns in the occurrence of drought in Guizhou province, and suggests that the lower values in Qiandongnan are associated with greater forest cover. Statistically, however, the effect of moisture stress is less marked than may have been expected (Table 6).

3.2.7. Slope

In this study, the slope angle was classified into five categories: 0–6°, 6–15°,15–25°, 25–35°, and >35° (Figure 7f). Specifically, the forests are distributed preferentially on slopes of 15–25° and occur less frequently on lands with lower slope angles, presumably because these lands are more suited to agriculture and urban development. Table 6 illustrates a very strongly positive correlation between slopes of 15–25° and forest area.
From the correlation analysis and multiple general linear models, it can be seen (Table 6) that 15–25° slopes play a dominant role in the forest areas, explaining 88.87% of the variation, while accessibility and land-use change account for 2.29% and 2.27%, respectively, followed by population effects (2.23%), GDP (1.88%), mean annual precipitation (0.97%), karstification intensity (0.85%), and drought index (0.64%).
Table 6 further reveals that the mean annual precipitation, GDP, population effects, land-use changes, accessibility, and slopes of 15–25° all play a role in forest change. Due to data-availability constraints, we ultimately selected mean annual precipitation, GDP, population, and land-use change (LUC) for further analysis as drivers of forest-cover changes.

3.3. Relative Importance of Drivers Changes over Time

To determine the relative importance of the drivers for forest change over time, we conducted a correlation analysis and multiple-GLM regression for the different periods (Table 7), taking the mean annual precipitation (MAP), annual mean temperature (MAT), population, GDP, and cropland conversion into forest as key drivers of forest changes over time, although, given the data limitations, the analysis was conducted only from 1990 to 2018, and the data for GDP and population in 1995 were used for 1990.
In Table 8, it can be seen that, prior to 2000, the population exerted the most significant impact on the forests but, after 2000, its influence was reduced to 3.04%. This may be attributed to the type of economic development in Guizhou before 2000 [64], whereby the inhabitants exploited forests for firewood [65] or settled on unused land [46]. Currently, the substitution of gas and hydropower for firewood helps to reduce the pressures of the population on the forests [65]. The negative effect of GDP on forest change diminished over the years, probably due to the transformations associated with economic development, which has reduced dependence on the direct consumption of natural resources, including forests [66]. The impact of the land-use change, mainly the conversion of cropland into forests, increased to 91.81% by 2018, probably as a consequence of the implementation of GFG [67]. While some fluctuations were observed during dry periods, the influence of MAP and MAT on the forest cover did not vary substantially in recent years.

4. Discussion

4.1. Validation of Forest Change in Guizhou through Comparison with Other Data Sources

We compared the results of our study with those of other land-use products to verify the trends in the forest changes (Table 8 and Table 9). We used ArcGIS spatial analysis to determine the forest change according to MODIS/006/MCD12Q1, GlobeLand30, and GLASS-GLC. It can be seen in Table 6 that all the products show an increasing trend in forest cover during recent decades, albeit with some interannual differences. Table 8 reveals that the data sources, definition/classification criteria, classification technique, and spatial resolution of the land-use data underlie the differences in the estimation of different annual forest areas and forest changes [68,69]. For example, the differences in spatial resolution between GLASS-GLC and CNLUCC may affect the land-cover classification and explain the minor differences in forest-change estimation. Moreover, shrubland is a single class in Global Land 30, and it is not classified as forest land, which may explain why the forest-change increase in Global Land 30 is lower than that in this study. Some grasslands are misclassified as shrublands in MODIS/006/MCD12Q1 and, since shrublands are components of ‘forest’ [70], the forest change from 2000 to 2018 in that product is much greater than in the results presented by CNLUCC, in which grassland is a single category, independent of forest cover. Moreover, CNLUCC is obtained through detailed field data [71], and it has been widely applied in many major projects, such as the Western Development of China and the second national soil-erosion survey of China, among others (http://www.resdc.cn/data.aspx?DATAID=95 (accessed on 30 January 2020)), which indicates its reliability. It is noteworthy that in CNLUCC, the forest area decreased in 2000, while in GLASS-GLC, it marginally increased. This difference has two possible causes, viz. the two products differ in terms of spatial resolution and classification technique. Notably, the spring and summer droughts in 1989 and the serious drought in southwestern China in 2000 may have interrupted the otherwise consistent increase in forest cover over time [72].

4.2. The Effects of Ecological Restoration Policy on Forest Change

Guizhou has the largest karst area in the world [73]. Since the release of the “Decision on Basic Greening of Guizhou in Ten Years” in 1990, China has implemented a batch of key projects to protect and restore the fragile ecological environment. These include the Shelterbelt Program for Upper and Middle Reaches of the Yangtze River (1989), the Natural Forest Protection Project (1998), and the Grain for Green program (1999), all of which were applied in Guizhou and contribute to greening [74,75]. In 2008, China imposed the “Outline of Comprehensive Control Plan for Rocky Desertification in Karst Areas,” which included 55 counties in Guizhou Province among China’s 100 pilot counties for the comprehensive control of rocky desertification, with the aim of further restoring the ecological environment. In subsequent years, Guizhou vigorously supported the development and protection of forest resources through various initiatives, such as the Afforestation Planning across County and Township and Village in Guizhou Province (2014–2017), the Three Year Action Plan for Green Guizhou Construction (2015–2017), the Guizhou Forestry Industry Three Year Multiplication Plan (2015–2017), the Implementation Plan on Promoting the Development of Forestry Industry in Guizhou Province, and the Ten Forestry Industry Bases Construction Plan of Guizhou Province (2018–2020). Additionally, to strengthen the protection of forest resources, Guizhou strictly implemented a forest-cutting quota system to ensure that the total growth of trees was far greater than the total consumption. It also carried out forest-ecological-benefit compensation (2004) and enforced a special law enforcement campaign to protect forest (2014). Guizhou has also reviewed and approved the use of forest land and defined the forestry ecological red line to strictly protect and rationally use forest land resources [76].
In short, China as a whole, and Guizhou in particular, have implemented various targeted policies to hasten vegetation restoration and protect their forests, all of which have contributed to the increase in forest cover (Figure 8). With the implementation of ecological-restoration and protection programs, this trend seems set to continue [16]. According to the Guizhou Statistical Yearbook, forest cover is defined as the ratio of the forest area to the total land area, expressed as a percentage. According to national regulations, this also includes shrublands and farmland–forest mosaic areas. Therefore, the level of forest resources and greening is even greater than that recorded in our study.

4.3. Limitations and Prospects

Although forest changes may be driven by multiple factors, not all of which are addressed in this study, our analysis, based on the conditions of the study area, considers the factors that are most likely to be significant. The findings offer important support for the government in identifying key areas for forest conservation and restoration.
Nevertheless, there are some limitations. For example, the data relating to some of the explanatory variables were not available for the entire period, meaning that in some cases, we used data from the closest suitable year in the analysis. Other relevant driving factors should be the subject of future research and analysis, such as the choice of afforestation species, the method of production of seedlings, and specific planting-environment conditions. Species selection, in particular, is a key challenge in afforestation [77,78], and the selection of the correct species mixtures can markedly increase the success of the restoration. In addition, the choice of appropriate species for specific environments, which can adapt to current and future environmental conditions, is crucial [79]. In degraded ecosystems, planting species that can withstand particular environmental constraints should be used. Other factors, such as the occurrence of vegetation fires, also need to be considered [80], as these may affect the rate of tree recruitment, forest-age structure, and species composition [81,82]. The effects of soil humidity on forest recovery are complex and may be important in seed germination [83], while soil moisture is a further constraint on successful regeneration [84].

5. Conclusions

In Guizhou province, forests are a prominent land type due to the favorable hydrothermal conditions, and the results of this study show that the forest cover has increased over the last few decades. In terms of area, Qiandongnan holds the largest share of forest, and experienced the most substantial increase of all the nine municipalities during the study period. On the other hand, Liupanshui, in the west of Guizhou, has the lowest forest cover and exhibited very little change overall. While forest changes are the result of both natural and artificial factors, the relative influence of these factors shifted over time. Prior to 2000, the population exerted a much stronger influence on the forests but, since then, the function of other factors has increased, particularly land-use changes. The nine major municipalities in Guizhou experienced different outcomes as a result, with Qiandongnan exhibiting the highest percentage of farmland converted into forest, at 47%, followed by Zunyi, with 40%, Qiannan, with 39%, and Tongren, with 37%. Bijie has the smallest portion of cropland converted into forest (29%). These results emphasize the dynamic nature of driving forces in determining forest cover and demonstrate the value of geospatial analysis in understanding their emerging influence. The methodology and modeling approach adopted here are used to illustrate the relative roles of natural and management factors and may be applied in other similar regions to reduce forest degradation and increase forest restoration.

Author Contributions

Conceptualization: R.C.; methodology: X.G., Q.L. and Z.X.; writing—original draft: X.G. and R.C.; writing—review and editing: X.G., R.C., M.E.M., Q.L., Z.X. and Z.P. All authors have read and agreed to the published version of the manuscript.

Funding

This study was conducted with the support of the National Social Science Fund of China (Grant No.20ZDA085), the National Key Research and Development Program of China (Grant No. 2017YFC1503001), and the China Postdoctoral Science Foundation (Grant No. 2022M722055 & 2022TQ0205).

Data Availability Statement

The source of relevant data acquisition has been described in the text.

Conflicts of Interest

The authors declare no conflict of interest.

References

  1. Curtis, P.G.; Slay, C.M.; Harris, N.L.; Tyukavina, A.; Hansen, M.C. Classifying drivers of global forest loss. Science 2018, 361, 1108. [Google Scholar] [CrossRef] [PubMed]
  2. McAlpine, C.; Johnson, A.; Salazar, A.; Syktus, J.; Wilson, K.; Meijaard, E.; Seabrook, L.; Dargusch, P.; Nordin, H.; Sheil, D. Forest loss and Borneo’s climate. Environ. Res. Lett. 2018, 13, 044009. [Google Scholar] [CrossRef]
  3. Viña, A.; McConnell, W.J.; Yang, H.; Xu, Z.; Liu, J. Effects of conservation policy on China’s forest recovery. Sci. Adv. 2016, 2, e1500965. [Google Scholar] [CrossRef] [PubMed]
  4. Siqueira-Gay, J.; Sonter, L.J.; Sánchez, L.E. Exploring potential impacts of mining on forest loss and fragmentation within a biodiverse region of Brazil’s northeastern Amazon. Resour. Policy 2020, 67, 101662. [Google Scholar] [CrossRef]
  5. Bryan, B.A.; Gao, L.; Ye, Y.; Sun, X.; Connor, J.D.; Crossman, N.D.; Stafford-Smith, M.; Wu, J.; He, C.; Yu, D.; et al. China’s response to a national land-system sustainability emergency. Nature 2018, 559, 193–204. [Google Scholar] [CrossRef]
  6. Hong, Y.; Du, M. Greening Efforts Push China’s Forest Coverage Rate to over 23 Pct. Available online: http://en.people.cn/n3/2021/0629/c90000-9866358.html (accessed on 30 December 2021).
  7. Chen, C.; Park, T.; Wang, X.; Piao, S.; Xu, B.; Chaturvedi, R.K.; Fuchs, R.; Brovkin, V.; Ciais, P.; Fensholt, R.; et al. China and India lead in greening of the world through land-use management. Nat. Sustain. 2019, 2, 122–129. [Google Scholar] [CrossRef]
  8. Guizhou Statistics Bureau. Guizhou Statistical Yearbook; China Statistics Press: Beijing, China, 2021. [Google Scholar]
  9. Tong, X.; Brandt, M.; Yue, Y.; Ciais, P.; Rudbeck Jepsen, M.; Penuelas, J.; Wigneron, J.-P.; Xiao, X.; Song, X.-P.; Horion, S.; et al. Forest management in southern China generates short term extensive carbon sequestration. Nat. Commun. 2020, 11, 129. [Google Scholar] [CrossRef]
  10. Tong, X.; Brandt, M.; Yue, Y.; Horion, S.; Wang, K.; Keersmaecker, W.D.; Tian, F.; Schurgers, G.; Xiao, X.; Luo, Y.; et al. Increased vegetation growth and carbon stock in China karst via ecological engineering. Nat. Sustain. 2018, 1, 44–50. [Google Scholar] [CrossRef]
  11. Huang, L.; Wang, B.; Niu, X.; Gao, P.; Song, Q. Changes in ecosystem services and an analysis of driving factors for China’s Natural Forest Conservation Program. Ecol. Evol. 2019, 9, 3700–3716. [Google Scholar] [CrossRef]
  12. Xiong, Q.; Li, L.; Luo, X.; He, X.; Zhang, L.; Pan, K.; Liu, C.; Sun, H. Driving forces for recovery of forest vegetation after harvesting a subalpine oak forest in eastern Tibetan Plateau. Environ. Sci. Pollut. Res. 2021, 28, 67748–67763. [Google Scholar] [CrossRef]
  13. Zhao, Y.; Ren, H.; Li, X. Forest Transition and Its Driving Forces in the Qian-Gui Karst Mountainous Areas. J. Resour. Ecol. 2020, 11, 59–68. [Google Scholar]
  14. Sitters, J.; Holmgren, M.; Stoorvogel, J.J.; López, B.C. Rainfall-Tuned Management Facilitates Dry Forest Recovery. Restor. Ecol. 2012, 20, 33–42. [Google Scholar] [CrossRef]
  15. Bronson, D.R.; Gower, S.T.; Tanner, M.; Van Herk, I. Effect of ecosystem warming on boreal black spruce bud burst and shoot growth. Glob. Change Biol. 2009, 15, 1534–1543. [Google Scholar] [CrossRef]
  16. Wang, H.; Lv, Z.; Gu, L.; Wen, C. Observations of China’s forest change (2000–2013) based on Global Forest Watch dataset. Biodivers. Sci. 2015, 23, 575–582. [Google Scholar] [CrossRef]
  17. Li, H.; Ma, Y.; Liu, W.; Wenjun, L. Clearance and fragmentation of tropical rain forest in Xishuangbanna, SW, China. Biodivers. Conserv. 2009, 18, 3421–3440. [Google Scholar] [CrossRef]
  18. Zhai, D.; Xu, J.; Dai, Z.; Cannon, C.H.; Grumbine, R.E. Increasing tree cover while losing diverse natural forests in tropical Hainan, China. Reg. Environ. Change 2013, 14, 611–621. [Google Scholar] [CrossRef]
  19. Zhang, J.Y.; Dai, M.H.; Wang, L.C.; Zeng, C.F.; Su, W.C. The challenge and future of rocky desertification control in karst areas in southwest China. Solid Earth 2016, 7, 83–91. [Google Scholar] [CrossRef]
  20. Xiong, K. Remote-Sensing and GIS-Based Typical Study of Rock Desertification in Karst Areas; Chinese Geological Press: Beijing, China, 2002. [Google Scholar]
  21. Wang, S.; Ji, H.; Ouyang, Z.; Zhou, D.; Zhen, L.; Li, T. Preliminary study on carbonate rock weathering pedogenesis. Sci. China 1999, 42, 572–581. [Google Scholar] [CrossRef]
  22. Chen, R.; Ye, C.; Cai, Y.; Xing, X. Integrated Restoration of Small Watershed in Karst Regions of Southwest China. AMBIO 2012, 41, 907–912. [Google Scholar] [CrossRef]
  23. Yan, X.; Cai, Y. Multi-scale anthropogenic driving forces of karst rocky desertification in southwest China. Land Degrad. Dev. 2015, 26, 193–200. [Google Scholar] [CrossRef]
  24. Li, D.; Liu, J.; Chen, H.; Zheng, L.; Wen, L.; Wang, K. Forage grass cultivation increases soil organic carbon and nitrogen pools in a karst region, southwest China. Land Degrad. Dev. 2018, 29, 4397–4404. [Google Scholar] [CrossRef]
  25. Liu, X.; Zhang, W.; Wu, M.; Ye, Y.; Wang, K.; Li, D. Changes in soil nitrogen stocks following vegetation restoration in a typical karst catchment. Land Degrad. Dev. 2019, 30, 60–72. [Google Scholar] [CrossRef]
  26. Dai, Q.; Peng, X.; Wang, P.; Li, C.; Shao, H. Surface erosion and underground leakage of yellow soil on slopes in karst regionS of southwest China. Land Degrad. Dev. 2018, 29, 2438–2448. [Google Scholar] [CrossRef]
  27. Bai, X.Y.; Zhang, X.B.; Chen, H.; He, Y.B. Using Cs-137 fingerprinting technique to estimate sediment deposition and erosion rates from Yongkang depression in the karst region of Southwest China. Land Degrad. Dev. 2010, 21, 474–479. [Google Scholar] [CrossRef]
  28. Dai, Q.; Peng, X.; Zhao, L.; Shao, H.; Yang, Z. Effects of underground pore fissures on soil erosion and sediment yield on karst slopes: Soil erosion and sediment on karst slopes. Land Degrad. Dev. 2017, 28, 1922–1932. [Google Scholar] [CrossRef]
  29. Guo, F.; Jiang, G.; Yuan, D.; Polk, J.S. Evolution of major environmental geological problems in karst areas of Southwestern China. Environ. Earth Sci. 2013, 69, 2427–2435. [Google Scholar] [CrossRef]
  30. Liu, B.; Pan, L.; Qi, Y.; Guan, X.; Li, J. Land Use and Land Cover Change in the Yellow River Basin from 1980 to 2015 and Its Impact on the Ecosystem Services. Land 2021, 10, 1080. [Google Scholar] [CrossRef]
  31. Heistermann, M.; Müller, C.; Ronneberger, K. Land in sight? Achievements, deficits and potentials of continental to global scale land-use modeling. Agric. Ecosyst. Environ. 2006, 114, 141–158. [Google Scholar] [CrossRef]
  32. Verburg, P.H.; Kok, K.; Pontius, R.G.; Veldkamp, A. Modeling Land-Use and Land-Cover Change. In Land-Use and Land-Cover Change: Local Processes and Global Impacts; Lambin, E.F., Geist, H., Eds.; Springer: Berlin/Heidelberg, Germany, 2006; pp. 117–135. [Google Scholar] [CrossRef]
  33. Baker, W.L. A review of models of landscape change. Landsc. Ecol. 1989, 2, 111–133. [Google Scholar] [CrossRef]
  34. Brown, D.G.; Walker, R.; Manson, S.; Seto, K. Modeling Land Use and Land Cover Change. In Land Change Science: Observing, Monitoring and Understanding Trajectories of Change on the Earth’s Surface; Gutman, G., Janetos, A.C., Justice, C.O., Moran, E.F., Mustard, J.F., Rindfuss, R.R., Skole, D., Turner, B.L., Cochrane, M.A., Eds.; Springer: Dordrecht, The Netherlands, 2012; pp. 395–409. [Google Scholar] [CrossRef]
  35. Lambin, E.F. Modelling and monitoring land-cover change processes in tropical regions. Prog. Phys. Geogr. Earth Environ. 1997, 21, 375–393. [Google Scholar] [CrossRef]
  36. Kaimowitz, D.; Angelsen, A. Economic Models of Tropical Deforestation: A Review; Center for International Forestry Research (CIFOR): Bogor, Indonesia, 1989. [Google Scholar]
  37. Lambin, E.F.; Rounsevell, M.D.A.; Geist, H.J. Are agricultural land-use models able to predict changes in land-use intensity? Agric. Ecosyst. Environ. 2000, 82, 321–331. [Google Scholar] [CrossRef]
  38. Agarwal, C.; Green, G.M.; Grove, J.M.; Evans, T.P.; Schweik, C.M. A Review and Assessment of Land-Use Change Models: Dynamics of Space, Time, and Human Choice; U.S. Department of Agriculture, Forest Service, Northeastern Research Station: Burlington, NJ, USA, 2002. [Google Scholar]
  39. Verburg, P.H.; Alexander, P.; Evans, T.; Magliocca, N.R.; Malek, Z.; Rounsevell, M.D.A.; van Vliet, J. Beyond land cover change: Towards a new generation of land use models. Curr. Opin. Environ. Sustain. 2019, 38, 77–85. [Google Scholar] [CrossRef]
  40. Regasa, M.S.; Nones, M.; Adeba, D. A Review on Land Use and Land Cover Change in Ethiopian Basins. Land 2021, 10, 585. [Google Scholar] [CrossRef]
  41. Wang, J.; Bretz, M.; Dewan, M.A.A.; Delavar, M.A. Machine learning in modelling land-use and land cover-change (LULCC): Current status, challenges and prospects. Sci. Total Environ. 2022, 822, 153559. [Google Scholar] [CrossRef]
  42. Bai, X.; Zhang, S.; Li, C.; Xiong, L.; Song, F.; Du, C.; Li, M.; Luo, Q.; Xue, Y.; Wang, S. A carbon neutrality capacity index for evaluating carbon sink contributions. Environ. Sci. Ecotechnol. 2023, 15, 100237. [Google Scholar] [CrossRef]
  43. Wu, J.; Zhang, F.; Cao, G.; Li, W.; Zhao, X. Temporal and spatial analysis of precipitation in Guizhou based on TRMM 3B42 satellite data. IOP Conf. Ser. Earth Environ. Sci. 2017, 81, 012076. [Google Scholar] [CrossRef]
  44. Tian, Y.; Wang, S.; Bai, X.; Luo, G.; Xu, Y. Trade-offs among ecosystem services in a typical Karst watershed, SW China. Sci. Total Environ. 2016, 566–567, 1297–1308. [Google Scholar] [CrossRef]
  45. China’s State Forestry Administration. The Bulletin of Rocky Desertification in China; China’s State Forestry Administration: Beijing, China, 2012. [Google Scholar]
  46. Zhao, L.; Hou, R. Human causes of soil loss in rural karst environments: A case study of Guizhou, China. Sci. Rep. 2019, 9, 3225. [Google Scholar] [CrossRef]
  47. Guizhou Statistics Bureau. Guizhou Statistical Yearbook; China Statistics Press: Beijing, China, 2019. [Google Scholar]
  48. Xu, X.; Liu, J.; Zhang, S.; Li, R.; Yan, C.; Wu, S. China’s Multi-Period Land Use Land Cover Remote Sensing Monitoring Data Set (CNLUCC); Resource and Environment Data Registration and Publishing System: Beijing, China, 2018. [Google Scholar] [CrossRef]
  49. Baltaci, U.; Yildirim, F. Effect of Slope on the Analysis of Forest Fire Risk. Hacet. J. Biol. Chem. 2020, 48, 373–379. [Google Scholar] [CrossRef]
  50. Ding, Y.; Xu, J.; Wang, X.; Peng, X.; Cai, H. Spatial and temporal effects of drought on Chinese vegetation under different coverage levels. Sci. Total Environ. 2020, 716, 137166. [Google Scholar] [CrossRef]
  51. Yin, L.; Dai, E.; Zheng, D.; Wang, Y.; Ma, L.; Tong, M. What drives the vegetation dynamics in the Hengduan Mountain region, southwest China: Climate change or human activity? Ecol. Indic. 2020, 112, 106013. [Google Scholar] [CrossRef]
  52. Padilla, F.M.; Vidal, B.; Sanchez, J.; Pugnaire, F.I. Land-use changes and carbon sequestration through the twentieth century in a Mediterranean mountain ecosystem: Implications for land management. J. Environ. Manag. 2010, 91, 2688–2695. [Google Scholar] [CrossRef] [PubMed]
  53. Yang, H.; Mu, S.; Li, J. Effects of ecological restoration projects on land use and land cover change and its influences on territorial NPP in Xinjiang, China. Catena 2014, 115, 85–95. [Google Scholar] [CrossRef]
  54. Rao, C.; Yan, B. Study on the interactive influence between economic growth and environmental pollution. Environ. Sci. Pollut. Res. 2020, 27, 39442–39465. [Google Scholar] [CrossRef]
  55. Muller, M.R.; Middleton, J. A Markov model of land-use change dynamics in the Niagara Region, Ontario, Canada. Landsc. Ecol. 1994, 9, 151–157. [Google Scholar]
  56. Long, H.; Qu, Y. Land use transitions and land management: A mutual feedback perspective. Land Use Policy 2018, 74, 111–120. [Google Scholar] [CrossRef]
  57. Urban, D.L.; Wallin, D.O. Introduction to Markov models. In Learning Landscape Ecology: A Practical Guide to Concepts and Techniques; Gergel, S.E., Turner, M.G., Eds.; Springer: New York, NY, USA, 2017; pp. 129–142. [Google Scholar] [CrossRef]
  58. Zhu, E.; Deng, J.; Zhou, M.; Gan, M.; Jiang, R.; Wang, K.; Shahtahmassebi, A. Carbon emissions induced by land-use and land-cover change from 1970 to 2010 in Zhejiang, China. Sci. Total Environ. 2018, 646, 930–939. [Google Scholar] [CrossRef]
  59. Bai, X.Y.; Wang, S.J.; Xiong, K.N. Assessing spatial-temporal evolution processes of karst rocky desertification land: Indications for restoration strategies. Land Degrad. Dev. 2013, 24, 47–56. [Google Scholar] [CrossRef]
  60. Wang, J.; Guo, J.; Qing, J. Application of a kind of k drought index in the spring drought analysis in northwest China. J. Nat. Resour. 2011, 22, 709–717. [Google Scholar] [CrossRef]
  61. Araromi, D.O.; Majekodunmi, O.T.; Adeniran, J.A.; Salawudeen, T.O. Modeling of an activated sludge process for effluent prediction—A comparative study using ANFIS and GLM regression. Environ. Monit. Assess. 2018, 190, 495. [Google Scholar] [CrossRef]
  62. Mather, A.S. The Forest Transition. Area 1992, 24, 367–379. [Google Scholar]
  63. Oliveira, T.M.; Guiomar, N.; Baptista, F.O.; Pereira, J.M.C.; Claro, J. Is Portugal’s forest transition going up in smoke? Land Use Policy 2017, 66, 214–226. [Google Scholar] [CrossRef]
  64. Yu, X. Environmental development and governance in western China since 2000: A case from Guizhou Province. Int. J. Environ. Stud. 2016, 73, 791–805. [Google Scholar] [CrossRef]
  65. Zhang, X.; Zha, T.; Zhao, Y.; Qin, J.; Lyv, Z.; Ma, Z.; Yu, H.; Zhu, Y.; Wang, G.; Tettenborn, F.; et al. Sustainable effects of small hydropower substituting firewood program in Majiang County, Guizhou Province, China. Sustainability 2017, 9, 988. [Google Scholar] [CrossRef]
  66. Dong, S.; Zhao, Y.; Li, X. Spatial Differentiation Characteristics and Driving Forces of Forest Transition: A Case Study of Zunyi City, Guizhou. J. Resour. Ecol. 2018, 9, 341–351. [Google Scholar]
  67. Wang, B.; Gao, P.; Niu, X.; Sun, J. Policy-driven China’s Grain to Green Program: Implications for ecosystem services. Ecosyst. Serv. 2017, 27, 38–47. [Google Scholar] [CrossRef]
  68. Zeng, Z.; Estes, L.; Ziegler, A.; Chen, A.; Searchinger, T.; Hua, F.; Guan, K.; Jintrawet, A.; Wood, E. Highland cropland expansion and forest loss in Southeast Asia in the twenty-first century. Nat. Geosci. 2018, 11, 556–562. [Google Scholar] [CrossRef]
  69. Lei, G.; Li, A.; Bian, J.; Zhang, Z. The roles of criteria, data and classification methods in designing land cover classification systems: Evidence from existing land cover data sets. Int. J. Remote Sens. 2020, 41, 5062–5082. [Google Scholar] [CrossRef]
  70. Zeng, T.; Zhang, Z.; Zhao, X.; Wang, X.; Zuo, L. Evaluation of the 2010 MODIS Collection 5.1 Land Cover Type Product over China. Remote Sens. 2015, 7, 1981–2006. [Google Scholar] [CrossRef]
  71. Wu, B.; Yuan, Q.; Yan, C.; Wang, Z.; Xinfang, Y.; Li, A.; Ma, R.; Huang, J.; Chen, J.; Chang, C.; et al. Land Cover Changes of China Form 2000 to 2010. Quat. Sci. 2014, 34, 723–731. [Google Scholar]
  72. Yan, X.; Li, Y.; Xia, Y.; Hu, Y.; Yang, C. Analysis of characteristics and causes of persistent drought in Guizhou during 1961—2016. Mid-Low Latit. Mt. Meteorol. 2019, 43, 1–7. [Google Scholar]
  73. Han, G.; Liu, C. Water geochemistry controlled by carbonate dissolution: A study of the river waters draining karst-dominated terrain, Guizhou Province, China. Chem. Geol. 2004, 204, 1–21. [Google Scholar] [CrossRef]
  74. An, H.; Liu, M. Analysis on the benefits of Grain for Green Project and sustainable development of Guizhou Province. Subtrop. Soil Water Conserv. 2008, 20, 1–4. [Google Scholar]
  75. Zhang, B.; Nie, C.; Zhu, J.; Yao, Y.; Mo, S.-g.; Luo, Y.; Cen, G. Dynamic change of forest resources in Guizhou province. Geogr. Res. 2003, 22, 725–732. [Google Scholar]
  76. Han, D.; Yang, T.; Pan, T.; Chen, T.; Zhang, X. Analysis on measures of forest resources growth and change in guizhou province. Agric. Technol. 2020, 40, 73–75. [Google Scholar]
  77. Sabir, M.; Ali, Y.; Khan, I.; Salman, A. Plants Species Selection for Afforestation: A Case Study of the Billion Tree Tsunami Project of Pakistan. J. Sustain. For. 2022, 41, 537–549. [Google Scholar] [CrossRef]
  78. Dey, D.C.; Gardiner, E.S.; Kabrick, J.M.; Stanturf, J.A.; Jacobs, D.F. Innovations in afforestation of agricultural bottomlands to restore native forests in the eastern USA. Scand. J. For. Res. 2010, 25, 31–42. [Google Scholar] [CrossRef]
  79. Cunningham, S.C.; Mac Nally, R.; Baker, P.J.; Cavagnaro, T.R.; Beringer, J.; Thomson, J.R.; Thompson, R.M. Balancing the environmental benefits of reforestation in agricultural regions. Perspect. Plant Ecol. Evol. Syst. 2015, 17, 301–317. [Google Scholar] [CrossRef]
  80. Babintseva, R.M.; Titova, Y.V. Effects of Fire on the Regeneration of Larch Forests in the Lake Baikal Basin. In Fire in Ecosystems of Boreal Eurasia; Goldammer, J.G., Furyaev, V.V., Eds.; Springer: Dordrecht, The Netherlands, 1996; pp. 358–365. [Google Scholar] [CrossRef]
  81. Goldammer, J.G.; Furyaev, V.V. Fire in Ecosystems of Boreal Eurasia: Ecological Impacts and Links to the Global System. In Fire in Ecosystems of Boreal Eurasia; Goldammer, J.G., Furyaev, V.V., Eds.; Springer: Dordrecht, The Netherlands, 1996; pp. 1–20. [Google Scholar] [CrossRef]
  82. Chu, T.; Guo, X. Remote Sensing Techniques in Monitoring Post-Fire Effects and Patterns of Forest Recovery in Boreal Forest Regions: A Review. Remote Sens. 2014, 6, 470–520. [Google Scholar] [CrossRef]
  83. Xiao, S.-C.; Xiao, H.-L.; Peng, X.-M.; Tian, Q.-Y. Daily and seasonal stem radial activity of Populus euphratica and its association with hydroclimatic factors in the lower reaches of China’s Heihe River basin. Environ. Earth Sci. 2014, 72, 609–621. [Google Scholar] [CrossRef]
  84. Curtin, D.; Beare, M.H.; Hernandez-Ramirez, G. Temperature and Moisture Effects on Microbial Biomass and Soil Organic Matter Mineralization. Soil Sci. Soc. Am. J. 2012, 76, 2055–2067. [Google Scholar] [CrossRef]
Figure 1. The geographical location of Guizhou province.
Land 12 01004 g001
Figure 2. Flow chart of methodology employed.
Land 12 01004 g002
Figure 3. (a) Forest changes in Guizhou Province. (b) Average forest cover in nine municipalities.
Land 12 01004 g003
Figure 4. Spatial pattern of forest changes in nine municipalities.
Land 12 01004 g004
Figure 5. Percentages of other land-use types converted into forests in Guizhou and its nine major municipalities 1980–2018. Ei (i = 1, 2, 3, 4) denotes the area of the i category of land in 2018, which transformed from the j category of land in 1980; Vj (j = 1, 2, 3, 4) represents the area of the j class of land in 1980, which converted into the i class of land in 2018; 1 = grassland, 2 = construction land, 3 = cropland, 4 = forest. Red arrows indicate percentages of i-type land in 1980 converted into forests by 2018.
Land 12 01004 g005
Figure 6. Percentages of four major land use types converting into forests in Guizhou: 1980 to 2018.
Land 12 01004 g006
Figure 7. Drivers of forest change. (a) Population density in 2015 (people per km2). (b) Distribution of GDP in 2015 (RMB 10,000/km2). (c) Accessibility and forest area. (d) Karstification intensity. (e) Spatial distribution of drought index. (f) Slope in 2009.
Land 12 01004 g007
Figure 8. Changes in forest cover (%) in Guizhou province (source: Guizhou Statistical Yearbook).
Land 12 01004 g008
Table 1. Land-use–land-cover classification in Guizhou, China.
Class lClass 2/25 Land Use Sub-Types
CroplandPaddy field, dryland
ForestForest land, shrubland, sparse woods, other forest areas
GrasslandHighly covered grassland, middle-covered grassland, low-covered grass land
WaterCanals, lakes, reservoirs and ponds, permanent ice and snow, intertidal zone, shoals
Built-up area Urban land, rural residential land, other built-up areas
OthersSand, Gobi, saline–alkali land, marshland, bare land, bare rocky land, others
Table 2. Data and methods of potential factors.
DriversOriginal Data SourceProcessing MethodPeriod
LUCLandsat TM/ETMResource and Environment Data Cloud Platform Markov model and R 1980, 1990, 2000, 2010, 2018
PLand use, night light, settlement densityResource and Environment Data Cloud Platform Spatial analysis1995, 2000, 2010, 2015
GDPGDP, land use, night light, settlement densityResource and Environment Data Cloud Platform Spatial analysis1995, 2000, 2010, 2015
AState, county, and township roadsGuizhou Institute of Mountainous ResourcesSpatial analysis2010
KILithological dataGuizhou Institute of Mountainous ResourcesSpatial analysis2010
DI, MAP, MATPrecipitation, evaporationGuizhou Institute of Mountainous Climate and Environment, Resource and Environment Data Cloud PlatformSpatial analysis1980–2015
SDEMGeospatial Data Cloud Spatial analysis2009
Notes that LUC, P, GDP, A, KI, DI, MAP, MAT, and S represent land-use change, population, gross domestic product, accessibility, karstification intensity, drought index, mean annual precipitation, mean annual temperature, and slope, respectively.
Table 3. Guizhou land-use changes from 1980 to 2018.
YearCroplandForestGrasslandWaterBuilt-Up AreaOthersTotal Area
Area (km2)(%)Area (km2)(%)Area (km2)(%)Area (km2)(%)Area (km2)(%)Area (km2)(%)Area (km2)
198049,03727.9294,30453.6931,42317.893630.214840.28360.02175,647
199048,92627.8594,41353.7531,36617.863800.225170.29440.03175,646
200049,31828.0893,37853.1631,95118.193950.225610.32440.03175,647
201049,18428.0194,54053.8430,71817.494670.276410.37370.02175,587
201848,55227.6494,77253.9529,38216.727210.4122251.27300.02175,682
Table 4. Forest subtypes in Guizhou from 1980 to 2018 (km2).
Forest Subtypes19801990200020102018Changes
Forest land24,03824,04823,67323,81824,392354
Shrubland43,61743,67543,16343,33943,469−148
Sparse woods26,36426,40326,23827,07326,615251
Other forest areas28528730431029611
Table 5. Forest changes from 1980 to 2018 in nine municipalities (km2).
Year19801990200020102018Changes
Anshun44424447441744574432−10
Bijie11,38811,39711,38011,54811,590202
Guiyang38723874386938834010138
Liupanshui3947395939704021396114
Qiandongnan18,56318,58718,45818,77319,041478
Qiannan14,64014,65114,27914,42214,515−125
Qianxinan80108017794880677980−30
Tongren10,15510,156984699729922−233
Zunyi19,28719,32519,21119,39719,32134
Total94,30494,41393,37894,54094,772468
Table 6. Correlations between and multiple GLM analyses of the relationships between forest areas and factors.
MethodCorrelation Analysis Multiple-GLM Regression
VariablerpSS, %
Drought index 0.0840.4600.64
Karstification intensity−0.0970.3940.85
Mean annual precipitation−0.296 **0.0080.97
GDP−0.255 *0.0241.88
Population−0.281 *0.0122.23
Land-use change (LUC)0.580 **0.0002.27
Accessibility0.388 **0.0002.29
Slope of 15–25°0.882 **0.00088.87
* p < 0.05, ** p < 0.01; SS, proportion of variances explained by the variable.
Table 7. Changes in drivers of forest variation over time.
YearVariableMAPMATPopulationGDPLUC
1990Correlation analysisr0.0950.064−0.379 **−0.150--
sig0.3910.5650.0000.174--
Multiple-GLM regressionSS, %3.34%3.59%74.44%18.62%--
2000Correlation analysis r−0.0130.095−0.283 **−0.261 *--
sig0.9080.3910.0090.016--
Multiple-GLM regressionSS, %25.63%11.12%63.08%0.18%--
2010Correlation analysis r0.1110.006−0.317 **−0.310 **0.236 *
sig0.3450.9600.0060.0070.042
Multiple-GLM regressionSS, %9.77%13.70%9.28%0.07%67.18%
2018Correlation analysis r−0.0640.012−0.312 **−0.282 *0.784 **
sig0.5830.9210.0060.0140.000
Multiple-GLM regressionSS, %0.34%2.78%3.04%2.04%91.81%
Notes: Annual precipitation (AP, mm), annual mean temperature (AMT, °C), population (per person/km2), GDP (RMB 10,000/km2), LCU (km2); * p < 0.05, ** p < 0.01; SS, proportion of variances explained by the variable.
Table 8. Comparison of results of this study with other products (areas in km2).
DataResolution19801990200020102018Changes 2000–2018Changes 1980–2018
CNLUCC (this study)1 km94,30494,41393,378994,54094,7721394468
GlobeLand3030 m----83,07984,47283,329250--
GLASS-GLC 5 km486861106270696970187482150
MODIS/006/MCD12Q1500 m----10,696 12,707 22,762 12,066 --
Table 9. Parameters of data products relating to forest-cover estimation.
DataSpatial ResolutionData SourceClassification TechniqueAccuracySubclass or Description
CNLUCC1 kmHJ-1A/B, Landsat TM/ETM+/OLIVisual interpretationAbove 75%Forest land, shrubland, sparse woods, other forest areas
GlobeLand3030 mLandsat TM/ETM+POK-based method2000/2010: 80.33 ± 0.2%
2020:
85.72%
Over 30% of land covered with trees and vegetation, including deciduous broad-leaved forests, evergreen broad-leaved forests, deciduous coniferous forests, evergreen coniferous forests, mixed forests, and sparse forests with crown coverage of 10–30%
GLASS-GLC5 kmLandsat TM/ETM+Conventional maximum-likelihood classifier, J4.8 decision-tree classifier, Random Forest classifier, and support-vector-machine classifier82.81%Broad leaf, leaf on; broad leaf, leaf-off; needle leaf, leaf on; needle leaf, leaf off; mixed leaf type, leaf on; mixed leaf type, leaf off.
MODIS/006/MCD12Q1500 mMODISDecision-tree classification algorithm66.42%Evergreen needleleaf forests; evergreen broadleaf forests; deciduous needleleaf forests; deciduous broadleaf forests; mixed forests; closed shrublands; open shrublands
Notes: sources of the table are from [67,68].
Disclaimer/Publisher’s Note: The statements, opinions and data contained in all publications are solely those of the individual author(s) and contributor(s) and not of MDPI and/or the editor(s). MDPI and/or the editor(s) disclaim responsibility for any injury to people or property resulting from any ideas, methods, instructions or products referred to in the content.

