

Comparative Analysis of Neighborhood Sustainability Assessment Systems from the USA (LEED–ND), Germany (DGNB–UD), and India (GRIHA–LD)


Abstract
:1. Introduction
1.1. Neighborhoods and Urban Districts
1.2. Neighborhood Sustainability Assessment (NSA) Systems
1.3. General Description of LEED–ND, DGNB–UD, and GRIHA–LD
1.3.1. LEED–ND
1.3.2. DGNB–UD
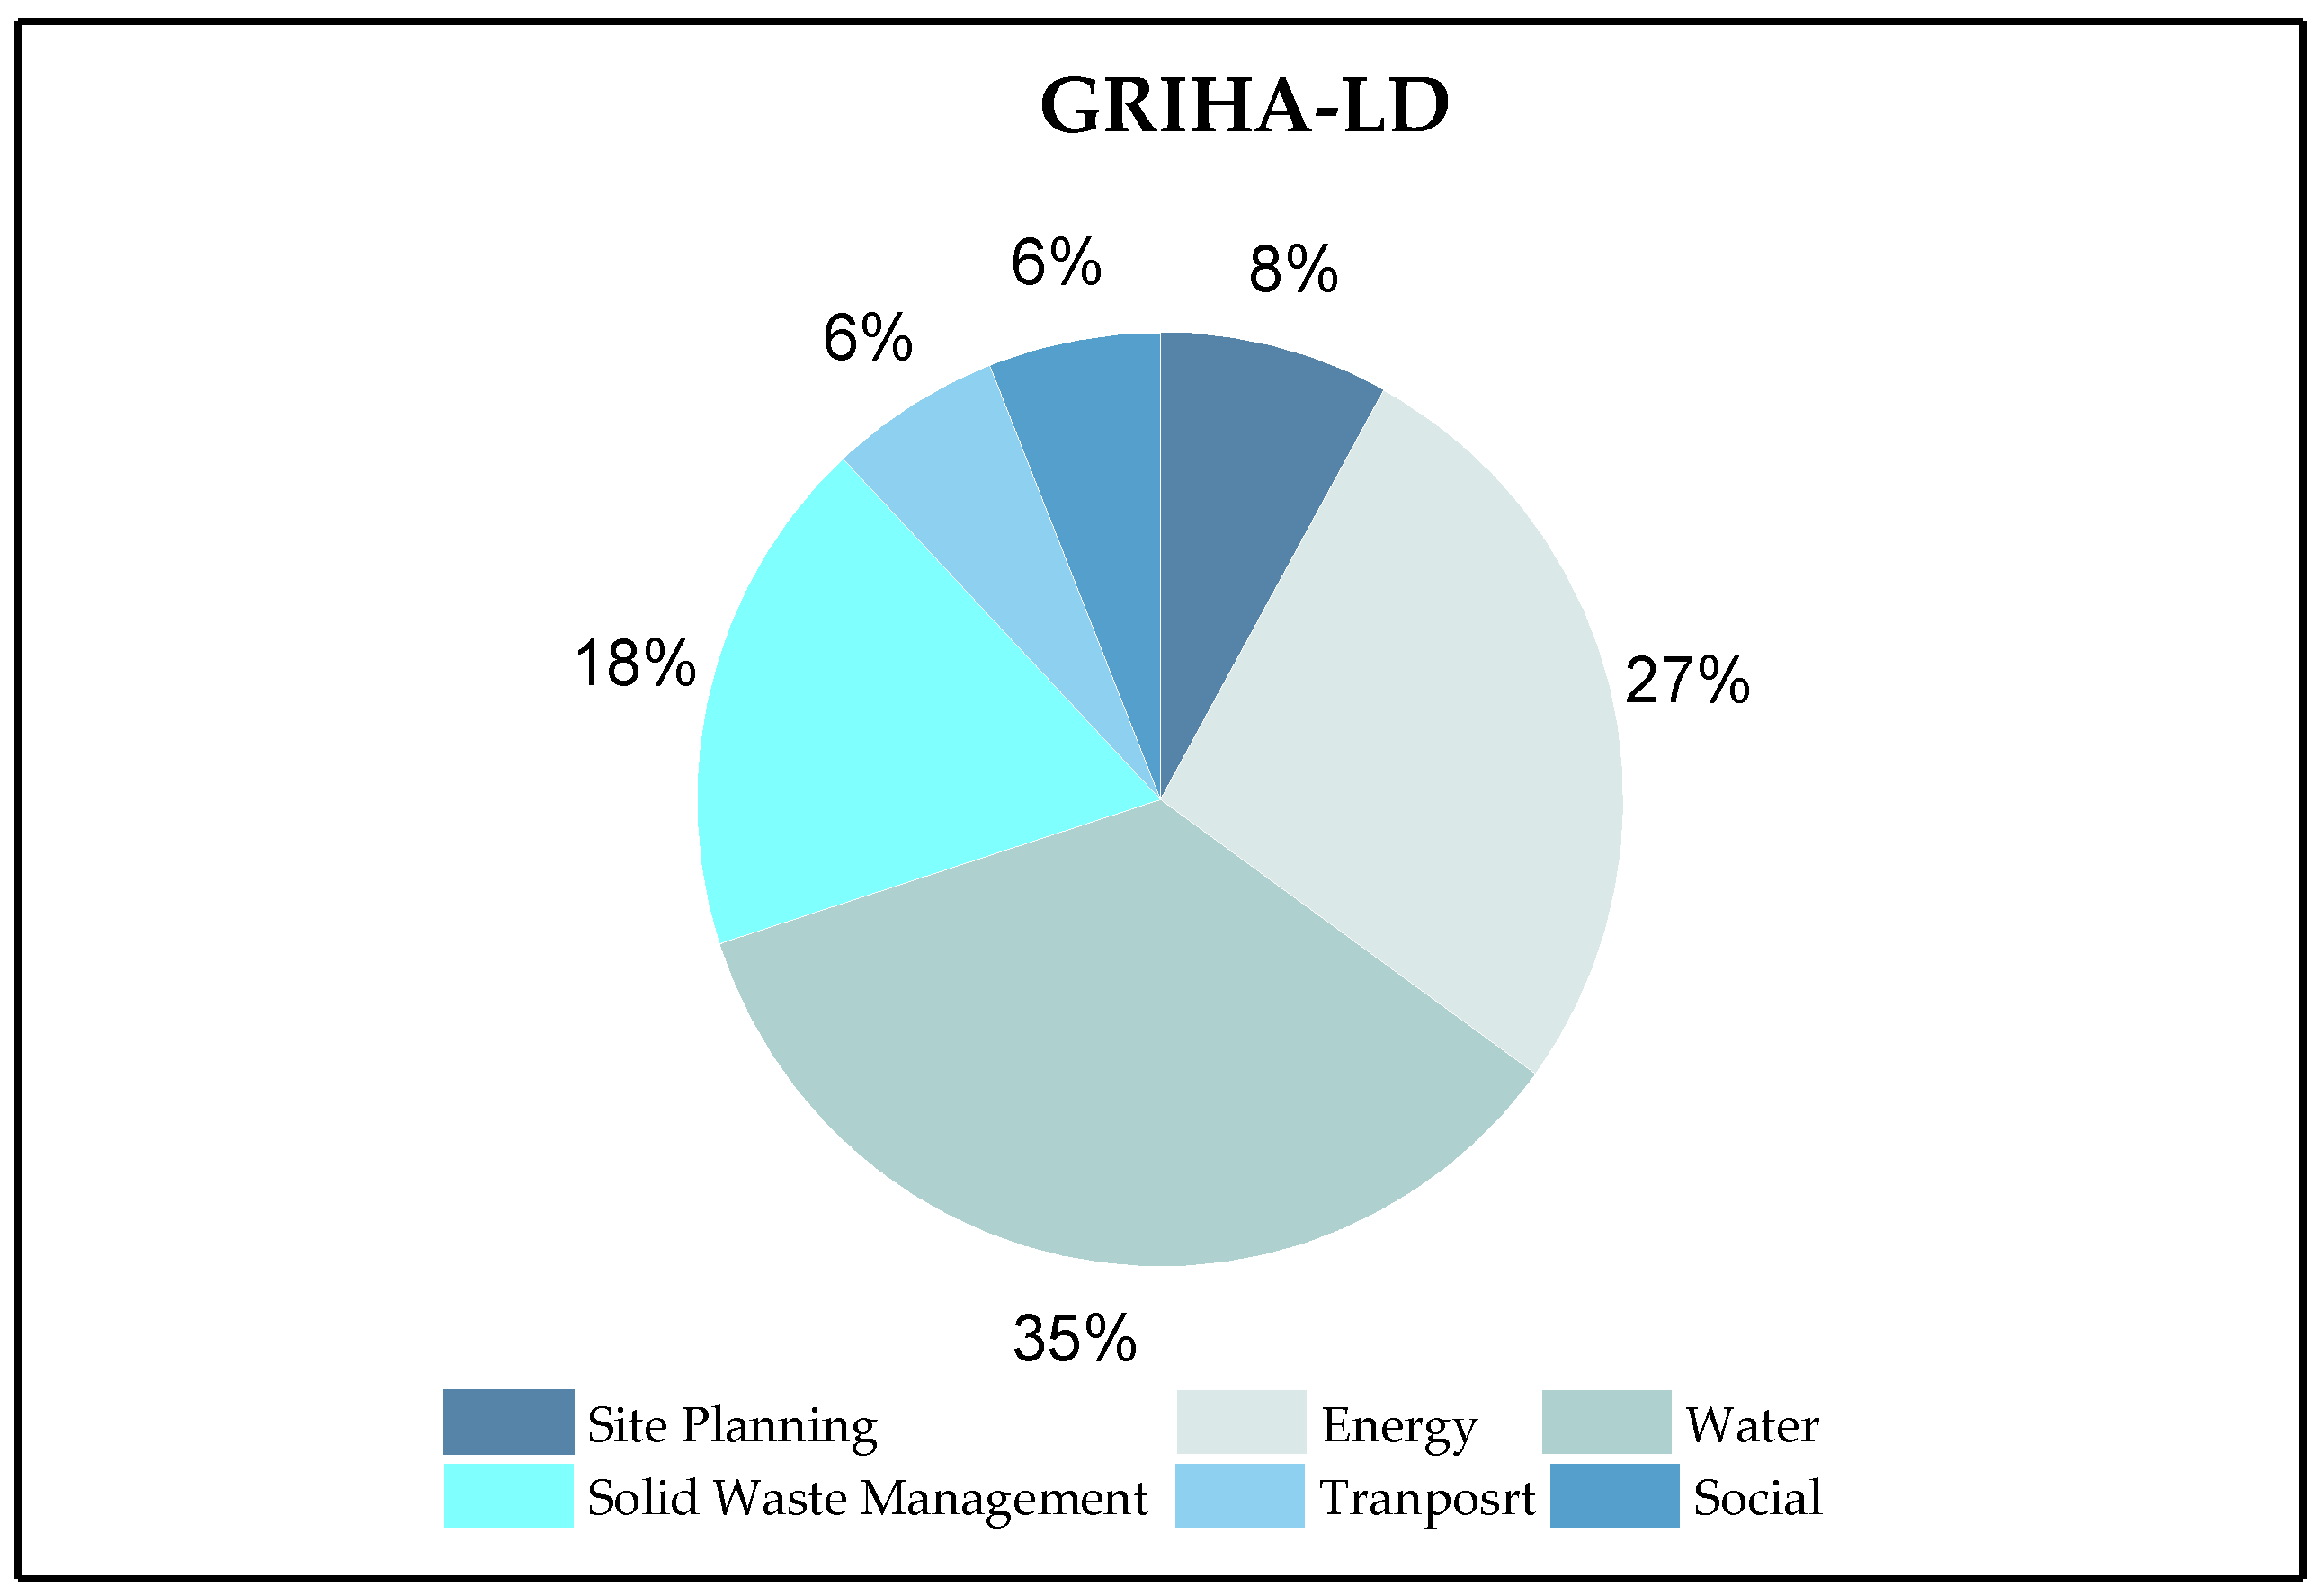
1.3.3. GRIHA−LD
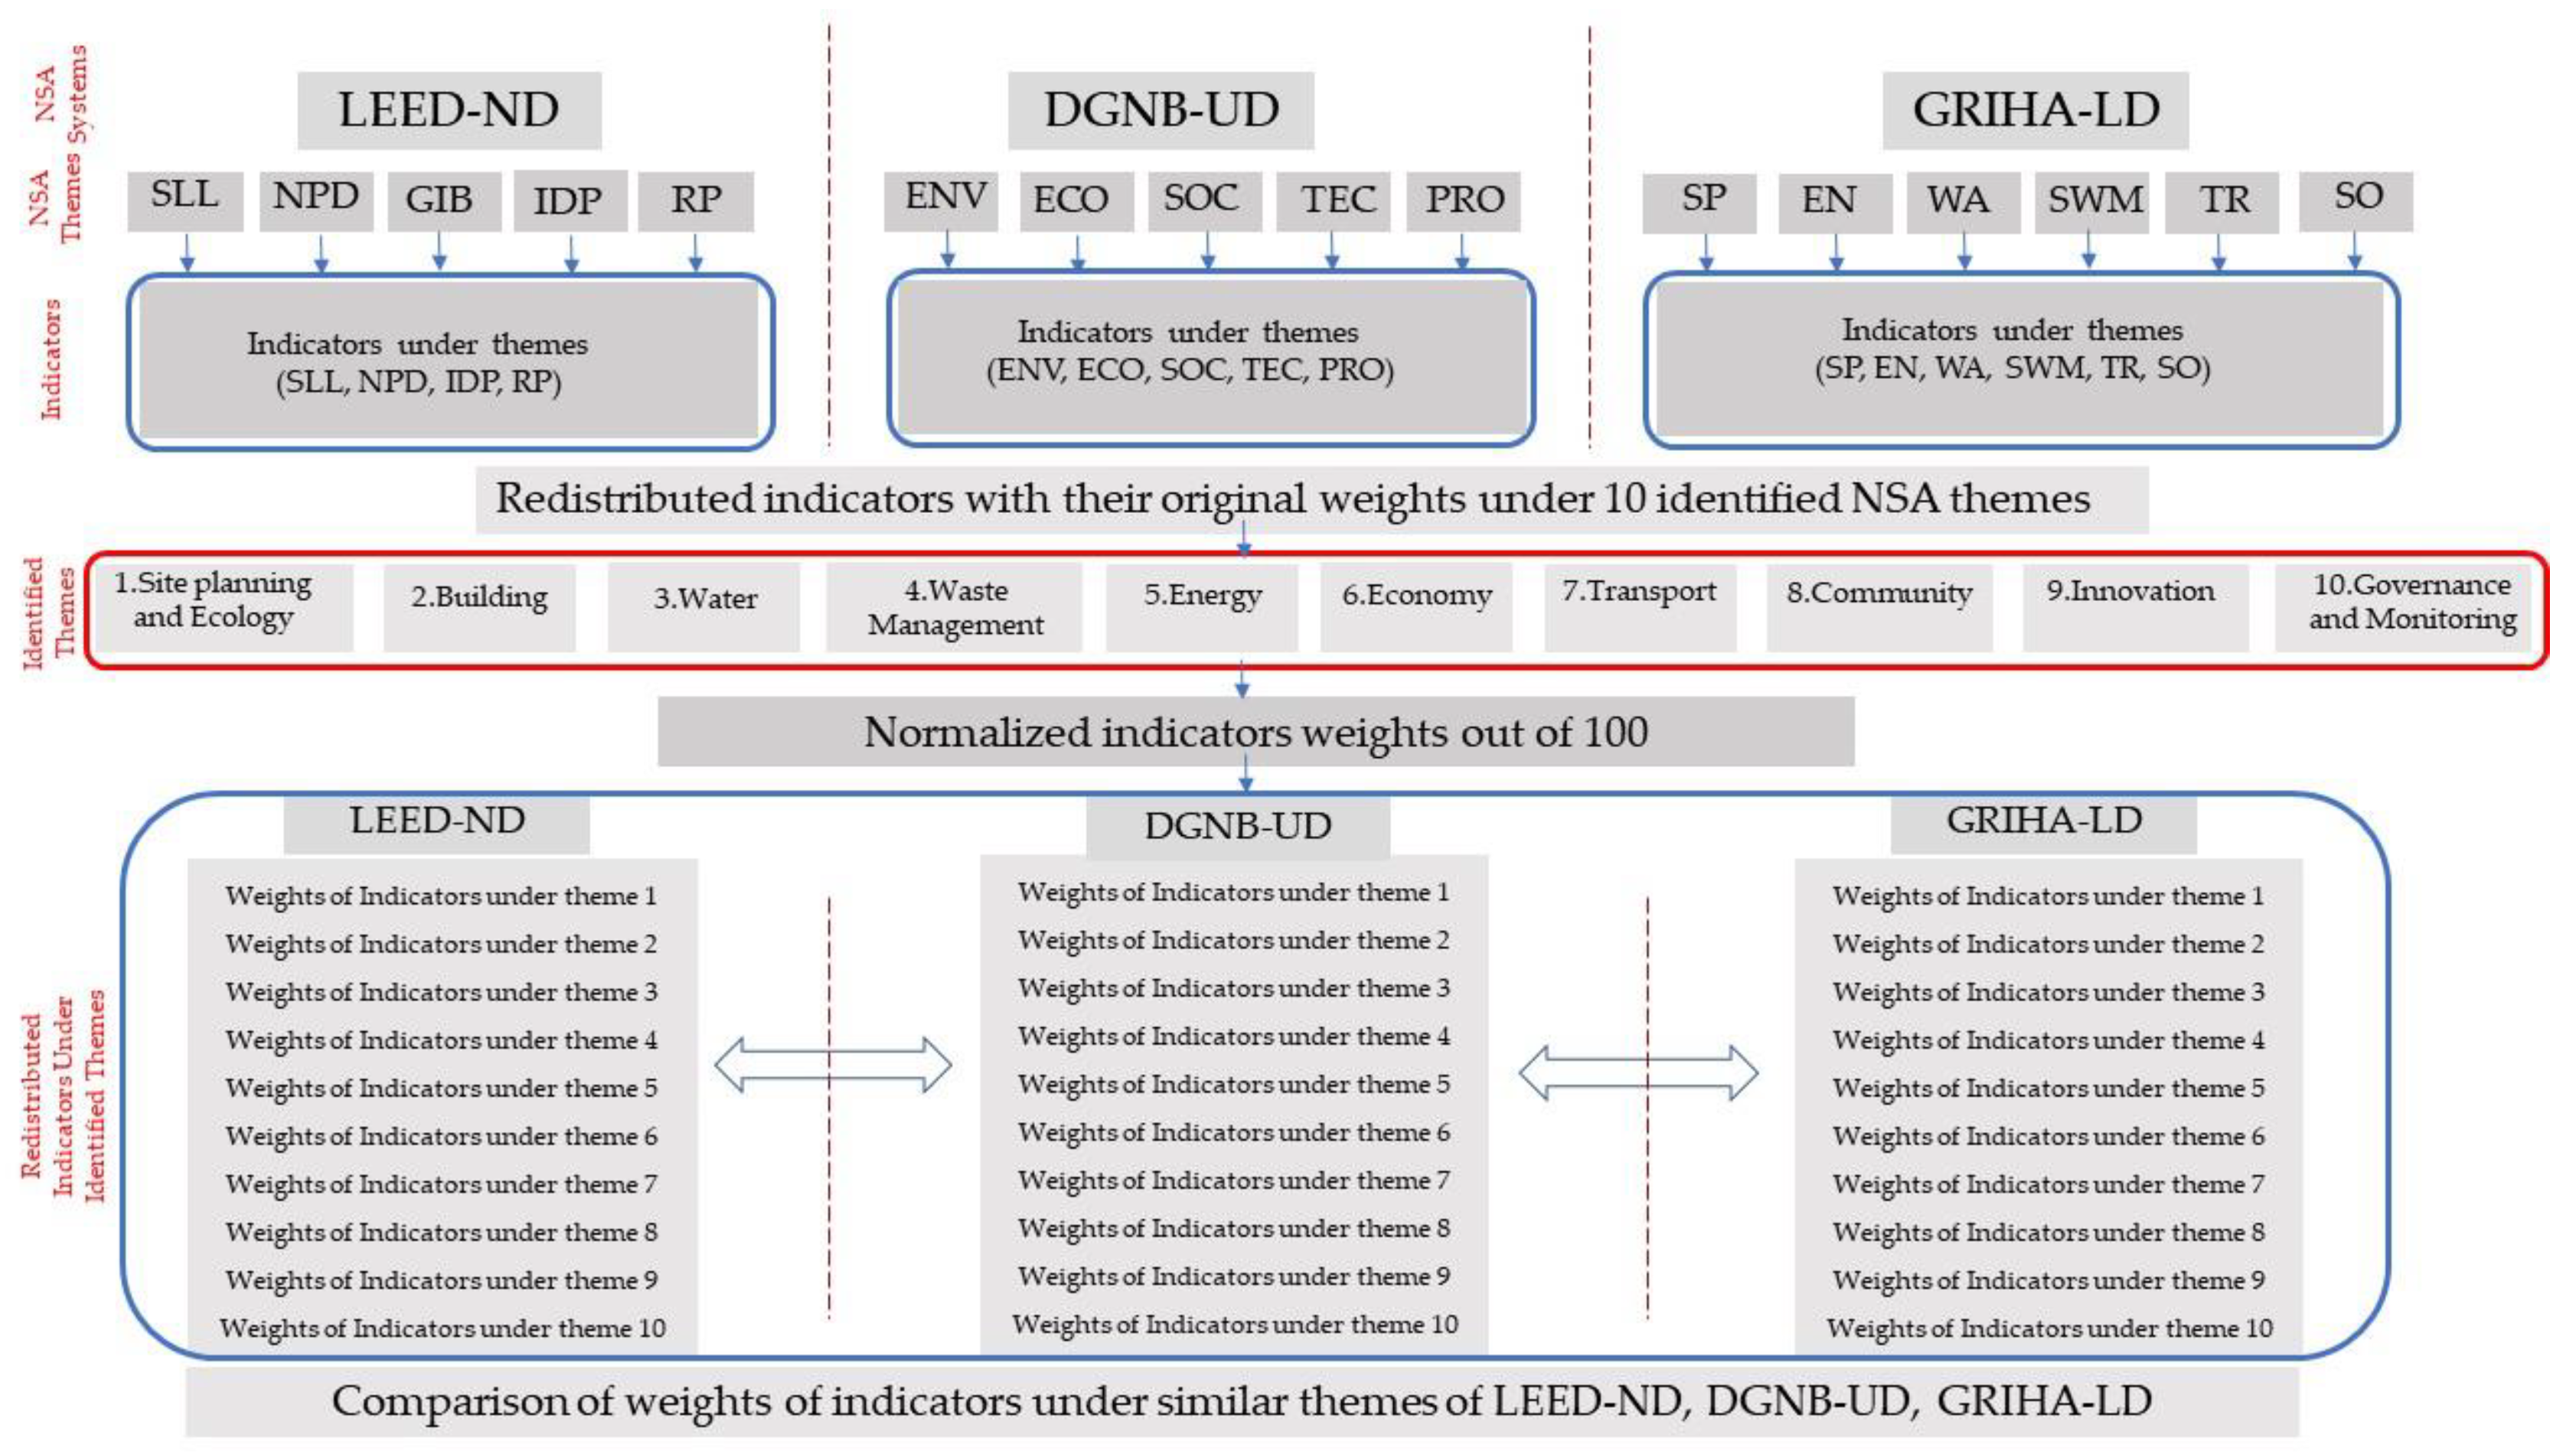
2. Materials and Methods
Selection of Themes for Comparative Analysis
- Site planning and ecology
- Buildings
- Water
- Waste management
- Energy
- Economy
- Transport
- Community
- Innovation
- Governance and monitoring
3. Results and Discussion
3.1. Theme-Based Comparison of LEED–ND, DGNB–UD, and GRIHA–LD
3.1.1. Site Planning and Ecology
3.1.2. Buildings
3.1.3. Water
3.1.4. Waste Management
3.1.5. Energy
3.1.6. Economy
3.1.7. Innovation
3.1.8. Transport
3.1.9. Community
3.1.10. Governance and Monitoring
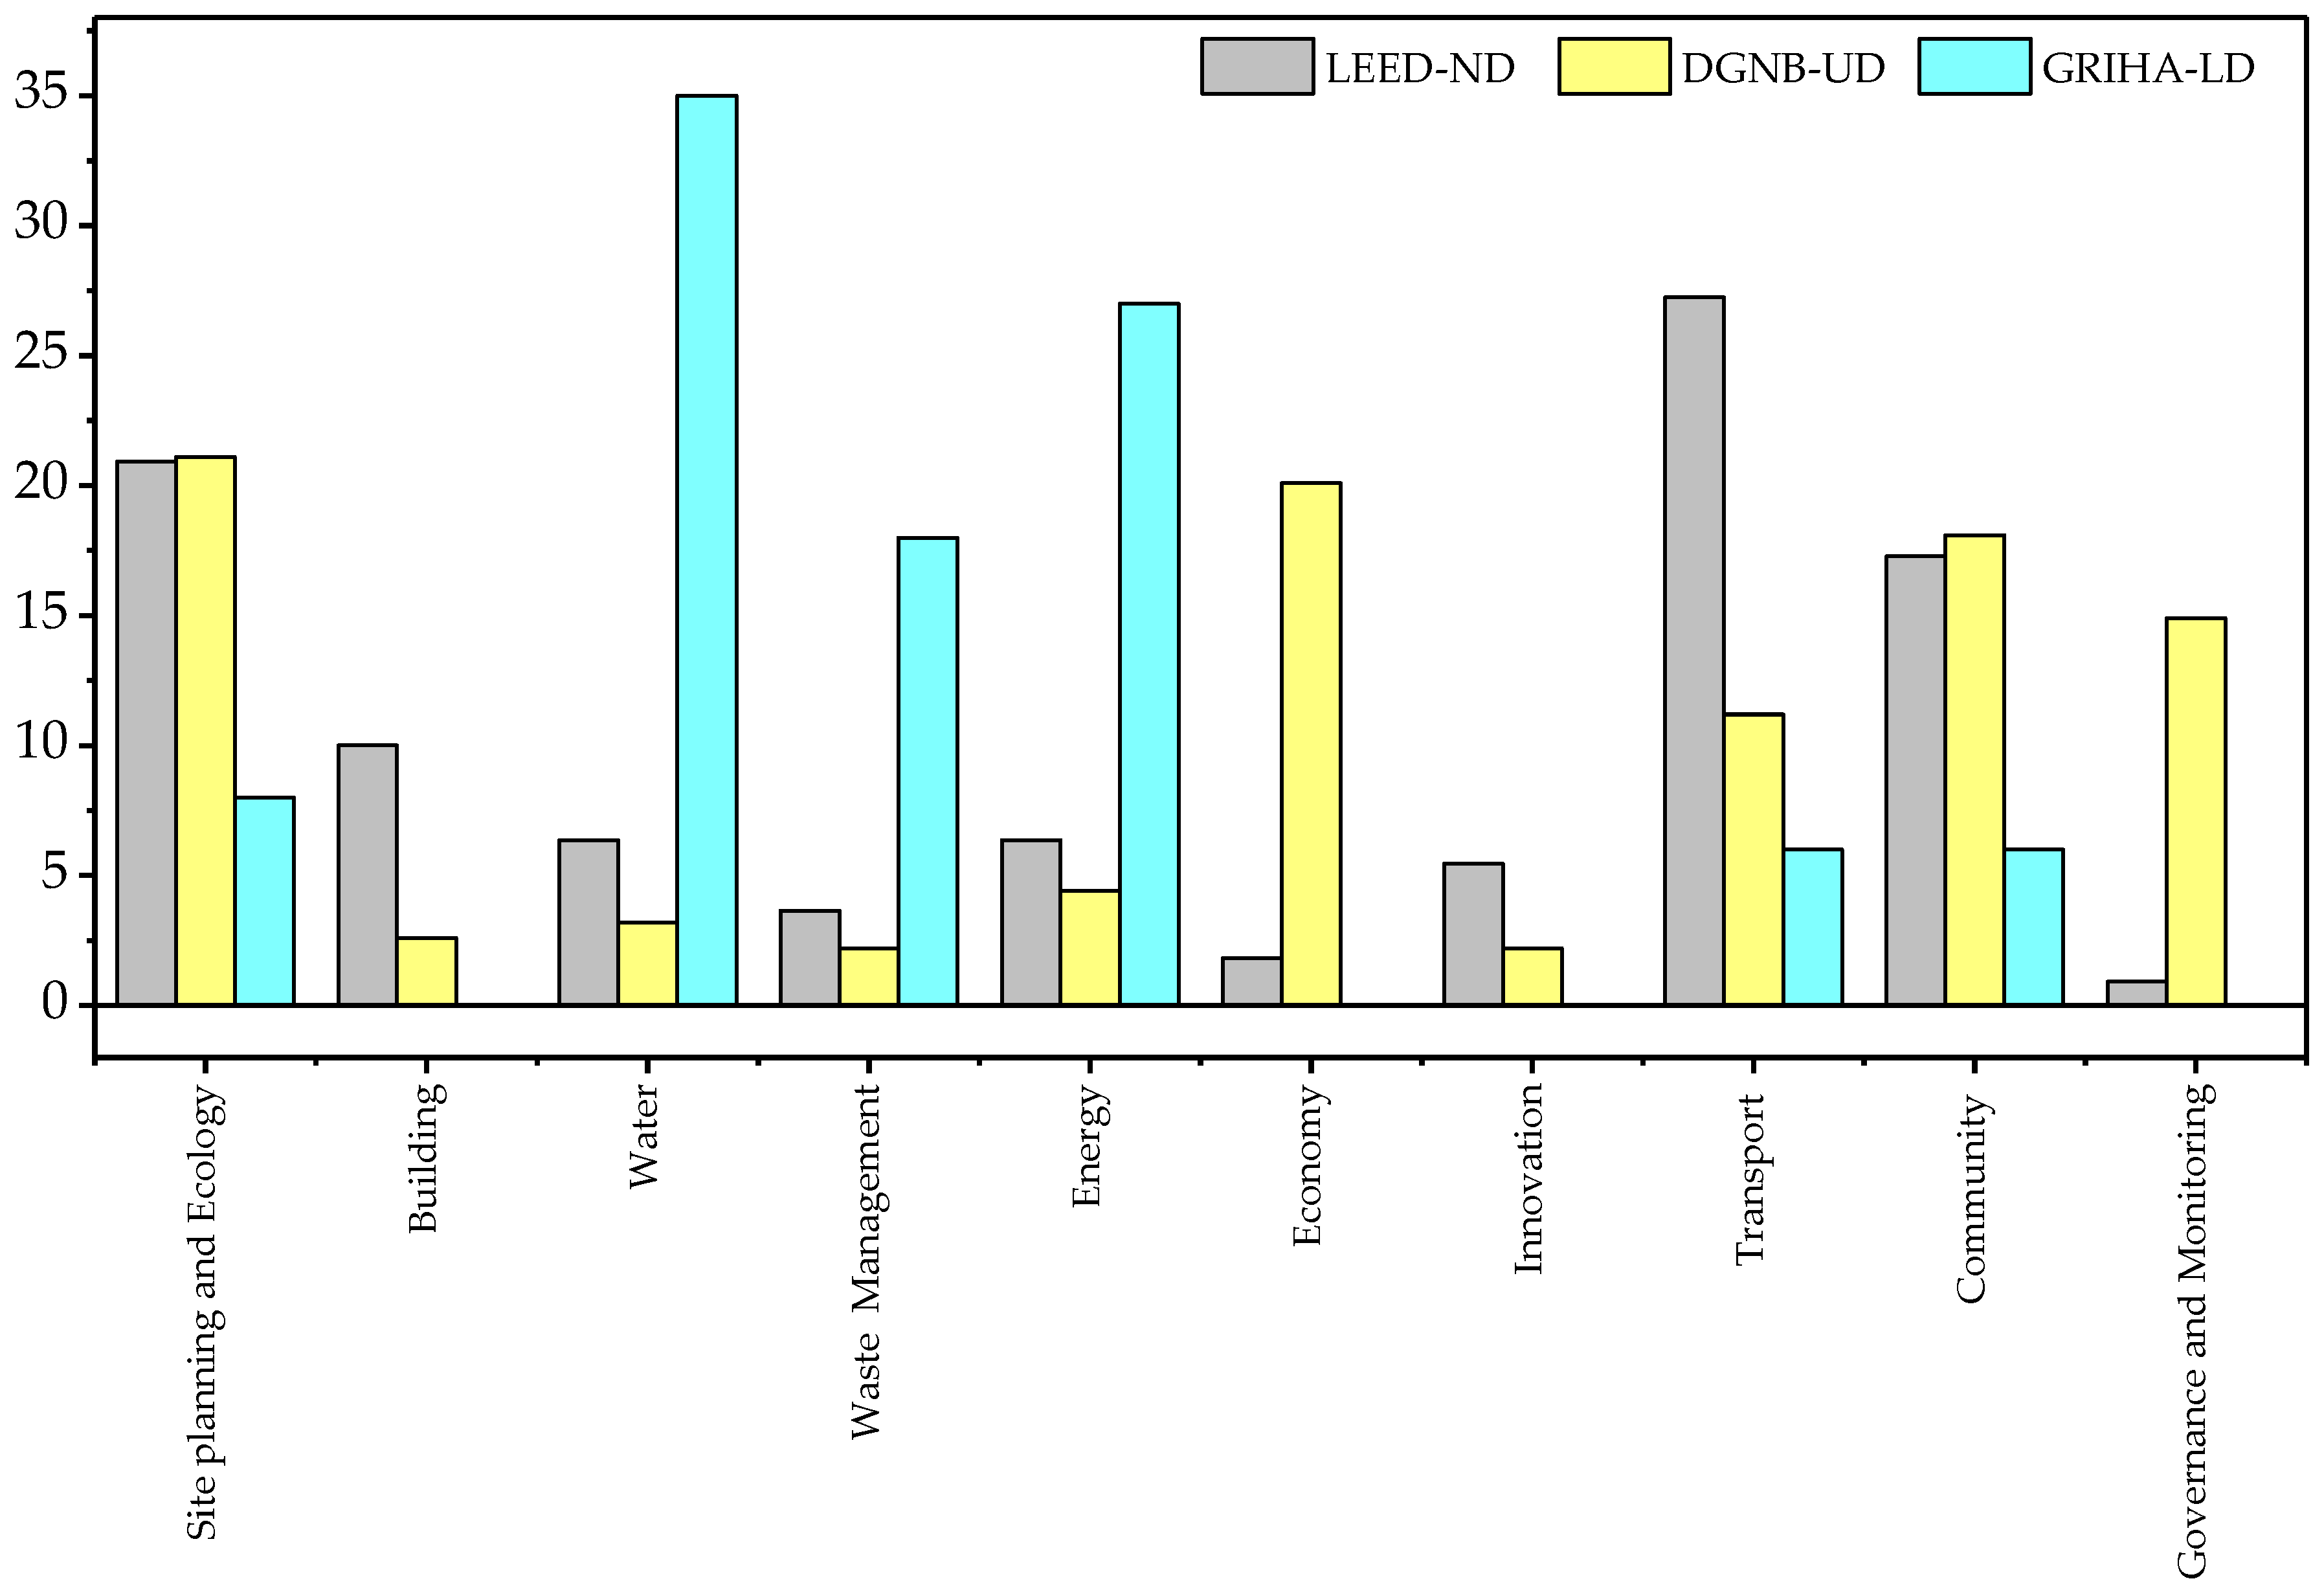
3.2. General Comparison of the LEED–ND, DGNB–UD, and GRIHA–LD
4. Conclusions
Author Contributions
Funding
Institutional Review Board Statement
Informed Consent Statement
Data Availability Statement
Conflicts of Interest
References
- United Nations. World Urbanization Prospects 2018: Highlights; United Nations: New York, NY, USA, 2019. [Google Scholar]
- Akinsemolu, A.A. The role of microorganisms in achieving the sustainable development goals. J. Clean. Prod. 2018, 182, 139–155. [Google Scholar] [CrossRef]
- Sharifi, A.; Khavarian-Garmsir, A.R. The COVID-19 pandemic: Impacts on cities and major lessons for urban planning, design, and management. Sci. Total Environ. 2020, 749, 142391. [Google Scholar] [CrossRef] [PubMed]
- Du Pisani, J.A. Sustainable development—Historical roots of the concept. Environ. Sci. 2006, 3, 83–96. [Google Scholar] [CrossRef]
- United Nations. Our Common Future: Report of the World Commission on Environment and Development; United Nations: New York, NY, USA, 1987. [Google Scholar]
- United Nations. United Nations Sustainability. Available online: https://www.un.org/en/academic-impact/sustainability (accessed on 25 February 2023).
- United Nations. United Nations Office for Disaster Risk Reduction. Available online: https://www.undrr.org/terminology/resilience (accessed on 23 February 2023).
- Amirtahmasebi, R. The New Urban Agenda; United Nations Human settlement program, 978-92-1-132869-1; UN Habitat: Nairobi, Kenya, 2020; Available online: https://unhabitat.org/sites/default/files/2020/12/nua_handbook_14dec2020_2.pdf (accessed on 15 February 2023).
- Romero-Lankao, P.; Gnatz, D.; Wilhelmi, O.; Hayden, M. Urban Sustainability and Resilience: From Theory to Practice. Sustainability 2016, 8, 1224. [Google Scholar] [CrossRef] [Green Version]
- Folke, C.; Carpenter, S.; Elmqvist, T.; Gunderson, L.; Holling, C.S.; Walker, B. Resilience and sustainable development: Building adaptive capacity in a world of transformations. Ambio 2002, 31, 437–440. [Google Scholar] [CrossRef]
- The International Council for Local Environmental Initiatives (ICLEI). The Local Agenda 21 Planning Guide; The International Council for Local Environmental Initiatives (ICLEI): Toronto, ON, Canada, 1996. [Google Scholar]
- United Nations. Report of the United Nations conference on Environment and development. In Proceedings of the United Nations Conference on Environment and Development, Rio de Janeiro, Brazil, 3–14 June 1992. [Google Scholar]
- United Nations. Transforming Our World: The 2030 Agenda for Sustainable Development; United Nations: New York, NY, USA, 2015. [Google Scholar]
- Michalina, D.; Mederly, P.; Diefenbacher, H.; Held, B. Sustainable Urban Development: A Review of Urban Sustainability Indicator Frameworks. Sustainability 2021, 13, 9348. [Google Scholar] [CrossRef]
- Kaur, H.; Garg, P. Urban Sustainability Assessment Tools: A review. J. Clean. Prod. 2019, 210, 146–158. [Google Scholar] [CrossRef]
- Deakin, M.; Curwell, S.; Lombardi, P. Bequest: Sustainability assessment the framework and directory of methods. Int. J. Life Cycle Assess. 2001, 6, 373–390. [Google Scholar] [CrossRef]
- Brandon, P.S.; Lombardi, P. Evaluating Sustainable Development in the Built Environment, 2nd ed.; Wiley-Blackwell: Hoboken, NJ, USA, 2011. [Google Scholar]
- Salat, S. Integrated Guidelines for Sustainable Neighbourhood Design; United Nations Environment Programme: Nairobi, Kenya, 2021. [Google Scholar]
- Mumford, L. The Neighbourhood and the Neighbourhood Unit. Town Plan. Rev. 1954, 24, 256–270. Available online: http://www.jstor.org/stable/40101548 (accessed on 15 February 2023). [CrossRef]
- U.S. Green Building Council (USGBC). Leadership in Energy and Environmental Design (LEED) 2009 for Neighborhood Development; U.S. Green Building Council: Washington, DC, USA, 2009. [Google Scholar]
- Deutsche Gesellschaft für Nachhaltiges Bauen—DGNB e.V. (German Sustainable Building Council), Certification Requirements for Urban Districts. Available online: https://www.dgnb-system.de/en/districts/certification-requirements/ (accessed on 15 February 2023).
- The Energy and Resources Institute (TERI), Green Rating for Integrated Habitat Assessment (GRIHA) Council 2021, GRIHA for Large Development. Available online: https://www.grihaindia.org/griha-large-developments (accessed on 15 February 2023).
- Sharifi, A.; Dawodu, A.; Cheshmehzangi, A. Neighborhood sustainability assessment tools: A review of success factors. J. Clean. Prod. 2021, 293, 125912. [Google Scholar] [CrossRef]
- Sharifi, A.; Murayama, A. Neighborhood sustainability assessment in action: Cross-evaluation of three assessment systems and their cases from the US, the UK, and Japan. Build. Environ. 2014, 72, 243–258. [Google Scholar] [CrossRef]
- Marchese, D.; Reynolds, E.; Bates, M.E.; Morgan, H.; Clark, S.S.; Linkov, I. Resilience and sustainability: Similarities and differences in environmental management applications. Sci. Total Environ. 2018, 613–614, 1275–1283. [Google Scholar] [CrossRef] [PubMed]
- Dehghanmongabadi, A.; Hoşkara, Ş.Ö.; Shirkhanloo, N. Introduction to achieve sustainable neighborhood. Int. J. Arts Commer. 2014, 3, 16–26. [Google Scholar]
- Luederitz, C.; Lang, D.J.; Von Wehrden, H. A systematic review of guiding principles for sustainable urban neighborhood development. Landsc. Urban Plan. 2013, 118, 40–52. [Google Scholar] [CrossRef]
- Yıldız, S.; Yilmaz, M.; Kivrak, S.; Gültekin, A.B. Neighborhood Sustainability Assessment Tools and a Comparative Analysis of Five Different Assessment Tools. J. Plan. 2016, 26, 93–100. [Google Scholar] [CrossRef]
- Sharifi, A. Sustainability at the Neighborhood Level: Assessment Tools and the Pursuit of Sustainability. Ph.D. Thesis, Nagoya University, Nagoya, Japan, 2013. [Google Scholar]
- Berardi, U. Sustainability Assessment in the Construction Sector: Rating Systems and Rated Buildings. Sustain. Dev. 2012, 20, 411–424. [Google Scholar] [CrossRef]
- Bond, A.J.; Morrison-Saunders, A. Re-evaluating Sustainability Assessment: Aligning the vision and the practice. Environ. Impact Assess. Rev. 2011, 31, 1–7. [Google Scholar] [CrossRef] [Green Version]
- Haapio, A. Towards sustainable urban communities. Environ. Impact Assess. Rev. 2012, 32, 165–169. [Google Scholar] [CrossRef]
- Deng, W. Improving Sustainability Decision-Making at Neighbourhood Level: A New Framework for Performance Assessment Based on China’s Small Residential District. Ph.D Thesis, The University of New South Wales: Sydney, NSW, Australia, 2011. [Google Scholar]
- Ness, B.; Urbel-Piirsalu, E.; Anderberg, S.; Olsson, L. Categorising tools for sustainability assessment. Ecol. Econ. 2007, 60, 498–508. [Google Scholar] [CrossRef]
- Hurley, J.; Horne, R. Review and analysis of tools for the implementation and Assessment of Sustainable Urban Development. In Proceedings of the 2006 Environmental Institute of Australia and New Zealand Conference, Adelaide, Australia, 17–20 September 2006. [Google Scholar]
- Japan Sustainable Building Consortium (JSBC) and Institute for Building Environment and Energy Conservation (IBEC). Comprehensive Assessment System for Built Environment Efficiency (CASBEE) Family and Tools. Available online: https://www.ibec.or.jp/CASBEE/english/toolsE_urban.htm (accessed on 25 February 2023).
- U.S. Green Building Council (USGBC). LEED v4 for Neighborhood Development; U.S. Green Building Council: Washington, DC, USA, 2018. [Google Scholar]
- Building Research Establishment (BRE), Building Research Establishment Environmental Assessment Method (BREEAM) Communities. Available online: https://bregroup.com/products/breeam/breeam-technical-standards/breeam-communties/ (accessed on 25 February 2023).
- Building and Construction Authority. Green Mark-2021. Available online: https://www1.bca.gov.sg/buildsg/sustainability/green-mark-certification-scheme/green-mark-2021 (accessed on 15 February 2023).
- Lee, J.; Park, J.; Schuetze, T. Comparative Analysis of LEED–ND & DGNB–UD Rating System. In Proceedings of the 8th Conference of the International Forum on Urbanism (IfoU), Incheon, Republic of Korea, 22–24 June 2015; pp. 235–248. [Google Scholar] [CrossRef]
- Hamedani, A.Z.; Huber, F. A Comparative Study Of DGNB, LEED And BREEAM Certificate Systems in Urban Sustainability. WIT Trans. Ecol. Environ. 2011, 155, 121–132. [Google Scholar] [CrossRef] [Green Version]
- Yigitcanlar, T.; Dur, F. Developing a Sustainability Assessment Model: The Sustainable Infrastructure, Land-Use, Environment and Transport Model. Sustainability 2010, 2, 321–340. [Google Scholar] [CrossRef] [Green Version]
- Kamble, T.; Bahadure, S. Neighborhood sustainability assessment in developed and developing countries. Environ. Dev. Sustain. 2019, 22, 4955–4977. [Google Scholar] [CrossRef]
- U.S. Green Building Council (USGBC). Checklist: LEED v4 for Neighborhood Development. Available online: https://www.usgbc.org/resources/checklist-leed-v4-neighborhood-development (accessed on 26 February 2023).
- Deutsche Gesellschaft für Nachhaltiges Bauen—DGNB e.V. (German Sustainable Building Council), Planning and Certification of Sustainable Districts. Available online: https://www.dgnb-system.de/en/districts/ (accessed on 26 February 2023).
- Deutsche Gesellschaft für Nachhaltiges Bauen—DGNB e.V. (German Sustainable Building Council). DGNB-Criteria-Set-Districts-Version-2020; German Sustainable Building Council (DGNB): Stuttgart, Germany, 2020. [Google Scholar]
- The Energy and Resources Institute (TERI). GRIHA LD for Large Development; GRIHA Council-Teri Initiative: New Delhi, India, 2015. [Google Scholar]
- Curwell, S.R.; Deakin, M.; Symes, M. (Eds.) Sustainable Urban Development: The Framework and Protocols for Environmental Assessment; Routledge: London, UK, 2005. [Google Scholar]
- Organisation for Economic Corporation Development (OECD). OECD Key Environmental Indicators; Organisation for Economic Corporation Development Press: Paris, France, 2004. [Google Scholar]
- Foley, B.A.; Daniell, T.M. A sustainability tool for intrasectoral and intersectoral water resources decision making. Australas. J. Water Resour. 2015, 8, 11–19. [Google Scholar] [CrossRef]
- Säynäjoki, E.; Kyrö, R.; Heinonen, J.; Junnila, S. An assessment of the applicability of three international neighbourhood sustainability rating systems to diverse local conditions, with a focus on Nordic case areas. Int. J. Sustain. Build. Technol. Urban Dev. 2012, 3, 96–104. [Google Scholar] [CrossRef]
- Sharifi, A.; Yamagata, Y. Urban Resilience Assessment: Multiple Dimensions, Criteria, and Indicators. In Urban Resilience; Advanced Sciences and Technologies for Security Applications; Springer: Berlin/Heidelberg, Germany, 2016; pp. 259–276. [Google Scholar]
- Sharifi, A.; Murayama, A. A critical review of seven selected neighbourhood sustainability assessment tools. Environ. Impact Assess. Rev. 2013, 38, 73–87. [Google Scholar] [CrossRef]
- Horbach, J. (Ed.) Indicator Systems for Sustainable Innovation; Physica-Verlag HD/Springer Science & Business Media: Berlin/Heidelberg, Germany, 2005. [Google Scholar]
- Huovila, A.; Bosch, P.; Airaksinen, M. Comparative analysis of standardized indicators for Smart sustainable cities: What indicators and standards to use and when? Cities 2019, 89, 141–153. [Google Scholar] [CrossRef]
- Kothari, C.R. Research Methodology Methods and Techniques; New Age International (P) Ltd., Publishers: New Delhi, India, 2004. [Google Scholar]
- Ali-Toudert, F.; Ji, L.; Fährmann, L.; Czempik, S. Comprehensive Assessment Method for Sustainable Urban Development (CAMSUD)—A New Multi-Criteria System for Planning, Evaluation and Decision-Making. Prog. Plan. 2020, 140, 100430. [Google Scholar] [CrossRef]
- Ali-Toudert, F.; Ji, L. Modeling and measuring urban sustainability in multi-criteria based systems—A challenging issue. Ecol. Indic. 2017, 73, 597–611. [Google Scholar] [CrossRef]
- Orova, M.; Reith, A. Multiscalarity in International Sustainable Assessment Systems: A Qualitative Comparison of LEED, CASBEE, BREEAM, DGNB and ESTIDAMA on Building, Neighbourhood and City Scale. IOP Conf. Ser. Earth Environ. Sci. 2019, 290, 012056. [Google Scholar] [CrossRef]
- LaGro, J.A., Jr. Site Analysis: A Contextual Approach to Sustainable Land Planning and Site Design; John Wiley & Sons, Inc.: Hoboken, NJ, USA, 2008. [Google Scholar]
- Yamagata, Y.; Maruyama, H. (Eds.) Urban Resilience A Transformative Approach; Springer International Publishing: Cham, Switzerland, 2016. [Google Scholar]
- Brears, R.C. (Ed.) Resilience and Water Resources Management. In Climate Resilient Water Resources Management; Palgrave Studies in Climate Resilient Societies; Springer: Berlin/Heidelberg, Germany, 2018; pp. 15–30. [Google Scholar]
- Minghua, Z.; Xiumin, F.; Rovetta, A.; Qichang, H.; Vicentini, F.; Bingkai, L.; Giusti, A.; Yi, L. Municipal solid waste management in Pudong New Area, China. Waste Manag. 2009, 29, 1227–1233. [Google Scholar] [CrossRef]
- Asafu-Adjaye, J. The relationship between energy consumption, energy prices and economic growth: Time series evidence from Asian developing countries. Energy Econ. 2000, 22, 615–625. [Google Scholar] [CrossRef] [Green Version]
- Sharifi, A.; Yamagata, Y. Principles and criteria for assessing urban energy resilience: A literature review. Renew. Sustain. Energy Rev. 2016, 60, 1654–1677. [Google Scholar] [CrossRef] [Green Version]
- Burton, C.G. A Validation of Metrics for Community Resilience to Natural Hazards and Disasters Using the Recovery from Hurricane Katrina as a Case Study. Ann. Assoc. Am. Geogr. 2014, 105, 67–86. [Google Scholar] [CrossRef]
- Von Gleich, A. Comment: Innovation Ability and Innovation Direction. In Innovations Towards Sustainability; Lehmann-Waffenschmidt, M., Ed.; Physica-Verlag: Heidelberg, Germany, 2007; pp. 141–153. [Google Scholar] [CrossRef]
- United Nations. Sustainable transport, sustainable development, Interagency Report. In Proceedings of the Second Global Sustainable Transport Conference, Beijing, China, 14–16 October 2021. [Google Scholar]
- Faturechi, R.; Miller-Hooks, E. Measuring the Performance of Transportation Infrastructure Systems in Disasters: A Comprehensive Review. J. Infrastruct. Syst. 2015, 21, 04014025. [Google Scholar] [CrossRef]
- Bertolini, L.; le Clercq, F.; Kapoen, L. Sustainable accessibility: A conceptual framework to integrate transport and land use plan-making. Two test-applications in the Netherlands and a reflection on the way forward. Transp. Policy 2005, 12, 207–220. [Google Scholar] [CrossRef]
- Shirazi, M.R.; Keivani, R. Social Sustainability of Compact Neighbourhoods Evidence from London and Berlin. Sustainability 2021, 13, 2340. [Google Scholar] [CrossRef]
- Khatibi, M.; Khaidzir, K.A.M.; Syed Mahdzar, S.S. Measuring the sustainability of neighborhoods: A systematic literature review. iScience 2023, 26, 105951. [Google Scholar] [CrossRef]
- Chandra, A.; Acosta, J.; Howard, S.; Uscher-Pines, L.; Williams, M.; Yeung, D.; Garnett, J.; Meredith, L.S. Building community resilience to disaster. Rand Health Q. 2011, 11, 6. [Google Scholar] [CrossRef]
- Frankenberger, T.; Mueller, M.; Spangler, T.; Alexander, S. Community Resilience: Conceptual Framework and Measurement Feed the Future Learning Agenda; Westat: Rockville, MD, USA, 2013. [Google Scholar]


| Credit Categories | Credits and Prerequisites | Credit Points/110 | Normalized Credit Points/100 | Credit Categories (%) |
|---|---|---|---|---|
| Smart location and linkage | Smart location | Required | - | 25.42 |
| Imperiled species and ecological communities | Required | - | ||
| Wetland and water body conservation | Required | - | ||
| Agricultural land conservation | Required | - | ||
| Floodplain avoidance | Required | - | ||
| Preferred locations | 10 | 9.1 | ||
| Brownfield remediation | 2 | 1.82 | ||
| Access to quality transit | 7 | 6.35 | ||
| Bicycle facilities | 2 | 1.82 | ||
| Housing and job proximity | 3 | 2.69 | ||
| Steep slope protection | 1 | 0.91 | ||
| Site design for habitat or wetland and water body conservation | 1 | 0.91 | ||
| Restoration of habitat or wetlands and water bodies | 1 | 0.91 | ||
| Long-term conservation management of habitat or wetlands and water bodies | 1 | 0.91 | ||
| Neighborhood pattern and design | Walkable streets | Required | - | 37.28 |
| Compact development | Required | - | ||
| Connected and open community | Required | - | ||
| Walkable streets | 9 | 8.18 | ||
| Compact development | 6 | 5.45 | ||
| Mixed used neighborhood | 4 | 3.64 | ||
| Housing types and affordability | 7 | 6.36 | ||
| Reduced parking footprint | 1 | 0.91 | ||
| Connected and open community | 2 | 1.82 | ||
| Transit facilities | 1 | 0.91 | ||
| Transportation demand management | 2 | 1.82 | ||
| Access to civic and public space | 1 | 0.91 | ||
| Access to recreation facilities | 1 | 0.91 | ||
| Visitability and universal design | 1 | 0.91 | ||
| Community outreach and involvement | 2 | 1.82 | ||
| Local food production | 1 | 0.91 | ||
| Tree-lined and shaded streetscapes | 2 | 1.82 | ||
| Neighborhood schools | 1 | 0.91 | ||
| Green infrastructure and building | Certified green building | Required | - | 28.2 |
| Minimum building energy performance | Required | - | ||
| Indoor water use reduction | Required | - | ||
| Construction activity pollution prevention | Required | - | ||
| Certified green buildings | 5 | 4.55 | ||
| Optimize building energy performance | 2 | 1.82 | ||
| Indoor water use reduction | 1 | 0.91 | ||
| Outdoor water use Reduction | 2 | 1.82 | ||
| Building reuse | 1 | 0.91 | ||
| Historic resource preservation and adaptive reuse | 2 | 1.82 | ||
| Minimized site disturbance | 1 | 0.91 | ||
| Rainwater management | 4 | 3.63 | ||
| Heat island reduction | 1 | 0.91 | ||
| Solar orientation | 1 | 0.91 | ||
| Renewable energy production | 3 | 2.73 | ||
| District heating and cooling | 2 | 1.82 | ||
| Infrastructure energy efficiency | 1 | 0.91 | ||
| Wastewater management | 2 | 1.82 | ||
| Recycled and reused infrastructure | 1 | 0.91 | ||
| Solid waste management | 1 | 0.91 | ||
| Light pollution reduction | 1 | 0.91 | ||
| Innovation and design process | Innovation | 5 | 4.55 | 5.46 |
| LEED®-accredited professional | 1 | 0.91 | ||
| Regional priority credit | Regional priority credit: region defined | 1 | 0.91 | 3.64 |
| Regional priority credit: region defined | 1 | 0.91 | ||
| Regional priority credit: region defined | 1 | 0.91 | ||
| Regional priority credit: region defined | 1 | 0.91 | ||
| - | Total credit | 110 | 100 | 100 |
| Domain | Criteria Group | Criteria | Relevance Factor | Share of Total Score (%) | Domain Score (%) | |
|---|---|---|---|---|---|---|
| Environmental quality (ENV) | Effect on global and local environment (ENV1) | ENV1.1 | Lifecycle assessment | 8 | 6.4 | 20 |
| ENV 1.2 | Pollutants and hazardous substances | - | - | |||
| ENV 1.5 | Urban climate | 5 | 4.0 | |||
| Resource consumption (ENV2) | ENV 2.2 | Water cycle systems | 4 | 3.2 | ||
| ENV2.3 | Land use | 4 | 3.2 | |||
| ENV 2.4 | Biodiversity | 4 | 3.2 | |||
| Economic quality (ECO) | Life-cycle costs (ECO1) | ECO1.1 | Lifecycle costs | 4 | 5.6 | 20 |
| Economic development (ECO2) | ECO2.1 | Resilience and adaptation | 3 | 4.3 | ||
| ECO2.3 | Land Use efficiency | 3 | 4.3 | |||
| ECO2.4 | Value stability | 2 | 2.9 | |||
| ECO2.5 | Environmental risks | 2 | 2.9 | |||
| Sociocultural and functional quality (SOC) | Health, comfort, and user satisfaction (SOC1) | SOC1.1 | Thermal comfort in open space | 3 | 2.6 | 20 |
| SOC1.6 | Open space | 4 | 3.5 | |||
| SOC1.8 | Workplace comfort | - | - | |||
| SOC1.9 | Noise, exhaust, and light emission | 3 | 2.6 | |||
| Functionality (SOC2) | SOC2.1 | Barrier-free design | 3 | 2.6 | ||
| Sociocultural quality (SOC3) | SOC3.1 | Urban design | 3 | 2.6 | ||
| SOC3.2 | Social and functional mix | 4 | 3.5 | |||
| SOC3.3 | Social and commercial infrastructure | 3 | 2.6 | |||
| Technical quality (TEC) | Technical infrastructure (TEC 2) | TEC2.1 | Energy infrastructure | 4 | 4.4 | 20 |
| TEC2.2 | Resource management | 2 | 2.2 | |||
| TEC2.4 | Smart infrastructure | 2 | 2.2 | |||
| Mobility (TEC3) | TEC3.1 | Mobility infrastructure—motorized transportation | 5 | 5.6 | ||
| TEC3.2 | Mobility infrastructure—pedestrians and cyclists | 5 | 5.6 | |||
| Process quality (PRO) | Planning quality (PRO1) | PRO1.2 | Integrated planning | 3 | 5.0 | 20 |
| PRO1.7 | Participation | 2 | 3.3 | |||
| PRO1.8 | Project management | 2 | 3.3 | |||
| PRO1.9 | Governance | 2 | 3.3 | |||
| PRO1.10 | Safety concepts | - | - | |||
| Construction quality (PRO 2) | PRO2.1 | Construction site/construction process | 1 | 1.8 | ||
| Quality assurance in the use phase (PRO3) | PRO3.5 | Quality assurance and monitoring | 2 | 3.3 | ||
| Total | 92 | 100 | 100 |
| Subsection | Subsection | Overall Weights (A) | Maximum Subsection Score (B) | Weighted Score (C) = (A) × (B) | Subsection Score (%) |
|---|---|---|---|---|---|
| Self-sufficiency appraisals | Energy | 0.18 | 100 | 18 | - |
| Water | 0.23 | 100 | 23 | - | |
| Organic solid waste Treatment | 0.12 | 100 | 12 | - | |
| Development quality | Site Planning | 0.08 | 100 | 8 | 8 |
| Energy | 0.09 | 100 | 9 | 27 * | |
| Water | 0.12 | 100 | 12 | 35 * | |
| Solid waste management | 0.6 | 100 | 6 | 18 * | |
| Transport | 0.06 | 100 | 6 | 6 | |
| Social | 0.06 | 100 | 6 | 6 | |
| Total | 1 | 100 | 100 | 100 |
| Author/Authors Year | Number of Themes | Themes |
|---|---|---|
| Orova, M.; Reith, A. 2019 [59] | 10 | 1. Healthy environment, 2. pollution and risks, 3. water efficiency and waste management, 4. material, 5. energy efficiency, 6. ecology, 7. the sustainable site, 8. management and quality of services, 9. economic aspect, and 10. community |
| Hamedani, A.Z; Huber, F. 2012 [41] | 13 | 1. Social and cultural aspects, 2. innovation, 3. design and planning, 4. process and construction management, 5. infrastructure, 6. business and economy, 7. transportation, 8. ecology and environment, 9. buildings, 10. location of new and existing communities, 11. resource efficient use, 12. water, 13. management energy efficiency |
| Lee, J.; Park, J.; Schuetze, T. 2015 [40] | 10 | 1. Smart green site, 2. smart green transportation, 3. smart green economy, 4. smart green building, 5. smart green infrastructure, 6. smart green community, 7. smart green ecology, 8. smart green program, 9. smart green water, and 10. smart green innovation |
| Kamble, T.; Bahadure, S. 2021 [43] | 8 | 1. Social, 2. site and site planning, 3. energy, 4. water and wastewater, 5. material and resources, 6. environmental, 7. transportation, 8. others (innovation and design, stakeholder’s engagement, historic preservation, etc.) |
| Sharifi, A.; Murayama, A. 2013 [53] | 6 | 1. Resource and environment, 2. transportation, 3. social, 4. economic, 5. location site selection, 6. pattern and design |
| Ali-Toudert, F.; Ji, L. 2017 [58] | 9 | 1. Site location/site ecology; 2. land use, urban form-building; 3. infrastructure, transport; 4. urban climate, climate change; 5. resources (energy, water, materials); 6. society, culture; 7. economy; 8. management, quality of services; 9. bonus |
| Deng, W. 2011 [33] | 9 | 1. Environmental quality within site, 2. neighborhood layout and facilities, 3. infrastructure, 4. transport, 5. economy, 6. resources and energy, 7. environmental impact, 8. site ecology, 9. sustainable management |
| Haapio, A. 2012 [32] | 7 | 1. Infrastructure; 2. transportation; 3. location; 4. resources and energy; 5. ecology; 6. business, economy, and employment; 7. wellbeing |
| Yıldız, S.; Yılmaz, M.; Kıvrak, S.; Gültekin, A.B. 2016 [28] | 6 | 1. Environment and land usage, 2. economic development, 3. transportation, 4. social development, 5. design and management, 6. resources and energy |
| Sharifi, A.; Yamagata, Y. 2016 [52] | 5 | 1. Materials and environmental resources, 2. society and wellbeing, 3. economic, 4. built environment and infrastructure, 5. governance and institution |
| No. | LEED-ND | Weighted Score/110 | Score /100 | DGNB–UD | Weighted Score/92 | Score /100 | GRIHA–LD | Score /100 |
|---|---|---|---|---|---|---|---|---|
| 1 | Wetland and water body Conservation | Pre * | Pre | Land use | 4 | 3.2 | Clearance for construction | Ma * |
| 2 | Agricultural land conservation | Pre | Pre | Lifecycle assessment | 8 | 6.4 | Storm water management | Ma |
| 3 | Floodplain avoidance | Pre | Pre | Urban design | 3 | 2.6 | Tree cover on site | Ma |
| 4 | Imperiled species and ecological communities | Pre | Pre | Urban climate | 5 | 4 | Storm water management | 3 |
| 5 | Construction activity pollution prevention | Pre | Pre | Biodiversity | 4 | 3.2 | Maintain existing site features | 3 |
| 6 | Preferred locations | 10 | 9.1 | Construction site solar orientation/ construction process | 1 | 1.7 | Manage construction activities in management to reduce environmental damage | 2 |
| 7 | Steep slope protection | 1 | 0.91 | - | - | - | - | - |
| 8 | Solar orientation | 1 | 0.91 | - | - | - | - | - |
| 9 | Site design for habitat or wetland and water body conservation | 1 | 0.91 | - | - | - | - | - |
| 10 | Housing and job proximity | 3 | 2.72 | - | - | - | - | - |
| 11 | Brownfield eemediation | 2 | 1.82 | - | - | - | - | - |
| 12 | Long-term conservation management of habitat or wetlands and water bodies | 1 | 0.91 | - | - | - | - | - |
| 13 | Heat island reduction | 1 | 0.91 | - | - | - | - | - |
| 14 | Restoration of habitat or wetlands and water bodies | 1 | 0.91 | - | - | - | - | - |
| 15 | Minimized site disturbance | 1 | 0.91 | - | - | - | - | - |
| 16 | Regional priority credit: Region defined | 1 | 0.91 | - | - | - | - | - |
| Total | 23 | 20.92 | Total | 25 | 21.1 | Total | 8 |
| No. | LEED–ND | Weighted Score/110 | Score /100 | DGNB–UD | Weighted Score/92 | Score /100 | GRIHA–LD | Score /100 |
|---|---|---|---|---|---|---|---|---|
| 1 | Certified green buildings | Pre | Pre | Noise, exhaust, and light emissions | 3 | 2.6 | - | - |
| 2 | Minimum building energy performance | Pre | Pre | - | - | - | - | - |
| 3 | Certified green buildings | 5 | 4.54 | - | - | - | - | - |
| 4 | Optimize building energy performance | 2 | 1.82 | - | - | - | - | - |
| 5 | Building reuse | 1 | 0.91 | - | - | - | - | - |
| 6 | Historic resource preservation and adaptive reuse | 2 | 1.82 | - | - | - | - | - |
| 7 | Regional priority credit: region defined | 1 | 0.91 | - | - | - | - | - |
| Total | 11 | 10.00 | Total | 3 | 2.6 | Total | 0 |
| No. | LEED–ND | Weighted Score/110 | Score /100 | DGNB–UD | Weighted Score/92 | Score /100 | GRIHA–LD | Score /100 |
|---|---|---|---|---|---|---|---|---|
| 1 | Indoor water use reduction | Pre | Pre | Water cycle systems | 4 | 3.2 | Water self-sufficient development | Ma |
| 2 | Indoor water use reduction | 1 | 0.91 | - | - | - | Capturing and storing rain water on site for reuse | Ma |
| 3 | Outdoor water use reduction | 2 | 1.82 | - | - | - | Monitoring and audits and operation and maintenance | - |
| 4 | Rainwater management | 4 | 3.63 | - | - | - | Reduction of the total amount of water required from the local municipal grid/ground water by 25 percent | - |
| 5 | - | - | - | - | - | - | Rainwater falling on site (besides that is being stored for use) is recharged using appropriate filtration measures | - |
| 6 | - | - | - | - | - | - | All low flow fixtures | - |
| 7 | - | - | - | - | - | - | Remote monitoring, operation and maintenance | - |
| Total | 7 | 6.36 | Total | 4 | 3.2 | Total | 35 |
| No. | LEED–ND | Weighted Score/110 | Score /100 | DGNB–UD | Weighted Score/92 | Score /100 | GRIHA–LD | Score /100 |
|---|---|---|---|---|---|---|---|---|
| 1 | Wastewater management | 2 | 1.82 | Resource management | 2 | 2.2 | Centralized or decentralized STP on site. | Ma |
| 2 | Recycled and reused infrastructure | 1 | 0.91 | - | - | - | Recycling STP water for reuse on site. | Ma |
| 3 | Solid waste management | 1 | 0.91 | - | - | - | STP/wastewater treatment facility should meet the CPCB norms. | - |
| Total | 4 | 3.64 | Total | 2 | 2.2 | Total | 18 |
| No. | LEED–ND | Weighted Score/110 | Score /100 | DGNB–UD | Weighted Score/92 | Score /100 | GRIHA–LD | Score /100 |
|---|---|---|---|---|---|---|---|---|
| 1 | Minimum building energy performance | Pre | Pre | Energy infrastructure | 4 | 4.4 | Outdoor road lighting meets the required lux levels | Ma |
| 2 | Renewable energy production | 3 | 2.73 | - | - | - | Automatic switching/ dimming controls | Ma |
| 3 | District heating and cooling | 2 | 1.82 | - | - | - | Smart mini-grids | - |
| 4 | Infrastructure energy efficiency | 1 | 0.91 | - | - | - | Passive urban design strategies, heat island calculation | - |
| 5 | Light pollution reduction | 1 | 0.91 | - | - | - | Operation and maintenance | - |
| Total | 7 | 6.37 | Total | 4 | 4.4 | Total | 27 |
| No. | LEED–ND | Weighted Score/110 | Score /100 | DGNB–UD | Weighted Score/92 | Score /100 | GRIHA–LD | Score /100 |
|---|---|---|---|---|---|---|---|---|
| 1 | Local food production | 1 | 0.91 | Lifecycle cost | 4 | 5.7 | Food production onsite | (Score included in site planning) |
| 2 | Regional priority credit: region defined | 1 | 0.91 | Resilience and adaptability | 3 | 4.3 | - | |
| 3 | - | - | - | Land use efficiency | 3 | 4.3 | - | |
| - | - | - | Value stability | 2 | 2.9 | - | ||
| - | - | - | Environmental risks | 2 | 2.9 | - | ||
| Total | 2 | 1.82 | Total | 14 | 20.1 | Total | 1 |
| No. | LEED–ND | Weighted Score/110 | Score /100 | DGNB–UD | Weighted Score/92 | Score /100 | GRIHA–LD | Score / 100 |
|---|---|---|---|---|---|---|---|---|
| 1 | Innovation | 5 | 4.55 | Smart infrastructure | 2 | 2.2 | - | - |
| 2 | LEED®-accredited professional | 1 | 0.91 | - | - | - | - | - |
| Total | 6 | 5.46 | Total | 2 | 2.2 | Total | 0 |
| No. | LEED–ND | Weighted Score/110 | Score /100 | DGNB–UD | Weighted Score/92 | Score /100 | GRIHA–LD | Score /100 |
|---|---|---|---|---|---|---|---|---|
| 1 | Walkable streets | Pre | Pre | Mobility infrastructure—motorized transportation | 5 | 5.6 | Provision of footpaths and bicycling tracks and safe interaction of NMT traffic with motorized traffic | Ma |
| 2 | Compact development | Pre | Pre | Mobility infrastructure—pedestrian and cyclists | 5 | 5.6 | Supporting infrastructure: bicycle parking, landscaping, public conveniences, etc. | - |
| 3 | Connected and open community | Pre | Pre | - | - | - | Safety measures: railing, non-slippery surfaces | - |
| 4 | Walkable streets | 9 | 8.18 | - | - | - | Parking for two-wheelers | - |
| 5 | Compact development | 6 | 5.45 | - | - | - | Road network planning | - |
| 6 | Reduced parking footprint | 1 | 0.91 | - | - | - | - | - |
| 7 | Transit facilities | 1 | 0.91 | - | - | - | - | - |
| 8 | Transportation demand management | 2 | 1.81 | - | - | - | - | - |
| 9 | Bicycle facilities | 2 | 1.81 | - | - | - | - | - |
| 10 | Access to quality transit | 7 | 6.36 | - | - | - | - | - |
| 11 | Tree-lined and shaded streetscapes | 2 | 1.81 | - | - | - | - | - |
| Total | 30 | 27.24 | Total | 10 | 11.2 | Total | 6 |
| No. | LEED–ND | Weighted Score/110 | Score /100 | DGNB–UD | Weighted Score/92 | Score /100 | GRIHA–LD | Score /100 |
|---|---|---|---|---|---|---|---|---|
| 1 | Mixed-use neighborhoods | 4 | 3.64 | Thermal Comfort in open spaces | 3 | 2.6 | Facilities for construction workers | Ma |
| 2 | Housing types and affordability | 7 | 6.36 | Open space | 4 | 3.5 | Social infrastructure in development | - |
| 3 | Neighborhood schools | 1 | 0.91 | Barrier-free design | 3 | 2.6 | Planning for low-income group population | - |
| 4 | Historic resource preservation and adaptive reuse | 2 | 1.82 | Social and functional mix | 4 | 3.5 | - | - |
| 5 | Access to civic and public space | 1 | 0.91 | Social and commercial infrastructure | 3 | 2.6 | - | - |
| 6 | Access to recreation facilities | 1 | 0.91 | Participation | 2 | 3.3 | - | - |
| 7 | Visitability and universal design | 1 | 0.91 | - | - | - | - | - |
| 8 | Community outreach and involvement | 2 | 1.82 | - | - | - | - | - |
| Total | 19 | 17.28 | Total | 19 | 18.1 | Total | 6 |
| No. | LEED–ND | Weighted Score/110 | Score /100 | DGNB–UD | Weighted Score/92 | Score /100 | GRIHA–LD | Score /100 |
|---|---|---|---|---|---|---|---|---|
| 1 | Regional priority credit: region defined | 1 | 0.91 | Integrated design | 3 | 5 | - | - |
| 2 | - | - | - | Governance | 2 | 3.3 | - | - |
| 3 | - | - | - | Project management | 2 | 3.3 | - | - |
| 4 | - | - | - | Quality assurance and monitoring | 2 | 3.3 | - | - |
| Total | 0 | 0.91 | Total | 9 | 14.9 | Total | 0 |
| No. | Sustainability Domain | Themes | LEED–ND | DGNB–UD | GRIHA–LD |
|---|---|---|---|---|---|
| 1 | Environmental | Site planning and ecology | 20.92 | 21.1 | 8 |
| 2 | Social | Building | 10.00 | 2.6 | 0 |
| 3 | Environmental | Water | 6.36 | 3.2 | 35 |
| 4 | Environmental | Waste management | 3.64 | 2.2 | 18 |
| 5 | Environmental | Energy | 6.37 | 4.4 | 27 |
| 6 | Economic | Economy | 1.82 | 20.1 | 0 |
| 7 | Institutional | Innovation | 5.46 | 2.2 | 0 |
| 8 | Environmental | Transport | 27.24 | 11.2 | 6 |
| 9 | Social | Community | 17.28 | 18.1 | 6 |
| 10 | Institutional | Governance and monitoring | 0.91 | 14.9 | 0 |
| Total | 100 | 100 | 100 |
Disclaimer/Publisher’s Note: The statements, opinions and data contained in all publications are solely those of the individual author(s) and contributor(s) and not of MDPI and/or the editor(s). MDPI and/or the editor(s) disclaim responsibility for any injury to people or property resulting from any ideas, methods, instructions or products referred to in the content. |
© 2023 by the authors. Licensee MDPI, Basel, Switzerland. This article is an open access article distributed under the terms and conditions of the Creative Commons Attribution (CC BY) license (https://creativecommons.org/licenses/by/4.0/).
Share and Cite
Bahale, S.; Schuetze, T. Comparative Analysis of Neighborhood Sustainability Assessment Systems from the USA (LEED–ND), Germany (DGNB–UD), and India (GRIHA–LD). Land 2023, 12, 1002. https://doi.org/10.3390/land12051002
Bahale S, Schuetze T. Comparative Analysis of Neighborhood Sustainability Assessment Systems from the USA (LEED–ND), Germany (DGNB–UD), and India (GRIHA–LD). Land. 2023; 12(5):1002. https://doi.org/10.3390/land12051002
Chicago/Turabian StyleBahale, Swati, and Thorsten Schuetze. 2023. "Comparative Analysis of Neighborhood Sustainability Assessment Systems from the USA (LEED–ND), Germany (DGNB–UD), and India (GRIHA–LD)" Land 12, no. 5: 1002. https://doi.org/10.3390/land12051002