Article

A Public Participation GIS for Geodiversity and Geosystem Services Mapping in a Mountain Environment: A Case from Grayson County, Virginia, U.S.A.

by
Kyler B. Stanley
,
Lynn M. Resler
* and
Lawrence W. Carstensen
Department of Geography, Virginia Tech, Blacksburg, VA 24061, USA
*
Author to whom correspondence should be addressed.
Land 2023, 12(4), 835; https://doi.org/10.3390/land12040835
Submission received: 4 March 2023 / Revised: 1 April 2023 / Accepted: 3 April 2023 / Published: 5 April 2023
(This article belongs to the Special Issue Perspectives on Mountain Conservation)

Abstract

:
Geodiversity and geosystem services are essential concepts for conservation efforts in mountain regions. Approaches that integrate both natural and human dimensions of mountain abiotic nature are best suited for this purpose; however, geodiversity research and associated conservation efforts along this vein are still developing. Here, we explore the potential of a public participation GIS, which integrates qualitative surveys with quantitative geodiversity information, to assess possible relationships between geodiversity and geosystem services for Grayson County, Virginia, U.S.A. Specifically, we: (1) used a geodiversity index to model geodiversity for the study area, (2) used a public participation GIS to map geosystem services markers, and (3) visualized geodiversity–geosystem services hotspots to uncover potential relationships between geodiversity and geosystem services values. Participants placed 318 markers, most frequently representing aesthetic (32%), artistic (22%), and educational (15%) geosystem services values. The majority (55%) of these markers corresponded to low and very low quantitative geodiversity index scores. Geosystem services value markers were clustered around population centers and protected areas. Although quantitative geodiversity measures are often used to identify and prioritize areas for conservation, our results suggest that locations valued by respondents would be missed using quantitative metrics alone. This research thus supports the need for holistic approaches incorporating place values to conserve and best understand relationships between people and abiotic aspects of mountain landscapes.

1. Introduction

Geodiversity encapsulates the collective variety of the Earth’s abiotic features and processes within a given area [1,2]. Mountains, by virtue of their dynamic slope processes, topographic arrangements, and diverse weathering surfaces and microclimates, are an archetype of geodiversity. Given their presence on every continent, comprising roughly one-quarter of the global land area [3,4], mountains also comprise a substantial component of global geodiversity.
Mountain geodiversity supports many tangible and intangible landscape services. For example, mountain geodiversity sustains ecosystem development, maintenance, and function [5,6,7,8,9,10]. Mountain geodiversity also provides abundant geosystem services, which are the goods, functions, and services provisioned by abiotic nature that support human societies and well-being [2,11,12]. Geosystem services include tangible aspects of abiotic landforms and properties, for example, the provision of minerals. However, they also encompass intangible benefits related to cultural practices and beliefs [13]. For example, many mountain landscapes are sources of artistic inspiration, heritage, scientific knowledge, and education [12,14] and, coupled with geodiversity assessment, may reflect the geotourism potential of mountainous regions [15]. Geodiversity and geosystem services are, therefore, integral to sustaining holistic mountain systems [16]. However, in many places, conservation initiatives that include geodiversity are lagging [17].
Conceptual and analytical standards for geodiversity research are still developing [18], and geodiversity is thus undergoing an innovative period of methodological refinement, especially concerning applications for conservation [19]. Quantitative methods often used for estimating geodiversity and identifying conservation priority areas are algorithmic and often utilize indices to identify and map abiotic features such as landforms, lithology, and soils for a given area [2,18]. These methods enable researchers to identify locations where geologic attributes support biodiversity [20]. Qualitative assessments of geodiversity typically involve non-numerical descriptions of geodiversity elements or an explanation of their value to humans [21]. Within the field of geoconservation, much of the research emphasizes modeling physical geodiversity [18]. Yet, there is a need to integrate geo-socio (and geo-eco-socio)-related research to clarify local stewardship priorities that can preserve and promote cultural and physical geodiversity and geoheritage. However, integrating quantitative with qualitative approaches presents methodological and conceptual challenges [5,22,23]. These challenges include mismatches between how people value geodiversity elements and, where people perceive geodiversity to exist, a lack of universally accepted geodiversity modeling methods, scale constraints, and limitations due to verification [18]. Weightings based on geoinformation crowdsourcing is one promising approach that has been implemented [24]. Yet, there remains room for additional new and innovative methodologies.
Public participation mapping is one potential methodological approach for spatially integrating geodiversity and geosystem services values. Public participation mapping and analysis typically incorporate qualitative data (e.g., interviews, focus groups, and written surveys) with quantitative spatial methodologies (e.g., indices and map algebra). Specifically, place value mapping through public participation geographic information systems (PPGIS) facilitates an understanding of where individuals perceive landscape values to exist [25,26,27,28,29,30,31]. As such, it can assist in uncovering the nuances of place’ [32,33,34]. Using geospatial mapping technologies and quantitative methods, a PPGIS allows researchers or land managers to understand the convergence among environmental and landscape factors, experience, perception, and ultimately, land use decisions [35,36,37]. Thus, given the integration capacity of a PPGIS, it is a potential approach for geodiversity research with promising conservation outcomes.
Here, we use a PPGIS methodology to assess potential relationships between geodiversity and geosystem services. Our study is informed by the geosystem services framework [38] that systematically characterizes the value of geodiversity to people. We focus our efforts on Grayson County, Virginia, U.S.A.—a rural, mountainous county in the Southern Appalachian Mountains—and provide the first assessment of geodiversity in this region. Specifically, we: (1) model the geodiversity of Grayson County using a modified geodiversity index, (2) develop and implement a survey on geosystem services values for Grayson County, Virginia, using a PPGIS methodology and a modified geosystem services framework, and (3) visualize their integration. Finally, we share the benefits, drawbacks, and lessons learned to help inform future work.

2. Materials and Methods

2.1. Study Area

Grayson County, Virginia (VA) (Figure 1), is situated in the Southern Appalachian Mountains within the Blue Ridge physiographic province, lying just north of Virginia’s border with North Carolina. Grayson County is distinctive within the region for its extensive highlands. Elevation ranges from 649.2 m to 1746.2 m a.s.l. at the summit of Mount Rogers—the highest point in the state. An array of relief types (e.g., mountains, rivers, valleys, and plains) create a distinctive landscape and easily identifiable physical landmarks [39]. Grayson County is underlain by a variety of igneous and metamorphic rocks comprising 21 different lithological units [40]. Differential erosion and extensive folding have created a varied terrain characterized by erosion-resistant granitic outcrops and uplands and by valleys composed of gneiss, granites, and schists. The New River, the oldest river on the North American continent [41], meanders north through the central part of the county, with Chestnut Creek, Elk Creek, Fox Creek, Little River, and Wilson Creek being major tributaries. Among the fifty-nine different soils series that exist throughout Grayson County, Peaks very gravely loam (18.6%), Edneytown loam (16.6%), Edneyville loam (13.2%), Glenelg loam (9.4%), and Tate loam (7.9%) dominate. The US Department of Agriculture, Natural Resources Conservation Service, provides detailed descriptions of the soils that are found within Grayson County, as well as across the USA [42].
Like other counties in southwestern Virginia, Grayson County is rural and has a low population density, with 5359 people living within the county’s land area of 1145 km2 [43]. Agriculture, including cattle production, dairy products, corn, hay, and burley tobacco, comprises approximately 40% of the land use. Manufacturing includes textiles, furniture, and other wood products. Several highly visited state and federally managed lands reside fully or partially within Grayson County [44]. These include the Blue Ridge Parkway, George Washington–Jefferson National Forests (containing Lewis Fork and Little Wilson Creek Wilderness and Mt. Rogers Recreational Area), Grayson Highlands State Park, and Matthews State Forest [42].
Grayson County’s natural heritage intertwines with the cultural heritage of the Southern Appalachian mountain people. Music, traditional crafts, and festivals are venues for expressing cultural heritage and its ties to the landscape. For example, Appalachian string band (or old-time) music is a traditional American folk music style for which the region is well known [45], which continues to be celebrated via music festivals throughout the year. Traditionally, Appalachian music is taught by ear and passed down through generations of families and within communities [46]. Before radio, the rugged Appalachian Mountains that dissect the landscape influenced the development of distinctive musical styles between communities [47]. The diversity of landforms and cultural heritage fosters an Appalachian musical ‘sense of place’.
Grayson County landscapes have been degraded by decades of mineral and timber extraction and increasingly through the direct impacts of recreation and tourism [48]. Indiscriminate clearcutting during the late 1800s and early 1900s resulted in extensive soil erosion. Building dams to support the woolen and textile mills along the New River also altered hydrological regimes. Visitation to the Blue Ridge Parkway—the most visited National Park Service unit in the United States [49]—brings millions of tourists, exacerbating the denigration of natural features on trails and rocky overlooks through trampling, defacement of natural features, and overcrowding.

2.2. Methodology

The overall methodology includes three primary steps (Figure 2). The first involved the creation of the geodiversity index for the study area. Second, we developed, tested, and implemented a survey to assess how community members value geosystem services using public participatory mapping. Finally, we visualized the spatial congruence between the quantitative geodiversity index map and the geoservices value markers using hotspot mapping.

2.2.1. Deriving a Geodiversity Index Map for Grayson County, VA, USA

We created an index map to characterize the spatial variability of geodiversity in Grayson County. Ours was the first assessment of geodiversity for the study area. Nine factors, collectively considered necessary for physical landscape evolution [50], were included in the index. These factors were: soil diversity, geological diversity, local relief, landform taxa, terrain ruggedness, slope position, hydrography, and topographic wetness (TWI). Each factor map was derived using readily available spatial datasets and created using ArcGIS Pro (2.8.x, © ESRI). Except for geological diversity which is categorical, each factor was reclassified and normalized using natural breaks [51] in the manner of Zwolinski et al. [18] and Melelli et al. [52] (Table 1).
Geological diversity represents the spatial variability of lithology and rock hardness, which controls the topographic response of erosion on the landscape [52]. Calculating rock hardness was based on Kori et al. [50], whereby each lithological unit’s hardness and hardness variability was ranked on a scale from 1 to 5. Vectorized geologic maps of Virginia (1:600,000 scale) [53,54], were used to aid expert hardness classification. The final classification reflects reclassified rock hardness values represented by the following rock types (listed from softest to hardest): (1) ultramafic; (2) conglomerate; (3) sandstone; (4) amphibolite, greenstone, meta-argillite, mica schist, quartz monzonite, rhyolite, sedimentary breccia; and (5) augen gneiss, biotite gneiss, felsic volcanic rock, and granite (Table 1).
The local relief, landform taxa, slope position, and terrain ruggedness factors were derived from 1 arc-second digital elevation models (DEM) using the open source System for Automated Geoscientific Analyses (SAGA, Version 8.0; [55]). The DEM was acquired from the USGS 3DEP Program dataset [56]. Local relief is a surrogate of potential landscape energy that determines erosion potential. It is calculated by subtracting the minimum from the maximum elevations of the surrounding cells (within a 3 × 3 window) to create a map of landform energy [57]. Landscape roughness, a quantitative measure of surface irregularity [52], considers terrain ruggedness and is a factor in erosion potential, which may change depending on altitude [15]. Typically, landscapes with higher ruggedness are recognized to be more diverse compared to flat terrain [58]. We calculated roughness, and topographic irregularity [59], using a topographic roughness index (TRI) following methods by Riley et al. [60].
Slope position and landform taxa are critical for characterizing the geomorphological components of geodiversity. Slope position categorizes both slope steepness and the location of a position on a slope. Landform taxa considers the role of landforms in hydrological processes, microclimatic variation, and erosion potential. The slope position index (SPI) and landform taxa factor maps were calculated based on the derivation of a topographic position index (TPI) based on methods in Jenness [59]. TPI compares the elevation of each cell within the DEM to the average elevation within a 3 × 3 window around the cell. The slope position index (SPI) is a classification system that calculates the standard deviation of the TPI to define six slope position classes: ridge, upper slope, middle slope, flat slope, lower slope, and valleys. SPI slope types were then reclassified (1–5) through expert classification by each class’s erosion potential (Table 1). The landform taxa factor is a derivate of a classification algorithm that compares the TPI at both coarse (aggregated cells) and fine (original cells) scales so that it can identify individual landforms such as small hills and river features, as well as prominent ridges and valleys [59].
Soil erodibility (soil k-factor) is a quantitative value that estimates the erodibility of a soil type and the rate of runoff [61]. The k-factor considers soil infiltration rate, permeability, surface sealing, structure, texture, organic matter content, surface gravel, and total water capacity [62,63]. Overall soil k factor is essential for understanding landform and landscape development [50]. The soil erodibility factor is calculated through the Universal Soil Loss Equation (USLE) A = R × K × LS × C × P. The resulting k factor is represented as the rate of erosion per unit erosion index from a standard plot and is used to create a soil taxa index. Soil k-factor attribute data for Grayson County, VA, USA, was retrieved through SSURGO database at a scale of 1:12,000 [42]. Each soil type contains a polygon that provides the spatial and other associated soil data (k-factor) that we could factor into the final model. Surface hydrology (as represented in the hydrography factor) shapes the landscape through erosion and sediment deposition. Hydrographic density for Grayson County was calculated by dividing the total water length (km) of the streams and water bodies of each basin by that basin’s area (km2) [52]. Data from the USGS National Hydrography Dataset (NHD) [64] at a 1:24,000 scale provided information for this factor.
Finally, mesoclimatic conditions were factored into the geodiversity index using a topographic wetness index (TWI) and insolation. We used 1 arc-second (~30 m) DEMs to calculate insolation and TWI in SAGA. Mesoclimatic factors represent erosion potential from precipitation and solar radiation intensity on surface topography through physical weathering [65]. Precipitation creates surface runoff that erodes rock surfaces and soils, transports rock downslope, decreases friction leading to slope failure, and accelerates erosion through freeze–thaw processes. The amount of solar radiation reaching a rock surface can substantially impact its internal and external temperature, creating thermal fatigue on the exposed rocks that enhance erosion potential [66].
We used map algebra (i.e., the Multi-Criteria Evaluation technique through Analytic Hierarchy Process) to generate the final geodiversity map based on the weighted summation of each of the nine factors. We followed the weighting process described by Kori et al. [50] but modified our weights to reflect the dominance of weather-resistant metamorphic and igneous rocks and the prominent role of geomorphological processes on the rugged landscape. Our final weights (out of 100%), reflecting the geologic and geomorphic influence and importance of each factor, were determined as slope position (27.7%), geological diversity (18%), soil erodibility (14.8%), landform taxa (10.6%), ruggedness (9.1%), hydrography (8.8%), local relief (8.6%), insolation (1.2%), and TWI (1.2%).

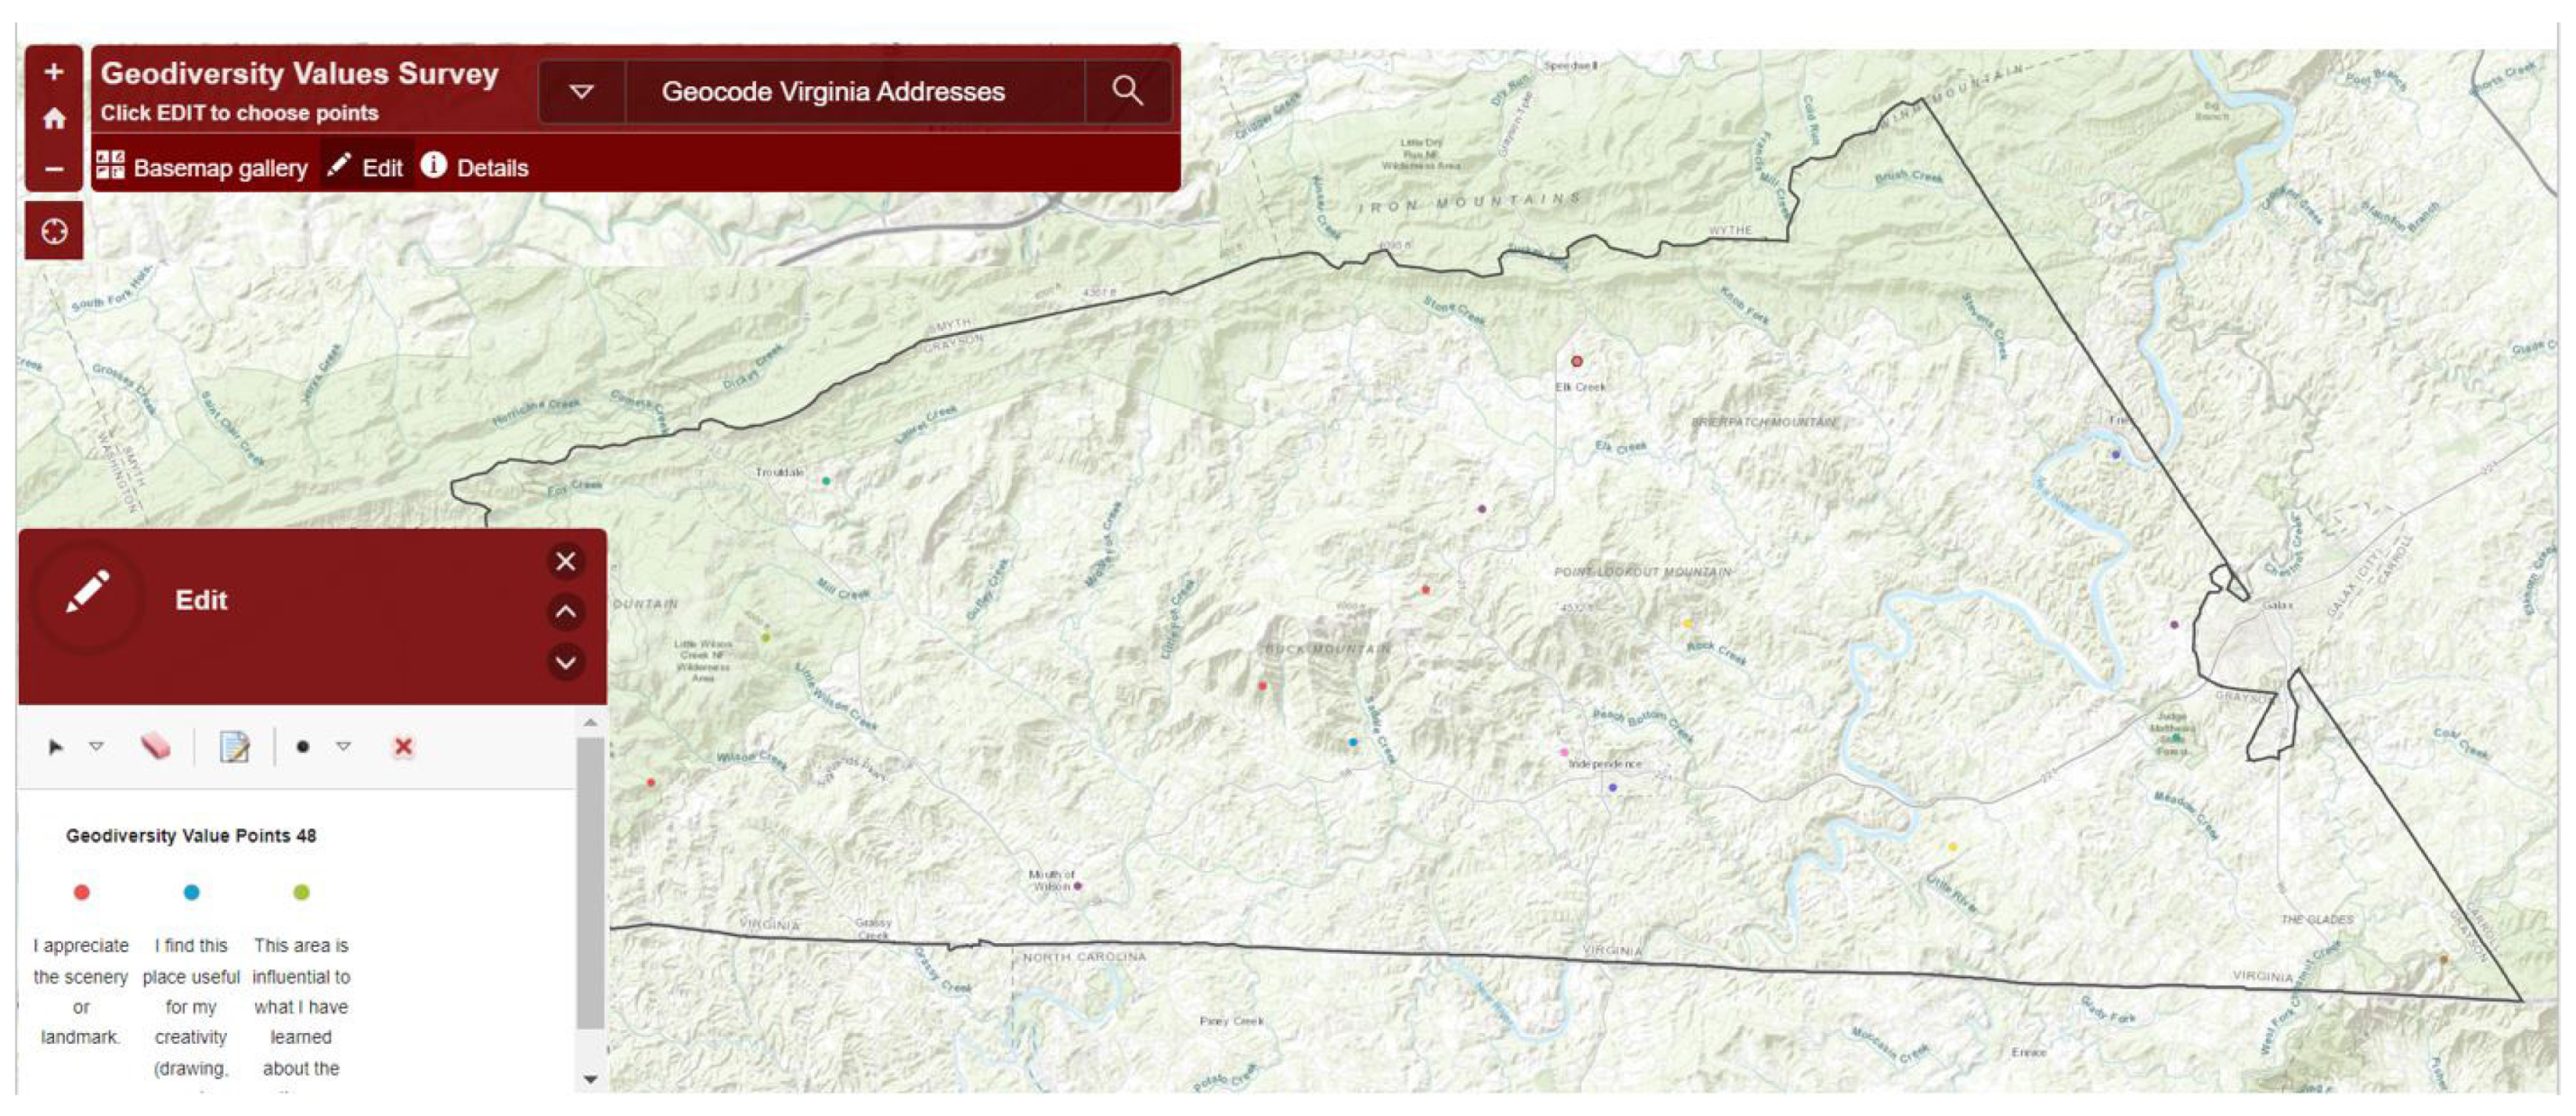
2.2.2. Using a PPGIS to Spatially Assess Geosystem Services

Geosystem services are “the goods and services that are related to geodiversity” [67] (p. 227). Gray [38] presents a framework adapted from the Millennium Ecosystem Assessment (MEA), whereby 25 geosystem services are organized into six groups: intrinsic, cultural, aesthetic, economic, functional, and scientific. Notably, the geosystem services framework recognizes the value of abiotic nature to people independently from its role in supporting people via ecosystem and biodiversity regulation. For example, mountain topography (through slopes, rock features, and microclimate variation) provides geotourism and leisure activities such as rock climbing, hiking, skiing, and sightseeing. Through these geotourism benefits, mountains also provide economic and cultural amenities to tourism-based communities. Topography also provides protective barriers from natural hazards and may have spiritual and cultural associations [14]. Finally, topography has educational values, allowing us to study and learn about the geomorphic processes that generate them [67,68].
We used a PPGIS to determine where people perceive different categories of geosystem services to exist within Grayson County. Using ArcGIS online (ESRI), we configured, pilot-tested, and distributed an internet-based PPGIS survey instrument and interactive map application. In the map interface, markers (points) represented one of ten geodiversity services and geosystem services. We developed our PPGIS based on Brown et al. [69], who used interactive mapping to assess ecosystem services.
Informed by the geosystem services framework [23,38,67], we selected and adapted ten geosystem services values for inclusion in the PPGIS. These were: aesthetic (i.e., Environmental Quality [67]), geotourism and leisure, spiritual, historic, and cultural associations, artistic inspiration, social, food and drink, energy products, ornamental/construction products, important geological landmarks, and educational areas. We selected geosystem services thought to be relevant to the study area context and by perceived ‘mappability’. These geosystem services values belong to the provisioning, knowledge, and cultural categories (Table 2). Provisioning service values include food and drink, fuel, and construction materials/ornamental products (i.e., gemstones). Locations characterized by cultural services have spiritual, historic, aesthetic, artistic, social, and leisure values. Finally, knowledge values represented important geological landmarks and significant historic or educational geologic areas.
An accompanying survey obtained information about respondent demographics, experience participating in the PPGIS survey, and perceived level of knowledge about the study area (Appendix A). Questions were based on those developed by Brown et al. [69] for biodiversity but explicitly modified to gain an understanding of geodiversity. Demographic variables collected included age, gender, level of formal education, length of residence, zip code of residence, county residency, and time spent in Grayson County. Survey questions prompted participants to self-rate their knowledge of the study region, scientific knowledge, amount of time spent in nature, and ease of participating in the PPGIS, based on a scalar single-digit integer value between one and five.

Respondents, Survey Dissemination, and Interaction with the PPGIS Map Interface

The study was based on a convenience sample of volunteers; we thus consider the nature of the PPGIS work exploratory. Virginia Tech’s IRB protocol (#21-220) approved the survey before dissemination. All subjects gave their informed consent for inclusion before they participated in the study. Volunteer survey respondents were sought out based on the geographic scope and goals of the study, with a particular focus on Grayson County, Virginia. Since familiarity with the study area was necessary for mapping, potential respondents were solicited from time-limited in-person gatherings, local gathering places, and through email. In-person gatherings included the Mt. Airy Fiddlers Convention (3–5 June 2021), Fries Community Center Jam Session (23 June 2021), and the Independence Farmers Market/US-52 Road Market on 13 August 2021. Additional solicitation occurred at Chestnut School of the Arts and the Galax Public Library, both located in the nearby city of Galax, Virginia. Potential participants were asked if they lived in, lived near, or owned a second home in Grayson County. If the response was yes, we provided a consent form, and they recorded their email address to receive the survey. Attendees at events or gathering places were given information about the study and asked to provide emails if they were interested in participating further. Seventy-five people agreed to participate via informed consent; 30 completed the online PPGIS survey. This response rate of 40% was considered more than adequate for study purposes.
Ages of the 30 respondents ranged from 21 to 77 years, with a mean age of 57.48 ± 15.91 years. Gender was half male and half female. Education ranged from some college (16.6%) to a completed degree (43.0%). Respondents resided in Grayson County and five adjacent counties. All respondents reported some familiarity with the Grayson County landscape (mean = 3.52 ± 1.06 SD); time spent in Grayson County ranged from 2 months to 55 years, with a mean of 15.38 years.
We distributed the PPGIS and the short demographic/ease-of-use survey (Appendix A) via a URL link through email so that respondents could complete the survey at home or at a location of choice with an accessible computer. In addition to demographic questions, a unique PPGIS instrument and link were created for and emailed separately to each respondent to maintain confidentiality. Respondents were asked to geolocate (using an online interactive map interface [Figure 3]) examples of geosystem services from which they benefited or valued, using point features representing one of the ten selected geosystems (Table 2).
Respondents interacted with the online map interface by selecting among the ten individual service point markers on the screen’s right panel (Figure 3) and dragging and dropping the markers to a location on a basemap of their choice (e.g., Imagery, Streets, Navigation, Open Street Map, USA Topo Maps) to facilitate geolocation. Respondents could choose to place as many or as few markers as they wanted. On the mapping interface, prompts helped respondents interpret the meaning of the geosystem services. Point markers were labeled as a prompt based on the operational definitions (Table 2). For example, “I find this location useful to participate in outdoor sports, walking, hiking, biking, dog walking, or rock climbing” was the prompt used for the geoservice value marker representing geotourism and leisure. Fagerholm et al. [30] provided a guide for framing questions suitable for inclusion in a PPGIS (Table 2). The online survey allowed participants to identify locations by zooming, dragging a cursor, or using the address search tool.

Integration of Geoservice Value Points and Geodiversity Value Map

Geodiversity provides a foundation that enables the provision of geosystem services [70]. To qualitatively assess geosystem services within the greater context of geodiversity, we used hot-spot mapping to visualize how geosystem service marker locations corresponded with the quantitative geodiversity index values. To do so, we extracted the geodiversity index scores corresponding to the geolocation of each geosystem services marker placed survey respondents. We assume that geodiversity provides geosystem services that are recognized in different capacities by local survey respondents and that a spatial relationship exists between the variation in abiotic diversity and their contribution to the well-being of people (e.g., de Groot et al. [71] and Brown and Fagerholm [72], for ecosystem services). Through contingency analysis, we explored the relationship between geosystem services categories and the geodiversity index score.
To visualize the geosystem services markers and associated geodiversity index scores, we created a geodiversity–geosystem services hotspot map following methods by Alessa et al. [73]. This process entailed: (1) generating a geosystem services marker density map (also known as kernel density or heat map) using a point density function tool in ArcGIS Pro, (2) rasterizing and reclassifying the point density layer according to the geodiversity index classification, and (3) dividing the point density map by a reversed classified geodiversity index layer through the raster calculator within ArcGIS Pro.

3. Results

3.1. Geodiversity Index Map

The final geodiversity map (Figure 4) is a raster map, with a pixel resolution of 25 m, that depicts the spatial variability of geodiversity as a grid of numerical parameters, classified into five ordinal groups ranging from very low (1) to very high (5). Mountain peaks, ridges, and sloped areas of high relief (e.g., Buck Mountain and Point Lookout Mountain) characterize landscapes within Grayson County with very high (5) geodiversity. Very low (1) geodiversity scores comprised 14.94% of the county area and generally exist in population centers or low-sloped meadows (Table 3) and where highly erodible ultramafic rocks occur (Figure 4). The mean geodiversity rank for Grayson County was 2.77.

3.2. Geosystem Services Values: Public Participatory GIS

The 30 respondents placed 318 markers representing locations they recognized for at least one of the ten geosystem services categories. Among the 318 markers, all geodiversity score categories were represented (Table 4), indicating that the local respondents valued geosystem services associated with locations characterized by a wide range of geodiversity. Respondents assigned more markers to the aesthetic geosystem services category than any other (31.4%). Markers associated with artistic inspiration (22.0%) and educational (15.7%) values followed, along with geotourism and leisure (8.5%), social (6.6%), spiritual, historic and cultural (6.6%), important geological landmarks (5.0%), food and drink (1.6%), ornamental/construction products (1.3%), and energy products (1.3%) followed (Table 4).
Out of the 318 markers placed throughout the county, the very high geodiversity category comprised 7.55% (n = 24) of the markers, 14.47% (n = 46) were associated with the high geodiversity category, 25.79% (n = 82) were in the medium geodiversity category, and 29.25% (n = 93) and 22.96% (n = 73) were in the low and very low geodiversity categories, respectively (Table 4). These results indicate that most marker locations had low corresponding geodiversity index scores. However, individual geosystem services categories varied in the proportion represented by each geodiversity category (Figure 5). Among these, over 50% of the markers in the aesthetic, artistic inspiration, geotourism and leisure, social, spiritual, historic and cultural categories fell in locations with low or very low geodiversity index scores. Contingency analysis revealed that the relationship between the geosystem services category and the categorical geodiversity score χ2 (36, n = 318) = 51.6, p < 0.05 is statistically meaningful.
Point density mapping of geoservice values markers revealed clustering near towns and natural areas with high visitation. The largest marker cluster was placed near Grayson Highlands State Park, followed by clusters in the towns of Fries, Independence, Elk Creek, and Whitetop, Virginia (Figure 6). The highest density clusters (based on kernel density calculations) ranged from 2.05–5.11 markers/km2, whereas smaller clusters ranged between 1.00 and 2.04 markers per km2 (Figure 6).
Respondents’ experience with the public participation mapping was assessed via an accompanying questionnaire based on a scalar single digit integer value between easy (1) and hard (5). Ease of using the mapping survey was reported to be moderately easy (mean rank = 2.37 ± 0.97 SD), as was the comprehension of the geosystem services markers (2.17 ± 0.80 SD). Identifying geosystem services on the map had a mean rank of 2.82 ± 0.97 SD, indicating that it was slightly challenging.

3.3. Integrating Ecosystem Service Markers and the Geodiversity through Visualization

We visualized the spatial congruence of mapped geodiversity index scores and survey marker placement using a hotspot map. The geodiversity–geosystem services value hotspot map (Figure 7) depicts areas with high concentrations of geosystem services point markers and high concentrations of geodiversity. Based on visual inspection, areas of high and geodiversity-high geosystem services concentrate around Grayson Highlands State Park, Fries, and Independence. Whitetop Mountain and Elk Creek communities exhibit notable importance but are smaller hotspot areas. Very small hotspots are located around the Blue Ridge Parkway and Mouth of Wilson. Medium-to-low-value areas are dispersed throughout the rest of the county.

4. Discussion

We explored potential relationships between geodiversity index scores and geosystem services in Grayson County, VA, USA, using PPGIS. This work also aimed to contribute to the methodological development of geodiversity research at the quantitative/qualitative interface. Here, we outline findings from the case study and contextualize their implications for mountain conservation. We additionally note the benefits and drawbacks of utilizing a PPGIS for geodiversity research and discuss possible avenues for future applications of a PPGIS in place-based geodiversity research.

4.1. Case Study Findings and Implications

The interactive PPGIS survey enabled respondents to identify and mark locations perceived as valuable for cultural, provisioning, and knowledge-based geosystem services (Table 2). Altogether, the mapped geosystem markers represented each of the geodiversity index score categories (very low to very high) and all ten geosystem services categories (Table 4 and Figure 5).
Although isolated markers offer insights into associations between the landscape and geosystem services valuation at an individual level, marker clusters demonstrate a collective recognition of geosystem services. Areas characterized by high geodiversity and clusters of service markers are likely of interest for geoconservation efforts. This research revealed marker clusters near population centers and natural areas with recreation access and cultural amenities (Figure 6). The largest cluster of geosystem services markers was spatially associated with Grayson Highlands State Park—a mountainous, 1822 ha recreational area popular with outdoor and music enthusiasts [74]. The hotspot map also revealed ‘high-high’ clusters, including Grayson Highland State Park and other rugged regions such as Buck Mountain and Whitetop Mountain (Figure 7). An additional large cluster was situated near Fries, which is a community gateway to the 57-mile, multipurpose New River Trail, and the scenic New River. Independence, Elk Creek, Whitetop, the Blue Ridge Parkway, and the unincorporated community, Mouth of Wilson, were locales of smaller clusters (Figure 6). Marker clustering around communities or natural amenities has also been reported in studies that use a PPGIS for mapping ecosystem services [69]. Such mapped placement is likely influenced by ease of access to marked locations [75] and spatial discounting [26,76,77,78], a theory suggesting people prefer to be close to things they like and further away from what they fear or dislike [79].
The maps in Figure 6 and Figure 7 also reveal marker placements in areas with low quantitative geodiversity scores. In fact, the majority of geosystem services markers were located on pixels classified as having very low to low geodiversity (Table 4, Figure 5). Many mapped points were not placed at locations with high to very high geodiversity scores, but rather at locations with personal relevance, suggesting an epistemological mismatch between the mapped quantitative geodiversity layer and responses from the place-based geosystems services survey. For example, a respondent might have placed a Spiritual, Historic, and Cultural marker at a family burial plot at a location with a low geodiversity score. Geodiversity map scores, as defined through the quantitative index alone, would thus have failed to detect such an association, regardless of the importance of the cultural significance of the location. Alternatively, our results could reflect spatial uncertainty and a scale mismatch in marker placement or that point markers (as opposed to polygons) were insufficient for spatially representing geosystem services’ locations. This finding could reflect the reclassification of geodiversity scores to reflect relative geodiversity within the county since an overall rugged landscape characterizes the county. Geosystem-services-marked locations with low geodiversity scores represent opportunities for natural heritage interpretation that may be overlooked using only a quantitative geodiversity assessment. Our findings thus reinforce the importance of integrating quantitative information, and qualitative input from community members for uncovering natural and social nuances of geodiversity.
Among the ten geosystem services, more markers placed by survey respondents were in the aesthetic category than any other geosystem services category (Figure 5). The aesthetic geosystem service reflects an appreciation of the landmark or scenery visible from the landmark. Aesthetic markers are dispersed throughout the county, but clusters again occurred at Grayson Highlands State Park, town sites associated with New River adventure tourism (e.g., Fries), and areas characterized by rugged terrain and high relative relief (Figure 6). We note that aesthetic clusters also tended to reflect a diversity of geosystem services and are, in some instances, additionally associated with artistic and geotourism services (Figure 6). The evaluation of intangible resources associated with geodiversity such as aesthetics and artistic inspiration is critical to the holistic conservation management of geodiversity [80]. In Grayson County, Virginia, the connection could be rooted in both history and culture. Research has suggested that place values are a function of the “sense of place” around one’s home [81]. The historical land use upon which many of the communities in Grayson County were founded (i.e., agriculture, textiles, and logging) cultivated a deep connection to the mountain landscape and the New River for the abiotic resources it provided [48]. Future work could assess how geosystem service valuation changes over time and space with geodiversity and landscape change, perhaps within a framework that considers critical perspectives, as well as dynamics and feedback among integrated geosystem, ecological, and social systems.

4.2. Benefits, Challenges, and Limitations

Conceptual and analytical standards for geodiversity research are still in development [18]. Although exploratory, this work is a step toward more focused and refined place-based geodiversity research. Our focus here is geodiversity in a mountainous region, but an overarching benefit of this approach is its adaptability. The approach affords the exploration of similar questions across an array of landscapes. Furthermore, the geosystems services framework [67], which was adapted to our spatial study, has additional capacity for assessing the role of globally relevant geosystem services at regional and local levels [16,82,83]. Notably, based on the survey results, respondents reported comprehension of the geosystems services markers to be moderately easy.
Concerning the spatial analysis and visualization capacities of the PPGIS, we additionally note the following benefits for supporting geodiversity-related research and mountain conservation efforts:
  • Widely applicable. The method we used is straightforward and can be replicated with similar, publicly available datasets for other areas; PPGIS methods are developed with open-source software making them widely accessible. Furthermore, we note that the geodiversity index has been used extensively as a framework for several studies with slight variations in the application [9,84,85]. One such variation includes applying a grid overlay system to calculate geodiversity within each grid cell. For our purposes here, we determined that individual weighting of variables allowed us to achieve greater customization of the model based on the landscape type (e.g., flat-lying vs. mountainous) [62]. However, the grid cell technique has been used successfully to compare areas of high geodiversity with concentrations of human activities, such as land degradation and urban growth [86].
  • Identify priority locations for mountain geoconservation and future research priorities. As an example, geodiversity includes aspects of the abiotic realm that are rare and vulnerable, as well as those that are stable or prolific [70]. PPGIS can empower the community through engagement, discourse, and conversation to bring geodiversity and geodiversity elements into conservation decisions. Knowledge about geosystem services and associated geodiversity can also provide foresight concerning the social and natural consequences of decisions affecting abiotic diversity. For example, similar methods could help to avert threats to geodiversity, including (but not limited to) unsustainable tourism, land development, or river and coastal engineering [1].
  • Uncover spatial nuances associated with geodiversity and a ‘sense of place’ that integrates culture within physical landscapes. The method we used is informed by a framework that creates knowledge about how globally important geosystem services, as provisioned by geodiversity, are perceived and valued on a local level. The spatial approach allows socio-geo-related nuances specific to geographic regions to be uncovered. For example, in this study, we noted informally that the placement of markers reflected locations referenced in the lyrics of traditional Appalachian string band, fiddle, and banjo musical stylings of Grayson County (e.g., [45]). Additionally, as reported in another study, the foraging of ramps (Allium tricoccum) as a seasonal famine food in niche microclimates and soil conditions of the Appalachian hillsides [87] reflects a locally significant human connection to abiotic diversity with implications for sustainability. This topic, or a similar one, could be explored more fully using a PPGIS.
  • Support holistic science and management of mountains via the ability to integrate several data types, thematic content, and spatial analyses. Like biodiversity, mountain geodiversity is pressured by climate change, tourism impacts, intensive land use practices, and extractive industries [12,88]. The ability to integrate several reference layers (e.g., land use and land cover (LULC), climate, and biodiversity) with qualitative geographic and non-geographic survey information, enables place-based exploration of complex spatial questions at the interface of human systems, the environment, and geosystems. PPGISs can thus aid spatial decision-making for land and ecosystem management with important geodiversity components. As an example, a PPGIS could aid in the development of a management plan for protecting globally rare plant communities that are restricted to specific rock types and maintained by geomorphic processes (such as the Southern Appalachian, high-elevation rock outcrop plant communities [89]) from the impacts of tourism and climate change. It could further aid in the articulation and integration of indigenous (or other cultural) perspectives into geodiversity and geoheritage research. Many examples that demonstrate the informal linkages between geodiversity and culture have expression within everyday life, for example, within mythologies, songs, and language [90]. PPGISs could be valuable for uncovering spatial nuances of these associations.
One drawback of the PPGIS method, not unique to this study, is the limited validation potential of both geodiversity layers and mapped geosystem services markers. Validation and verification challenges emerge from several interrelated factors, including GIS reference data availability and quality, scale mismatches of datasets, the technological aptitude and cartographic literacy of respondents [36], and a lack of a general understanding of geodiversity as a concept. Qualitative assessment of geodiversity services, for example, as determined by marker placement on a map, contains subjectivity that is neither comparable across location, nor compatible with the verification of results [91]. In this study, landscapes across the range of geodiversity classes exhibited wide variability (Figure 8), but variability was also observed among landscapes classified within the same geodiversity category. Furthermore, our study relied on survey respondents for basic map literacy; we could not verify that marker locations accurately represent their intended placement. Thus, in our study, we added a 50 m buffer around the points mapped to account for possible misplacement of points. As was implemented by Brown et al. [69], we suggest the inclusion of a short, written description (e.g., “peak of Mount Rogers” or “cliffs along New River”) for each mapped geosystem service marker to help contextualize marker placement. Other research has recommended ordinal questioning for assessing categorical rankings. For example, the placement of different size markers to represent the degree of valuation has been used in previous work on ecosystem services [26,92]. Interviews [93], or focus groups that permit elaboration and storytelling, would offer a superior, yet time-intensive, option. Social media data are an innovative and promising avenue for uncovering relationships between geodiversity and cultural ecosystem services [7] and could also be leveraged in a PPGIS for spatial geosystem service assessments.
The interpretation and quantitative estimation of geodiversity elements at varying spatial scales add additional complexity [94]. In mountain environments, geodiversity encapsulates very small individual elements (e.g., sediments) to very large elements such as glacial moraines or mountain ranges larger than the study area. Thus, available datasets for representing the gamut of geodiversity within a given area can be limited. The acquisition of available data at varying resolutions is challenging and creates a need for a scale-specific geodiversity classification framework to help determine what geodiversity elements should be modeled at different spatial scales with different data resolutions [95].
Confusion over spatial scale also applies to the perception of geosystem services. Mismatches can occur between the spatial scale at which geosystem services are perceived versus how they are measured or represented on an interactive map. Viewshed analysis, a GIS-based procedure for mapping the area that is visible from a given ground location shows promise for incorporation into a PPGIS and has been used to map cultural ecosystem services [96,97]. Such an analysis may be especially relevant for studies in prominent mountain landscapes where view quality is of importance [98]. Additionally, flexibility with the mapping interface, such as the ability to draw polygons to depict an area, could offer an alternative to point location mapping.
The output of quantitative geodiversity indices may also vary based on differences in expert knowledge. Validation of quantitative geodiversity measures is thus limited [18]. Although some research has reported progress (e.g., [52,99]), successful attempts tend to depend upon the availability of concrete validation data, such as pre-existing maps. In situ verification is an ideal approach [18]; however, this process remains subjective (in part due to within-class variability), time intensive, and expensive. Depending on the project goal, however, subjectivity could also represent an opportunity for the researcher to understand the nuances of lived experiences.
Finally, we acknowledge that the survey sample, although suitable for this study, was insufficient to be comprehensive or definitive. Seventy-five participants provided their email and indicated an interest in participating, but 30 participants completed the survey. Overall, this sample was highly educated, with 23/30 holding a bachelor’s degree or higher. The education levels that characterize our sample are comparable to those from other PPGIS surveys focusing on land and ecosystem value perception [69,76]. These studies have reported formal education levels related to the types of services mapped. For example, aesthetic values were commonly chosen among a highly educated sample in an ecosystem services survey [76]. Thus, there is the potential for skewed results when demographics among participants are similar. Future research should more closely examine the potential association between demographics and geosystem services markers.

5. Conclusions

Mountains are highly geodiverse landscapes with natural and cultural significance. The concepts of geodiversity and geosystem services are thus essential for conservation efforts in mountain regions, yet approaches that integrate both natural and human dimensions of mountain abiotic nature are still developing. Here, we explored the potential of public participation GIS (PPGIS) to assess potential relationships between geodiversity and geosystem services for Grayson County, VA, USA. Our objectives were to adapt a geodiversity index to model geodiversity for Grayson Country and subsequently used qualitative survey methods in a PPGIS. Finally, we visualized geodiversity–geosystem services hotspots to uncover potential relationships between geodiversity and geosystem services values. Quantitative geodiversity measures are often used to identify and prioritize priority areas for conservation, with an emphasis on identifying areas with high geodiversity. In this study, however, our results revealed that local respondents placed geosystem services markers most frequently at locations with low levels of geodiversity. The majority (55%) of these markers corresponded to low and very low quantitative geodiversity index scores. Geosystem services value markers were clustered around population centers and protected areas. Although quantitative geodiversity measures are often used to identify and prioritize areas for conservation, our results suggest that locations valued by respondents would have been missed using quantitative metrics alone. The benefits of incorporating a PPGIS methodology include: (1) promoting public participation for identifying how local people ascribe value to and benefit from geodiversity, and (2) spatial integration of geodiversity and geosystemic services values (in this case, in mountainous regions). Ultimately, we advocate for approaches that consider both the numerical variability of geodiversity across space and local valuation of abiotic diversity for integrated mountain conservation [2,18,100].

Author Contributions

Conceptualization: K.B.S., L.M.R. and L.W.C.; methodology: K.B.S. and L.W.C.; formal analysis, L.M.R., K.B.S. and L.W.C.; writing—original draft preparation, writing—review and editing, L.M.R., K.B.S. and L.W.C. All authors have read and agreed to the published version of the manuscript.

Funding

This research received no external funding.

Institutional Review Board Statement

The study was conducted in accordance with the Declaration of Helsinki, and approved by the Institutional Review Board of Virginia Tech (#21-220, 15 April 2021).

Informed Consent Statement

Informed consent was obtained from all subjects involved in the study.

Data Availability Statement

The survey data presented in this study are confidential, per IRB #21-220. Geodiversity GIS data are available upon request from the corresponding author.

Acknowledgments

Thanks to Tom Pingel (Virginia Tech), and Julie Libarkin (Michigan State University) for valuable insights into this work. The Virginia Tech, Department of Geography Poole Fund, supported this research.

Conflicts of Interest

The authors declare no conflict of interest.

Appendix A. Geosystem Services Survey

Please fill out the survey questionnaire to the best of your ability.
  • Age ___________
  • Gender _________
Male         Female         Other
3.
Ethnicity _________________
  • White
  • Hispanic or Latino
  • Black or African American
  • Native American or American Indian
  • Asian/Pacific Islander
  • Other ____________
4.
Level of Formal Education ______________
  • High School Diploma
  • Technical or 2-Year Degree
  • Some College
  • Bachelor’s Degree
  • Advanced Degree
5.
What County do you live in? ______________
6.
How long have you lived in that county? If you lived elsewhere, provide total years spent in the county across your lifetime ____________
Please indicate your level of understanding of each of the following concepts where 5 is Excellent Understanding and 1 is No Understanding.
7.
How familiar are you with the landscape of Grayson County, VA, USA?
1      2      3      4      5
None      Average       Excellent
Please indicate your experience of the survey process by rating the following concepts where 5 is Hard and 1 is Easy.
8.
PPGIS Survey ease of use
1      2      3      4      5
Easy       Hard      
9.
Comprehension of Geosystem Service Marker Definitions
1      2      3      4      5      
Easy       Hard      
10.
Challenge of identifying geosystems services
1      2      3      4      5
Easy       Hard      

References

  1. Gray, M. Geodiversity: Valuing and Conserving Abiotic Nature, 2nd ed.; Wiley-Blackwell: Hoboken, NJ, USA, 2013; ISBN 978-0-470-74215-0. [Google Scholar]
  2. Brilha, J.; Gray, M.; Pereira, D.I.; Pereira, P. Geodiversity: An Integrative Review as a Contribution to the Sustainable Management of the Whole of Nature. Environ. Sci. Policy 2018, 86, 19–28. [Google Scholar] [CrossRef] [Green Version]
  3. Grover, V. Introduction and road map for global changes on high mountains. In Impact of Global Changes on Mountains: Responses and Adaptation; Grover, V.I., Borsdorf, A., Breutse, J.H., Tiwari, P.C., Frangetto, F.W., Eds.; CRC Press: Boca Raton, FL, USA, 2014; pp. 15–32. ISBN 978-1-48-220890-0. [Google Scholar]
  4. Price, M.F.; Kohler, T. Sustainable mountain development. In Mountain Geography: Physical and Human Dimensions; Price, M.F., Byers, A.C., Friend, D.A., Kohler, T., Price, L.W., Eds.; University of California Press: Berkeley, CA, USA, 2013; pp. 333–366. ISBN 978-0-52-025431-2. [Google Scholar]
  5. Hjort, J.; Gordon, J.E.; Gray, M.; Hunter, M.L. Why Geodiversity Matters in Valuing Nature’s Stage: Why Geodiversity Matters. Conserv. Biol. 2015, 29, 630–639. [Google Scholar] [CrossRef] [PubMed]
  6. Ren, Y.; Lü, Y.; Hu, J.; Yin, L. Geodiversity Underpins Biodiversity but the Relations Can Be Complex: Implications from Two Biodiversity Proxies. Glob. Ecol. Conserv. 2021, 31, e01830. [Google Scholar] [CrossRef]
  7. Fox, N.; Graham, L.J.; Eigenbrod, F.; Bullock, J.M.; Parks, K.E. Geodiversity Supports Cultural Ecosystem Services: An Assessment Using Social Media. Geoheritage 2022, 14, 27. [Google Scholar] [CrossRef]
  8. Jonasson, C.; Gordon, J.E.; Kociánová, M.; Josefsson, M.; Dvŏrák, I.J.; Thompson, D.B.A. Links between geodiversity and biodiversity in European mountains: Case studies from Sweden, Scotland and the Czech Republic. In Mountains of Northern Europe: Conservation, Management, People and Nature; Thompson, D.B.A., Price, M.F., Galbraith, C.A., Eds.; The Stationery Office: Edinburgh, UK, 2005; pp. 55–70. [Google Scholar]
  9. Pereira, D.I.; Pereira, P.; Brilha, J.; Santos, L. Geodiversity Assessment of Paraná State (Brazil): An Innovative Approach. Environ. Manag. 2013, 52, 541–552. [Google Scholar] [CrossRef] [PubMed] [Green Version]
  10. Muellner-Riehl, A.N.; Schnitzler, J.; Kissling, W.D.; Mosbrugger, V.; Rijsdijk, K.F.; Seijmonsbergen, A.C.; Versteegh, H.; Favre, A. Origins of Global Mountain Plant Biodiversity: Testing the ‘Mountain-geobiodiversity Hypothesis. J. Biogeogr. 2019, 46, 2826–2838. [Google Scholar] [CrossRef] [Green Version]
  11. Gray, M. Geodiversity: The Origin and Evolution of a Paradigm. Geol. Soc. Lond. Spec. Publ. 2008, 300, 31–36. [Google Scholar] [CrossRef]
  12. Gordon, J.E. Mountain geodiversity: Characteristics, values and climate change. In Mountains, Climate and Biodiversity; John Wiley & Sons: Hoboken, NJ, USA, 2018; pp. 137–154. [Google Scholar]
  13. Verschuuren, B.; Mallarach, J.-M.; Bernbaum, E.; Spoon, J.; Brown, S.; Borde, R.; Brown, J.; Calamia, M.; Mitchell, N.; Infield, M.; et al. Cultural and Spiritual Significance of Nature: Guidance for Protected and Conserved Area Governance and Management; IUCN, International Union for Conservation of Nature: Gland, Switzerland, 2021; ISBN 978-2-8317-2089-0. [Google Scholar]
  14. Bernbaum, E. Sacred mountains: Themes and teachings. Mt. Res. Dev. 2006, 26, 304–309. [Google Scholar] [CrossRef]
  15. Chrobak, A.; Novotný, J.; Struś, P. Geodiversity Assessment as a First Step in Designating Areas of Geotourism Potential. Case Study: Western Carpathians. Front. Earth Sci. 2021, 9, 752669. [Google Scholar] [CrossRef]
  16. Schrodt, F.; Bailey, J.J.; Kissling, W.D.; Rijsdijk, K.F.; Seijmonsbergen, A.C.; van Ree, D.; Hjort, J.; Lawley, R.S.; Williams, C.N.; Anderson, M.G.; et al. To Advance Sustainable Stewardship, We Must Document Not Only Biodiversity but Geodiversity. Proc. Natl. Acad. Sci. USA 2019, 116, 16155–16158. [Google Scholar] [CrossRef] [Green Version]
  17. Browne, M.A.E. Geodiversity and the Role of the Planning System in Scotland. Scott. Geogr. J. 2012, 128, 266–277. [Google Scholar] [CrossRef]
  18. Zwoliński, Z.; Najwer, A.; Giardino, M. Methods for Assessing Geodiversity. In Geoheritage; Elsevier: Amsterdam, The Netherlands, 2018; pp. 27–52. ISBN 978-0-12-809531-7. [Google Scholar]
  19. Santos, D.S.; Mansur, K.L.; Gonçalves, J.B.; Arruda, E.R.; Manosso, F.C. Quantitative Assessment of Geodiversity and Urban Growth Impacts in Armação Dos Búzios, Rio de Janeiro, Brazil. Appl. Geogr. 2017, 85, 184–195. [Google Scholar] [CrossRef]
  20. Knudson, C.; Kay, K.; Fisher, S. Appraising Geodiversity and Cultural Diversity Approaches to Building Resilience through Conservation. Nat. Clim. Chang. 2018, 8, 678–685. [Google Scholar] [CrossRef]
  21. Gonçalves, J.; Mansur, K.; Santos, D.; Henriques, R.; Pereira, P. Is It Worth Assessing Geodiversity Numerically? A Comparative Analysis between Quantitative and Qualitative Approaches in Miguel Pereira Municipality, Rio de Janeiro, Brazil. Geosciences 2022, 12, 347. [Google Scholar] [CrossRef]
  22. Gordon, J.E. Rediscovering a Sense of Wonder: Geoheritage, Geotourism and Cultural Landscape Experiences. Geoheritage 2012, 4, 65–77. [Google Scholar] [CrossRef]
  23. Gray, M. Geodiversity. In Geoheritage; Elsevier: Amsterdam, The Netherlands, 2018; pp. 13–25. ISBN 978-0-12-809531-7. [Google Scholar]
  24. Jankowski, P.; Najwer, A.; Zwoliński, Z.; Niesterowicz, J. Geodiversity assessment with crowdsourced data and spatial multicriteria analysis. ISPRS Int. J. Geo-Inf. 2020, 9, 716. [Google Scholar] [CrossRef]
  25. Williams, D.R.; Patterson, M.E.; Roggenbuck, J.W.; Watson, A.E. Beyond the Commodity Metaphor: Examining Emotional and Symbolic Attachment to Place. Leis. Sci. 1992, 14, 29–46. [Google Scholar] [CrossRef]
  26. Brown, G. Mapping Spatial Attributes in Survey Research for Natural Resource Management: Methods and Applications. Soc. Nat. Resour. 2004, 18, 17–39. [Google Scholar] [CrossRef]
  27. Sherrouse, B.C.; Clement, J.M.; Semmens, D.J. A GIS Application for Assessing, Mapping, and Quantifying the Social Values of Ecosystem Services. Appl. Geogr. 2011, 31, 748–760. [Google Scholar] [CrossRef]
  28. Brown, G.; Brabyn, L. An Analysis of the Relationships between Multiple Values and Physical Landscapes at a Regional Scale Using Public Participation GIS and Landscape Character Classification. Landsc. Urban Plan. 2012, 107, 317–331. [Google Scholar] [CrossRef]
  29. Fagerholm, N.; Käyhkö, N.; Ndumbaro, F.; Khamis, M. Community Stakeholders’ Knowledge in Landscape Assessments—Mapping Indicators for Landscape Services. Ecol. Indic. 2012, 18, 421–433. [Google Scholar] [CrossRef]
  30. Fagerholm, N.; Torralba, M.; Moreno, G.; Girardello, M.; Herzog, F.; Aviron, S.; Burgess, P.; Crous-Duran, J.; Ferreiro-Domínguez, N.; Graves, A.; et al. Cross-Site Analysis of Perceived Ecosystem Service Benefits in Multifunctional Landscapes. Glob. Environ. Chang. 2019, 56, 134–147. [Google Scholar] [CrossRef] [Green Version]
  31. van Riper, C.J.; Kyle, G.T.; Sutton, S.G.; Barnes, M.; Sherrouse, B.C. Mapping Outdoor Recreationists’ Perceived Social Values for Ecosystem Services at Hinchinbrook Island National Park, Australia. Appl. Geogr. 2012, 35, 164–173. [Google Scholar] [CrossRef]
  32. Tuan, Y.-F. Space and Place: The Perspective of Experience; U of Minnesota Press: Minneapolis, MN, USA, 1977; ISBN 978-1-4529-0553-2. [Google Scholar]
  33. Relph, E. Place and Placelessness; Pion: London, UK, 1976; ISBN 0850860555. [Google Scholar]
  34. Stedman, R.C. Subjectivity and Social-Ecological Systems: A Rigidity Trap (and Sense of Place as a Way Out). Sustain. Sci. 2016, 11, 891–901. [Google Scholar] [CrossRef]
  35. Tulloch, D. Public participation GIS (PPGIS). Encycl. Geogr. Inf. Sci. 2008, 1, 352–355. [Google Scholar]
  36. Brown, G.; Kyttä, M. Key Issues and Research Priorities for Public Participation GIS (PPGIS): A Synthesis Based on Empirical Research. Appl. Geogr. 2014, 46, 122–136. [Google Scholar] [CrossRef]
  37. Fagerholm, N.; Raymond, C.M.; Olafsson, A.S.; Brown, G.; Rinne, T.; Hasanzadeh, K.; Broberg, A.; Kyttä, M. A Methodological Framework for Analysis of Participatory Mapping Data in Research, Planning, and Management. Int. J. Geogr. Inf. Sci. 2021, 35, 1848–1875. [Google Scholar] [CrossRef]
  38. Gray, M. Valuing Geodiversity in an ‘Ecosystem Services’ Context. Scott. Geogr. J. 2012, 128, 177–194. [Google Scholar] [CrossRef]
  39. Reynard, E.; Giusti, C. The Landscape and the Cultural Value of Geoheritage. In Geoheritage; Elsevier: Amsterdam, The Netherlands, 2018; pp. 147–166. ISBN 978-0-12-809531-7. [Google Scholar]
  40. Geologic Units in Grayson County, Virginia. Available online: https://mrdata.usgs.gov/geology/state/fips-unit.php?code=f51077 (accessed on 28 November 2020).
  41. New River. Available online: https://dwr.virginia.gov/waterbody/new-river/ (accessed on 12 December 2021).
  42. Soil Survey Staff, Natural Resources Conservation Service, United States Department of Agriculture. Web Soil Survey. Available online: https://catalog.data.gov/dataset/soil-survey-geographic-ssurgo-database-for-grayson-county-virginia1 (accessed on 22 December 2020).
  43. Grayson County, Virginia—Census Bureau Profile. Available online: https://data.census.gov/profile?g=0500000US51077 (accessed on 2 December 2020).
  44. Conservation Lands Database. Available online: https://www.dcr.virginia.gov/natural-heritage/clinfo#his (accessed on 22 March 2021).
  45. Beckworth, J. Always Been a Rambler: G.B. Grayson and Henry Whitter, Country Music Pioneers of Southern Appalachia; McFarland: Jefferson, NC, USA, 2018; ISBN 978-1-4766-3186-8. [Google Scholar]
  46. Donleavy, K. Strings of Life: Conversations with Old-Time Musicians from Virginia and North Carolina; Pocahontas Press: Dublin, VA, USA, 2004; ISBN 978-0-936015-49-1. [Google Scholar]
  47. Titon, J.T. Old-Time Kentucky Fiddle Tunes; University Press of Kentucky: Lexington, KY, USA, 2001; ISBN 978-0-8131-2200-7. [Google Scholar]
  48. Worsham, G. A Survey of Historic Architecture in Grayson County, Virginia Including the Towns of Independence and Fries; Va Dept of Historic Resources: Richmond, VA, USA, 2002. [Google Scholar]
  49. NPS Annual Park Ranking Report for Recreation Visits in 2021. Available online: https://irma.nps.gov/Stats/SSRSReports/National%20Reports/Annual%20Park%20Ranking%20Report%20(1979%20-%20Last%20Calendar%20Year) (accessed on 3 October 2022).
  50. Kori, E.; Onyango Odhiambo, B.D.; Chikoore, H. A Geomorphodiversity Map of the Soutpansberg Range, South Africa. Landf. Anal. 2019, 38, 13–24. [Google Scholar] [CrossRef]
  51. Jenks, G.F. The Data Model Concept in Statistical Mapping. Int. Yearb. Cartogr. 1967, 7, 186–190. [Google Scholar]
  52. Melelli, L.; Vergari, F.; Liucci, L.; Del Monte, M. Geomorphodiversity Index: Quantifying the Diversity of Landforms and Physical Landscape. Sci. Total Environ. 2017, 584–585, 701–714. [Google Scholar] [CrossRef]
  53. Preliminary Integrated Geologic Map Databases of the United States: Delaware, Maryland, New York, Pennsylvania, and Virginia (OFR 2005-1325). Available online: https://pubs.usgs.gov/of/2005/1325/#VA (accessed on 3 December 2021).
  54. Chesterman, C.W. National Audubon Society Field Guide to Rocks and Minerals: North America; Knopf Doubleday Publishing Group: New York, NY, USA, 1978; ISBN 978-0-394-50269-4. [Google Scholar]
  55. Conrad, O.; Bechtel, B.; Bock, M.; Dietrich, H.; Fischer, E.; Gerlitz, L.; Wehberg, J.; Wichmann, V.; Böhner, J. System for Automated Geoscientific Analyses (SAGA) v. 2.1.4. Geosci. Model Dev. Discuss. 2015, 8, 2271–2312. [Google Scholar] [CrossRef] [Green Version]
  56. U.S. Geological Survey. 20220512, USGS 1/3 Arc Second n37w082 20220512: U.S. Geological Survey. Available online: https://www.sciencebase.gov/catalog/item/627f3792d34e3bef0c9a3191 (accessed on 28 November 2021).
  57. Zwoliński, Z. The Routine of Landform Geodiversity Map Design for the Polish Carpathian Mts. Landf. Anal. 2009, 11, 77–85. [Google Scholar]
  58. Manosso, F.C.; de Nóbrega, M.T. Calculation of Geodiversity from Landscape Units of the Cadeado Range Region in Paraná, Brazil. Geoheritage 2016, 8, 189–199. [Google Scholar] [CrossRef]
  59. Jenness, J. Topographic Position Index (tpi_jen.avx) Extension for ArcView 3.x, v. 1.3a. Jenness Enterprises. 2006. Available online: http://www.jennessent.com/arcview/tpi.htm (accessed on 22 December 2020).
  60. Riley, S.; Degloria, S.; Elliot, S.D. A Terrain Ruggedness Index That Quantifies Topographic Heterogeneity. Int. J. Sci. 1999, 5, 23–27. [Google Scholar]
  61. Bouyoucos, G.J. The Clay Ratio as a Criterion of Susceptibility of Soils to Erosion. Agron. J. 1935, 27, 738–741. [Google Scholar] [CrossRef] [Green Version]
  62. Wischmeier, W.H.; Smith, D.D. Predicting Rainfall Erosion Losses: A Guide to Conservation Planning; Department of Agriculture, Science and Education Administration: Washington, DC, USA, 1978. [Google Scholar]
  63. Karydas, C.; Petriolis, M.; Manakos, I. Evaluating Alternative Methods of Soil Erodibility Mapping in the Mediterranean Island of Crete. Agriculture 2013, 3, 362–380. [Google Scholar] [CrossRef] [Green Version]
  64. USGS 3D Elevation Program Digital Elevation Service. Available online: https://hydro.nationalmap.gov/arcgis/rest/services/nhd/MapServer (accessed on 2 December 2021).
  65. Najwer, A.; Borysiak, J.; Gudowicz, J.; Mazurek, M.; Zwoliński, Z. Geodiversity and Biodiversity of the Postglacial Landscape (Dębnica River Catchment, Poland). Quaest. Geogr. 2016, 35, 5–28. [Google Scholar] [CrossRef] [Green Version]
  66. Hall, K.; Hall, A. Thermal Gradients and Rock Weathering at Low Temperatures: Some Simulation Data. Permafr. Periglac. Process. 1991, 2, 103–112. [Google Scholar] [CrossRef]
  67. Gray, M. Geodiversity, Geoheritage and Geoconservation for Society. Int. J. Geoheritage Park. 2019, 7, 226–236. [Google Scholar] [CrossRef]
  68. Schumm, S.A. To Interpret the Earth: Ten Ways to Be Wrong; Cambridge University Press: Cambridge, UK, 1998; ISBN 978-0-521-64602-4. [Google Scholar]
  69. Brown, G.; Montag, J.M.; Lyon, K. Public Participation GIS: A Method for Identifying Ecosystem Services. Soc. Nat. Resour. 2012, 25, 633–651. [Google Scholar] [CrossRef]
  70. Gray, M. Other Nature: Geodiversity and Geosystem Services. Environ. Conserv. 2011, 38, 271–274. [Google Scholar] [CrossRef] [Green Version]
  71. de Groot, R.S.; Alkemade, R.; Braat, L.; Hein, L.; Willemen, L. Challenges in Integrating the Concept of Ecosystem Services and Values in Landscape Planning, Management and Decision Making. Ecol. Complex. 2010, 7, 260–272. [Google Scholar] [CrossRef]
  72. Brown, G.; Fagerholm, N. Empirical PPGIS/PGIS Mapping of Ecosystem Services: A Review and Evaluation. Ecosyst. Serv. 2015, 13, 119–133. [Google Scholar] [CrossRef]
  73. Alessa, L.N.; Kliskey, A.A.; Brown, G. Social–Ecological Hotspots Mapping: A Spatial Approach for Identifying Coupled Social–Ecological Space. Landsc. Urban Plan. 2008, 85, 27–39. [Google Scholar] [CrossRef]
  74. Grayson Highlands State Park. Available online: https://www.dcr.virginia.gov/state-parks/grayson-highlands#general_information (accessed on 5 December 2022).
  75. Raymond, C.M.; Gottwald, S.; Kuoppa, J.; Kyttä, M. Integrating Multiple Elements of Environmental Justice into Urban Blue Space Planning Using Public Participation Geographic Information Systems. Landsc. Urban Plan. 2016, 153, 198–208. [Google Scholar] [CrossRef]
  76. Brown, G.; Reed, P. Public Participation GIS: A New Method for Use in National Forest Planning. For. Sci. 2009, 55, 166–182. [Google Scholar]
  77. Brown, G.; Weber, D. A Place-Based Approach to Conservation Management Using Public Participation GIS (PPGIS). J. Environ. Plan. Manag. 2013, 56, 455–473. [Google Scholar] [CrossRef] [Green Version]
  78. Brown, G.; Reed, P.; Raymond, C.M. Mapping Place Values: 10 Lessons from Two Decades of Public Participation GIS Empirical Research. Appl. Geogr. 2020, 116, 102156. [Google Scholar] [CrossRef]
  79. Hannon, B. Sense of Place: Geographic Discounting by People, Animals and Plants. Ecol. Econ. 1994, 10, 157–174. [Google Scholar] [CrossRef]
  80. Mazurczyk, T.J.; Murtha, T.M.; Goldberg, L.K.; Orland, B. Integrating Visual and Cultural Resource Evaluation and Impact Assessment for Landscape Conservation Design and Planning. In Visual Resource Stewardship Conference Proceedings: Landscape and Seascape Management in a Time of Change. Gen. Tech. Rep. NRS-P-183; Gobster, P.H., Smardon, R.C., Eds.; Department of Agriculture, Forest Service, Northern Research Station: Newtown Square, PA, USA, 2018; pp. 149–160. [Google Scholar]
  81. Norton, B.G.; Hannon, B. Environmental Values: A Place-Based Approach. Environ. Ethics 1997, 19, 227–245. [Google Scholar] [CrossRef]
  82. Perotti, L.; Carraro, G.; Giardino, M.; De Luca, D.A.; Lasagna, M. Geodiversity Evaluation and Water Resources in the Sesia Val Grande UNESCO Geopark (Italy). Water 2019, 11, 2102. [Google Scholar] [CrossRef] [Green Version]
  83. Tognetto, F.; Perotti, L.; Viani, C.; Colombo, N.; Giardino, M. Geomorphology and Geosystem Services of the Indren-Cimalegna Area (Monte Rosa Massif—Western Italian Alps). J. Maps 2021, 17, 161–172. [Google Scholar] [CrossRef]
  84. Serrano, E.; Ruiz-Flaño, P. Geodiversity: A theoretical and applied concept. Geogr. Helv. 2007, 62, 140–147. [Google Scholar] [CrossRef]
  85. Silva, J.P.; Rodrigues, C.; Pereira, D.I. Mapping and Analysis of Geodiversity Indices in the Xingu River Basin, Amazonia, Brazil. Geoheritage 2015, 7, 337–350. [Google Scholar] [CrossRef] [Green Version]
  86. Bétard, F.; Peulvast, J.-P. Geodiversity Hotspots: Concept, Method and Cartographic Application for Geoconservation Purposes at a Regional Scale. Environ. Manag. 2019, 63, 822–834. [Google Scholar] [CrossRef]
  87. Rivers, B.; Oliver, R.; Resler, L. Pungent Provisions: The Ramp and Appalachian Identity. Mater. Cult. 2014, 46, 1–24. [Google Scholar]
  88. Chakraborty, A. Mountains as Vulnerable Places: A Global Synthesis of Changing Mountain Systems in the Anthropocene. GeoJournal 2021, 86, 585–604. [Google Scholar] [CrossRef]
  89. Wiser, S.K.; Peet, R.K.; White, P.S. High-Elevation Rock Outcrop Vegetation of the Southern Appalachian Mountains. J. Veg. Sci. 1996, 7, 703–722. [Google Scholar] [CrossRef] [Green Version]
  90. Kubalíková, L.; Coratza, P. Reflections of Geodiversity—Culture Relationships within the Concept of Abiotic Ecosystem Services. Geol. Soc. Lond. Spec. Publ. 2023, 530, SP530-2022-2155. [Google Scholar] [CrossRef]
  91. Brilha, J. Geoheritage. In Geoheritage; Elsevier: Amsterdam, The Netherlands, 2018; pp. 69–85. ISBN 978-0-12-809531-7. [Google Scholar]
  92. Brown, G.; Raymond, C. The Relationship between Place Attachment and Landscape Values: Toward Mapping Place Attachment. Appl. Geogr. 2007, 27, 89–111. [Google Scholar] [CrossRef]
  93. Raymond, C.M.; Bryan, B.A.; MacDonald, D.H.; Cast, A.; Strathearn, S.; Grandgirard, A.; Kalivas, T. Mapping Community Values for Natural Capital and Ecosystem Services. Ecol. Econ. 2009, 68, 1301–1315. [Google Scholar] [CrossRef]
  94. Hjort, J.; Luoto, M. Geodiversity of High-Latitude Landscapes in Northern Finland. Geomorphology 2010, 115, 109–116. [Google Scholar] [CrossRef]
  95. Ibáñez, J.-J.; Brevik, E.C. Divergence in Natural Diversity Studies: The Need to Standardize Methods and Goals. CATENA 2019, 182, 104110. [Google Scholar] [CrossRef]
  96. Garcia-Martin, M.; Fagerholm, N.; Bieling, C.; Gounaridis, D.; Kizos, T.; Printsmann, A.; Müller, M.; Lieskovský, J.; Plieninger, T. Participatory Mapping of Landscape Values in a Pan-European Perspective. Landsc. Ecol. 2017, 32, 2133–2150. [Google Scholar] [CrossRef]
  97. Ridding, L.E.; Redhead, J.W.; Oliver, T.H.; Schmucki, R.; McGinlay, J.; Graves, A.R.; Morris, J.; Bradbury, R.B.; King, H.; Bullock, J.M. The Importance of Landscape Characteristics for the Delivery of Cultural Ecosystem Services. J. Environ. Manag. 2018, 206, 1145–1154. [Google Scholar] [CrossRef] [Green Version]
  98. Germino, M.J.; Reiners, W.A.; Blasko, B.J.; McLeod, D.; Bastian, C.T. Estimating Visual Properties of Rocky Mountain Landscapes Using GIS. Landsc. Urban Plan. 2001, 53, 71–83. [Google Scholar] [CrossRef]
  99. Forte, J.P.; Brilha, J.; Pereira, D.I.; Nolasco, M. Kernel Density Applied to the Quantitative Assessment of Geodiversity. Geoheritage 2018, 10, 205–217. [Google Scholar] [CrossRef] [Green Version]
  100. Brilha, J. Inventory and Quantitative Assessment of Geosites and Geodiversity Sites: A Review. Geoheritage 2016, 8, 119–134. [Google Scholar] [CrossRef] [Green Version]
Figure 1. Grayson County, Virginia, U.S.A. Landmarks and designated public land. Wilderness Area is managed by the U.S. Department of Agriculture, Forest Service. The Blue Ridge Parkway is a scenic byway managed by the U.S. National Park Service.
Land 12 00835 g001
Figure 2. Flow chart depicting major steps of the methodology.
Land 12 00835 g002
Figure 3. Example of the online PPGIS interface provided to survey respondents.
Land 12 00835 g003
Figure 4. Nine geologic and geomorphological factors (A) were integrated into the final geodiversity map for Grayson County, Virginia (B). The final geodiversity raster map had geodiversity ranging from 85.6 to 480.4, which were grouped into five classes: very low (85.60–224.94), low (224.95–265.19), medium (265.20–305.44), high (305.45–359.63), and very high (359.64–480.40) using natural breaks [51].
Land 12 00835 g004
Figure 5. Stacked column graph depicting the proportion of each geodiversity category (very low to very high) contributing to the total response rate for individual geosystem services categories. The number of responses for each geosystem services category is listed in Table 4.
Land 12 00835 g005
Figure 6. (A) Kernel density map of the geosystem services markers based on individual point marker locations. 1. Hotspot situated around Grayson Highlands State Park; 2. Hotspot centered around the town of Fries; 3. Hotspot near Blue Ridge Music Center on the Blue Ridge Parkway. (B) Individual point locations for each geosystem service, by category.
Land 12 00835 g006
Figure 7. Geodiversity–geosystem services value hotspot map visualizes areas with high clusters of geosystem services marker and areas characterized by high quantitative geodiversity. Numbers refer to major landmarks.
Land 12 00835 g007
Figure 8. Landscape examples within Grayson County across the range of geodiversity classes. (A)—Very Low (1), Land around Independence 1908 Courthouse; (B)—Low (2), Open field in the foreground along Saddle Ridge Road; (C)—Medium (3) Hilly farm field; (D)—High (4) Waterfall along Fox Creek; (E)—Very High (5), The peak on top of Point Lookout Mountain.
Land 12 00835 g008
Table 1. Values of the ten factors used in the geodiversity index.
Geodiversity Category and ScoreSlope PositionRuggednessLandform TaxaLocal Relief (m)Geological DiversitySoil Erodibility (K-Factor)Insolation (kW/m2)TWIHydrography (m/km2)
Very Low (1)Flat Slope0–2.98Plains0–9.01Ultramafic rock variety0.06–0.220.74–1.972.86–6.150–0.53
Low (2)Middle Slope2.99–5.03Valley9.01–16.00Conglomerate variety0.22–0.281.97–3.566.15–8.080.53–1.33
Medium (3)Upper/Lower Slope5.04–7.26Open/Upper Slopes, Mid-slope/Upper Drain16.01–23.00Sandstone0.28–0.343.56–5.048.08–11.051.33–1.53
High (4)Valley7.27–10.25Local/Mid-slope Ridges23.01–32.00Amphibolite, greenstone, meta-argillite, mica schist, quartz monzonite, rhyolite,
sedimentary breccia
0.34–0.435.04–6.6611.05–15.461.53–1.66
Very High (5)Ridge10.26–47.53High Ridges32.01–91.00Augen gneiss, biotite gneiss, felsic volcanic rock, granite0.44–0.526.66–8.4915.46–23.331.66–1.86
Table 2. Geosystem services marker definitions.
Geosystem Service (GS) CategoryGSGS BenefitsOperational Definition
CulturalAestheticAppreciation of landscape or landmarkI appreciate the scenery or landmark.
Geotourism and leisureProvides recreation opportunityI find this location useful to participate in outdoor sports, walking, hiking, biking, dog walking, rock climbing, etc.
Spiritual, historic, and cultural AssociationsSignificant area that represents spirituality, local culture, heritage, or history.This location plays a significant role in my spirituality, local culture, heritage, and/or history.
Artistic inspirationProvides materials or inspiration for art/music.I find this place useful for my creativity (drawing, music, writing, and woodworking).
SocialSignificance to social interactions.I find this location to be beneficial to social groups that I am a part of because of its terrain or non-living benefits.
ProvisioningFood and drinkUseful for subsidenceI collect/harvest non-living food or drink from this location. (e.g., freshwater and mineral water).
Energy productsSignifies important areas for abiotic energy resourcesThis location is important for my energy needs (e.g., coal, gas, oil, hydroelectric, and wind power).
Ornamental/construction products I utilize the non-living materials in this location (e.g., gemstones, metals, stone, and brick).
KnowledgeImportant geological landmarksSignifies important geological landmarks/area.I find this location of geologic importance.
Educational areasSignifies influential areas to educational/local knowledge about the Earth.This area is influential to what I have learned about the Earth or can teach people about the Earth.
Table 3. Area of Grayson County, VA, USA, represented by geodiversity index categories and scores.
ScoreCategoryArea (km2)Area (%)
1Very Low273.8114.94
2Low526.5728.73
3Medium529.8328.91
4High362.2719.77
5Very High140.197.65
Table 4. Frequencies and percentages of mapped geosystem services (GS) marker categories associated with geodiversity index score categories.
Very Low (1)(%)Low (2)(%)Medium (3)(%)High (4)(%)Very High (5)(%)Total Mapped Attributes
Aesthetic2121.003030.001919.001616.001414.00100
Artistic inspiration2028.571927.141521.431217.1445.7170
Educational areas1020.001428.001632.00714.0036.0050
Geotourism and leisure725.931140.74622.2227.4113.7027
Social314.29838.10733.3329.5214.7621
Spiritual, historic, and cultural942.86523.81419.05314.2900.0021
Important geological landmarks212.50531.25531.25425.0000.0016
Food and drink00.0000.005100.0000.0000.005
Ornamental/construction products00.0000.00375.0000.00125.004
Energy products125.00125.00250.0000.0000.004
Total mapped attributes7322.969329.258225.794614.47247.55318
Disclaimer/Publisher’s Note: The statements, opinions and data contained in all publications are solely those of the individual author(s) and contributor(s) and not of MDPI and/or the editor(s). MDPI and/or the editor(s) disclaim responsibility for any injury to people or property resulting from any ideas, methods, instructions or products referred to in the content.

