
Assessing and Comparing the Visual Comfort of Streets across Four Chinese Megacities Using AI-Based Image Analysis and the Perceptive Evaluation Method

Abstract
:1. Introduction
1.1. People Perceive Comfort in Streets
1.2. The Evaluation of Street Comfort
1.3. The Aim of This Study
- (1)
- To construct a relation between subjective comfort perceptions and street indicators at the street scale and use it to assess and compare street visual comfort in four Chinese case study cities.
- (2)
- To visualize and analyze the spatial distribution of street visual comfort and of related street indicators and compare within and across cities based on geographical and functional attributes.
- (3)
- To develop design instructions to enhance street visual comfort for the four cities.
2. Materials and Methods
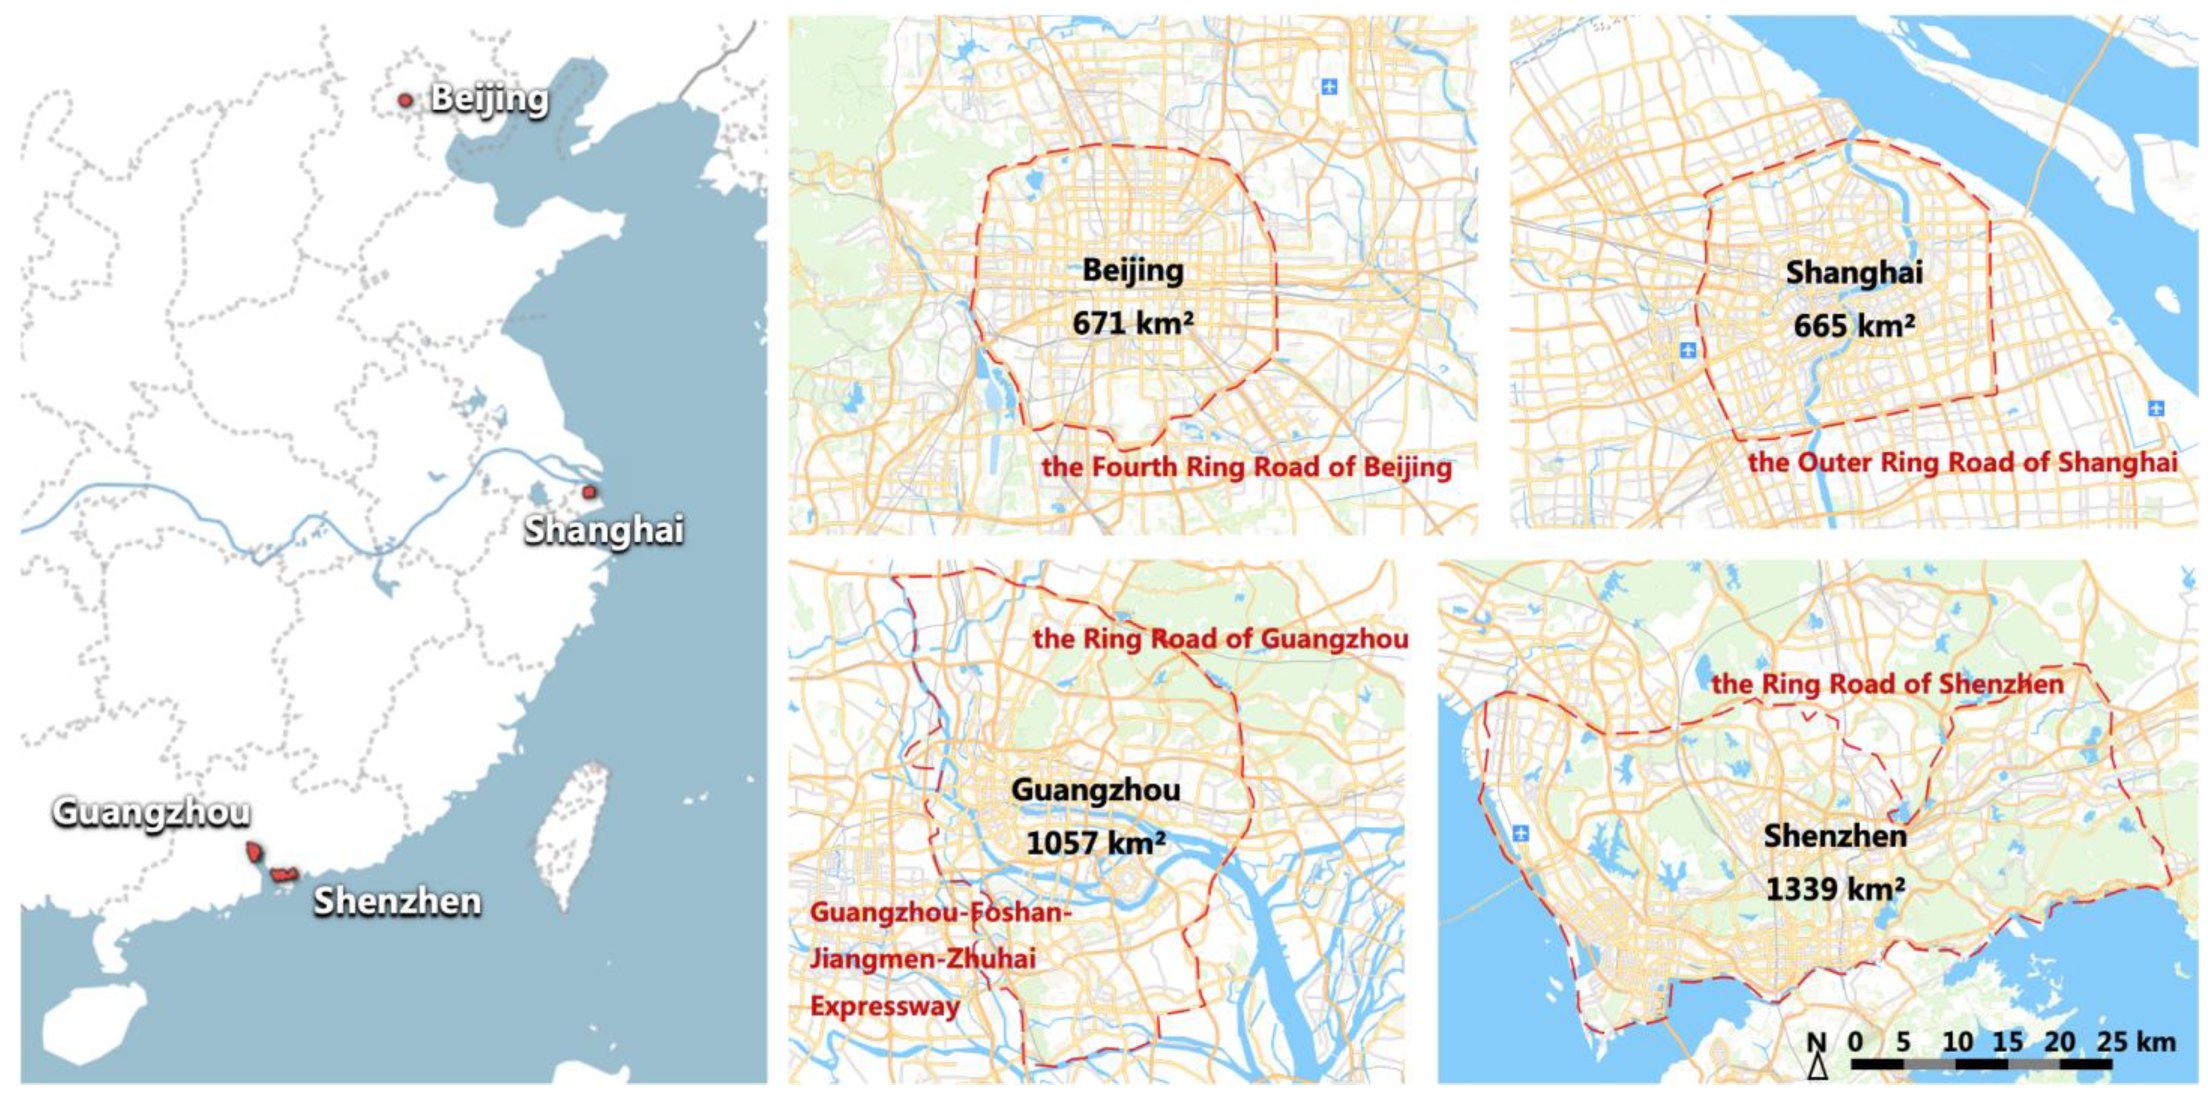
2.1. Study Sites
2.2. Data Sources
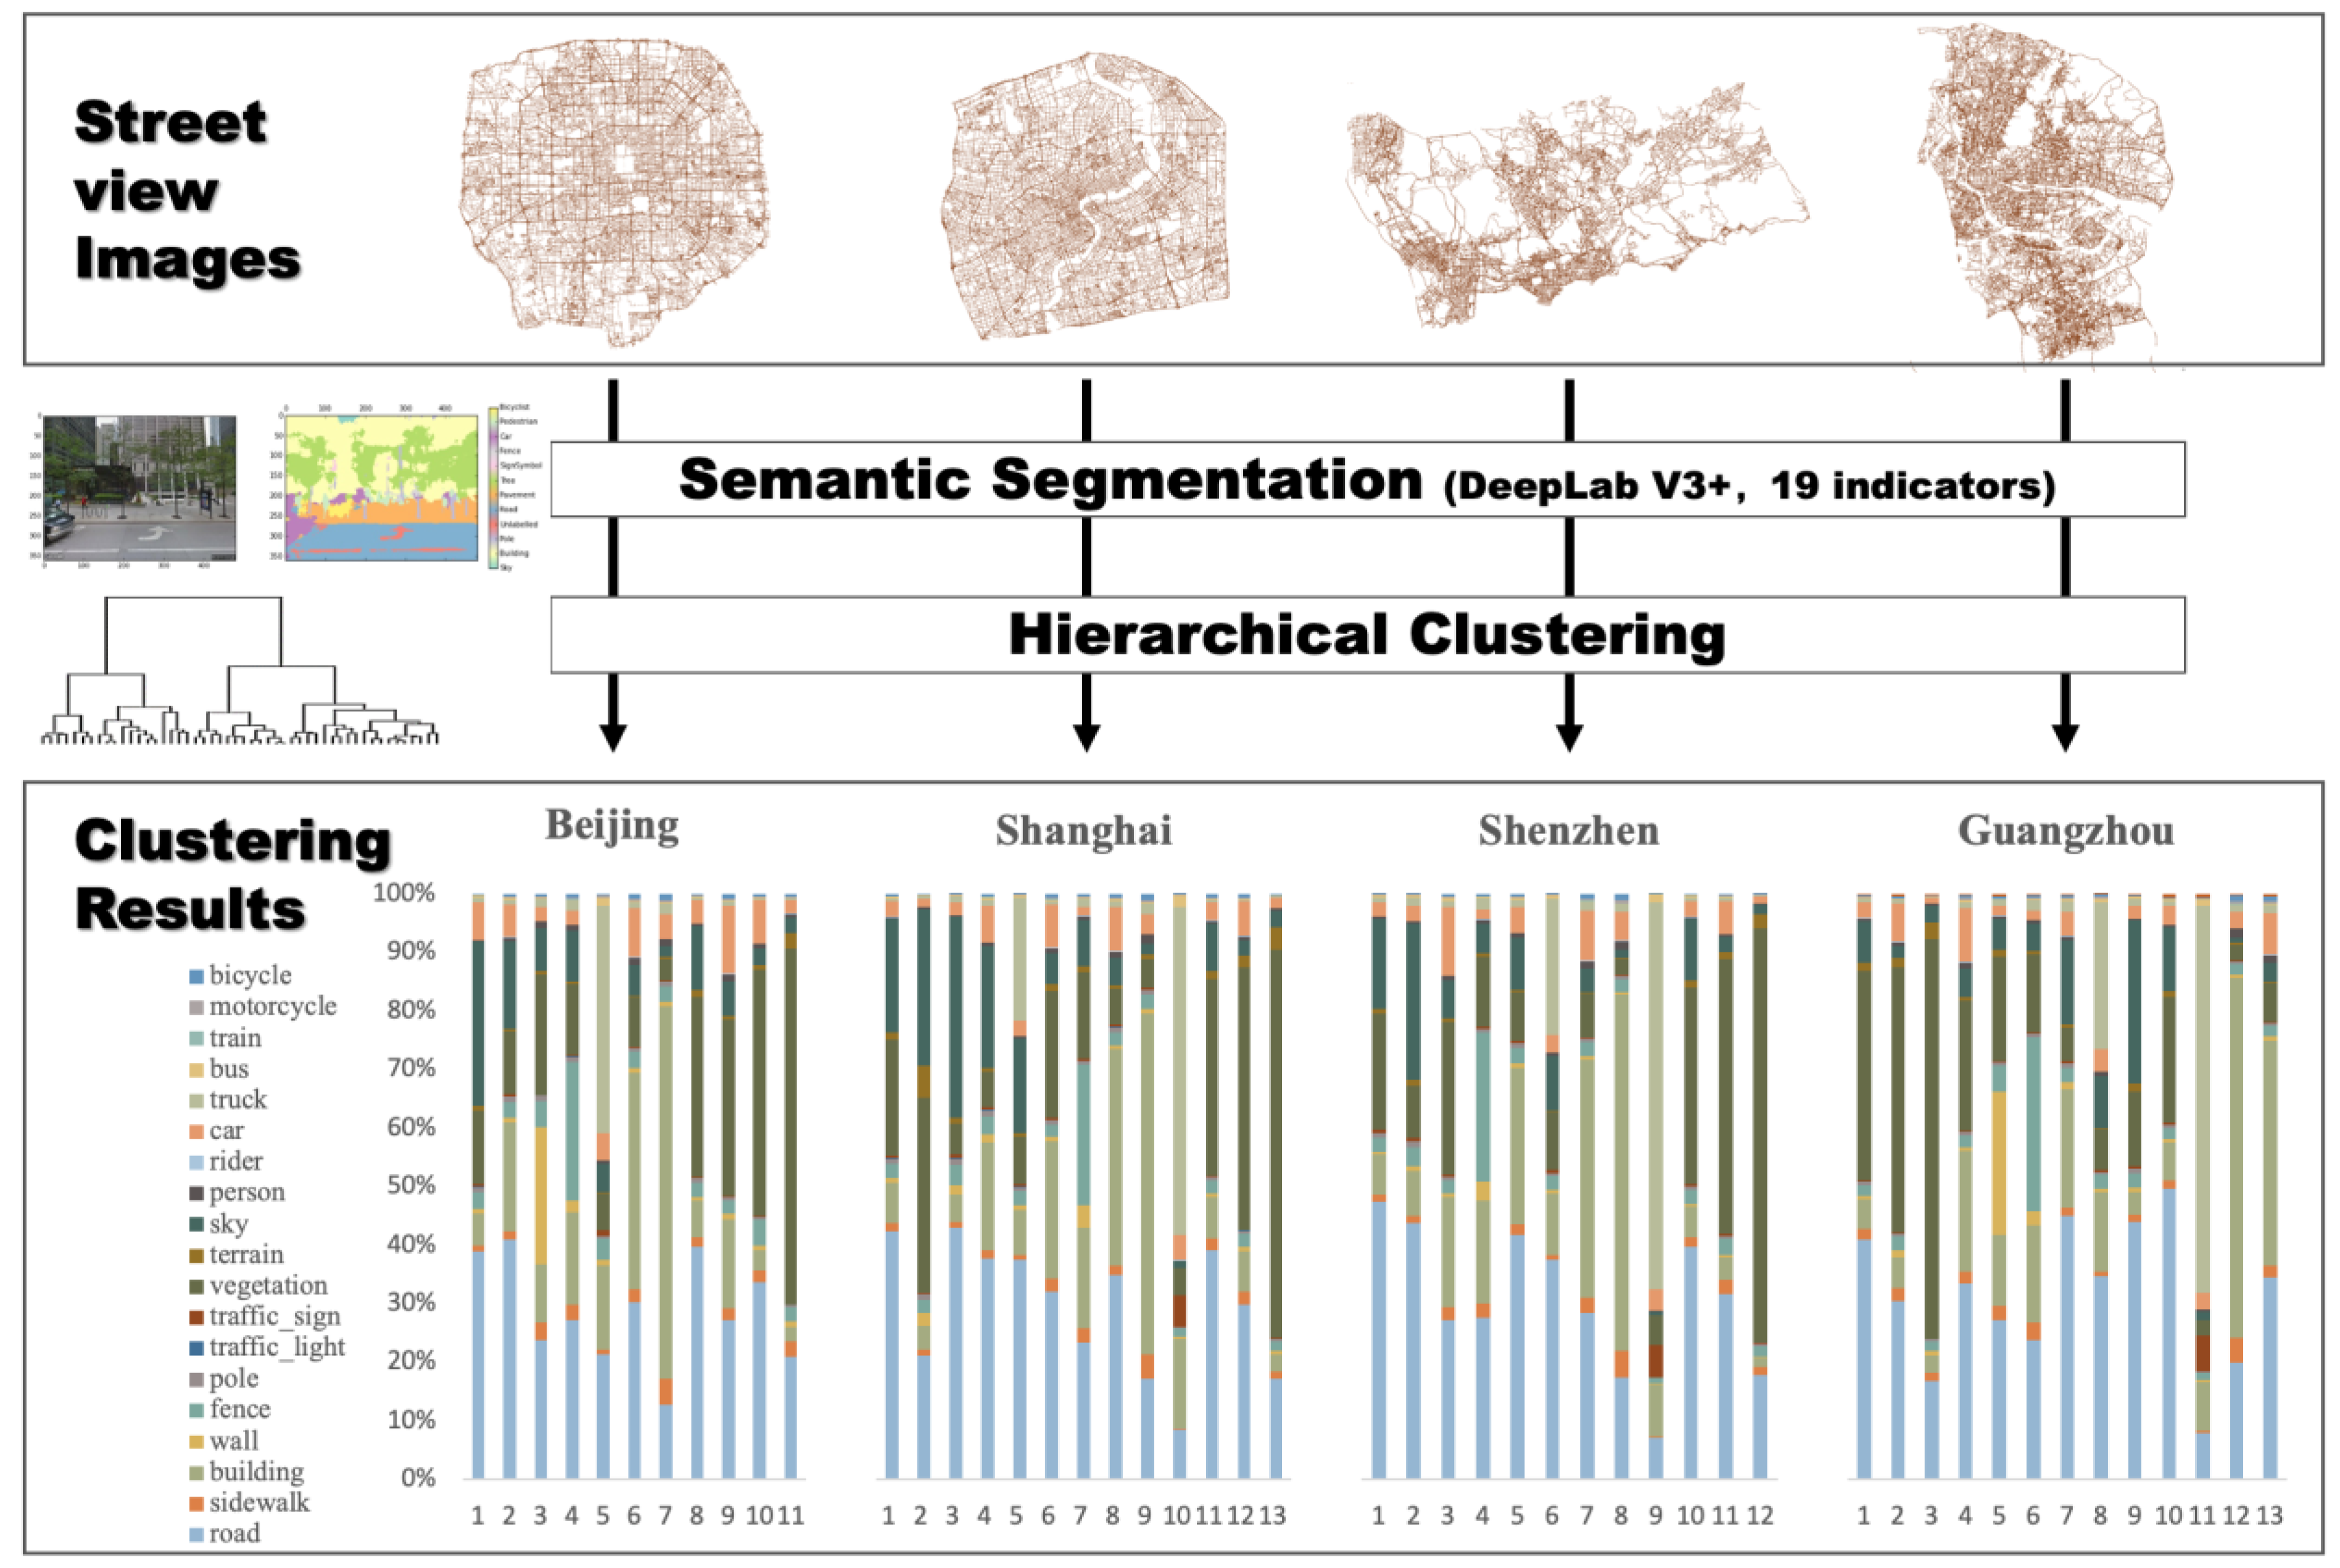
2.3. Street Classification Based on the Percentages of Street Indicators
2.4. Street Comfort Evaluation Using A Questionnaire-Based Online Survey
2.5. Data Analysis
2.5.1. Calculating the Overall Street Comfort Level of the Four Case Study Cities
2.5.2. Relating People’s Perceived Comfort with Street Characteristics
2.5.3. Visualizing and Comparing Street Comfort within and across Cities
3. Results
3.1. Manipulation Checks
3.2. Street Indicators Relating to Street Comfort
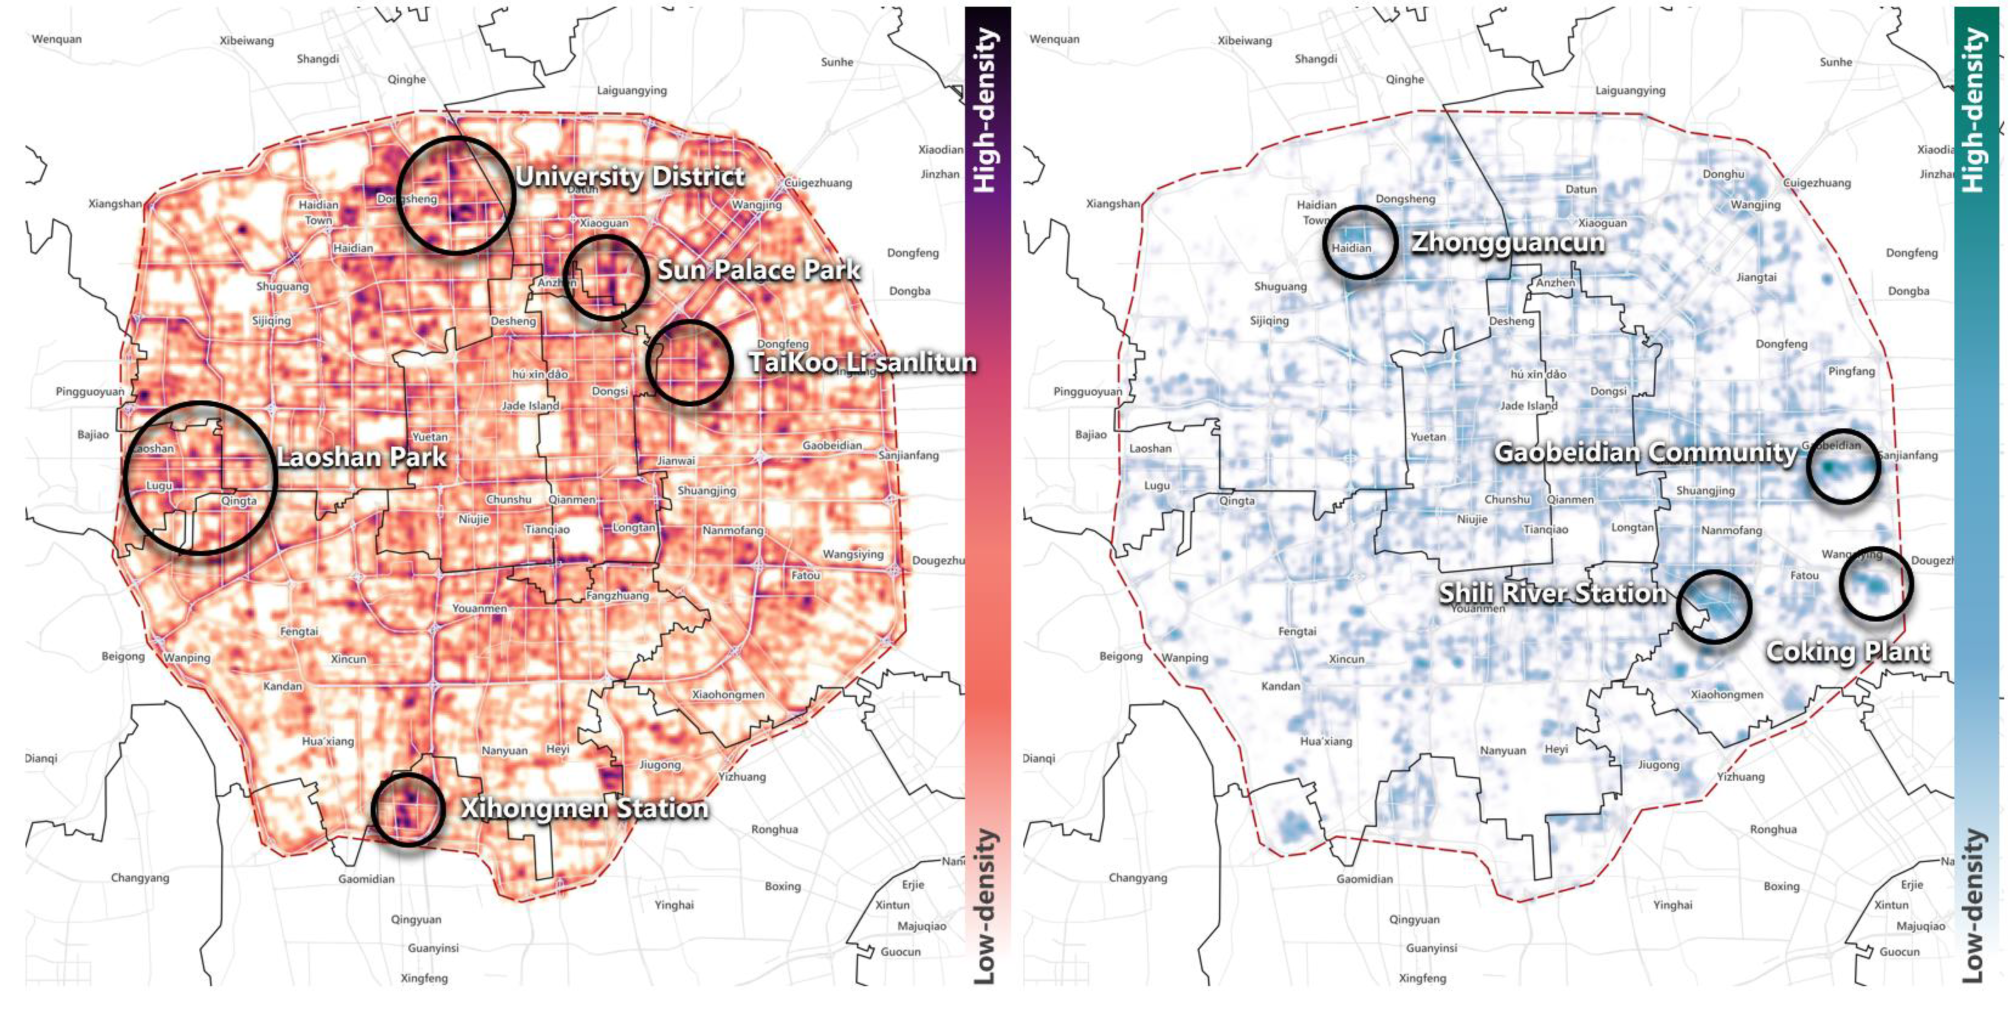
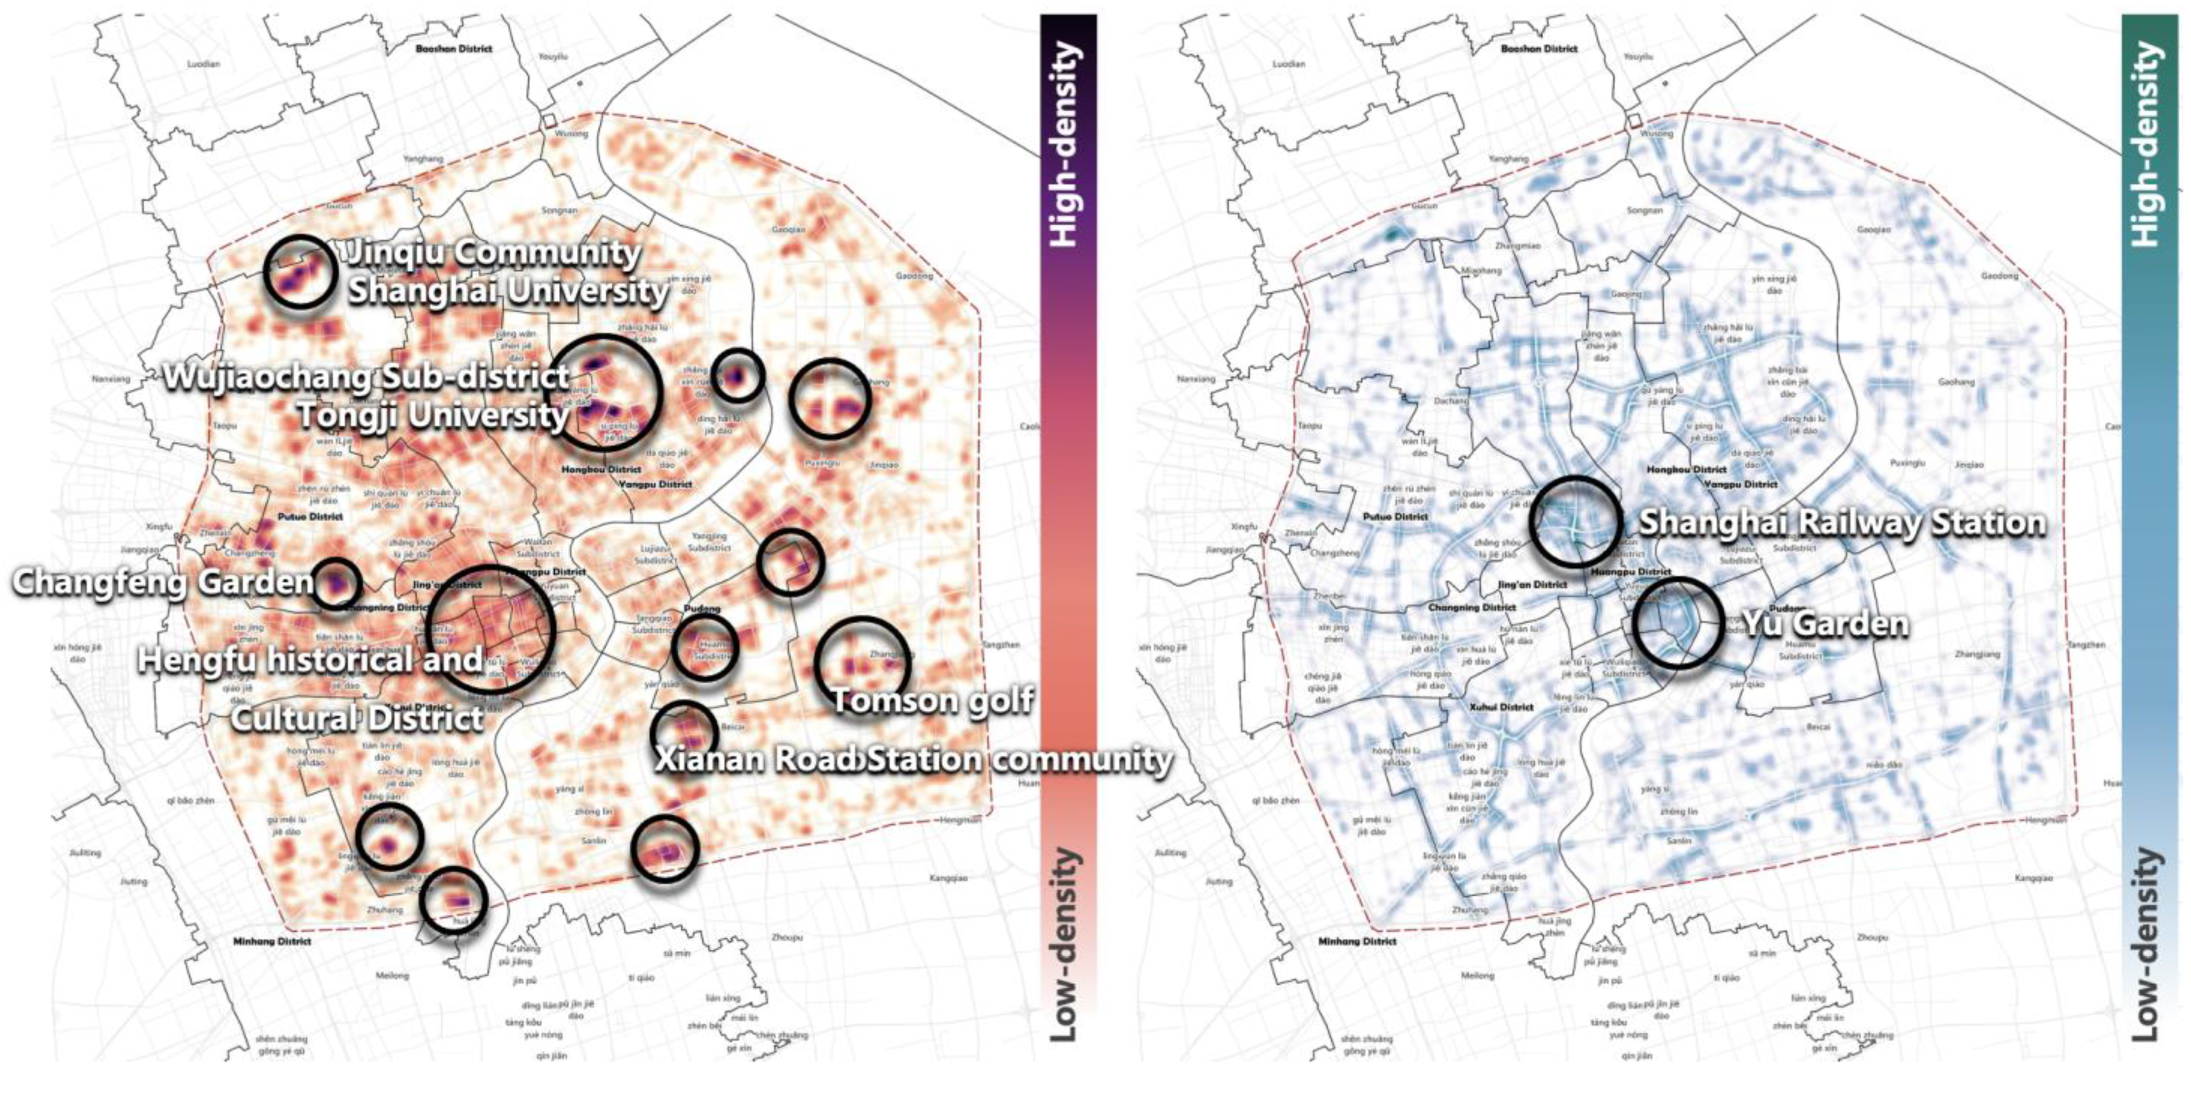
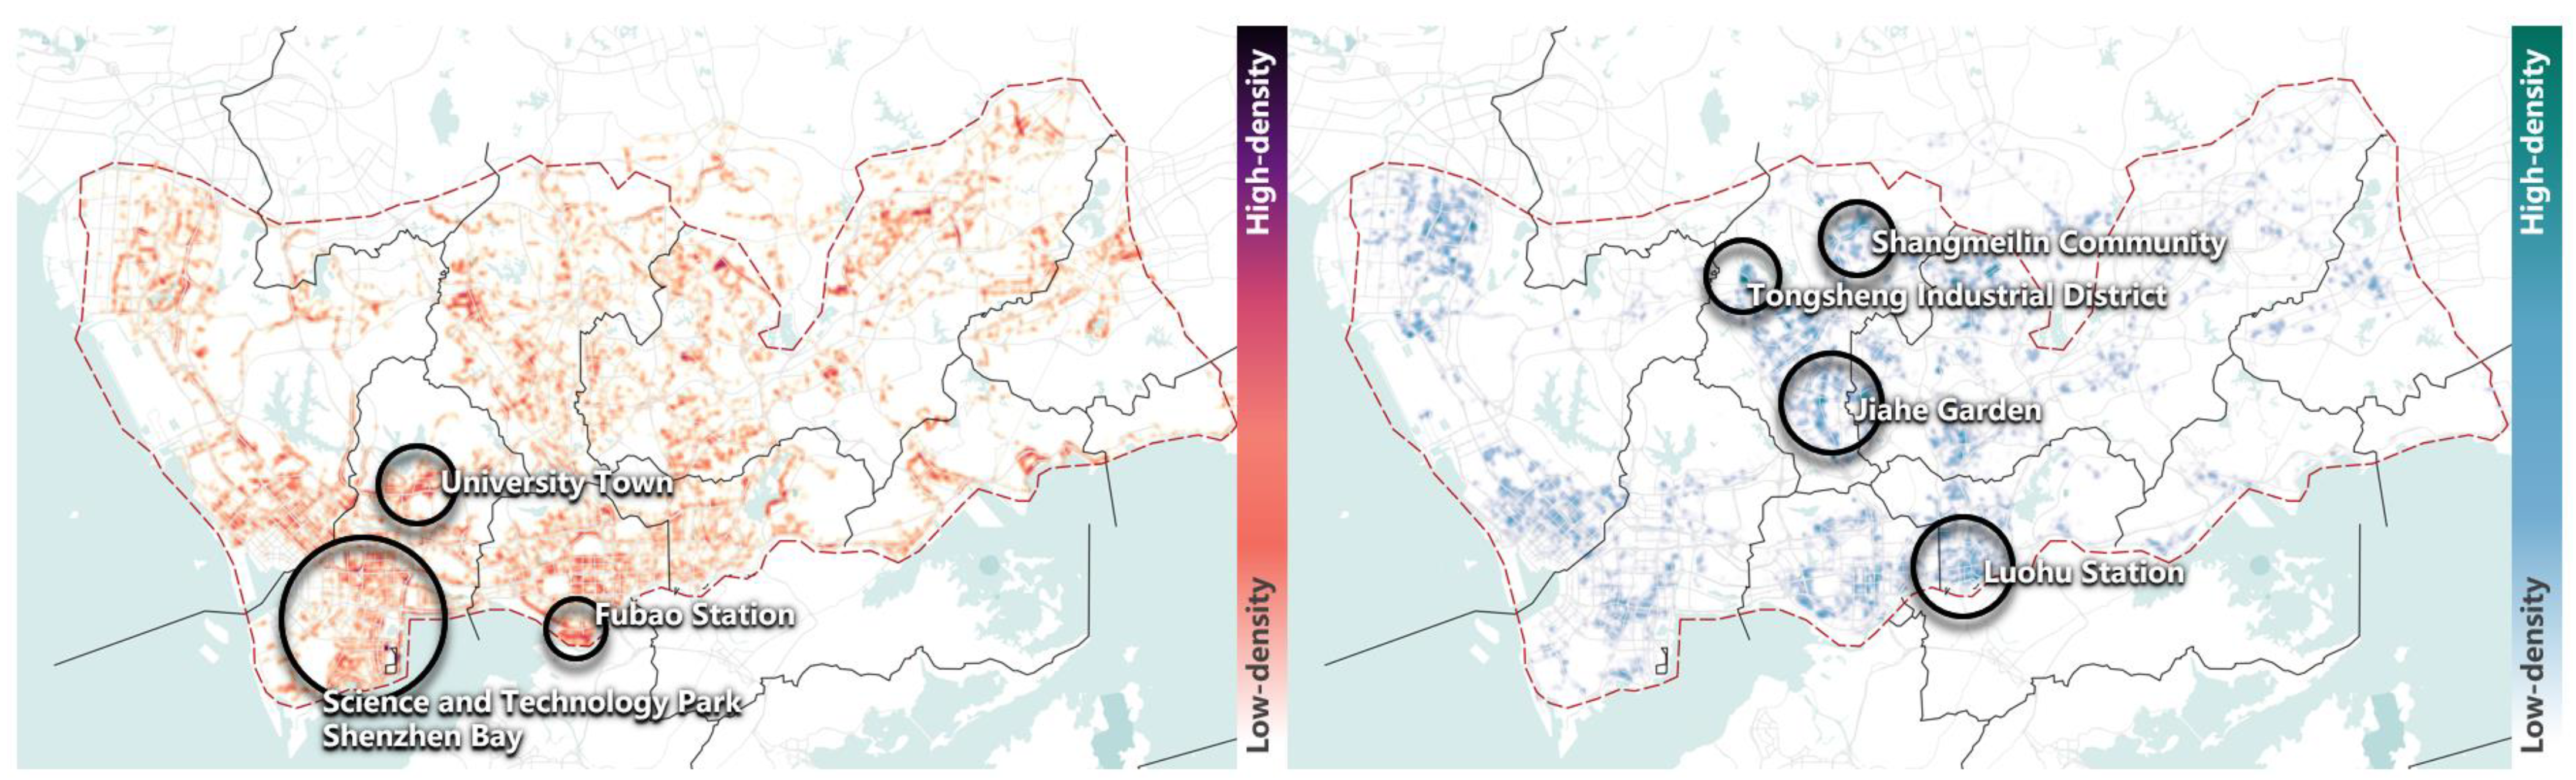
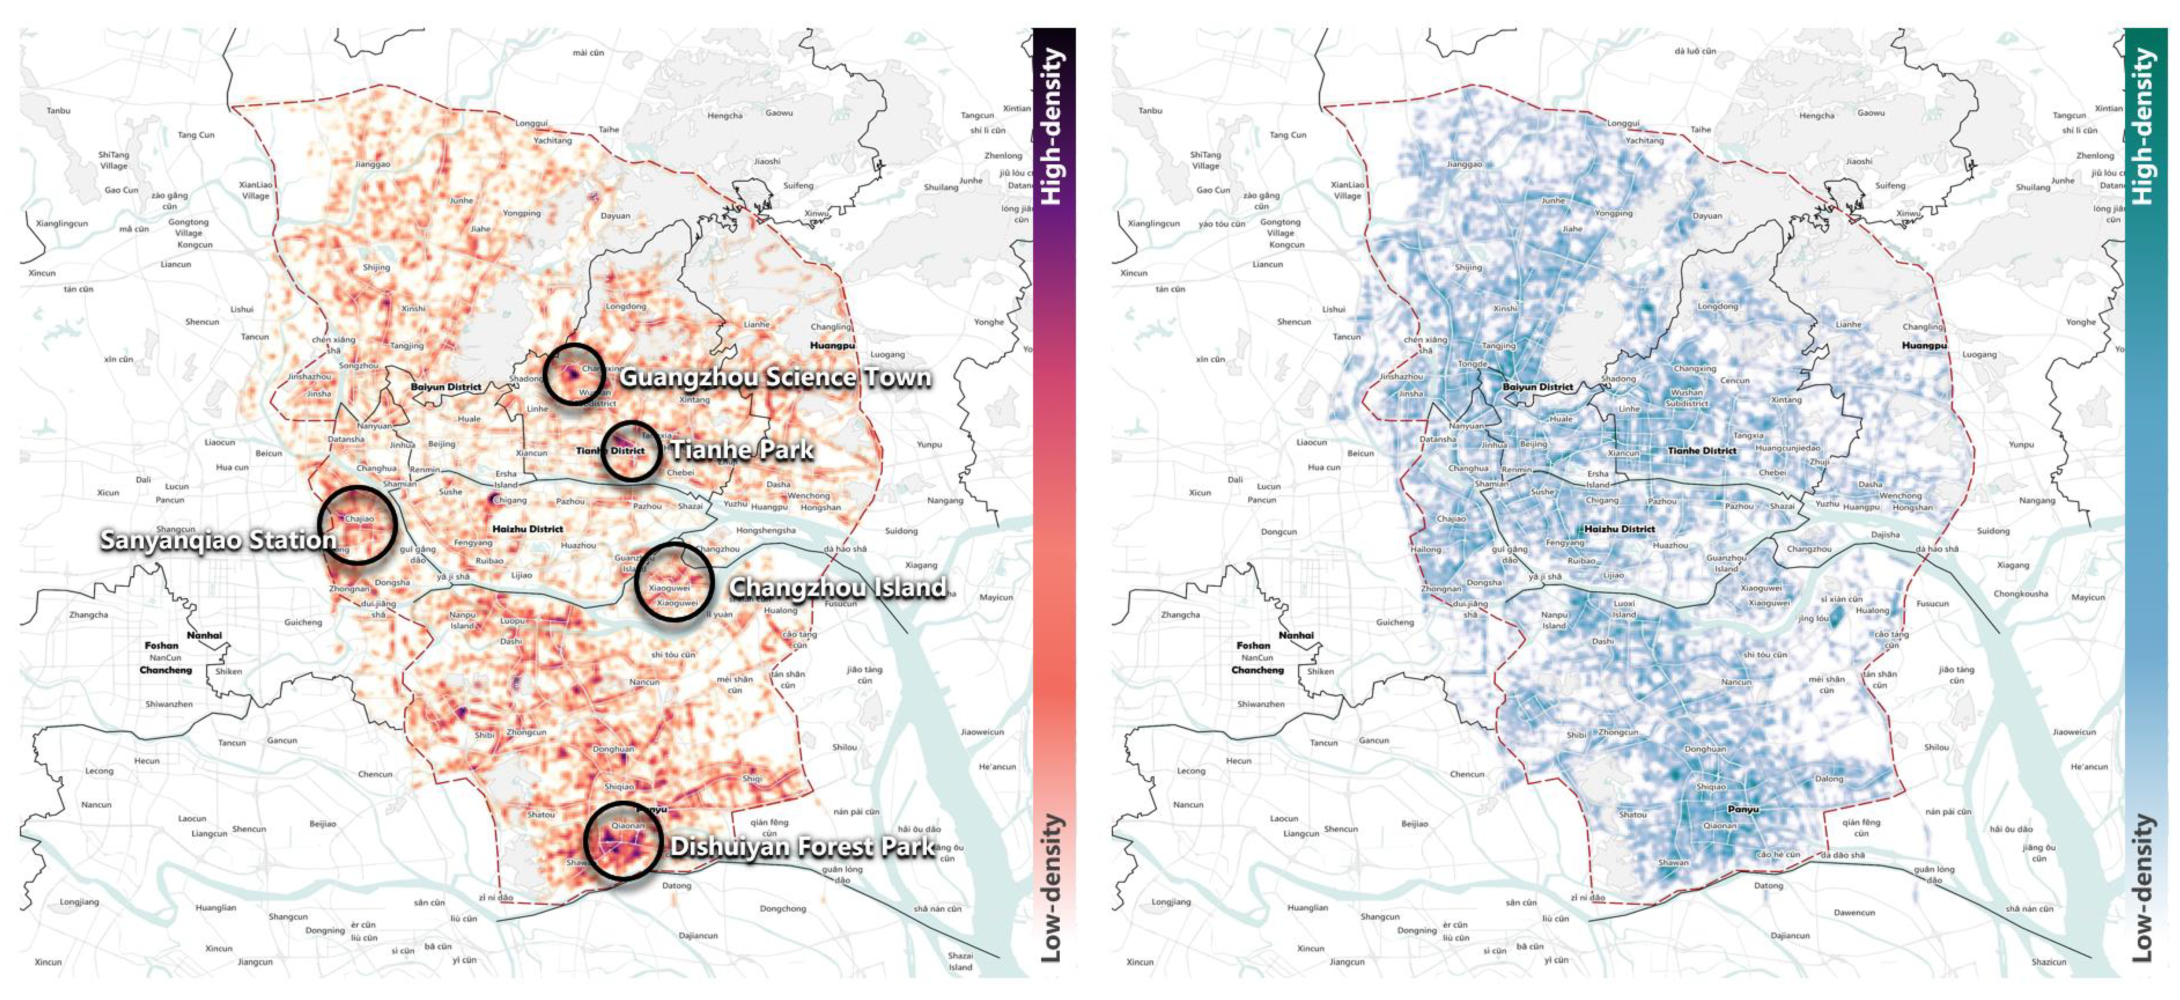
3.3. Comparing Street Comfort Distribution within and across Cities
4. Discussion
4.1. Streets Comfort Distribution Is Highly Influenced by Urban Planning Process
4.2. Design Implications Based on Comfort-Related Street Indicators and City Characteristics
4.3. Limitation
5. Conclusions
Author Contributions
Funding
Institutional Review Board Statement
Informed Consent Statement
Data Availability Statement
Conflicts of Interest
References
- Mehta, V. Walkable streets: Pedestrian behavior, perceptions and attitudes. J. Urban. 2008, 1, 217–245. [Google Scholar] [CrossRef]
- Mehta, V. The Street: A Quintessential Social Public Space; Routledge: Oxford, UK, 2013. [Google Scholar]
- Cole, R.; Lorch, R. Buildings, Culture and Environment; Wiley Online Library: Hoboken, NY, USA, 2003. [Google Scholar]
- Alfonzo, M.A. To walk or not to walk? The hierarchy of walking needs. Environ. Behav. 2005, 37, 808–836. [Google Scholar] [CrossRef]
- Pauna, C.B.; Chirvai, D.I.G. Urban Comfort in Bucharest. Social-Eeconomic Parameters. Rom. J. Reg. Sci. 2009, 3, 808–836. [Google Scholar]
- Finch, E.; Iverson, G.; Dye, J. Pedestrian Comfort Guidance for London. In Proceedings of the European Transport Conference, 2010 Association for European Transport (AET), Glasgow, UK, 11–13 October 2010. [Google Scholar]
- Rybczynski, W. Home: A Short History of an Idea; Penguin: New York, NY, USA, 1986; Volume 10. [Google Scholar]
- Szokolay, S. Introduction to Architectural Science: The Basis of Sustainable Design; Routledge: Oxford, UK, 2008. [Google Scholar]
- Bottema, M. Towards rules of thumb for wind comfort and air quality. Atmos. Environ. 1999, 33, 4009–4017. [Google Scholar] [CrossRef]
- Mochida, A.; Yoshino, H.; Takeda, T.; Kakegawa, T.; Miyauchi, S. Methods for controlling airflow in and around a building under cross-ventilation to improve indoor thermal comfort. J. Wind Eng. Ind. Aerodyn. 2005, 93, 437–449. [Google Scholar] [CrossRef]
- Rossi, F.; Anderini, E.; Castellani, B.; Nicolini, A.; Morini, E. Integrated improvement of occupants’ comfort in urban areas during outdoor events. Build. Environ. 2015, 93, 285–292. [Google Scholar] [CrossRef]
- Wang, C.; Si, Y.; Abdul-Rahman, H.; Wood, L.C. Noise annoyance and loudness: Acoustic performance of residential buildings in tropics. Build. Serv. Eng. Res. Technol. 2015, 36, 680–700. [Google Scholar] [CrossRef] [Green Version]
- Mohelnikova, J. Light and Lighting-Basic terms and criteria for specifying lighting requirements Light and Lighting-Basic terms and criteria for specifying lighting requirements, 2002. J. Light Vis. Environ. 2008, 32, 20–26. [Google Scholar] [CrossRef] [Green Version]
- Rock, I.; Harris, C.S. Vision and touch. Sci. Am. 1967, 216, 96–107. [Google Scholar] [CrossRef]
- Klemm, W.; Heusinkveld, B.G.; Lenzholzer, S.; van Hove, B. Street greenery and its physical and psychological impact on thermal comfort. Landsc. Urban Plan. 2015, 138, 87–98. [Google Scholar] [CrossRef]
- Liu, F.; Kang, J. Relationship between street scale and subjective assessment of audio-visual environment comfort based on 3D virtual reality and dual-channel acoustic tests. Build. Environ. 2018, 129, 35–45. [Google Scholar] [CrossRef]
- Clowes, W. Sons Limited. In Whitaker’s Almanack; J Whitaker & Sons Ltd: Stevenage, UK, 1971. [Google Scholar]
- Guski, R. Personal and social variables as co-determinants of noise annoyance. Noise Health 1999, 1, 45. [Google Scholar] [PubMed]
- Shao, Y.; Hao, Y.; Yin, Y.; Meng, Y.; Xue, Z. Improving Soundscape Comfort in Urban Green Spaces Based on Aural-Visual Interaction Attributes of Landscape Experience. Forests 2022, 13, 1262. [Google Scholar] [CrossRef]
- Jain, H.; Tiwari, G.; Zuidgeest, M. Evaluating bicyclists comfort and safety perception. In Proceedings of the 12th World Conference on Transport Research, WCTR 2010, Lisbon, Portugal, 11–15 July 2010; pp. 1–19. [Google Scholar]
- Li, L.; Yang, X.; Yin, L. Exploration of pedestrian refuge effect on safety crossing at signalized intersection. Transp. Res. Rec. 2010, 2193, 44–50. [Google Scholar] [CrossRef]
- Ujang, N.; Muslim, Z. Walkability and attachment to tourism places in the city of Kuala Lumpur, Malaysia. Athens J. Tour. 2014, 2, 53–65. [Google Scholar] [CrossRef]
- Kingery-Page, K. Shades of Comfort: Privacy and the Street; In Proceedings of the Making Cities Livable Congress, Portland, USA, 10-14 May 2009.
- Gill, G.; Bigazzi, A.; Winters, M. Investigating relationships among perceptions of yielding, safety, and comfort for pedestrians in unsignalized crosswalks. Transp. Res. Part F Traffic Psychol. Behav. 2022, 85, 179–194. [Google Scholar] [CrossRef]
- Park, Y.; Garcia, M. Pedestrian safety perception and urban street settings. Int. J. Sustain. Transp. 2020, 14, 860–871. [Google Scholar] [CrossRef]
- Chen, R.; Sung, W.-P.; Chang, H.-C.; Chi, Y.-R. Applying outdoor environment to develop health, comfort, and energy saving in the office in hot-humid climate. Sci. World J. 2013, 2013, 1–8. [Google Scholar] [CrossRef] [Green Version]
- Blocken, B.; Stathopoulos, T.; Van Beeck, J. Pedestrian-level wind conditions around buildings: Review of wind-tunnel and CFD techniques and their accuracy for wind comfort assessment. Build. Environ. 2016, 100, 50–81. [Google Scholar] [CrossRef]
- Markvica, K.; Richter, G.; Lenz, G. Impact of urban street lighting on road users’ perception of public space and mobility behavior. Build. Environ. 2019, 154, 32–43. [Google Scholar] [CrossRef]
- Zuo, J.; Mu, T.; Xiao, T.-Y.; Luo, J.-C. Evaluation of Walking Comfort in Children’s School Travel at Street Scale: A Case Study in Tianjin (China). Int. J. Environ. Res. Public Health 2021, 18, 10292. [Google Scholar] [CrossRef]
- Mehta, V. Look closely and you will see, listen carefully and you will hear: Urban design and social interaction on streets. J. Urban Des. 2009, 14, 29–64. [Google Scholar] [CrossRef]
- Lu, Y.; Sarkar, C.; Xiao, Y. The effect of street-level greenery on walking behavior: Evidence from Hong Kong. Soc. Sci. Med. 2018, 208, 41–49. [Google Scholar] [CrossRef]
- Brookfield, K.; Tilley, S. Using virtual street audits to understand the walkability of older adults’ route choices by gender and age. Int. J. Environ. Res. Public Health 2016, 13, 1061. [Google Scholar] [CrossRef] [Green Version]
- Shuaib, A.; Rana, M.M.P. Questing a walkable city: A case of urban neighbourhood walkability environment in Bangladesh. J. Place Manag. Dev. 2021, 15, 374–395. [Google Scholar] [CrossRef]
- Loidl, H.; Bernard, S. Open (ing) Spaces: Design as Landscape Architecture; Birkhäuser: Basel, Switzerland, 2022. [Google Scholar]
- Bain, L.; Gray, B.; Rodgers, D. Living Streets: Strategies for Crafting Public Space; John Wiley & Sons: Hoboken, NJ, USA, 2012. [Google Scholar]
- Németh, J.; Schmidt, S. Publicly accessible space and quality of life: A tool for measuring the openness of urban spaces. In Quality-of-Life Community Indicators for Parks, Recreation and Tourism Management; Springer: Berlin, Germany, 2011; pp. 41–66. [Google Scholar]
- Xiang, L.; Papastefanou, G.; Ng, E. Isovist indicators as a means to relieve pedestrian psycho-physiological stress in Hong Kong. Environ. Plan. B Urban Anal. City Sci. 2021, 48, 964–978. [Google Scholar] [CrossRef]
- Ba, M.; Kang, J. Effect of a fragrant tree on the perception of traffic noise. Build. Environ. 2019, 156, 147–155. [Google Scholar] [CrossRef]
- Nasrollahi, N.; Shokri, E. Daylight illuminance in urban environments for visual comfort and energy performance. Renew. Sustain. Energy Rev. 2016, 66, 861–874. [Google Scholar] [CrossRef]
- Hartig, T.; Johansson, G.; Kylin, C. Residence in the social ecology of stress and restoration. J. Soc. Issues 2003, 59, 611–636. [Google Scholar] [CrossRef]
- Halonen, J.I.; Vahtera, J.; Stansfeld, S.; Yli-Tuomi, T.; Salo, P.; Pentti, J.; Kivimäki, M.; Lanki, T. Associations between nighttime traffic noise and sleep: The Finnish public sector study. Environ. Health Perspect. 2012, 120, 1391–1396. [Google Scholar] [CrossRef] [Green Version]
- Alamoush, S.J.; Jaafar, N.H.; Husini, E.M.; Ismail, W.N.W. COMFORT CHARACTER OF LANDSCAPE FEATURES OF TRADITIONAL STREETS IN AMMAN, JORDAN. Plan. Malays. 2018, 16, 63–74. [Google Scholar]
- Capitanio, M. Attractive streetscape making pedestrians walk longer routes: The case of Kunitachi in Tokyo. J. Archit. Urban. 2019, 43, 131–137. [Google Scholar] [CrossRef]
- Dunlop, I.N.; Casello, J.M.; Doherty, S.T. Tracking the Transit Rider Experience: Using Smartphones to Measure Comfort and Well-Being Throughout the Trip; Transportation Research Board: Washington, DC, USA, 2015. [Google Scholar]
- Labdaoui, K.; Mazouz, S.; Acidi, A.; Cools, M.; Moeinaddini, M.; Teller, J. Utilizing thermal comfort and walking facilities to propose a comfort walkability index (CWI) at the neighbourhood level. Build. Environ. 2021, 193, 107627. [Google Scholar] [CrossRef]
- Ye, Y.; Richards, D.; Lu, Y.; Song, X.; Zhuang, Y.; Zeng, W.; Zhong, T. Measuring daily accessed street greenery: A human-scale approach for informing better urban planning practices. Landsc. Urban Plan. 2019, 191, 103434. [Google Scholar] [CrossRef]
- Long, Y.; Liu, L. How green are the streets? An analysis for central areas of Chinese cities using Tencent Street View. PLoS ONE 2017, 12, e0171110. [Google Scholar] [CrossRef] [Green Version]
- Liang, J.; Gong, J.; Sun, J.; Zhou, J.; Li, W.; Li, Y.; Liu, J.; Shen, S. Automatic sky view factor estimation from street view photographs—A big data approach. Remote Sens. 2017, 9, 411. [Google Scholar] [CrossRef] [Green Version]
- Cao, R.; Fukuda, T.; Yabuki, N. A Real-Time Visual Environmental Estimation System Using Image Segmentation. In Proceedings of the 41st Symposium on Computer Techonology of Information, Turin, Italy, 6–7 December 2018. [Google Scholar]
- Tang, J.; Long, Y. Measuring visual quality of street space and its temporal variation: Methodology and its application in the Hutong area in Beijing. Landsc. Urban Plan. 2019, 191, 103436. [Google Scholar] [CrossRef]
- Maria, M.D.; Fiumi, L.; Mazzei, M.; V, B.O. A system for monitoring the environment of historic places using convolutional neural network methodologies. Heritage 2021, 4, 1429–1446. [Google Scholar] [CrossRef]
- Deng, M.; Yang, W.; Chen, C.; Liu, C. Exploring associations between streetscape factors and crime behaviors using Google Street View images. Front. Comput. Sci. 2022, 16, 164316. [Google Scholar] [CrossRef]
- Dong, Q.; Sun, R.; Sun, Y.; Xu, S.; Sun, C.; Han, Y. Method for predicting urban street local air heat environment coupling based on scale model physical simulation, involves obtaining prediction model of real-time area wind-heat environment prediction by input area measuring point data. CN115618462-A, 2023. Available online: https://www.patentguru.com/CN115618462A (accessed on 1 October 2019).
- Oliveira, A.A.A.; Wang, Z.; Hirata, R. Locating Urban Trees near Electric Wires using Google Street View Photos: A New Dataset and A Semi-Supervised Learning Approach in the Wild. In Proceedings of the IEEE/CVF Conference on Computer Vision and Pattern Recognition, New Orleans, LA, USA, 18–22 June 2022; pp. 4286–4294. [Google Scholar]
- Yahuarcani, I.O.; Diaz, J.E.G.; Satalaya, A.M.N.; Noriega, A.A.D.; Cachique, F.X.L.; Llaja, L.A.S.; Pezo, A.R.; Rojas, A.E.L. Recognition of violent actions on streets in urban spaces using Machine Learning in the context of the COVID-19 pandemic. In Proceedings of the 2021 International Conference on Electrical, Computer and Energy Technologies (ICECET), Cape Town, South Africa, 9–10 December 2021; pp. 1–4. [Google Scholar]
- Yang, C.; Xu, F.; Jiang, l.; Wang, R.; Yi, L.; Zhao, M.; Zhang, X. Approach to Quantify Spatial Comfort of Urban Roads based on Street View Images. J. Geo-Inf. Sci. 2021, 23, 17. [Google Scholar]
- Liu, M.; Jiang, Y.; He, J. Quantitative evaluation on street vitality: A case study of Zhoujiadu community in Shanghai. Sustainability 2021, 13, 3027. [Google Scholar] [CrossRef]
- Liu, S.; Lai, S.-Q.; Liu, C.; Jiang, L. What influenced the vitality of the waterfront open space? A case study of Huangpu River in Shanghai, China. Cities 2021, 114, 103197. [Google Scholar] [CrossRef]
- Jiang, Y.; Han, Y.; Liu, M.; Ye, Y. Street vitality and built environment features: A data-informed approach from fourteen Chinese cities. Sustain. Cities Soc. 2022, 79, 103724. [Google Scholar] [CrossRef]
- Taubenböck, H.; Debray, H.; Qiu, C.; Schmitt, M.; Wang, Y.; Zhu, X.X. Seven city types representing morphologic configurations of cities across the globe. Cities 2020, 105, 102814. [Google Scholar] [CrossRef]
- Brigatti, E.; Netto, V.; de Sousa Filho, F.; Cacholas, C. Entropy and hierarchical clustering: Characterizing the morphology of the urban fabric in different spatial cultures. Chaos Interdiscip. J. Nonlinear Sci. 2021, 31, 113138. [Google Scholar] [CrossRef]
- PricewaterhouseCoopers; China Development Research Foundation. Chinese Cities of Opportunity 2019; PWC: Shanghai, China, 2019; pp. 5–6. [Google Scholar]
- Gou, A.; Zhang, C.; Wang, J. Study on the identification and dynamics of green vision rate in Jing’an district, Shanghai based on deeplab V3+ model. Earth Sci. Inform. 2022, 15, 163–181. [Google Scholar] [CrossRef]
- Joshi, A.; Kale, S.; Chandel, S.; Pal, D.K. Likert scale: Explored and explained. Br. J. Appl. Sci. Technol. 2015, 7, 396. [Google Scholar] [CrossRef]
- Sheets, V.L.; Manzer, C.D. Affect, cognition, and urban vegetation: Some effects of adding trees along city streets. Environ. Behav. 1991, 23, 285–304. [Google Scholar] [CrossRef]
- Chen, X. Looking into the Supergrid and Superblock Structure in Chinese Cities: Taking Xi’an and Nanjing as Examples. In Chinese Urban Planning and Construction; Springer: Berlin, Germany, 2021; pp. 37–62. [Google Scholar]
- Yanjing, Z. Theory and Practice of Spatial Arrangement and City Competition. Planners 2004, 7, 5–13. [Google Scholar]
- Zacharias, J.; Tang, Y. Restructuring and repositioning Shenzhen, China’s new mega city. Prog. Plan. 2010, 73, 209–249. [Google Scholar] [CrossRef]
- Zan, H. Urban Street Design from the Perspective of Complete Streets: A Case Study of Shashen Road in Shenzhen. J. Landsc. Res. 2019, 11, 19–28. [Google Scholar]
- Chew, M.M. New Boundary Work of Rural Migrants: How It Opens Up New Potential Ways of Remaking Rural-Urban Symbolic Boundaries in China. Chin. Sociol. Rev. 2019, 51, 421–447. [Google Scholar] [CrossRef]
- Kh, M. Identification of factors influencing urban facade’s design with an emphasis on aesthetics and ecological dimensions Case study: Valiasr (as) Street–Free Region of Qeshm. Motaleate Shahri 2014, 3, 15–26. [Google Scholar]
- Dietrich, U. Urban street Canyons–impact of different materials and colours of facades and ground and different positions of persons on outdoor thermal comfort. In Sustainability and the City; WIT Press: Ashurst Lodge, UK, 2008; pp. 95–106. [Google Scholar]
- Mirabi, E.; Nasrollahi, N. Urban Facade Geometry on Outdoor Comfort Conditions: A Review. Eur. Online J. Nat. Soc. Sci. 2020, 9, 655–677. [Google Scholar] [CrossRef]
- Yuting, Y.; Yuhan, S.; Zhenying, X.; Thwaites, K.; Kexin, Z. An Explorative Study on the Identification and Evaluation of Restorative Streetscape Elements. Landsc. Archit. Front. 2020, 8, 76–90. [Google Scholar]
- Shao, Y.; Yin, Y.; Xue, Z. Evaluation and comparison of streetscape comfort in Beijing and Shanghai based on a big data approach with street images. Landsc. Archit. 2021, 28, 53–59. [Google Scholar]
- Sun, L.; Tan, W.; Ren, Y.; Ji, X.; Wang, Z.; Li, P. Research on visual comfort of underground commercial streets’ pavement in china on the basis of virtual simulation. Int. J. Pattern Recognit. Artif. Intell. 2020, 34, 2050005. [Google Scholar] [CrossRef]
- Xie, F.; Levinson, D. Measuring the structure of road networks. Geogr. Anal. 2007, 39, 336–356. [Google Scholar] [CrossRef]


| Beijing | Shanghai | Shenzhen | Guangzhou | |
|---|---|---|---|---|
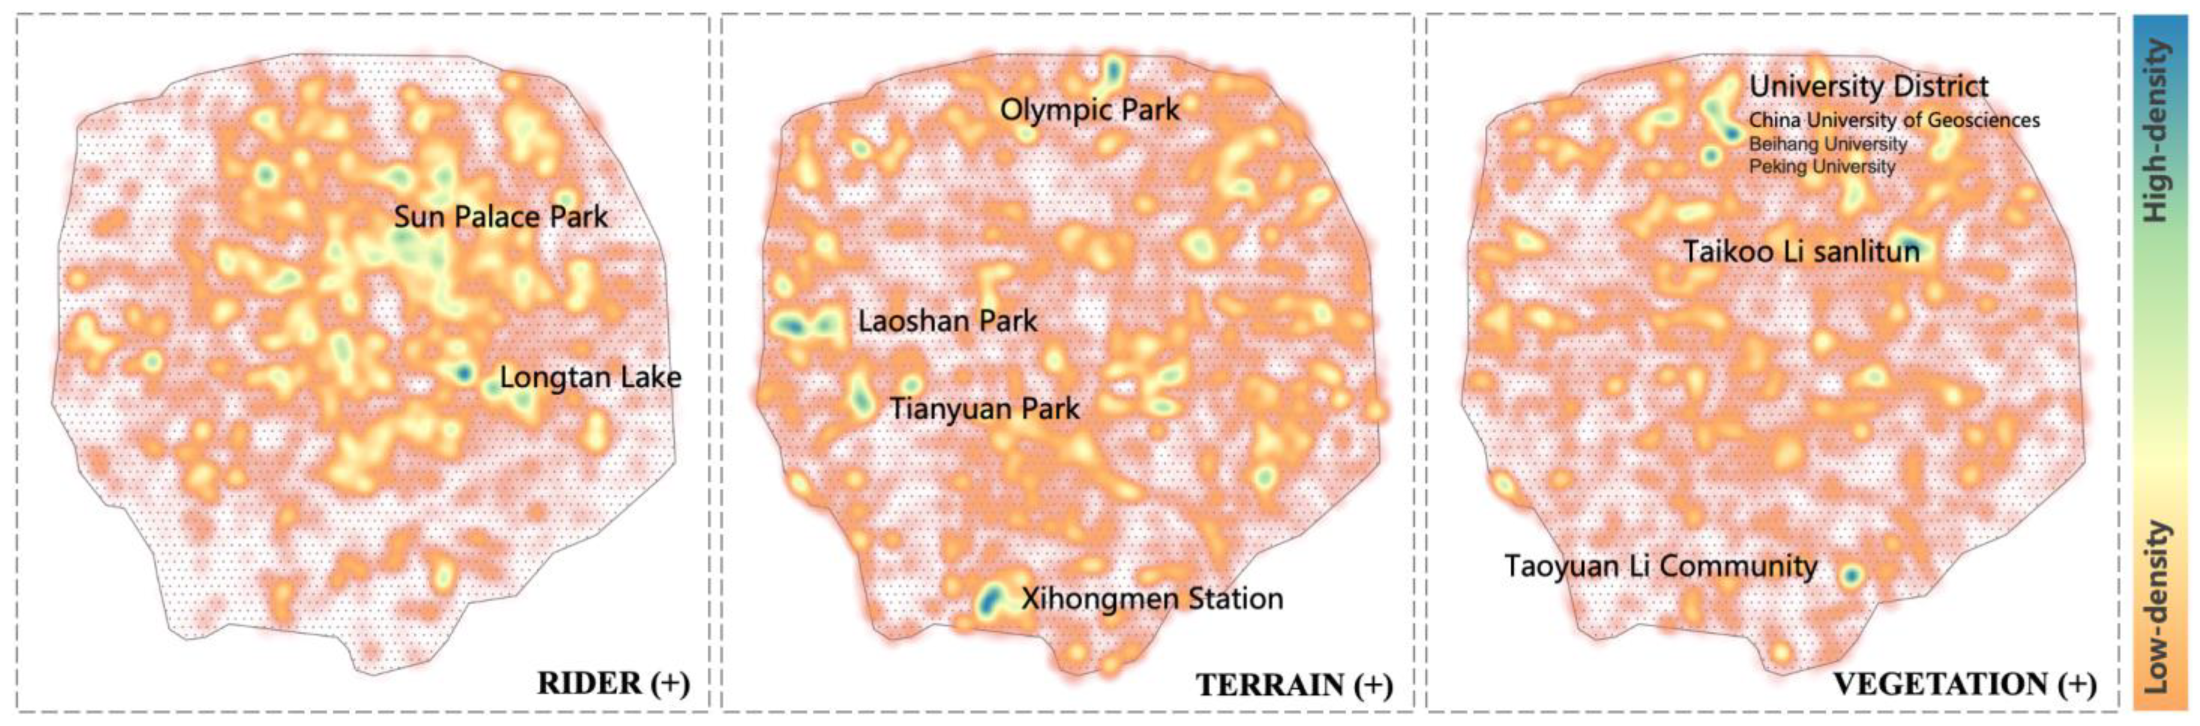
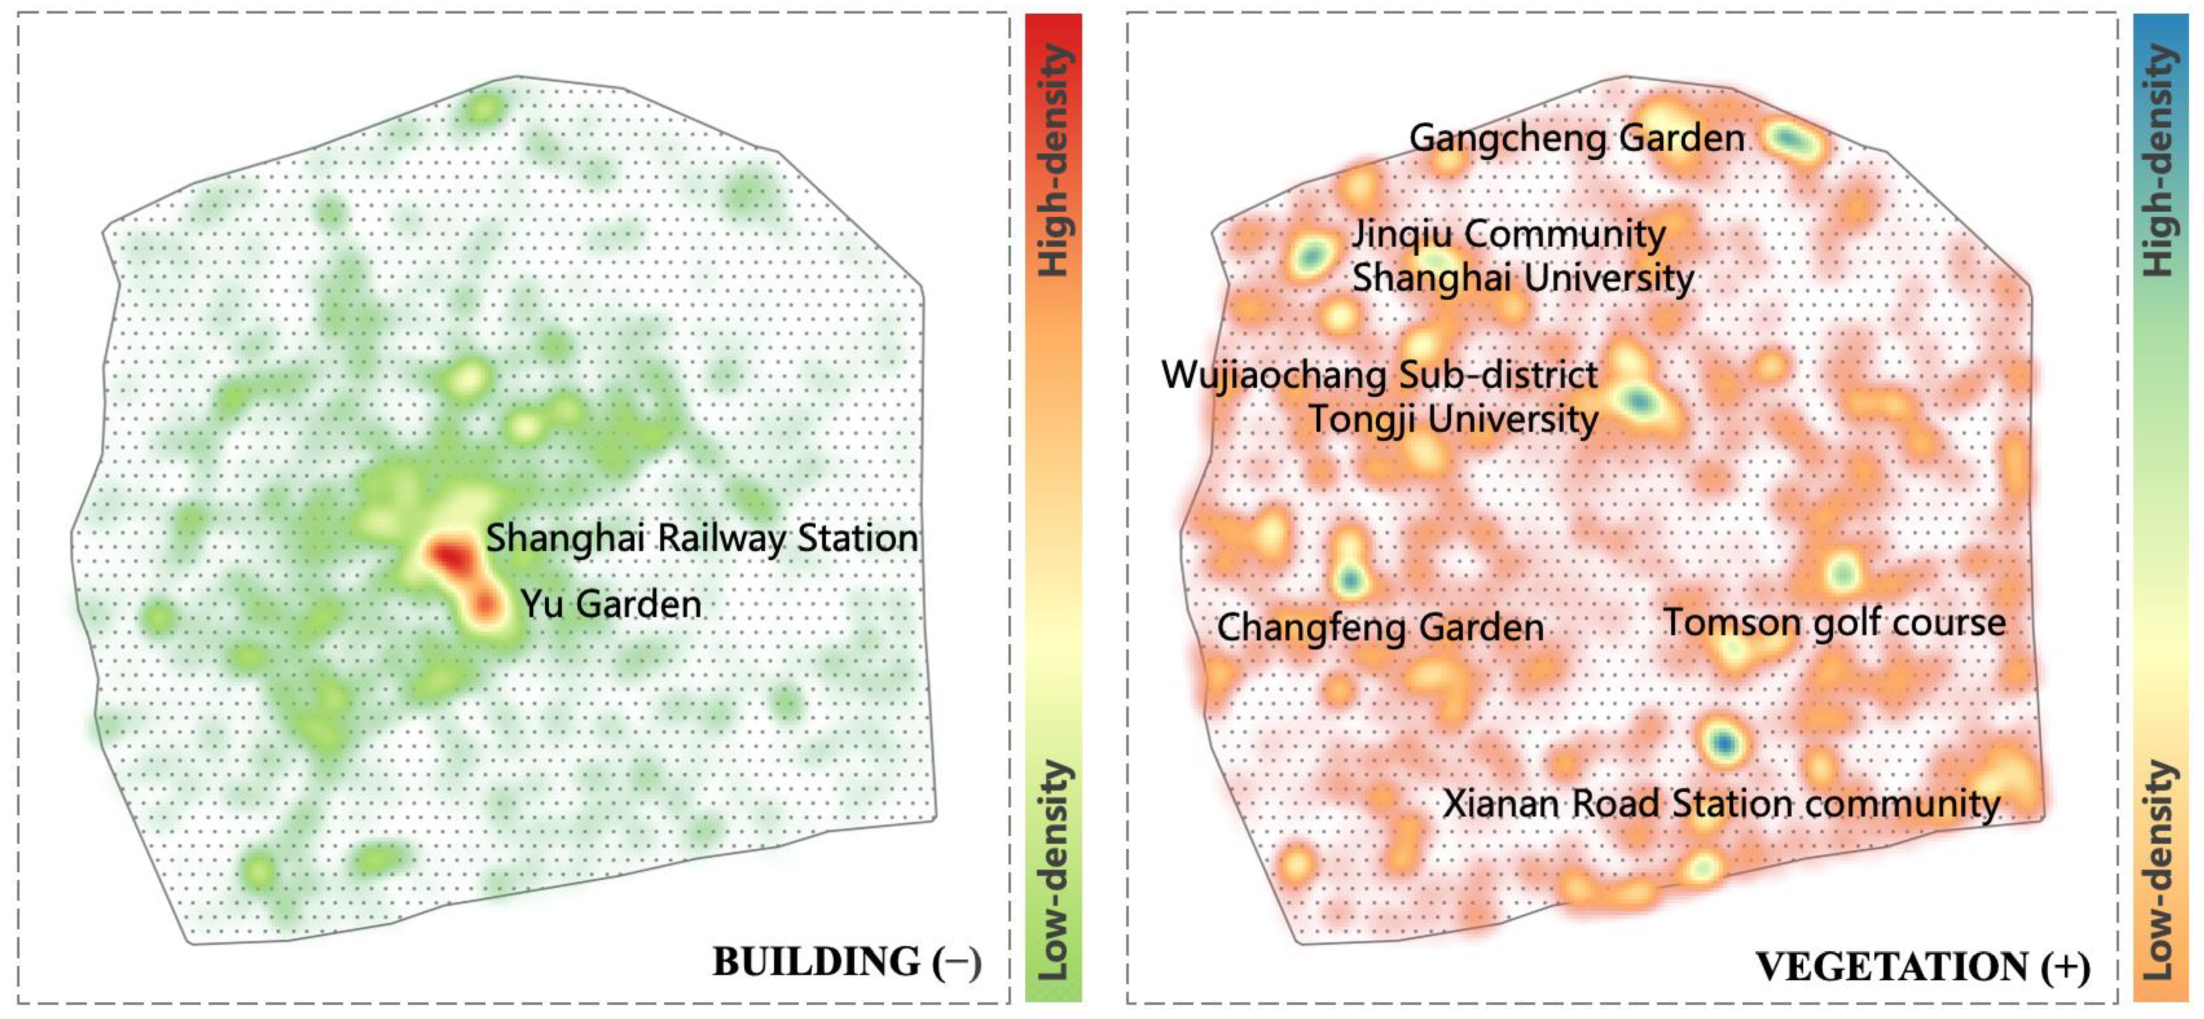
| Positive effects | Vegetation Terrain Rider | Vegetation | Vegetation Terrain | Terrain |
| Negative effects | / | Building | Building Person Motorcycle Bicycle | Building Person Motorcycle Bicycle |
Disclaimer/Publisher’s Note: The statements, opinions and data contained in all publications are solely those of the individual author(s) and contributor(s) and not of MDPI and/or the editor(s). MDPI and/or the editor(s) disclaim responsibility for any injury to people or property resulting from any ideas, methods, instructions or products referred to in the content. |
© 2023 by the authors. Licensee MDPI, Basel, Switzerland. This article is an open access article distributed under the terms and conditions of the Creative Commons Attribution (CC BY) license (https://creativecommons.org/licenses/by/4.0/).
Share and Cite
Shao, Y.; Yin, Y.; Xue, Z.; Ma, D. Assessing and Comparing the Visual Comfort of Streets across Four Chinese Megacities Using AI-Based Image Analysis and the Perceptive Evaluation Method. Land 2023, 12, 834. https://doi.org/10.3390/land12040834
Shao Y, Yin Y, Xue Z, Ma D. Assessing and Comparing the Visual Comfort of Streets across Four Chinese Megacities Using AI-Based Image Analysis and the Perceptive Evaluation Method. Land. 2023; 12(4):834. https://doi.org/10.3390/land12040834
Chicago/Turabian StyleShao, Yuhan, Yuting Yin, Zhenying Xue, and Dongbo Ma. 2023. "Assessing and Comparing the Visual Comfort of Streets across Four Chinese Megacities Using AI-Based Image Analysis and the Perceptive Evaluation Method" Land 12, no. 4: 834. https://doi.org/10.3390/land12040834