Article

Monitoring House Vacancy Dynamics in The Pearl River Delta Region: A Method Based on NPP-VIIRS Night-Time Light Remote Sensing Images

1
School of Public Affairs and Administration, University of Electronic Science and Technology of China, Chengdu 611731, China
2
School of Information Engineering, China University of Geosciences, Beijing 100083, China
3
College of Resource and Environment Engineering, Guizhou University, Guiyang 550025, China
4
School of Data Science and Artificial Intelligence, Wenzhou University of Technology, Wenzhou 325000, China
5
Department of Geography and Anthropology, Louisiana State University, Baton Rouge, LA 70803, USA
6
School of Automation, University of Electronic Science and Technology of China, Chengdu 610054, China
*
Author to whom correspondence should be addressed.
Land 2023, 12(4), 831; https://doi.org/10.3390/land12040831
Submission received: 14 February 2023 / Revised: 1 April 2023 / Accepted: 3 April 2023 / Published: 5 April 2023
(This article belongs to the Special Issue Urban Land Development in the Process of Urbanization)

Abstract

:
Urban spatial interaction integrates cities into closely related urban network systems in continuous urban regions. However, it also brings differentiation and has mutual negative impacts between each location. Unbalanced development is one such impacts and needs closely monitoring. The housing vacancy rate (HVR) in a continuous urban region is an important index in the unbalanced development of a continuous urban region since it indicates the uneven distribution of population and investment across cities. This study uses NPP-VIIRS NTL data and Landsat 8 OLT images to estimate HVRs at the district level. Additionally, this study tracks the spatial–temporal dynamics of HVR distributions in the Pearl River Delta (PRD) region. The comparison between the sampled HVRs and estimated HVRs verifies the effectiveness of the estimated HVRs in identifying dynamic changes in HVRs. This study has found that although overall decreasing HVRs are observed in the PRD, speculations and irrational real estate investment exist in cities on the west bank of the Pearl River Estuary and in some isolated districts in other cities. Furthermore, increasing proportions of vacant pixels in most cities indicate rising real estate development, requiring further supervision. This study suggests that more precise data and advanced techniques could help to improve the accuracy of the estimation techniques.

1. Introduction

The housing vacancy rate (HVR) is the percentage of all available units in the real estate market that are unoccupied or vacant at a particular time and is an important index of housing oversupply or real estate speculation [1]. Widespread housing vacancies may indicate a structural crisis due to either property abandonment or real estate speculation, phenomena which might hurt the economy severely [2]. Recently, the distribution of HVRs in a continuous urban region and the changes over time have drawn the attention of scholars since they indicate the uneven distribution of population and investments across cities [3]. On the one hand, urban spatial interaction integrates cities into closely related urban network systems [4] with stronger population, capital and resource aggregation capabilities [5]. On the other, with the strengthening of spatial interaction, there will be differences in agglomeration between cities, inevitably leading to unbalanced development [6]. Especially in China, where the local governments have proved their powerful influence on defining urban development and have caused a remarkable scale of uneven development across and within cities [7]. Additionally, links between cities have also become increasingly influential in the real HVRs due to the fast-developing joint plans. Overall, monitoring the dynamics of HVR distribution in a continuous urban region is a very important tool for correcting erroneous development decisions and promoting balanced regional development. In view of this, this research aims to propose an updated and inexpensive method to use to monitor the dynamics of HVR distribution in a continuous urban region. With the monitoring of unbalanced regional development as the target, the most critical issue here is not the accuracy of the vacancy situation of housing units, but the judgment of the overall vacancy rate dynamics throughout the continuous urban region with the district as the units.
However, the monitoring of HVR has long been hampered by the difficulty of collecting housing vacancy information. Multiple evaluation methods have been derived to evaluate HVRs based on single or mixed data. Survey data with huge survey samples and reliable methods, such as that derived from the CPS/HVS (Current Population Survey/Housing Vacancy Survey) and AHS (American Housing Survey) in the US, constitute the main sources of information used in these tasks [8]. Power data [9], building data and tax data [10] can also be applied to evaluate HVRs. However, these methods are either costly, time-consuming or have a high barrier to acquisition [11,12]. Scholars have reported the difficulty of obtaining reliable information using survey-based methods [13], and the lack of historical data make it difficult to track changes in HVR [11]. The housing vacancy problem is considered severe across China [14], but China lacks transparent HVR statistics with which to show the real estate market situation. There are urgent needs for both a data source with historical accumulation and timely updates and for a method to apply it with for HVR estimation in China.
Fortunately, night-time light (NTL) data, which have been available since 2013, have become widely acknowledged as objectively reflecting the changes in urban development. NTL data are indirect manifestations of human activities. They have been widely used in population density simulation [9], electricity and energy consumption [15], GDP estimation [16], the assessment of poverty [17], as well as in HVR studies [18] to substitute traditional survey-taking methods. This generally requires a mixed use of NTL and other big data. For instance, Wang et al. [19] combined NTL data with OpenStreetMap data, and Zhang et al. [20] and Yang and Pan [21] used urban POI data and NTL data to extract the urban built-up area and evaluate HVRs. Yue et al. [22] proposed a method of estimating HVRs based on the image of the appearance of a house. However, the existing city-based HVR analysis is not precise enough for use in the analysis of the interaction of urban development across cities. This is because the spillover of investment in one city might only affect one to two districts in another city. The study of district-level HVRs would be theoretically significant for studying the dynamics of HVR distribution in a continuous urban region as it shows the areas of interaction between cities more precisely. Although a district that generally covers over 100 km2 is large enough for HVR estimation with NTL data, no studies elaborating this have yet been carried out.
In response to the abovementioned gaps in the research, this study applies NPP-VIIRS NTL data and Landsat 8 OLT images to the estimation of HVRs in the Pearl River Delta (PRD) region at the district level. It tracks the spatial–temporal dynamics of HVR distributions in order to evaluate the interaction of urban development across cities. The following sections have been included. The second section introduces the choice of the study area, data processing, and the calculation of HVRs and the verification of the method The results are presented in the third section, showing the distribution of different HVRs across districts and the change in HVRs over time, specifically in 2013, 2016, and 2019. Section 4 concludes the research and discusses future studies.

2. Materials and Methods
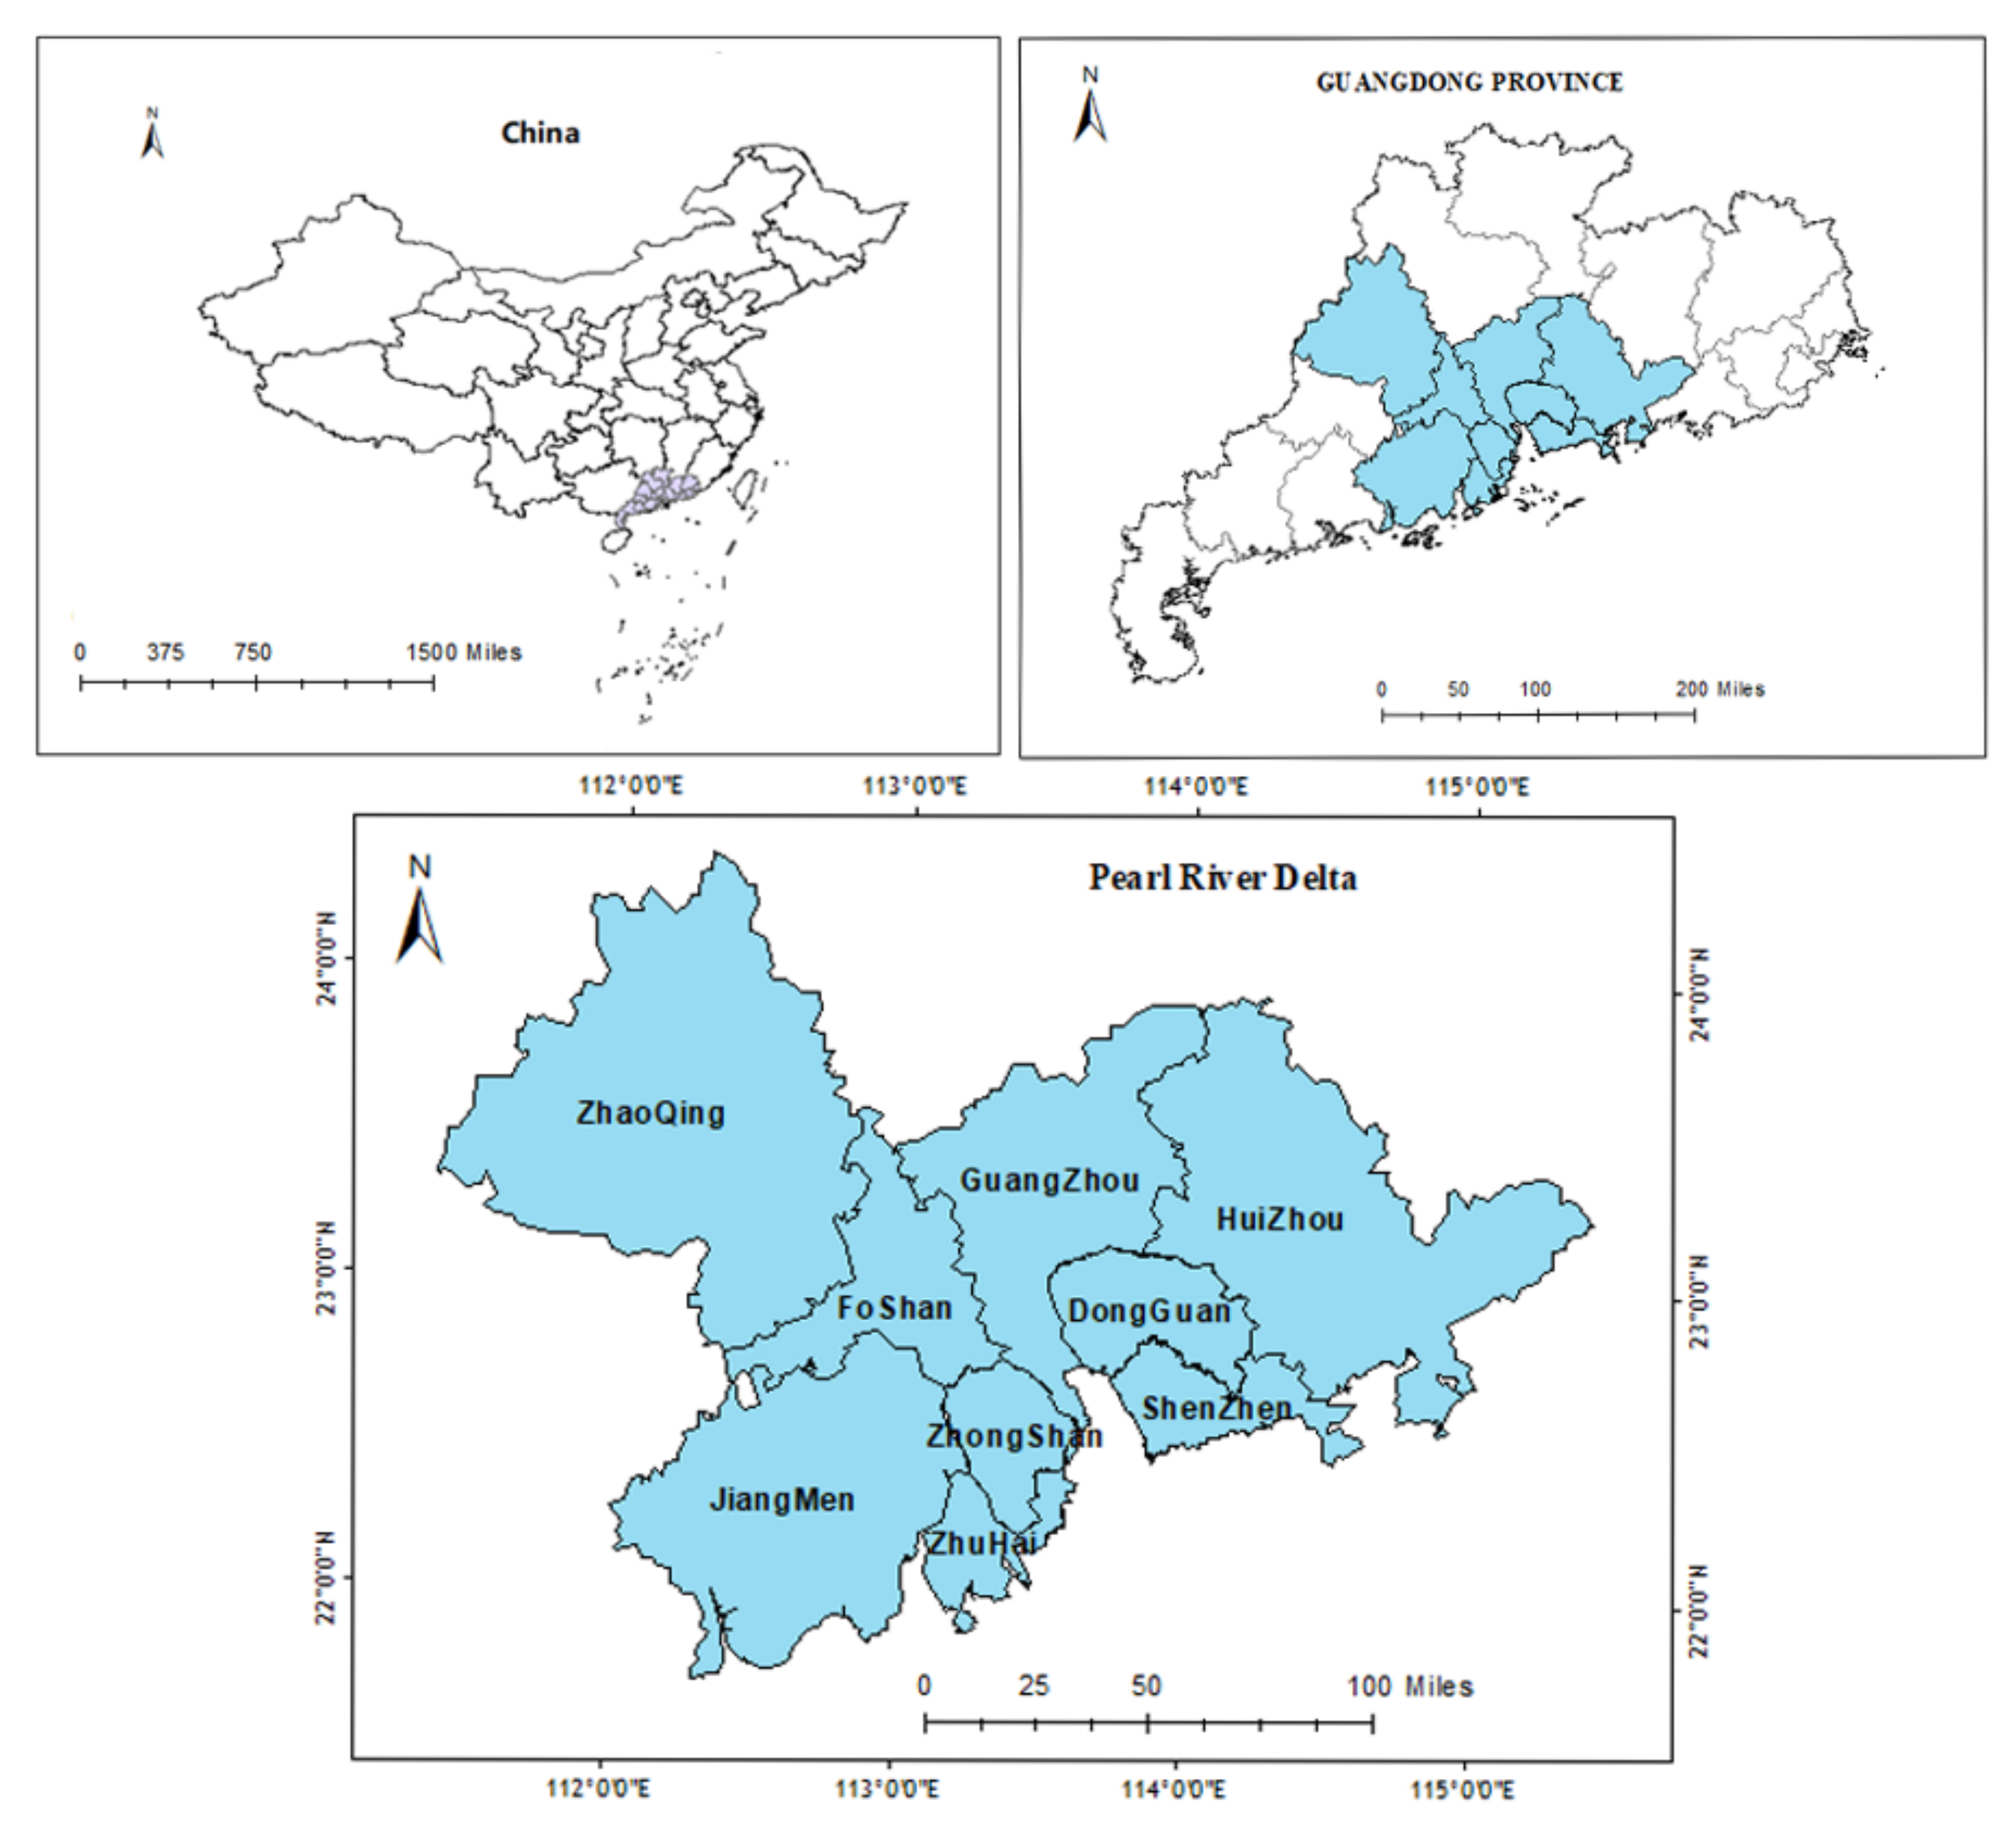
2.1. Study Area

In this study, the study area chosen is the region of the Pearl River Delta (PRD). It is located in the southern coastal area of China and is one of the three most productive economic regions of China [23,24], contributing up to 8689.9 billion yuan to GDP in China, which makes up around 80% of the total GDP in Guangdong Province in 2019 (National Statistics Bureau of Guangzhou 2020).
As shown in Figure 1, nine cities have been included in the PRD: Guangzhou, Foshan, Shenzhen, Dongguan, Zhongshan, Zhuhai, Jiangmen, Zhaoqing, and Huizhou. The PRD is one of China’s most developed and prosperous areas has a significant population. According to the 2019 Guangdong Province Statistical Yearbook, the PRD has a population of around 63 million people. Additionally, the PDR covers an area of 4173.15 km2 in terms of built-up area. This situation boosts the demand as well as supply for housing. New buildings have sprung up like mushrooms in the PRD due to urban development. The unregulated growth of real estate development has resulted in an increasing number of empty housing units and may have harmed the local economy [14]. Therefore, implementing rational planning for urban housing development, in addition to accurately estimating HVRs of the region and their distribution, is extremely important.
This study evaluates the HVR distribution dynamics at the district/county scale. Districts and counties in China are the political units of municipal government. There are 105 districts and counties included in the PRD2. The size of districts or counties in the PRD varies from 11.43 (Guancheng Street Community in Dongguan City) to 3558.75 km2 (Huidong County), allowing for the collection of sufficient samples of NTL pixels for analysis within a district. A district or county generally has a balanced population structure, economic and social development level, environment capacity, land utilization status, infrastructure, and basic public service provision. In addition, it has an urban center which concentrates residences. Therefore, the district-scale study avoids a comparison of the extreme value of lights in one city and helps to gain more rational results.

2.2. Data Source

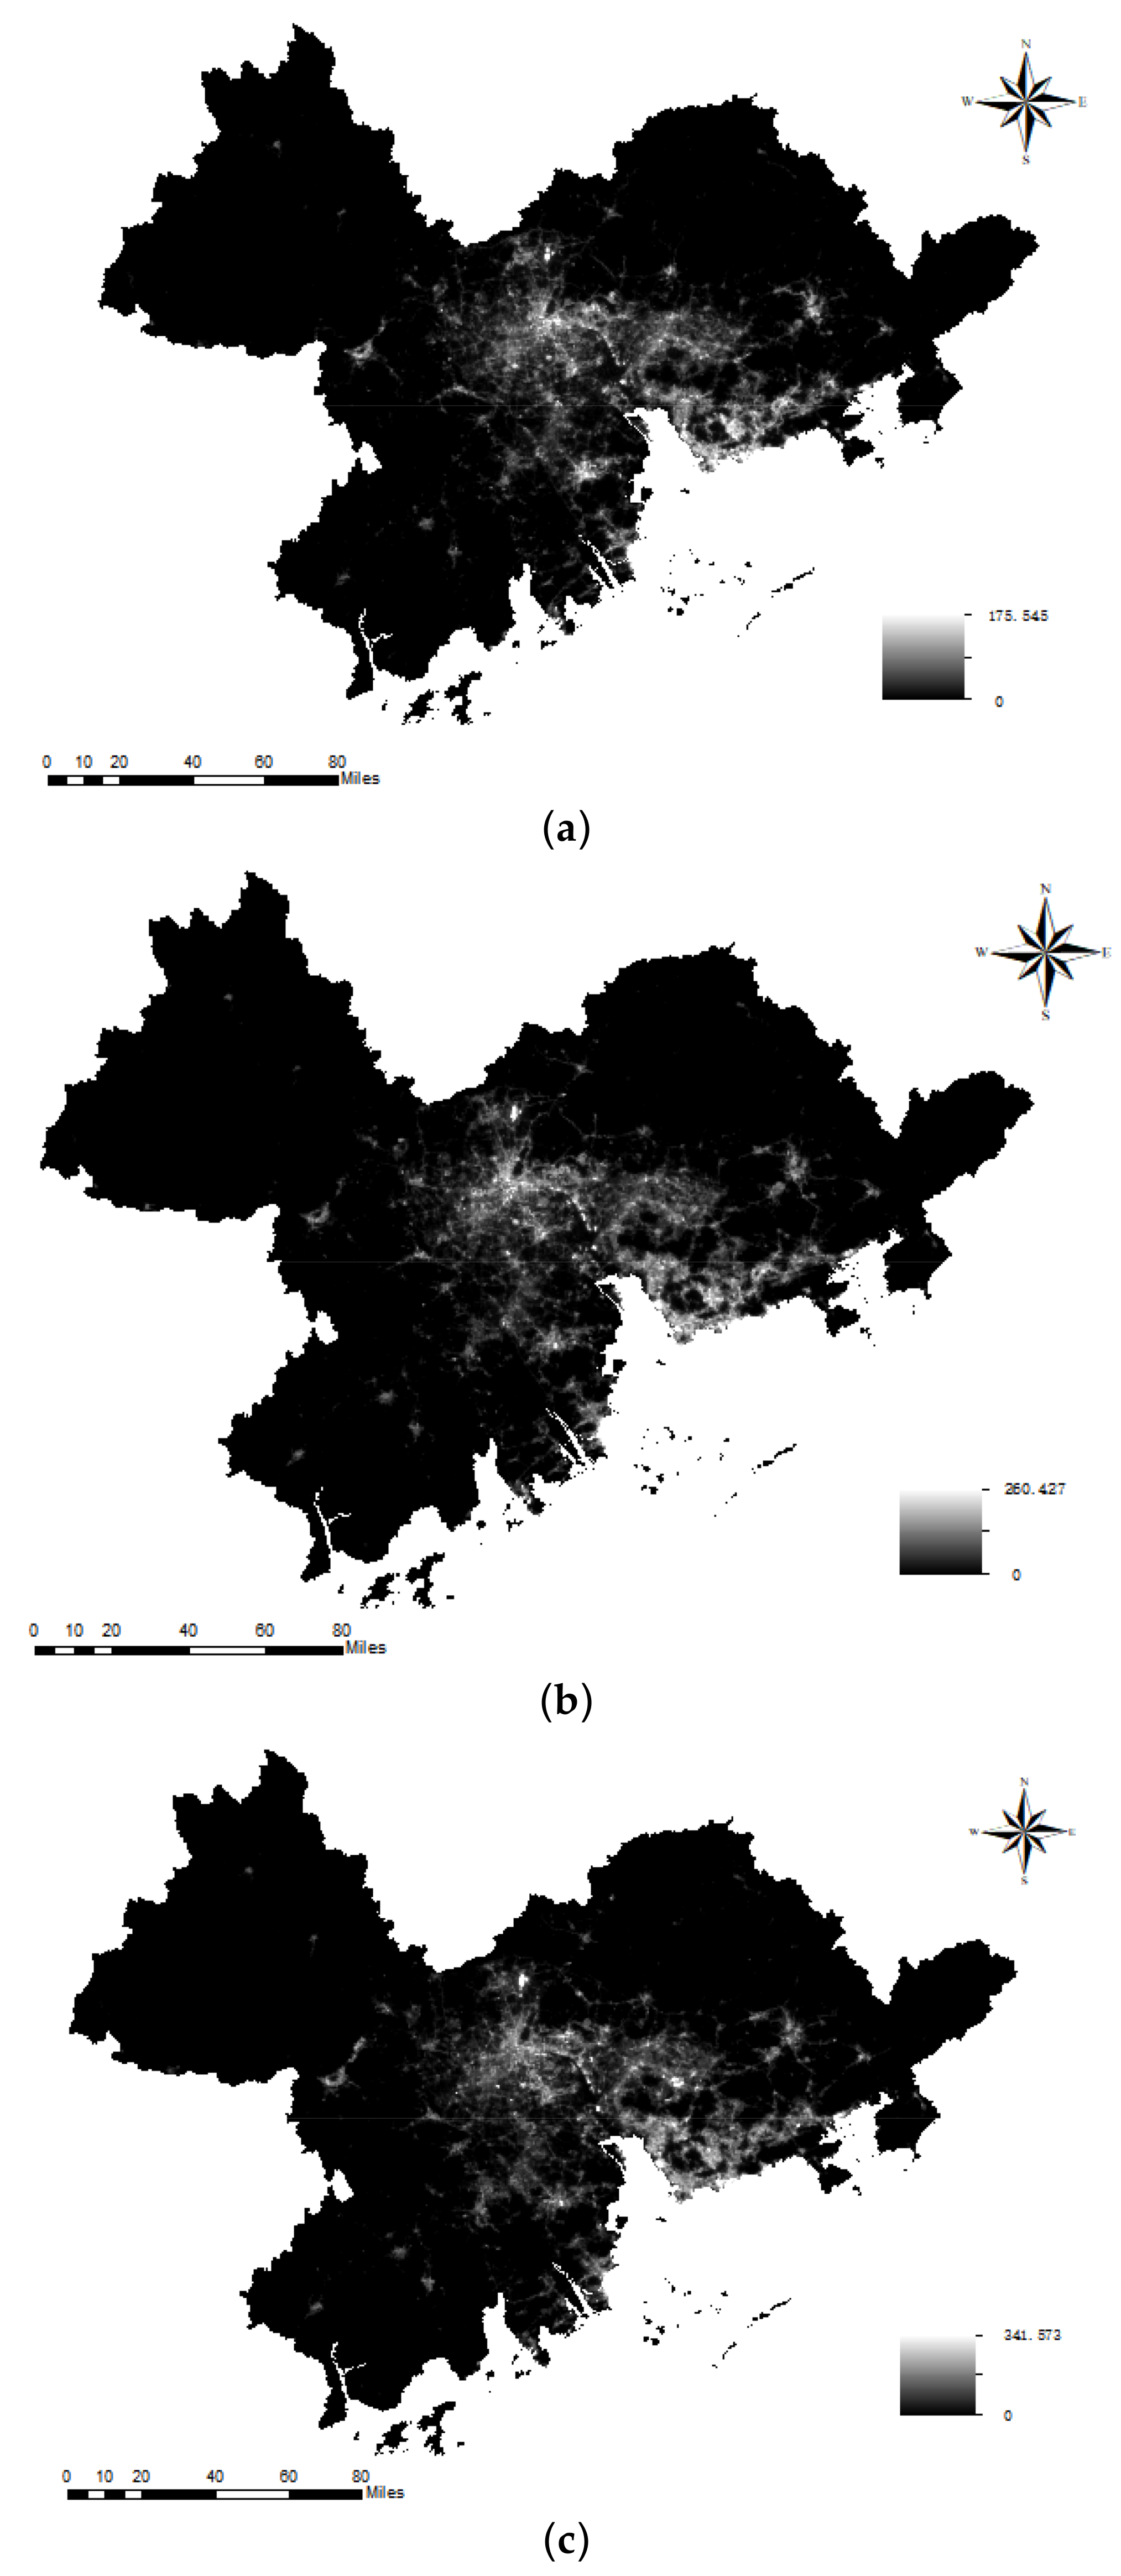
2.2.1. Night-Time Light Remote Sensing Images

The problems of lower spatial resolution and shorter radiometric detections in applying DMSP/OLS NTL data have led to attempts to use NPP-VIIRS NTL data ever since 2013 [25]. VIIRS performs very well in calibration and validation and can detect night-time lights spanning from 75° N to 65° S with the radiation from 3 nW·cm−2·sr−1 to 0.02 W·cm−2·sr−1 [26]. Suomi-NPP provides sensor data records, including data on clouds, sea surface temperature, and so [27]. Furthermore, the DNB (Day/Night Band) is a component of the VIIRS instrument onboard Suomi-NPP, which makes it possible to observe satellite night in the visible spectrum. As a new generation of night-time products, NPP-VIIRS enables scholars to collect daily, monthly and annual data from 2013 to 2019. Specifically, NPP-VIIRS NTL data of the PRD for the years 2013, 2016, and 2019 (see Figure 2) are collected in this study to track the changes in HVRs.
In this paper, the night-time light remote sensing images we used were downloaded from the National Oceanic and Atmospheric Administration (NOAA) (https://www.ngdc.noaa.gov/eog/viirs/download_dnb_composites.html, accessed on 3 September 2021) and are shown in Figure 2.

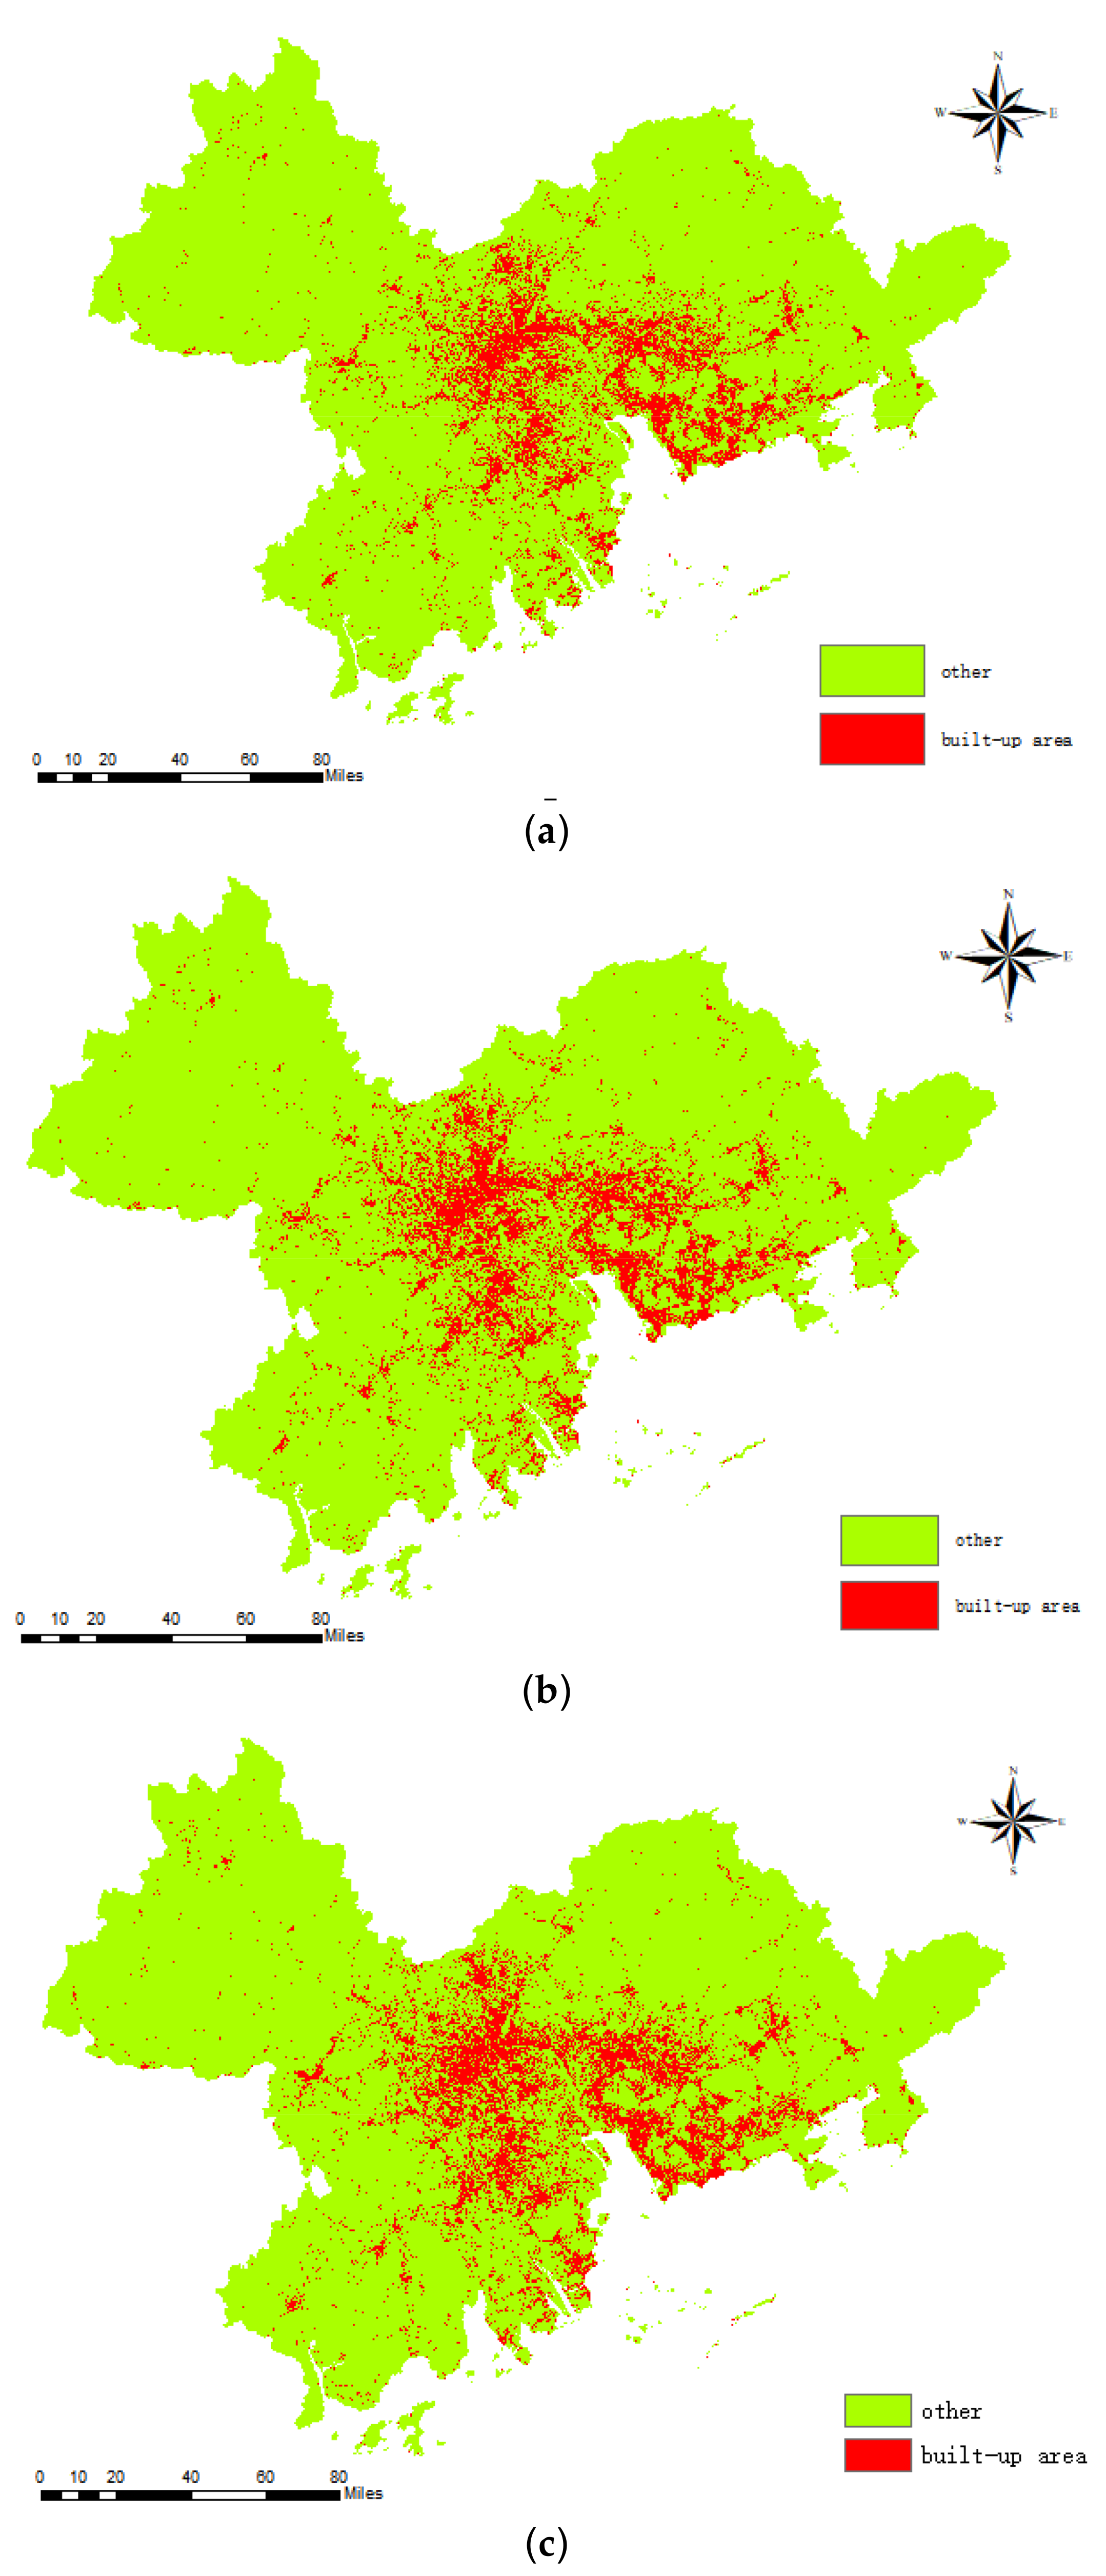
2.2.2. Urban Built-Up Area Data

The urban built-up area data are needed in this study to process NTL data. In this study, remote sensing images were obtained from Landsat 8 OLI to classify land in the PRD. The data set is provided by International Scientific & Technical Data Mirror Site, Computer Network Information Center, Chinese Academy of Sciences. (http://www.gscloud.cn, accessed on 3 September 2021) The Landsat 8 satellite payload consists of two science instruments—the operational land imager (OLI) and the thermal infrared sensor (TIRS). OLI is a push-broom sensor with a four-mirror telescope and 12-bit quantization capacity. It collects data for visible, near-infrared, and short-wave infrared spectral bands as well as panchromatic bands.

2.2.3. Housing Rent/Sale Data

By applying a Python web crawler, we obtained rent data from one of the key real-estate information platforms, namely Soufun (https://gz.fang.com/, accessed on 20 September 2019), for the city of Guangzhou (except Conghua, Zengcheng) as the case with which to verify the HVR estimation. The data obtained include the total number of housing units, the number of units on sale, and the number of units for rent in each real estate project. Statistical data of the sampled projects are shown in Table 1.

2.3. Data Processing
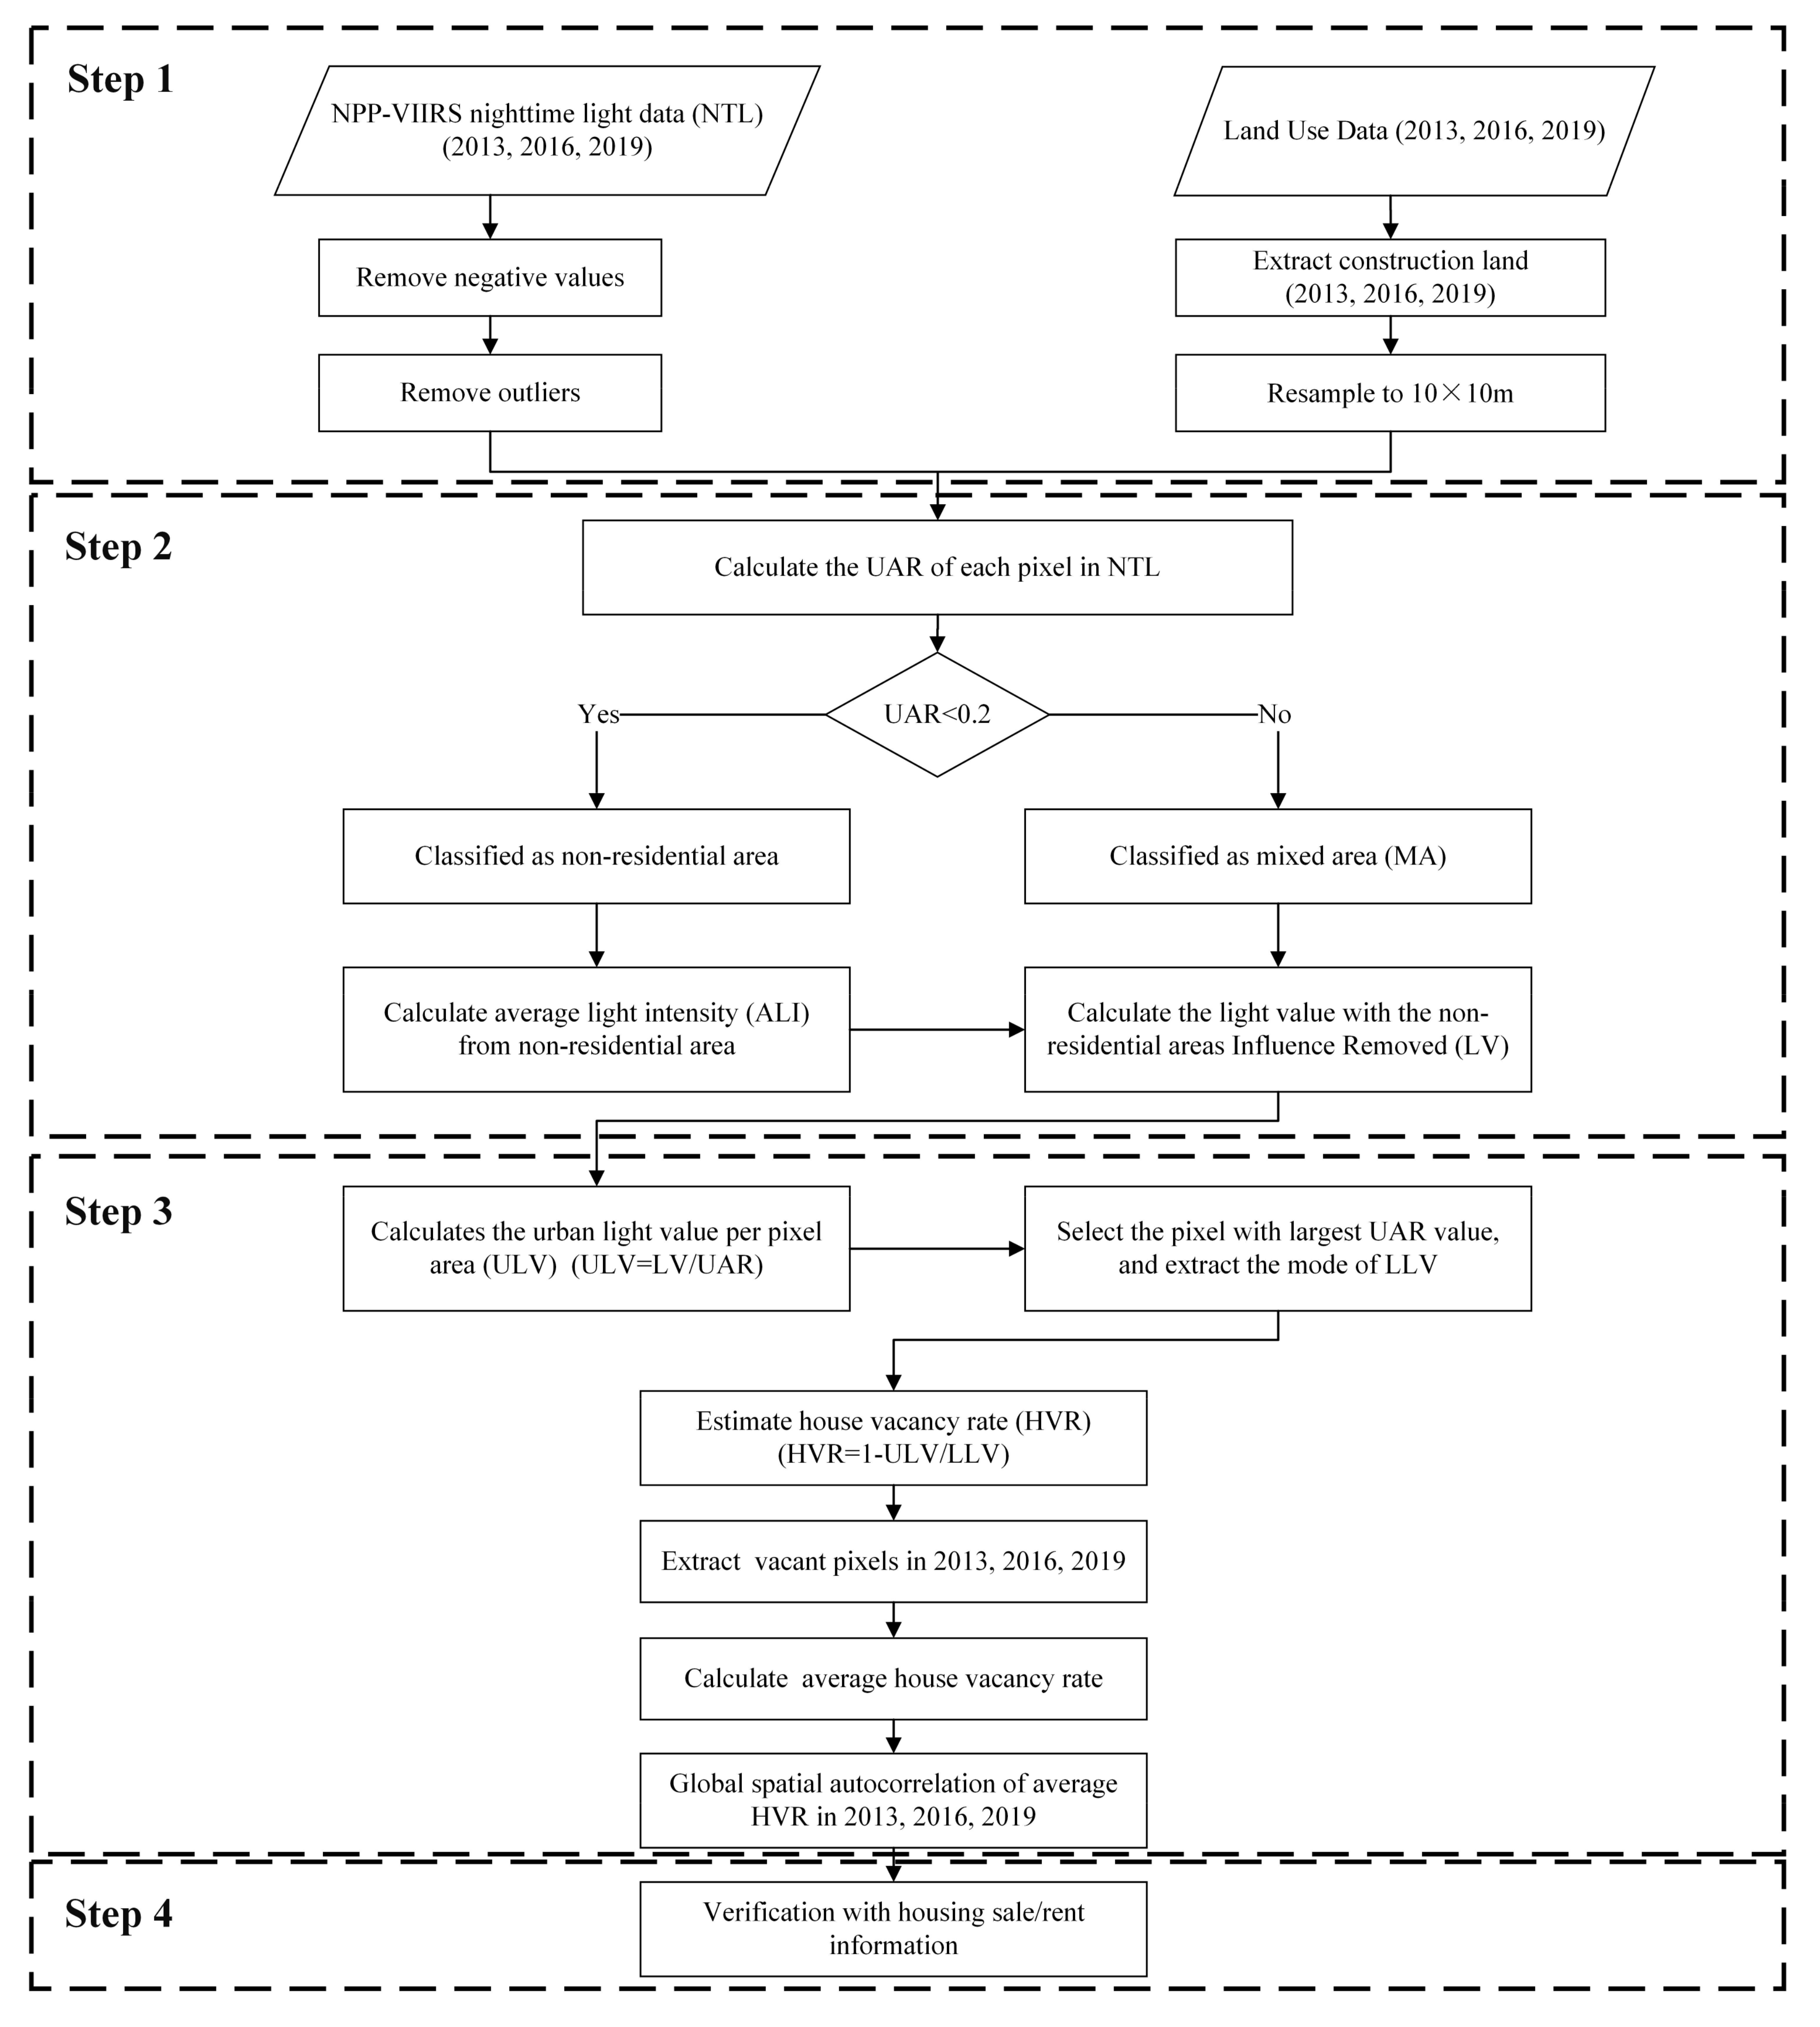
2.3.1. Workflow

The main process in this research can be divided into four main steps, as illustrated in Figure 3. Step 1 involves data pre-processing to gain each pixel’s urban area ratio (UAR). This includes denoising NTL data and resampling urban built-up area data. Step 2 calculates UAR and removes non-residential lights from the light value. With the light value of each NTL pixel, Step 3 derives the HVR of each pixel by comparing the estimated light value and the largest light value. Measures are also applied to evaluate the links between changes in HVRs in different districts. Finally, this study uses the housing rent/sale information to calculate the real HVRs and to verify the HVRs estimation, a task performed in Step 4.

2.3.2. Pre-Processing NTL Data

The noise influenced the NPP-VIIRS remote sensing images downloaded from NOAA, resulting in the image’s extreme value. Two steps were thus applied:
We removed negative values. The original night light data contained pixels with negative values. Due to the lack of metadata description, these negative values were considered to be background noise values generated during the data synthesis process. Therefore, existing studies were used to replace negative values with vacant or zero values [28]. Furthermore, according to the principle of the constant target area method, the total area covered by NTL was set to be the same for DMSP OLS and NPP-VIIRS data [16,25]. This study extracted values greater than 0 in the DMSP OLS night light data and assigned a value of 1 to generate a mask that multiplied with the NPP-VIIRS data in order to eliminate some abnormal values. To ensure the integrity of the data and later calculations, this study replaced the negative values in the NPP-VIIRS night light data and the NTL pixel value outside the mask of DMSP OLS positive values with zero values.
We removed outliers. There is a significant positive correlation between light radiation value and economic development. In short, higher GDP means a higher NTL value. In the PRD, Guangzhou and Shenzhen have the highest levels of economic activities. As such, the light value of city centers in Guangzhou and Shenzhen was extracted as the maximum value. If the NTL value of one pixel was larger than the maximum value, the following measures were be taken: the values of the surrounding eight adjacent pixels were collected, and the maximum value of these eight pixels replaced the abnormal value. If the adjacent eight pixels were all greater than the maximum value, this study rasterized the pixels until every pixel was smaller in value than the maximum value.
The denoised picture is shown in Figure 4.

2.3.3. Pre-Processing Landsat 8 OLI Data

Using the environment for visualizing images (ENVI) method, this study applies radiometric, topographic, and atmospheric corrections to avoid disturbances from clouds and atmosphere. Radiometric correction converted the digital value of each pixel in the image into surface reflectance, thereby removing photometric deviations in the image due to changes in the intensity of solar radiation. Topographic correction converted the image into a relatively highly consistent image of surface reflectance, removing topography-induced luminance bias. Atmospheric correction eliminated the influence of clouds, fog, smog, etc., in the atmosphere on the image in order to obtain more accurate surface reflectance. To achieve that, the FLAASH model was applied. It has the characteristics of simple input parameters and high output reflectance accuracy and is currently a commonly used atmospheric correction model. According to the time phase and geographic location of the Landsat 8 image data acquired in the study area, the mid-latitude summer (MLS) and urban aerosols were selected in the FLAASH model. The support vector machine (SVM) method was applied to separate construction land, water area, green field, and cultivated land according to the national standard for land classifications. SVM is a binary classification model and has been widely used in land-use information extraction [29]. As one of the most popular supervised classification methods [26], SVM performs best since it can not only solve the nonlinear and high dimensional data classification problem [30], but can also achieve better performance based on the use of fewer training samples [31]. This study used ENVI’s ROI tool to extract the image information of various types of land from the image, and we chose 30–40 small triangle areas for each type of land used to compose the training set. Detailed information about sample selection is shown in Table 2. Subsequently, the SVM model was trained with the training set. The radial basis function (RBF) was applied for the parameter setting of SVM with the gamma parameter as 0.250, the penalty parameter as 100 and the probability parameter as default. Using other night light images not involved in training as verification data, the ENVI calculated the accuracy and error of the model. The result of the extraction had an overall accuracy of 0.93 and a Kappa value of 0.91.
We regard construction land as a built-up area and water area, green fields, and cultivated land as constituting other categories of land use. The classified outcomes can be obtained and divided into two parts, the built-up area and the other area, based on the Bayes classification method, which classifies the remote sensing image. The urban built-up areas of the PRD for 2013, 2016, and 2019 have been extracted and shown in Figure 5.

2.3.4. Removing Non-Residential Lights

The light shown in the remote sensing images includes the light from the residential area and the non-residential area, such as roads and factories [18]. To obtain more accurate data, additional measures were taken to remove non-residential lights for mixed lights dominated pixels. Two steps were applied:
(1) We evaluated the urban build-up area rate (UAR). Existing studies revealed a high correlation between the urban build-up area and night lights [32]. The urban built-up area rate (UAR) could thus be used to divide data into residential and non-residential NTL pixels. Because the spatial resolution of an NTL pixel was 500 × 500 m and the spatial resolution of a land-use pixel was 30 × 30 m, the land-use images were resampled to 10 × 10 m and then superimposed with the 500 × 500 m night light data. Therefore, a night light pixel could contain up to 2500 land-use pixels. The UAR was obtained at an NTL pixel level with Formula (1).
UAR i = N i N light
In the Formula (1), U A R i represents the ratio of built-up area in one NTL pixel; N i refers to the number of construction land pixels contained in the i-th pixel; and N l i g h t refers to the number of land-use pixels in an NTL pixel, which is 2500 in this study.
(2) We removed non-residential lights. An NTL pixel included the continuous built-up area and areas outside the built-up area. Roads and factories also had the ability to produce background light for such areas and were always included in the total NTL [18]. In order to obtain more accurate data, the impact of the background lights had to be removed. Zhou [33] proved that a UAR equaling 20% could be regarded as the watershed of resident and non-resident pixels. If the UAR was less than 20%, the NTL image mainly consisted of background lights. In this study, pixels with a UAR of more than 0.2 were labeled as residential pixels, and the light value of residential pixels was recorded as the housing light of that pixel. The pixels with UAR less than 0.2 were labeled as non-residential pixels and removed.

2.4. House Vacancy Rate Estimation

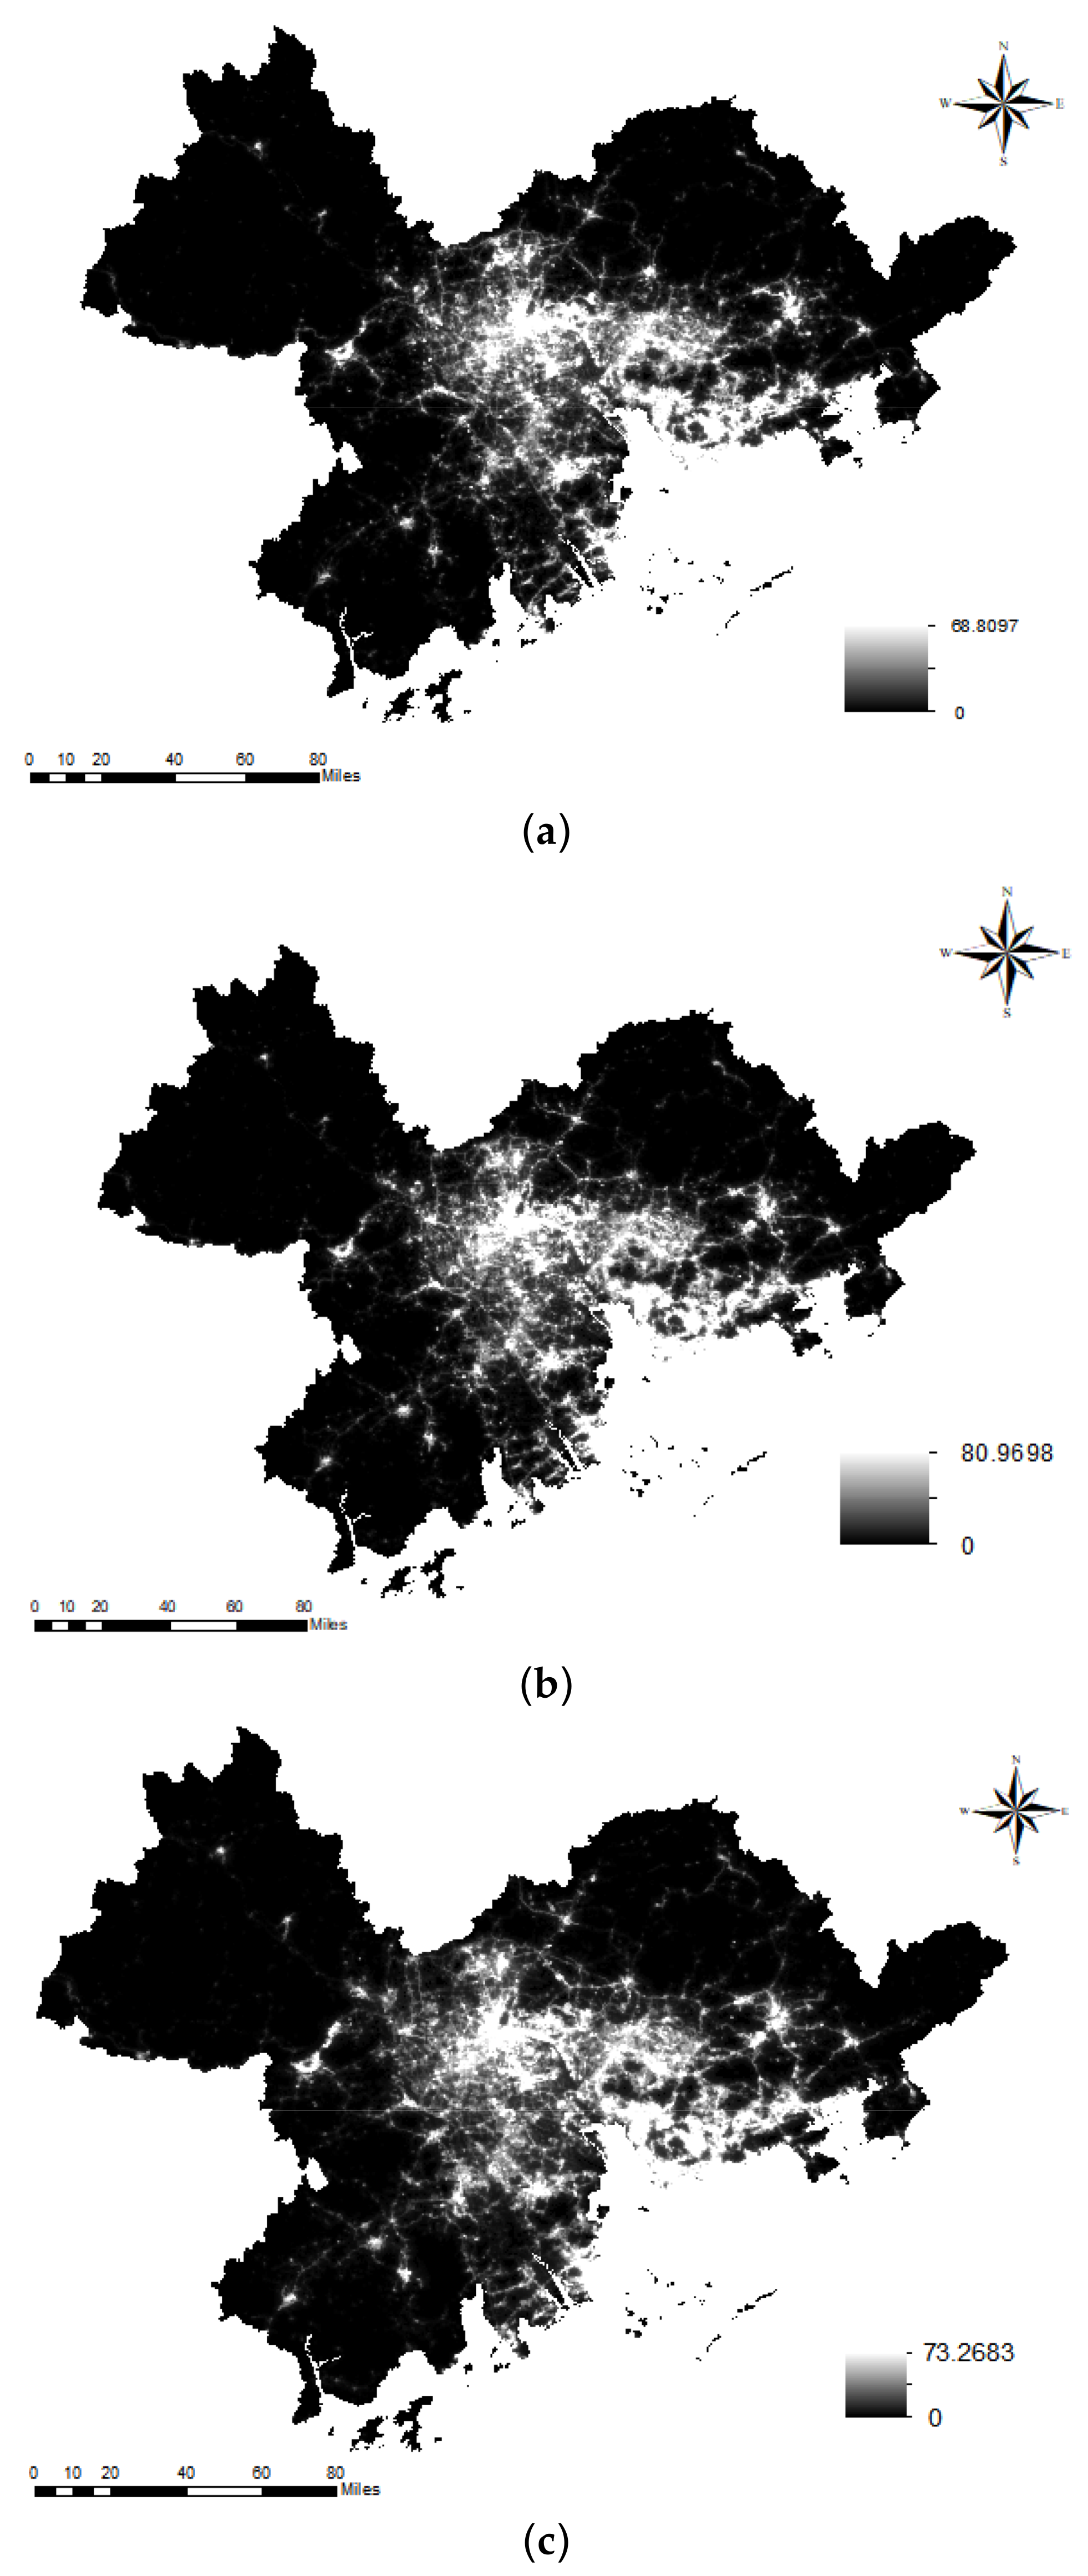
2.4.1. Estimating Light Intensity in the Urban Built-Up Area

Considering that the light of an NTL pixel comes from the built-up area, the light intensity of the built-up area within a pixel should be used for analysis. After obtaining the housing light of each resident pixel, the light housing value in the city at the pixel level can be easily calculated by a ratio shown in Formula (2).
ULV i = LV res i UAR i
In the Formula (2), U L V i means the light value on the built-up area at a pixel level, and L V r e s i represents the light value without the non-residential influence.

2.4.2. Estimating HVR
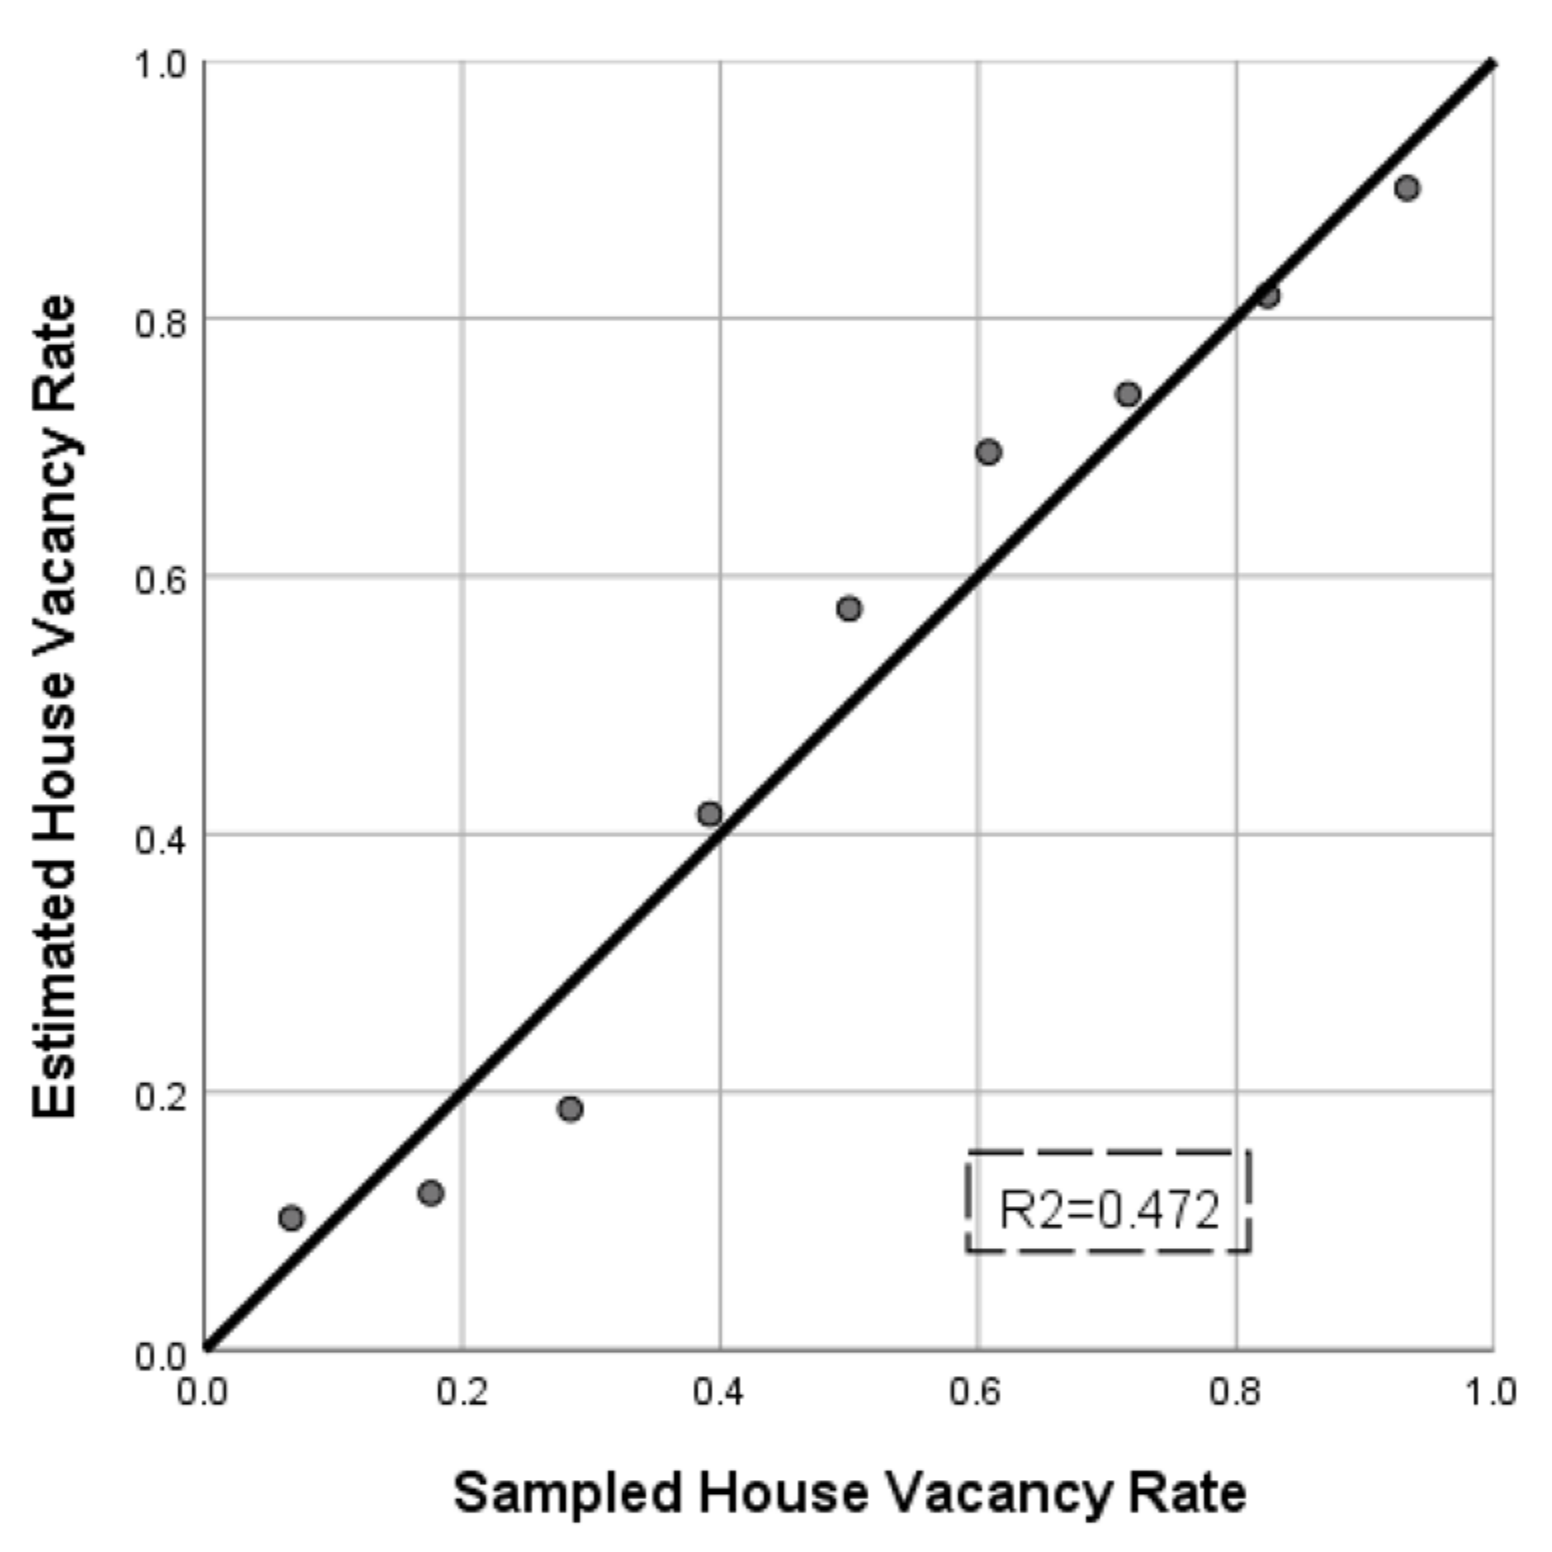
Following the conclusion made by Chen et al. [18], this study regarded the largest light value in a district as the light value for full occupation. The HVR of a district was calculated according to Formula (3).
HVR i = 1 ULV res i LLV m
In Formula (3), HVRi is the house vacancy rate at a pixel level, U L V r e s i means the light value of the built-up area in i-th pixel. L L V m is the largest light value of urban built-up areas in the m-th district. Here, LLV is defined as most of the NTL of the pixels with the highest UAR. According to the “Code for classification of urban land use and planning standards of development land in China” (GB 50137-2011), residential land occupies the largest share of urban land. Therefore, it was reasonable to assume that most of the pixels with the highest UAR represented the largest light value that the residential land use could generate.

2.5. Verification

There are two commonly used methods for accuracy verification: one is to compare the estimated value with the actual measured value [18]; the other is to compare the estimated result with the results obtained by others in the same area using other methods [34]. Unfortunately, none of these data are available for Chinese cities. As an alternative, this study used the ratio of the number of housing units on sale or for rent to the total number of housing units in one district to characterize the housing vacancy level in the district. The sample HVR could thus be calculated with Formula (4).
HVR i = VHN i WSH i × 100 %
In the Formula (4), HVRi refers to the ith district’s house vacancy rate, VHNi means the number of vacant housing units (housing units on sale or for rent) in ith district and WSHi is the total number of housing units in ith district. From this formula, we can obtain the sampled HVR in each district.
This study selected Guangzhou in the Pearl River Delta region in 2019 as the verification area. As shown in Table 3, the overall estimated HVRs were greater than the sampled HVRs. This may partially due to the fact that lights from commercial and business activities impact HVR in the way that they may set a higher “fully occupied light” as commercial lights always have a greater than the residential ones at night. If a pixel occupied by commercial use is set as the standard of “fully occupied pixel”, HVRs of all other pixels may be overestimated due to the increase in the denominator of the Formula (4). Although choosing the majority of the pixels with the highest UAR as the largest light value that the residential land use could generate partially reduces the impact of commercial lights on HVR estimation, the overall results are still larger than those of the real ones.
However, whether estimated HVRs can be used to identify dynamic changes in HVR depends more on the correlation between the estimates and the sample HVR. A linear regression was employed to explore the relationship between the sampled HVR and the estimated HVR. As shown in Figure 6, the coefficient of determination (R2) value was 0.472. This demonstrates that there existed a relatively strong relationship between the sampled HVR and the estimated HVR. The results showed that the F value is 6.258, the T value is 6.442 and the p value is 0.041. That is to say, the p value is lower than 0.05. These indexes all showed that the sampled HVR was strongly related with the estimated HVR and that this linear regression was influential and significant.
Following Formula (5), we also employed the normalized RMSE (root mean square error) to find the difference between the statistical HVR and the estimated HVR. The result was 4.9%. That is to say, the method we used to evaluate HVR was comparatively reliable and accurate. The effectiveness was thus verified.
RMSE = 1 N t = 1 N ( sampled estimated ) 2
In Formula (5), N is the number of the sampled cities; sampled means is the sampled HVR and estimated means is the estimated HVR.

3. Results

3.1. Overall Decreasing HVRs in the PRD

We have depicted the mapped HVR distribution in Figure 7 using color ranges from green (0–0.2) to red (0.8–1). The estimated HVR of the PRD decreased from 0.3877 in 2013 to 0.3637 and 0.355 in 2019. Because the light produced by manufacturers that remain working at night—with this being a quite common practice for manufactories in the PRD—was also included in the night light category, the large proportion of manufactural land in the PRD might cause a higher HVR to be registered for these than their actual one. It is worth observing the change in HVRs here. An increasing proportion of pixels with a healthy housing vacancy situation (HVR < 20%) can be witnessed in Figure 7, increasing from 42% in 2013 to 43.68% and 44.94% in 2019. Moreover, the increase in pixels with a healthy housing vacancy situation occurs much faster than the increase in total pixels, with a UAR larger than 20%. The proportion of pixels with a healthy housing vacancy situation increased by 9% from 2013 to 2016 and 8% from 2016 to 2019, while the proportion of construction land (pixels with UAR larger than 20%) increased by only 5% for each period.

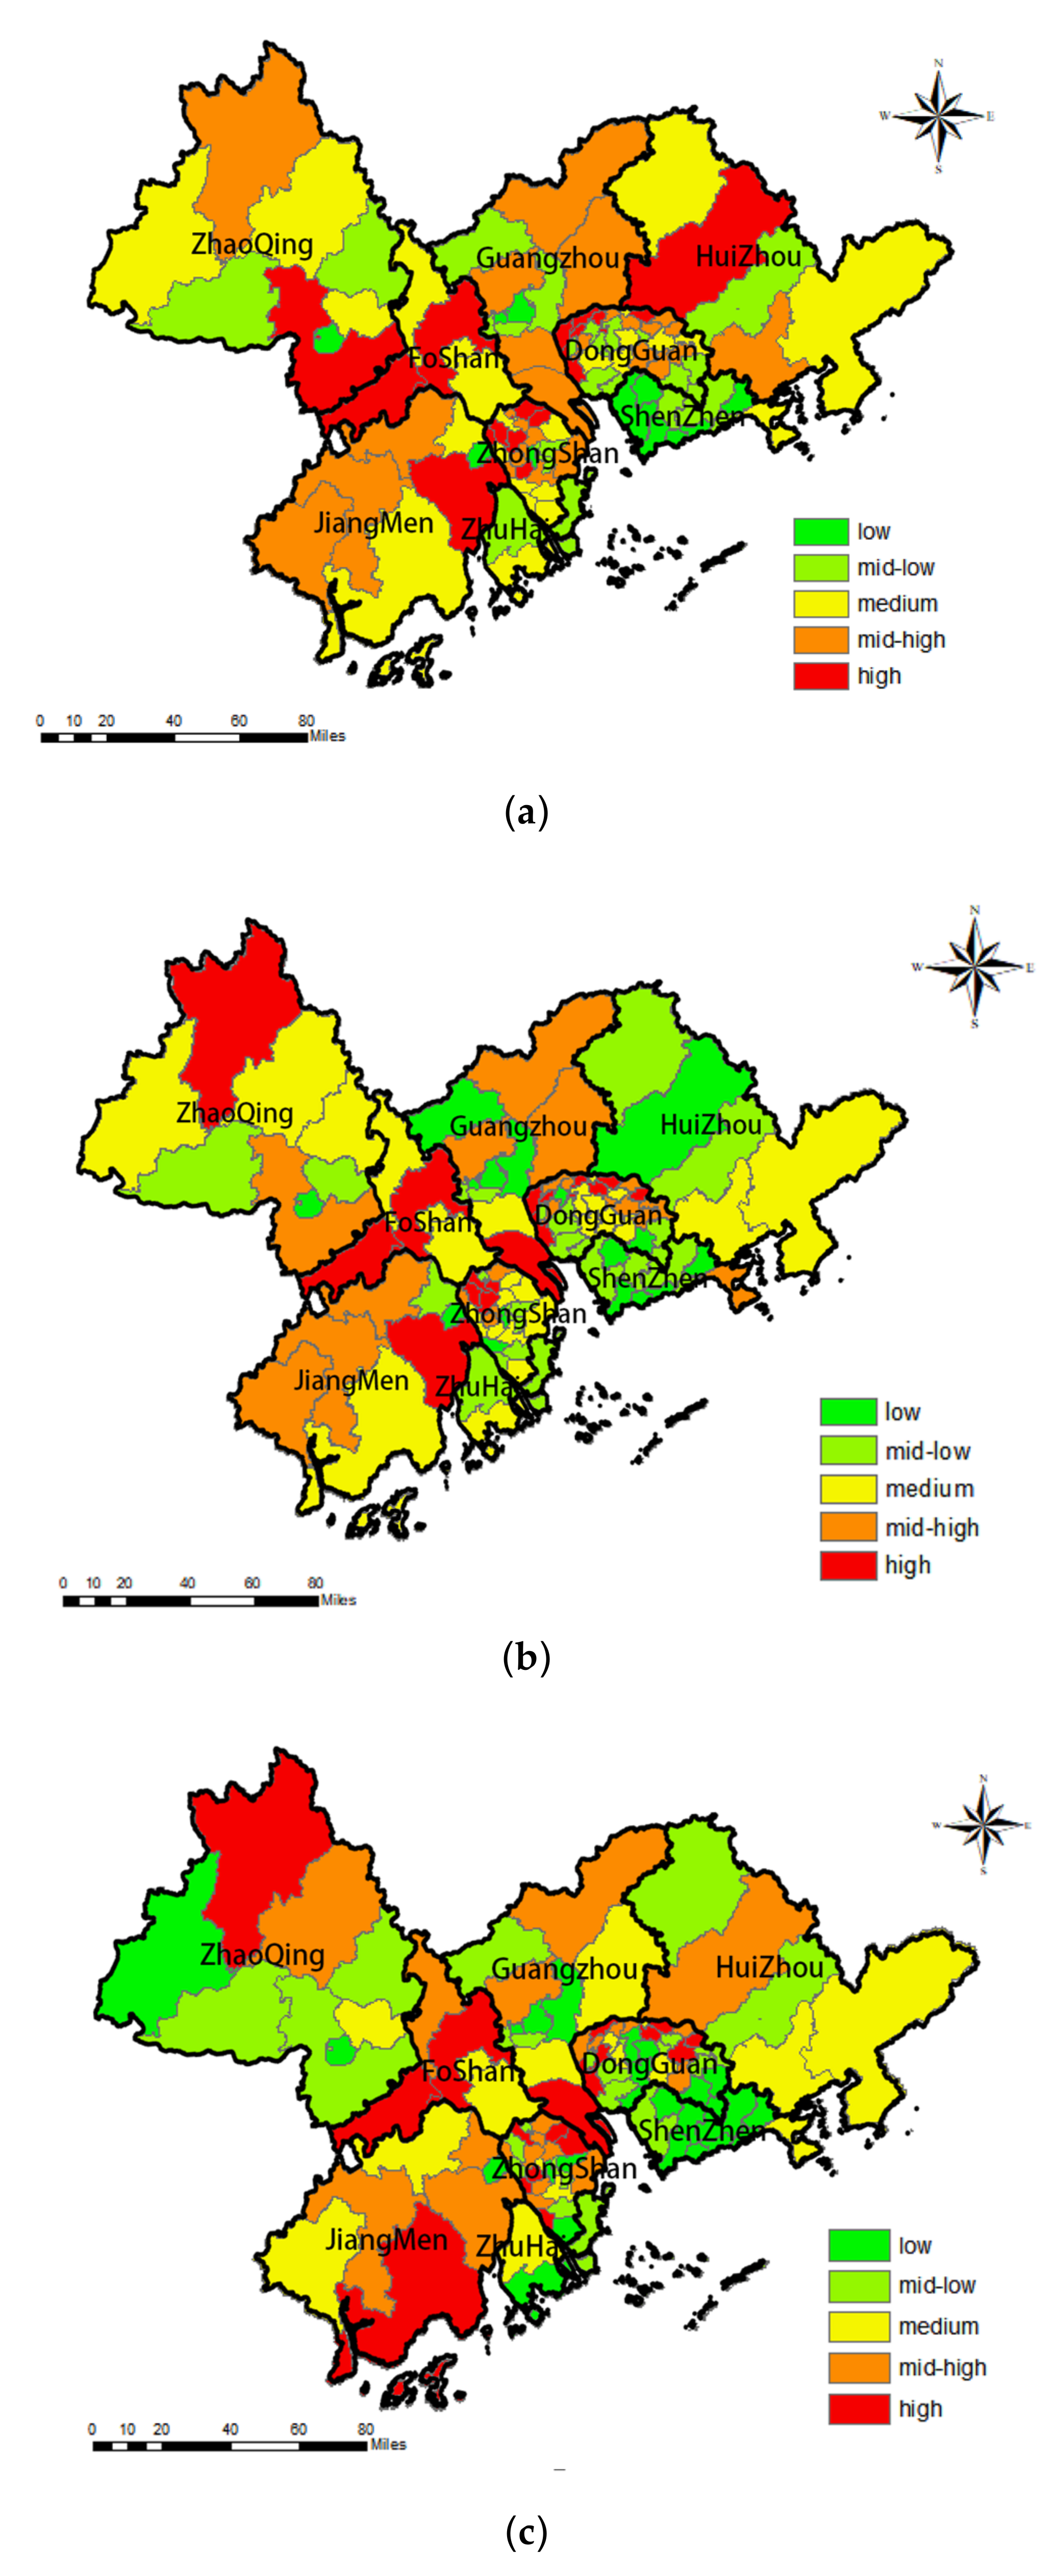
3.2. Dynamics of HVRs at the District Scale

Looking into the PRD, HVRs have never been evenly distributed. As shown in Figure 8, we separated the districts into five groups: low, mid–low, medium, mid–high, and high. We performed this by calculating and dividing the average HVRs of all districts. The cities located west of the Pearl River Estuary had more districts with high HVRs. Especially in the cities of Jiangmen and Zhongshan, the HVRs in most districts continued rising in these 6 years studied. Together with the completion of the Humen Bridge in 1997 which linked the west and east banks of the Pearl River Estuary, the real estate market believed that citizens in rich east bank cities such as Dongguan and Shenzhen would invest and even inhabit in the west bank. This resulted in the development for irrational speculation in west bank cities. Speculation could at times also focus on one district in a city. For example, the housing vacancy situations in the city of Zhaoqing were found to be relatively healthy. The exception was the District of Huaiji, with this indicating an oversupply of real estate in this isolated county compared with its limited population. Similarly, the HVR of Boluo County in Huizhou increased dramatically from 2016 to 2019, from 0.16 to 0.43. This may be due to the speculation incentives stemming from the spillover of housing needs in Shenzhen and Dongguan.

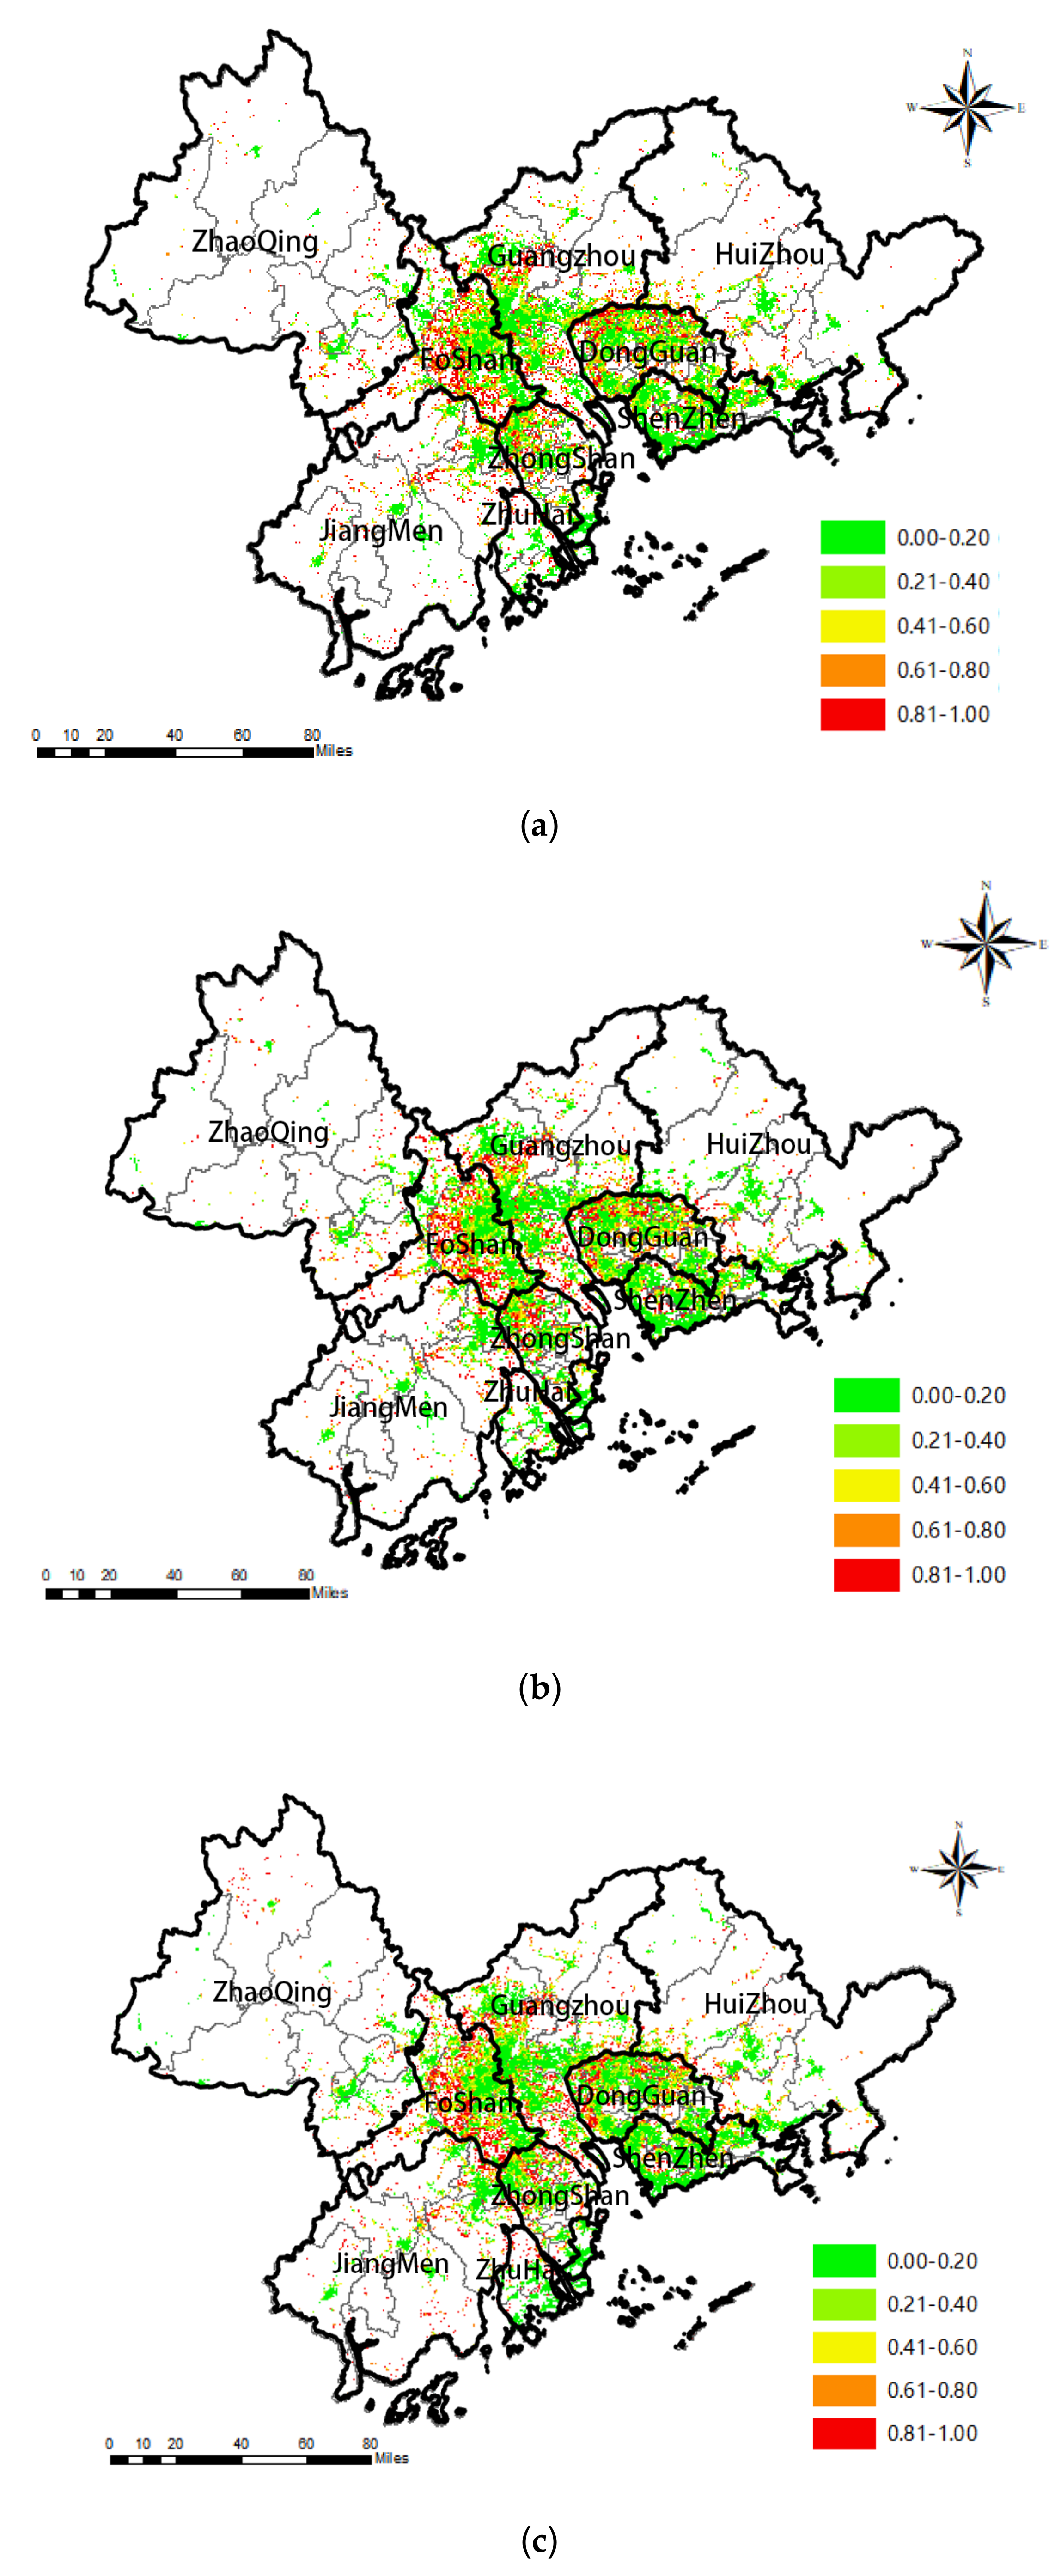
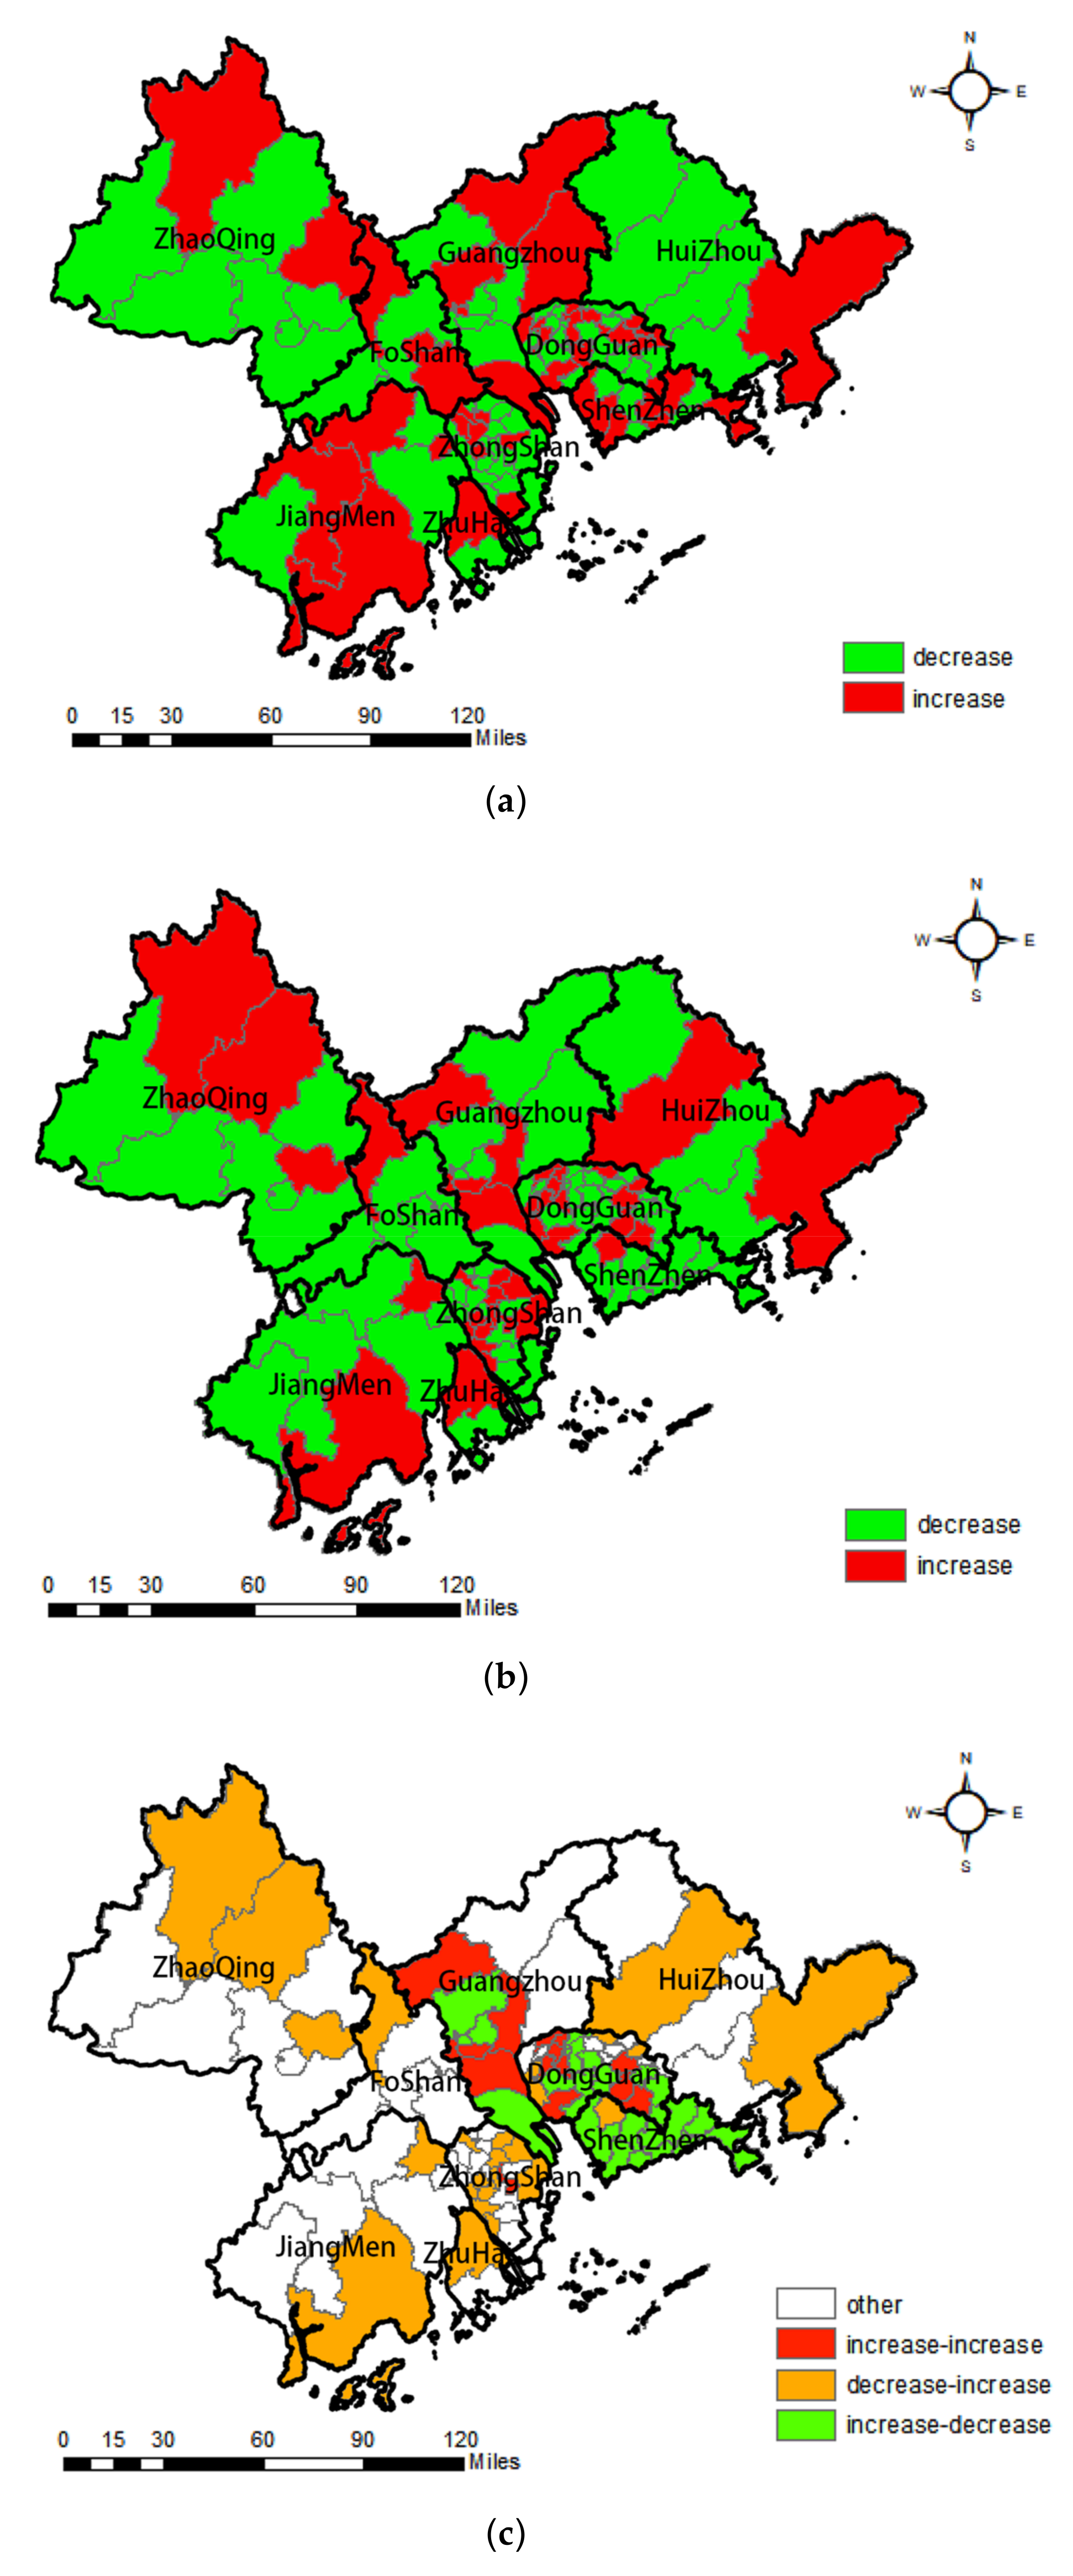
3.3. Spatial Differentiation of HVRs Changes

Most cities experienced reduced HVRs in these 6 years (Table 4). In 2016, the HVRs of 64 districts were reduced compared with HVRs in 2013, and the number of districts in these circumstances increased to 71 in 2019. As shown in Figure 9, the central area of the PRD—including Shenzhen, Dongguan, and Guangzhou—experienced a reduction of HVRs to a greater extent. Such areas enjoyed better economic activities and were found to have attracted many migrants in the past three decades. With limited available vacant land for new construction, the increasing inflow of population to the central area of the PRD supported denser development and increasing population density in this area. Even for the areas that experienced the 2015 real estate bubble, HVRs reduced after 2016. Nansha District of Guangzhou seemed to be an abnormal case in the central area of the PRD and possessed a high HVR (50%). The development of Nansha Port since 2008 also stimulated real estate development in Nansha District. However, the lack of public amenities and employment chances prevented people from living in Nansha.

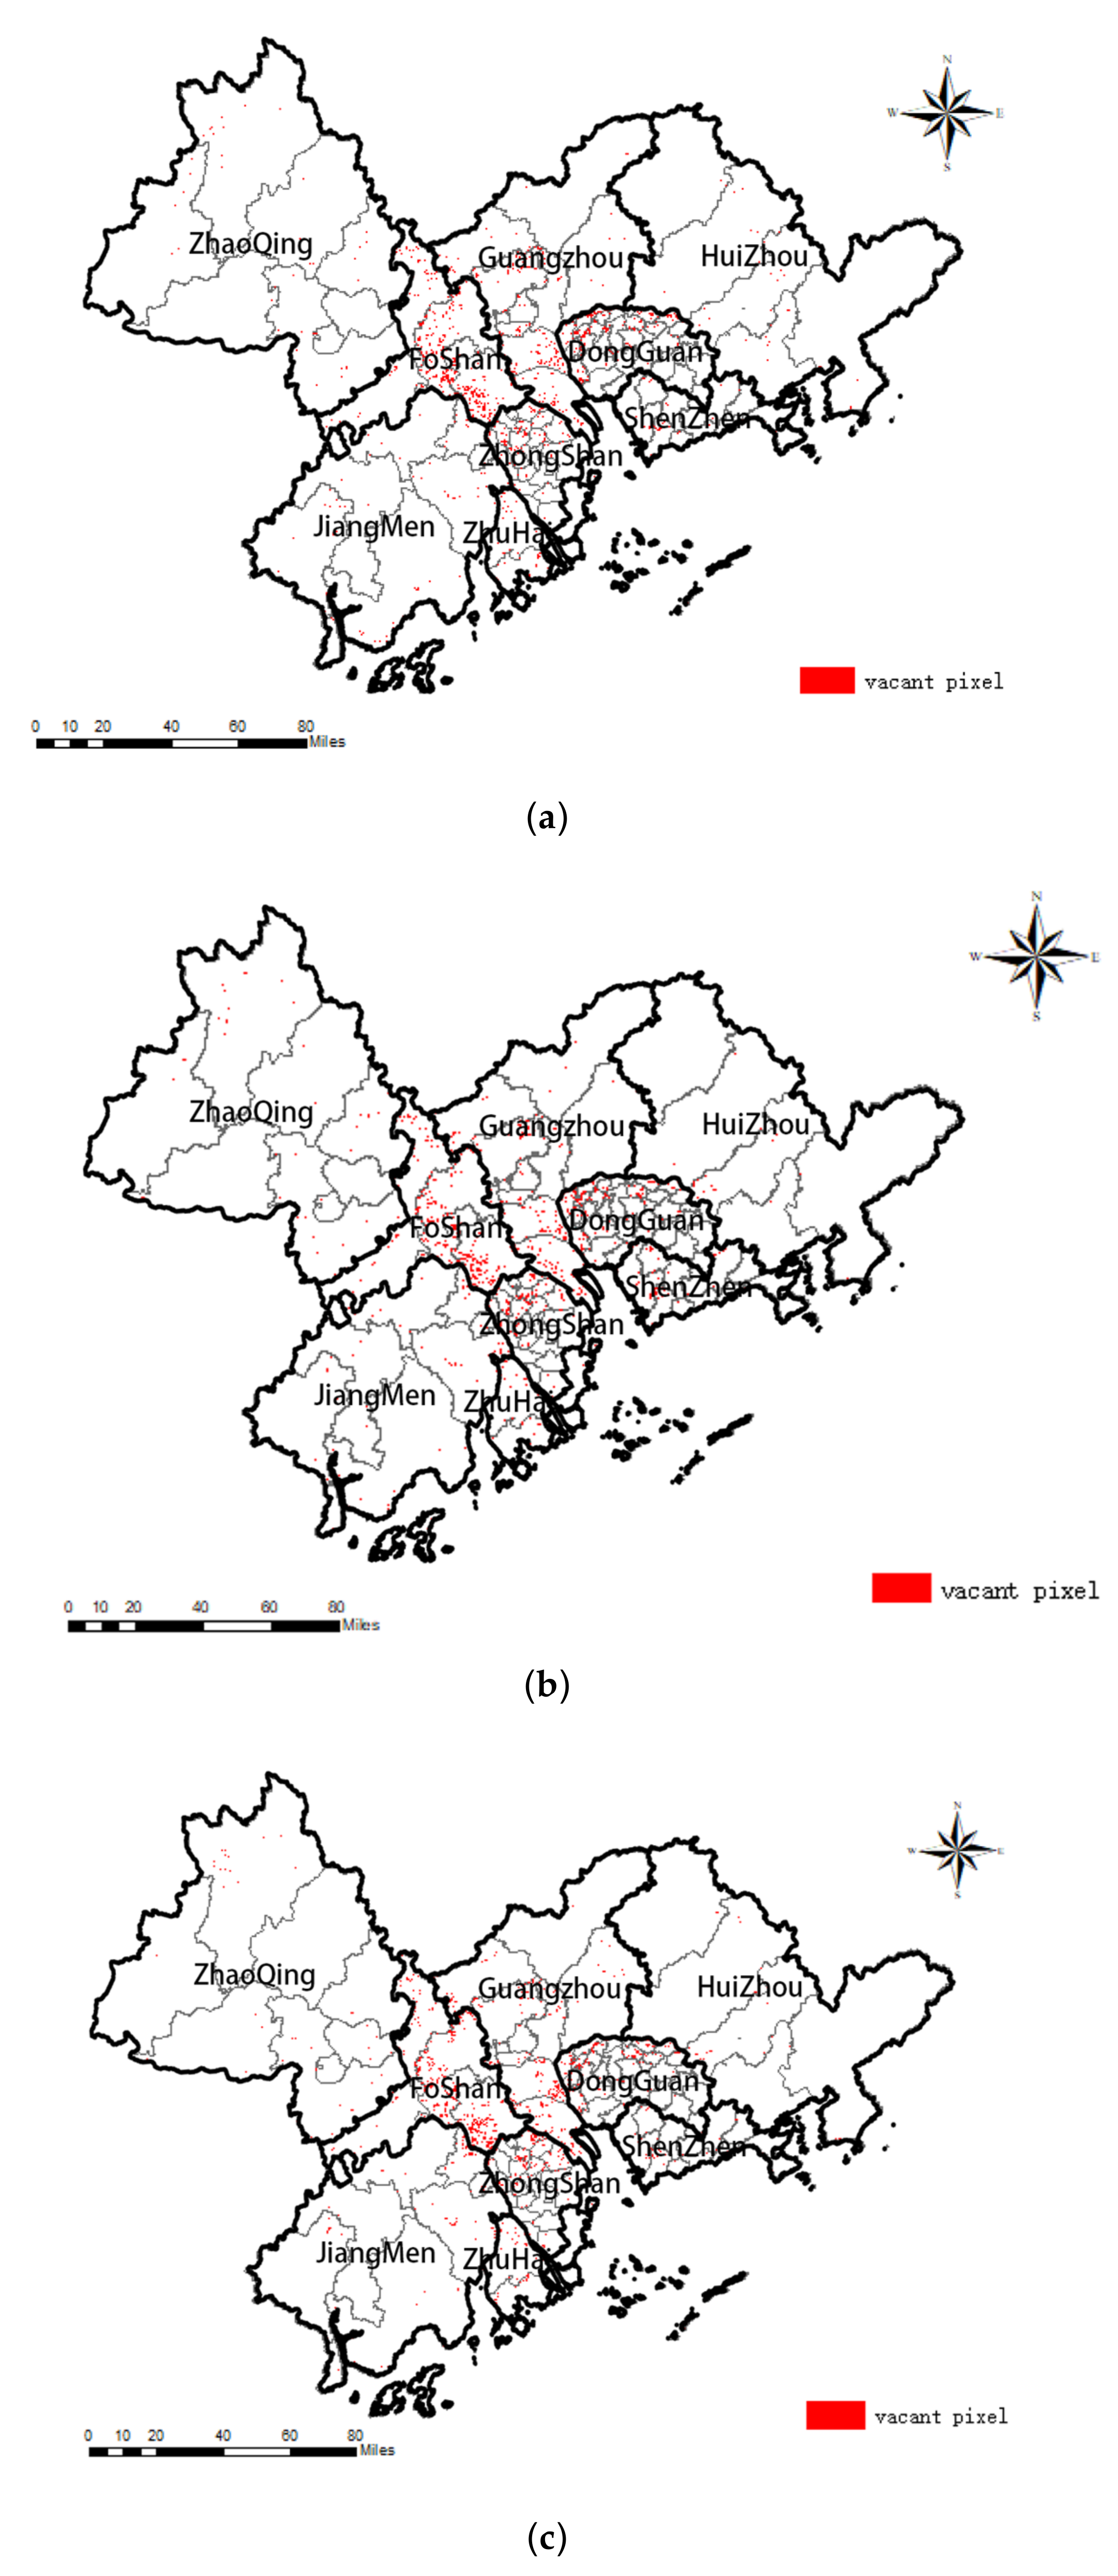
3.4. Potential Risk: Increasing Vacant Pixels in the PRD

This study has paid more attention to the NTL pixels with UAR of more than 20% but which possessed a light value lower than the background light and extracted them, as shown in Table 5 and Figure 10. Such pixels could be recognized as vacant pixels where there was development, but there are almost no inhabitants in the buildings provided in those pixels. Considering the NTL pixels’ scale, vacant pixels could result from new projects under construction or increasing rates of development for investment purposes instead of residence. The number of vacant pixels increased from 2980 to 3031 in 2016 to 3076 in 2019. Of all 105 districts, 52 districts have witnessed increasing vacant pixels from 2013 to 2016, and 46 districts had increasing vacant pixels in 2019 compared with the situation in 2016. As occurred in Shenzhen and Dongguan, sometimes, vacant pixels—an oversupply of new projects—were automatically filled by the inflowing population and increasing housing needs. They both experienced reduced numbers of vacant pixels. Respectively, the number was 58 in Shenzhen and 67 in Dongguan. However, most cities had more vacant pixels in 2019 than in 2016, especially those on the outskirts of the PRD. This warns us about the risk of the use of tremendous development to increase the supply of housing units in the PRD that may increase HVRs.

4. Discussion and Conclusions

Cities are interconnected through spatial interactions and are merged into closely related urban network systems [4]. This strengthens the functional connection between cities and enhances the resource-gathering capacity of a continuous urban region, but there may be differentiation and mutual negative impacts within continuous urban regions. The dynamics of HVR distribution, as an important index of housing oversupply or real estate speculation, may have applications to monitoring unbalanced development within the continuous urban region and are worth in-depth study. Especially in China, the local governments have proved their powerful influence on defining urban development and have caused a remarkable scale of uneven development across and within cities.
Monitoring HVR has long been hampered by the difficulty of collecting housing vacancy information via traditional methods. By the mixed use of various big data, NTL data has shown its effectiveness in HVR estimation at the city level [18,19,20,21,22]. The research carried out by Chen et al. [18] has demonstrated the effectiveness of using NTL data to estimate HVR at the city level. In this study, we applied both NPP-VIIRS NTL data and Landsat 8 OLT images to estimate HVRs in the PRD at the district level, and tracked the spatial–temporal dynamics of HVR distributions to evaluate the interaction of urban development across cities for the period from 2013 to 2019. The study of district-level HVRs is theoretically significant for studying the dynamics of HVR distribution in a continuous urban region as it shows the areas of interaction between cities more precisely. With the monitoring of unbalanced regional development as the target, the most critical issue here is not the accuracy of the vacancy situation of housing units, but the judgment of the overall vacancy rate status and dynamics throughout a continuous urban region. In this assessment, districts operate as the units.
To get rid of the noise in original images, NTL data are first denoised. The urban built-up areas are then extracted based on Landsat 8 OLT images; then, light intensity is calculated at a pixel level for residential areas. The HVR of a district was thus calculated according to the comparison between the light value of each pixel and the higher light value in a district (the majority of the NTL of the pixels with the highest UAR). Furthermore, this study uses the ratio of the number of housing units on sale or for rent to the total number of housing units in one district to characterize the housing vacancy level in the district, and compares it with the estimated HVRs. The comparison between the sampled HVRs and estimated HVRs verifies the estimated HVRs’ effectiveness in identifying dynamic changes in HVRs.
Due to the large proportion of manufactural land in the PRD, high HVRs observed in the PRD do not necessarily indicate a high-risk market. This study has paid more attention to the change in and distribution of HVRs in the PRD. Overall decreasing HVRs in the PRD is proved by a faster decrease in rate of HVRs than the rate of increase in construction land. However, such changes are not evenly distributed throughout the PRD. Housing investment speculation mainly focuses on cities located west of the Pearl River Estuary, such as Jiangmen and Zhongshan, and some isolated districts in other cities, such as the District of Huaiji in Zhaoqing, the District of Nansha in Guangzhou, and the County of Boluo in Huizhou. The global Moran’s I index indicates a positive and increasing correlation of the HVRs between different districts. This study also calculates the distribution of vacant pixels to indicate the increasing levels of development for speculation purposes instead of residence. Increasing levels vacant pixels in cities other than Shenzhen and Dongguan point out the risk that the tremendous development might increase the future stock of housing units in the PRD and cause larger housing vacancy problems.
In broader theoretical terms, the preceding methodological and empirical discussion in this article reflects an attempt to contribute to, and advocate for, estimating and tracking the dynamics of the HVR distribution in a continuous urban region with the use of open access data. It allows for the close and timely monitoring of the housing vacation situation in the region and may be applied as a very important tool to correct wrong development decisions and promote balanced regional development. In areas where real estate resale and rental markets are well developed and online information is abundant, HVRs can also be approximated with other methods, such as the one employed in this study to verify the results. In these methods, researchers may calculate the ratio of the number of housing units on sale or for rent to the total number of housing units. However, for a wider area in which online rental and sales information are unavailable, it is more economical and efficient to use free NTL data. This also allows for HVR comparisons over larger regions to support the analysis of uneven development and local policy adjustments.
This research proves that the HVRs at the district scale can be estimated through NPP-VIIRS night-time light data, and that the results could represent the dynamics of HVR distribution well. However, the method is not precise enough to give detailed HVRs, and there could be further improved for future studies. First, more precise data, such as Jilin-1 (0.9 m) and EROS-B (0.7 m), could offer better results in HVR estimation. Second, the use of advanced deep learning-driven super-resolution mapping techniques [35,36] could also help to improve the accuracy of the estimation. With more available data about real HVRs, the verification process could be further improved. Spatial analysis, such as the global Moran’I index or the spatial Dubin model for spatial autocorrelation analysis, could help to reveal the logic behind HVR distribution.

Author Contributions

Conceptualization, X.L. and W.Z.; methodology, Z.L., X.F. and W.Z.; software, Z.Y. and M.L.; validation, X.L., L.Y. and W.Z.; formal analysis, Z.L. and X.L.; data curation, Z.L. and X.L.; writing—original draft preparation, X.L.; writing—review and editing, Z.Y. and W.Z.; visualization, M.L.; supervision, W.Z.; project administration, W.Z.; funding acquisition, X.L. and W.Z. All authors have read and agreed to the published version of the manuscript.

Funding

This research was funded by UESTC Funds for Important Social Science Research, grant number [2021FRJHZD003] and Sichuan Science and Technology Program, grant number [2021YFQ0003].

Institutional Review Board Statement

Not applicable.

Informed Consent Statement

Not applicable.

Data Availability Statement

These data were derived from the following resources available in the public domain: [The Resource and Environment Science and Data Center (https://www.resdc.cn/, accessed on 13 February 2023)] [The National Oceanic and Atmospheric Administration (NOAA) (https://www.ngdc.noaa.gov/eog/viirs/download_dnb_composites.html, accessed on 3 September 2021)] [International Scientific & Technical Data Mirror Site, Computer Network Information Center, Chinese Academy of Sciences. (http://www.gscloud.cn, accessed on 3 September 2021)] [Soufun (https://gz.fang.com/, accessed on 20 September 2019)].

Conflicts of Interest

The authors declare no conflict of interest.

References

  1. Glaeser, E.; Huang, W.; Ma, Y.; Shleifer, A. A real estate boom with Chinese characteristics. J. Econ. Perspect. 2017, 31, 93–116. [Google Scholar] [CrossRef] [Green Version]
  2. Newman, G.; Lee, R.J.; Gu, D.; Park, Y.; Saginor, J.; Van Zandt, S.; Li, W. Evaluating drivers of housing vacancy: A longitudinal analysis of large U.S. cities from 1960 to 2010. J. Hous. Built Environ. 2019, 34, 807–827. [Google Scholar] [CrossRef] [PubMed]
  3. Zhang, C.; Jia, S.; Yang, R. Housing affordability and housing vacancy in China: The role of income inequality. J. Hous. Econ. 2016, 33, 4–14. [Google Scholar] [CrossRef]
  4. Castells, M.; Blackwell, C. The information age: Economy, society and culture. Volume 1. The rise of the network society. Environ. Plan. B Plan. Des. 1998, 25, 631–636. [Google Scholar]
  5. Garcia-López, M.À.; Muñiz, I. Urban spatial structure, agglomeration economies, and economic growth in Barcelona: An intra-metropolitan perspective. Pap. Reg. Sci. 2013, 92, 515–534. [Google Scholar] [CrossRef]
  6. Limtanakool, N.; Schwanen, T.; Dijst, M. Ranking functional urban regions: A comparison of interaction and node attribute data. Cities 2007, 24, 26–42. [Google Scholar] [CrossRef]
  7. Ye, C.; Chen, M.; Duan, J.; Yang, D. Uneven development, urbanization and production of space in the middle-scale region based on the case of Jiangsu province, China. Habitat Int. 2017, 66, 106–116. [Google Scholar] [CrossRef]
  8. Shi, L.; Wurm, M.; Huang, X.; Zhong, T.; Leichtle, T.; Taubenböck, H. Estimating housing vacancy rates at block level: The example of Guiyang, China. Landsc. Urban Plan. 2022, 224, 104431. [Google Scholar] [CrossRef]
  9. Cui, F.; Liu, B.; Jia, K.; Cai, Z.; Cheng, H. Application of Power Big Data in Power Acquisition System—The vacancy rate of residential housing based on power data. Agric. Electr. Manag. 2021, 02, 28–29. [Google Scholar]
  10. Armstrong, G.; Soebarto, V.; Zuo, J. Vacancy visual analytics method: Evaluating adaptive reuse as an urban regeneration strategy through understanding vacancy. Cities 2021, 115, 103220. [Google Scholar] [CrossRef]
  11. Wyatt, P. Empty dwellings: The use of council-tax records in identifying and monitoring vacant private housing in England. Environ. Plan. A 2008, 40, 1171–1184. [Google Scholar] [CrossRef]
  12. Maldonado, J.L. Viviendas Vacías: Un Universo Complejo; Su Vivienda, El Mundo: Medellín, Colombia, 2004; p. 369. [Google Scholar]
  13. Gentili, M.; Hoekstra, J. Houses without people and people without houses: A cultural and institutional exploration of an Italian paradox. Hous. Stud. 2019, 34, 425–447. [Google Scholar] [CrossRef] [Green Version]
  14. Moreno, E.L.; Blanco, Z.G. Ghost cities and empty houses: Wasted prosperity. Am. Int. J. Soc. Sci. 2014, 3, 207–216. [Google Scholar]
  15. Pan, J.; Li, J. Spatiotemporal dynamics of electricity consumption in China. Appl. Spat. Anal. Policy 2019, 12, 395–422. [Google Scholar] [CrossRef]
  16. Shi, K.; Huang, C.; Yu, B.; Yin, B.; Huang, Y.; Wu, J. Evaluation of NPP-VIIRS night-time light composite data for extracting built-up urban areas. Remote Sens. Lett. 2014, 5, 358–366. [Google Scholar] [CrossRef]
  17. Pan, J.; Hu, Y. Spatial identification of multi-dimensional poverty in rural China: A perspective of nighttime-light remote sensing data. J. Indian Soc. Remote Sens. 2018, 46, 1093–1111. [Google Scholar] [CrossRef]
  18. Chen, Z.; Yu, B.; Hu, Y.; Huang, C.; Shi, K.; Wu, J. Estimating house vacancy rate in metropolitan areas using NPP-VIIRS nighttime light composite data. IEEE J. Sel. Top. Appl. Earth Obs. Remote Sens. 2015, 8, 2188–2197. [Google Scholar] [CrossRef]
  19. Wang, L.; Fan, H.; Wang, Y. An estimation of housing vacancy rate using NPP-VIIRS night-time light data and OpenStreetMap data. Int. J. Remote Sens. 2019, 40, 8566–8588. [Google Scholar] [CrossRef]
  20. Zhang, D.; Li, D.; Zhou, L.; Huang, J.; Gao, H.; Wang, J.; Ma, Y. High precision space estimation of housing vacancy rate using high resolution image and Luojia-1. Bull. Surv. Mapp. 2021, 1, 41–46. [Google Scholar]
  21. Yang, P.; Pan, J. Estimating Housing Vacancy Rate Using Nightlight and POI: A Case Study of Main Urban Area of Xi’an City, China. Appl. Sci. 2022, 12, 12328. [Google Scholar] [CrossRef]
  22. Yue, X.; Wang, Y.; Zhao, Y.; Zhang, H. Estimation of Urban Housing Vacancy Based on Daytime Housing Exterior Images—A Case Study of Guangzhou in China. ISPRS Int. J. Geo-Inf. 2022, 11, 349. [Google Scholar] [CrossRef]
  23. Liu, Z.; An, W. The Generation and Development of the Urban Agglomeration in the Pearl River Delta. J. Tongji Univ. Soc. Sci. Sect. 2004, 5, 72–77. [Google Scholar]
  24. Zhu, Z.; Zheng, B.H.; He, Q.Y. Study on evolution of spatial structure of Pearl River Delta urban agglomeration and its effects. Econ. Geogr. 2011, 31, 404–408. [Google Scholar]
  25. Shi, K.; Yu, B.; Huang, Y.; Hu, Y.; Yin, B.; Chen, Z.; Chen, L.; Wu, J. Evaluating the ability of NPP-VIIRS night-time light data to estimate the gross domestic product and the electric power consumption of China at multiple scales: A comparison with DMSP-OLS data. Remote Sens. 2014, 6, 1705–1724. [Google Scholar] [CrossRef] [Green Version]
  26. Dou, Y.; Liu, Z.; He, C.; Yue, H. Urban land extraction using VIIRS nighttime light data: An evaluation of three popular methods. Remote Sens. 2017, 9, 175. [Google Scholar] [CrossRef] [Green Version]
  27. Cao, C.; De Luccia, F.J.; Xiong, X.; Wolfe, R.; Weng, F. Early on-orbit performance of the visible infrared imaging radiometer suite onboard the Suomi National Polar-Orbiting Partnership (S-NPP) satellite. IEEE Trans. Geosci. Remote Sens. 2013, 52, 1142–1156. [Google Scholar] [CrossRef] [Green Version]
  28. López, R.; Valdés, A. Fighting rural poverty in Latin America: New evidence of the effects of education, demographics, and access to land. Econ. Dev. Cult. Chang. 2000, 49, 197–211. [Google Scholar] [CrossRef]
  29. Vapnik, V. The Nature of Statistical Learning Theory, 2nd ed.; Springer Science & Business Media: Berkeley, CA, USA, 1999. [Google Scholar]
  30. Xu, M.; He, C.; Liu, Z.; Dou, Y. How did urban land expand in China between 1992 and 2015? A multi-scale landscape analysis. PLoS ONE 2016, 11, e0154839. [Google Scholar] [CrossRef] [Green Version]
  31. Cao, X.; Chen, J.; Imura, H.; Higashi, O. A SVM-based method to extract urban areas from DMSP-OLS and SPOT VGT data. Remote Sens. Environ. 2009, 113, 2205–2209. [Google Scholar] [CrossRef]
  32. Letu, H.; Hara, M.; Yagi, H.; Naoki, K.; Tana, G.; Nishio, F.; Shuhei, O. Estimating energy consumption from night-time DMPS/OLS imagery after correcting for sat-uration effects. Int. J. Remote Sens. 2010, 31, 4443–4458. [Google Scholar] [CrossRef]
  33. Zhou, Y.; Smith, S.J.; Elvidge, C.D.; Zhao, K.; Thomson, A.; Imhoff, M. A cluster-based method to map urban area from DMSP/OLS nightlights. Remote Sens. Environ. 2014, 147, 173–185. [Google Scholar] [CrossRef]
  34. Dong, L.; Pan, J.; Feng, Y.; Wang, W. Spatial difference pattern of house vacancy in China from nighttime light view. Econ. Geogr. 2017, 37, 62–69. [Google Scholar]
  35. He, D.; Shi, Q.; Liu, X.; Zhong, Y.; Zhang, L. Generating 2m fine-scale urban tree cover product over 34 metropolises in China based on deep context-aware sub-pixel mapping network. Int. J. Appl. Earth Obs. Geoinf. 2022, 106, 102667. [Google Scholar] [CrossRef]
  36. He, D.; Shi, Q.; Liu, X.; Zhong, Y.; Xia, G.; Zhang, L. Generating annual high resolution land cover products for 28 metropolises in China based on a deep super-resolution mapping network using Landsat imagery. GIScience Remote Sens. 2022, 59, 2036–2067. [Google Scholar] [CrossRef]
Figure 1. Location of the PRD in Guangdong Province in China and distribution of districts/counties. Data Source: The Resource and Environment Science and Data Center (https://www.resdc.cn/ (accessed on 13 February 2023)).
Land 12 00831 g001
Figure 2. NPP-VIIRS NTL remote sensing images of the PRD. (a) 2013, (b) 2016, (c) 2019. Data Source: The National Oceanic and Atmospheric Administration (NOAA) (https://www.ngdc.noaa.gov/eog/viirs/download_dnb_composites.html, accessed on 3 September 2021).
Land 12 00831 g002
Figure 3. The flowchart of the proposed research.
Land 12 00831 g003
Figure 4. Denoised NTL remote sensing image in the PRD. (a) 2013, (b) 2016, (c) 2019.
Land 12 00831 g004
Figure 5. Urban built-up area in the PRD in 2013, 2016, and 2019. (a) 2013, (b) 2016, (c) 2019. Data source: Landsat 8 OLI.
Land 12 00831 g005
Figure 6. The linear regression between sampled HVR and estimated HVR.
Land 12 00831 g006
Figure 7. HVRs at pixel scale in the PRD. (a) 2013, (b) 2016, (c) 2019.
Land 12 00831 g007
Figure 8. HVRs at district scale in the PRD. (a) 2013, (b) 2016, (c) 2019.
Land 12 00831 g008
Figure 9. Spatial distribution of HVRs changes in the PRD. (a) 2013–2016, (b) 2016–2019, (c) 2013–2019.
Land 12 00831 g009
Figure 10. Spatial distribution of vacant pixels in the PRD. (a) 2013, (b) 2016, (c) 2019.
Land 12 00831 g010
Table 1. Sampled data of vacant housing units (on sale or for rent) in Guangzhou.
DistrictNumber of Sampled ProjectsNumber of Total Housing UnitsNumber of Units on Sale or for Rent
Nansha89152,2147686
Tianhe549440,39017,572
Haizhu455519,16715,204
Panyu458480,83022,832
Baiyun285347,70314,280
Huadu178238,08811,698
Liwan223307,3238788
Yuexiu334408,10610,918
Huangpu144247,6438754
Table 2. Selection of samples for training set in ENVI.
TypeSampleNumber
WaterLand 12 00831 i00134
UrbanLand 12 00831 i00240
ForestLand 12 00831 i00332
GrasslandLand 12 00831 i00436
MountainLand 12 00831 i00534
CroplandLand 12 00831 i00631
Table 3. The sampled HVR and the estimated HVR in Guangzhou.
DistrictEstimated House Vacancy RateSampled House Vacancy Rate
Nansha49.85%5.51%
Tianhe19.40%4.65%
Haizhu27.76%3.61%
Panyu39.45%5.54%
Baiyun43.16%5.45%
Huadu28.70%5.99%
Liwan30.47%3.47%
Yuexiu11.41%3.26%
Huangpu18.43%3.32%
Table 4. HVR changes of individual cities in the PRD (2013–2019).
City2013–20162016–2019HVR (2019)
Guangzhou−3.22%−1.23%0.32
Foshan3.02%−0.90%0.44
Zhaoqing−2.91%−7.65%0.33
Shenzhen−1.21%−15.38%0.21
Dongguan−3.08%−7.53%0.37
Huizhou−24.18%12.52%0.33
Zhuhai2.21%−21.50%0.27
Zhongshan−8.89%6.64%0.40
Jiangmen−3.22%5.71%0.40
PRD−4.99%−2.39%0.35
Table 5. Number of vacant pixels in cities in the PRD.
City201320162019
Guangzhou596639684
Foshan938854906
Zhaoqing92445
Shenzheng144190132
Dongguan631604537
Huizhou484653
Zhuhai153131140
Zhongshan354421420
Jiangmen107122159
PRD298030313076
Disclaimer/Publisher’s Note: The statements, opinions and data contained in all publications are solely those of the individual author(s) and contributor(s) and not of MDPI and/or the editor(s). MDPI and/or the editor(s) disclaim responsibility for any injury to people or property resulting from any ideas, methods, instructions or products referred to in the content.

