Article

Carbon Emission Reduction Effects of the Digital Economy: Mechanisms and Evidence from 282 Cities in China

1
College of Business, City University of Hong Kong, Hong Kong 999077, China
2
School of Economics and Resource Management, Beijing Normal University, Beijing 100875, China
3
Center for Innovation and Development Studies, Beijing Normal University at Zhuhai, Zhuhai 519087, China
*
Authors to whom correspondence should be addressed.
These authors contributed equally to this work.
Land 2023, 12(4), 773; https://doi.org/10.3390/land12040773
Submission received: 8 March 2023 / Revised: 24 March 2023 / Accepted: 26 March 2023 / Published: 29 March 2023
(This article belongs to the Section Urban Contexts and Urban-Rural Interactions)

Abstract

:
The digital economy has great potential to boost innovation and social productivity, and it plays an important role in helping to achieve carbon peak and carbon neutrality. This study focuses on analyzing and testing the role of the digital economy in promoting carbon reduction in Chinese cities. Based on panel data of 282 cities in China from 2011 to 2019, this study measured the development level of the digital economy and carbon emission intensity by constructing a digital economy development level evaluation index system and a carbon emission inversion model, respectively. It was found that the digital economy can significantly reduce urban carbon emissions by promoting industrial structure upgrading and green innovation, and the digital economy will have a more obvious promotion effect on urban carbon emission reduction over time. This conclusion was found to be valid after we performed robustness tests such as the instrumental variable method, quasi-experimental analysis, and placebo test. Furthermore, heterogeneity analysis showed that eastern, regenerative, and provincial capital cities are better able to promote carbon emission reduction under the development of the digital economy. This study provides new empirical evidence at the city level for developing the digital economy to reduce urban carbon emissions and acts as a useful reference for developing countries to realize “smart carbon emission reduction”.

1. Introduction

From the record high temperatures caused by continuous increases in greenhouse gases (mainly carbon dioxide) to the prolonged fires in the Amazon rainforests of South America and the long-lasting forest fires in Australia, it is clear that curbing global warming is an important task and challenge for all of humankind. The increase in carbon emissions will directly lead to global warming, causing extreme weather such as typhoons and high temperatures, and damaging people’s health and quality of life [1,2]. Hence, looking for suitable ways to reduce greenhouse gas emissions in the process of economic development has become a focus for all countries in the world. As the largest developing country in the world, exploring low-carbon development strategies is necessary for China to engage in high-quality development while reducing carbon emissions in the future.
Since the information revolution, the digital economy, consisting of two major categories, digital industrialization and industrial digitization, has become the main economic form after the agricultural economy and the industrial economy. In 2022, the size of China’s Internet users exceeded 1.05 billion and the Internet penetration rate rose to 74.4%. Meanwhile, China has built the world’s largest 5G network and become one of the global leaders in 5G standards and technologies. In addition, the digital economy has been instrumental in promoting regional economic growth [3,4,5], increasing green total factor productivity [6,7], and promoting green technological innovation [8,9,10] while also positively affecting environmental improvement [11,12]. Specifically, many studies have analyzed the impact of information technology and environmental regulation on carbon emissions. Some scholars have found that the rapid development of Information and Communication Technologies (ICTs) and industries has led to rapid increases in electricity consumption, which has driven increases in carbon emissions [13,14]. Other scholars believe that the development of ICT and related industries (e.g., the spread of the Internet and the construction of ICT infrastructure) will reduce greenhouse gas emissions and thus improve environmental quality [15,16]. In addition, the Chinese government has proposed the goal of reaching carbon and energy development peak by 2030. Currently, the overall inequality of China’s carbon emissions shows a downward trend while intragroup inequality shows a slight upward trend [17]. The current level of development may not fully support the achievement of the 2030 target [18]. Therefore, many scholars are concerned about whether the higher the development level of the digital economy (DLDE), the more it can help China achieve carbon peak and carbon neutrality.
The digital economy, an innovation driving factor, may have been underestimated in its positive impact on low-carbon development in the past. Zhang et al. found that since China launched the carbon emission trading pilot, the digital economy has made a significant contribution to low-carbon development [19]. Using inter-provincial panel data, some scholars found that DLDE has a positive effect on carbon emission reduction (CER) [20,21] and significant spatial spillover effect [
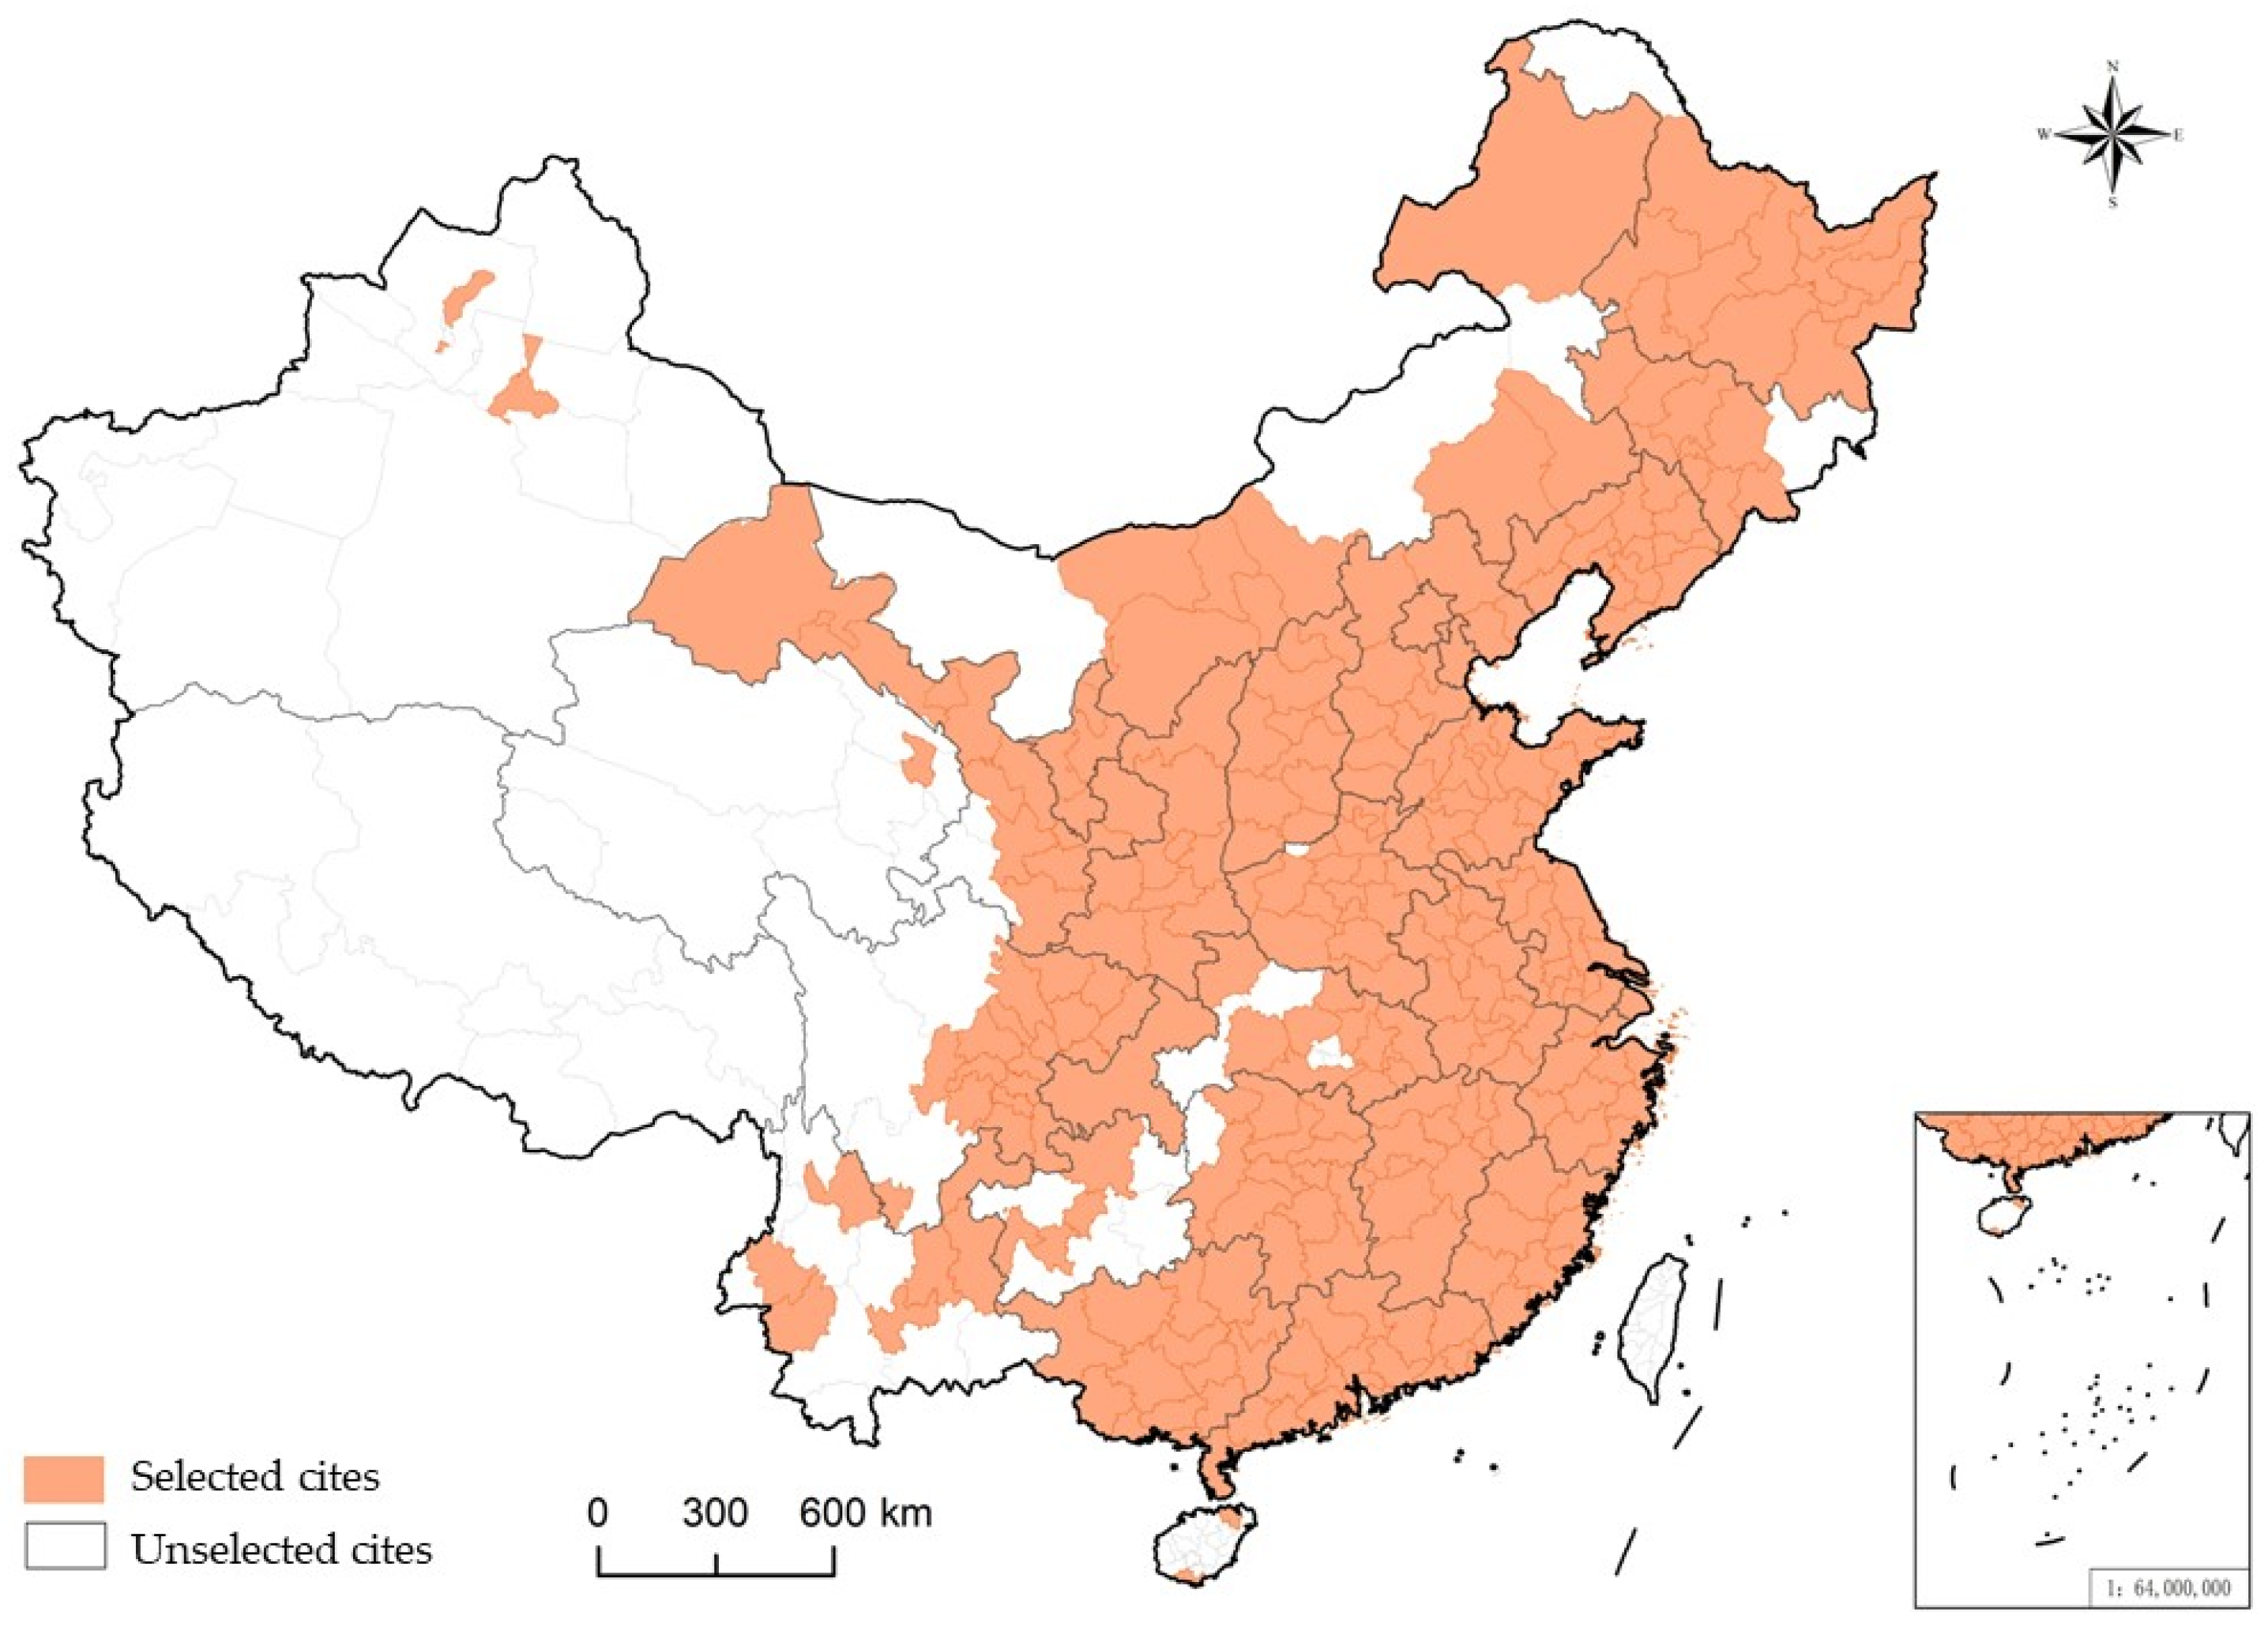
22]. However, this issue at the city level needs to be discussed further. So, can the digital economy be an effective driver of urban carbon reduction in this new phase of development? If the answer is yes, what are the underlying mechanisms? Are there any spatial and temporal differences in the effects? The purposes of this study were to identify whether the digital economy can become a new driver of CER at the city level and to provide recommendations for government policies to guide the development of a vibrant digital economy. Therefore, this study considered the panel data of 282 cities in China from 2011 to 2019, used different econometric models to conduct in-depth research on the impact of DLDE on CER, and took the rationalization of the urban industrial structure and the upgrading of the industrial structure as intermediary variables to investigate the transmission mechanism of carbon reduction effects of the digital economy.
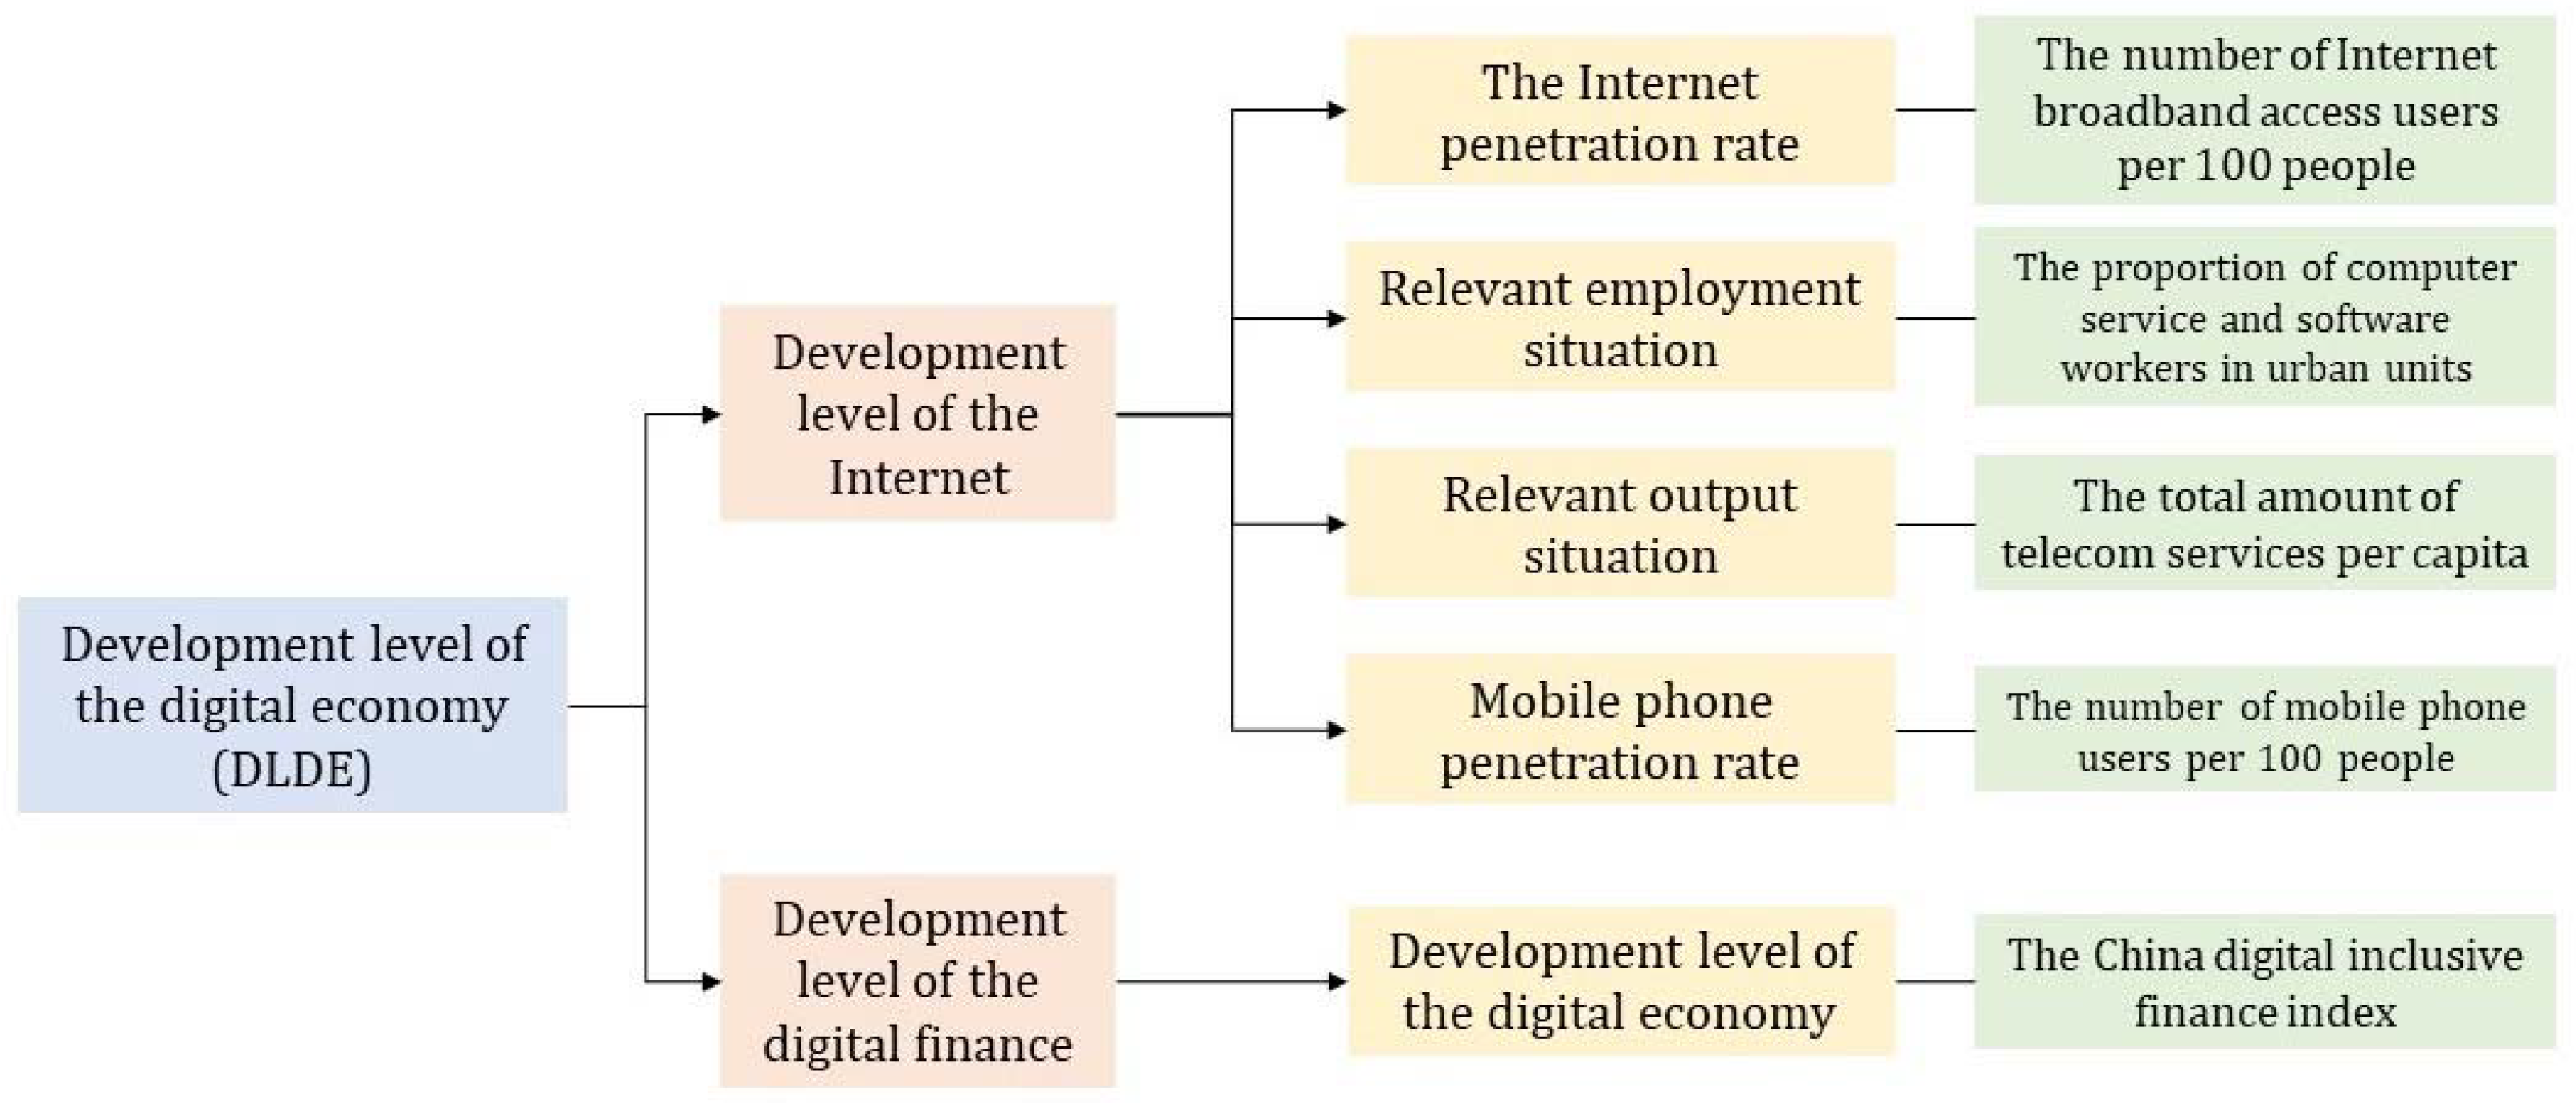
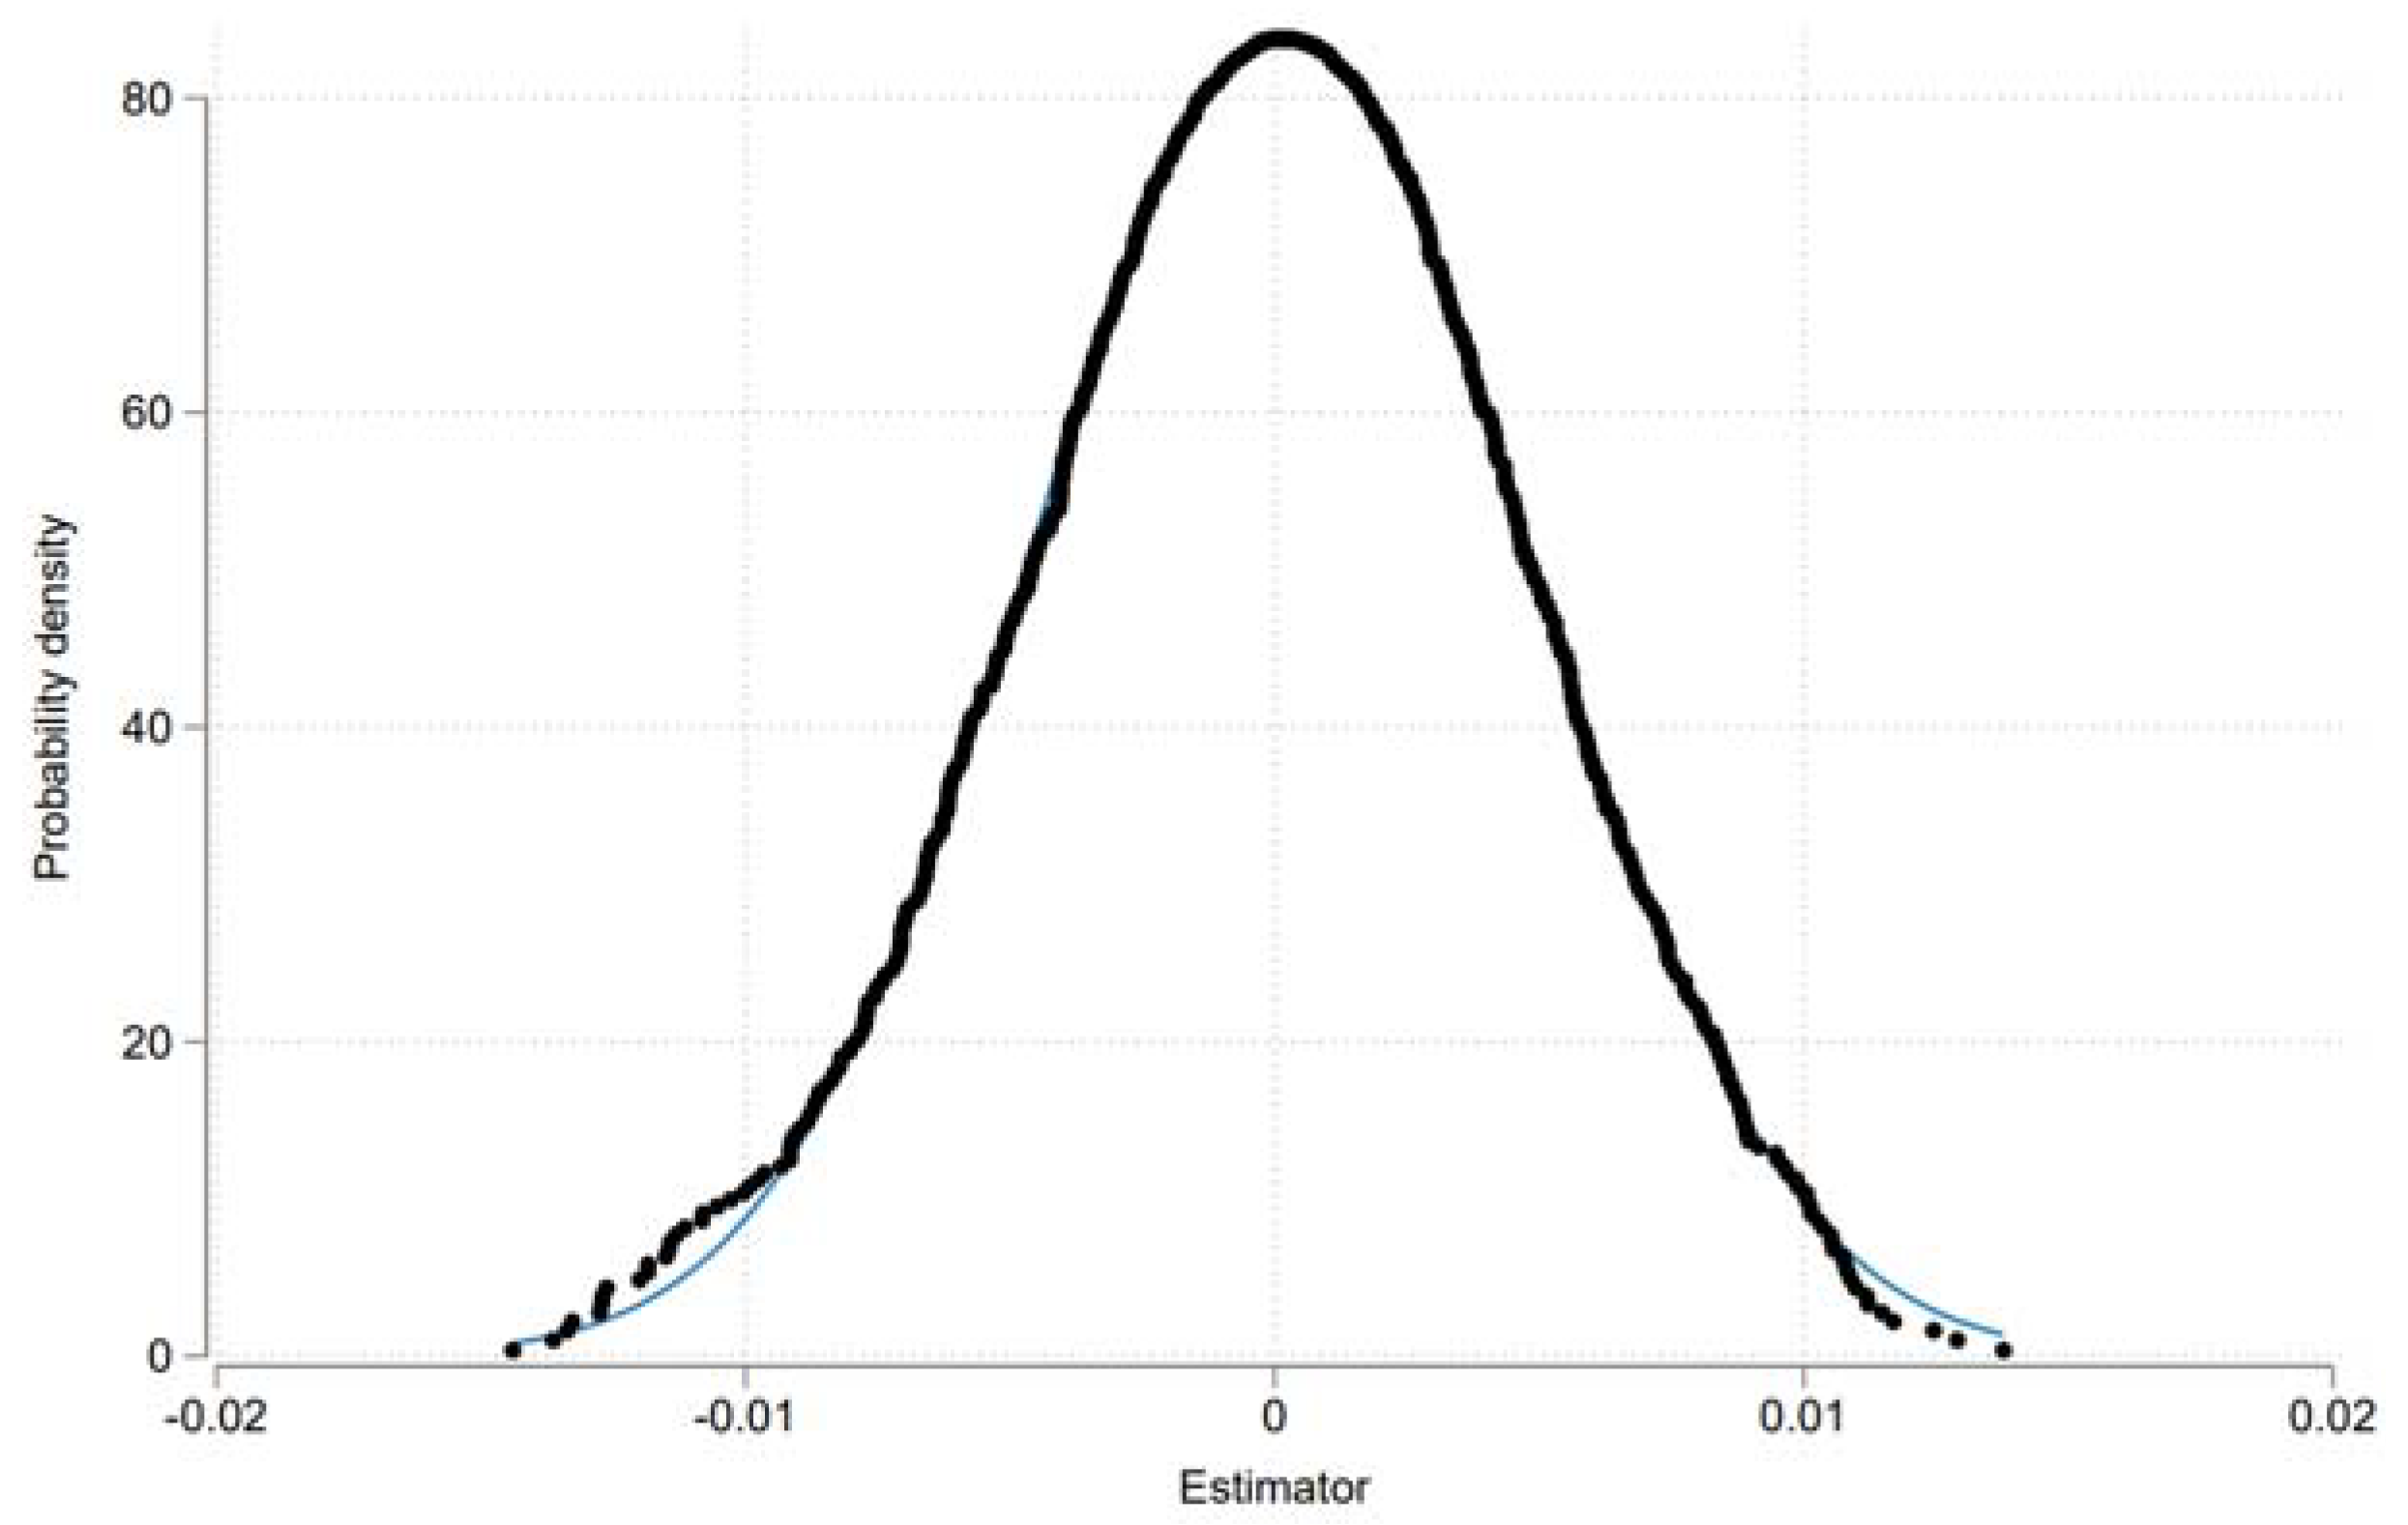
This study used a comprehensive index system to measure the urban DLDE, rather than a single index. Additionally, compared with most previous studies that measured China’s provincial carbon emission intensity (CEI), this study innovatively combined the Intergovernmental Panel on Climate Change (IPCC) carbon emission estimation method and satellite light data to establish a carbon emission inversion model to measure CEI and obtained new carbon emission data from the city level. In terms of mechanism analysis, we focused on discussing and testing the impact of industrial structure upgrading measured in terms of industrial structure rationalization and the impact of green innovation measured in terms of green patents on urban carbon reduction, thus providing a new perspective and empirical evidence on the potential of the digital economy to promote urban carbon reduction. In addition, the instrumental variable method, quasi-experimental analysis, the placebo test, and other methods were used to verify the robustness of our empirical results, providing more solid support for our regression analysis.
The rest of this study is arranged as follows. In Section 2, we analyze the theoretical mechanism and propose the research hypotheses. In Section 3, we explain the selected indicators and the measurement model. In Section 4, we report and fully analyze the results of the empirical analysis, as well as perform the robustness test and endogeneity discussion. In 
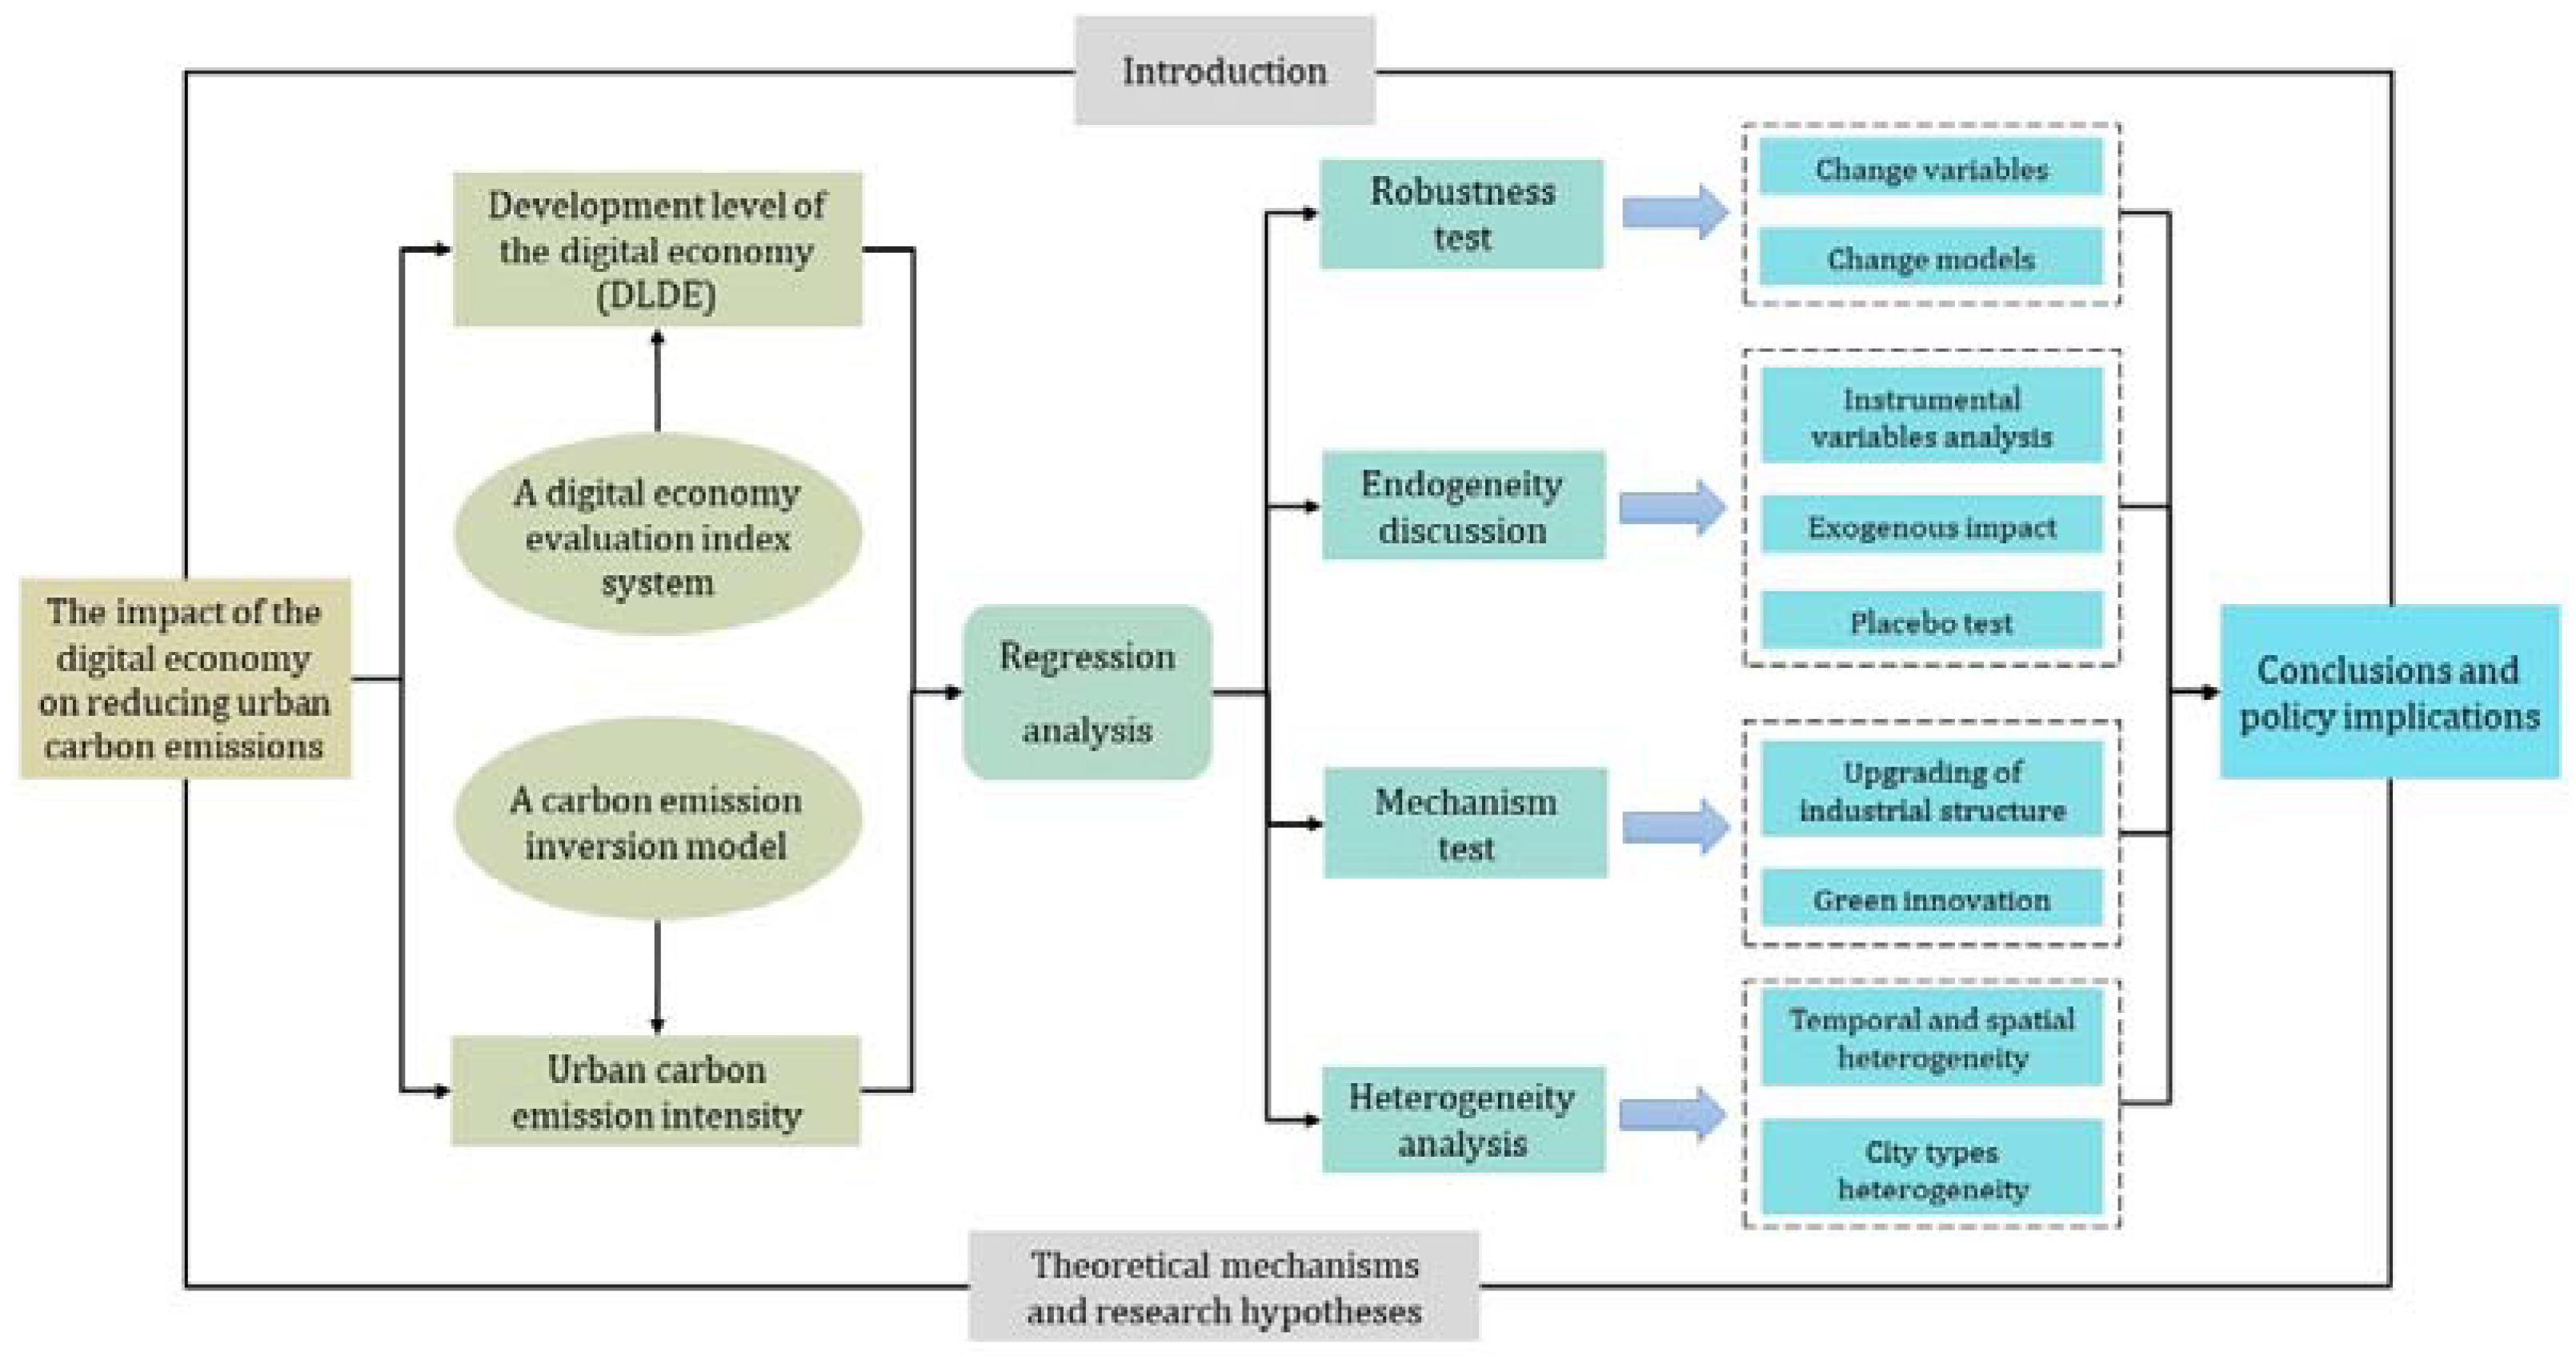
Section 5, we further analyze the mechanism and realization path of the digital economy that affects urban carbon emissions and analyze the heterogeneity according to urban characteristics. Finally, we summarize the conclusions and propose corresponding policy implications. The research framework of this study is shown in Figure 1.

2. Theoretical Mechanisms and Research Hypotheses

Since Tapscott first introduced the term “digital economy” in the 1990s, research on the digital economy has gone through three stages from the Information Economy to the Internet Economy to the New Economy. However, there is no standard to define the meaning of digital economy uniformly. Zimmerman showed that the digital economy is open, representing not only a technology change but also challenges and opportunities for business structures and economic activities; it is innovative, fundamentally changing the means of creating value [23]. Bukht and Heeks argued that the ICT sector, which provides the underlying digital goods and services, is the digital economy’s core [24]. Barefoot et al. defined the digital economy as the digital infrastructure on which users can operate over the Internet to carry out digital transactions that can create value in terms of complexity and human resource costs [25]. Additionally, Chen claimed that all ICT-based economic activities fall within the scope of the digital economy [26]. Therefore, synthesizing previous analyses, the authors of this study believe that the digital economy is an economic activity characterized by data support, integrated innovation, and open sharing. It uses digital technology to drive digital information to communicate on the Internet platform, and concretely manifests itself through business models.
With the widespread promotion and application of digital technology, the development of the digital economy also integrated with the development of the real social economy and plays an important role in reducing CEI. On the one hand, the digital economy can promote the transformation of traditional cities into smart cities. The digital economy relies on the use of digital technologies in urban construction and management, which can contribute to the digitalization, informatization, and intelligent operation of cities [27]. On the other hand, the digital economy can contribute to the digital management of enterprises in cities, enabling the accurate measurement of carbon footprints and the tracing of carbon emissions to their sources. The digital economy can also facilitate the digital transformation of enterprises, allowing them to efficiently use digital technologies to monitor and analyze their energy consumption and improve their ESG performance [28]. A tangible example of effective CER using digital economy technologies is Jing Dong Company (JD) in China. JD’s data center uses energy-saving technologies such as frequency conversion and indirect evaporative cooling, and the average annual power usage has gradually decreased through economic management, making the data center greener and less carbon-intensive. JD also strategically partnered with Didi Taxi to reduce the carbon footprint of employee travel via “car-pooling”, a move that has reduced carbon emissions by over 270,000 kg. In terms of packaging design for its products, JD uses reusable recycled delivery boxes and is exploring new green models at the source through digital operations. In addition, JD fully opened up its digital social supply chain to drive upstream and downstream industries to jointly achieve sustainable development. By using digital technology to accelerate its low-carbon development, JD promotes the green transformation of the industry and leads the green operation and green consumption trends in society.
This example shows that the digital economy can reduce the complexity of using its data and information capital for value creation and can effectively reduce the cost of human and material resource dissemination. It can also promote convergence and innovation to enhance the efficiency of economic operations and energy use. In this way, an open, shared, and symbiotic ecosystem can be formed, which can effectively reduce carbon emissions. Therefore, Hypothesis 1 is proposed.
 Hypothesis 1. 
The digital economy can reduce urban carbon emissions.
In general, the digital economy mainly promotes the upgrading of the urban industrial structure in two ways: industrial structure rationalization [29] and industrial structure supererogation [30]. First, with the wide application and comprehensive penetration of digital technologies such as the Internet in the industrial field, the operational efficiency of industrial organizations has been significantly improved [31]. This will lead to the formation and development of new industries. In this way, the proportional relationship between industries will be changed, labor productivity will be improved, and the output value proportion of industries with high levels of labor productivity will be increased. The overall industrial structure will be shifted towards the direction of intelligence and greening, and the level of the advanced industrial structure will be improved. Second, improvements in the digital infrastructure can lead to the rational allocation of production resources and factors, which will lead to a more orderly synergistic division of labor among industries and thus a more rational industrial structure [32]. In addition, developing the regional economy will lead to changes in the dominant industrial sectors in the region. Since different dominant industrial sectors have different resource consumption patterns, resource mismatch and misallocation will inevitably result in huge waste, which will lead to abnormal carbon emission growth [33]. Industrial structure upgrading can not only improve the efficiency of regional resource element utilization, reduce energy consumption per unit product, and thus reduce carbon emissions per unit product [11,34], but also promote the rapid development of technology-intensive industries with high tech at their core, enhance the clean and efficient utilization of coal, oil, and other energy sources, and help realize the greening and decarbonization of the whole society’s industrial chain [35]. Hence, Hypothesis 2 is proposed.
 Hypothesis 2. 
The digital economy can reduce carbon emissions by promoting the upgrading of urban industrial structures.
Green innovation is an effective means to address environmental pollution problems, and it can significantly reduce CEI [36]. The impact of the digital economy on green innovation capability is mainly reflected in three aspects: First, the knowledge spillover effect generated by the agglomeration of the digital economy drives enterprises to accelerate the use of new methods in pollution management and green development, thus promoting urban green innovation. Second, the digital economy can gradually eliminate the traditional high-pollution and high-energy-consuming industries through the substitution effect. Digital technologies can improve the efficiency of traditional backward industries and speed up transformation and upgrading. In a greener environment, the same unit of factor input will generate greater economic and social benefits [37]. Third, the development of the digital economy has enabled inclusive finance to benefit more economic agents through digital technology. Faster and more convenient financial support can help provide enterprises more green innovation research and development funds, as well as production and operation backup support from the supply side. At the same time, it also helps to enhance innovation and entrepreneurial activities in traditionally financially underdeveloped areas, which then indirectly promotes improvements in regional green innovation. Moreover, green innovation is conducive to CER while ensuring economic development [38]. It can promote improvements in enterprises’ production efficiency and the gradual substitution of clean energy for fossil fuel resources in the production process, thus effectively reducing carbon emissions, which can help a country achieve green and sustainable development [39]. Additional tools of green innovation include scientific instruments of environmental regulation. Carbon trading is an important market-based instrument used to control greenhouse gas emissions, and China’s carbon trading market has demonstrated that this policy helps to stimulate companies’ green innovation [40]. Thus, Hypothesis 3 is proposed.
 Hypothesis 3. 
The digital economy can reduce carbon emissions by increasing the green innovation capacity of cities.

3. Indicators and Model

3.1. Indicator Descriptions

3.1.1. Measurements of Urban CEI

The traditional statistical data-based IPCC carbon emission estimation method can only be used to achieve a complete estimation at the provincial scale; it cannot be used to obtain carbon emission data at the city level. Currently, city-level carbon emission accounting is mostly obtained by back-calculating socio-economic factors [41,42,43]. However, socio-economic statistics are subject to bias caused by inconsistencies in statistical caliber and data sources. There are inevitably some errors in the city-level carbon emission data obtained with this method. Accordingly, Chen et al. calculated county carbon emission data by using satellite light data [44], avoiding the inaccurate results caused by using social and economic factors to calculate carbon emission. Based on Chen et al.’s method, this study established a carbon emission inversion model for in-depth calculation and then matched it to the level of Chinese cities to obtain urban carbon emission data to avoid the impact of the urbanization rate and other factors on data accuracy.
A positive correlation between nighttime light brightness values and CO2 emissions has been shown [45]. The nighttime light data used in this study came from Defense Meteorological Satellite Program (DMSP). However, we extracted the nighttime light data from different satellites, the measurement scale was not uniform and errors occurred. Hence, it was necessary to correct the original light data. This study referred to the research method of existing scholars [46] and selected Jixi city as the base correction site, which satisfied the calibration criteria. The specific correction methods are as follows: First, the collected DMSP annual data were subjected to mutual correction, intra-annual fusion, and inter-annual correction with existing research methods. Second, the annual data of Visible Infrared Imaging Radiometer Suite (VIIRS) were processed with noise reduction, and a sensitivity analysis was performed by using the overlapping 2012 and 2013 data from the two datasets to select the best-fit parameters. Third, the VIIRS data were fitted to DMSP data according to the optimal parameters for constructing a synthetic Chinese nighttime lighting dataset.
Based on the IPCC report on how to account for carbon emissions from energy consumption and the energy consumption data records of each industry, standard coal conversion factors and carbon emission factors for each type of energy source were calculated, as shown in Table 1 [47,48]. The carbon emissions of 30 provinces and municipalities directly under the Central Government and autonomous regions (except Tibet) in inland China for a total of 20 years from 2000 to 2019 were calculated with Equation (1).
c n e = i = 1 i j = 1 j E i j ε j f j 44 / 12
where c n e is carbon emission, i is the type of different industries, j is the type of each energy source, E i j is the consumption of each type of energy in different industries, ε j is the conversion factor of standard coal for different energy sources, f j is the carbon emission factor of different energy sources, and 44/12 is the conversion factor of carbon into carbon dioxide.
Referencing Zhu et al. [49], the total value of nighttime lighting brightness was used as the explanatory variable, and the carbon emission was used as the explanatory variable. The estimation of urban carbon emissions based on nighttime lighting data was carried out by constructing a panel data model. Considering the positive correlation between the CO2 emissions and the total nighttime light brightness values of cities, the following relationship was set to exist between them.
c n e k t = α p r o v n l i g h t k t + μ k + ν t + ε k t
where c n e k t is the CO2 emissions in the province k in the year t , p r o v n l i g h t k t is the total luminance value of lights in the province k in the year t , μ k is the regional dummy variable, ν t is the year fixed effect, and ε k t is the random error term. Using the two-way panel fixed effects estimation Equation (2), the estimated value of α could be obtained. After that, the city-level CO2 emissions econometric model was constructed with the top–down estimation method, as shown in Equation (3).
C O 2 i t = c n e k t α c i t y n l i g h t i t + μ i + ν t + ε i t α p r o v n l i g h t k t + μ k + ν t + ε k t
where c n e k t is the provincial emission of CO2 based on government statistics. c i t y n l i g h t i t and p r o v n l i g h t k t are the total nighttime luminance values of the city i and its province k , respectively, in the year t . Based on Equations (2) and (3), the CO2 emissions of 282 cities in China can be measured.

3.1.2. Measurement of DLDE

Referencing Zhao et al. [3] and considering the availability of data at the city level, DLDE is comprehensively represented in this study by the Internet and digital finance development levels. The evaluation index system of DLDE constructed in this study is shown in Figure 2.
In Figure 2, the China digital inclusive finance index was calculated by Peking University. To facilitate the study, the above indicators were logarithmically processed. Subsequently, the data of the indicators were standardized and downscaled through the method of principal component analysis to obtain the comprehensive index of DLDE, which is denoted as d i g e .

3.1.3. Selection of Mechanism Variables

Regarding the measurement of the level of green innovation in cities, there are no official statistical city-level data on green patents in China. Learning from existing studies [50,51,52,53], the patent information data of the State Intellectual Property Office of China were used in this study to obtain the green patent data by matching them with the green patent information and then matched to the city level as the proxy variable of green innovation, denoted as g r i . In the empirical test, this variable was added by 1 and taken as the natural logarithm to reduce the data bias [54]. g r i represents a higher level of green innovation in a city with a higher value.
Industrial structure upgrading can effectively improve energy efficiency and reduce carbon emissions [55,56]. In this study, we referred to the research of previous scholars and used industrial structure rationalization [29] and industrial structure supererogation [30] to measure industrial structure upgrading.
Industrial structure rationalization ( i s 1 ) indicates the degree of effective resource utilization and structural transformation ability among industries, and it can also be used to measure the degree of coordination among factor input–output structures. Here, it was calculated with Equation (4).
i s 1 = 1 T L = 1 i = 1 n ( Y i Y ) ln ( Y i / L i Y / L )
In Equation (4), TL is the Theil index, Y is the output value, L is the employment, i is the industry, and n is the number of industrial sectors. When the value of i s 1 is smaller, the level of industrial structure rationalization is higher.
Industrial structure supererogation ( i s 2 ) refers to the process of shifting the focus of a country’s economic development or industrial structure from the primary industry to the secondary and tertiary industries one by one. The ratio of the output value of the primary industry, secondary industry, and tertiary industry to GDP was measured as a component of the spatial vector, thus forming a set of three-dimensional vectors X 0 = ( x 1 , 0 , x 2 , 0 , x 3 , 0 ) . Then, the angles θ 1 , θ 2 , and θ 3 between X 0 and the vectors X 1 = ( 1 , 0 , 0 ) , X 2 = ( 0 , 1 , 0 ) , and X 3 = ( 0 , 0 , 1 ) (which are arranged from the lowest to the highest industry, respectively) were measured. When the value of i s 2 is larger, the level of industrial structure advancement is higher. The calculation process is shown in Equations (5) and (6).
θ j = arccos i = 1 3 ( x i , j x i , 0 ) i = 1 3 ( x i , j 2 ) 1 / 2 i = 1 3 ( x i , 0 2 ) 1 / 2
i s 2 = k = 1 3 j = 1 k θ j ,   j = 1 , 2 , 3

3.2. Model Design

To test the promotion effect of the DLDE on CER, the following benchmark model was constructed in this study:
C O 2 i t = β 0 + β 1 d i g e i t + β 2 Z i t + δ t + ε i t
In Equation (7), C O 2 i t is the CEI of the city i in the year t , d i g e i t is the DLDE of the city i in the year t , and Z i t is the control variable. The specific control variables are as follows: Population density (pnd) was expressed as the ratio of the total population at the end of the year to the area of the urban area. Human capital was set as the source of economic growth and an important endogenous driver of regional CER. Foreign investment openness (fdi) was measured as the ratio of foreign direct investment to GDP in the host city. Opening up to the outside world can provide a bottom–up technology guarantee for the improvement of the environment and help guide the concentrated flow of factors to green industries with high technology levels. The degree of financial development (fin) was measured as the ratio of the number of loans from financial institutions to GDP. There is an innovative incentive effect of financial agglomeration, thus providing sufficient financial guarantee for CER projects. Energy use efficiency (eney) was measured in terms of GDP per 10,000 tons of standard coal. An improvement in energy efficiency is an important reflection of high-quality economic development and an important symbol of CER. The perfection of transportation facilities (trans) was expressed as road miles to the total area of the region. Transportation facilities, as a major component of infrastructure, are conducive to improvements in factor resource allocation efficiency in different regions. Additionally, the model avoids individual heterogeneity in the within-group regressions, thus adding δ t to denote the time fixed effects and clustering the random error term ε i t to the city level to solve the systematic heteroskedasticity problem of the model. The estimated coefficient α 1 indicates the identification of the causal effect of the digital economy and carbon reduction. If α 1 < 0 , then the digital economy reduces carbon emissions.

3.3. Descriptive Statistics

The aforementioned 282 cities in China from 2011 to 2019 were used as the research sample of this study. Their spatial distribution in China is shown in Figure 3.
The relevant data were obtained from the China City Statistical Yearbook and databases such as CSMAR, EPS, and Wind. The descriptive statistics of each indicator are shown in Table 2. The Spearman correlation test indicated that there was no serious problem of multicollinearity between the main variables, so they can be added together in the regression equation. Accordingly, a series of subsequent analyses and discussions were conducted in this study.

4. Empirical Test

4.1. Basic Regression

The basic regression results for the impact of the DLDE on urban carbon emissions are reported in Table 3. It can be seen from column (1) to column (6) that the estimated coefficients of the core explanatory variable d i g e were always significantly negative when control variables were gradually added. Thus, the effect of the development of the digital economy in promoting urban CER was initially confirmed. Specifically, with the inclusion of control variables, each percentage point increase in the digital economy was associated with a 14.1% reduction in urban carbon emissions. In addition, the impact coefficient of energy use efficiency on carbon emissions amounted to −6.883, indicating that improvements in energy use efficiency comprise one of the main factors influencing CER. Furthermore, practice has also shown that China’s coal resources have unique endowment characteristics and price advantages, which ensure that the energy pattern dominated by coal resources will not change in the short term. Therefore, improving energy economic efficiency is one of the most effective ways to promote CER [57,58].

4.2. Robustness Test

To further test for measurement bias, the two approaches of replacing variables and replacing econometric models were employed in this study for robustness testing. In previous research, the DLDE was measured with the principal component method. Here, the entropy value method was applied to obtain the comprehensive development index of the digital economy via objective weighting, which is denoted as d i g e 2 . In addition, referring to existing scholarly research [59], a continuous dynamic distribution method based on the stochastic kernel density function was used to analyze the CEI of Chinese cities and the total carbon emissions of each city can be obtained. The test results shown in columns (1) and (2) in Table 4 illustrate that the digital economy can significantly reduce CEI according to our changed digital economy measurement system. The coefficients of d i g e and d i g e 2 were significant at the 1% level whether control variables were included. Columns (3) and (4) verify that the digital economy significantly reduces CEI according to the continuous dynamic distribution approach used to measure CEI. Columns (5) and (6) verify that DLDE measured with the entropy method and the CEI measured with the continuous dynamic distribution method were tested again, and the digital economy was found to significantly reduce the CEI. Therefore, different methods of measuring the DLDE and CEI do not affect the core conclusion of this study, and the reduction effect of the digital economy on carbon emissions has strong credibility. Furthermore, Table 5 shows that the effect of the digital economy on carbon emissions was significantly negative at the 1% level when the baseline regression was tested using different models such as a mixed OLS model, a fixed effects model, and a quantile regression model, which again verified Hypothesis 1.
Meanwhile, because the autoregressive distributive lag (ARDL) approach is useful for analyzing time series data with variables that are nonstationary or integrated. Moreover, the ARDL approach can capture both short- and long-run dynamics of the relationship between carbon emissions and the digital economy. Therefore, to further investigate the long-run equilibrium relationship between DLDE and CER and to solve the possible panel nonstationary, this study built the panel-ARDL model. This can also further verify the robustness of the empirical results. After testing, both variables CO2 and d i g e are I(1) and there is a long-run co-integration relationship. Referencing Pesaran and Smith, and Iii and Frank [60,61,62] in the estimation of nonstationary heterogeneous panels with large cross-sectional observations (N) and large time series observations (T), this study estimated three alternative models: a traditional dynamic FE (DFE) estimator that relies on pooling of cross-sections, a mean-group (MG) estimator that relies on estimating N time series regressions and averaging the coefficients, and a pooled mean-group (PMG) estimator that relies on a combination of pooling and averaging of coefficients. The results are shown in Table 6. The Hausman test indicates that in column 2, the calculated Hausman statistic is 0.26 and the corresponding p-value is 0.610, which should accept the null hypothesis. Therefore, under the original assumption (difference in coefficients not systematic), the PMG estimate is the preferred valid estimate. Hausman test results in column 1 and column 3 show that DFE model is superior to PMG and MG model. Therefore, the DFE estimation is the best for the panel-ARDL model under the sample conditions of this study. In the estimation results of DFE model in Table 6, in the short-run, the coefficient of Δ d i g e is significantly positive at the 1% level, while in the long-run, the coefficient of d i g e is significantly negative and the size is close to the benchmark regression results. This indicates that the development of the digital economy may increase carbon emissions due to the expansion of economic scale and economic activities in the short-run, but in the long-run, the development of digital economy is conducive to CER. Specifically, the theoretical analysis shows that the development of digital economy can promote emission reduction from the two aspects of industrial structure upgrading and green innovation.

4.3. Endogeneity Discussion

4.3.1. Instrumental Variable (IV) Analysis

The presence of certain unobservable factors and bidirectional causality can lead to endogeneity problems, so the IV was used to conduct endogeneity tests to avoid these problems. The IV chosen in this study was the urban topography undulation and it was chosen for two reasons. One is that the topographic relief reflects the complexity of the regional terrain and has an impact on the installation and commissioning of digital infrastructure. Generally speaking, an increase in terrain relief increases the difficulty and cost of infrastructure construction, which satisfies the correlation condition of the IV. The other, is that topographic relief is a natural geographic factor that has no endogenous relationship with other economic variables and satisfies the condition of exogeneity as an IV. In addition, to obtain a more reliable test of the endogeneity problem, considering the actual situation in China and referring to existing studies [3], this study used post office density in 1998 as another IV. The Internet perpetuates the development of traditional communication technologies, and local traditional telecommunication infrastructures have impacts on the later application and diffusion of Internet technologies in terms of technology level and usage habits. The frequency of traditional telecommunication tools such as landline phones has gradually decreased in recent years, and their impact on local economic development has gradually diminished, which satisfies the exclusivity characteristic of the IV. The time point of 1998 was chosen because Chongqing City was officially established as a municipality in China in 1997. It is worth noting, in particular, that their raw data were in cross-sectional form that could not be used for the econometric analysis of panel data. Therefore, the interaction terms between the number of Internet users in the previous year and the topographic relief of each city and the density of post offices in 1998 were used as instrumental variables [63].
The endogeneity test results after adding instrumental variables are reported in Table 7. The IV in columns (1) and (2) is topographic relief (IV_land), the IV in columns (3) and (4) is post office density in 1998 (IV_post), and the instrumental variables in columns (5) and (6) are topographic relief and post office density in 1998. These models were estimated with the 2SLS method. The test results of the first stage in the model show that there was a significant negative correlation between IV_land and d i g e , and that there was a significant positive correlation between IV_post and d i g e in 1998. In the second stage test results, the coefficients of d i g e were all significantly negative at the level of 1%. In addition, the results show that it passes the underidentification test and weak identification test. In general, these tests proved the rationality of the IV selected in this study, confirming that the digital economy has a relatively robust role in promoting CER. The triplicate regression using the instrumental variable method supported the conclusion of baseline regression reported in Table 3, further verifying Hypothesis 1.

4.3.2. Exogenous Impact

The digital economy has become one of the most active research fields in China’s economic development. The State Council of China issued the “Broadband China” strategy in 2013, which officially elevated the construction of broadband facilities as a part of the national strategic facility construction plan. The policy came into effect in 2014 and has been gradually piloted in 117 cities in three batches. By 2020, the “Broadband China” strategy was completed. Now, the number of optical fiber access ports is about 880 million, 7.65 times that of 2013 and 771,000 5G base stations have been opened, leading the world in terms of construction scale. With the end of the “Broadband China” strategy, China’s network infrastructure construction has achieved leapfrog development.
In this study, the “Broadband China” strategy was adopted as an exogenous impact, and the time-varying difference-in-differences (DID) was used to evaluate whether the digital economy can more stably promote CER. On the one hand, the development the of the digital economy cannot be separated from the support of basic network infrastructure, as network performance and service quality are closely related to infrastructure. On the other hand, the gradual expansion of the pilot cities has provided us with a rare quasi-natural experiment. Therefore, this study constructed a time-varying DID to test the exogenous impact of urban–rural integration promoted by the digital economy.
C O 2 i t = β 0 + β 1 t r e a t t i m e i t + β 2 Z i t + μ i + δ t + ε i t
In Equation (8), C O 2 i t is the explained variable, which represents the CEI of the city; t r e a t t i m e is the core explanatory variable, which indicates whether the city implements the “Broadband China” strategy (if the city i implemented the “Broadband China” strategy in the year t , the value was 1; otherwise, the value was 0); and β 1 is the estimated coefficient of t r e a t t i m e , which represents the real policy effect of the “Broadband China” strategy on carbon emissions. The rest of the equation is the same as the baseline regression equation. Moreover, this study replaced the dependent variable with the CEI measured based on the continuous dynamic distribution method for another test. Specifically, column (7) showed that when control variables were added, the estimated coefficient of the “Broadband China” strategy on CER was −0.004, which was significantly negative at the 5% level. Column (8) showed that the estimated coefficient of the “Broadband China” strategy on the CEI index measured by the continuous dynamic distribution method was −0.071, which was significantly negative at the 5% level. These results indicate that network infrastructure construction plays an important role in promoting CER, which supports Hypothesis 1. Compared with the single difference technique, the difference-in-differences model can shield other factors affecting carbon emission and avoid deviations of intra-group regression. To verify the parallel trend hypothesis, this study adopted the event study method and established the following model:
C O 2 i t = β 0 + β 1 s = 5 5 t r e a t t i m e i t y e a r s + β 2 Z i t + μ i + δ t + ε i t
In Equation (9), t r e a t t i m e y e a r s represents the dummy variable of the implementation of the “Broadband China” strategy at different event points. The value range of s was selected as 5 s 5 . If the value of s was 0, the value was set as 1 in the year when the urban “Broadband China” strategy was implemented; otherwise, the value was set as 0. Before implementing the specific policy, the estimated coefficient fluctuated around, indicating that it matched the parallel trend.

4.3.3. Placebo Test

The choice of pilot cities in the “Broadband China” strategy was not completely random. In policymaking, some differences systematically change over time, leading to difficulties in identifying causal effects. To test the selection bias of “Broadband China” cities and some non-observational factors affecting the causal identification, this study adopted an indirect placebo test to explore how the digital economy promotes CER. By randomly generating the experimental group and control group of “Broadband China” pilot cities, a wrong estimate of the multiplier coefficient was generated. On this base, the bootstrap was repeated 1000 times, and the 1000 generated T-values were distributed and observed, as shown in Figure 4 (The black dots are the coefficient estimates, and the blue line is a normal distribution curve). The value distribution around 0 was similar to the normal distribution, showing that the basic regression conclusion is correct after addressing the selection bias and non-observed factors.

5. Further Analyses

5.1. Mechanism Test

A step-to-step test model was built with the mediation effect test method, and the results are shown in Table 8.
The estimated results of column (1) showed that the digital economy significantly promotes i s 1 at the 1% level. After adding i s 1 to regression column (2), it was found that the coefficient of d i g e was significantly negative at the 1% level, indicating that the digital economy promotes CER by promoting the upgrading of the industrial structure. The estimation results of column (3) indicated that the digital economy significantly positively promotes i s 2 at the 1% level. In recent years, the digital economy has been widely applied in the primary, secondary, and tertiary industries through, for instance, green and smart agriculture, the transformation of high-pollution industrial enterprises, and the encouragement of enterprises to research and develop green technology innovation patents. After adding i s 2 to regression column (2), it was found that the coefficient of d i g e was significantly negative at the 1% level, indicating that the digital economy promotes CER by promoting industrial structure upgrading. Therefore, Hypothesis 2 was preliminarily confirmed. The empirical results of column (5) showed that the digital economy significantly accelerates green innovation at the 1% level. However, after adding g r i to regression column (6), it was found that the coefficient of d i g e was significantly negative at the 1% level, which also confirmed that the digital economy can reduce carbon emissions by promoting green technology innovation. Therefore, Hypothesis 3 was proven. In column (7), the three mechanism variables were uniformly added to the regression model for another test to confirm the effectiveness of the mechanism variables. The results showed that when the three mechanism variables were added, the coefficient of d i g e was significantly positive at the level of 1%, which again confirmed Hypothesis 2 and Hypothesis 3.
To further confirm the existence of the mediation effect, this study adopted the bootstrap method, and the specific results are shown in Table 9. The model used 1000 self-samples, and it revealed that the two mediating effects were very significant, which fully explained the path of the digital economy to reduce carbon emissions.

5.2. Heterogeneity Analysis

Due to differences in economic foundation and resource endowment, we found obvious heterogeneity in both the quality of economic development and DLDE in China. The impact may also have heterogeneity in time and space, the type of urban economic development, and at the city level. It was necessary to conduct an in-depth discussion of this topic.
We performed spatial and temporal heterogeneity regression, and the results are shown in Table 10. First, the results in columns (1) to (3) show that the absolute value of the coefficient of d i g e significantly increased after 2013, indicating that DLDE was improved and its influence on CER was strengthened following the implementation of the “Broadband China” strategy. Second, the results in columns (4) to (6) show that the digital economy plays a more significant role in urban CER in cities located in Eastern China compared with cities located in Central and Western China. This result is also related to the different levels of regional economic development in China. Cities in the eastern region tend to have higher economic levels, are more open to foreign investment, and more fully use energy than those in the central and western regions.
Table 11 reports the regression results of urban type heterogeneity. According to the classification criteria of the State Council of China in 2013, this study divided cities into growing cities, mature cities, recessionary cities, regenerative cities, and non-resource-based cities. Columns (1) to (5) show that DLDE has a significant impact on the carbon emissions of regenerative and growing cities, with a large absolute coefficient value, though it showed no significant impact on recessionary cities. Columns (7) to (9) show that the absolute value of the coefficient of d i g e was larger for provincial capitals and municipalities directly under the Central Government; additionally, the effect on non-provincial capitals was found to be significant, but the absolute value of the coefficient of d i g e was relatively small. It is obvious that for both regeneration and growth cities, city development needs the help of industry. However, due to the relatively backward nature of urban development and the low level of economic development, the effect on recessionary cities was not found to be significant. In addition, provincial capitals and municipalities directly under the Central Government often have unique development advantages. Their economic level often ranks high in their provinces, and they have relatively significant policy support. Therefore, the digital economy will have more obvious impacts on the CER of these cities.
Generally speaking, DLDE may have a greater impact on the CER intensity of eastern cities, regenerative and growth cities, provincial capitals, and municipalities directly under the Central Government than the other kinds of municipalities because these cities witnessed the earlier development of their digital economies, better supporting environmental health and fully taking advantage of the benefits of the digital economy.

6. Conclusions and Policy Implications

This study explored the carbon reduction effects of the digital economy and the corresponding mechanisms. Our main conclusions are as follows: First, the digital economy can significantly reduce CEI and is an important driving force of achieving environmental protection goals. After further testing with instrumental variables, exogenous policy impact, and index substitution, our conclusion remained valid. Second, the digital economy can influence carbon emissions through two important channels: promoting industrial structure upgrading and green innovation. Third, the carbon reduction effects of the digital economy increase over time. The digital economy was found to have a significant positive effect on CER in cities in Eastern China, though the effect was not obvious for cities in Central and Western China. The development of the digital economy in regenerative cities was found to be conducive to CER best, though the development of the digital economy in recessionary cities was found to have no obvious effect on CER. The positive effect of the digital economy in promoting CER was also found to be more obvious in municipalities directly under the Central Government and provincial capitals. In addition, regarding the limitations of this study, this result may be a conclusion obtained only for a limited sample of cities and in this period of time. The data of some cities in northwest China are not public or difficult to collect, so the sample of this study did not cover all cities in China. If the study samples and the study time are changed, maybe we will have some new findings. Meanwhile, the results may also be influenced by how carbon emissions are estimated or how the digital economy is measured.
Therefore, the following policy implications can be proposed. To begin with, it is necessary to develop the construction of the digital infrastructure and consolidate the foundation for digital industrialization and industrial digitization. The government needs to vigorously support the research of artificial intelligence, big data, cloud computing, blockchain, and other digital technologies, and further promote the deep integration of the digital economy with urban management, enterprise development, energy conservation, and emission reduction. This will help digital technology penetrate traditional energy-intensive industries and optimize the industrial structure. Second, we should pay attention to the positive effects of industrial structure upgrading and green innovation capability on CER. At present, China’s digital economy is immature. During development, it is important to strengthen the extensive applications of the digital economy in various industrial fields such as industry, agriculture, construction, and transportation. Governments can promote improvements in green innovation ability through the introduction of corresponding financial and talent protection policies. Finally, a differentiated digital economy strategy should be implemented to improve the coordination of digital infrastructure construction among different regions. Reducing urban CEI requires overall planning, scientific planning, and gradual progress in different regions. By increasing the intensity and popularization of the “Broadband China” strategy, the “digital divide” between the eastern and central regions can be eliminated such that the central region, western region, mature cities, and recessionary cities can realize the “curve overtake” in environmental issues.

Author Contributions

Conceptualization, Z.M. and W.-B.L.; methodology, C.C.; software, W.-B.L.; validation, Z.M., W.-B.L., C.C. and C.G.; formal analysis, Z.M.; data curation, Z.M.; writing—original draft preparation, Z.M. and W.-B.L.; writing—review and editing, C.C. and C.G.; visualization, W.-B.L.; supervision, C.G.; funding acquisition, C.C.; project administration C.G. All authors have read and agreed to the published version of the manuscript.

Funding

This study was funded by the National Social Science Fund of China (No. 21CGL036) and the Project of Humanities and Social Sciences of Ministry of Education in China (No. 19YJC790006).

Institutional Review Board Statement

Not applicable.

Informed Consent Statement

Not applicable.

Data Availability Statement

Not applicable.

Conflicts of Interest

The authors declare no conflict of interest.

References

  1. Dong, H.; Xue, M.; Xiao, Y.; Liu, Y. Do Carbon Emissions Impact the Health of Residents? Considering China’s Industrialization and Urbanization. Sci. Total Environ. 2021, 758, 143688. [Google Scholar] [CrossRef]
  2. Liu, H.; Wong, W.-K.; The Cong, P.; Nassani, A.A.; Haffar, M.; Abu-Rumman, A. Linkage among Urbanization, Energy Consumption, Economic Growth and Carbon Emissions. Panel Data Analysis for China Using ARDL Model. Fuel 2023, 332, 126122. [Google Scholar] [CrossRef]
  3. Zhao, T.; Zhang, Z.; Liang, S. Digital Economy, Entrepreneurship Activity and High-quality Development: Empirical Evidence from Chinese Cities. Manag. World 2020, 36, 65–76. (In Chinese) [Google Scholar] [CrossRef]
  4. Jiao, S.; Sun, Q. Digital Economic Development and Its Impact on Econimic Growth in China: Research Based on the Prespective of Sustainability. Sustainability 2021, 13, 10245. [Google Scholar] [CrossRef]
  5. Cai, X.; Wang, W.; Rao, A.; Rahim, S.; Zhao, X. Regional Sustainable Development and Spatial Effects From the Perspective of Renewable Energy. Front. Environ. Sci. 2022, 10, 166. [Google Scholar] [CrossRef]
  6. Gu, B.; Liu, J.; Ji, Q. The Effect of Social Sphere Digitalization on Green Total Factor Productivity in China: Evidence from a Dynamic Spatial Durbin Model. J. Environ. Manag. 2022, 320, 115946. [Google Scholar] [CrossRef] [PubMed]
  7. Liu, Y.; Yang, Y.; Li, H.; Zhong, K. Digital Economy Development, Industrial Structure Upgrading and Green Total Factor Productivity: Empirical Evidence from China’s Cities. Int. J. Environ. Res. Public Health 2022, 19, 2414. [Google Scholar] [CrossRef] [PubMed]
  8. Cao, S.; Nie, L.; Sun, H.; Sun, W.; Taghizadeh-Hesary, F. Digital Finance, Green Technological Innovation and Energy-Environmental Performance: Evidence from China’s Regional Economies. J. Clean. Prod. 2021, 327, 129458. [Google Scholar] [CrossRef]
  9. Li, J.; Chen, L.; Chen, Y.; He, J. Digital Economy, Technological Innovation, and Green Economic Efficiency-Empirical Evidence from 277 Cities in China. Manag. Decis. Econ. 2022, 43, 616–629. [Google Scholar] [CrossRef]
  10. Dai, D.; Fan, Y.; Wang, G.; Xie, J. Digital Economy, R&D Investment, and Regional Green Innovation—Analysis Based on Provincial Panel Data in China. Sustainability 2022, 14, 6508. [Google Scholar] [CrossRef]
  11. Fisher-Vanden, K.; Jefferson, G.H.; Liu, H.; Tao, Q. What Is Driving China’s Decline in Energy Intensity? Resour. Energy Econ. 2004, 26, 77–97. [Google Scholar] [CrossRef]
  12. Li, Z.; Li, N.; Wen, H. Digital Economy and Environmental Quality: Evidence from 217 Cities in China. Sustainability 2021, 13, 8058. [Google Scholar] [CrossRef]
  13. Salahuddin, M.; Alam, K. Internet Usage, Electricity Consumption and Economic Growth in Australia: A Time Series Evidence. Telemat. Inform. 2015, 32, 862–878. [Google Scholar] [CrossRef]
  14. Hamdi, H.; Sbia, R.; Shahbaz, M. The Nexus between Electricity Consumption and Economic Growth in Bahrain. Econ. Model. 2014, 38, 227–237. [Google Scholar] [CrossRef] [Green Version]
  15. Shobande, O.A. Decomposing the Persistent and Transitory Effect of Information and Communication Technology on Environmental Impacts Assessment in Africa: Evidence from Mundlak Specification. Sustainability 2021, 13, 4683. [Google Scholar] [CrossRef]
  16. Bhujabal, P.; Sethi, N.; Padhan, P.C. ICT, Foreign Direct Investment and Environmental Pollution in Major Asia Pacific Countries. Environ. Sci. Pollut. Res. 2021, 28, 42649–42669. [Google Scholar] [CrossRef]
  17. Chen, J.; Xu, C.; Cui, L.; Huang, S.; Song, M. Driving Factors of CO2 Emissions and Inequality Characteristics in China: A Combined Decomposition Approach. Energy Econ. 2019, 78, 589–597. [Google Scholar] [CrossRef]
  18. Cui, L.; Li, R.; Song, M.; Zhu, L. Can China Achieve Its 2030 Energy Development Targets by Fulfilling Carbon Intensity Reduction Commitments? Energy Econ. 2019, 83, 61–73. [Google Scholar] [CrossRef]
  19. Zhang, J.; Lyu, Y.; Li, Y.; Geng, Y. Digital Economy: An Innovation Driving Factor for Low-Carbon Development. Environ. Impact Assess. Rev. 2022, 96, 106821. [Google Scholar] [CrossRef]
  20. Hao, X.; Wen, S.; Li, Y.; Xu, Y.; Xue, Y. Can the Digital Economy Development Curb Carbon Emissions? Evidence from China. Front. Psychol. 2022, 13, 938918. [Google Scholar] [CrossRef]
  21. Zhu, Z.; Liu, B.; Yu, Z.; Cao, J. Effects of the Digital Economy on Carbon Emissions: Evidence from China. Int. J. Environ. Res. Public Health 2022, 19, 9450. [Google Scholar] [CrossRef]
  22. Yi, M.; Liu, Y.; Sheng, M.S.; Wen, L. Effects of Digital Economy on Carbon Emission Reduction: New Evidence from China. Energy Policy 2022, 171, 113271. [Google Scholar] [CrossRef]
  23. Zimmermann, H.-D. Understanding the Digital Economy: Challenges for New Business Models. SSRN Electron. J. 2000, 729–732. [Google Scholar] [CrossRef] [Green Version]
  24. Bukht, R.; Heeks, R. Defining, Conceptualising and Measuring the Digital Economy. Dev. Inf. Work. Pap. 2017, 68, 1–24. [Google Scholar] [CrossRef] [Green Version]
  25. Barefoot, K.; Curtis, D.; Jolliff, W.; Nicholson, J.R.; Omohundro, R. Defining and Measuring the Digital Economy; U.S. Department of Commerce Bureau of Economic Analysis: Washington, DC, USA, 2018; Volume 15.
  26. Chen, Y. Improving Market Performance in the Digital Economy. China Econ. Rev. 2020, 62, 101482. [Google Scholar] [CrossRef]
  27. Goldfarb, A.; Tucker, C. Digital Economics. J. Econ. Lit. 2019, 57, 3–43. [Google Scholar] [CrossRef] [Green Version]
  28. Chen, G.; Han, J.; Yuan, H. Urban Digital Economy Development, Enterprise Innovation, and ESG Performance in China. Front. Environ. Sci. 2022, 10, 955055. [Google Scholar] [CrossRef]
  29. Cheng, Z.; Li, L.; Liu, J. Industrial Structure, Technical Progress and Carbon Intensity in China’s Provinces. Renew. Sustain. Energy Rev. 2018, 81, 2935–2946. [Google Scholar] [CrossRef]
  30. Fu, L.-H. Empirical Study on the Relationship between China's Advanced Industrial Structure and Economic Growth. Stat. Res. 2010, 27, 79–81. (In Chinese) [Google Scholar] [CrossRef]
  31. Wang, J.; Wang, W.; Ran, Q.; Irfan, M.; Ren, S.; Yang, X.; Wu, H.; Ahmad, M. Analysis of the Mechanism of the Impact of Internet Development on Green Economic Growth: Evidence from 269 Prefecture Cities in China. Environ. Sci. Pollut. Res. 2022, 29, 9990–10004. [Google Scholar] [CrossRef]
  32. Njangang, H.; Nounamo, Y. Is Information and Communication Technology a Driver of Industrialization Process in African Countries? Econ. Bull. 2020, 40, 2654–2662. [Google Scholar]
  33. Tian, X.; Bai, F.; Jia, J.; Liu, Y.; Shi, F. Realizing Low-Carbon Development in a Developing and Industrializing Region: Impacts of Industrial Structure Change on CO2 Emissions in Southwest China. J. Environ. Manag. 2019, 233, 728–738. [Google Scholar] [CrossRef]
  34. Yu, Y.; Deng, Y.; Chen, F. Impact of Population Aging and Industrial Structure on CO2 Emissions and Emissions Trend Prediction in China. Atmos. Pollut. Res. 2018, 9, 446–454. [Google Scholar] [CrossRef]
  35. Raghutla, C.; Chittedi, K.R. Financial Development, Energy Consumption, Technology, Urbanization, Economic Output and Carbon Emissions Nexus in BRICS Countries: An Empirical Analysis. Manag. Environ. Qual. Int. J. 2020, 32, 290–307. [Google Scholar] [CrossRef]
  36. Yuan, B.; Li, C.; Yin, H.; Zeng, M. Green Innovation and China’s CO2 Emissions—The Moderating Effect of Institutional Quality. J. Environ. Plan. Manag. 2022, 65, 877–906. [Google Scholar] [CrossRef]
  37. He, Z.; Lu, W.; Hua, G.; Wang, J. Factors Affecting Enterprise Level Green Innovation Efficiency in the Digital Economy Era—Evidence from Listed Paper Enterprises in China. BioResources 2021, 16, 7648–7670. [Google Scholar] [CrossRef]
  38. Lee, K.-H.; Min, B. Green R&D for Eco-Innovation and Its Impact on Carbon Emissions and Firm Performance. J. Clean. Prod. 2015, 108, 534–542. [Google Scholar] [CrossRef] [Green Version]
  39. Apergis, N.; Eleftheriou, S.; Payne, J.E. The Relationship between International Financial Reporting Standards, Carbon Emissions, and R&D Expenditures: Evidence from European Manufacturing Firms. Ecol. Econ. 2013, 88, 57–66. [Google Scholar] [CrossRef]
  40. Cui, J.; Zhang, J.; Zheng, Y. Carbon Pricing Induces Innovation: Evidence from China’s Regional Carbon Market Pilots. AEA Pap. Proc. 2018, 108, 453–457. [Google Scholar] [CrossRef] [Green Version]
  41. Yang, L.; Xia, H.; Zhang, X.; Yuan, S. What Matters for Carbon Emissions in Regional Sectors? A China Study of Extended STIRPAT Model. J. Clean. Prod. 2018, 180, 595–602. [Google Scholar] [CrossRef]
  42. Ahmad, M.; Rahman, U.Z.; Hong, L.; Khan, S.; Khan, Z.; Khan, N.M. Impact of Environmental Quality Variables and Socio-Economic Factors on Human Health: Empirical Evidence from China. Pollution 2018, 4, 571–579. [Google Scholar] [CrossRef]
  43. Jiao, Z.; Xing, Z.; Zhang, G.; Ma, X.; Wang, H. Comparing Decoupling and Driving Forces of CO2 Emissions in China and India. Front. Environ. Sci. 2022, 10, 273. [Google Scholar] [CrossRef]
  44. Chen, J.; Gao, M.; Cheng, S.; Hou, W.; Song, M.; Liu, X.; Liu, Y.; Shan, Y. County-Level CO2 Emissions and Sequestration in China during 1997–2017. Sci. Data 2020, 7, 391. [Google Scholar] [CrossRef] [PubMed]
  45. Wang, Z.-X.; Ye, D.-J. Forecasting Chinese Carbon Emissions from Fossil Energy Consumption Using Non-Linear Grey Multivariable Models. J. Clean. Prod. 2017, 142, 600–612. [Google Scholar] [CrossRef]
  46. Elvidge, C.D.; Baugh, K.; Zhizhin, M.; Hsu, F.C.; Ghosh, T. VIIRS Night-Time Lights. Int. J. Remote Sens. 2017, 38, 5860–5879. [Google Scholar] [CrossRef] [Green Version]
  47. Cheng, Y.; Wang, Z.; Ye, X.; Wei, Y.D. Spatiotemporal Dynamics of Carbon Intensity from Energy Consumption in China. J. Geogr. Sci. 2014, 24, 631–650. [Google Scholar] [CrossRef] [Green Version]
  48. Li, Z.; Wang, J. The Dynamic Impact of Digital Economy on Carbon Emission Reduction: Evidence City-Level Empirical Data in China. J. Clean. Prod. 2022, 351, 131570. [Google Scholar] [CrossRef]
  49. Zhu, J.; Fan, Y.; Deng, X.; Xue, L. Low-Carbon Innovation Induced by Emissions Trading in China. Nat. Commun. 2019, 10, 4088. [Google Scholar] [CrossRef] [Green Version]
  50. Du, K.; Li, P.; Yan, Z. Do Green Technology Innovations Contribute to Carbon Dioxide Emission Reduction? Empirical Evidence from Patent Data. Technol. Forecast. Soc. Change 2019, 146, 297–303. [Google Scholar] [CrossRef]
  51. Chen, Z.; Zhang, X.; Chen, F. Do Carbon Emission Trading Schemes Stimulate Green Innovation in Enterprises? Evidence from China. Technol. Forecast. Soc. Change 2021, 168, 120744. [Google Scholar] [CrossRef]
  52. Du, G.; Yu, M.; Sun, C.; Han, Z. Green Innovation Effect of Emission Trading Policy on Pilot Areas and Neighboring Areas: An Analysis Based on the Spatial Econometric Model. Energy Policy 2021, 156, 112431. [Google Scholar] [CrossRef]
  53. Xu, N.; Zhang, H.; Li, T.; Ling, X.; Shen, Q. How Big Data Affect Urban Low-Carbon Transformation—A Quasi-Natural Experiment from China. Int. J. Environ. Res. Public Health 2022, 19, 16351. [Google Scholar] [CrossRef]
  54. Campbell, D.L.; Mau, K. On Trade Induced Technical Change: The Impact of Chinese Imports on Innovation, IT, and Productivity. Rev. Econ. Stud. 2021, 88, 2555–2559. [Google Scholar] [CrossRef]
  55. Liu, L.; Zhang, Y.; Gong, X.; Li, M.; Li, X.; Ren, D.; Jiang, P. Impact of Digital Economy Development on Carbon Emission Efficiency: A Spatial Econometric Analysis Based on Chinese Provinces and Cities. Int. J. Environ. Res. Public Health 2022, 19, 14838. [Google Scholar] [CrossRef]
  56. Lyu, K.; Yang, S.; Zheng, K.; Zhang, Y. How Does the Digital Economy Affect Carbon Emission Efficiency? Evidence from Energy Consumption and Industrial Value Chain. Energies 2023, 16, 761. [Google Scholar] [CrossRef]
  57. Xu, S.-C.; He, Z.-X.; Long, R.-Y.; Chen, H. Factors That Influence Carbon Emissions Due to Energy Consumption Based on Different Stages and Sectors in China. J. Clean. Prod. 2016, 115, 139–148. [Google Scholar] [CrossRef]
  58. Li, W.; Sun, W.; Li, G.; Jin, B.; Wu, W.; Cui, P.; Zhao, G. Transmission Mechanism between Energy Prices and Carbon Emissions Using Geographically Weighted Regression. Energy Policy 2018, 115, 434–442. [Google Scholar] [CrossRef]
  59. Wu, J.-X.; Guo, Z.-Y. Convergence analysis of China's carbon emissions based on continuous dynamic distribution method. Stat. Res. 2016, 33, 54–60. (In Chinese) [Google Scholar] [CrossRef]
  60. Pesaran, M.H.; Smith, R. Estimating Long-Run Relationships from Dynamic Heterogeneous Panels. J. Econom. 1995, 68, 79–113. [Google Scholar] [CrossRef]
  61. Pesaran, M.H.; Shin, Y.; Smith, R.P. Pooled Mean Group Estimation of Dynamic Heterogeneous Panels. J. Am. Stat. Assoc. 1999, 94, 621–634. [Google Scholar] [CrossRef]
  62. Blackburne, E.F.; Frank, M.W. Estimation of Nonstationary Heterogeneous Panels. Stata J. 2007, 7, 197–208. [Google Scholar] [CrossRef]
  63. Nunn, N.; Qian, N. US Food Aid and Civil Conflict. Am. Econ. Rev. 2014, 104, 1630–1666. [Google Scholar] [CrossRef] [Green Version]
Figure 1. Research framework.
Land 12 00773 g001
Figure 2. The evaluation index system of DLDE.
Land 12 00773 g002
Figure 3. The spatial distribution of the 282 cities in China.
Land 12 00773 g003
Figure 4. Placebo test.
Land 12 00773 g004
Table 1. Standard coal conversion factors and carbon emission factors.
Energy TypeStandard Coal Conversion FactorsCarbon Emission Factors
Coal0.714 kgce/kg0.755 kg/kgce
Coke0.971 kgce/kg0.855 kg/kgce
Crude oil1.428 kgce/kg0.585 kg/kgce
Gasoline1.470 kgce/kg0.550 kg/kgce
Kerosene1.471 kgce/kg0.571 kg/kgce
Diesel1.457 kgce/kg0.592 kg/kgce
Fuel oil1.428 kgce/kg0.618 kg/kgce
Other petroleum products1.228 kgce/kg0.585 kg/kgce
Natural gas1.214 kgce/m30.448 kg/kgce
Liquefied petroleum gas1.714 kgce/m30.504 kg/kgce
Table 2. Descriptive statistics.
VariableObservationMeanStandard DeviationMinMax
CO225384.0770.3972.9265.097
dige25382.3970.0832.0862.709
citynlight25381.8900.9890.0024.112
pnd25385.7460.9161.6297.968
eney25380.1630.0070.1400.187
fdi25380.0170.0170.0000.192
fin25381.5613.2940.02544.898
trans25381.5754.4610.06190.678
is125380.3584.1080.000206.934
is225386.5160.3465.5177.836
gri25384.3721.6900.6939.335
Table 3. Basic regression results.
Variable(1)(2)(3)(4)(5)(6)
dige−0.345 ***−0.343 ***−0.338 ***−0.327 ***−0.143 ***−0.141 ***
(0.000)(0.000)(0.000)(0.000)(0.000)(0.000)
pnd 0.018 *0.018 *0.018 *0.0030.002
(0.075)(0.076)(0.070)(0.768)(0.782)
fdi −0.260 ***−0.226 ***−0.169 ***−0.159 ***
(0.000)(0.000)(0.000)(0.001)
fin 0.005 ***0.005 ***0.005 ***
(0.000)(0.000)(0.000)
eney −6.994 ***−6.883 ***
(0.000)(0.000)
trans 0.002 **
(0.042)
constant10.806 ***10.708 ***10.725 ***10.741 ***12.410 ***12.396 ***
(0.000)(0.000)(0.000)(0.000)(0.000)(0.000)
City FEYESYESYESYESYESYES
N253825382538253825382538
adj. R20.9390.9390.9390.9420.9540.954
Note: p-values are in parentheses. *, **, and *** mean significant at the 10%, 5%, and 1% level, respectively.
Table 4. Robustness test I.
VariableChange the Independent VariableChange the Dependent VariableChange the Independent and Dependent Variables
(1)(2)(3)(4)(5)(6)
dige −2.128 ***−0.621 ***
(0.000)(0.006)
dige2−0.119 ***−0.129 *** −2.076 ***−1.226 ***
(0.000)(0.000) (0.000)(0.000)
pnd 0.014 ** 0.247 ** 0.277 ***
(0.034) (0.021) (0.009)
fdi 0.150 *** −2.536 *** −2.163 ***
(0.000) (0.000) (0.000)
fin −0.001 0.017 *** 0.003
(0.127) (0.005) (0.617)
eney 1.637 *** −50.902 *** −29.845 ***
(0.000) (0.000) (0.000)
trans −0.000 0.008 0.006
(0.478) (0.371) (0.538)
constant12.568 ***12.298 ***1.022 *11.515 ***22.417 ***19.037 ***
(0.000)(0.000)(0.051)(0.000)(0.000)(0.000)
City FEYESYESYESYESYESYES
Year FEYESYESYESYESYESYES
N253825382538253825382538
adj. R20.9760.9760.9340.9410.9410.942
Note: p-values are in parentheses. *, **, and *** mean significant at the 10%, 5%, and 1% level, respectively.
Table 5. Robustness test II.
VariableMixed OLS ModelFixed Effects ModelQuantile Regression Model
Q = 0.25Q = 0.5Q = 0.75
(1)(2)(3)(4)(5)(6)(7)
dige−0.963 ***−0.647 *** −0.855 ***−0.695 ***−0.611 ***
(0.000)(0.000) (0.000)(0.000)(0.000)
dige2 −0.364 ***−0.790 ***
(0.000)(0.000)
pnd −0.013 ***0.011−0.016 ***−0.008 ***−0.005 **−0.013 ***
(0.000)(0.151)(0.000)(0.006)(0.027)(0.000)
fdi −0.139 *−0.046−0.079−0.082−0.078−0.283 ***
(0.055)(0.249)(0.300)(0.502)(0.402)(0.001)
fin 0.0000.001 ***−0.0000.001 ***0.0000.000
(0.164)(0.003)(0.633)(0.006)(0.240)(0.379)
eney −5.178 ***−0.385−1.220 ***−3.379 ***−4.247 ***−5.673 ***
(0.000)(0.228)(0.002)(0.000)(0.000)(0.000)
trans −0.001 ***0.001−0.000−0.001−0.000 *−0.000
(0.010)(0.299)(0.739)(0.318)(0.081)(0.166)
constant9.327 ***11.003 ***14.488 ***18.127 ***10.141 ***10.691 ***11.221 ***
(0.000)(0.000)(0.000)(0.000)(0.000)(0.000)(0.000)
City FE YESNOYESYESYES
Year FE NOYESYESYESYES
N2538253825382538253825382538
adj. R20.5710.6050.9680.6610.9190.9300.930
Note: p-values are in parentheses. *, **, and *** mean significant at the 10%, 5%, and 1% level, respectively.
Table 6. Robustness test III.
VariablePMGMGDFE
(1)(2)(3)
long-run coefficients d i g e −4.501 ***53.964−0.325 ***
(0.000)(0.321)(0.000)
short-run coefficientsEC item−0.087 ***−0.465 ***−0.342 ***
(0.000)(0.000)(0.000)
Δ d i g e 0.2157 ***0.346 ***0.074 ***
(0.000)(0.000)(0.001)
constant0.086 ***3.953 ***3.720 ***
(0.000)(0.000)(0.000)
Hausman test0.020.260.00
(0.894)(0.610)(0.998)
Note: p-values are in parentheses. *** means significant at the 1% level. Hausman test is the χ2-value. Hausman test in column 1 is used to compare PMG and DFE, Hausman test in column 2 is used to compare MG and PMG, and Hausman test in column 3 is used to compare MG and DFE.
Table 7. Endogeneity test results.
VariableIV_landIV_postBoth IV_land and IV_post“Broadband China” Strategy
(1)(2)(3)(4)(5)(6)(7)(8)
dige −2.953 *** −0.827 *** −1.658 ***
(0.000) (0.000) (0.000)
DID −0.004 **−0.071 ***
(0.010)(0.004)
IV_land−0.288 *** −0.023 ***
(0.004) (0.001)
IV_post 7.395 *** 6.485 ***
(0.007) (0.002)
pnd0.017 *−0.0450.021 **−0.0090.021 **−0.0230.013 **0.287 ***
(0.077)(0.139)(0.033)(0.426)(0.031)(0.196)(0.037)(0.006)
fdi−0.017 ***−0.0270.036−0.127 **0.049−0.0880.170 ***−1.571 ***
(0.750)(0.865)(0.502)(0.035)(0.347)(0.352)(0.000)(0.007)
fin0.0040.0010.001 *0.004 ***0.0010.003 ***−0.000−0.005
(0.416)(0.453)(0.093)(0.000)(0.755)(0.001)(0.310)(0.467)
eney−2.630 ***9.107 ***−4.097 ***−2.980 ***−1.823 ***1.744 *1.227 ***−22.748 ***
(0.144)(0.000)(0.000)(0.000)(0.000)(0.100)(0.000)(0.000)
trans0.002 ***−0.005 *0.002 **−0.0000.002 **−0.002−0.0000.001
(0.008)(0.053)(0.025)(0.917)(0.030)(0.176)(0.566)(0.904)
Year FEYESYESYESYESYESYESYESYES
City FEYESYESYESYESYESYESYESYES
Anderson LM 56.502 *** 81.181 *** 116.850 ***
Wald F 57.799 *** 83.987 *** 61.425 ***
F57.800 83.990 61.430
N25382538253825382538253825382538
Note: p-values are in parentheses. *, **, and *** mean significant at the 10%, 5%, and 1% level, respectively.
Table 8. Mechanism test results.
VariableUpgrading of Industrial StructureGreen InnovationAll
is1CO2is2CO2griCO2CO2
(1)(2)(3)(4)(5)(6)(7)
dige0.373 **−0.140 ***3.040 ***−0.117 ***1.199 ***−0.120 ***−0.113 ***
(0.020)(0.000)(0.000)(0.000)(0.000)(0.000)(0.000)
is1 0.032 *** 0.007 **
(0.000) (0.023)
is2 0.050 *** 0.043 ***
(0.000) (0.000)
gri 0.007 ***0.007 ***
(0.000)(0.000)
pnd−0.0920.016 ***−0.301 ***0.013 **0.0080.014 **0.014 **
(0.137)(0.007)(0.000)(0.029)(0.951)(0.031)(0.019)
fdi1.312 ***0.108 ***1.513 **0.101 ***−1.0200.142 ***0.092 ***
(0.000)(0.001)(0.015)(0.002)(0.156)(0.000)(0.005)
fin0.000−0.001−0.008 **−0.001−0.027 ***−0.001 **−0.001 **
(0.951)(0.105)(0.013)(0.139)(0.000)(0.038)(0.041)
eney−111.660 ***5.158 ***−119.733 ***7.665 ***37.999 ***1.919 ***7.837 ***
(0.000)(0.000)(0.000)(0.000)(0.000)(0.000)(0.000)
trans−0.005−0.0000.023 ***0.000−0.006−0.0000.000
(0.325)(0.668)(0.000)(0.611)(0.614)(0.427)(0.741)
constant25.788 ***11.485 ***8.298 ***10.675 ***−20.137 ***12.148 ***10.590 ***
(0.000)(0.000)(0.000)(0.000)(0.000)(0.000)(0.000)
Year FEYESYESYESYESYESYESYES
City FEYESYESYESYESYESNOYES
N2538253825382538253825382538
adj. R20.9410.9790.6070.9800.9590.9770.980
Note: p-values are in parentheses. **, and *** mean significant at the 5%, and 1% level, respectively.
Table 9. Mediating effect test results.
Observed Coef.Bootstrap Std.zp > |z|Normal Base 95% Conf. Interval
is1
_bs_1−0.0270.009−3.110.002[−0.044, −0.010]
_bs_2−0.5900.028−20.910.000[−0.646, −0.535]
is2
_bs_10.0350.0084.480.000[0.019, 0.049]
_bs_2−0.6820.039−17.420.000[−0.759, −0.605]
gri
_bs_1−0.7250.013−5.570.000[−0.098, −0.047]
_bs_2−0.5450.030−18.420.000[−0.603, −0.487]
Table 10. Temporal and spatial heterogeneity.
Variable2011–20132014–20162017–2019EasternCentralWestern
(1)(2)(3)(4)(5)(6)
dige−0.073 **−0.693 ***−0.583 ***−0.086 ***−0.028−0.029
(0.046)(0.000)(0.000)(0.010)(0.304)(0.211)
pnd0.046−0.014 ***−0.014 ***0.0190.0010.044 ***
(0.183)(0.000)(0.000)(0.436)(0.910)(0.008)
fdi−0.191−0.046−0.196−0.300 ***0.168 **0.311 **
(0.235)(0.753)(0.162)(0.000)(0.011)(0.028)
fin−0.008 ***0.0000.0000.010 ***−0.000−0.001
(0.003)(0.616)(0.882)(0.000)(0.986)(0.221)
eney25.397 ***−4.588 ***−5.667 ***−7.451 ***0.7133.162 ***
(0.000)(0.000)(0.000)(0.000)(0.213)(0.000)
trans0.003−0.001−0.001 *−0.0000.0020.001
(0.655)(0.199)(0.052)(0.478)(0.300)(0.906)
constant7.007 ***10.794 ***11.255 ***12.554 ***11.407 ***10.763 ***
(0.000)(0.000)(0.000)(0.000)(0.000)(0.000)
Year FEYESYESYESYESYESYES
City FEYESYESYESYESYESYES
N846846846900891747
adj. R20.9730.5940.5820.9550.9580.971
Note: p-values are in parentheses. *, **, and *** mean significant at the 10%, 5%, and 1% level, respectively.
Table 11. City type heterogeneity.
VariableGrowingMatureRecessionaryRegenerativeNon-Resource-BasedProvincial CapitalMunicipality Directly under the Central GovernmentNon-Provincial Capital
(1)(2)(3)(4)(5)(7)(8)(9)
dige−0.170 **−0.075 **−0.020−0.380 ***−0.122 ***−0.266 ***−0.172 **−0.127 ***
(0.016)(0.022)(0.687)(0.000)(0.000)(0.000)(0.043)(0.000)
pnd0.028−0.031 *−0.0080.0120.013−0.008−0.0940.013 *
(0.814)(0.059)(0.583)(0.878)(0.277)(0.645)(0.643)(0.065)
fdi0.6550.1960.445 **0.040−0.093 *−0.156 *−0.280 ***0.168 ***
(0.441)(0.205)(0.049)(0.728)(0.066)(0.078)(0.007)(0.000)
fin0.003 ***0.001−0.009 ***0.0060.008 ***0.005 *0.069 ***−0.001
(0.002)(0.327)(0.002)(0.167)(0.000)(0.090)(0.006)(0.118)
eney−2.5890.3941.6872.863 **−8.022 ***−3.190 ***−4.220 **1.671 ***
(0.168)(0.511)(0.129)(0.028)(0.000)(0.000)(0.014)(0.000)
trans0.060 ***0.0010.0020.014−0.0000.016 ***−0.005−0.000
(0.008)(0.782)(0.531)(0.264)(0.890)(0.007)(0.150)(0.580)
constant11.474 ***11.534 ***11.235 ***14.086 ***12.560 ***14.299 ***14.375 ***12.271 ***
(0.000)(0.000)(0.000)(0.000)(0.000)(0.000)(0.000)(0.000)
Year FEYESYESYESYESYESYESYESYES
City FEYESYESYESYESYESYESYESYES
N1265402071261539234362268
adj. R20.9280.9640.9220.9810.9580.9740.7930.972
Note: p-values are in parentheses. *, **, and *** mean significant at the 10%, 5%, and 1% level, respectively.
Disclaimer/Publisher’s Note: The statements, opinions and data contained in all publications are solely those of the individual author(s) and contributor(s) and not of MDPI and/or the editor(s). MDPI and/or the editor(s) disclaim responsibility for any injury to people or property resulting from any ideas, methods, instructions or products referred to in the content.

