
A Procedure for Evaluating Historical Land Use Change and Resilience in Highly Reclaimed Coastal Areas: The Case of the Tavoliere di Puglia (Southern Italy)

 , , and
Abstract
:1. Introduction
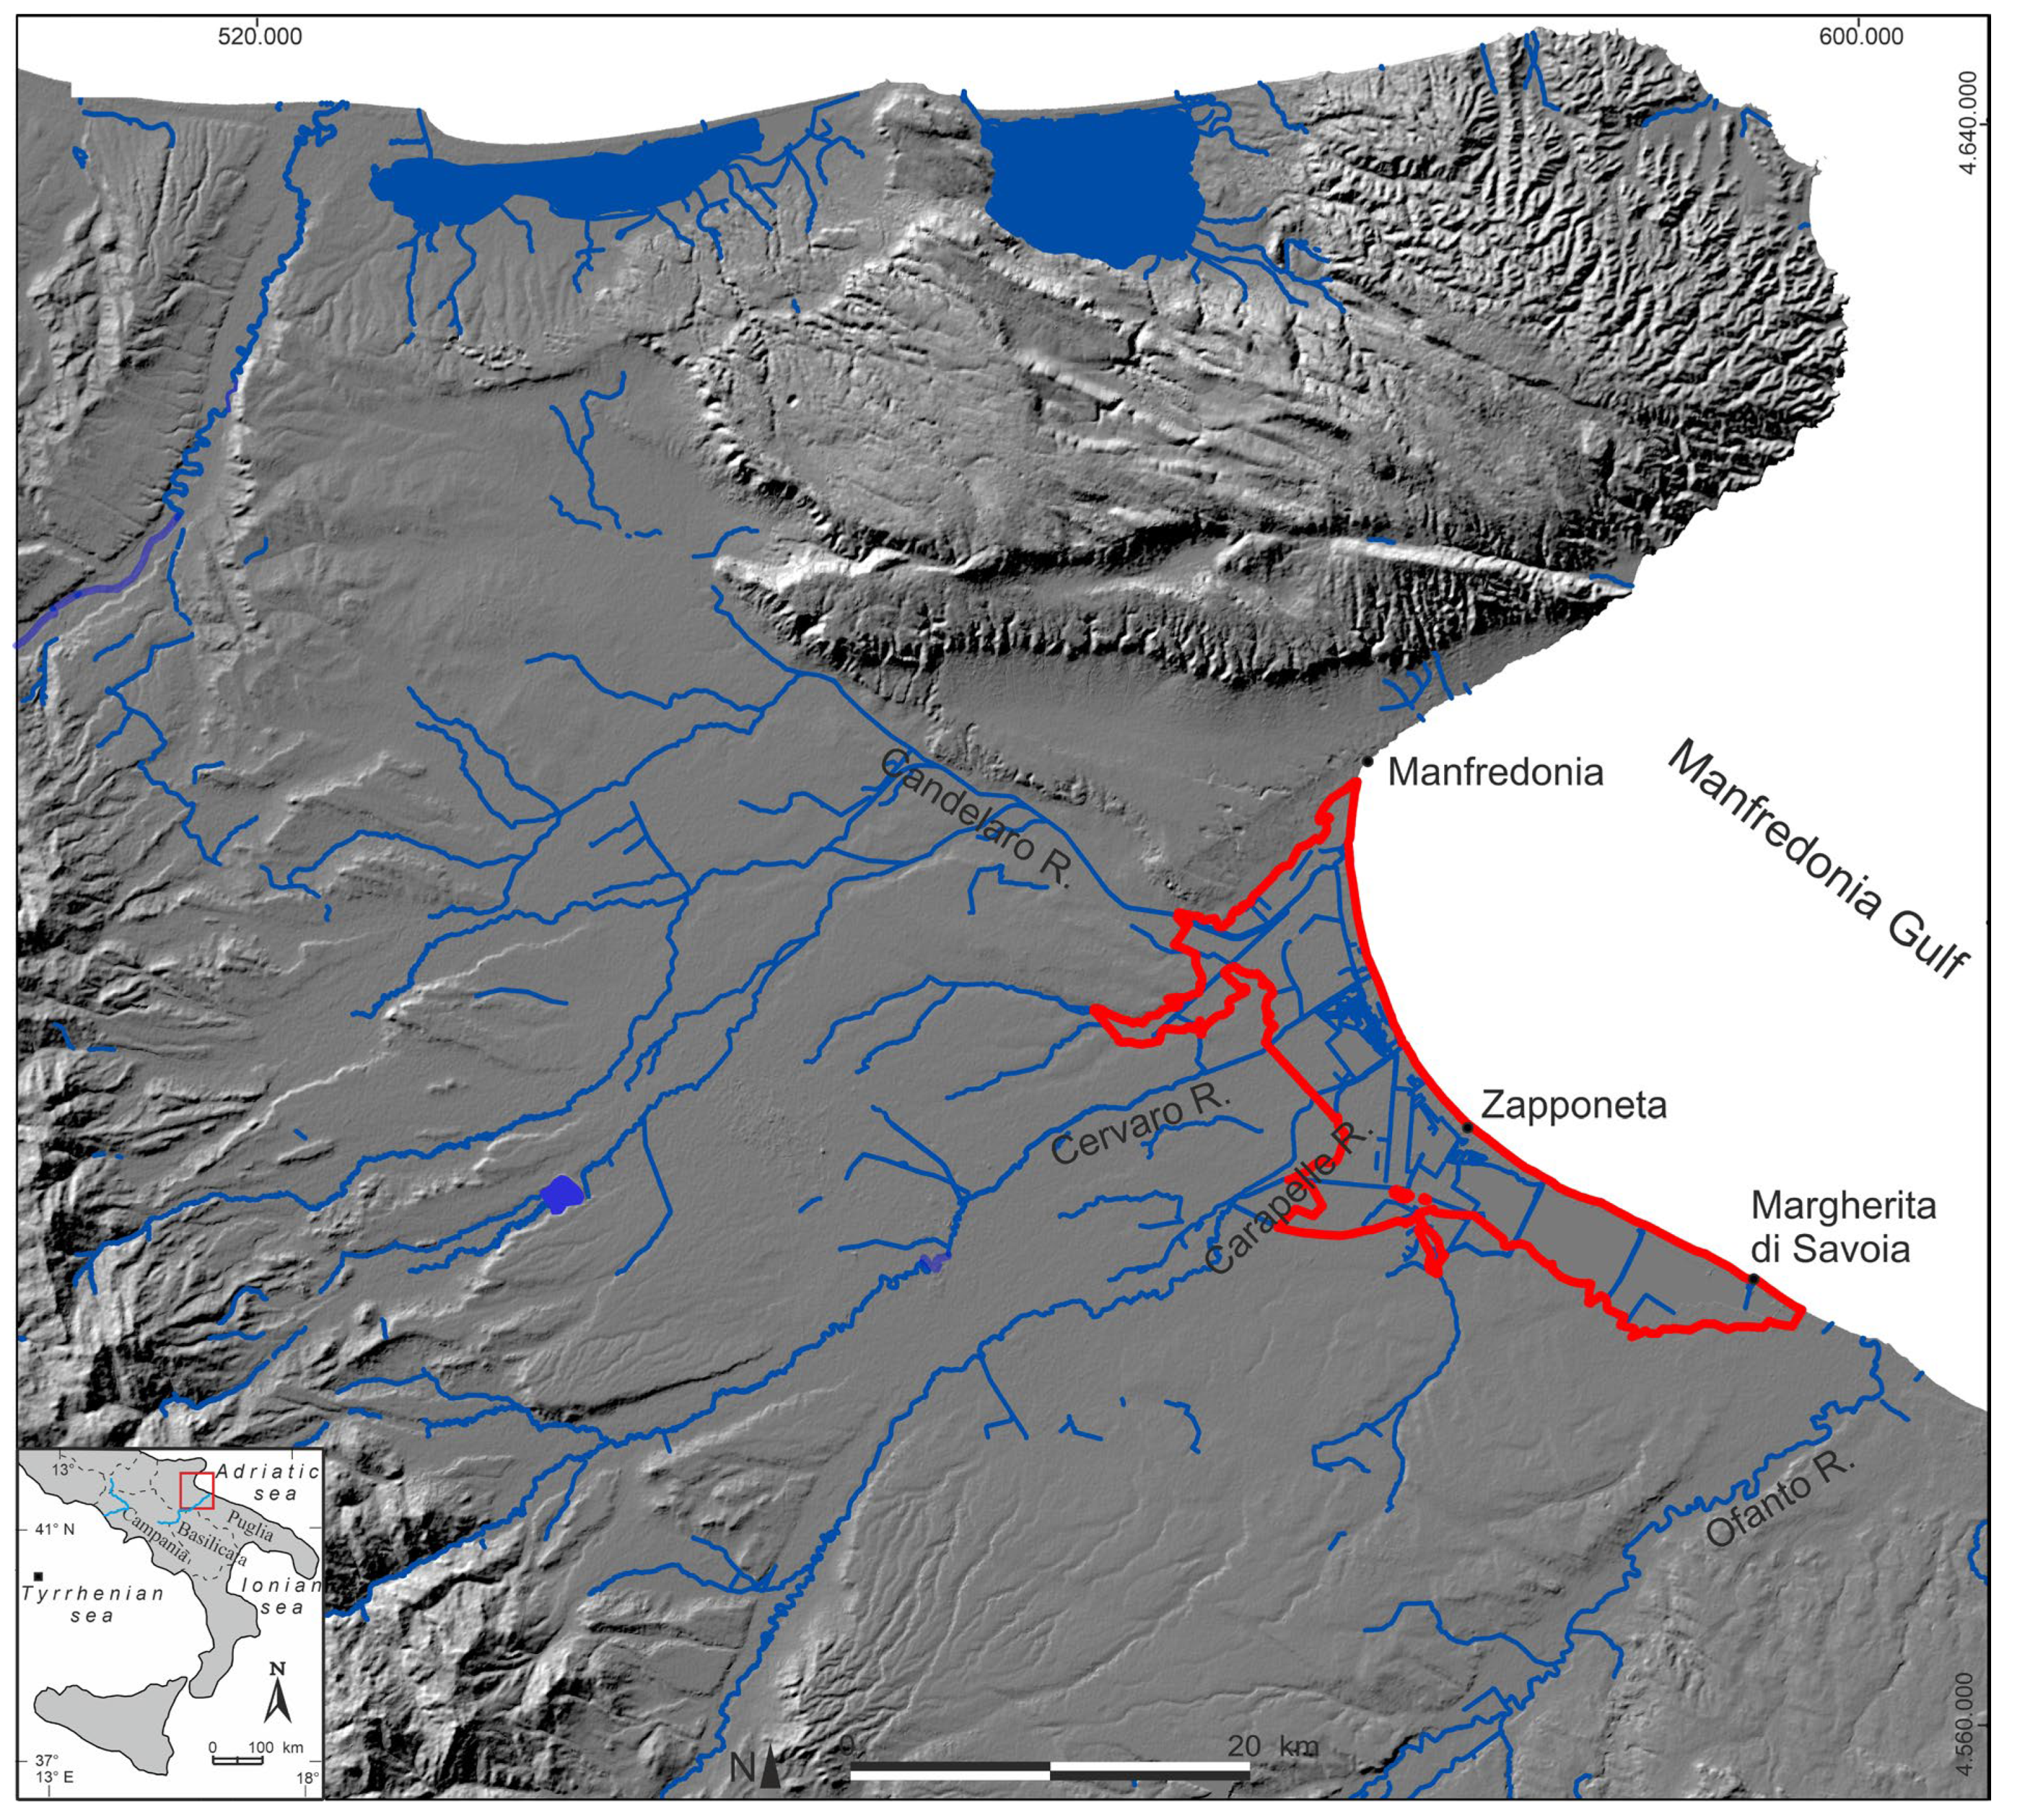
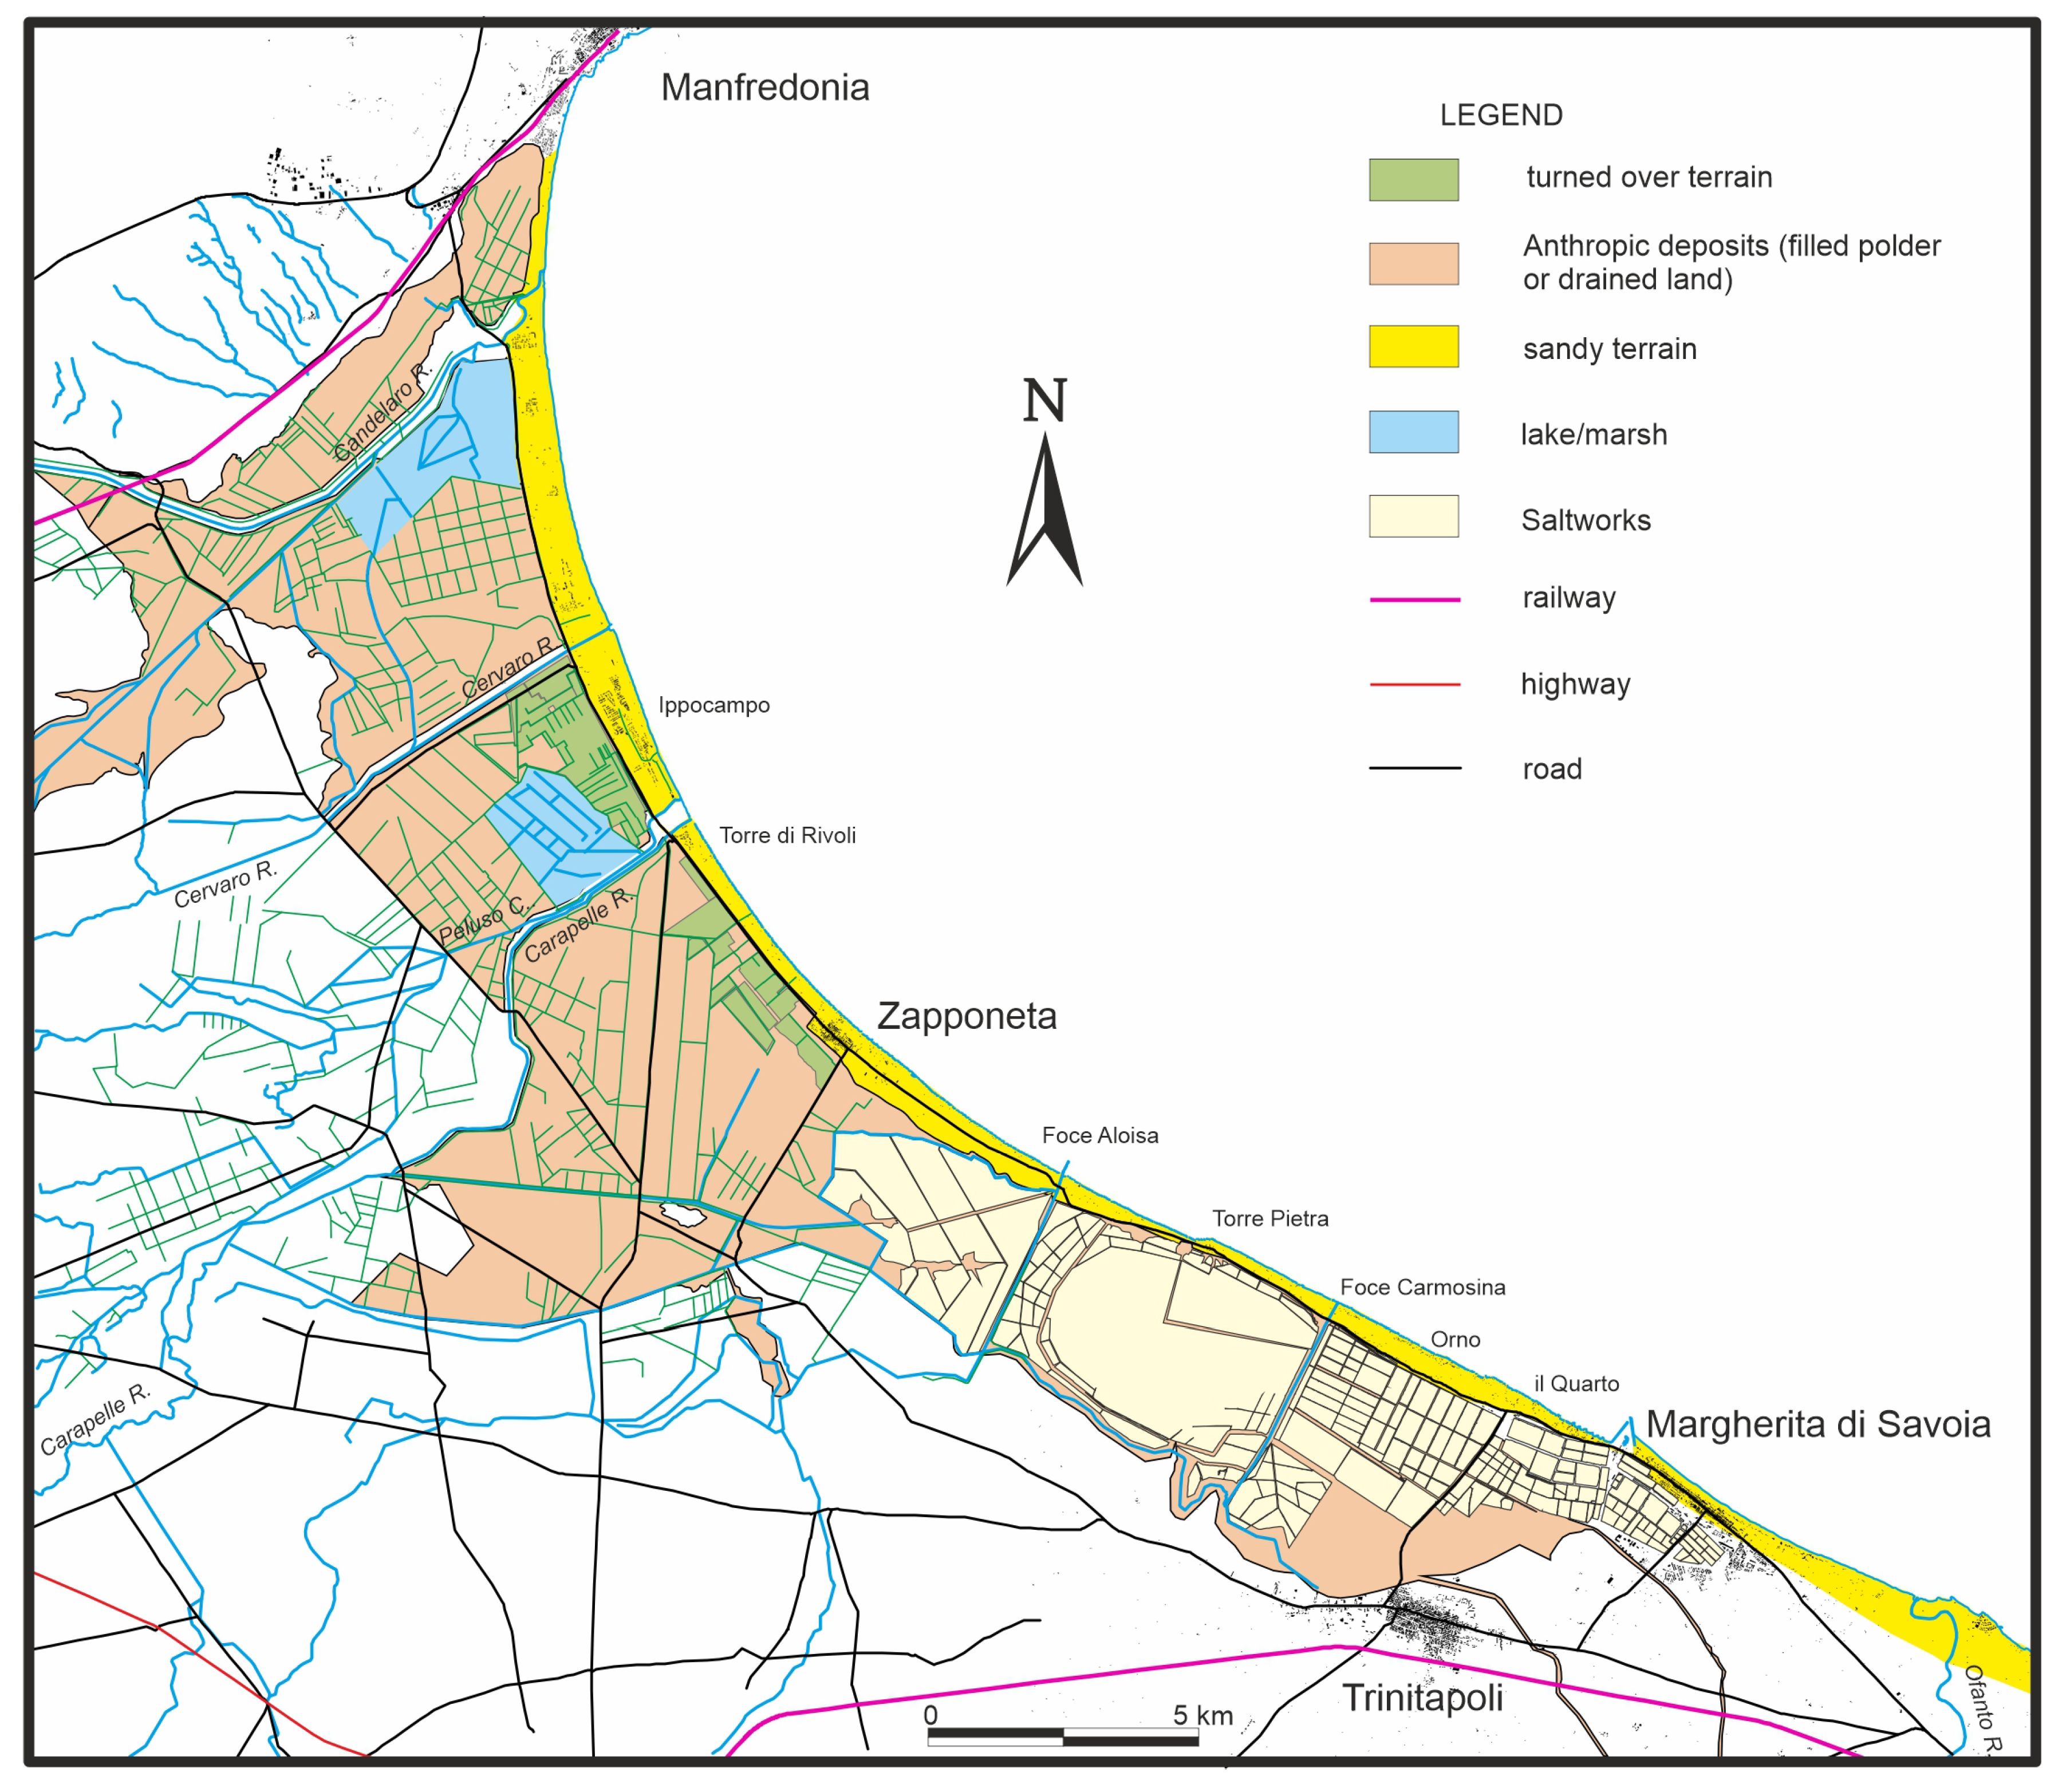
2. Study Area

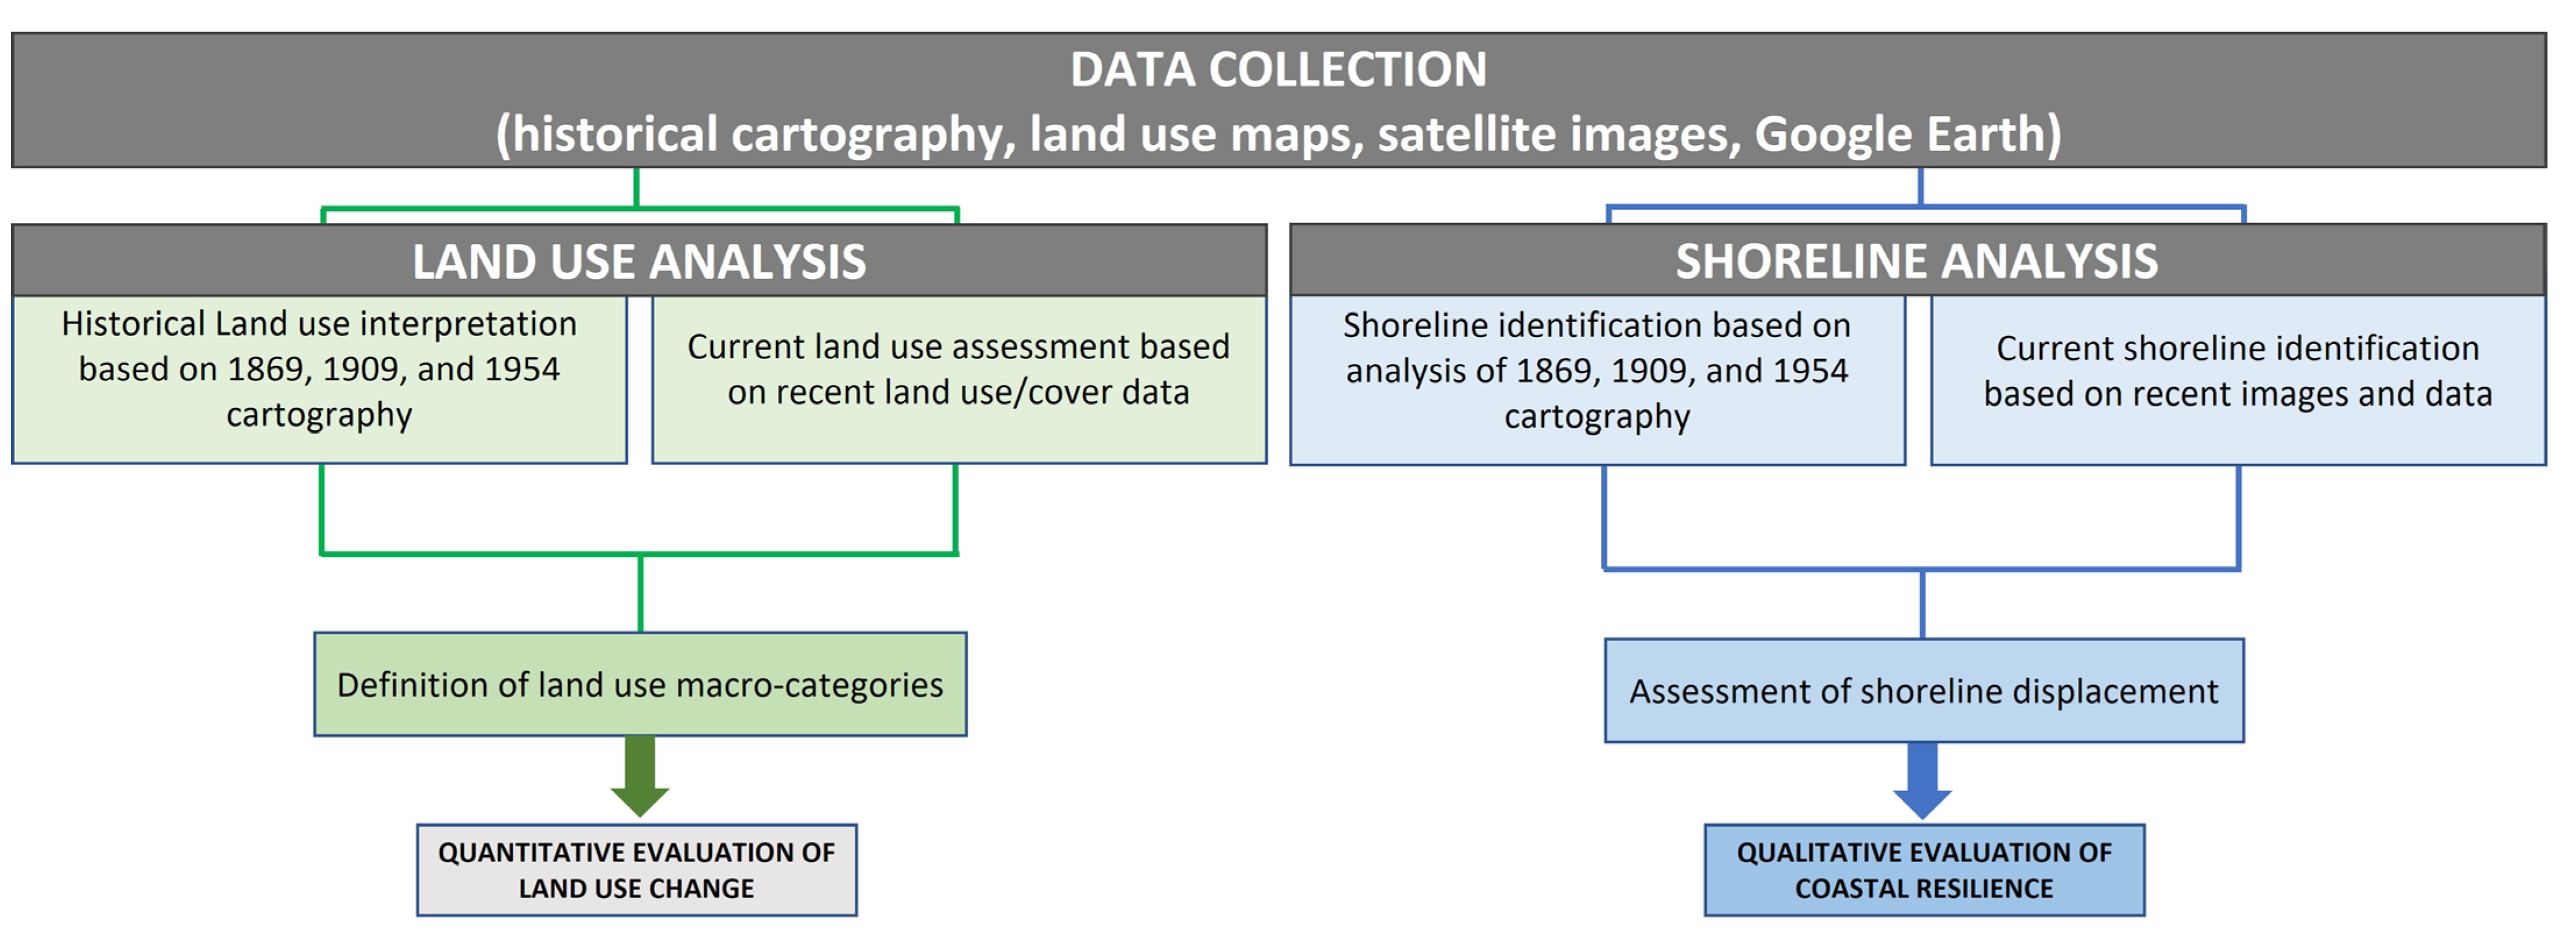
3. Materials and Methods
3.1. Data Collection
3.2. Land Use Analysis
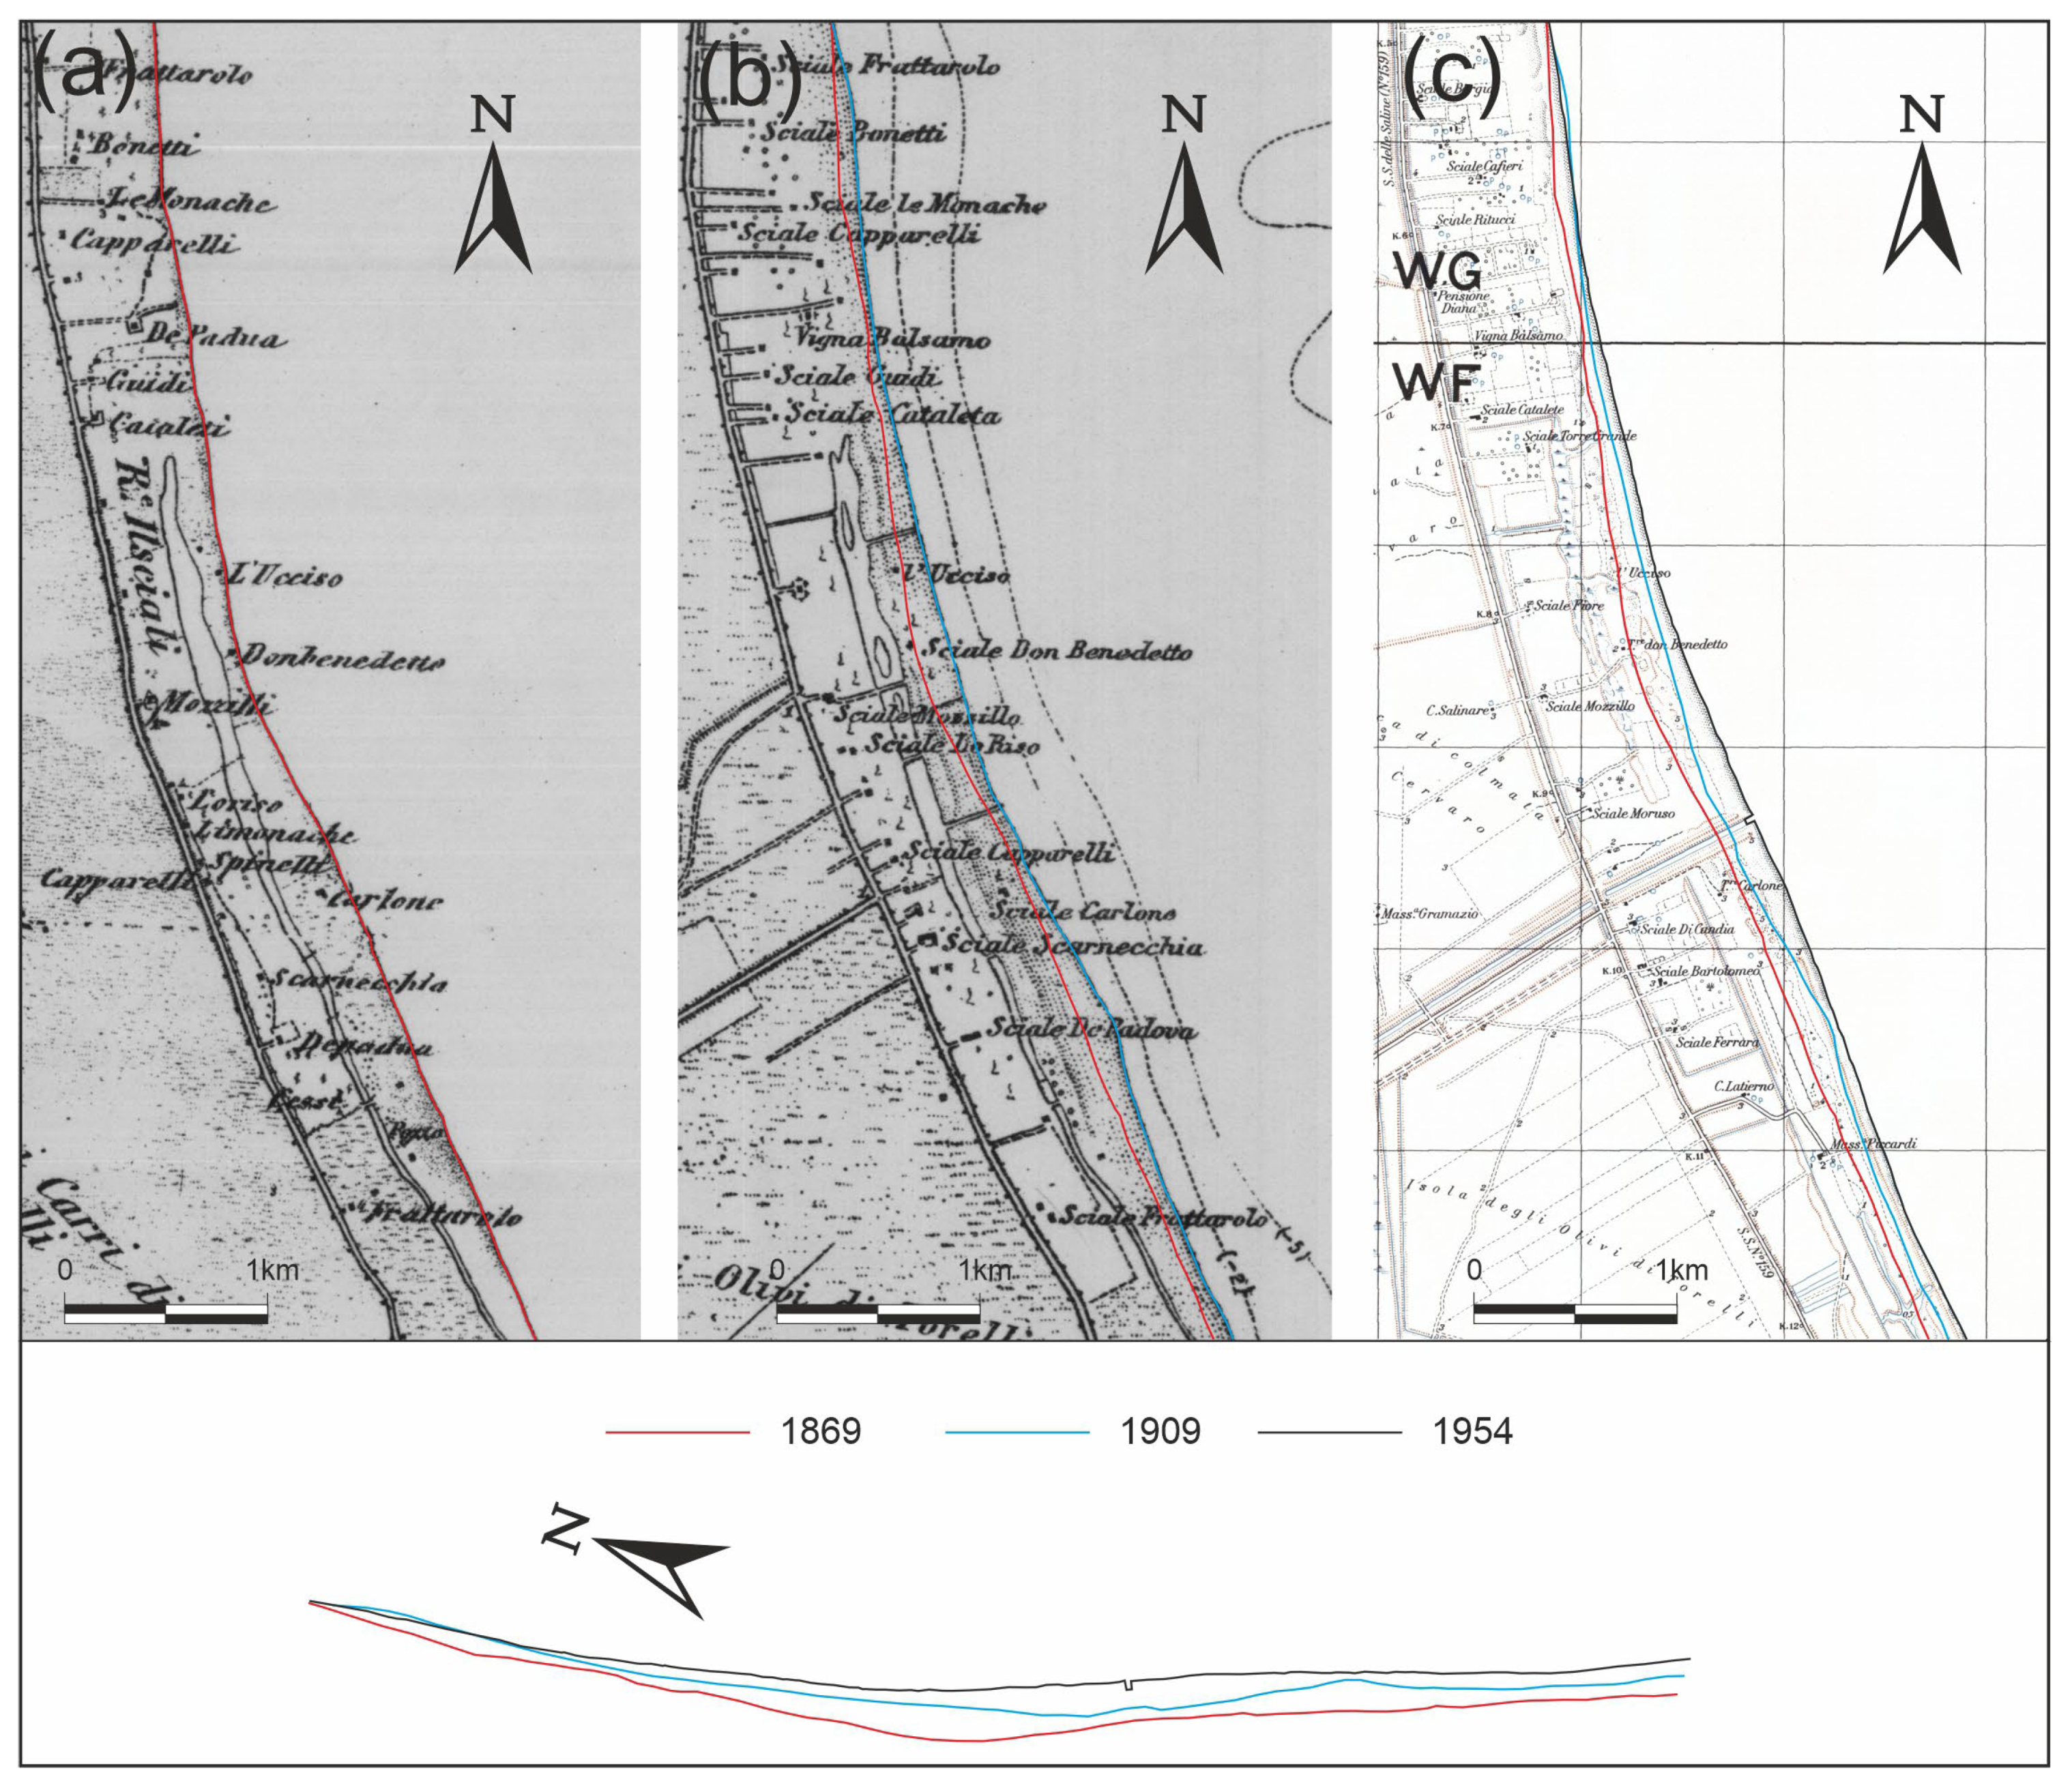
3.3. Shoreline Analysis
4. Results
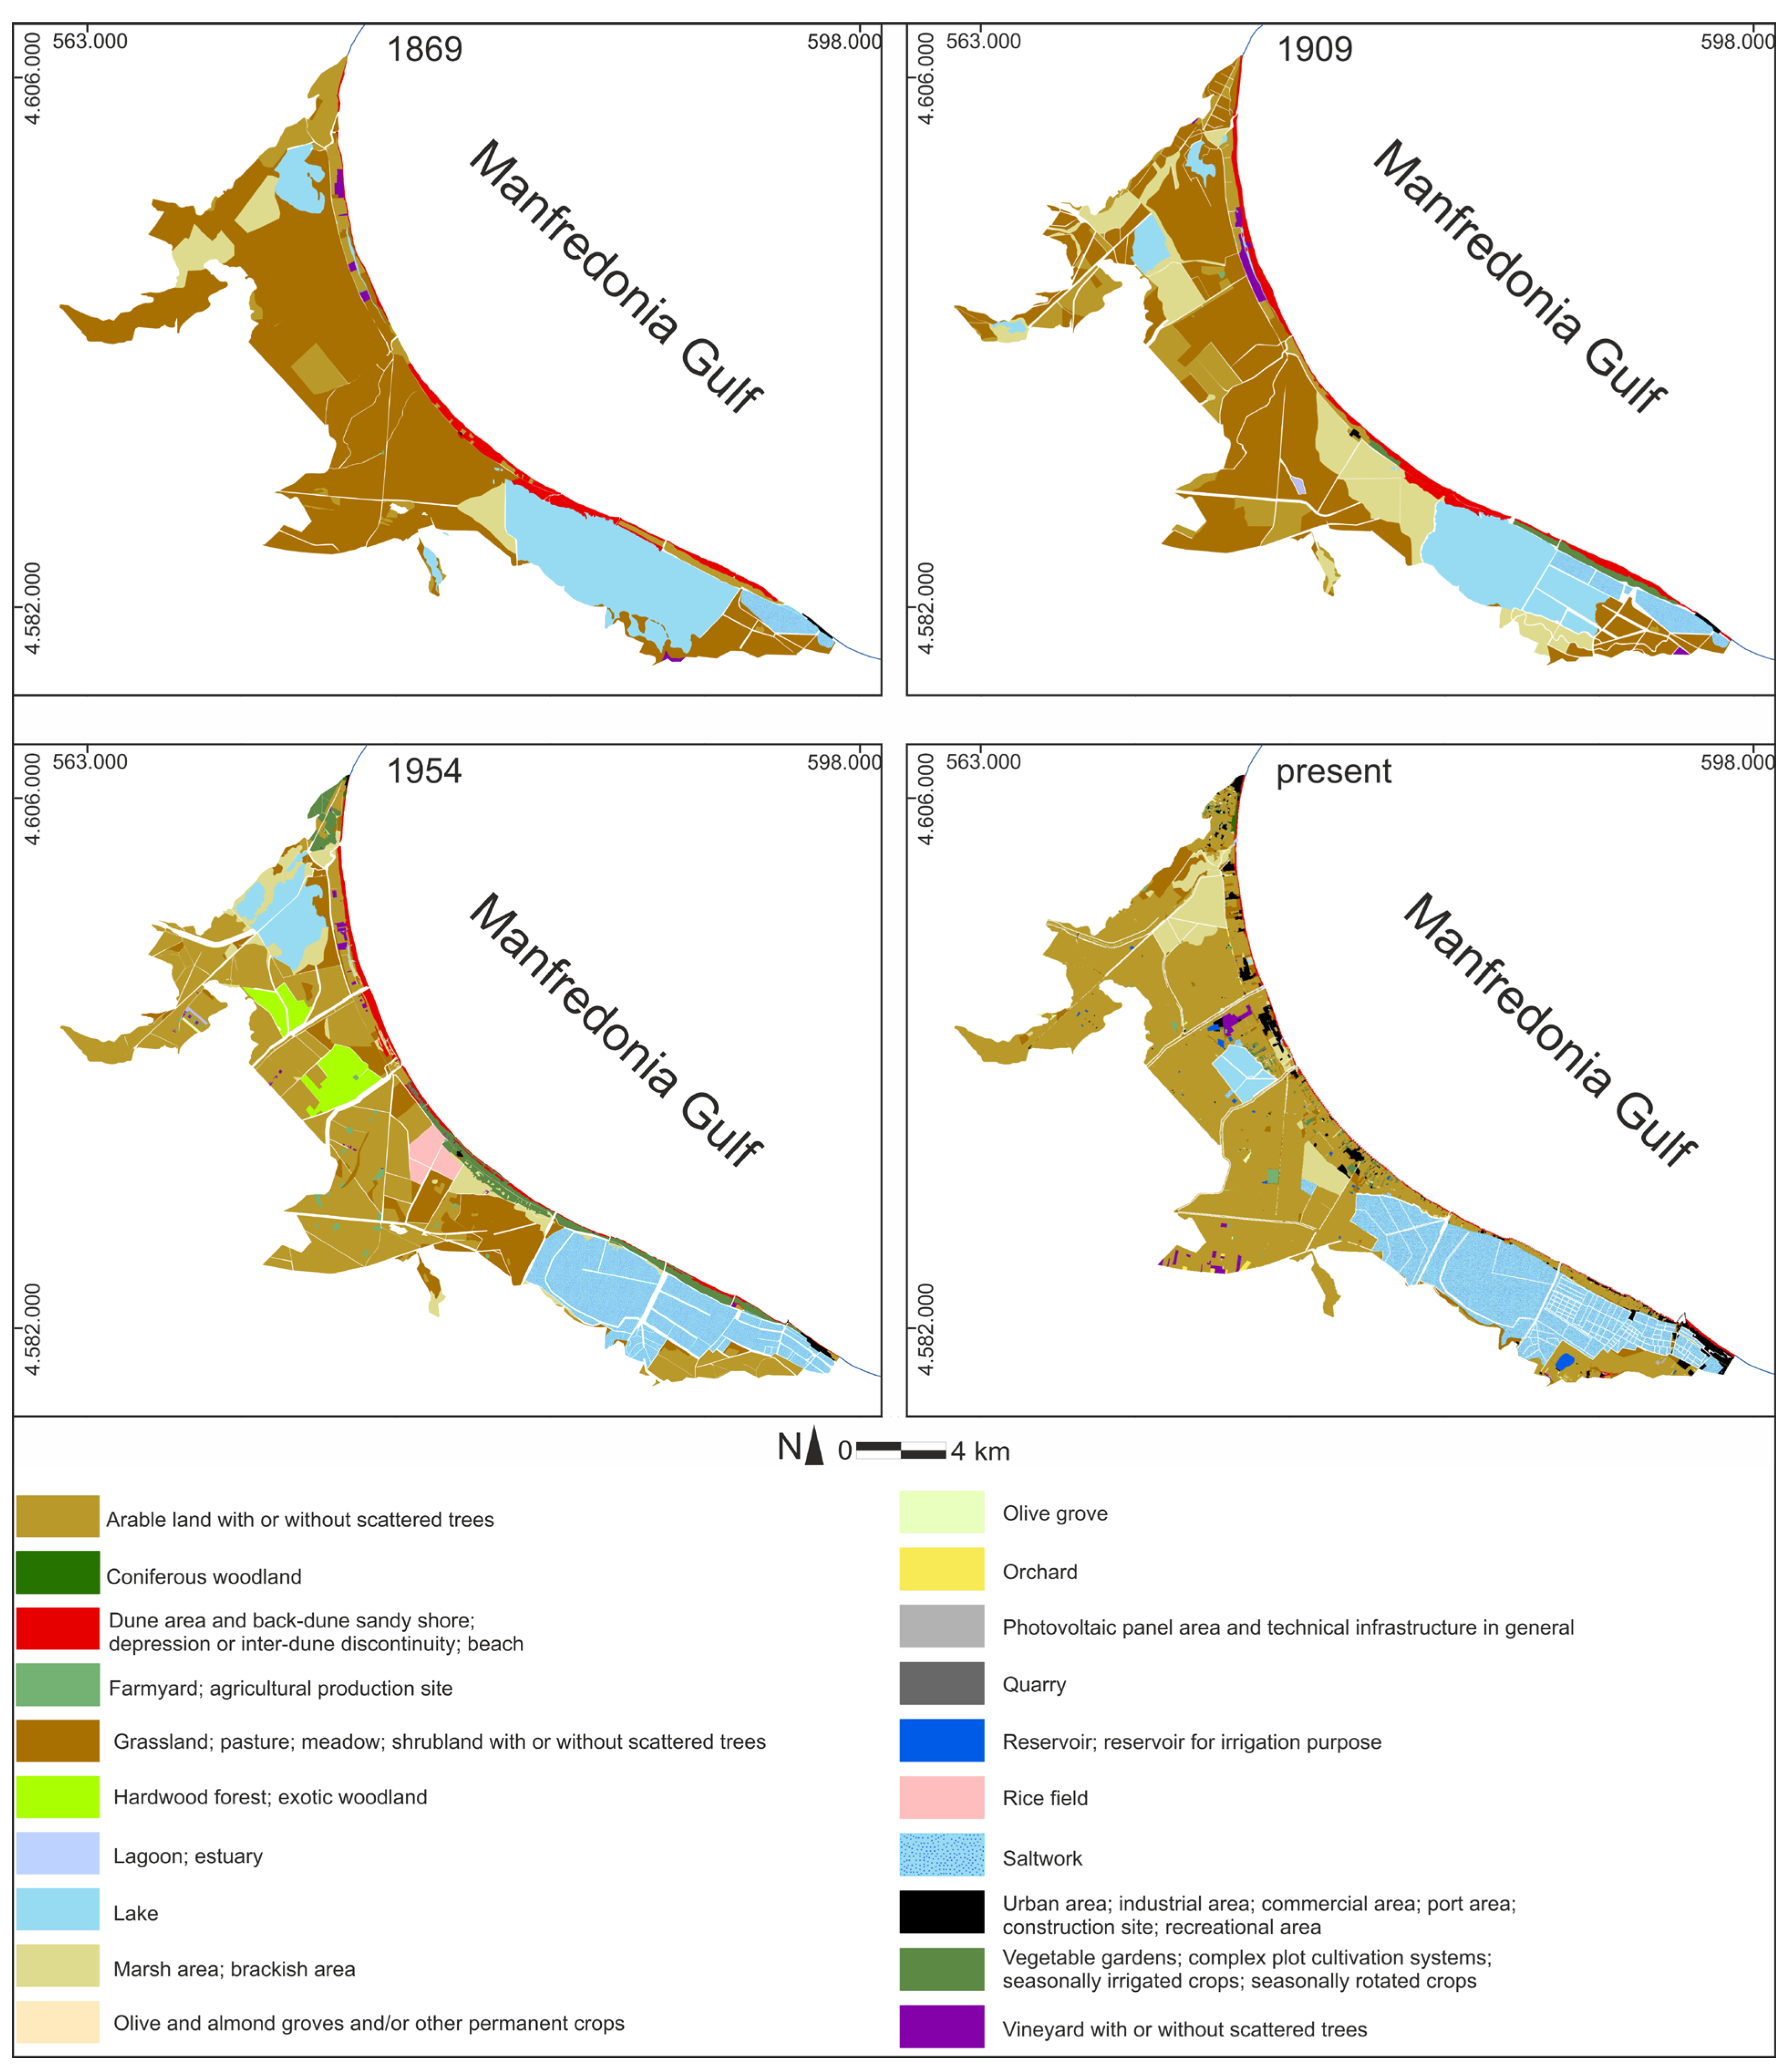
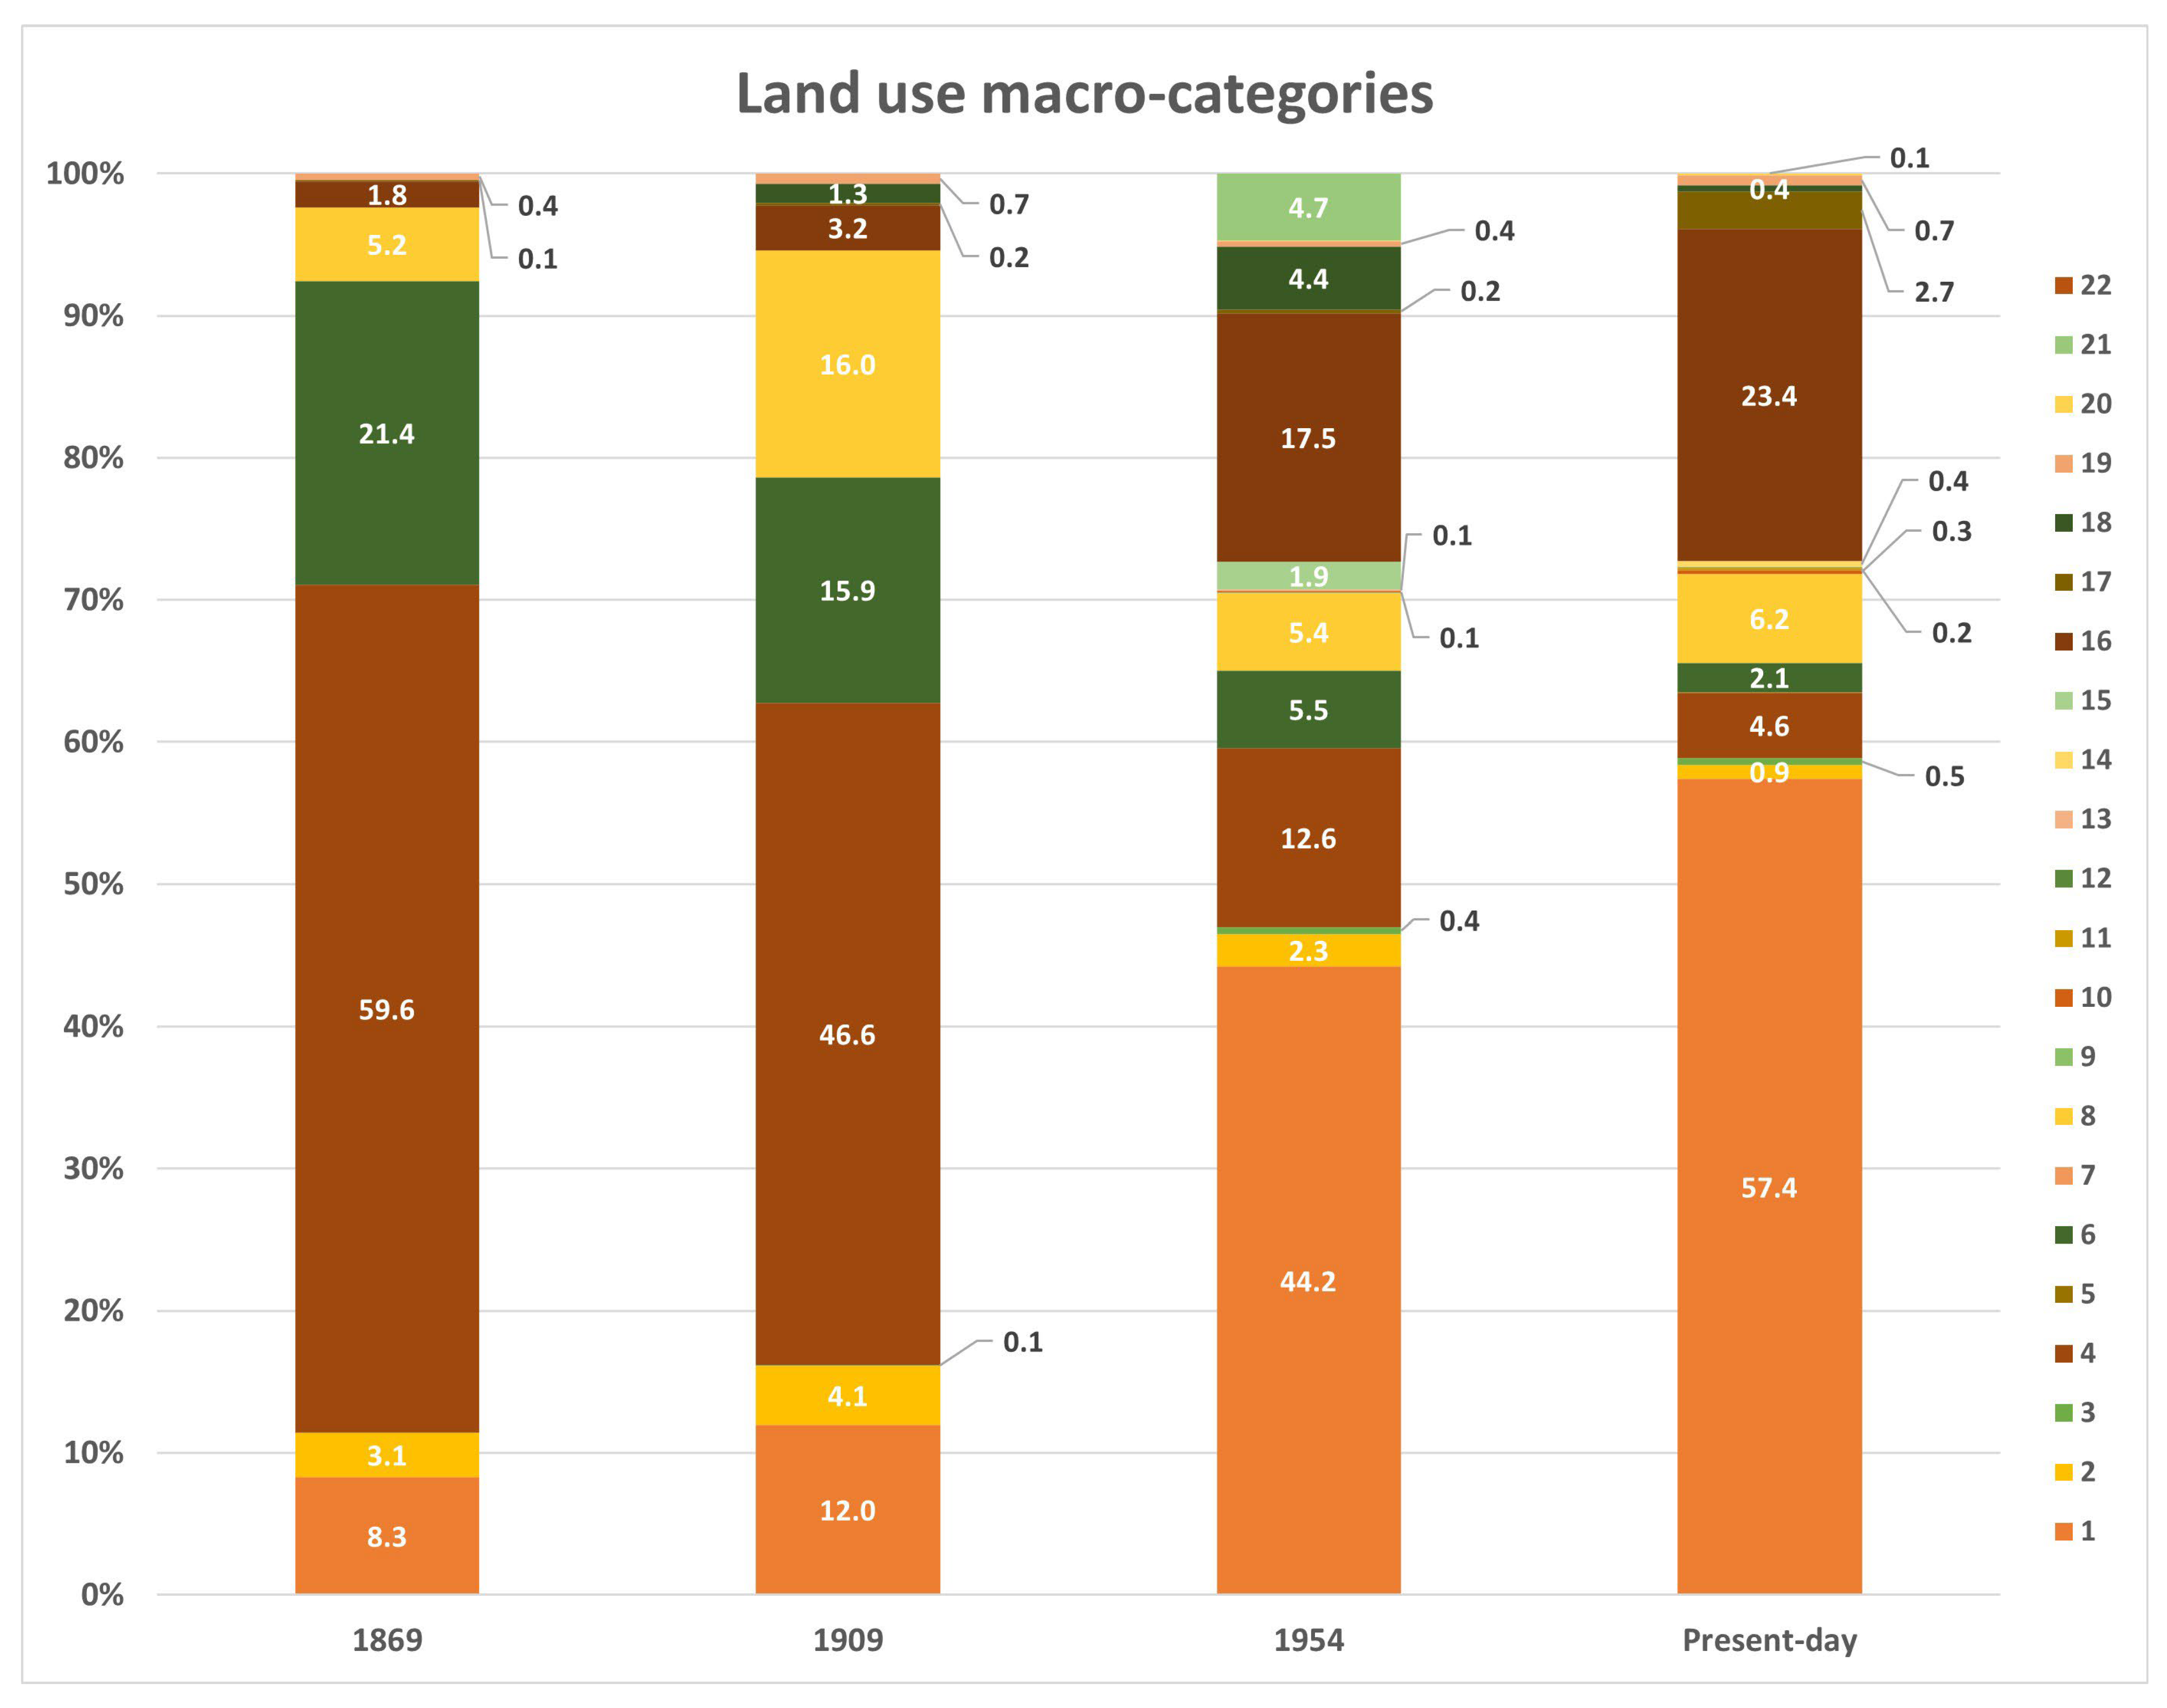
4.1. Definition of Land Use Macro-Categories and Quantitative Land Use Change
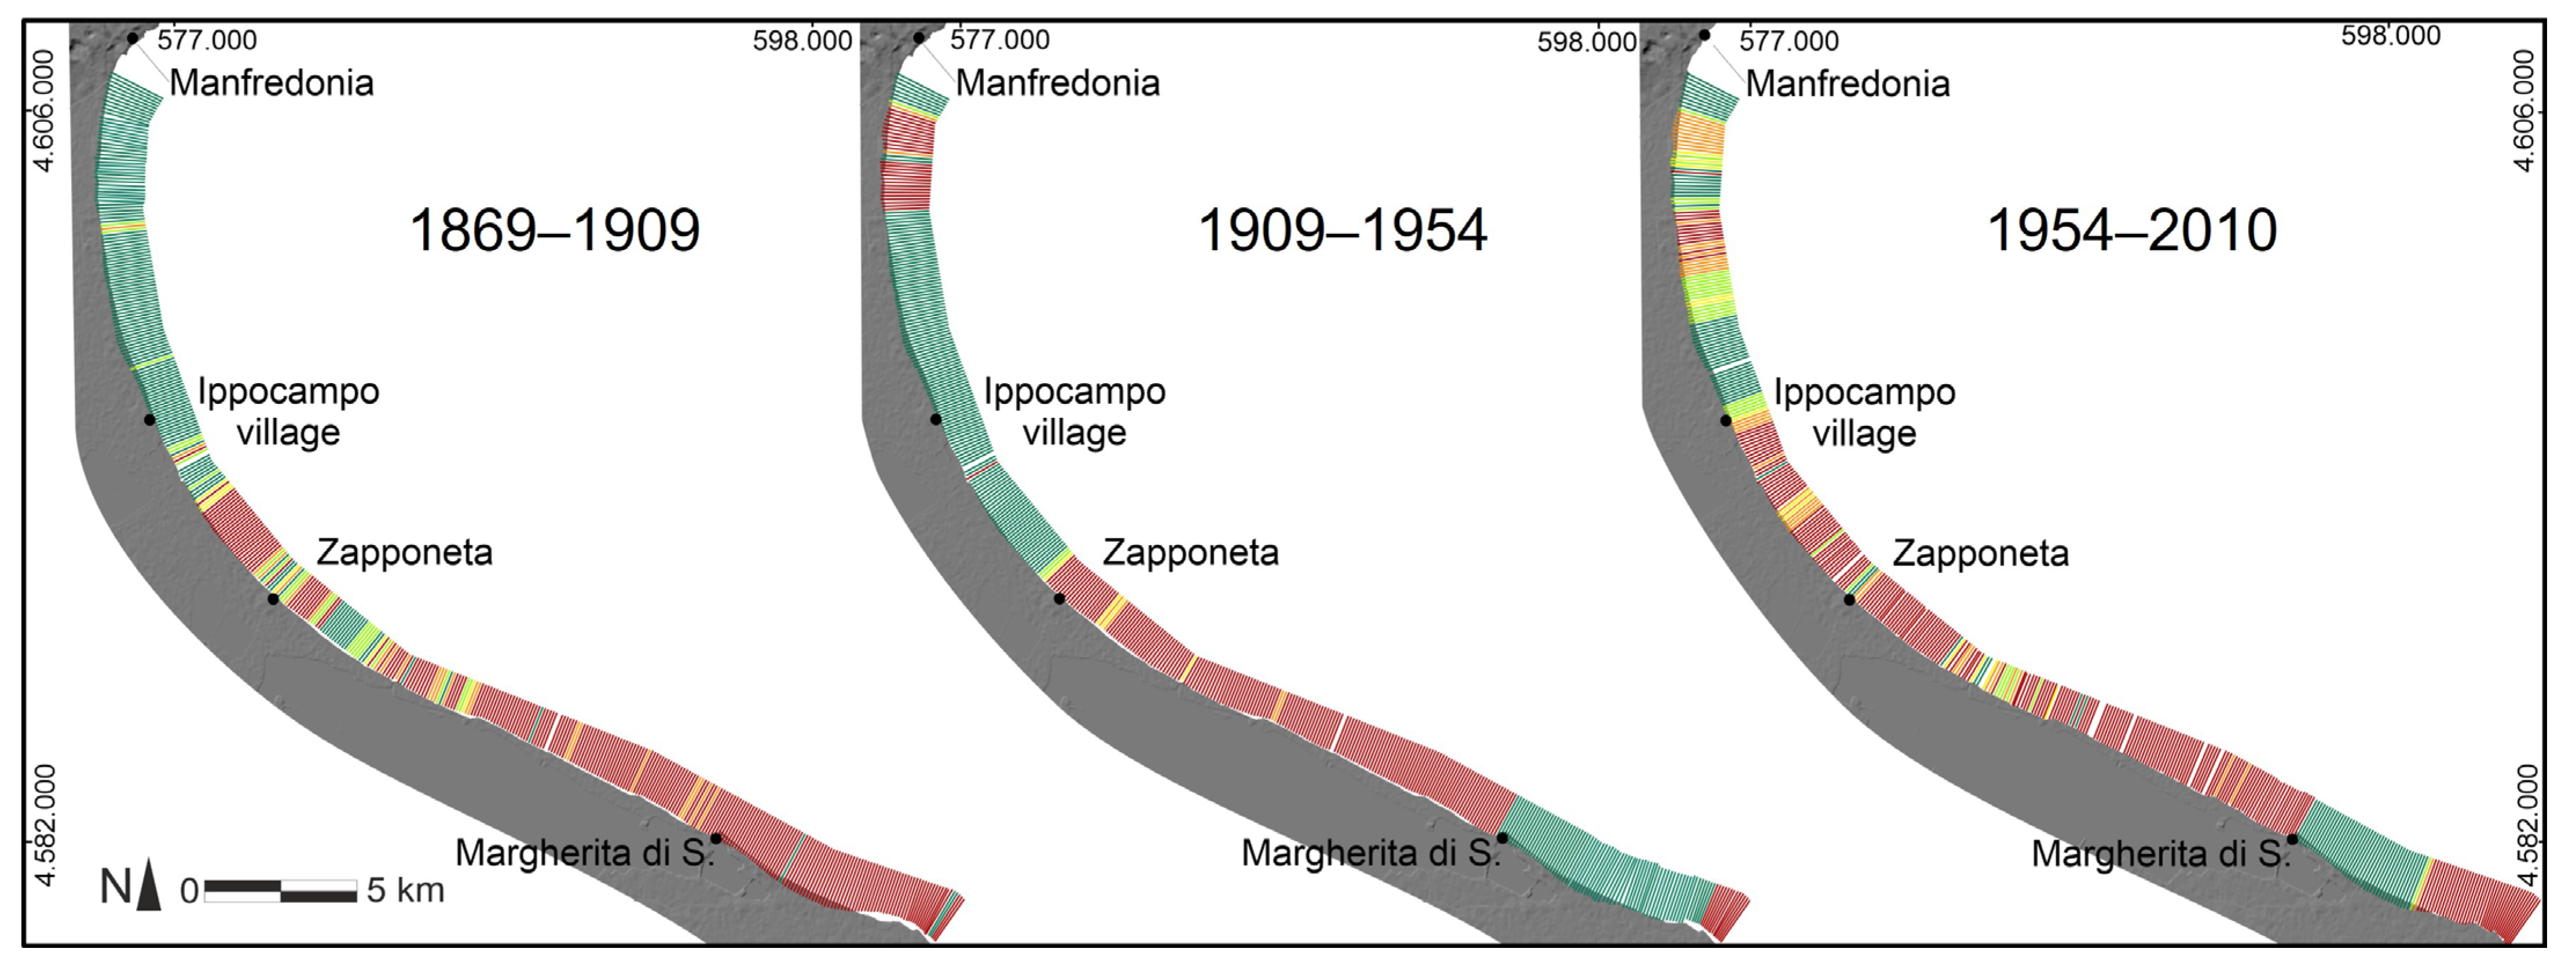
4.2. Assessment of Shoreline Displacements and Qualitative Analysis of Coastal Resilience
5. Discussion
5.1. Land Use Change
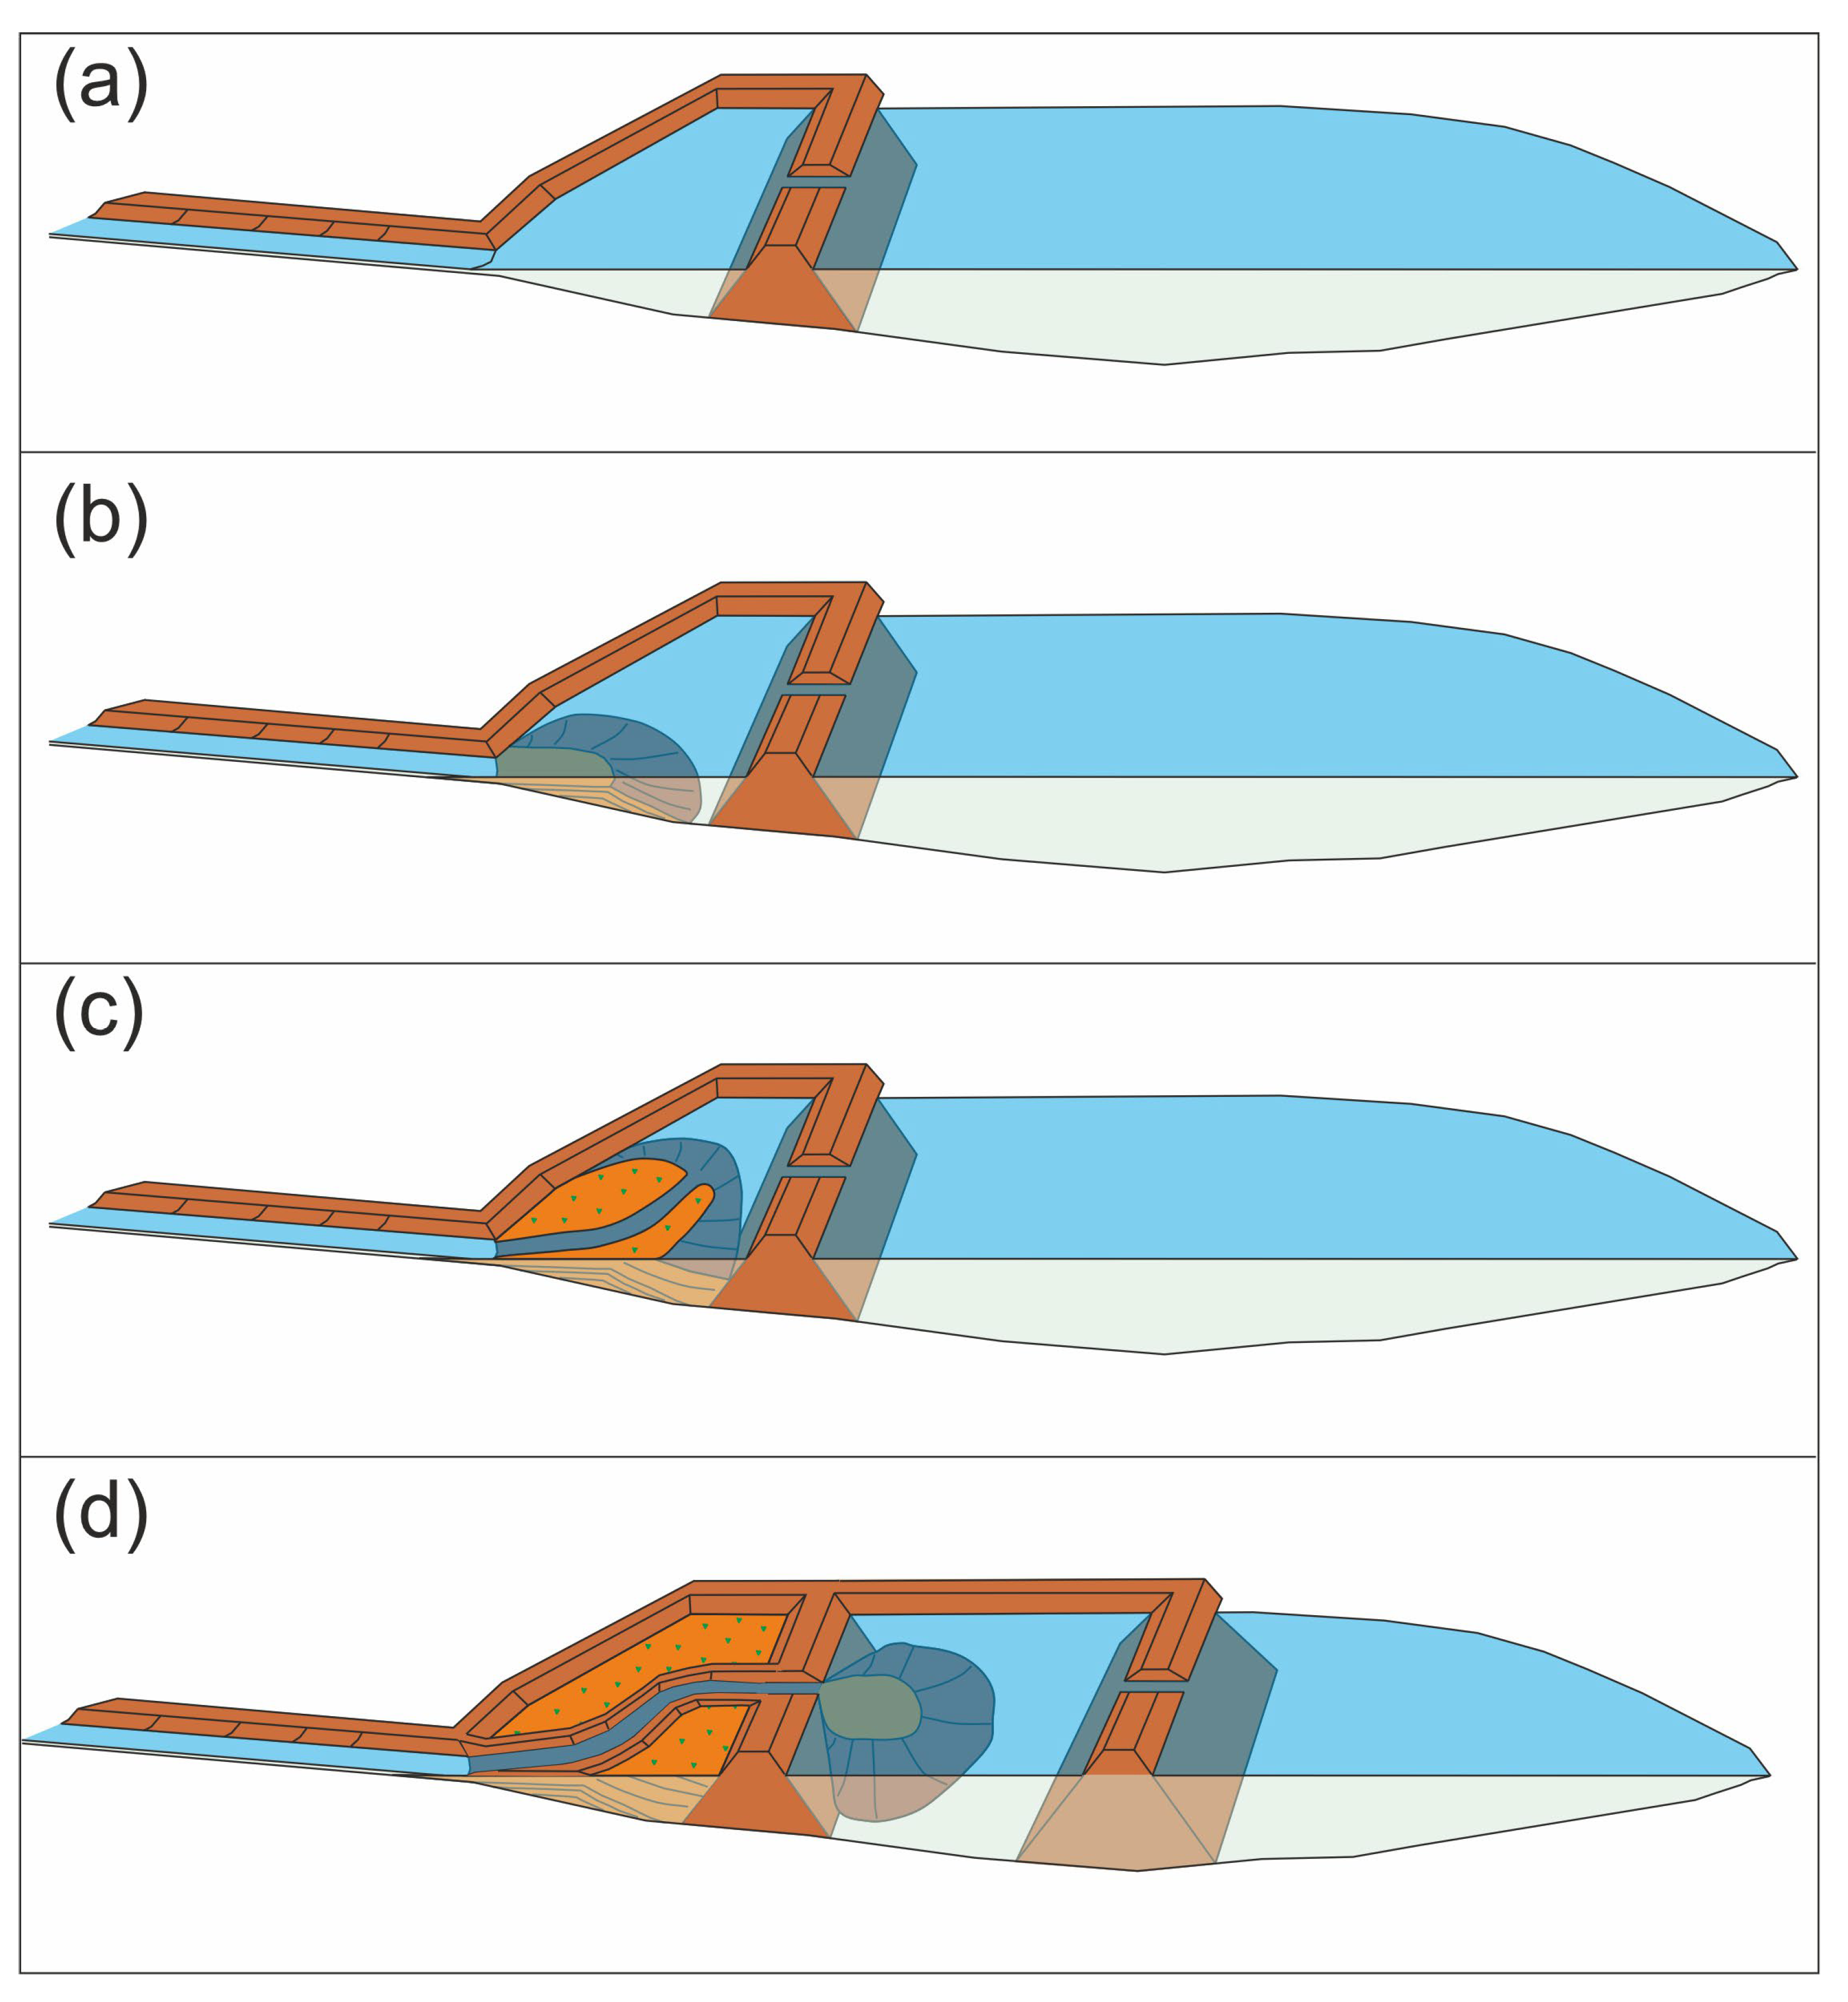
5.1.1. Land reclamation by Means of “Filled Polders” Structures
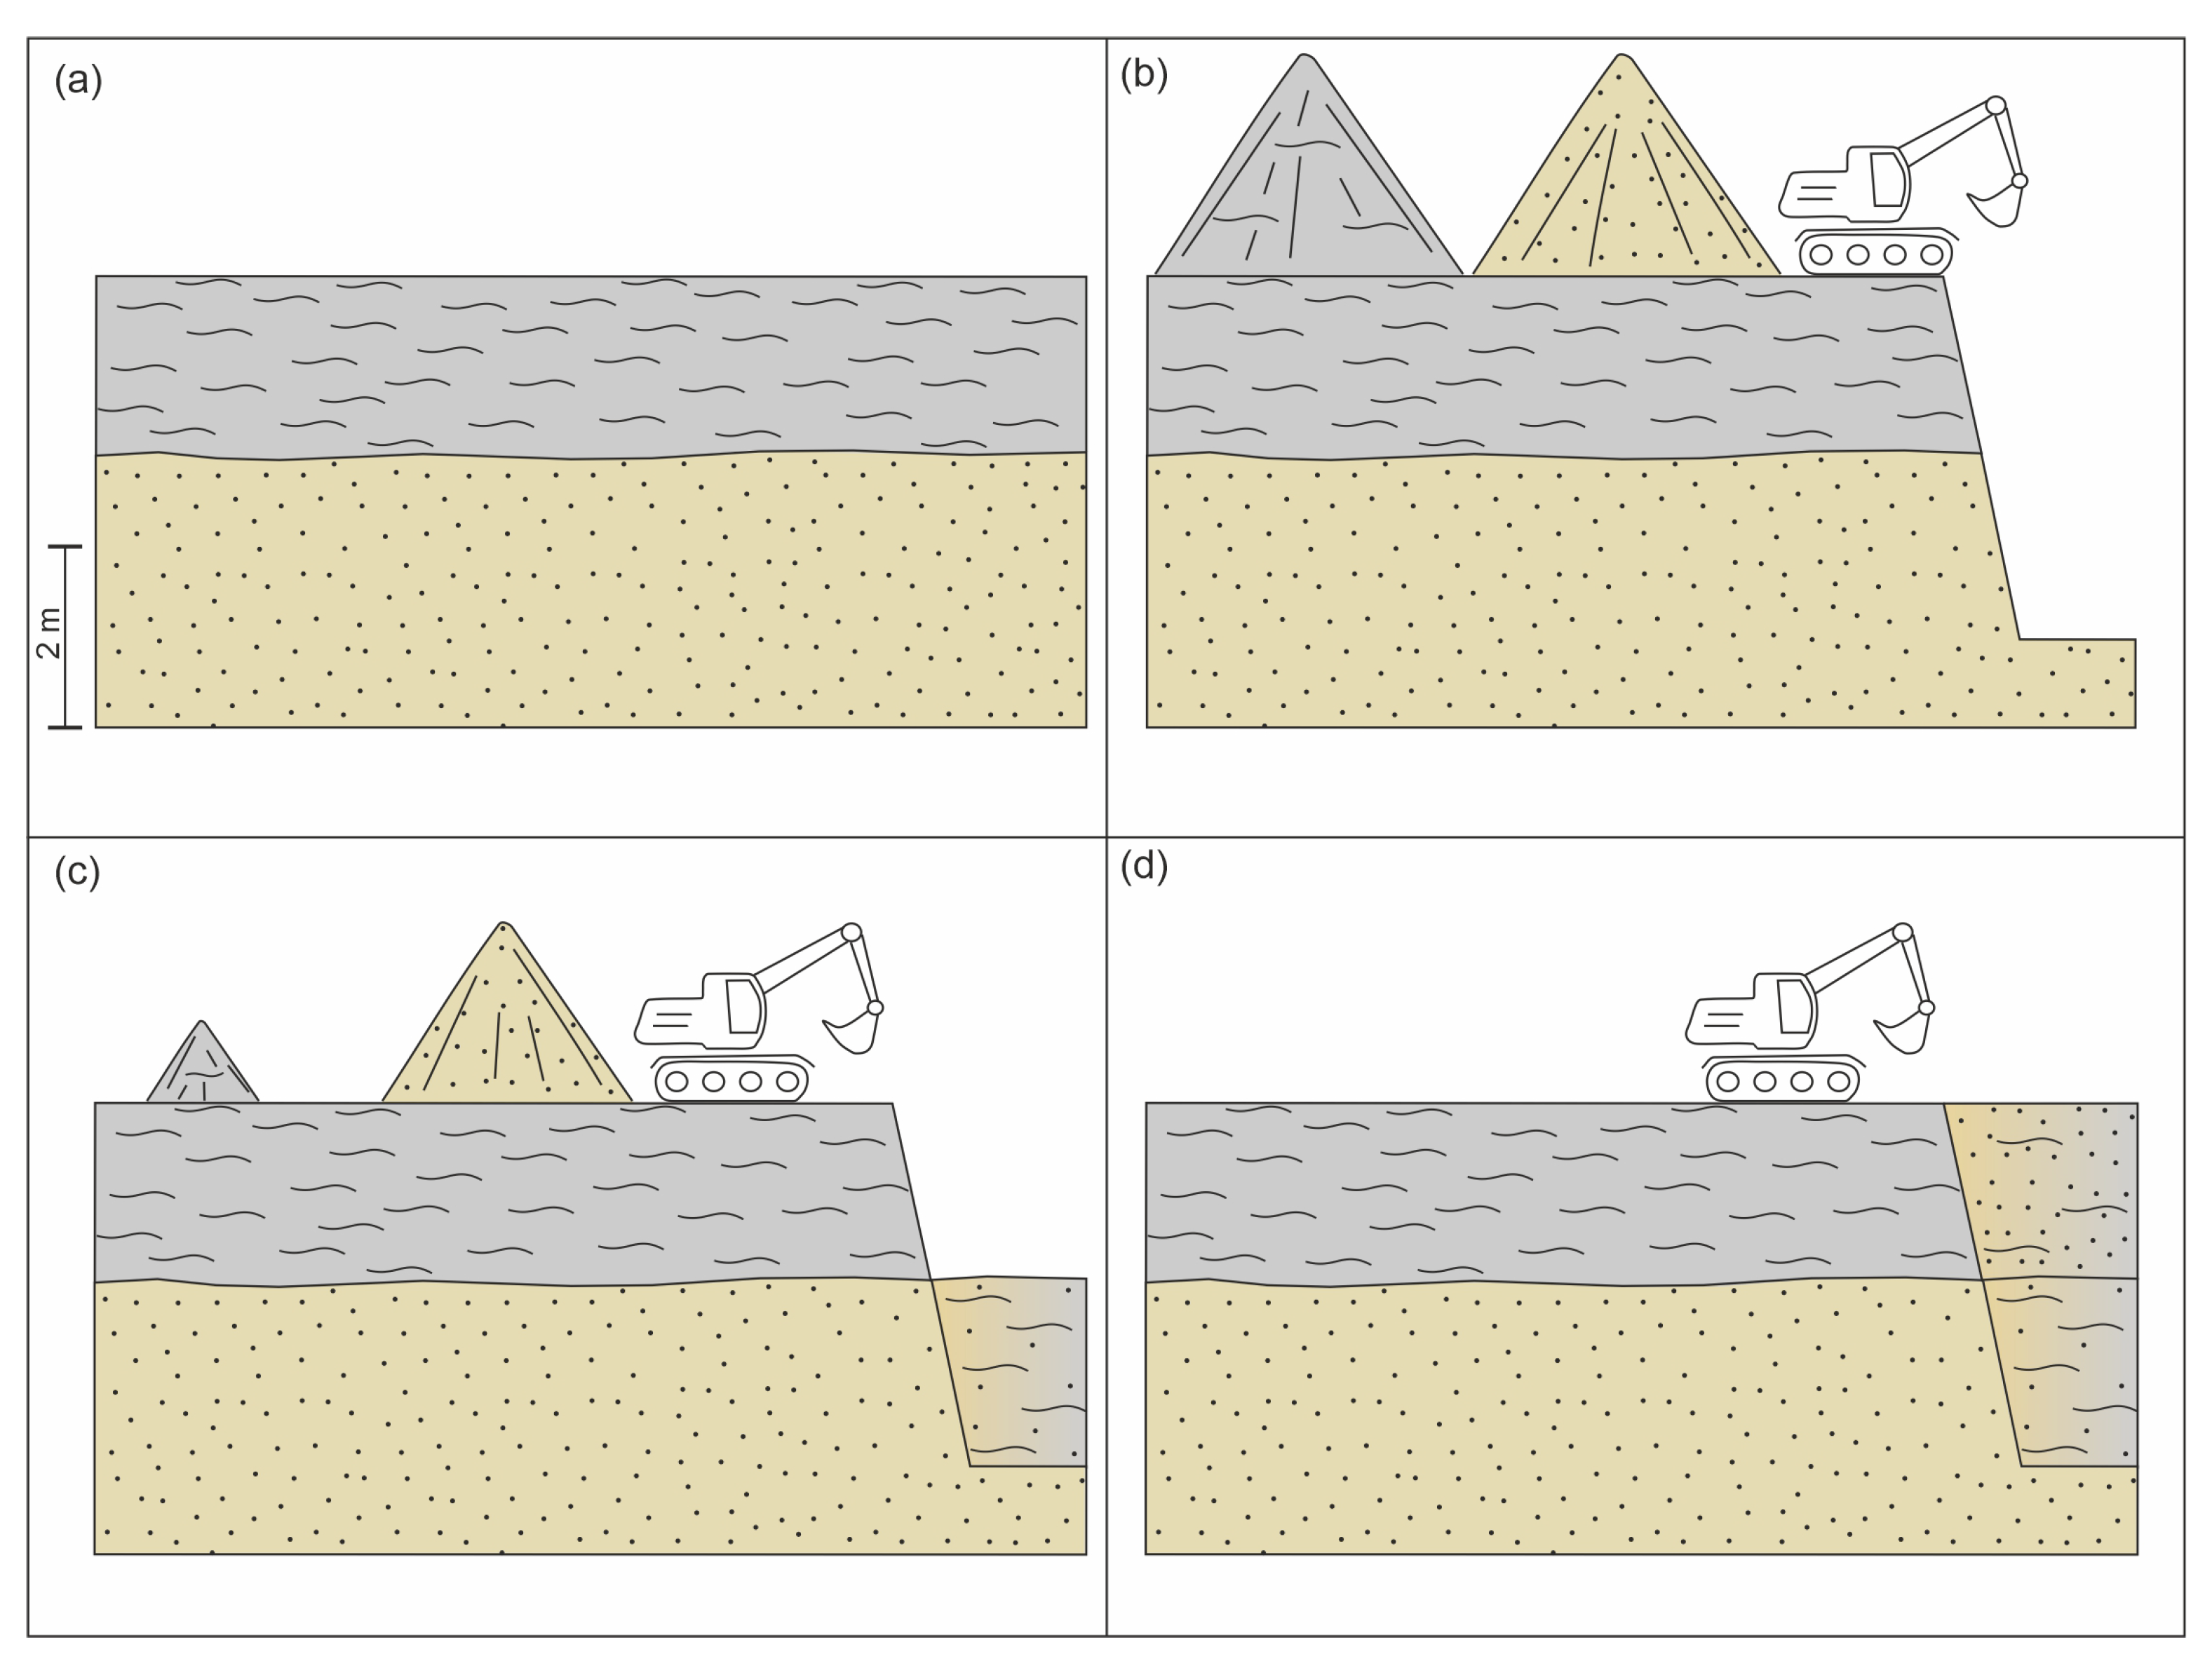
5.1.2. Turnings
- (1)
- The removal of the superficial layer of clayey fill deposits (anthropogenic deposits) (Figure 12b);
- (2)
- The removal of a thickness of underlying sandy deposits (Figure 12b);
- (3)
- The backfilling of the lower part of the excavation with a mixture of predominantly clay and clayey sand, obtained by mixing parts of the previous sediments (Figure 12c);
- (4)
- The filling of the upper part of the excavation with a mixture of predominantly sandy clay and sand, obtained by mixing the remaining part of the previously removed clays and sands (Figure 12d).
5.2. Coastal Resilience
6. Conclusions
Author Contributions
Funding
Data Availability Statement
Conflicts of Interest
References
- Turner, B.; Skole, D.; Sanderson, S.; Fischer, G.; Fresco, L.; Leemans, R. Land-Use and Land-Cover Change. Sci./Res. Plan 1995. [Google Scholar]
- Turner, B.L.I.; Meyer, B.L. Global Land Use and Land Cover Change: An Overview. In Changes in Land Use and Land Cover: A Global Perspective; Meyer, W.B., Turner, B.L., II, Eds.; Cambridge University Press: Cambridge, UK, 1994; Volume 1, pp. 1–549. [Google Scholar]
- Briassoulis, H. Analysis of Land Use Change: Theoretical and Modeling Approaches. Web Book Reg. Sci. 2020, 1, 1–248. [Google Scholar]
- Winkler, K.; Fuchs, R.; Rounsevell, M.; Herold, M. Global Land Use Changes Are Four Times Greater than Previously Estimated. Nat. Commun. 2021, 12, 2501. [Google Scholar] [CrossRef]
- Yang, Y.; Zhang, S.; Yang, J.; Chang, L.; Bu, K.; Xing, X. A Review of Historical Reconstruction Methods of Land Use/Land Cover. J. Geogr. Sci. 2014, 24, 746–766. [Google Scholar] [CrossRef]
- Bayer, A.D.; Lindeskog, M.; Pugh, T.A.M.; Anthoni, P.M.; Fuchs, R.; Arneth, A. Uncertainties in the Land-Use Flux Resulting from Land-Use Change Reconstructions and Gross Land Transitions. Earth Syst. Dyn. 2017, 8, 91–111. [Google Scholar] [CrossRef] [Green Version]
- Prestele, R.; Arneth, A.; Bondeau, A.; de Noblet-Ducoudré, N.; Pugh, T.A.M.; Sitch, S.; Stehfest, E.; Verburg, P.H. Current Challenges of Implementing Anthropogenic Land-Use and Land-Cover Change in Models Contributing to Climate Change Assessments. Earth Syst. Dyn. 2017, 8, 369–386. [Google Scholar] [CrossRef] [Green Version]
- Pongratz, J.; Dolman, H.; Don, A.; Erb, K.-H.; Fuchs, R.; Herold, M.; Jones, C.; Kuemmerle, T.; Luyssaert, S.; Meyfroidt, P.; et al. Models Meet Data: Challenges and Opportunities in Implementing Land Management in Earth System Models. Glob. Change Biol. 2018, 24, 1470–1487. [Google Scholar] [CrossRef] [Green Version]
- Liu, H.; Gong, P.; Wang, J.; Clinton, N.; Bai, Y.; Liang, S. Annual Dynamics of Global Land Cover and Its Long-Term Changes from 1982 to 2015. Earth Syst. Sci. Data 2020, 12, 1217–1243. [Google Scholar] [CrossRef]
- Xiaoyong, L.; Tian, H.; Pan, S.; Lu, C. Four-Century History of Land Transformation by Humans in the United States: 1630–2020. Earth Syst. Sci. Data Discuss. 2022, 15, 1–36. [Google Scholar] [CrossRef]
- Statuto, D.; Cillis, G.; Picuno, P. Using Historical Maps within a GIS to Analyze Two Centuries of Rural Landscape Changes in Southern Italy. Land 2017, 6, 65. [Google Scholar] [CrossRef] [Green Version]
- Pelorosso, R.; Leone, A.; Boccia, L. Land Cover and Land Use Change in the Italian Central Apennines: A Comparison of Assessment Methods. Appl. Geogr. 2009, 29, 35–48. [Google Scholar] [CrossRef]
- Tolessa, T.; Senbeta, F.; Kidane, M. The Impact of Land Use/Land Cover Change on Ecosystem Services in the Central Highlands of Ethiopia. Ecosyst. Serv. 2017, 23, 47–54. [Google Scholar] [CrossRef]
- Quintas-Soriano, C.; Castro, A.J.; Castro, H.; García-Llorente, M. Impacts of Land Use Change on Ecosystem Services and Implications for Human Well-Being in Spanish Drylands. Land Use Policy 2016, 54, 534–548. [Google Scholar] [CrossRef]
- Tran, H.-D.; Yang, X.; Manzanas Lopez, D.; Musau, P.; Nguyen, L.V.; Xiang, W.; Bak, S.; Johnson, T.T. NNV: The Neural Network Verification Tool for Deep Neural Networks and Learning-Enabled Cyber-Physical Systems. In Proceedings of the Computer Aided Verification 32nd International Conference, CAV 2020, Los Angeles, CA, USA, 21–24 July 2020; Lahiri, S.K., Wang, C., Eds.; Springer International Publishing: Cham, Switzerland, 2020; pp. 3–17. [Google Scholar]
- Findell, K.L.; Berg, A.; Gentine, P.; Krasting, J.P.; Lintner, B.R.; Malyshev, S.; Santanello, J.A.; Shevliakova, E. The Impact of Anthropogenic Land Use and Land Cover Change on Regional Climate Extremes. Nat. Commun. 2017, 8, 989. [Google Scholar] [CrossRef] [Green Version]
- Hayakawa, A.; Shimizu, M.; Woli, K.; Kuramochi, K.; Hatano, R. Evaluating Stream Water Quality through Land Use Analysis in Two Grassland Catchments. J. Environ. Qual. 2006, 35, 617–627. [Google Scholar] [CrossRef] [Green Version]
- Shi, P.; Zhang, Y.; Li, Z.; Li, P.; Xu, G. Influence of Land Use and Land Cover Patterns on Seasonal Water Quality at Multi-Spatial Scales. Catena 2017, 151, 182–190. [Google Scholar] [CrossRef]
- Salazar, A.; Baldi, G.; Hirota, M.; Syktus, J.; McAlpine, C. Land Use and Land Cover Change Impacts on the Regional Climate of Non-Amazonian South America: A Review. Glob. Planet. Change 2015, 128, 103–119. [Google Scholar] [CrossRef]
- Bhattachan, A.; Emanuel, R.E.; Ardón, M.; Bernhardt, E.S.; Anderson, S.M.; Stillwagon, M.G.; Ury, E.A.; BenDor, T.K.; Wright, J.P. Evaluating the Effects of Land-Use Change and Future Climate Change on Vulnerability of Coastal Landscapes to Saltwater Intrusion. Elem. Sci. Anthr. 2018, 6, 62. [Google Scholar] [CrossRef] [Green Version]
- Dada, O.A.; Agbaje, A.O.; Adesina, R.B.; Asiwaju-Bello, Y.A. Effect of Coastal Land Use Change on Coastline Dynamics along the Nigerian Transgressive Mahin Mud Coast. Ocean. Coast. Manag. 2019, 168, 251–264. [Google Scholar] [CrossRef]
- Lo, K.F.A.; Gunasiri, C.W.D. Impact of Coastal Land Use Change on Shoreline Dynamics in Yunlin County, Taiwan. Environments 2014, 1, 124–136. [Google Scholar] [CrossRef]
- Cai, F.; van Vliet, J.; Verburg, P.H.; Pu, L. Land Use Change and Farmer Behavior in Reclaimed Land in the Middle Jiangsu Coast, China. Ocean. Coast. Manag. 2017, 137, 107–117. [Google Scholar] [CrossRef]
- Tian, B.; Wu, W.; Yang, Z.; Zhou, Y. Drivers, Trends, and Potential Impacts of Long-Term Coastal Reclamation in China from 1985 to 2010. Estuar. Coast. Shelf Sci. 2016, 170, 83–90. [Google Scholar] [CrossRef]
- Wang, H.; Yang, J.; Zhu, J.; Ren, L.; Liu, Y.; Li, W.; Chen, C. Estimation of Significant Wave Heights from ASCAT Scatterometer Data via Deep Learning Network. Remote Sens. 2021, 13, 195. [Google Scholar] [CrossRef]
- Wu, W.; Yang, Z.; Tian, B.; Huang, Y.; Zhou, Y.; Zhang, T. Impacts of Coastal Reclamation on Wetlands: Loss, Resilience, and Sustainable Management. Estuar. Coast. Shelf Sci. 2018, 210, 153–161. [Google Scholar] [CrossRef]
- Yan, J.; Cui, B.; Zheng, J.; Xie, T.; Wang, Q.; Li, S. Quantification of Intensive Hybrid Coastal Reclamation for Revealing Its Impacts on Macrozoobenthos. Environ. Res. Lett. 2015, 10, 014004. [Google Scholar] [CrossRef] [Green Version]
- Yu, S.; Cui, B.; Gibbons, P.; Yan, J.; Ma, X.; Xie, T.; Song, G.; Zou, Y.; Shao, X. Towards a Biodiversity Offsetting Approach for Coastal Land Reclamation: Coastal Management Implications. Biol. Conserv. 2017, 214, 35–45. [Google Scholar] [CrossRef]
- Chen, L.; Zhou, Z.; Xu, F.; Jimenez, M.; Tao, J.; Zhang, C. Simulating the Impacts of Land Reclamation and De-Reclamation on the Morphodynamics of Tidal Networks. Anthr. Coasts 2020, 3, 30–42. [Google Scholar] [CrossRef]
- Zhang, Y.; Chen, R.; Wang, Y. Tendency of Land Reclamation in Coastal Areas of Shanghai from 1998 to 2015. Land Use Policy 2020, 91, 104370. [Google Scholar] [CrossRef]
- Jiang, L.; Lin, H.; Cheng, S. Monitoring and Assessing Reclamation Settlement in Coastal Areas with Advanced InSAR Techniques: Macao City (China) Case Study. Int. J. Remote Sens. 2011, 32, 3565–3588. [Google Scholar] [CrossRef]
- Choi, Y.R. Modernization, Development and Underdevelopment: Reclamation of Korean Tidal Flats, 1950s–2000s. Ocean. Coast. Manag. 2014, 102, 426–436. [Google Scholar] [CrossRef]
- Zhang, X.; Pan, D.; Chen, J.; Zhao, J.; Zhu, Q.; Huang, H. Evaluation of Coastline Changes under Human Intervention Using Multi-Temporal High-Resolution Images: A Case Study of the Zhoushan Islands, China. Remote Sens. 2014, 6, 9930–9950. [Google Scholar] [CrossRef] [Green Version]
- Charlier, R.H.; Chaineux, M.C.P.; Morcos, S. Panorama of the History of Coastal Protection. J. Coast. Res. 2005, 21, 79–111. [Google Scholar] [CrossRef] [Green Version]
- Lai, S.; Loke, L.H.L.; Hilton, M.J.; Bouma, T.J.; Todd, P.A. The Effects of Urbanisation on Coastal Habitats and the Potential for Ecological Engineering: A Singapore Case Study. Ocean. Coast. Manag. 2015, 103, 78–85. [Google Scholar] [CrossRef]
- Wang, W.; Liu, H.; Li, Y.; Su, J. Development and Management of Land Reclamation in China. Ocean. Coast. Manag. 2014, 102, 415–425. [Google Scholar] [CrossRef]
- Martinez, M.L.; Silva, R.; Lithgow, D.; Mendoza, E.; Flores, P.; Martínez, R.; Cruz, C. Human Impact on Coastal Resilience along the Coast of Veracruz, Mexico. Coas 2017, 77, 143–153. [Google Scholar] [CrossRef]
- Daniela, R.; Marco, V. Land Use and Landscape Pattern Changes Driven by Land Reclamation in a Coastal Area: The Case of Volturno Delta Plain, Campania Region, Southern Italy. Environ. Earth Sci. 2017, 76, 694. [Google Scholar] [CrossRef]
- Evelpidou, N.; Tzouxanioti, M.; Liaskos, A. Coastal Erosion: The Future of Sandy Beaches. Proc. Eur. Acad. Sci. Arts 2022, 1–16. [Google Scholar] [CrossRef]
- Anthony, E.J.; Marriner, N.; Morhange, C. Human Influence and the Changing Geomorphology of Mediterranean Deltas and Coasts over the Last 6000 Years: From Progradation to Destruction Phase? Earth Sci. Rev. 2014, 139, 336–361. [Google Scholar] [CrossRef]
- Caldara, M.; Iannone, A.; Lopez, R.; Simone, O.; De Santis, V.; Torres, T.; Ortiz, J.E. New Data on the Pleistocene of Trani (Adriatic Coast, Southern Italy). Ital. J. Geosci. 2013, 132, 239–253. [Google Scholar] [CrossRef]
- De Santis, V.; Caldara, M.; Pennetta, L.; Torres, T.; Ortiz, J.E. Unconformity-Bounded Stratigraphic Units (UBSUs) in an Italian Alluvial-Plain Area: Recognizing and Dating. J. Sediment. Res. 2013, 83, 96–114. [Google Scholar] [CrossRef]
- De Santis, V.; Caldara, M.; Torres, T.; Ortiz, J.E. Two Middle Pleistocene Warm Stages in the Terrace Deposits of the Apulia Region (Southern Italy). Quat. Int. 2014, 332, 2–18. [Google Scholar] [CrossRef]
- De Santis, V.; Caldara, M.; Pennetta, L. “Continuous” Backstepping of Holocene Coastal Barrier Systems into Incised Valleys: Insights from the Ofanto and Carapelle-Cervaro Valleys. Water 2020, 12, 1799. [Google Scholar] [CrossRef]
- De Santis, V.; Scardino, G.; Meschis, M.; Ortiz, J.E.; Sánchez-Palencia, Y.; Caldara, M. Refining the Middle-Late Pleistocene Chronology of Marine Terraces and Uplift History in a Sector of the Apulian Foreland (Southern Italy) by Applying a Synchronous Correlation Technique and Amino Acid Racemization to Patella spp. and Thetystrombus latus. IJG 2021, 140, 438–463. [Google Scholar] [CrossRef]
- De Santis, V.; Scardino, G.; Scicchitano, G.; Meschis, M.; Montagna, P.; Pons-Branchu, E.; Ortiz, J.E.; Sánchez-Palencia, Y.; Caldara, M. Middle-Late Pleistocene Chronology of Palaeoshorelines and Uplift History in the Low-Rising to Stable Apulian Foreland: Overprinting and Reoccupation. Geomorphology 2023, 421, 108530. [Google Scholar] [CrossRef]
- Amorosi, A.; Bruno, L.; Caldara, M.; Campo, B.; Cau, S.; De Santis, V.; Di Martino, A.; Hong, W.; Lucci, G.; Pellegrini, C.; et al. Late Quaternary Sedimentary Record of Estuarine Incised-Valley Filling and Interfluve Flooding: The Manfredonia Paleovalley System (Southern Italy). Mar. Pet. Geol. 2023, 147, 105975. [Google Scholar] [CrossRef]
- De Santis, V.; Caldara, M. Evolution of an Incised Valley System in the Southern Adriatic Sea (Apulian Margin): An Onshore-Offshore Correlation. Geol. J. 2016, 51, 263–284. [Google Scholar] [CrossRef]
- De Santis, V.; Caldara, M.; Pennetta, L. Transgressive Architecture of Coastal Barrier Systems in the Ofanto Incised Valley and Its Surrounding Shelf in Response to Stepped Sea-Level Rise. Geosciences 2020, 10, 497. [Google Scholar] [CrossRef]
- Tarquini, S.; Isola, I.; Favalli, M.; Battistini, A.; Dotta, G. TINITALY, a Digital Elevation Model of Italy with a 10 Meters Cell Size (Version 1.1); Istituto Nazionale di Geofisica e Vulcanologia (INGV): Roma, Italy, 2023; Volume 1, pp. 1–2. [Google Scholar] [CrossRef]
- Boenzl, F.; Caldara, M.; Moresi, M.; Pennetta, L. History of the Salpi Lagoon-Sabhka (Manfredonia Gulf, Italy). Alp. Mediterr. Quat. 2001, 14, 93–104. [Google Scholar]
- Caldara, M.; Pennetta, L. Interpretazione Paleoclimatica Di Dati Preistorici e Storici Relativi All’entroterra Del Golfo Di Manfredonia. Mem. Della Soc. Geol. Ital. 1992, 42, 197–207. [Google Scholar]
- Caldara, M.; Pennetta, L. Evoluzione Ed Estinzione Dell’antico Lago Di Salpi in Puglia. Bonifica 1992, 7, 59–81. [Google Scholar]
- Di Rita, F.; Simone, O.; Caldara, M.; Gehrels, W.R.; Magri, D. Holocene Environmental Changes in the Coastal Tavoliere Plain (Apulia, Southern Italy): A Multiproxy Approach. Palaeogeogr. Palaeoclimatol. Palaeoecol. 2011, 310, 139–151. [Google Scholar] [CrossRef]
- Schmiedt, G. Contributo Della Fotografia Aerea Alla Ricostruzione Della Antica Laguna Compresa Fra Siponto e Salapia. Arch. Stor. Pugl. 1973, 26, 159–172. [Google Scholar]
- Caldara, M.; Pennetta, L.; Simone, O. Holocene Evolution of the Salpi Lagoon (Puglia, Italy). J. Coast. Res. 2002, 36, 124–133. [Google Scholar] [CrossRef]
- Boenzi, F.; Caldara, M.; Pennetta, L.; Simone, O. Environmental Aspects Related to the Physical Evolution of Some Wetlands Along the Adriatic Coast of Apulia (Southern Italy): A Review. J. Coast. Res. 2006, 1, 170–175. [Google Scholar]
- Dibenedetto, G. Le Bonifiche in Capitanata Nella Prima Metà Del XIX Secolo. In Proceedings of the 6° Convegno Nazionale sulla Preistoria-Protostoria della Daunia, San Severo, Italy, 14–16 November 1984; pp. 95–120. [Google Scholar]
- Magini, G. Capitanata Olim Mesapiae, et Japigiae Pars; Bologna: Bologna, Italy, 1620. [Google Scholar]
- De Rossi, D. Provincia Di Capitanata, Già Delineata Dal Magini e Nuovamente Ampliata Secondo Lo Stato Presente; Domenico de Rossi: Rome, Italy, 1714; p. 1. [Google Scholar]
- Rosati, G. La Provincia Di Capitanata; Le Monnier: Firenze, Italy, 1787; p. 1. [Google Scholar]
- Marzolla, B. Atlante Corografico Storico e Statistico Del Regno Delle Due Sicilie; Reale Litografia Militare: Napoli, Italy, 1832; p. 1. [Google Scholar]
- Theiler, E.; Himmelstoss, E.; Zichichi, J.; Ergul, A. Digital Shoreline Analysis System (DSAS) Version 4.0-An ArcGIS Extension for Calculating Shoreline Change (Ver. 4.4, July 2017). U.S. Geol. Surv. Open-File Rep. 2017, 1, 1278. [Google Scholar]
- Himmelstoss, E.A.; Henderson, R.E.; Kratzmann, M.G.; Farris, A.S. Digital Shoreline Analysis System (DSAS) Version 5.0 User Guide; Open-File Report; U.S. Geological Survey: Reston, VA, USA, 2018; Volume 2018–1179. [Google Scholar]
- Ciasca, R. Storia Delle Bonifiche Del Regno Di Napoli. In Giuseppe Laterza e Figli, 1st ed.; Laterza: Bari, Italy, 1928. [Google Scholar]
- Airoldi, L.; Connell, S.; Beck, M. The Loss of Natural Habitats and the Addition of Artificial Substrata. In Marine Hard Bottom Communities; Springer: Deu, Germany, 2009; pp. 269–280. ISBN 978-3-540-92703-7. [Google Scholar]
- Dafforn, K.A.; Glasby, T.M.; Airoldi, L.; Rivero, N.K.; Mayer-Pinto, M.; Johnston, E.L. Marine Urbanization: An Ecological Framework for Designing Multifunctional Artificial Structures. Front. Ecol. Environ. 2015, 13, 82–90. [Google Scholar] [CrossRef]
- Dafforn, K.A.; Mayer-Pinto, M.; Morris, R.L.; Waltham, N.J. Application of Management Tools to Integrate Ecological Principles with the Design of Marine Infrastructure. J. Environ. Manag. 2015, 158, 61–73. [Google Scholar] [CrossRef] [PubMed]
- Seto, K.C.; Fragkias, M.; Güneralp, B.; Reilly, M.K. A Meta-Analysis of Global Urban Land Expansion. PLoS ONE 2011, 6, e23777. [Google Scholar] [CrossRef]
- Chapman, M.G.; Browne, M.A. Mitigating against the Loss of Species by Adding Artificial Intertidal Pools to Existing Seawalls. Mar. Ecol. Prog. Ser. 2014, 497, 119–129. [Google Scholar] [CrossRef]
- Pecorari, V. Memoria Sulla Regia Salina di Barletta di Vincenzo Pecorari Amministratore Generale della Dogana di Napoli e sua Giurisdizione; Flauto, V., Ed.; Biblioteca Nazionale di Napoli: Napoli, Italy, 1784; p. 143. [Google Scholar]
- Giustiniani, L. Dizionario Geografico-Ragionato del Regno di Napoli; Presso Vincenzo Manfredi: Naples, Italy, 1797; p. 472. [Google Scholar]
- Michelangelo, M. La Fisica Appula del p. f. Michelangelo Manicone Lettor Giubilato in Sagra Teologia, ed Esprovinciale Francescano Degli Osservanti; Tomo 1–5, 2; Sapienza—Università di Roma (Biblioteca di Scienze della Terra): Roma, Italy, 1806; p. 247. [Google Scholar]
- De Angelis, G. Pel Disseccamento Delle Paludi Sipontine. In Componimenti Poetici; Tipografia di Giacomo Russo: Foggia, Italy, 1830; Volume 1, p. 1. [Google Scholar]
- Pascale, L. L’Antica e La Nuova Siponto, etc; Tipografia Succ.; Emilio Marietti: Torino, Italy, 1912. [Google Scholar]
- Rotella, G. Cinquant’anni di Bonifica nel Tavoliere; Bastogi: Rome, Italy, 1984. [Google Scholar]
- Russo, S. La Bonifica Del Lago Salpi in Capitanata. L’ambiente Stor. 1987, 8–9, 119–135. [Google Scholar]
- Talchabhadel, R.; Kawaike, K.; Nakagawa, H.; Talchabhadel, R.; Kawaike, K.; Nakagawa, H. Temporary De-Poldering for a Long Term Flood/Sediment Management in the Southwestern Bangladesh; IntechOpen: London, UK, 2021; ISBN 978-1-83968-131-8. [Google Scholar]
- Afan De Rivera, C. Del Bonificamento Del Lago Di Salpi Coordinato a Quello Della Pianura Della Capitanata; Stamperie E Cart. Del Fibreno: Napoli, Italy, 1845; Volume 1, p. 638. [Google Scholar]
- Copertino, V.A.; Fiorentino, M. Valutazione Delle Piene in Puglia; Dipartimento di Ingegneria e Fisica Dell’ambiente, Università Degli Studi della Basilicata Gruppo Nazionale per la Difesa Dalle Catastrofi Idrogeologiche: Potenza, Italy, 1994. [Google Scholar]
- De Santis, V.; Caldara, M.; Marsico, A.; Capolongo, D.; Pennetta, L. Evolution of the Ofanto River Delta from the ‘Little Ice Age’ to Modern Times: Implications of Large-Scale Synoptic Patterns. Holocene 2018, 28, 1948–1967. [Google Scholar] [CrossRef]
- Triggiani, M.; Refice, A.; Capolongo, D.; Bovenga, F.; Caldara, M. Investigation of Subsidence in the Manfredonia Gulf (Southern Italy) through Multitemporal DInSAR Techniques; EGU General Assembly: Wien, Austria, 2009; Volume 11, p. 7341. [Google Scholar]
- Scardino, G.; Anzidei, M.; Petio, P.; Serpelloni, E.; De Santis, V.; Rizzo, A.; Liso, S.I.; Zingaro, M.; Capolongo, D.; Vecchio, A.; et al. The Impact of Future Sea-Level Rise on Low-Lying Subsiding Coasts: A Case Study of Tavoliere Delle Puglie (Southern Italy). Remote Sens. 2022, 14, 4936. [Google Scholar] [CrossRef]
- Triggiani, M. Le Tecniche Di Interferometria Radar Applicate Allo Studio Della Subsidenza Nel Golfo Di Manfredonia (FG): Tesi Di Dottorato in Geomorfologia e Dinamica Ambientale Ciclo XXIII; Università Degli Studi Di Bari: Bari, Italy, 2011; p. 92. [Google Scholar]
- De Santis, V.; Caldara, M. The 5.5–4.5 Kyr Climatic Transition as Recorded by the Sedimentation Pattern of Coastal Deposits of the Apulia Region, Southern Italy. Holocene 2015, 25, 1313–1329. [Google Scholar] [CrossRef]
- Torelli, L. Sulle Bonificazioni, Risaie ed Irrigazioni del Regno d’Italia; Relazione a S.E. il ministro di Agricoltura, Industria e Commercio; Book on Demand; Forgotten Books: London, UK, 1864; p. 276. [Google Scholar]
- Donadio, C.; Vigliotti, M.; Valente, R.; Stanislao, C.; Ivaldi, R.; Ruberti, D. Anthropic vs. Natural Shoreline Changes along the Northern Campania Coast, Italy. J. Coast Conserv. 2018, 22, 939–955. [Google Scholar] [CrossRef]
- Bergillos, R.J.; Rodríguez-Delgado, C.; Millares, A.; Ortega-Sánchez, M.; Losada, M.A. Impact of River Regulation on a Mediterranean Delta: Assessment of Managed versus Unmanaged Scenarios. Water Resour. Res. 2016, 52, 5132–5148. [Google Scholar] [CrossRef]
- Özpolat, E.; Demir, T. The Spatiotemporal Shoreline Dynamics of a Delta under Natural and Anthropogenic Conditions from 1950 to 2018: A Dramatic Case from the Eastern Mediterranean. Ocean. Coast. Manag. 2019, 180, 104910. [Google Scholar] [CrossRef]
- Martín-Vide, J.P.; Prats-Puntí, A.; Ferrer-Boix, C. What Controls the Coarse Sediment Yield to a Mediterranean Delta? The Case of the Llobregat River (NE Iberian Peninsula). Nat. Hazards Earth Syst. Sci. 2020, 20, 3315–3331. [Google Scholar] [CrossRef]
- Antonioli, F.; Anzidei, M.; Amorosi, A.; Lo Presti, V.; Mastronuzzi, G.; Deiana, G.; De Falco, G.; Fontana, A.; Fontolan, G.; Lisco, S.; et al. Sea-Level Rise and Potential Drowning of the Italian Coastal Plains: Flooding Risk Scenarios for 2100. Quat. Sci. Rev. 2017, 158, 29–43. [Google Scholar] [CrossRef] [Green Version]
- Aucelli, P.P.C.; Di Paola, G.; Incontri, P.; Rizzo, A.; Vilardo, G.; Benassai, G.; Buonocore, B.; Pappone, G. Coastal Inundation Risk Assessment Due to Subsidence and Sea Level Rise in a Mediterranean Alluvial Plain (Volturno Coastal Plain—Southern Italy). Estuar. Coast. Shelf Sci. 2017, 198, 597–609. [Google Scholar] [CrossRef]
- Di Paola, G.; Rizzo, A.; Benassai, G.; Corrado, G.; Matano, F.; Aucelli, P.P.C. Sea-Level Rise Impact and Future Scenarios of Inundation Risk along the Coastal Plains in Campania (Italy). Environ. Earth Sci. 2021, 80, 608. [Google Scholar] [CrossRef]
- Ibáñez, C.; Caiola, N.; Ibáñez, C.; Caiola, N. Sea-Level Rise, Marine Storms and the Resilience of Mediterranean Coastal Wetlands: Lessons Learned from the Ebro Delta. Mar. Freshw. Res. 2021, 73, 1246–1254. [Google Scholar] [CrossRef]


| Type | Year | Scale | Source |
|---|---|---|---|
| Topographic map | 1869 | 1:50.000 | Italian Military Geographic Institute |
| Topographic map | 1909 | 1:50.000 | Italian Military Geographic Institute |
| Topographic map | 1954 | 1:25.000 | Italian Military Geographic Institute |
| Land use/cover map | Present day | 1:5.000 | Regione Puglia |
| Retreat | Low Retreat | Equilibrium | Low Progradation | Progradation | |
|---|---|---|---|---|---|
| NSM | >−10 m | −10–1 m | −1–1 m | 1–10 m | >10 m |
| ID | Land Use Macro-Categories | Preliminary Land Use Categories | CORINE Land Cover Codes |
|---|---|---|---|
| 1 | Arable land with or without scattered trees | Arable land; arable land with trees | 2.1.1; 2.1.2; 2.1.1.2 |
| 2 | Dune area and back-dune sandy shore, depression or inter-dune discontinuity, and beach | Dune area; back-dune sandbars; interdune depressions; beach | 3.2.3; 3.3.1 |
| 3 | Farmyard and agricultural production site | Farmyard; agricultural production site | 1.2.1.6 |
| 4 | Grassland, pasture, meadow, and shrubland with or without scattered trees | Grassland; pasture; meadow; shrubland; treed meadows; treed pastures | 2.3.1; 3.2.1; 3.2.2; 3.3.3; 3.3.4; 3.2.4.1 |
| 5 | Lagoon and estuary | - | 5.2.1; 5.2.2 |
| 6 | Lake | Lake | 5.1.2; 5.1.2.1 |
| 7 | Landfill | - | 1.3.2; 1.3.2.1; 1.3.2.2 |
| 8 | Marsh area and brackish area (wetland) | Marsh area | 4.1.1; 4.2.1; 4.2.3 |
| 9 | Olive and almond groves and/or other permanent crops | Olive and almond groves | 2.2.4 |
| 10 | Olive grove | Olive groves | 2.2.3 |
| 11 | Orchard | Orchard | 2.2.2 |
| 12 | Photovoltaic panel area and technical infrastructure in general | - | 1.2.2; 1.2.2.5 |
| 13 | Quarry | Sandy quarry | 1.3.2; 1.3.2.1; 1.3.2.2 |
| 14 | Reservoir and reservoir for irrigation purpose | Reservoir | 5.1.2; 5.1.2.2 |
| 15 | Rice field | Rice field | 2.1.3 |
| 16 | Saltwork | Saltwork | 4.2.2 |
| 17 | Urban area, industrial area, commercial area, port area, construction site, and recreational area | Urban area | 1.1.1; 1.1.2; 1.2.1; 1.2.3; 1.2.4; 1.3.3;1.4.1; 1.4.2; 1.1.1.1; 1.1.1.2; 1.1.1.3; 1.1.2.1; 1.1.2.2; 1.1.2.3; 1.2.1.1; 1.2.1.2; 1.2.1.4; 1.2.1.5; 1.2.1.7; 1.3.3.1; 1.4.2.1; 1.4.2.2; 1.4.2.3; 1.4.2.4 |
| 18 | Vegetable gardens, complex plot cultivation systems, seasonally irrigated crops, and seasonally rotated crops | Vegetable gardens | 2.4.1; 2.4.2; 2.1.1.1 |
| 19 | Vineyard with or without scattered trees | Vineyard and treed vineyard | 2.2.1 |
| 20 | Woodland (coniferous) | Coniferous woodland | 3.1.2 |
| 21 | Woodland (deciduous) and exotic woodland | Eucalyptus forest | 3.1.1; 3.1.1.7 |
| 22 | Woodland (mixed) | - | 3.1.3 |
Disclaimer/Publisher’s Note: The statements, opinions and data contained in all publications are solely those of the individual author(s) and contributor(s) and not of MDPI and/or the editor(s). MDPI and/or the editor(s) disclaim responsibility for any injury to people or property resulting from any ideas, methods, instructions or products referred to in the content. |
© 2023 by the authors. Licensee MDPI, Basel, Switzerland. This article is an open access article distributed under the terms and conditions of the Creative Commons Attribution (CC BY) license (https://creativecommons.org/licenses/by/4.0/).
Share and Cite
De Santis, V.; Rizzo, A.; Scardino, G.; Scicchitano, G.; Caldara, M. A Procedure for Evaluating Historical Land Use Change and Resilience in Highly Reclaimed Coastal Areas: The Case of the Tavoliere di Puglia (Southern Italy). Land 2023, 12, 775. https://doi.org/10.3390/land12040775
De Santis V, Rizzo A, Scardino G, Scicchitano G, Caldara M. A Procedure for Evaluating Historical Land Use Change and Resilience in Highly Reclaimed Coastal Areas: The Case of the Tavoliere di Puglia (Southern Italy). Land. 2023; 12(4):775. https://doi.org/10.3390/land12040775
Chicago/Turabian StyleDe Santis, Vincenzo, Angela Rizzo, Giovanni Scardino, Giovanni Scicchitano, and Massimo Caldara. 2023. "A Procedure for Evaluating Historical Land Use Change and Resilience in Highly Reclaimed Coastal Areas: The Case of the Tavoliere di Puglia (Southern Italy)" Land 12, no. 4: 775. https://doi.org/10.3390/land12040775