

Management of U.S. Agricultural Lands Differentially Affects Avian Habitat Connectivity
 , , ,
, , ,
Abstract
:1. Introduction
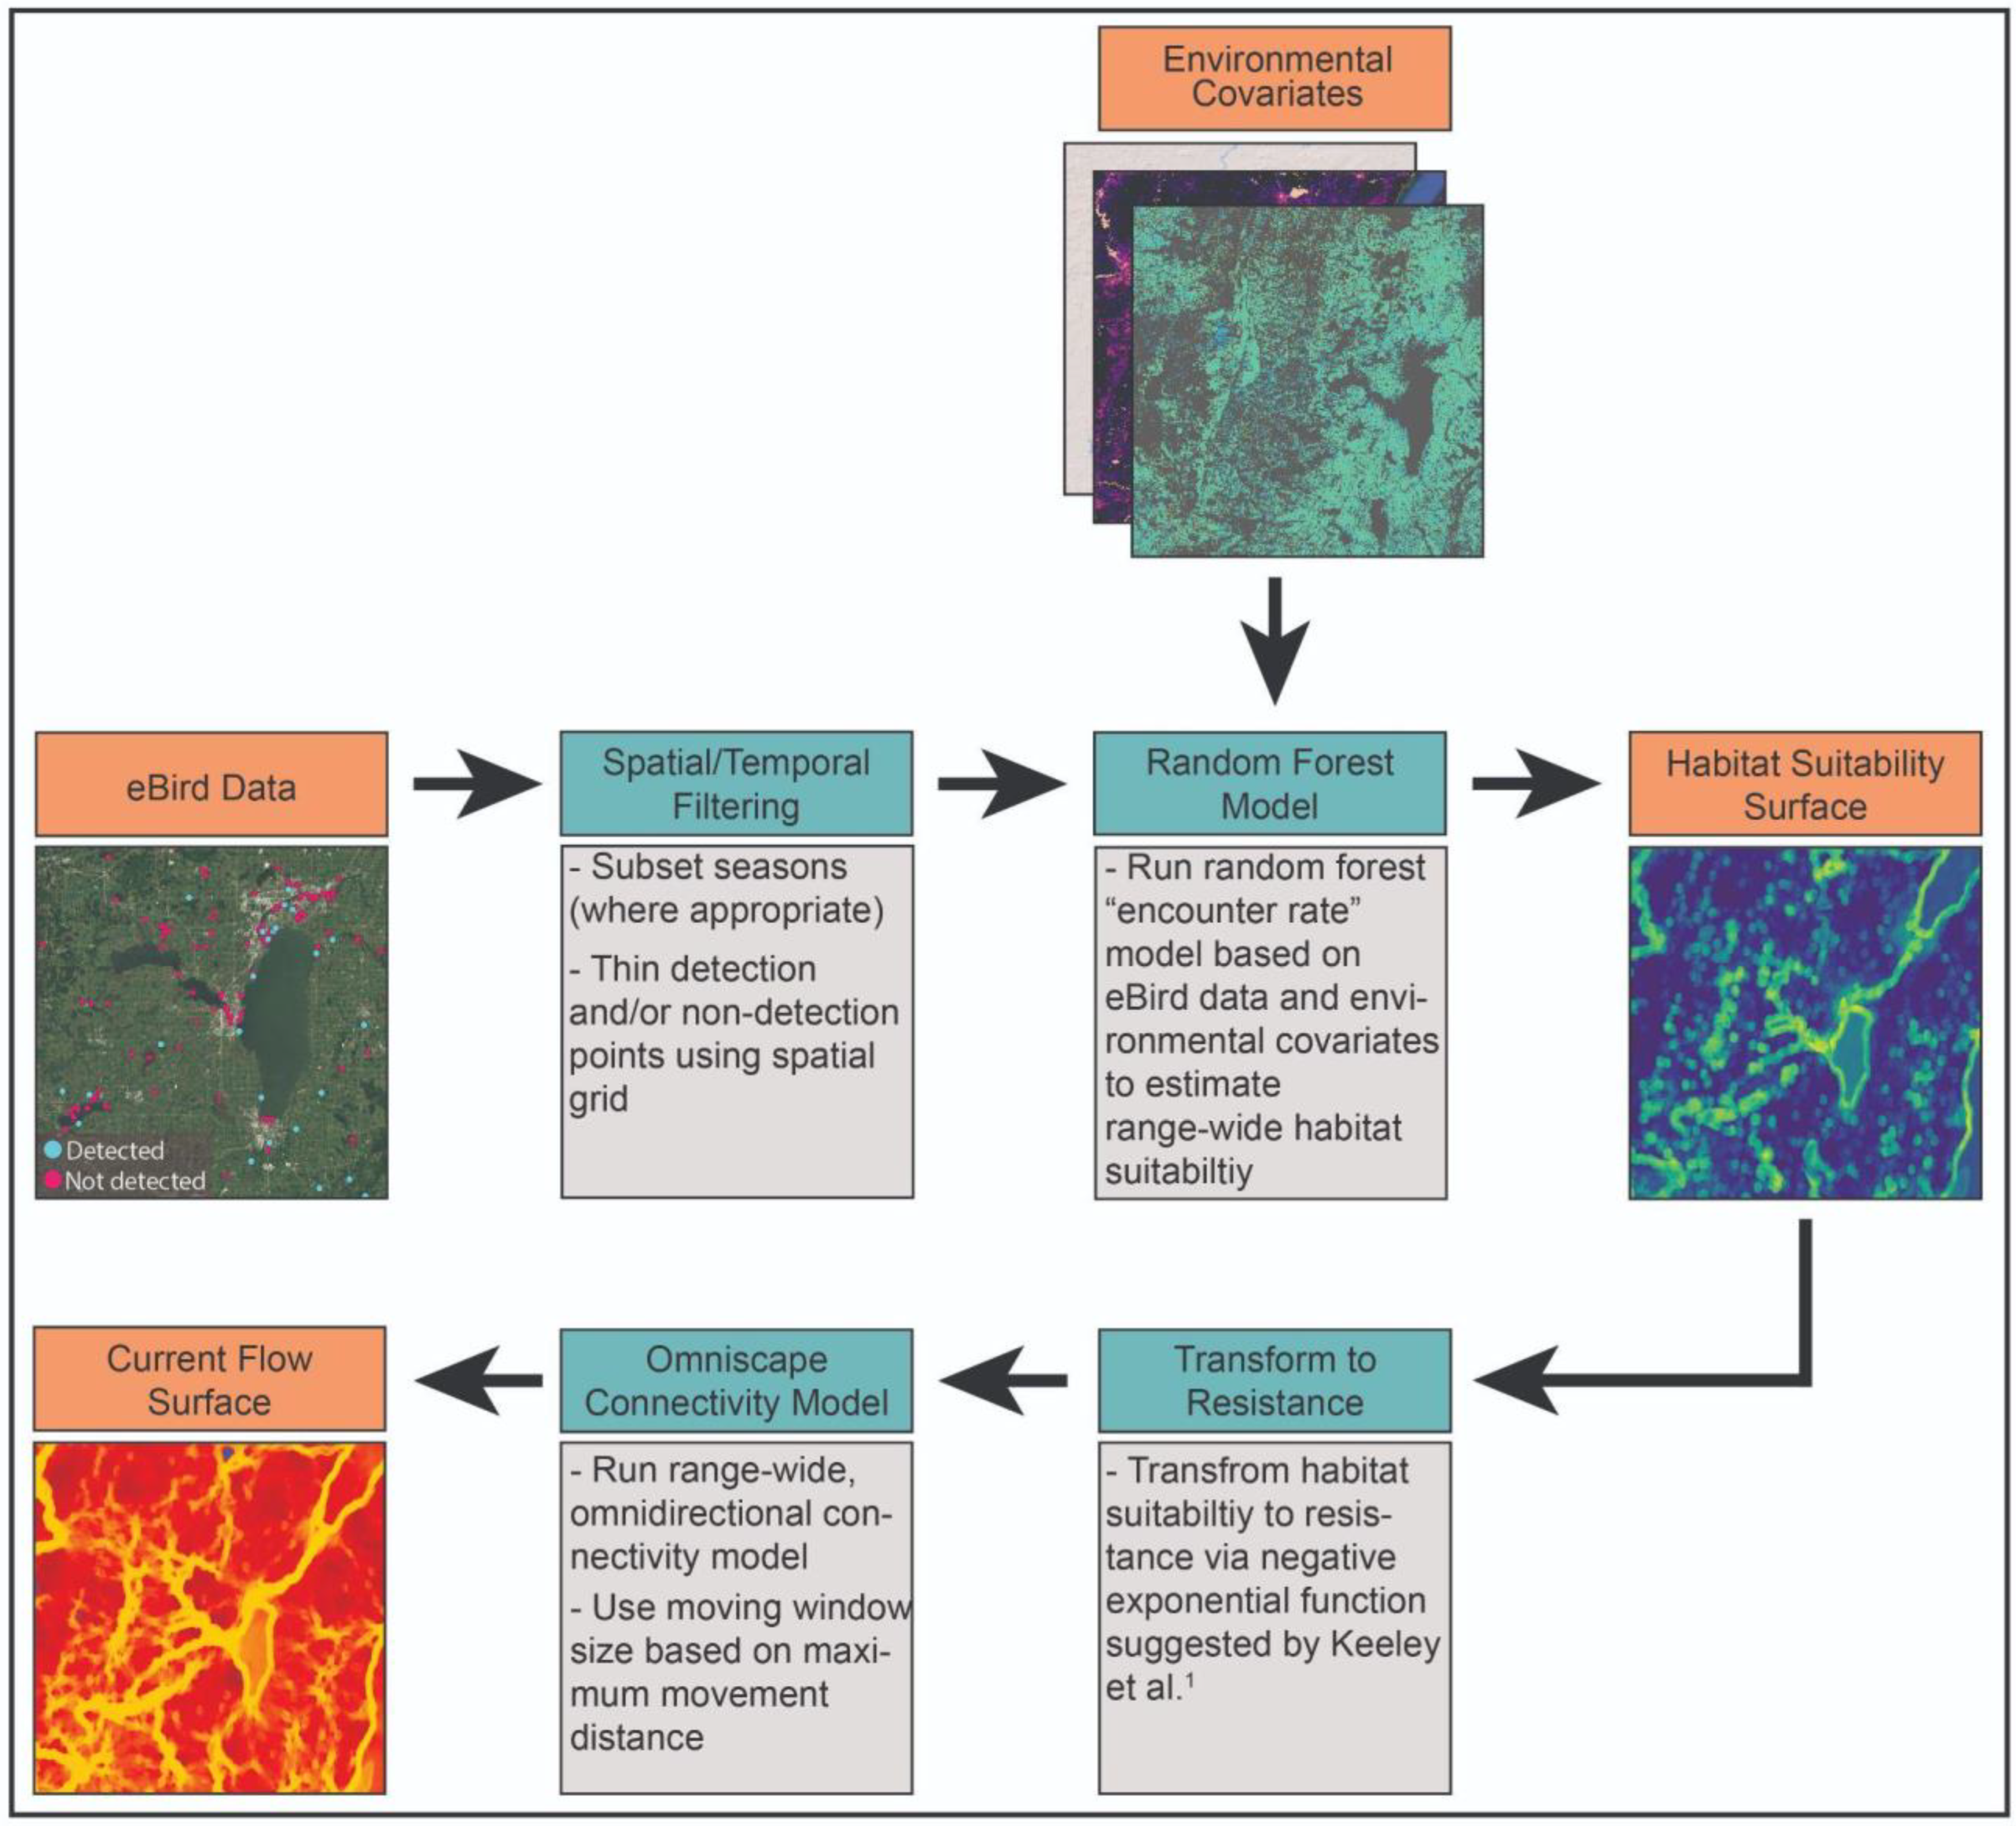
2. Methods
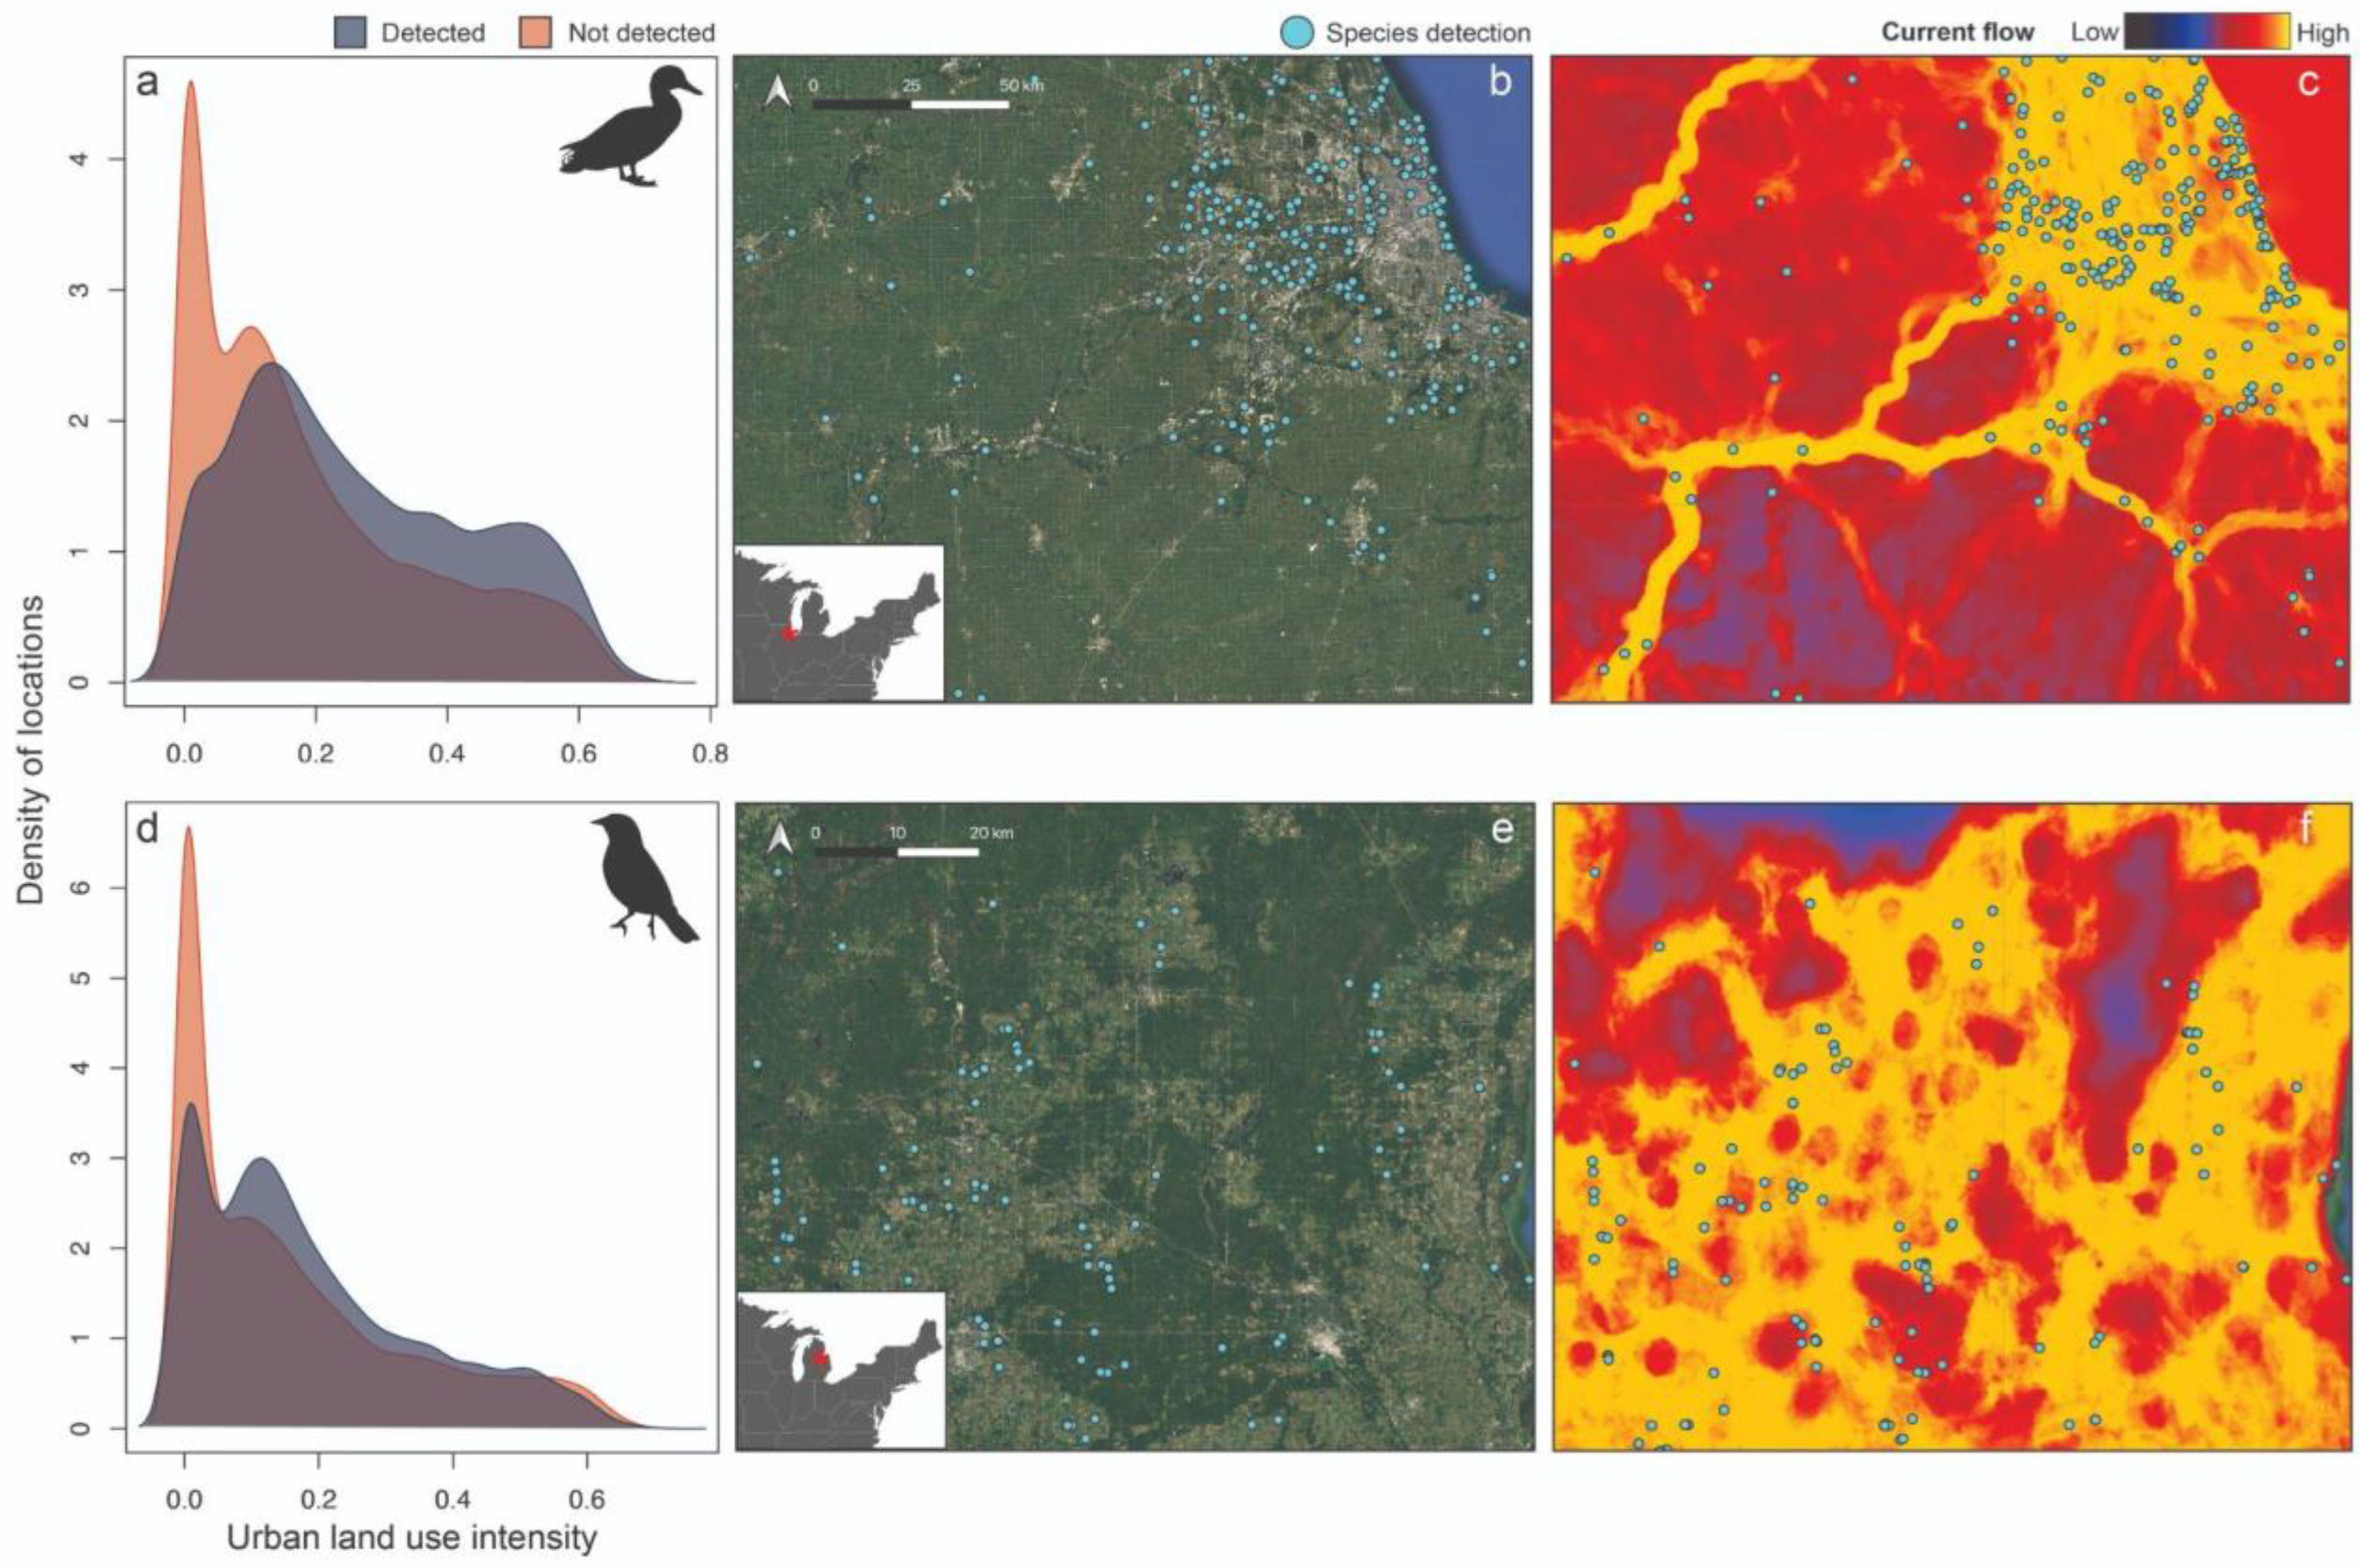
2.1. Focal Species Data
2.2. Model Covariates

| Covariate Name | Source | Date | Native Resolution | Predictor Type | Sage-Grouse | Black Duck | Bobolink |
|---|---|---|---|---|---|---|---|
| Agricultural land use intensity | Suraci et al. 2023 | 2016 | 250 m | focal mean | x | x | x |
| Urban land use intensity | Suraci et al. 2023 | 2016 | 250 m | focal mean | x | x | x |
| Transportation land use intensity | Suraci et al. 2023 | 2016 | 250 m | focal mean | x | x | x |
| Energy land use intensity | Suraci et al. 2023 | 2016 | 250 m | focal mean | x | x | x |
| Elevation | ALOS Global DSM (AW3D) 1 | 2021 | 30 m | focal mean | x | x | x |
| Slope | ALOS Global DSM (AW3D) | 2021 | 30 m | focal mean | x | x | x |
| Aspect | ALOS Global DSM (AW3D) | 2021 | 30 m | focal mean | x | x | x |
| Ruggedness | ALOS Global DSM (AW3D) | 2021 | 30 m | focal mean | x | x | x |
| Sage brush | LANDFIRE v2.0: Existing Vegetation Type 2 | 2016 | 30 m | percent cover | x | ||
| Water | NLCD 2016 3 | 2016 | 30 m | percent cover | x | x | |
| Herbaceous wetlands | NLCD 2016 | 2016 | 30 m | percent cover | x | ||
| All wetlands | NLCD 2016 | 2016 | 30 m | percent cover | x | ||
| Forest | NLCD 2016 | 2016 | 30 m | percent cover | x | ||
| Shrub | NLCD 2016 | 2016 | 30 m | percent cover | x | ||
| Grassland | NLCD 2016 & Farms Under Threat 4 | 2016 | 30 m, 10 m | percent cover | x | ||
| Tidal flats | Murray et al. 2019 | 2014–2016 | 30 m | percent cover | x | ||
| Snow-water equivalent | NASA Daymet V4 5 | 2014–2018 | 1 km | focal mean | x | ||
| Maximum temperature | NASA Daymet V4 | 2014–2018 | 1 km | focal mean | x | x | |
| Minimum temperature | NASA Daymet V4 | 2014–2018 | 1 km | focal mean | x | x | |
| Precipitation | NASA Daymet V4 | 2014–2018 | 1 km | focal mean | x | x | x |
2.3. Random Forest Models of Habitat Suitability
2.4. Connectivity Modeling
2.5. Comparison with Existing Sage-Grouse Models
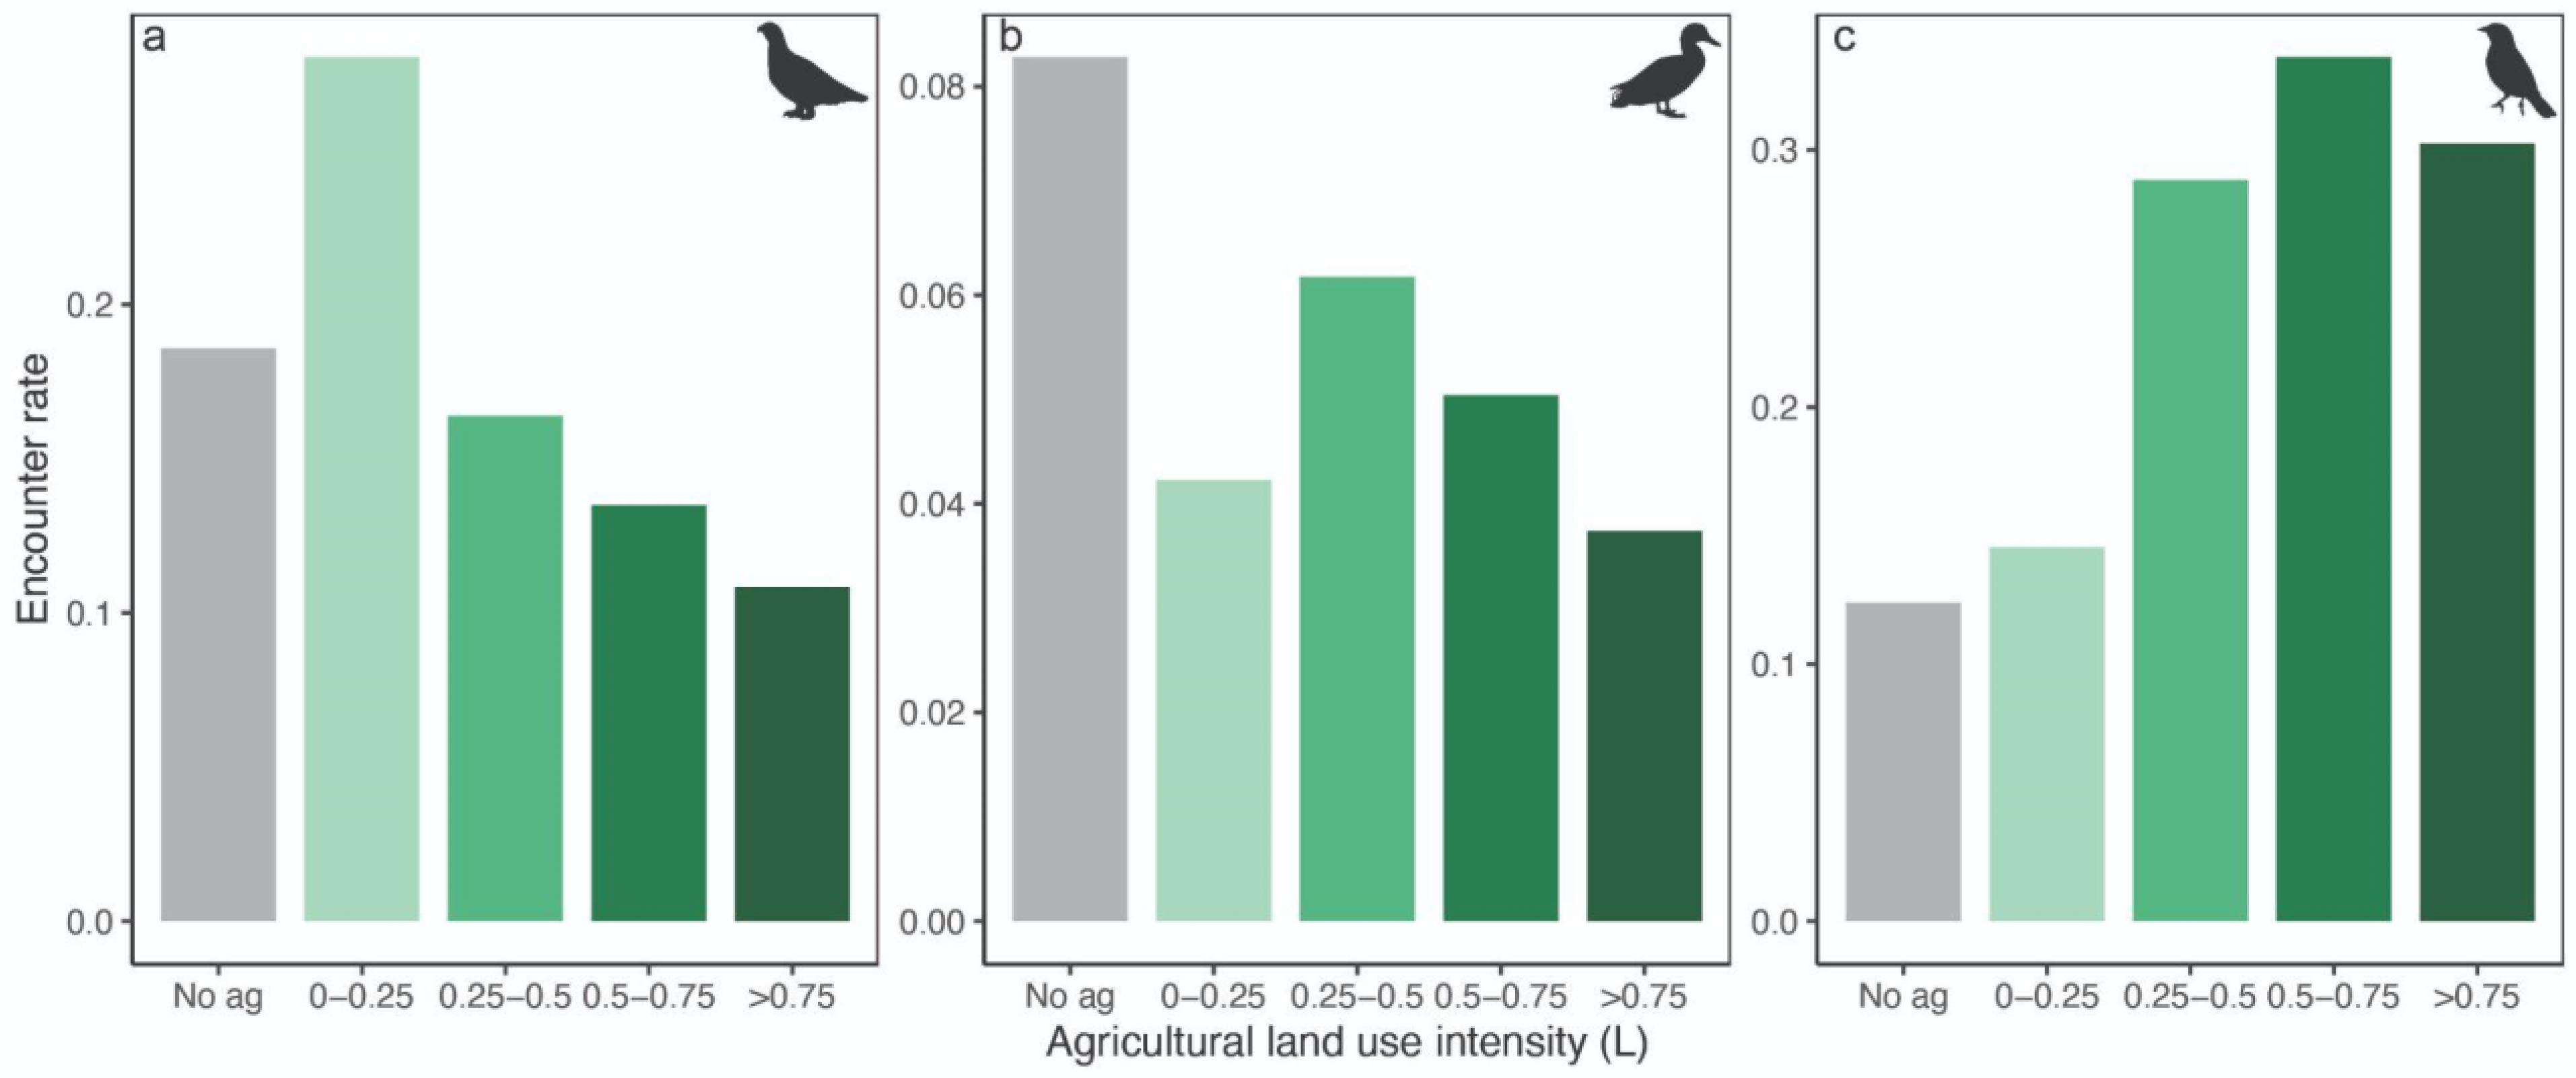
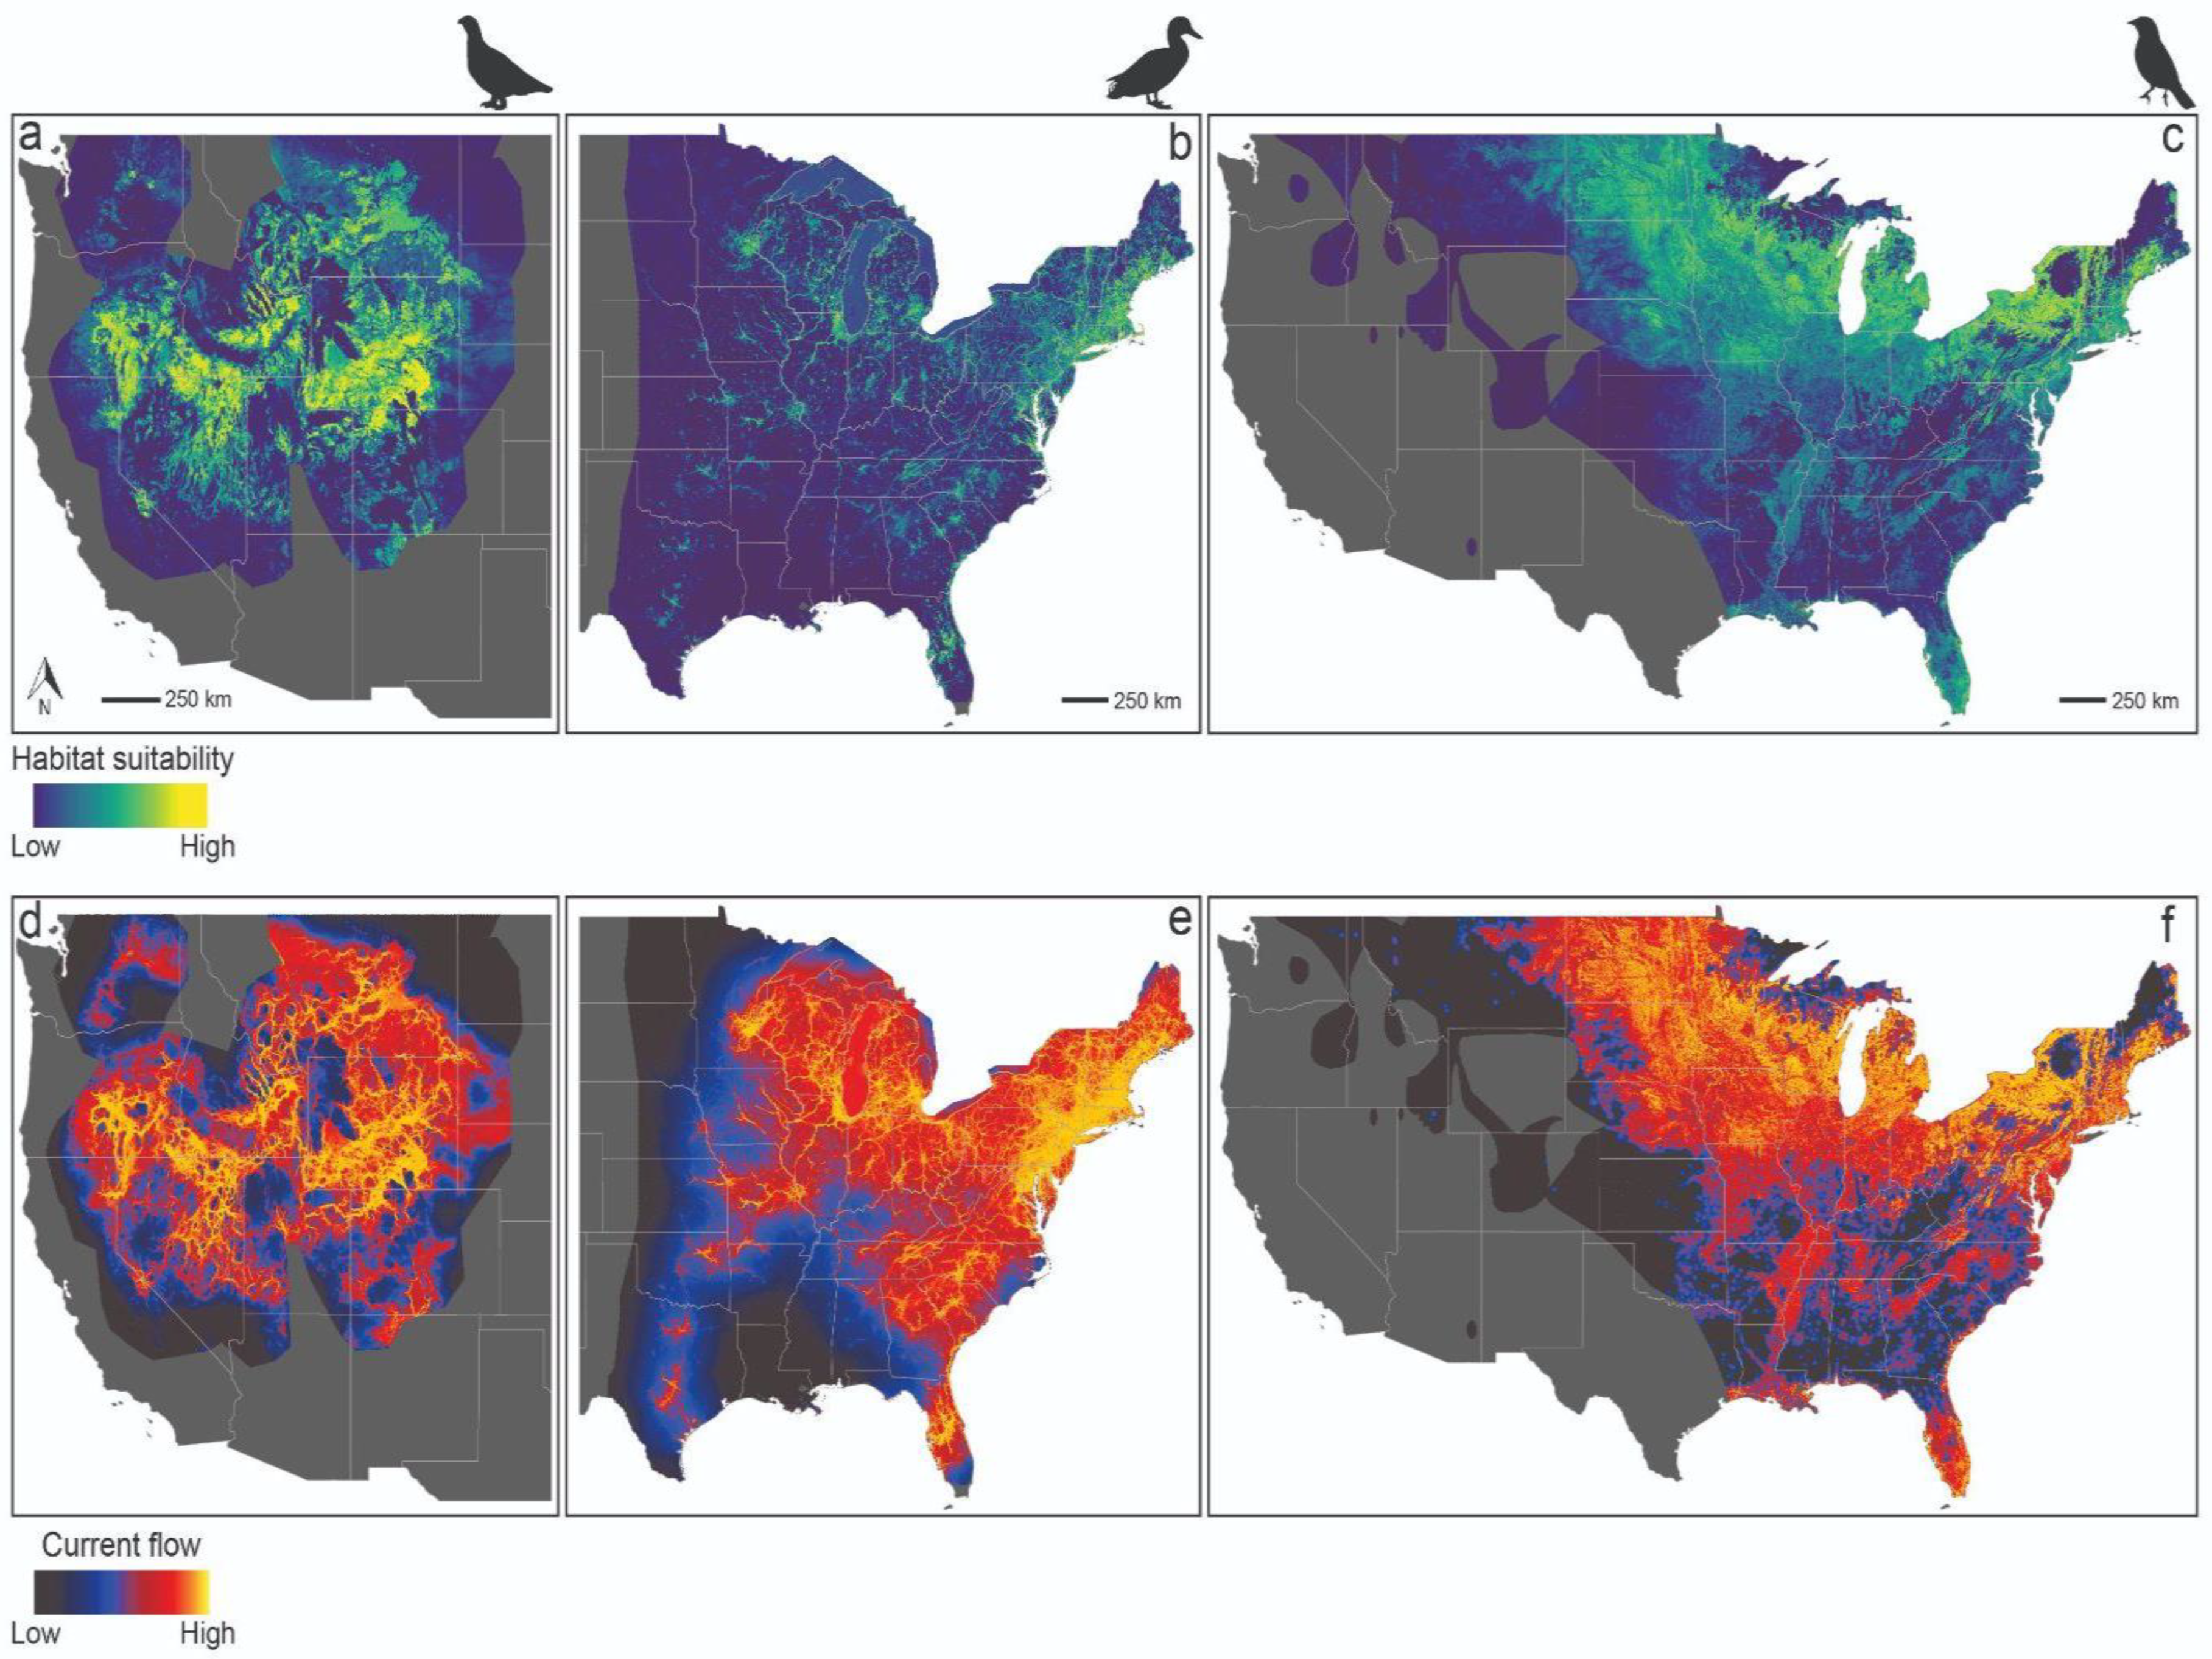
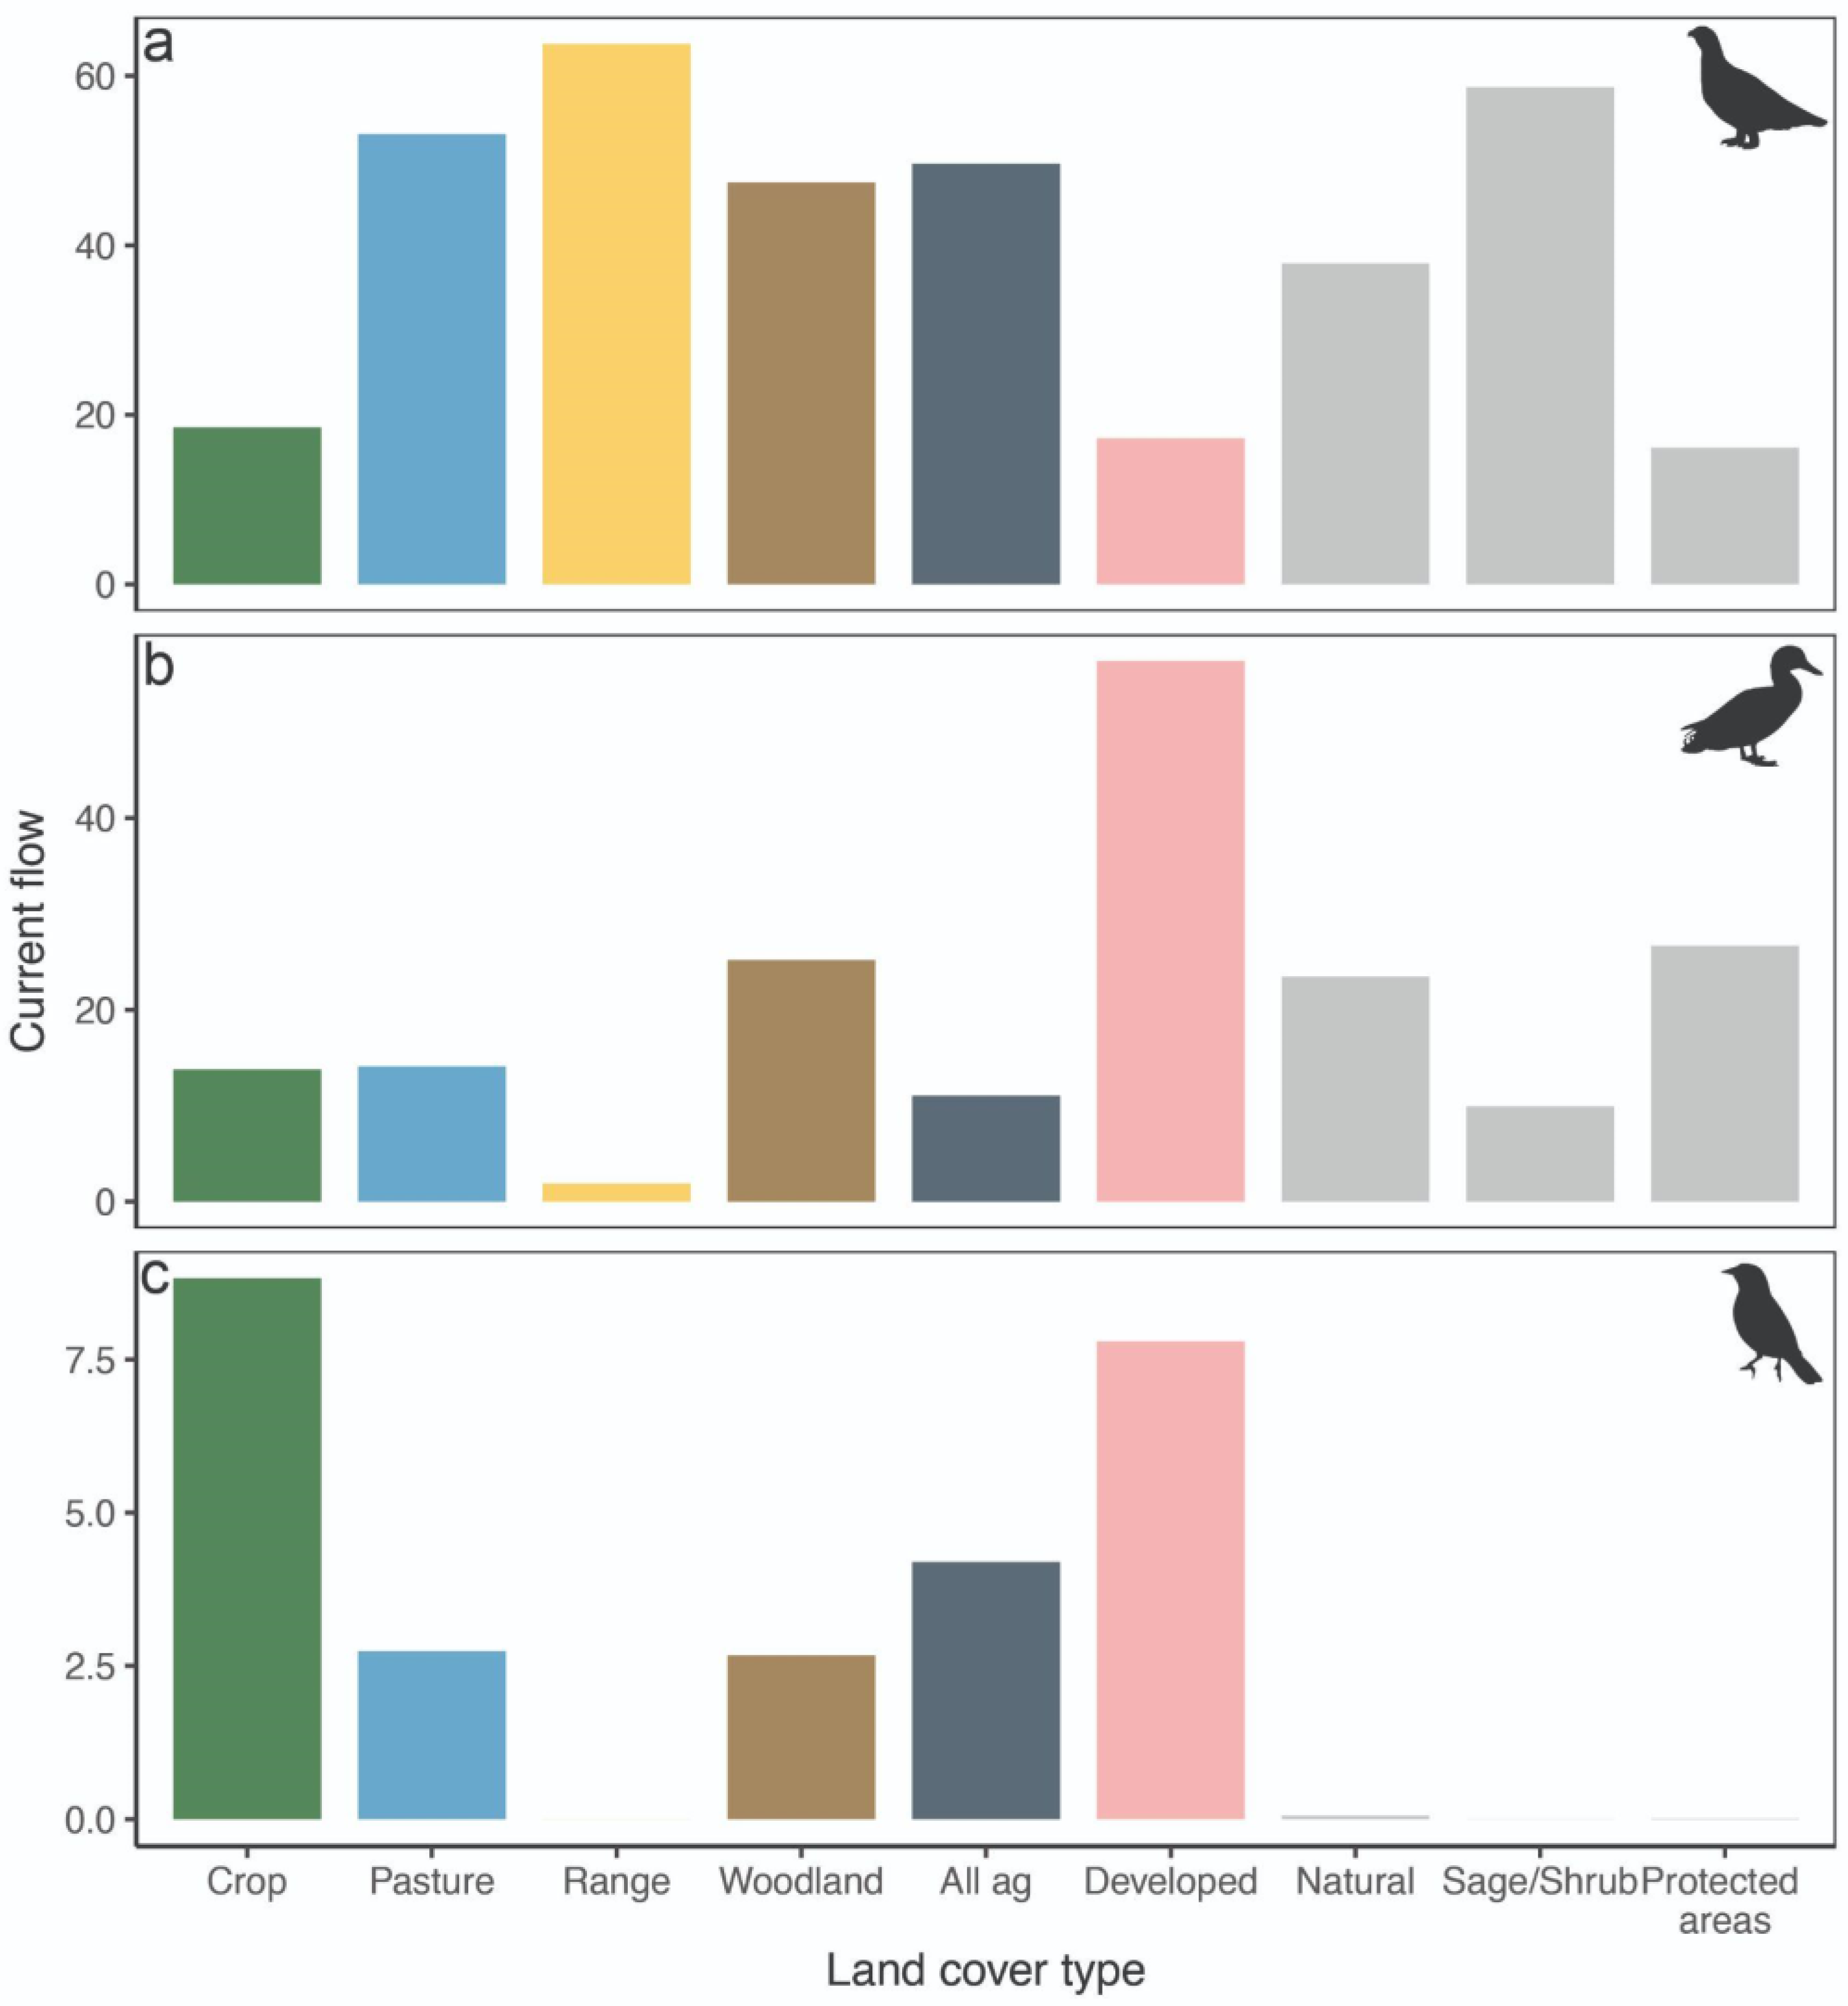
3. Results
4. Discussion
Supplementary Materials
Author Contributions
Funding
Data Availability Statement
Acknowledgments
Conflicts of Interest
References
- Suraci, J.P.; Littlefield, C.E.; Nicholson, C.C.; Hunter, M.C.; Sorensen, A.; Dickson, B.G. Mapping Connectivity and Conservation Opportunity on Agricultural Lands across the Conterminous United States. Biol. Conserv. 2023, 278, 109896. [Google Scholar] [CrossRef]
- Newbold, T.; Hudson, L.N.; Hill, S.L.L.; Contu, S.; Lysenko, I.; Senior, R.A.; Börger, L.; Bennett, D.J.; Choimes, A.; Collen, B.; et al. Global Effects of Land Use on Local Terrestrial Biodiversity. Nature 2015, 520, 45–50. [Google Scholar] [CrossRef] [Green Version]
- Stanton, R.L.; Morrissey, C.A.; Clark, R.G. Analysis of Trends and Agricultural Drivers of Farmland Bird Declines in North America: A Review. Agric. Ecosyst. Environ. 2018, 254, 244–254. [Google Scholar] [CrossRef]
- Fajardo, N.; Strong, A.M.; Perlut, N.G.; Buckley, N.J. Natal and Breeding Dispersal of Bobolinks (Dolichonyx Oryzivorus) and Savannah Sparrows (Passerculus Sandwichensis) in an Agricultural Landscape. Auk 2009, 126, 310–318. [Google Scholar] [CrossRef] [Green Version]
- Fehlmann, G.; O’riain, M.J.; Fürtbauer, I.; King, A.J. Behavioral Causes, Ecological Consequences, and Management Challenges Associated with Wildlife Foraging in Human-Modified Landscapes. BioScience 2021, 71, 40–54. [Google Scholar] [CrossRef]
- Doherty, T.S.; Driscoll, D.A. Coupling Movement and Landscape Ecology for Animal Conservation in Production Landscapes. Proc. R. Soc. B Biol. Sci. 2018, 285, 20172272. [Google Scholar] [CrossRef]
- Grass, I.; Loos, J.; Baensch, S.; Batáry, P.; Librán-Embid, F.; Ficiciyan, A.; Klaus, F.; Riechers, M.; Rosa, J.; Tiede, J.; et al. Land-Sharing/-Sparing Connectivity Landscapes for Ecosystem Services and Biodiversity Conservation. People Nat. 2019, 1, 262–272. [Google Scholar] [CrossRef] [Green Version]
- Sieving, K.E.; Willson, M.F.; De Santo, T.L. Habitat Barriers to Movement of Understory Birds in Fragmented South-Temperate Rainforest. Auk 1996, 113, 944–949. [Google Scholar] [CrossRef]
- Wimberly, M.C.; Narem, D.M.; Bauman, P.J.; Carlson, B.T.; Ahlering, M.A. Grassland Connectivity in Fragmented Agricultural Landscapes of the North-Central United States. Biol. Conserv. 2018, 217, 121–130. [Google Scholar] [CrossRef]
- Nogeire, T.M.; Davis, F.W. Can Orchards Help Connect Mediterranean Ecosystems? Animal Movement Data Alter Conservation Priorities. Amid 2015, 174, 105–116. [Google Scholar] [CrossRef] [Green Version]
- Fahrig, L.; Baudry, J.; Brotons, L.; Burel, F.G.; Crist, T.O.; Fuller, R.J.; Sirami, C.; Siriwardena, G.M.; Martin, J.-L. Functional Landscape Heterogeneity and Animal Biodiversity in Agricultural Landscapes. Ecol. Lett. 2011, 14, 101–112. [Google Scholar] [CrossRef] [PubMed]
- Redlich, S.; Martin, E.A.; Wende, B.; Steffan-Dewenter, I. Landscape Heterogeneity Rather than Crop Diversity Mediates Bird Diversity in Agricultural Landscapes. PLoS ONE 2018, 13, e0200438. [Google Scholar] [CrossRef] [PubMed] [Green Version]
- Hendershot, J.N.; Smith, J.R.; Anderson, C.B.; Letten, A.D.; Frishkoff, L.O.; Zook, J.R.; Fukami, T.; Daily, G.C. Intensive Farming Drives Long-Term Shifts in Avian Community Composition. Nature 2020, 579, 393–396. [Google Scholar] [CrossRef] [PubMed]
- Shirk, A.J.; Schroeder, M.A.; Robb, L.A.; Cushman, S.A. Persistence of Greater Sage-Grouse in Agricultural Landscapes. J. Wildl. Manag. 2017, 81, 905–918. [Google Scholar] [CrossRef]
- Coates, P.S.; Ricca, M.A.; Prochazka, B.G.; Brooks, M.L.; Doherty, K.E.; Kroger, T.; Blomberg, E.J.; Hagen, C.A.; Casazza, M.L. Wildfire, Climate, and Invasive Grass Interactions Negatively Impact an Indicator Species by Reshaping Sagebrush Ecosystems. Proc. Natl. Acad. Sci. USA 2016, 113, 12745–12750. [Google Scholar] [CrossRef] [PubMed] [Green Version]
- Tack, J.D.; Jakes, A.F.; Jones, P.F.; Smith, J.T.; Newton, R.E.; Martin, B.H.; Hebblewhite, M.; Naugle, D.E. Beyond Protected Areas: Private Lands and Public Policy Anchor Intact Pathways for Multi-Species Wildlife Migration. Biol. Conserv. 2019, 234, 18–27. [Google Scholar] [CrossRef]
- English, M.D.; Robertson, G.J.; Peck, L.E.; Mallory, M.L. Agricultural Food Resources and the Foraging Ecologies of American Black Ducks (Anas Rubripes) and Mallards (Anas Platyrhynchos) at the Northern Limits of Their Winter Ranges. Urban Ecosyst. 2017, 20, 1311–1318. [Google Scholar] [CrossRef]
- Conroy, M.J.; Miller, M.W.; Hines, J.E. Identification and Synthetic Modeling of Factors Affecting American Black Duck Populations. Wildl. Monogr. 2002, 150, 1–64. [Google Scholar]
- Maisonneuve, C.; Bélanger, L.; Bordage, D.; Jobin, B.; Grenier, M.; Beaulieu, J.; Gabor, S.; Filion, B. American Black Duck and Mallard Breeding Distribution and Habitat Relationships along a Forest-Agriculture Gradient in Southern Québec. J. Wildl. Manag. 2006, 70, 450–459. [Google Scholar] [CrossRef]
- Lieske, D.J.; Pollard, B.; Gloutney, M.; Milton, R.; Connor, K.; Dibblee, R.; Parsons, G.; Howerter, D. The Importance of Agricultural Landscapes as Key Nesting Habitats for the American Black Duck in Maritime Canada. Waterbirds 2012, 35, 525–534. [Google Scholar] [CrossRef]
- Herkert, J.R. Bobolink Dolichonyx Oryzivorus Population Decline in Agricultural Landscapes in the Midwestern USA. Biol. Conserv. 1997, 80, 107–112. [Google Scholar] [CrossRef]
- Perlut, N.G.; Strong, A.M.; Donovan, T.M.; Buckley, N.J. Regional Population Viability of Grassland Songbirds: Effects of Agricultural Management. Biol. Conserv. 2008, 141, 3139–3151. [Google Scholar] [CrossRef]
- Tack, J.D.; Naugle, D.E.; Carlson, J.C.; Fargey, P.J. Greater Sage-Grouse Centrocercus Urophasianus Migration Links the USA and Canada: A Biological Basis for International Prairie Conservation. Oryx 2012, 46, 64–68. [Google Scholar] [CrossRef] [Green Version]
- Oyler-Mccance, S.J.; Taylor, S.E.; Quinn, T.W. A Multilocus Population Genetic Survey of the Greater Sage-Grouse across Their Range. Mol. Ecol. 2005, 14, 1293–1310. [Google Scholar] [CrossRef] [Green Version]
- Coluccy, J.M.; Anderson, K.A.; Yerkes, T.; Bowman, J.L. Migration Routes and Chronology of American Black Duck Anas Rubripes. Wildfowl 2020, 70, 148–166. [Google Scholar]
- Peck, L.E.; English, M.D.; Robertson, G.J.; Craik, S.R.; Mallory, M.L. Migration Chronology and Movements of Adult American Black Ducks Anas Rubripes Wintering in Nova Scotia, Canada. Wildl. Biol. 2022, 2022, e01000. [Google Scholar] [CrossRef]
- Perlut, N.G. Prevalent Transoceanic Fall Migration by a 30-Gram Songbird, the Bobolink. Auk 2018, 135, 992–997. [Google Scholar] [CrossRef]
- Cava, J.A.; Perlut, N.G.; Travis, S.E. Why Come Back Home? Investigating the Proximate Factors That Influence Natal Philopatry in Migratory Passerines. Anim. Behav. 2016, 118, 39–46. [Google Scholar] [CrossRef] [Green Version]
- Crist, M.R.; Knick, S.T.; Hanser, S.E. Range-Wide Connectivity of Priority Areas for Greater Sage-Grouse: Implications for Long-Term Conservation from Graph Theory. Condor 2017, 119, 44–57. [Google Scholar] [CrossRef]
- Row, J.R.; Doherty, K.E.; Cross, T.B.; Schwartz, M.K.; Oyler-McCance, S.J.; Naugle, D.E.; Knick, S.T.; Fedy, B.C. Quantifying Functional Connectivity: The Role of Breeding Habitat, Abundance, and Landscape Features on Range-Wide Gene Flow in Sage-Grouse. Evol. Appl. 2018, 11, 1305–1321. [Google Scholar] [CrossRef]
- Sullivan, B.L.; Aycrigg, J.L.; Barry, J.H.; Bonney, R.E.; Bruns, N.; Cooper, C.B.; Damoulas, T.; Dhondt, A.A.; Dietterich, T.; Farnsworth, A.; et al. The EBird Enterprise: An Integrated Approach to Development and Application of Citizen Science. Biol. Conserv. 2014, 169, 31–40. [Google Scholar] [CrossRef]
- Johnston, A.; Hochachka, W.M.; Strimas-Mackey, M.E.; Gutierrez, V.R.; Robinson, O.J.; Miller, E.T.; Auer, T.; Kelling, S.T.; Fink, D. Analytical Guidelines to Increase the Value of Community Science Data: An Example Using EBird Data to Estimate Species Distributions. Divers. Distrib. 2021, 27, 1265–1277. [Google Scholar] [CrossRef]
- Keeley, A.T.H.; Beier, P.; Gagnon, J.W. Estimating Landscape Resistance from Habitat Suitability: Effects of Data Source and Nonlinearities. Landsc. Ecol. 2016, 31, 2151–2162. [Google Scholar] [CrossRef]
- Strimas-Mackey, M.; Hochachka, W.M.; Ruiz-Gutierrez, V.; Robinson, O.J.; Miller, E.T.; Auer, T.; Kelling, S.; Fink, D.; Johnston, A. Best Practices for Using EBird Data; Version 1.0; Cornell Lab of Ornithology: Ithaca, NY, USA, 2020. [Google Scholar]
- BirdLife International and Handbook of the Birds of the World Centrocercus urophasianus; The IUCN Red List of Threatened Species. Version 2021-3. 2016. Available online: https://www.iucnredlist.org (accessed on 9 December 2021).
- BirdLife International and Handbook of the Birds of the World Dolichonyx Oryzivorus; The IUCN Red List of Threatened Species. Version 2021-3. 2016. Available online: https://www.iucnredlist.org (accessed on 6 January 2022).
- BirdLife International and Handbook of the Birds of the World Anas rubripes; The IUCN Red List of Threatened Species. Version 2021-3. 2021. Available online: https://www.iucnredlist.org (accessed on 6 January 2022).
- Luck, G.W.; Ricketts, T.H.; Daily, G.C.; Imhoff, M. Alleviating Spatial Conflict between People and Biodiversity. Proc. Natl. Acad. Sci. USA 2004, 101, 182–186. [Google Scholar] [CrossRef] [Green Version]
- Courter, J.R.; Johnson, R.J.; Stuyck, C.M.; Lang, B.A.; Kaiser, E.W. Weekend Bias in Citizen Science Data Reporting: Implications for Phenology Studies. Int. J. Biometeorol. 2013, 57, 715–720. [Google Scholar] [CrossRef]
- Robinson, O.J.; Ruiz-Gutierrez, V.; Fink, D. Correcting for Bias in Distribution Modelling for Rare Species Using Citizen Science Data. Divers. Distrib. 2018, 24, 460–472. [Google Scholar] [CrossRef] [Green Version]
- Strimas-Mackey, M.; Miller, E.; Hochachka, W. Auk: EBird Data Extraction and Processing with AWK. In R Package Version 0.3. 0; R Core: Vienna, Austria, 2018. [Google Scholar]
- R Core Team. R: A Language and Environment for Statistical Computing; R Core: Vienna, Austria, 2021. [Google Scholar]
- CSP. Methods and Approach Used to Estimate the Loss and Fragmentation of Natural Lands in the Conterminous U.S. from 2001 to 2017; CSP: Truckee, CA, USA, 2019. [Google Scholar]
- Theobald, D.M. A General Model to Quantify Ecological Integrity for Landscape Assessments and US Application. Landsc. Ecol 2013, 28, 1859–1874. [Google Scholar] [CrossRef]
- CSP. Description of the Approach, Data, and Analytical Methods Used for the Farms Under Threat: State of the States Project; Version 2.0; Final Technical Report; CSP: Truckee, CA, USA, 2020. [Google Scholar]
- Dewitz, J. National Land Cover Database (NLCD) 2016 Products: U.S. Geological Survey Data Release. 2019. Available online: https://www.sciencebase.gov/catalog/item/5d4c6a1de4b01d82ce8dfd2f (accessed on 20 May 2022).
- USDA. Summary Report: 2017 National Resources Inventory; Natural Resources Conservation Service: Washington, DC, USA; Center for Survey Statistics and Methodology, Iowa State University: Ames, IA, USA, 2020. [Google Scholar]
- Takaku, J.; Tadono, T.; Tsutsui, K.; Ichikawa, M. Validation of “AW3D” Global DSM Generated from ALOS PRISM. ISPRS Ann. Photogramm. Remote Sens. Spat. Inf. Sci. 2016, 3, 25. [Google Scholar] [CrossRef] [Green Version]
- Sappington, J.M.; Longshore, K.M.; Thompson, D.B. Quantifying Landscape Ruggedness for Animal Habitat Analysis: A Case Study Using Bighorn Sheep in the Mojave Desert. J. Wildl. Manag. 2007, 71, 1419–1426. [Google Scholar] [CrossRef]
- Connelly, J.W.; Schroeder, M.A.; Sands, A.R.; Braun, C.E. Guidelines to Manage Sage Grouse Populations and Their Habitats. Wildl. Soc. Bull. 2000, 28, 967–985. [Google Scholar]
- Zeller, K.A.; Cushman, S.A.; Van Lanen, N.J.; Boone, J.D.; Ammon, E. Targeting Conifer Removal to Create an Even Playing Field for Birds in the Great Basin. Biol. Conserv. 2021, 257, 109130. [Google Scholar] [CrossRef]
- LANDFIRE Existing Vegetation Type Layer, LANDFIRE 2.0.0. 2016. Available online: https://www.landfire.gov/evt.php (accessed on 20 May 2022).
- Morton, J.M.; Kirkpatrick, R.L.; Vaughan, M.R.; Stauffer, F. Habitat Use and Movements of American Black Ducks in Winter. J. Wildl. Manag. 1989, 53, 390–400. [Google Scholar] [CrossRef]
- Murray, N.J.; Phinn, S.R.; DeWitt, M.; Ferrari, R.; Johnston, R.; Lyons, M.B.; Clinton, N.; Thau, D.; Fuller, R.A. The Global Distribution and Trajectory of Tidal Flats. Nature 2019, 565, 222–225. [Google Scholar] [CrossRef]
- Bollinger, E.K.; Gavin, T.A. Responses of Nesting Bobolinks (Dolichonyx Oryzivorus) to Habitat Edges. Auk 2004, 121, 767–776. [Google Scholar] [CrossRef]
- Thornton, M.M.; Shrestha, R.; Wei, Y.; Thornton, P.E.; Kao, S.-C.; Wilson, B.E. Daymet: Daily Surface Weather Data on a 1-km Grid for North America; Version 4; ORNL DAAC: Oak Ridge, TN, USA, 2020. [Google Scholar] [CrossRef]
- Homer, C.G.; Edwards, T.C.; Ramsey, R.D.; Price, K.P. Use of Remote Sensing Methods in Modelling Sage Grouse Winter Habitat. J. Wildl. Manag. 1993, 57, 78–84. [Google Scholar] [CrossRef]
- Gorelick, N.; Hancher, M.; Dixon, M.; Ilyushchenko, S.; Thau, D.; Moore, R. Google Earth Engine: Planetary-Scale Geospatial Analysis for Everyone. Remote Sens. Environ. 2017, 202, 18–27. [Google Scholar] [CrossRef]
- Cutler, D.R.; Edwards, T.C., Jr.; Beard, K.H.; Cutler, A.; Hess, K.T.; Gibson, J.; Lawler, J.J. Random Forests for Classification in Ecology. Ecology 2007, 88, 2783–2792. [Google Scholar] [CrossRef]
- Fox, E.W.; Hill, R.A.; Leibowitz, S.G.; Olsen, A.R.; Thornbrugh, D.J.; Weber, M.H. Assessing the Accuracy and Stability of Variable Selection Methods for Random Forest Modeling in Ecology. Environ. Monit Assess 2017, 189, 316. [Google Scholar] [CrossRef]
- Bradter, U.; Mair, L.; Jönsson, M.; Knape, J.; Singer, A.; Snäll, T. Can Opportunistically Collected Citizen Science Data Fill a Data Gap for Habitat Suitability Models of Less Common Species? Methods Ecol. Evol. 2018, 9, 1667–1678. [Google Scholar] [CrossRef]
- Fletcher, R.J.; Hefley, T.J.; Robertson, E.P.; Zuckerberg, B.; McCleery, R.A.; Dorazio, R.M. A Practical Guide for Combining Data to Model Species Distributions. Ecology 2019, 100, e02710. [Google Scholar] [CrossRef] [PubMed]
- Bellamy, C.; Boughey, K.; Hawkins, C.; Reveley, S.; Spake, R.; Williams, C.; Altringham, J. A Sequential Multi-Level Framework to Improve Habitat Suitability Modelling. Landsc. Ecol. 2020, 35, 1001–1020. [Google Scholar] [CrossRef] [Green Version]
- Wright, M.N.; Ziegler, A. Ranger: A Fast Implementation of Random Forests for High Dimensional Data in C++ and R. J. Stat. Softw. 2017, 77, 1–17. [Google Scholar] [CrossRef] [Green Version]
- Malley, J.D.; Kruppa, J.; Dasgupta, A.; Malley, K.G.; Ziegler, A. Probability Machines: Consistent Probability Estimation Using Nonparametric Learning Machines. Methods Inf. Med. 2012, 51, 74–81. [Google Scholar] [CrossRef] [PubMed]
- Hastie, T.; Tibshirani, R.; Friedman, J. The Elements of Statistical Learning: Data Mining, Inference, and Prediction, 2nd ed.; Springer Series in Statistics; Springer: New York, NY, USA, 2009. [Google Scholar]
- McRae, B.; Popper, K.; Jones, A.; Schindel, M.; Buttrick, S.; Hall, K.; Unnasch, R.; Platt, J. Conserving Nature’s Stage: Mapping Omnidirectional Connectivity for Resilient Terrestrial Landscapes in the Pacific Northwest; The Nature Conservancy: Portland, OR, USA, 2016. [Google Scholar]
- Landau, V.A.; Shah, V.B.; Anantharaman, R.; Hall, K.R. Omniscape.Jl: Software to Compute Omnidirectional Landscape Connectivity. J. Open Source Softw. 2021, 6, 2829. [Google Scholar] [CrossRef]
- McRae, B.H.; Dickson, B.G.; Keitt, T.H.; Shah, V.B. Using Circuit Theory to Model Connectivity in Ecology, Evolution, and Conservation. Ecology 2008, 89, 2712–2724. [Google Scholar] [CrossRef]
- Dickson, B.G.; Albano, C.M.; Anantharaman, R.; Beier, P.; Fargione, J.; Graves, T.A.; Gray, M.E.; Hall, K.R.; Lawler, J.J.; Leonard, P.B.; et al. Circuit-Theory Applications to Connectivity Science and Conservation. Conserv. Biol. 2019, 33, 239–249. [Google Scholar] [CrossRef]
- Abrahms, B.; Sawyer, S.C.; Jordan, N.R.; McNutt, J.W.; Wilson, A.M.; Brashares, J.S. Does Wildlife Resource Selection Accurately Inform Corridor Conservation? J. Appl. Ecol. 2017, 54, 412–422. [Google Scholar] [CrossRef] [Green Version]
- Dunn, P.O.; Braun, C.E. Late Summer-Spring Movements of Juvenile Sage Grouse. Wilson Bull. 1986, 98, 83–92. [Google Scholar]
- Cross, T.B.; Naugle, D.E.; Carlson, J.C.; Schwartz, M.K. Genetic Recapture Identifies Long-Distance Breeding Dispersal in Greater Sage-Grouse (Centrocercus Urophasianus). Condor 2017, 119, 155–166. [Google Scholar] [CrossRef] [Green Version]
- USGS. U.S. Geological Survey (USGS) Gap Analysis Project (GAP). Protected Areas Database of the United States (PAD-US) 2.1: U.S. Geological Survey Data Release; USGS: Reston, VA, USA, 2020. [Google Scholar]
- Hijmans, R.J.; Van Etten, J.; Sumner, M.; Cheng, J.; Baston, D.; Bevan, A.; Bivand, R.; Busetto, L.; Canty, M.; Fasoli, B.; et al. Raster: Geographic Data Analysis and Modeling; 2023; Available online: https://CRAN.R-project.org/package=raster (accessed on 5 February 2023).
- Doherty, K.E.; Naugle, D.E.; Walker, B.L.; Graham, J.M. Greater Sage-Grouse Winter Habitat Selection and Energy Development. J. Wildl. Manag. 2008, 72, 187–195. [Google Scholar] [CrossRef]
- Knick, S.T.; Hanser, S.E.; Preston, K.L. Modeling Ecological Minimum Requirements for Distribution of Greater Sage-Grouse Leks: Implications for Population Connectivity across Their Western Range, U.S.A. Ecol. Evol. 2013, 3, 1539–1551. [Google Scholar] [CrossRef]
- Doherty, K.E.; Evans, J.S.; Coates, P.S.; Juliusson, L.M.; Fedy, B.C. Importance of Regional Variation in Conservation Planning: A Rangewide Example of the Greater Sage-Grouse. Ecosphere 2016, 7, e01462. [Google Scholar] [CrossRef]
- Doherty, K.; Theobald, D.M.; Bradford, J.B.; Wiechman, L.A.; Bedrosian, G.; Boyd, C.S.; Cahill, M.; Coates, P.S.; Creutzburg, M.K.; Crist, M.R.; et al. A Sagebrush Conservation Design to Proactively Restore America’s Sagebrush Biome; Open-File Report, No. 2022-1081; U.S. Geological Survey: Reston, VA, USA, 2022. [Google Scholar]
- Copeland, H.E.; Pocewicz, A.; Naugle, D.E.; Griffiths, T.; Keinath, D.; Evans, J.; Platt, J. Measuring the Effectiveness of Conservation: A Novel Framework to Quantify the Benefits of Sage-Grouse Conservation Policy and Easements in Wyoming. PLoS ONE 2013, 8, e67261. [Google Scholar] [CrossRef] [PubMed]
- Stevens, C.E.; Gabor, T.S.; Diamond, A.W. Use of Restored Small Wetlands by Breeding Waterfowl in Prince Edward Island, Canada. Restor. Ecol. 2003, 11, 3–12. [Google Scholar] [CrossRef]
- Robinson, O.J.; McGowan, C.P.; Devers, P.K. Updating Movement Estimates for American Black Ducks (Anas Rubripes). PeerJ 2016, 4, e1787. [Google Scholar] [CrossRef] [Green Version]
- Knittle, C.E.; Porter, R.D. Waterfowl Damage and Control Methods in Ripening Grain: An Overview; U.S. Department of the Interior, Fish and Wildlife Service: Denver, CO, USA, 1987. [Google Scholar]
- Fox, A.D.; Elmberg, J.; Tombre, I.M.; Hessel, R. Agriculture and Herbivorous Waterfowl: A Review of the Scientific Basis for Improved Management. Biol. Rev. 2017, 92, 854–877. [Google Scholar] [CrossRef]
- Perlut, N.G.; Strong, A.M.; Donovan, T.M.; Buckley, N.J. Grassland Songbirds in a Dynamic Management Landscape: Behavioral Responses and Management Strategies. Ecol. Appl. 2006, 16, 2235–2247. [Google Scholar] [CrossRef]
- McGowan, M.M.; Perlut, N.G.; Strong, A.M. Agriculture Is Adapting to Phenological Shifts Caused by Climate Change, but Grassland Songbirds Are Not. Ecol. Evol. 2021, 11, 6993–7002. [Google Scholar] [CrossRef]
- Kremen, C.; Merenlender, A.M. Landscapes That Work for Biodiversity and People. Science 2018, 362, eaau6020. [Google Scholar] [CrossRef] [Green Version]
- Ringelman, K.M.; Williams, C.K.; Devers, P.K.; Coluccy, J.M.; Castelli, P.M.; Anderson, K.A.; Bowman, J.L.; Costanzo, G.R.; Cramer, D.M.; Dibona, M.T.; et al. A Meta-Analysis of American Black Duck Winter Habitat Use along the Atlantic Coast. J. Wildl. Manag. 2015, 79, 1298–1307. [Google Scholar] [CrossRef]
- Jones, Z.F.; Bock, C.E. Conservation of Grassland Birds in an Urbanizing Landscape: A Historical Perspective. Condor 2002, 104, 643–651. [Google Scholar] [CrossRef]
- Pavlacky, D.C.; Hagen, C.A.; Bartuszevige, A.M.; Iovanna, R.; George, T.L.; Naugle, D.E. Scaling up Private Land Conservation to Meet Recovery Goals for Grassland Birds. Conserv. Biol. 2021, 35, 1564–1574. [Google Scholar] [CrossRef] [PubMed]


| Mean Squared Error | Sensitivity | Specificity | AUC | Kappa | |
|---|---|---|---|---|---|
| Sage grouse | 0.076 | 0.75 | 0.967 | 0.944 | 0.744 |
| Black duck | 0.118 | 0.637 | 0.916 | 0.899 | 0.528 |
| Bobolink | 0.153 | 0.621 | 0.852 | 0.831 | 0.435 |
| Comparison Model | Comparison Model HCA within This Study’s HCA | This Study’s HCA within Comparison Model HCA |
|---|---|---|
| Crist et al. 2017 | 64.6% | 47.1% |
| Row et al. 2018 | 65.5% | 52.4% |
Disclaimer/Publisher’s Note: The statements, opinions and data contained in all publications are solely those of the individual author(s) and contributor(s) and not of MDPI and/or the editor(s). MDPI and/or the editor(s) disclaim responsibility for any injury to people or property resulting from any ideas, methods, instructions or products referred to in the content. |
© 2023 by the authors. Licensee MDPI, Basel, Switzerland. This article is an open access article distributed under the terms and conditions of the Creative Commons Attribution (CC BY) license (https://creativecommons.org/licenses/by/4.0/).
Share and Cite
Suraci, J.P.; Mozelewski, T.G.; Littlefield, C.E.; Nogeire McRae, T.; Sorensen, A.; Dickson, B.G. Management of U.S. Agricultural Lands Differentially Affects Avian Habitat Connectivity. Land 2023, 12, 746. https://doi.org/10.3390/land12040746
Suraci JP, Mozelewski TG, Littlefield CE, Nogeire McRae T, Sorensen A, Dickson BG. Management of U.S. Agricultural Lands Differentially Affects Avian Habitat Connectivity. Land. 2023; 12(4):746. https://doi.org/10.3390/land12040746
Chicago/Turabian StyleSuraci, Justin P., Tina G. Mozelewski, Caitlin E. Littlefield, Theresa Nogeire McRae, Ann Sorensen, and Brett G. Dickson. 2023. "Management of U.S. Agricultural Lands Differentially Affects Avian Habitat Connectivity" Land 12, no. 4: 746. https://doi.org/10.3390/land12040746