Article

Research on the Slope Gradient Effect and Driving Factors of Construction Land in Urban Agglomerations in the Upper Yellow River: A Case Study of the Lanzhou–Xining Urban Agglomerations

1
School of Civil Engineering, Qinghai University, Xining 810016, China
2
Graduate School of Qinghai University, Qinghai University, Xining 810016, China
3
Research Department of Ecological Civilization, Qinghai Academy of Social Sciences, Xining 810000, China
*
Author to whom correspondence should be addressed.
Land 2023, 12(4), 745; https://doi.org/10.3390/land12040745
Submission received: 18 February 2023 / Revised: 16 March 2023 / Accepted: 23 March 2023 / Published: 26 March 2023

Abstract

:
Analyses of the scale and structural characteristics of construction land serve as the basis for optimizing the spatial pattern of territorial planning. Existing studies have focused mainly on the horizontal expansion of urban construction land. Therefore, based on the Google Earth Engine (GEE) platform, in this paper, we use high-precision land-use cover data, DEM data and socioeconomic data to construct the standard dominant comparative advantage index (NRCA) using the geological mapping analysis method and we systematically analyze the horizontal scale, slope spectrum characteristics, gradient effects and driving factors of construction land in the Lanzhou–Xining urban agglomeration (LXUA) from 1990 to 2020 at four scales: the urban agglomeration, provincial area, typical city and county (district) scales. The results of the study show that urban construction land, rural settlement land and other construction land in the LXUA show “linear”, inverted-“U” and “J” growth patterns, respectively. Three types of construction land show different spatial transfer characteristics. The scale and extent of climbing of urban construction land in the LXUA is gradually decreasing over time, and the number of climbing rural settlement lands in 2000–2010 was as high as 34 counties (districts), while the number of counties (districts) with strong climbing degrees of other construction land rose to 12 from 2010 to 2020. The relative hotspots of the slope-climbing phenomenon of the three types of construction land have gradually expanded spatially, with Lanzhou city and Xining city as the center, and the overall spatial characteristics are “more in the east and less in the west”. The population and GDP are the main factors influencing the slope-climbing phenomenon of urban construction land, while rural settlements are influenced mainly by natural conditions, and accessibility is the key factor affecting other construction land.

1. Introduction

Land resources are the foundation of survival, the basis of development, the source of wealth and the key to ecology, and these are an important material basis and spatial carrier for economic and social development and ecological civilization construction [1,2,3]. Construction land is an important type of land use among land resources and is the most direct evidence of human behavioral activities that transform the surface of the Earth [4]. Construction land can be divided into commercial service land, industrial and mining land, residential land, public administration and public service land, transportation land, and special land such as military facilities, according to the land-use classification scheme currently used in China (GB/T 21010-2017). The expansion of construction land plays an important role in supporting and guaranteeing the development of urbanization, industrialization and modernization in China [5]. Many cities around the world are expanding at twice the rate of their average population growth [6]. The global urban population is projected to exceed 5 billion by 2030 [7]. Nearly 50 percent of newly built land is expected to be concentrated in Asia [8]. However, with rapid urbanization, the current land-use pattern of more rapid land urbanization than population urbanization in China has given rise to a series of problems, such as the rough expansion of construction land, rapid consumption of resources and the environment, hollowing out in the countryside, non-agriculturalization of high-quality arable land and fragmentation of ecological space. Urban expansion has become an important topic in urban research and a core Issue of urban sustainable development [9]. Building livable and appropriate living spaces, intensive and efficient production spaces, and beautiful ecological spaces is the eternal goal of efficient and sustainable utilization of land resources and an important path to achieving sustainable development and building a beautiful China. Therefore, systematically exploring the dynamic evolution of construction land is an important issue faced in the territorial spatial planning, construction and governance of the country [10], and it is critical to promote new and improved urbanization strategies in China.
With the rapid promotion of urbanization and the flourishing development of remote-sensing information technology in China, scholars have conducted rich and important research on construction land using multisource remote-sensing products. The relevant studies have focused mainly on analyzing horizontal-scale-dimension delineations [11,12,13], morphological evolution [14,15], center-of-gravity shifts [12,16,17] and land-use patterns of urban construction land [5,14,18] or on assessing the vertical dimensional gradient effect of construction land using indices such as the topographic relief [19], topographic position index [20] and average climbing index [21]. In contrast, few comprehensive studies have explored construction land in both the horizontal and vertical dimensions. The existing studies did not classify or refine construction land, and the research objects focused on the evolution laws of urban construction land; thus, those studies were not conducive to obtaining a comprehensive or systematic understanding of the evolution law of construction land and did not differentiate among the management frameworks of various types of construction land from the perspective of fine-scale management. At the same time, studies have been conducted mainly at the national [10], regional [19,21,22], city [23] and district (county) [24] scales, especially in mountainous cities. While urban agglomerations are an important form and carrier of China’s future urbanization development [25], few studies have been conducted at the urban agglomeration scale. Therefore, it is necessary to study the evolution characteristics and slope gradient effect of construction land in urban agglomerations at multiple scales based on highly detailed land classification data.
In view of this, this study takes the Lanzhou–Xining Urban Agglomeration (LXUA), where the ecological environment of in the Upper Yellow River is important and fragile, with fast development speed and severe contradiction between people and land. Based on the Google Earth Engine (GEE) platform, in this paper, we use remote sensing images taken from 1990 to 2020 to construct a standardized Revealed Comparative Advantage Index (NRCA) and comprehensively analyze the horizontal expansion and vertical gradient of urban construction land, rural settlement land and other construction land at the urban agglomeration, provincial area, typical city and county (district) scales in the LXUA to provide an empirical reference for the scientific management of construction land, optimize the territorial spatial pattern in the LXUA, and provide a theoretical basis for the implementation of ecological protection and high-quality development strategies in the Yellow River Basin.

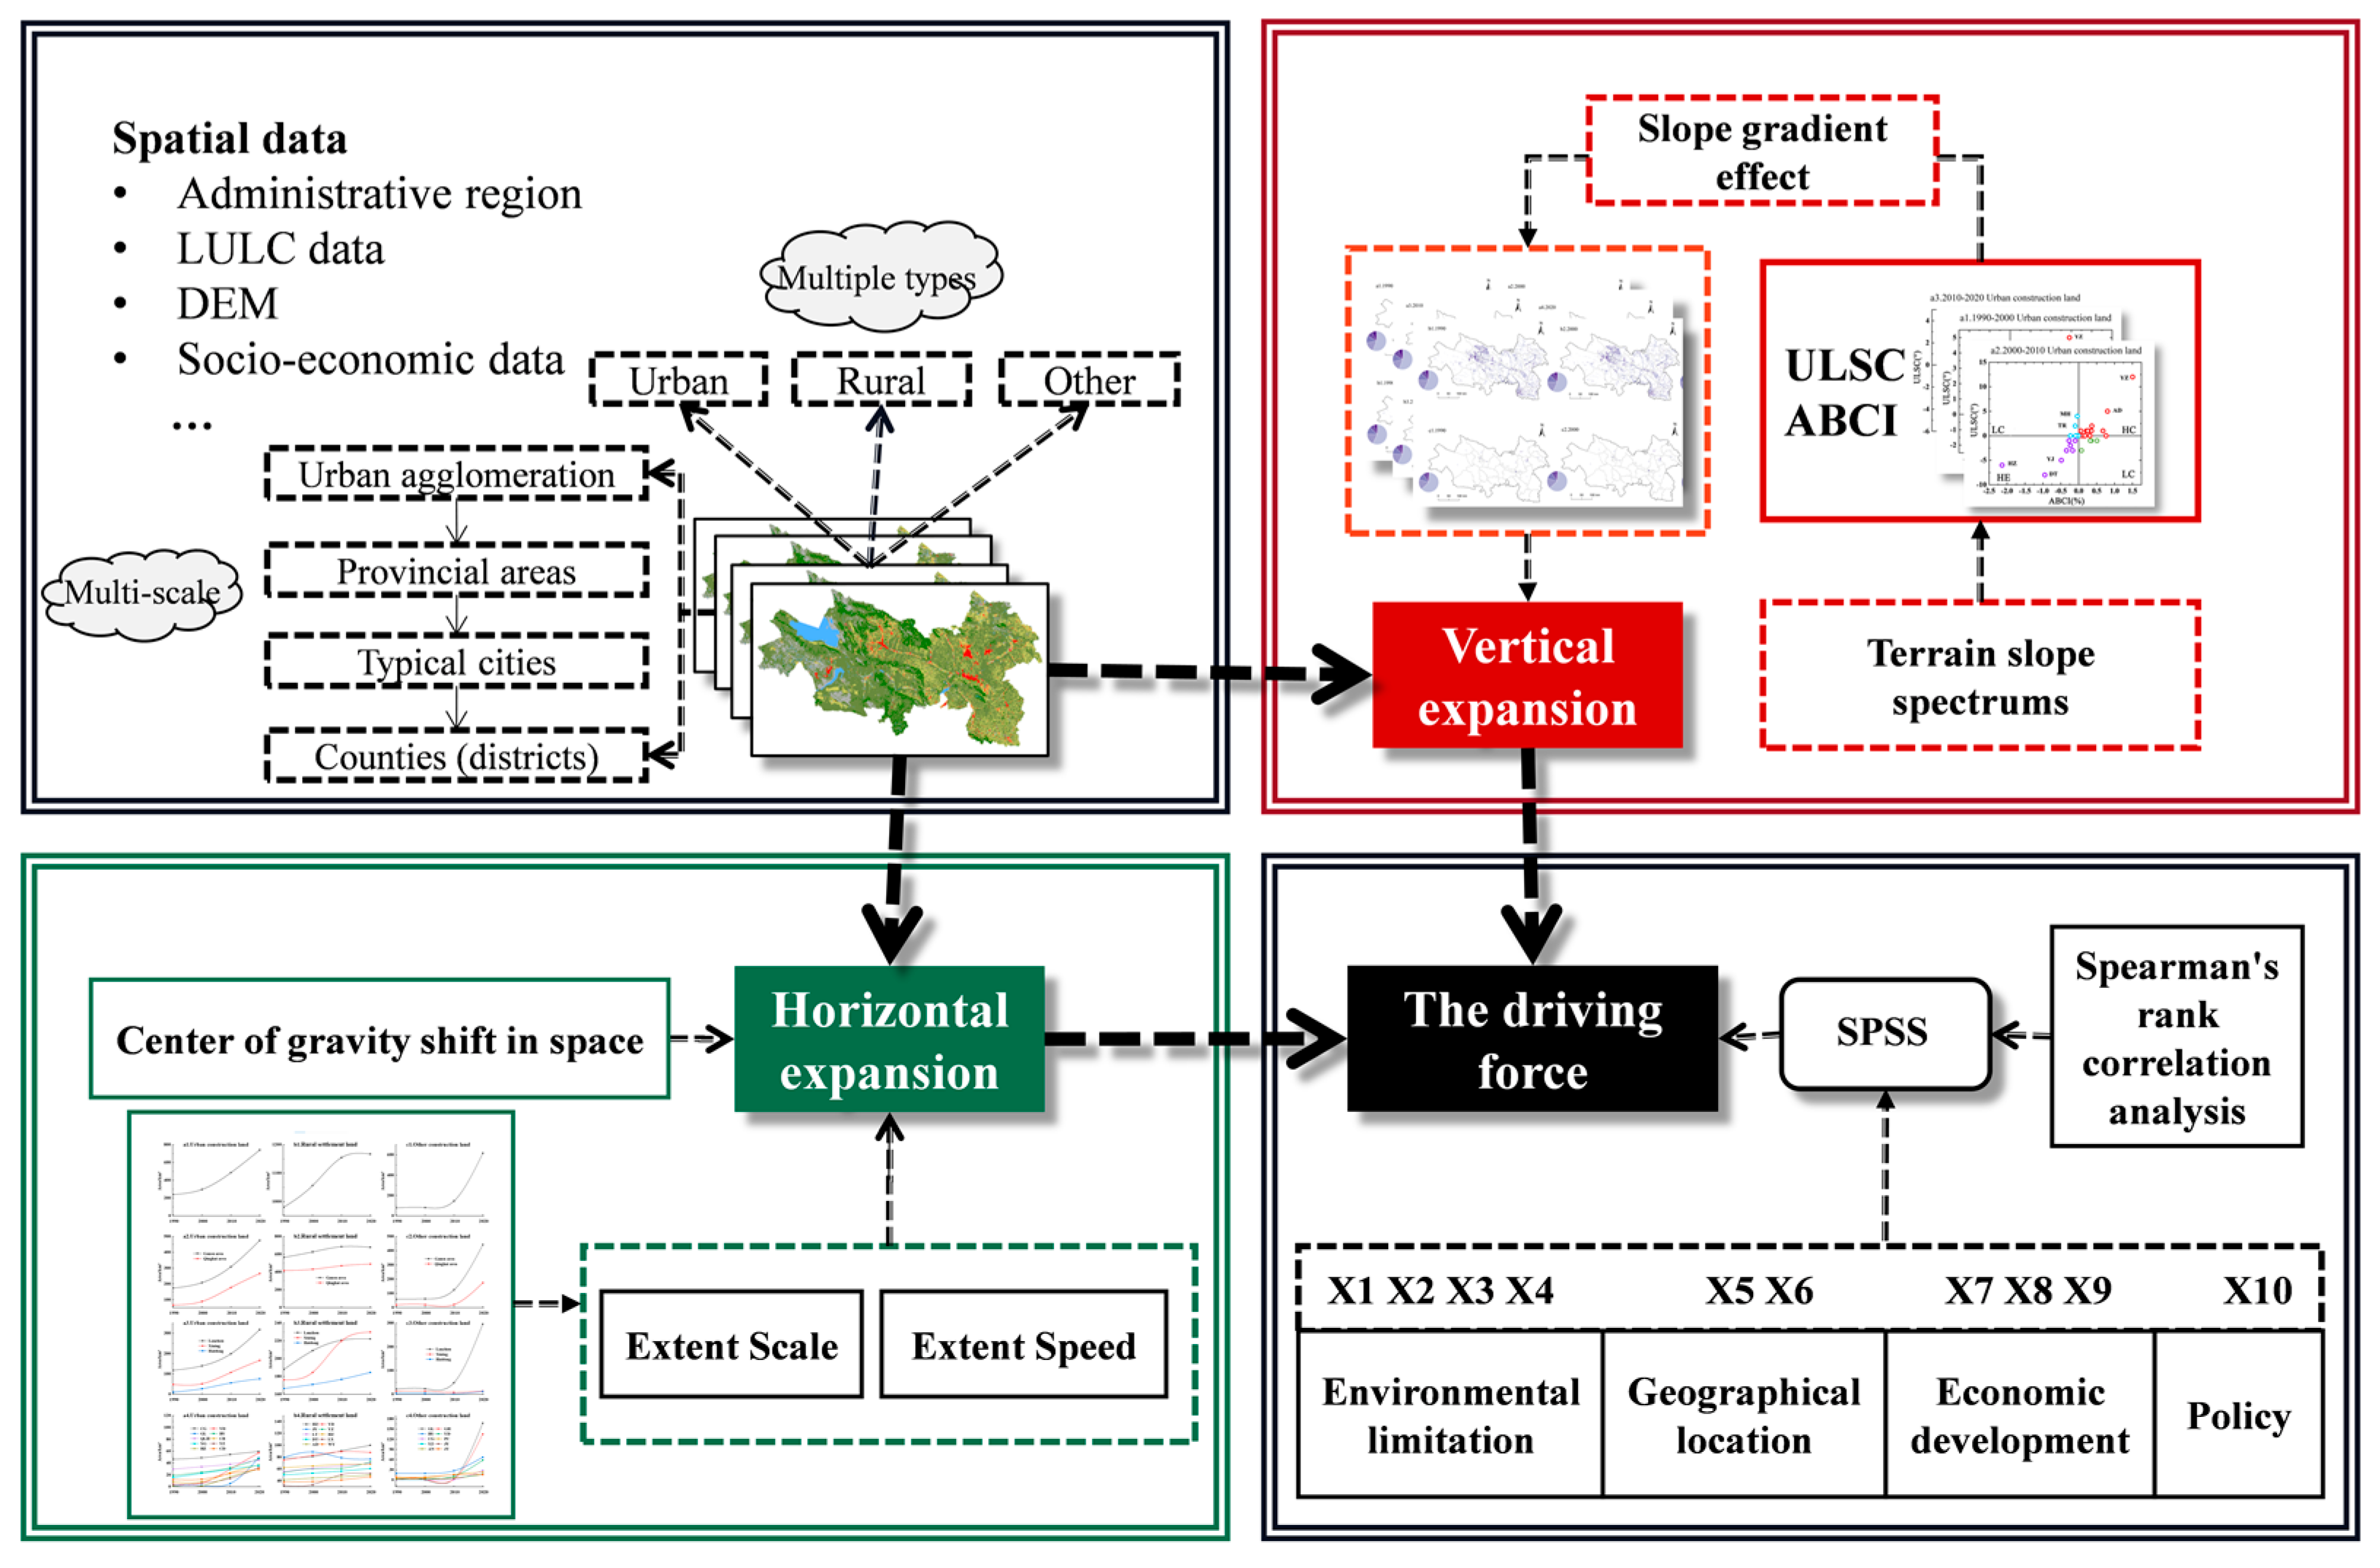
2. Data Sources and Methodology
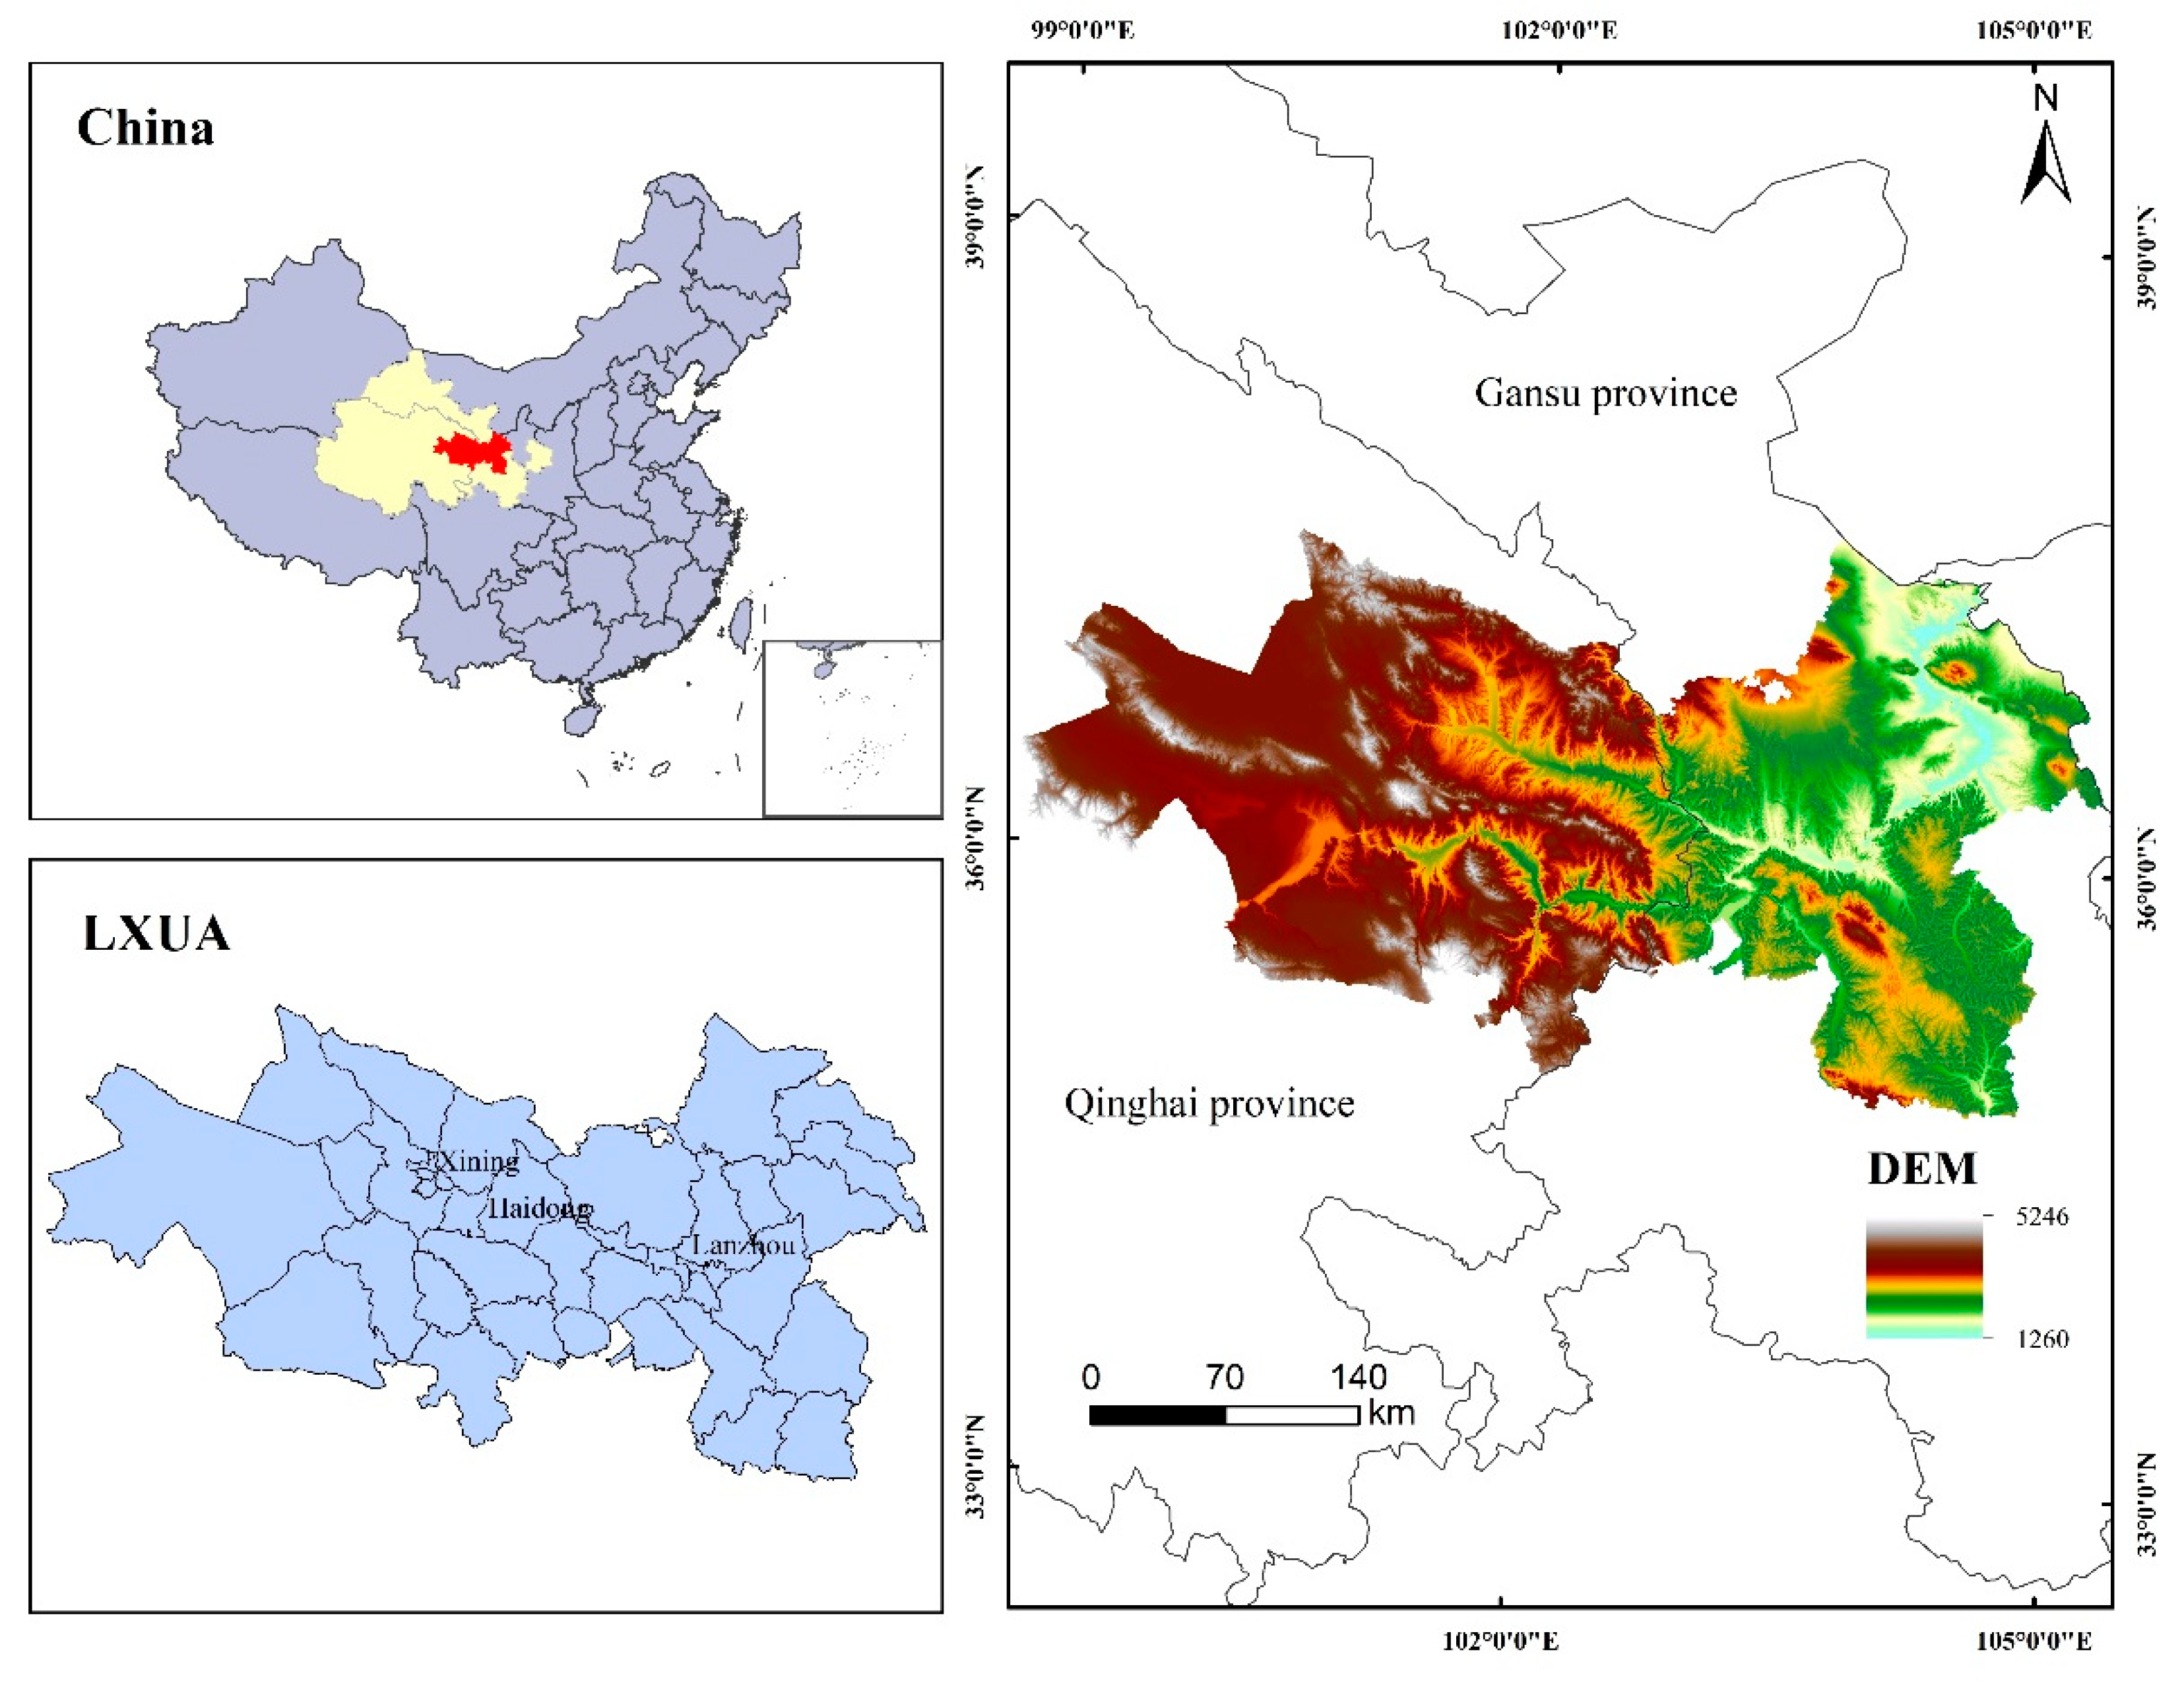
2.1. Study Area

The Lanzhou–Xining Urban Agglomeration is located at 98°05′ E~105°38′ E, 34°07′ N~39°05′ N, with the transition zone between the Loess Plateau and Qinling Mountains in the eastern area, separated from the Tarim Basin in Xinjiang to the north, connected to the Tibetan Plateau in the south, and connected to the Sichuan Basin through mountains and plateau basins in the southeast, with a total area of 97,500 km2 (Figure 1). The LXUA takes the Hehuang Valley as the basic bearing area, the Yellow River ecological protection axis runs through the whole radiating area, the Qilian Mountains serve as an ecological security barrier in the north, the Gannan Plateau serves as an ecological security barrier in the south, and the Sanjiangyuan Region serves as an ecological security barrier in the west. Overall, the terrain is high in the west and low in the east, and the landform types in the region are complex and diverse [26]. The LXUA is centered on Lanzhou city and Xining city, including 4 typical cities and 20 counties (districts) in Gansu Province and 5 typical cities and 19 counties (districts) in Qinghai Province (Table 1). It is a relatively dense area of towns in the upper reaches of the Yellow River region. In the past decade, the urbanization process of the LXUA has accelerated, with an annual population growth rate of 2.05% and an annual GDP growth rate of 8.15%. The per capita disposable income of urban and rural residents is relatively high, and there is a large gap between urban and rural areas [27]. This urban agglomeration is located in the international economic cooperation corridor of the New Asia–Europe Continental Bridge and is an important component of the China–Central Asia–West Asia economic corridor [28]. As an important regional city agglomeration in western China, the Lanzhou–West City Agglomeration is led by the national strategies of “Western Development”, “the Belt and Road” and the ecological protection and high-quality development of the Yellow River Basin. The population scale continues to increase, and the level of urbanization and infrastructure continue to improve. Due to the valley-type landform characteristics of “two mountains sandwiched by a river”, the phenomena of “building land on mountains” and “cutting mountains for development” have become increasingly obvious in this region.

2.2. Data Source and Processing

Considering the completeness of administrative divisions and the representativeness of the study area, Lanzhou City, Xining City and Haidong City were chosen as typical cities at the city scale to carry out this study. Therefore, the analyses in this paper are based on four scales—urban agglomeration, provincial area, typical city and county (districts) scale—and the time span is 1990–2020, with 10 years as the considered time period. The administrative boundary vector data are obtained from the 1:1 million basic geographic information database provided by the National Geographic Information Resources Catalog Service System (https://www.webmap.cn/ (accessed on 5 November 2022)). We chose the land-use data obtained from the Resource and Environment Science and Data Center (https://www.resdc.cn/ accessed on 5 November 2022) with a resolution of 30 m × 30 m, and the primary land categories included arable land, forestland, grassland, urban and rural industrial, mining and residential land, water area and unused land. The construction land used in this study consist of urban construction land, rural settlement land and other construction land in the secondary classification scheme of urban and rural industrial, mining and residential land. The accuracy of the first-class land-use data and the second-class classification data of this data is more than 90%, which meets the requirement of the research precision [2]. The digital elevation data were obtained from the SRTM (Shuttle Radar Topography Mission) DEM dataset of the GEE platform with a resolution of 30 m (Table 2). In addition, based on the requirements of the Code for Vertical Planning of Urban and Rural Construction Land (CJJ83-2016) and the characteristics of the topographic slope spectrum of the LXUA, and considering the suitability of construction land, we conducted our analyses only for construction land with slopes at or below 25°. Below is a general framework for the study (Figure 2).

2.3. Methodology

2.3.1. Construction Land Level Expansion Measure

Based on the reality that research on the horizontal expansion of construction land is relatively mature, in this study, we mainly examine the characteristics of the horizontal expansion of construction land in the LXUA from 2 aspects: the scale and speed of construction land expansion; the utilized calculation formulas are detailed in the literature [29,30].

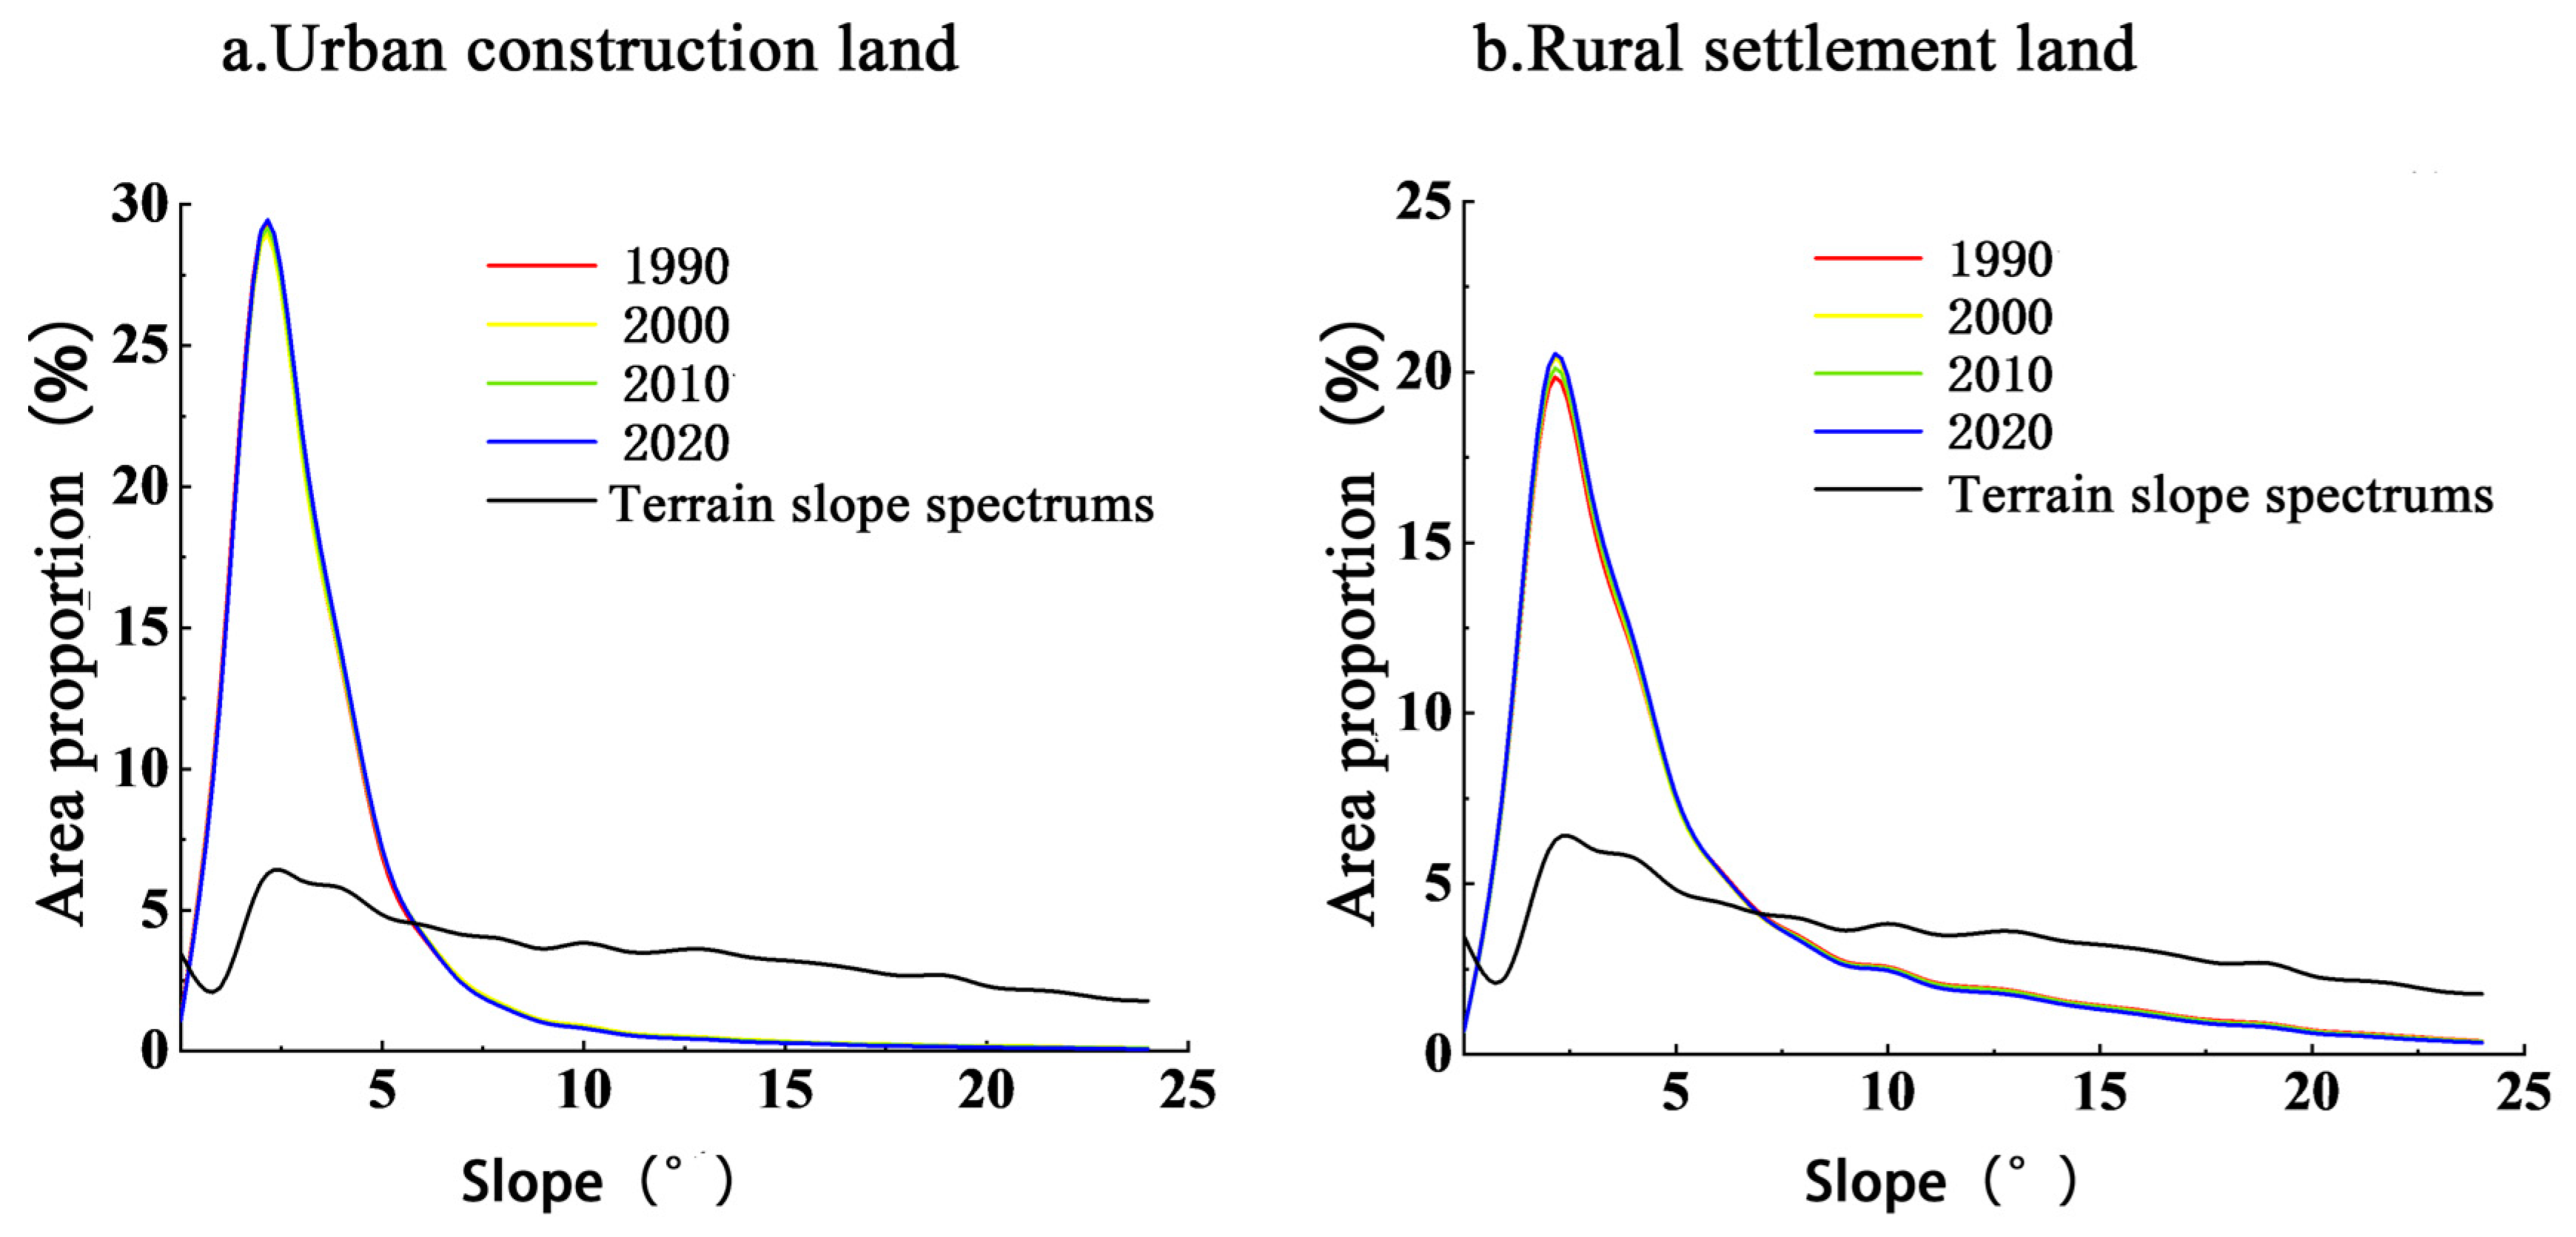
2.3.2. Terrain and Construction Land Slope Spectra

Drawing on the slope spectrum geoanalysis method proposed by Tang et al. [31], based on the GEE platform, the slope data were rasterized with the 4-period land-use data, the number of rasters for each slope interval and the number of regional construction land rasters were counted at 1° intervals, and the topographic slope spectrum curves and construction land slope spectrum curves were drawn. The topographic slope spectrum (land area frequency slope spectrum) is a statistical map of the percentage of the land area corresponding to the slope factor in a specific statistical area to the total statistical area; such maps can visually reflect the overall slope distribution of the background land [23]. The construction land slope spectrum (construction land area frequency slope spectrum) is a statistical map of the percentage of the construction land area corresponding to the slope factor in a specific statistical area to the total construction land area in the statistical area; these maps can visually reflect the overall slope distribution of the background land and visually reflect the land-use preference of construction land at different slopes [10]. The calculation formulas are expressed as follows:
P t , i = A t , i / A t × 100 %
P b , i = A b , i / A b × 100 %
where Pt,i and Pb,i are the topographic slope spectrum and construction land slope spectrum of i raster cells, respectively; At,i and Ab,i are the land area and construction land area of i raster cells, respectively; and At and Ab are the total land area and construction land area of the study area, respectively.

2.3.3. Comparative Advantage Index of the Construction Land Distribution

To further characterize the suitability of the construction land distribution, we tried to introduce the NRCA proposed by Yu et al. [32] into our study of the construction land slope-climbing law to reflect the dynamic and continuous comparative advantage of the research object in different intervals; this index is not limited temporally or spatially and has been widely used in judgments of the dominant land-use functions and optimizations of the spatial national land-use pattern. In the related research, the calculation formula is expressed as follows:
N R C A i , j = P i , j / P b P i P j / P b P b
where NRCAi,j indicates the comparative advantage of slope level j in i raster cells, Pi,j is the construction land slope spectrum of slope level j in i raster cells, Pi is the sum of the construction land slope spectrum in i raster cells, Pj is the sum of the construction land slope spectrum of slope level j, Pb is the sum of the construction land slope spectrum in the study area, NRCAi,j > 0 means that slope level j has a comparative advantage in i raster cells, and NRCA > 0 means that the construction land has a better suitability at the jth slope level and vice versa. Moreover, when Pb,i = Pt,i, the slope spectrum of construction land and the ground slope spectrum intersect, and the slope at this time is defined as the advantageous slope threshold (T). When Pb,i > Pt,i and NRCAi,j > 0, the slope spectrum of construction land with slopes less than T is larger than the terrain slope spectrum, and at this time, construction land is distributed mainly in the raster areas with slopes less than T, also called the advantageous area (AA). For the convenience of facilitating the statistical analysis, the other cases are regarded together as the inferior area (inferior area, IA).

2.3.4. Average Construction Land Climbing Index and Upper-Limit Slope

To quantitatively measure the degree of construction land climbing, the built-up land climbing index (BCI), which is the proportion of the construction land area in the disadvantaged area to the total construction land area in a given period of time, was used. To facilitate a comparison of the changes in the extent of built-up land climbing in different periods, the average built-up land climbing index (ABCI) was calculated using the following formula:
B C I = ( I A t / B A t I A t / B A t ) × 100 %
A B C I = B C I / ( t t )
where BCI is the built-up land climbing index from year t′ to year t; IAt′ and IAt are the areas of construction land in the disadvantaged area in year t′ and year t, respectively; BAt and BAt are the total areas of construction land in year t′ and year t, respectively; and ABCI is the average climbing index of construction land from year t′ to year t. ABCI > 0 indicates that the proportion of construction land in the disadvantaged area increases with time, i.e., the construction land exhibits a climbing expansion; the larger the ABCI value, the stronger the climbing capacity of the construction land.
In addition, to analyze the difference in slope maxima over time for different construction land distribution scales, the upper limit slope (downward accumulation key value) was used. To compare the changes in the upper-limit slope angle among different periods, the upper-limit slope angle change (ULSC) was calculated. ULSC > 0 indicates that the construction land is climbing to the disadvantaged area in that period, and the larger the value of this term, the greater the climbing capacity of the construction land. ULSC ≤ 0 indicates that the construction land is expanding horizontally in the advantaged area in that period.

2.3.5. Construction Land Climbing Heat

The spatial distributions of the relative hot and cold patterns of the construction land climbing phenomenon were explored using the construction land climb heat index proposed by Peng et al. [23]. The specific formula is expressed as follows:
R i = S i i = 1 n S i × 100
where Ri is the slope share index (%) of the construction land in the ith raster, and the larger the value of this index is, the higher the climbing heat is. Si is the total slope of the construction land in the ith raster, and n is the total number of statistical cells. For the convenience of description, the cumulative series is divided into 5 groups in 20% equal steps after the slope shares are stacked sequentially from smallest to largest.

2.3.6. Spearman’s Rank Correlation Analysis

The main driving factors of urban expansion are the location, economy, transportation, natural resources, population, culture and national policies [33,34]. Spearman’s rank correlation coefficient was used to reveal the driving factors behind urban expansion in the study area. Referring to previous research on the driving forces of urban expansion and by combining the available data, we chose natural resource endowments (slope X1, elevation X2, precipitation X3, and relative humidity X4), location conditions (accessibility X5 and distance from county government X6), socioeconomic conditions (population density X7, urbanization level X8 and average land GDP X9), and policy factors (distance from ecological protection zone X10) and determined the influence of these 10 indicator factors on the climbing heat of construction land in the LXUA. Spearman’s rank correlation can measure the associations between independent variables even when they do not follow a normal distribution [35].

3. Results and Analysis

3.1. Analysis of the Multiscale Horizontal Expansion Characteristics of Construction Land

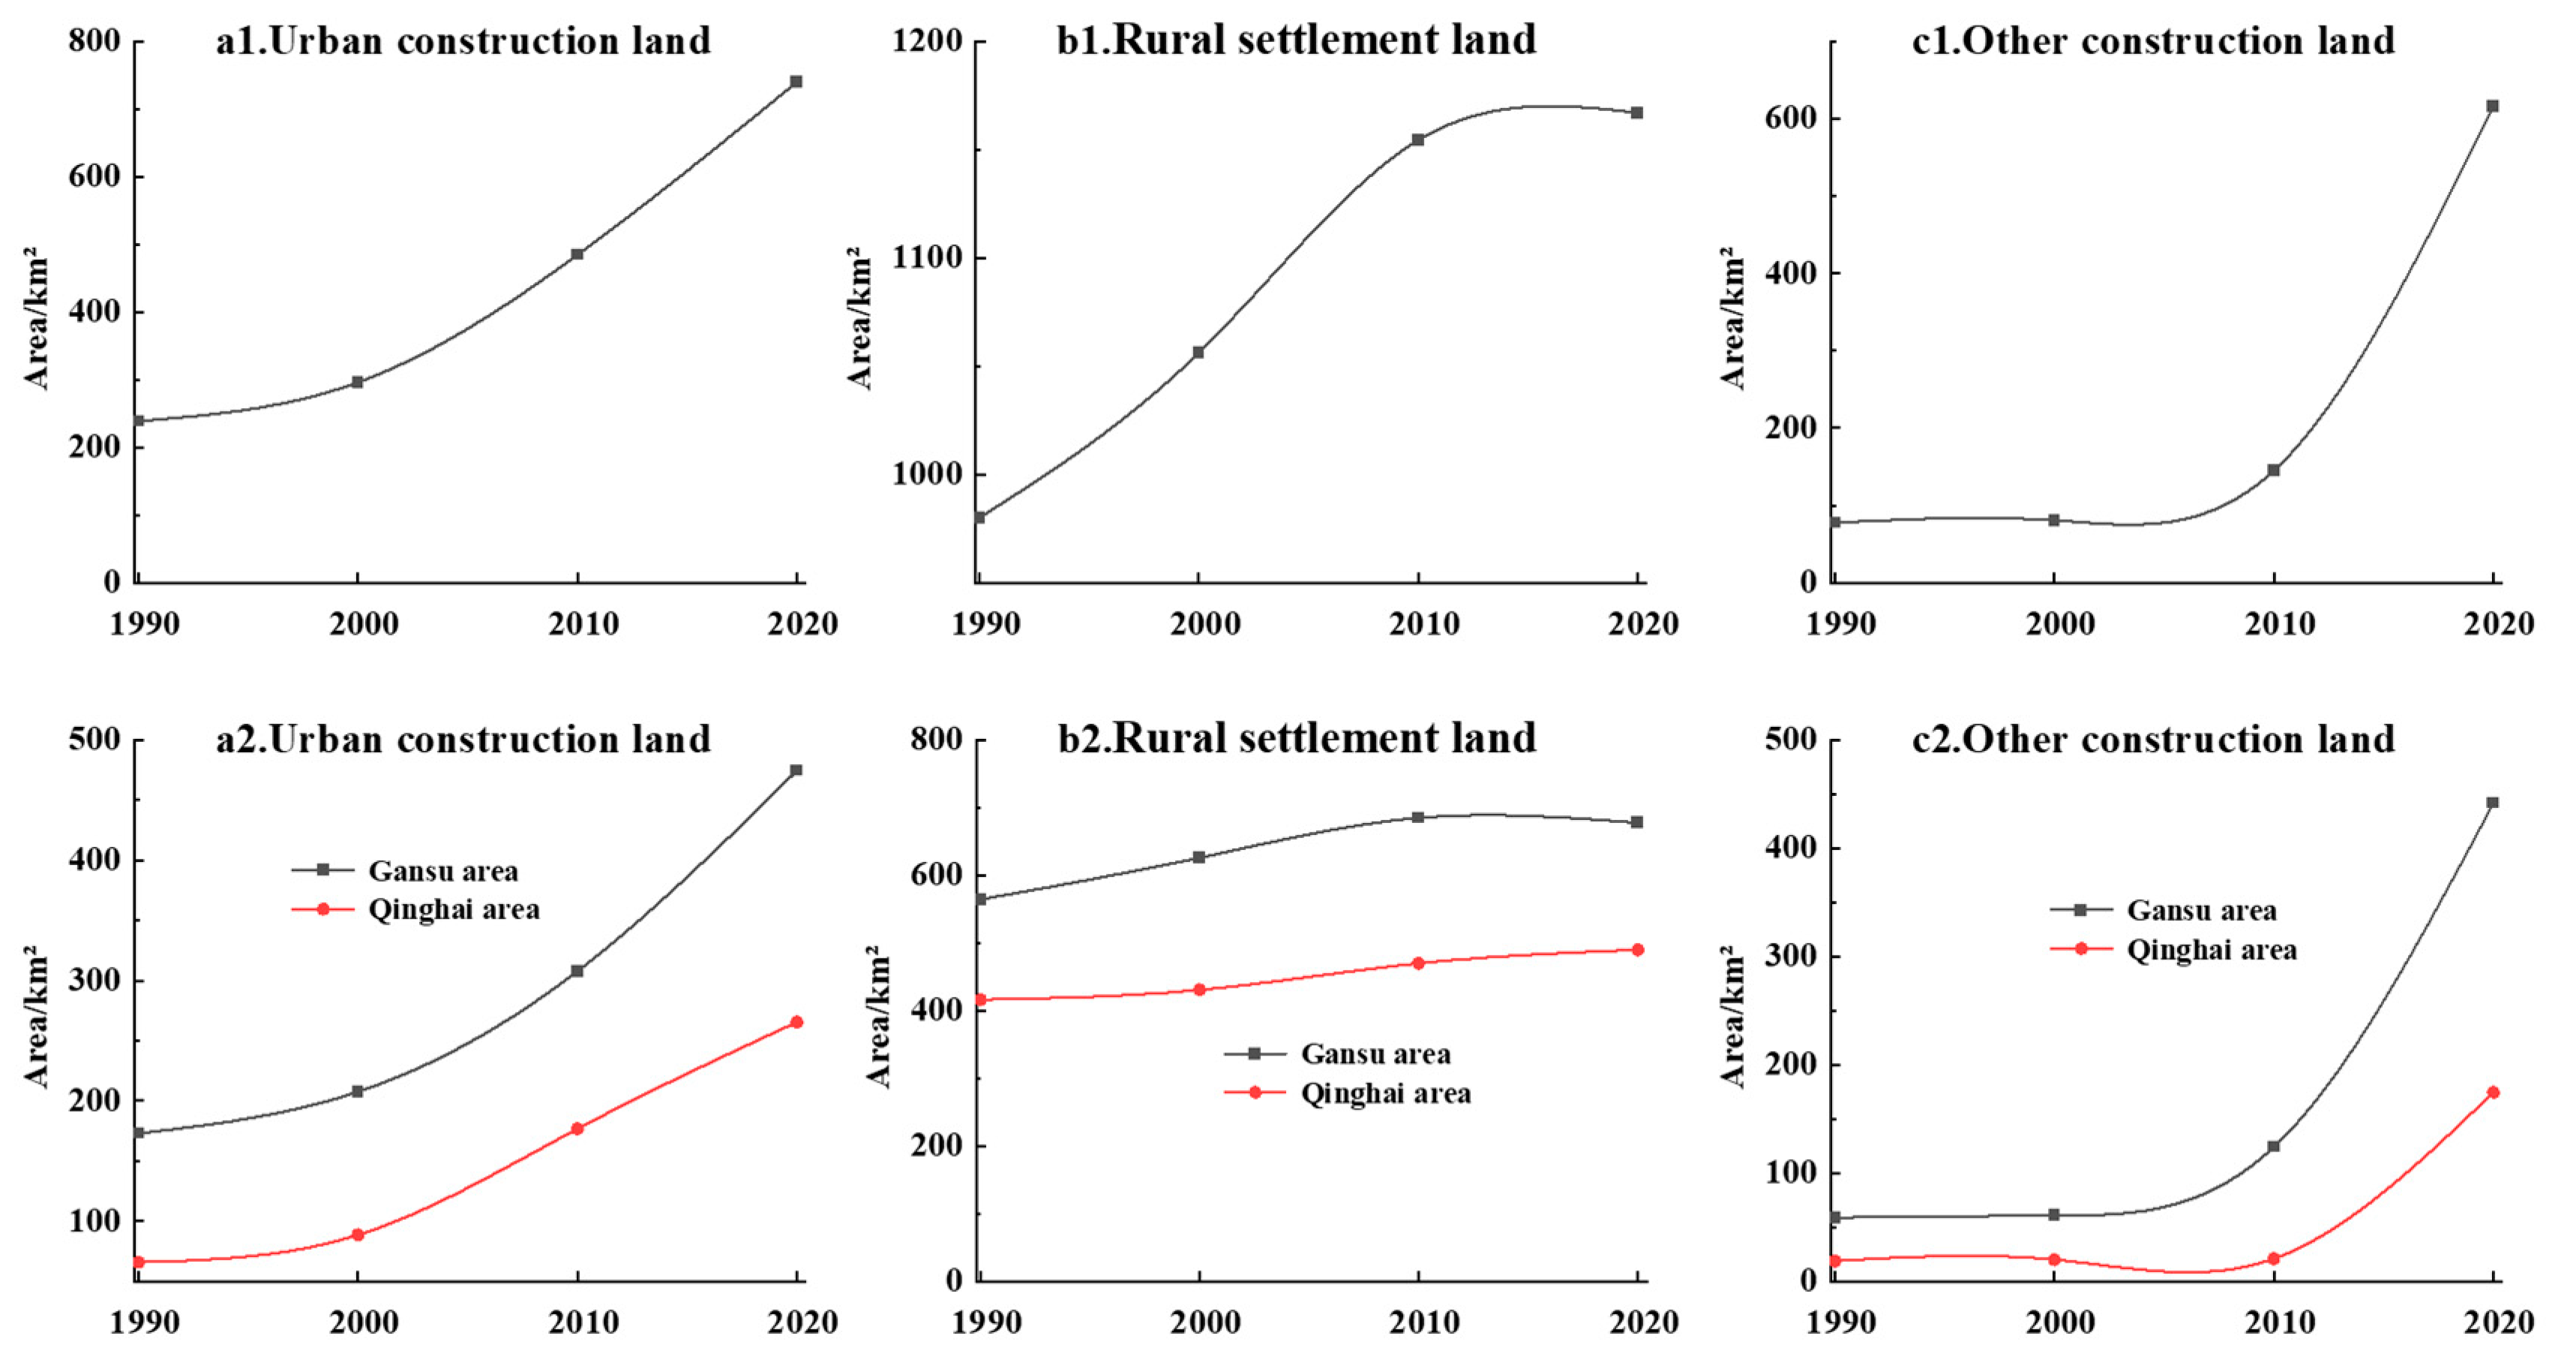
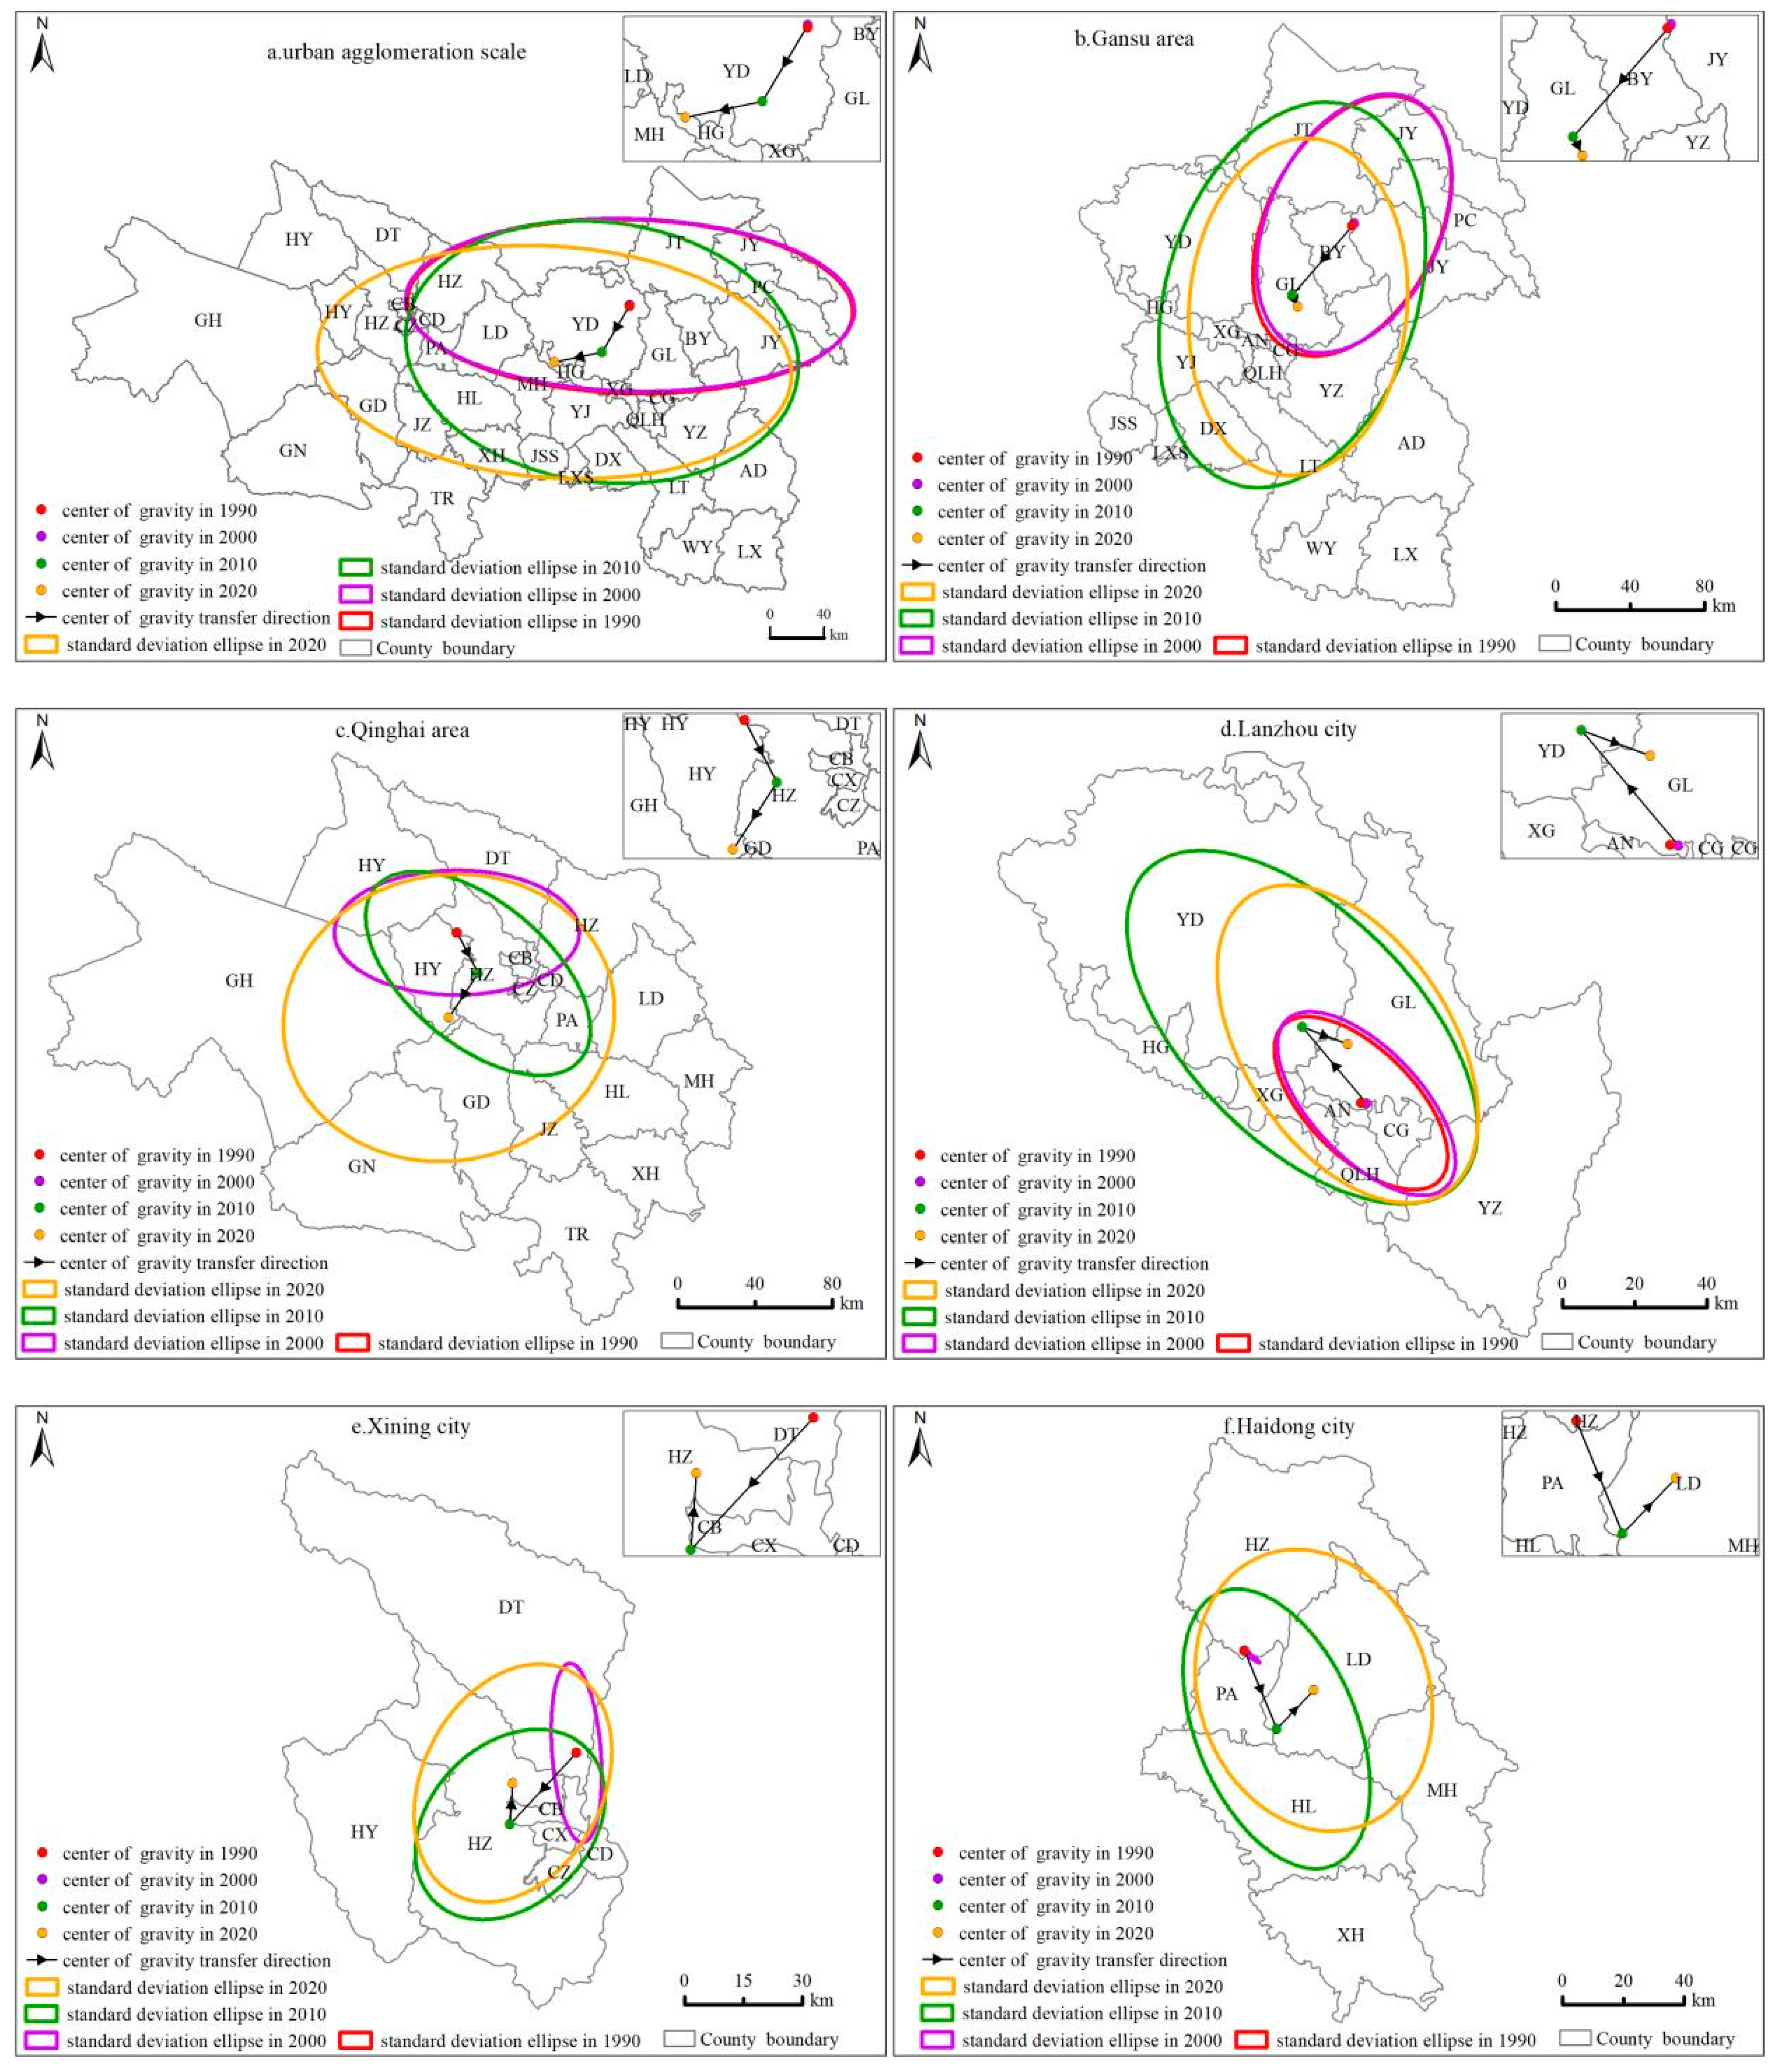
3.1.1. Horizontal Expansion Characteristics of Urban-Agglomeration-Scale Construction Land

In terms of urban construction land, the area of urban construction land in the LXUA has been increasing continuously in a “linear” growth pattern (Figure 3(a1)). From 238.86 km2 in 1990 to 739.84 km2 in 2020, this area increased by 500.98 km2, with an average growth rate of 16.70 km2/a. Especially after 2000, with the implementation of the national strategy of “Western Development”, the urban construction land in the LXUA has increased rapidly. Regarding rural settlement land, these lands in the LXUA have also increased continuously, showing an inverted-U-shaped growth pattern of “fast first and then slow” (Figure 3(b1)). In terms of other construction land, the area of other construction land in the LXUA has continued to increase, showing a “slow and then fast” “J” growth pattern (Figure 3(c1)). The area of other construction land in 2020 was nearly 8 times that in 1990 and nearly 4 times that in 2010. With the implementation of the national “the Belt and Road” new urbanization strategy, the rapid increase in land for transportation facilities and other construction land in the LXUA has increased rapidly.

3.1.2. Provincial-Tract-Scale Construction Land Level Expansion Characteristics

In terms of urban construction land, both Gansu and Qinghai continued to experience urban construction land increases with “linear” growth patterns, and the area and growth rate of urban construction land in Gansu were larger than those in Qinghai (Figure 3(a2)). In terms of land for rural settlements, the Gansu area showed an inverted-“U” pattern of “first increasing and then decreasing”, while the Qinghai area showed an “I” pattern of slow growth. The area of rural settlements in Gansu was always larger than that in Qinghai (Figure 3(b2)). The land area of rural settlements in Gansu increased continuously from 564.03 km2 in 1990 to 684.53 km2 in 2010; after 2010, with the implementation of the national new urbanization strategy, the land area of rural settlements in Gansu decreased from 684.53 km2 in 2010 to 677.41 km2 in 2020, with a growth rate of −0.71 km2/a. In contrast, the area of rural settlements in Qinghai increased slowly, growing from 416.01 km2 in 1990 to 489.54 km2 in 2020. In terms of other construction land, the other construction land areas in both Gansu and Qinghai were increasing in a “J” pattern throughout the study period. The area of other construction land in Gansu was always larger than that in Qinghai (Figure 3(c2)). The area of other construction land in Gansu in 2020 was nearly 8 times that in 1990 and nearly 4 times that in 2010. The area of other construction land in Qinghai in 2020 was nearly 9 times that in 1990 and nearly 8 times that in 2010.

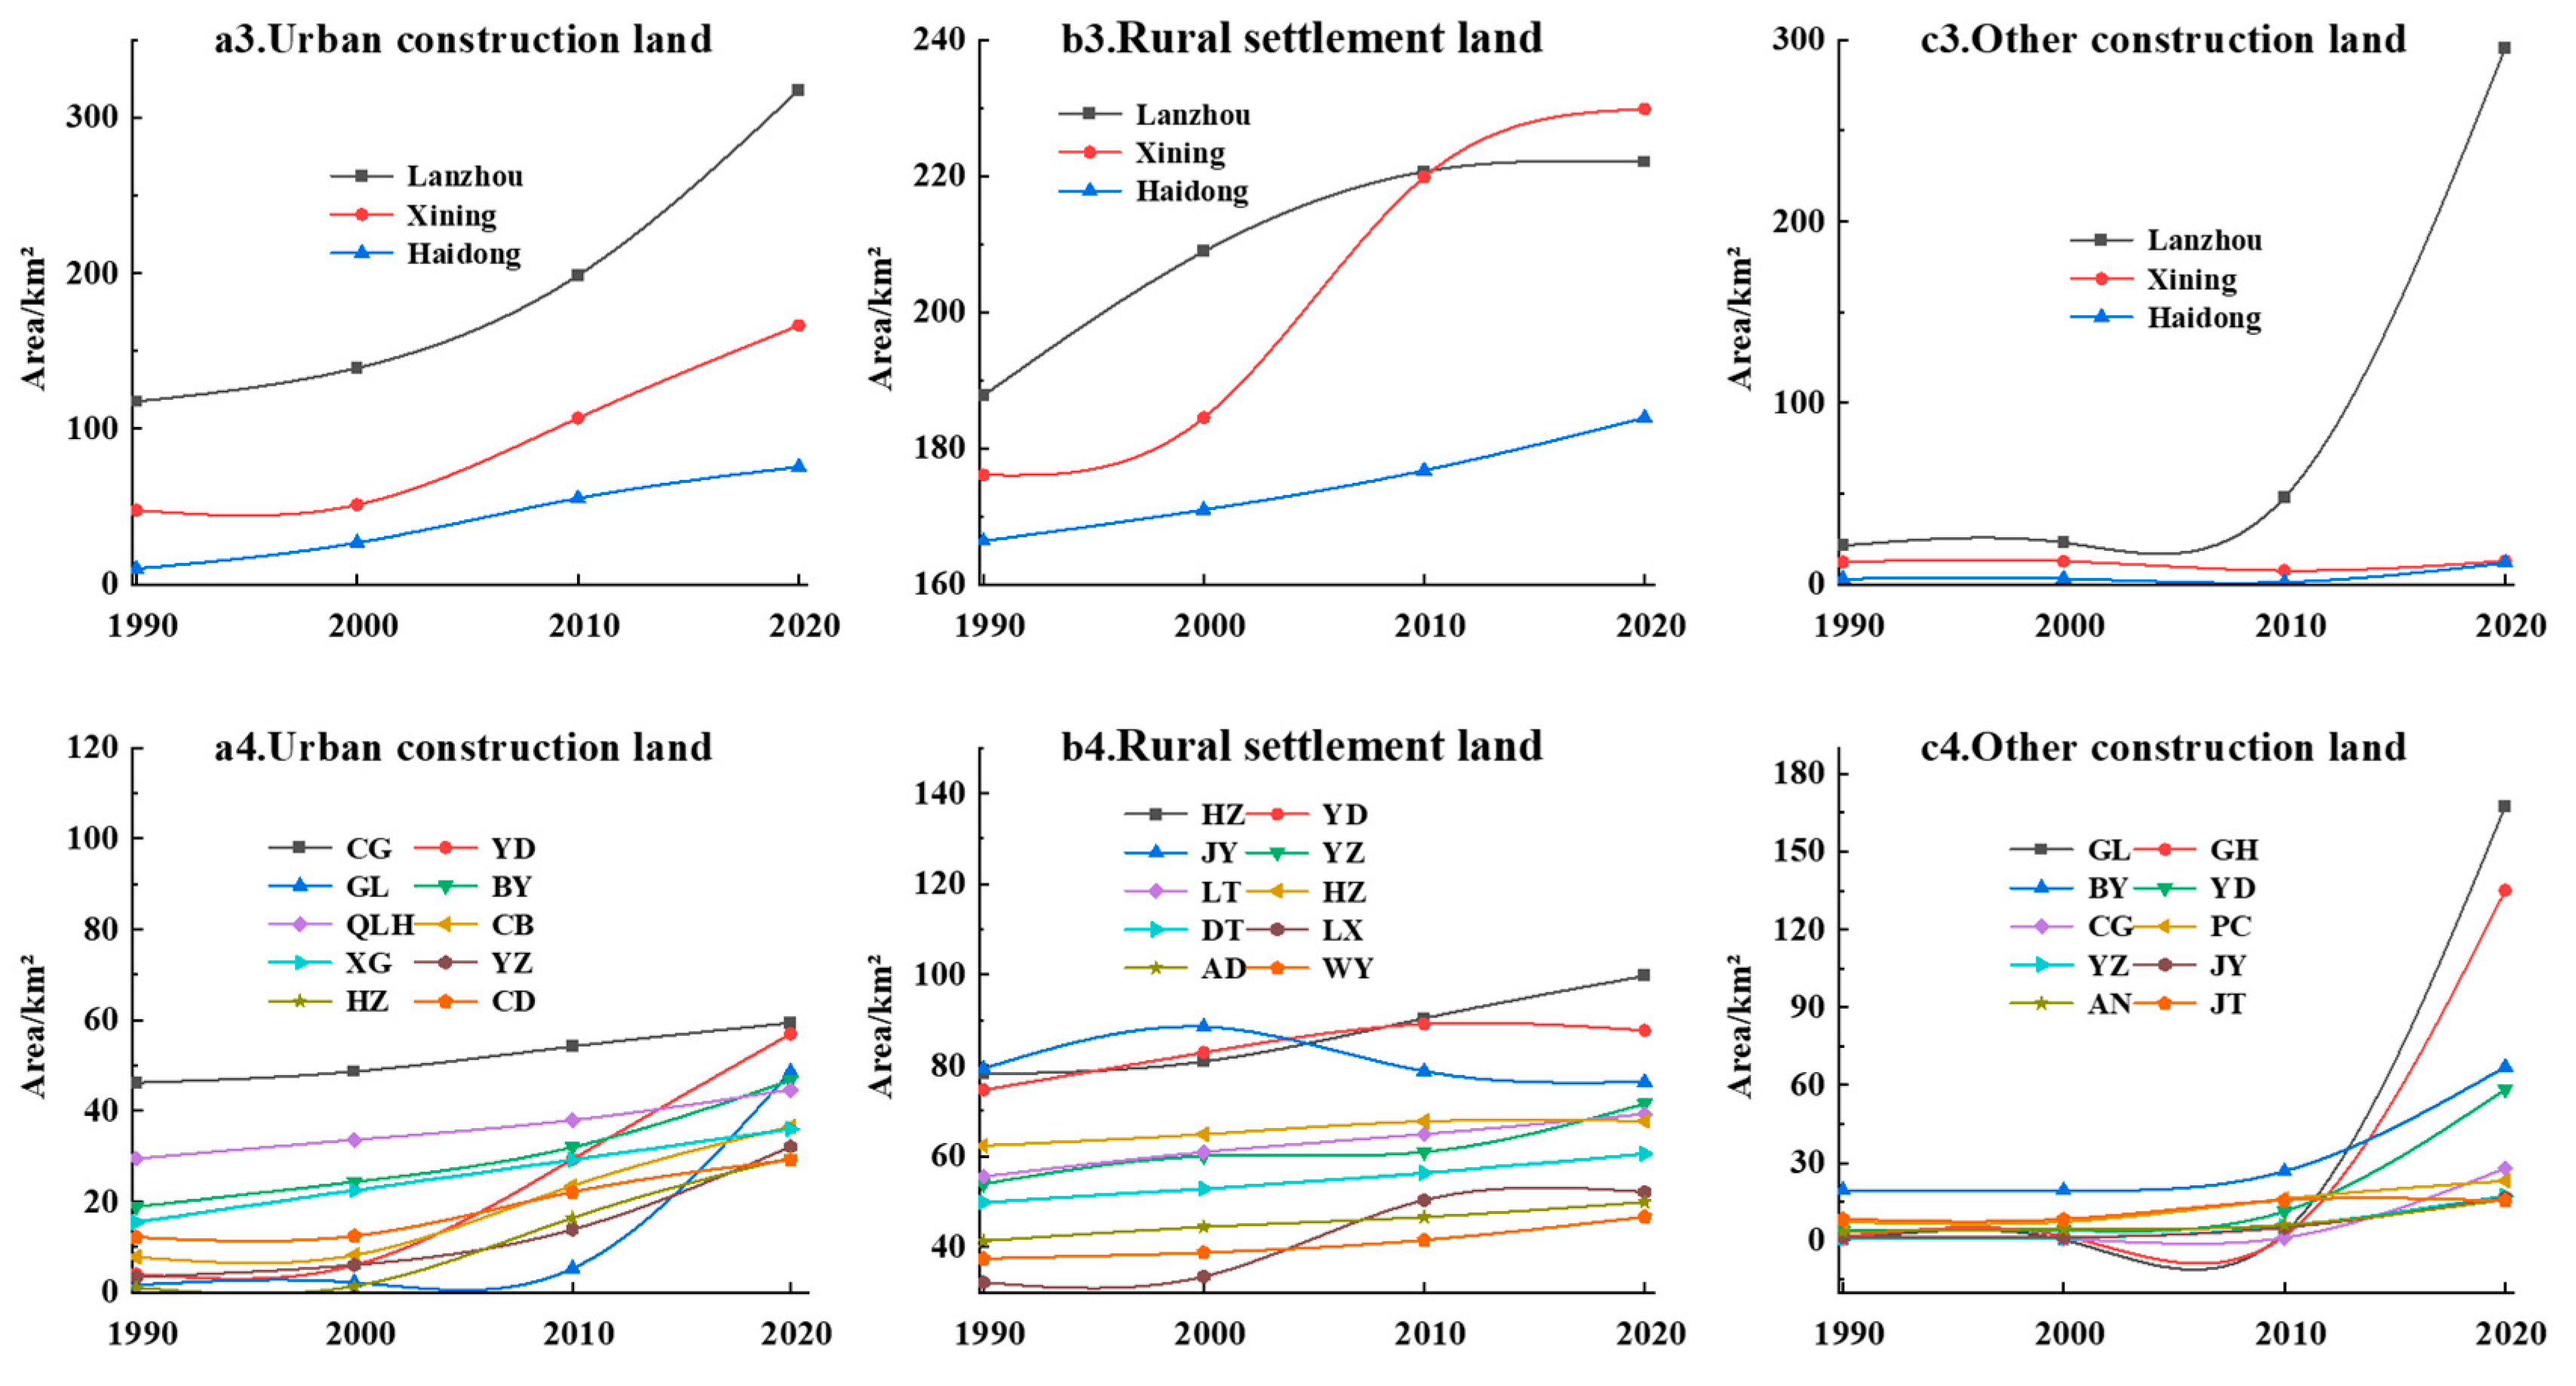
3.1.3. Typical City Construction Land Horizontal Expansion Characteristics

In terms of urban construction land, the urban construction land areas in Lanzhou, Xining and Haidong all continuously increased in a “linear” growth pattern, and the area and growth rate of urban construction land in Lanzhou were always larger than those in Xining and Haidong (Figure 3(a3)). In terms of rural settlement land, the areas of rural settlement land in Lanzhou City, Xining City and Haidong City all showed increasing trends (Figure 3(b3)). The land area of rural settlements in Lanzhou City increased continuously from 187.76 km2 in 1990 to 222.08 km2 in 2020, with an average rate of 1.14 km2/a, with the increase rate decelerating to 0.14 km2/a after 2010. The land area of rural settlements in Xining City increased continuously from 176.07 km2 in 1990 to 229.84 km2 in 2020, with an average rate of 1.79 km2/a, and the area of rural settlement land in Xining City exceeded that of Lanzhou City in 2020. The area of rural settlement land in Haidong City increased continuously from 166.38 km2 in 1990 to 184.49 km2 in 2020, with an average rate of 0.60 km2/a. In terms of other construction land, other construction land in Lanzhou City showed a “J” growth pattern (Figure 3(c3)); especially after 2010, the area of other construction land in Lanzhou City increased rapidly, but the areas of other construction land in Xining City and Haidong City “decreased first and then increased”. The “U”-shaped growth pattern was mainly the result of the conversion of other construction land in Xining and Haidong cities to urban construction land under the intensive implementation of the “Western Development” policy.

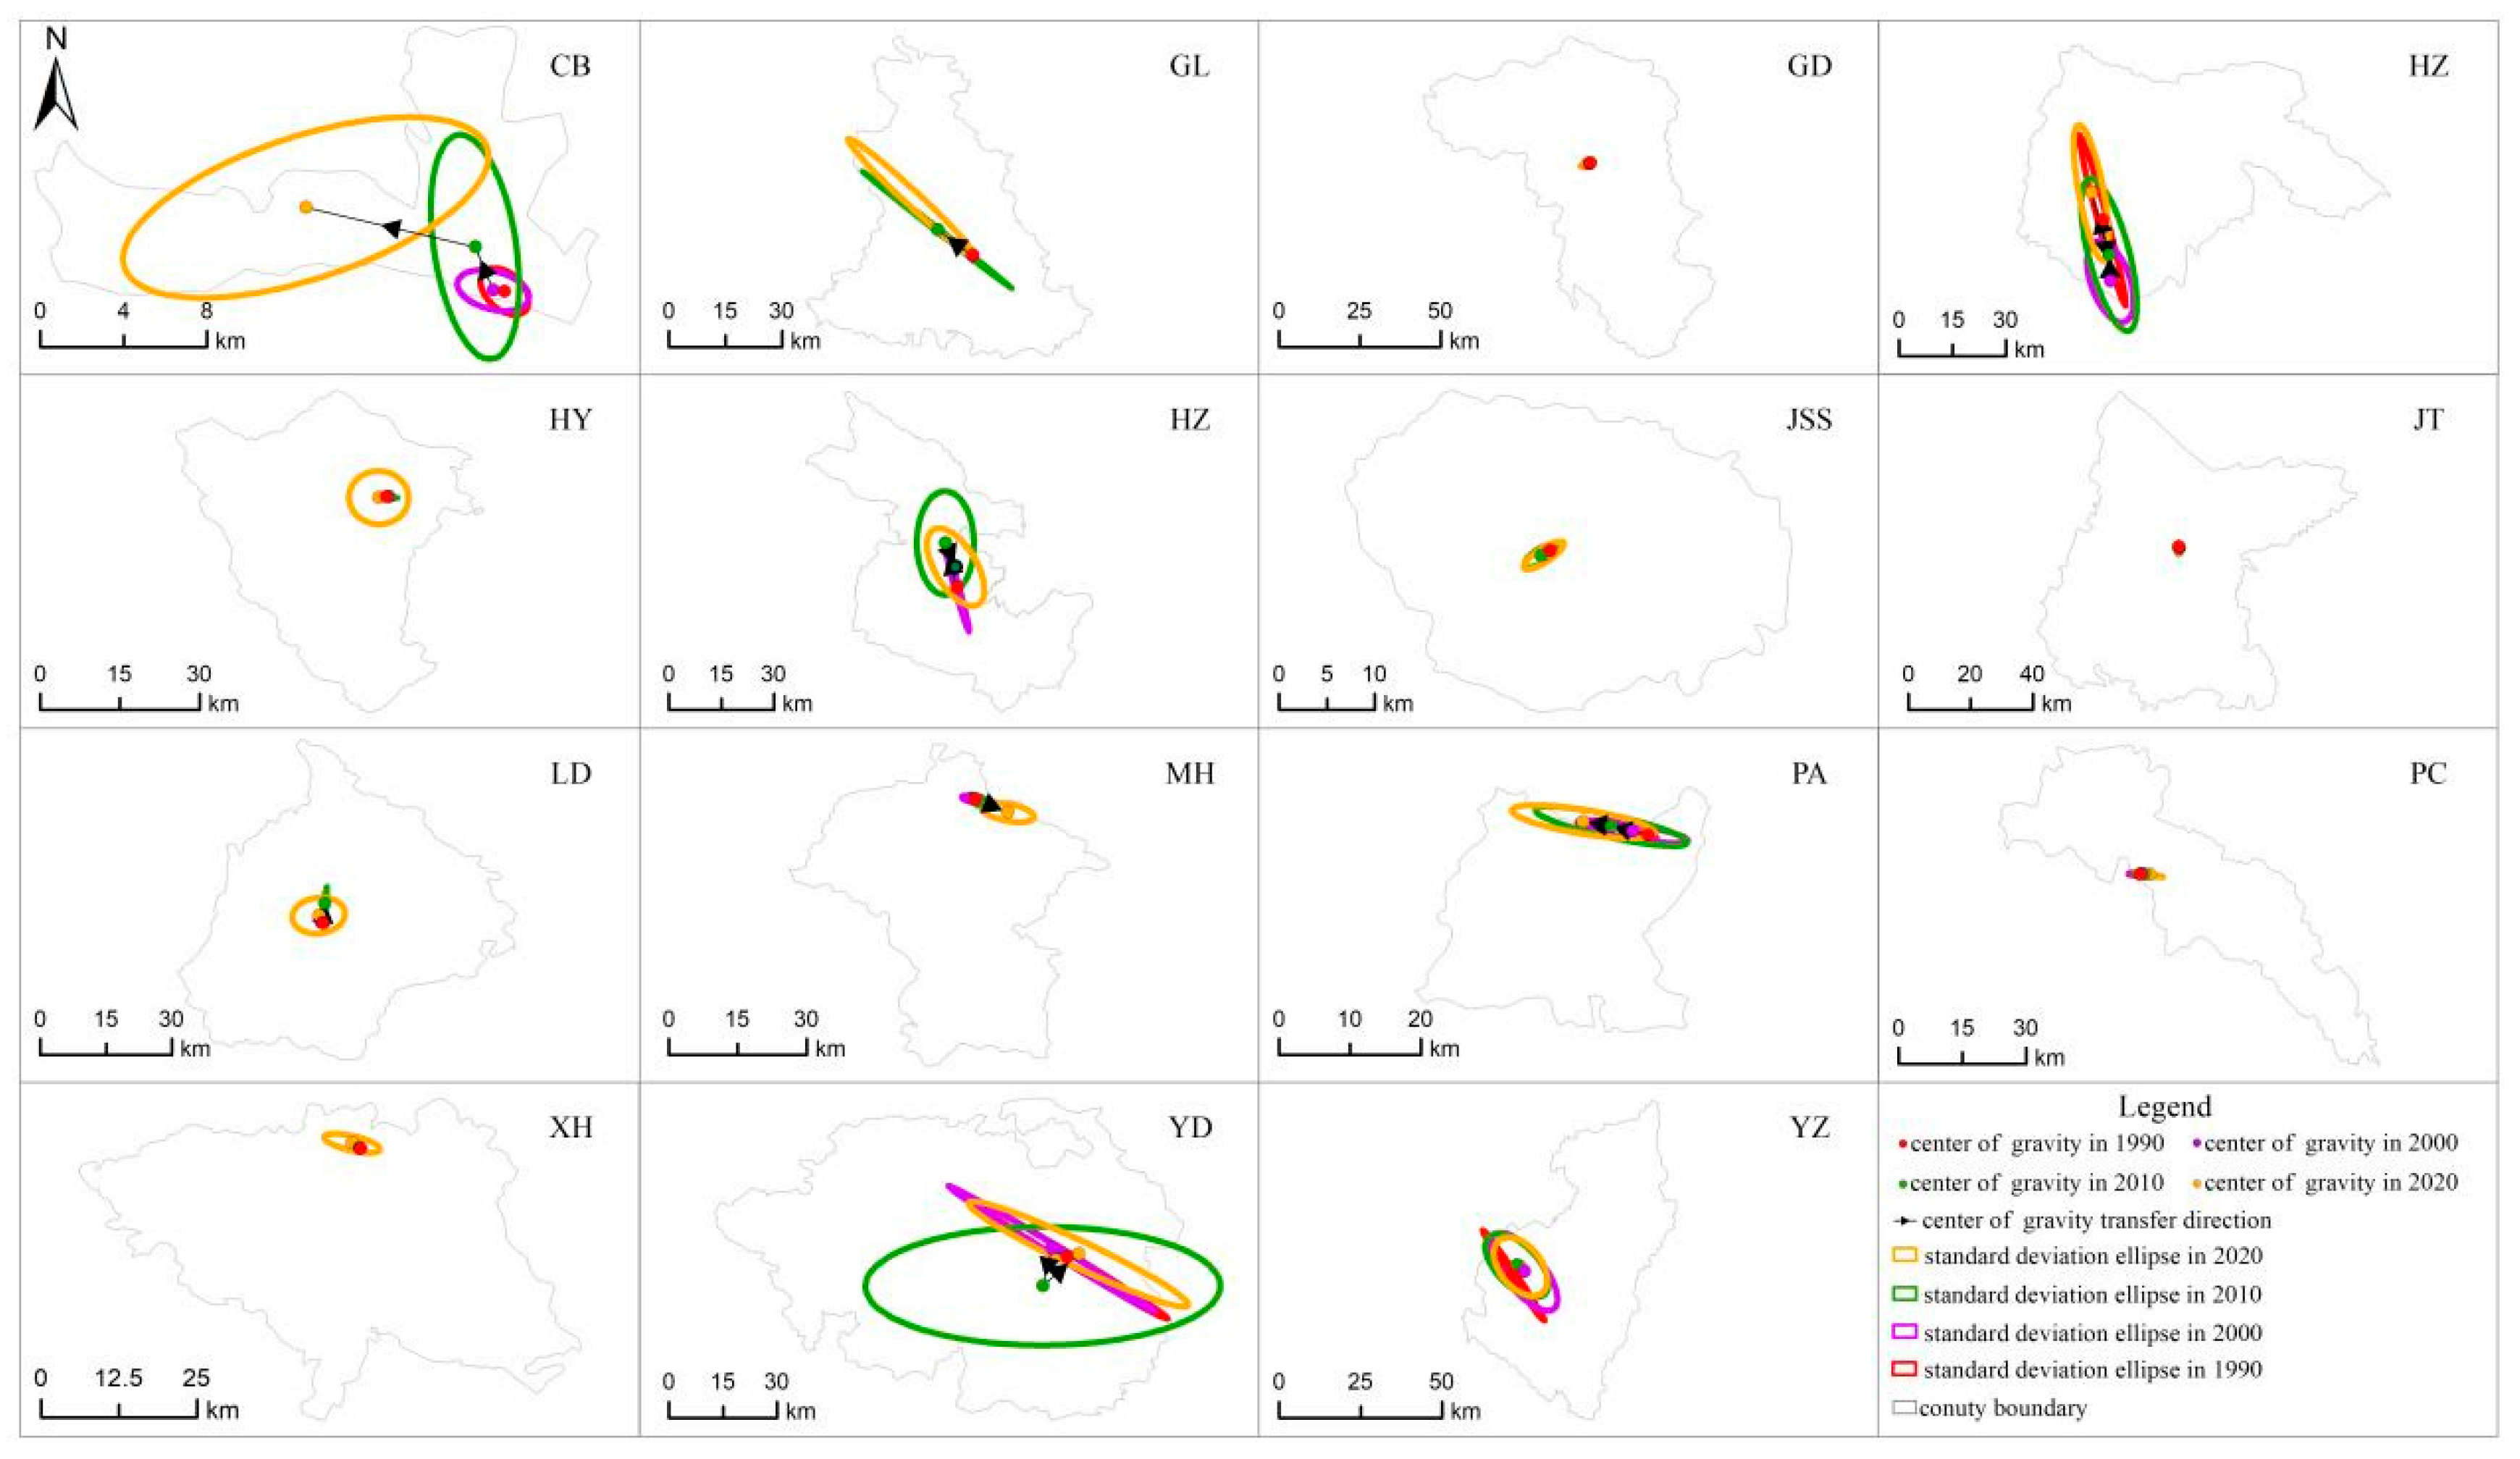
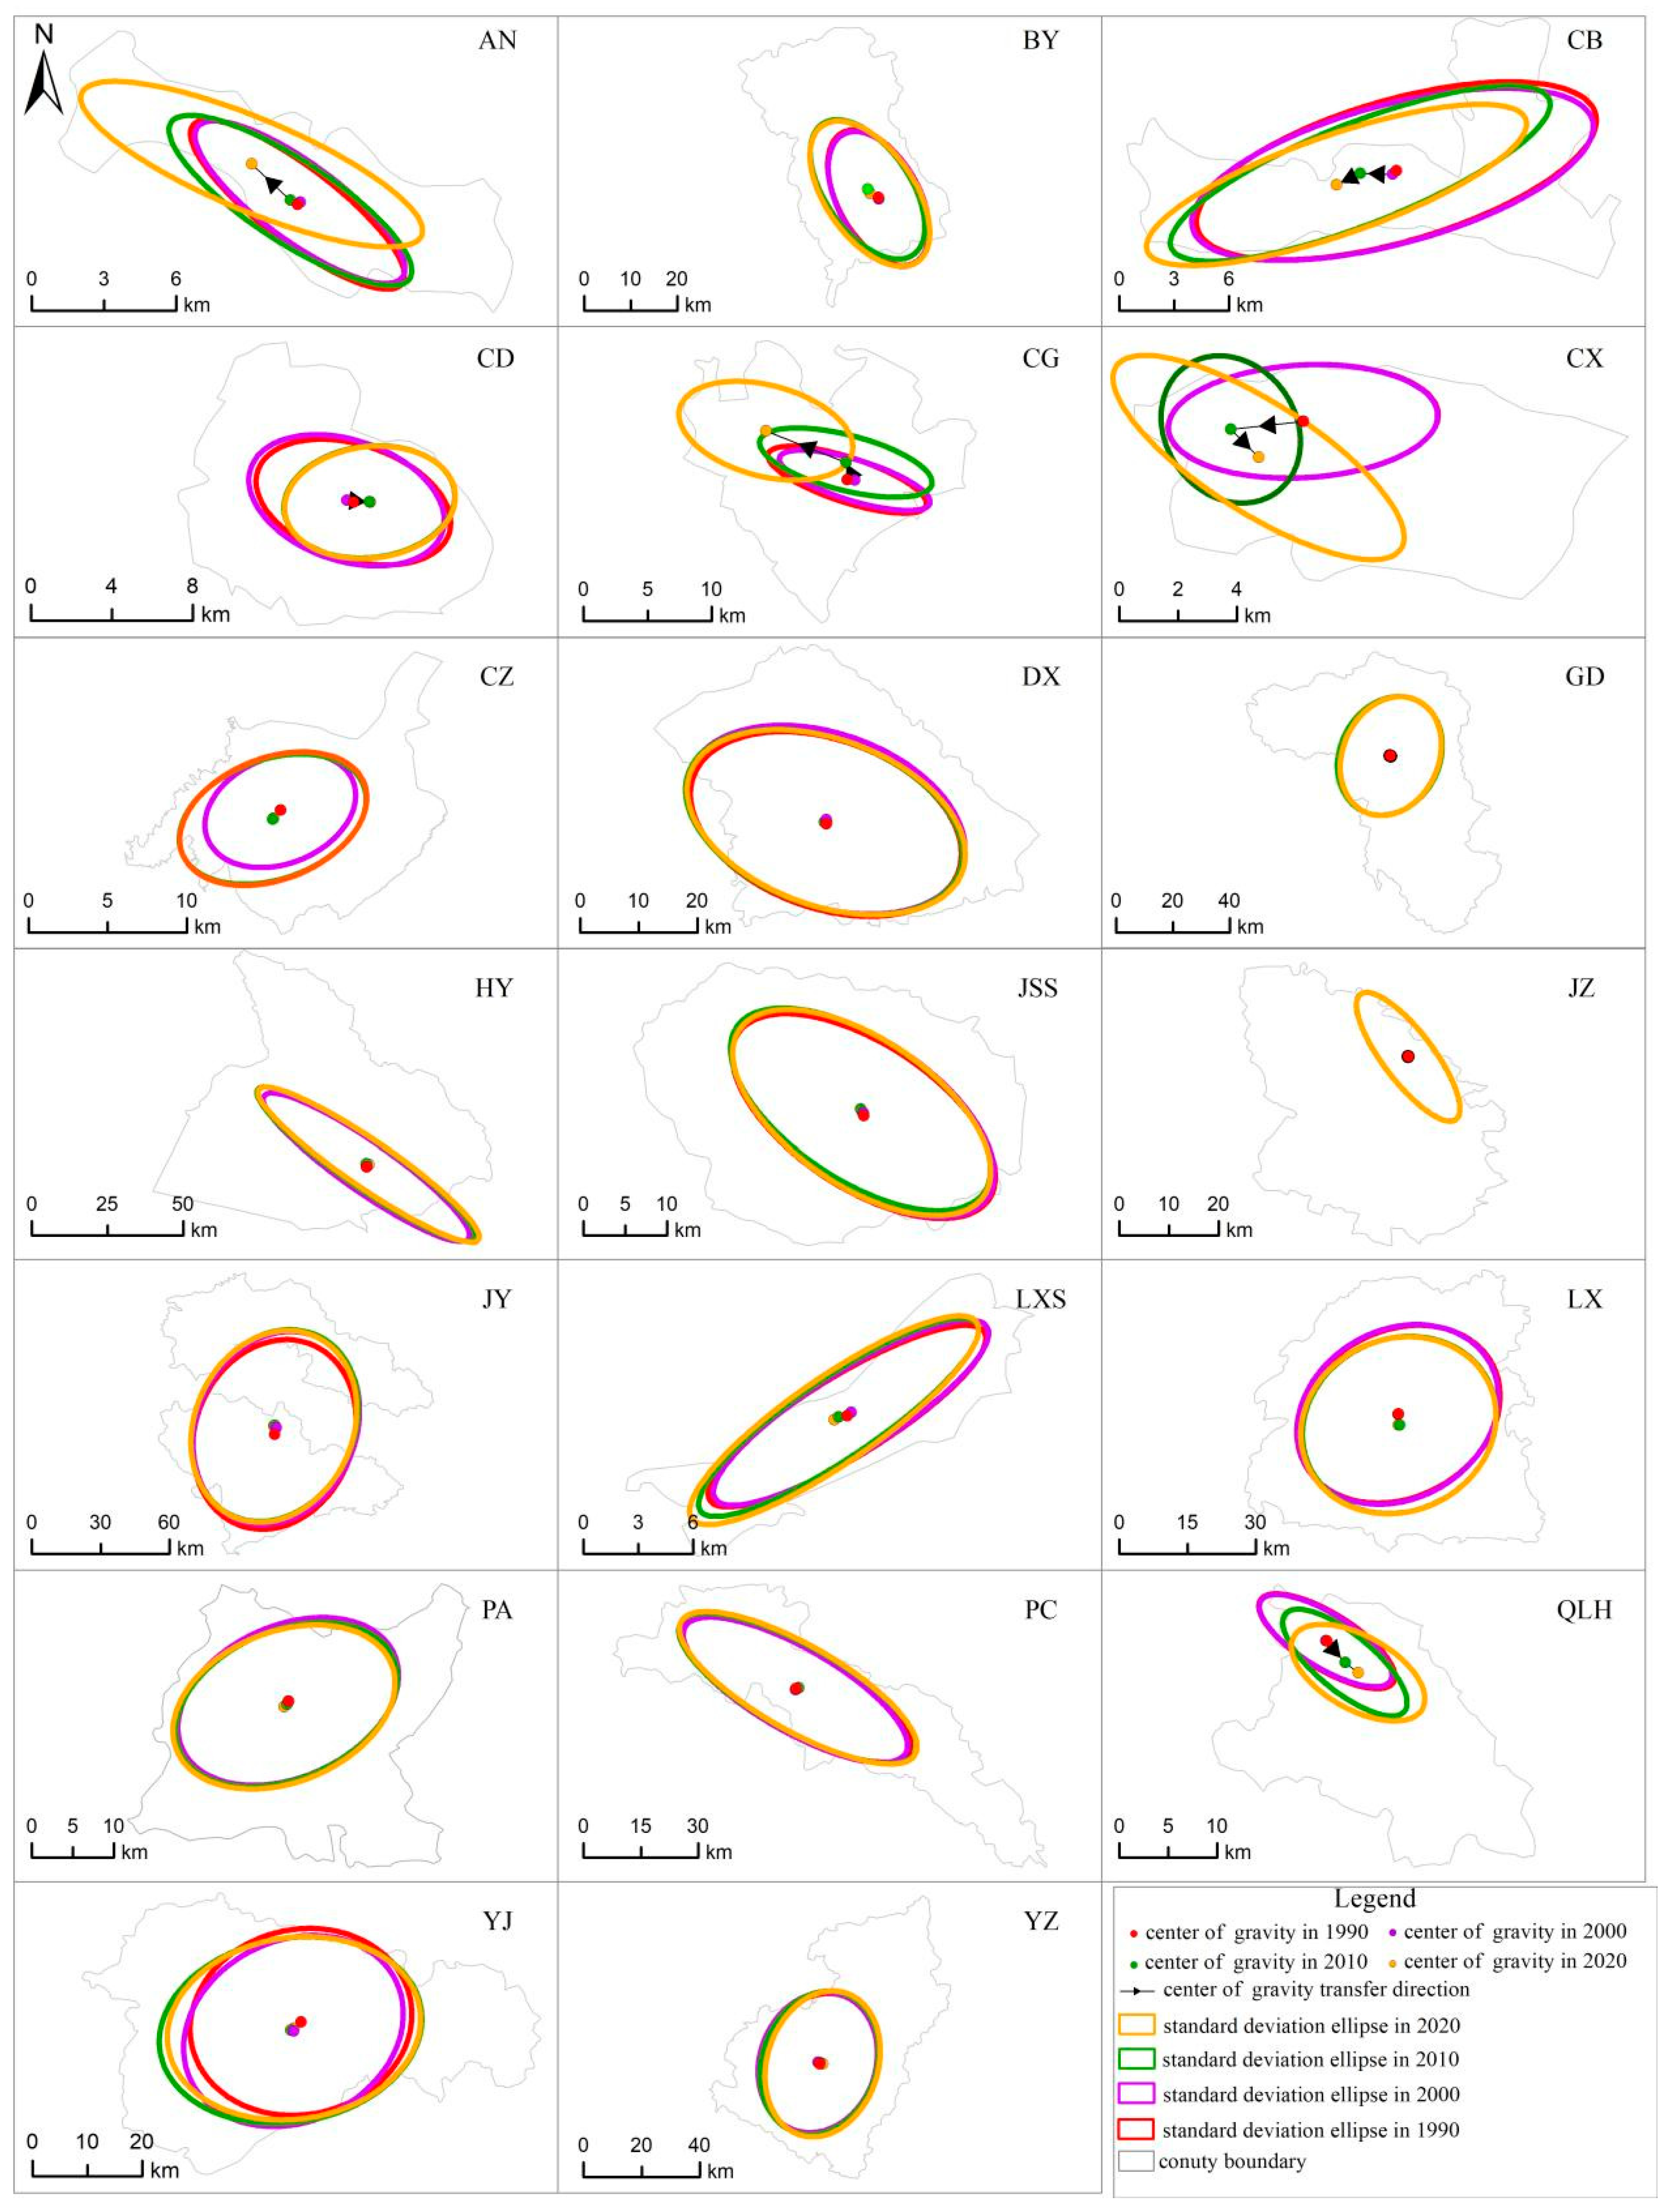
3.1.4. County (District)-Scale Construction Land Level Expansion Characteristics

In terms of urban construction land, the areas of urban construction land in Chengguan District, Qilihe District, Xigu District and Baiyin District were always larger than those in the remaining districts and counties, and the area of urban construction land in Dongxiang County was always the smallest (Figure 3(a4)). The growth rates of urban construction land in Yongdeng County, Gaolan County, Yuzhong County and Chengbei District were the fastest, and the growth rate of urban construction land in Jianzha County was the slowest, mainly because the establishment of Lanzhou New District in 2012 led to rapid increases in urban construction land in Yongdeng County and Gaolan County, the construction of Yuzhong Peace University City led to the rapid increase of urban construction land in Yuzhong County, and the establishment of university cities such as Xining Biotechnology Industrial Park and the new campus of Qinghai Normal University made the urban construction land area in Chengbei District increase rapidly. In terms of rural settlement land, the number of counties (districts) with decreasing rural settlement land areas increased throughout the study period (Figure 3(b4)). Thirty counties (districts), including Yongjing County, Anding District and Mutual County, had increasing rural settlement land areas, while 9 counties (districts), including Jingyuan County, Pingchuan District and Chengxi District, had decreasing rural settlement land areas from 1990 to 2020. The number of counties (districts) with decreasing rural settlement land areas was increasing, and this was closely related to China’s current new urbanization strategy and the policy of stock construction land development. In terms of other construction land, the areas of other construction land increased in most counties (districts) (Figure 3(c4)). The areas of other construction land in 34 counties (districts), including Baiyin District, Xigu District and Huanzhong District, increased; the areas of other construction land in two districts, Chengxi District and Chengzhong District, remained unchanged; and the areas of other construction land in three districts, namely, Xigu District, Chengbei District and Chengdong District, decreased. In general, after the implementation of the “Western Development” strategy in 2000, the scale of other construction land in each county and district continued to increase due to the construction of a number of major infrastructure projects, such as the Lanzhou–Xinjiang railroad relink, while decreased other construction land areas in some regions were the result of urbanization development converting some industrial and mining land areas belonging to urban areas into urban construction land.

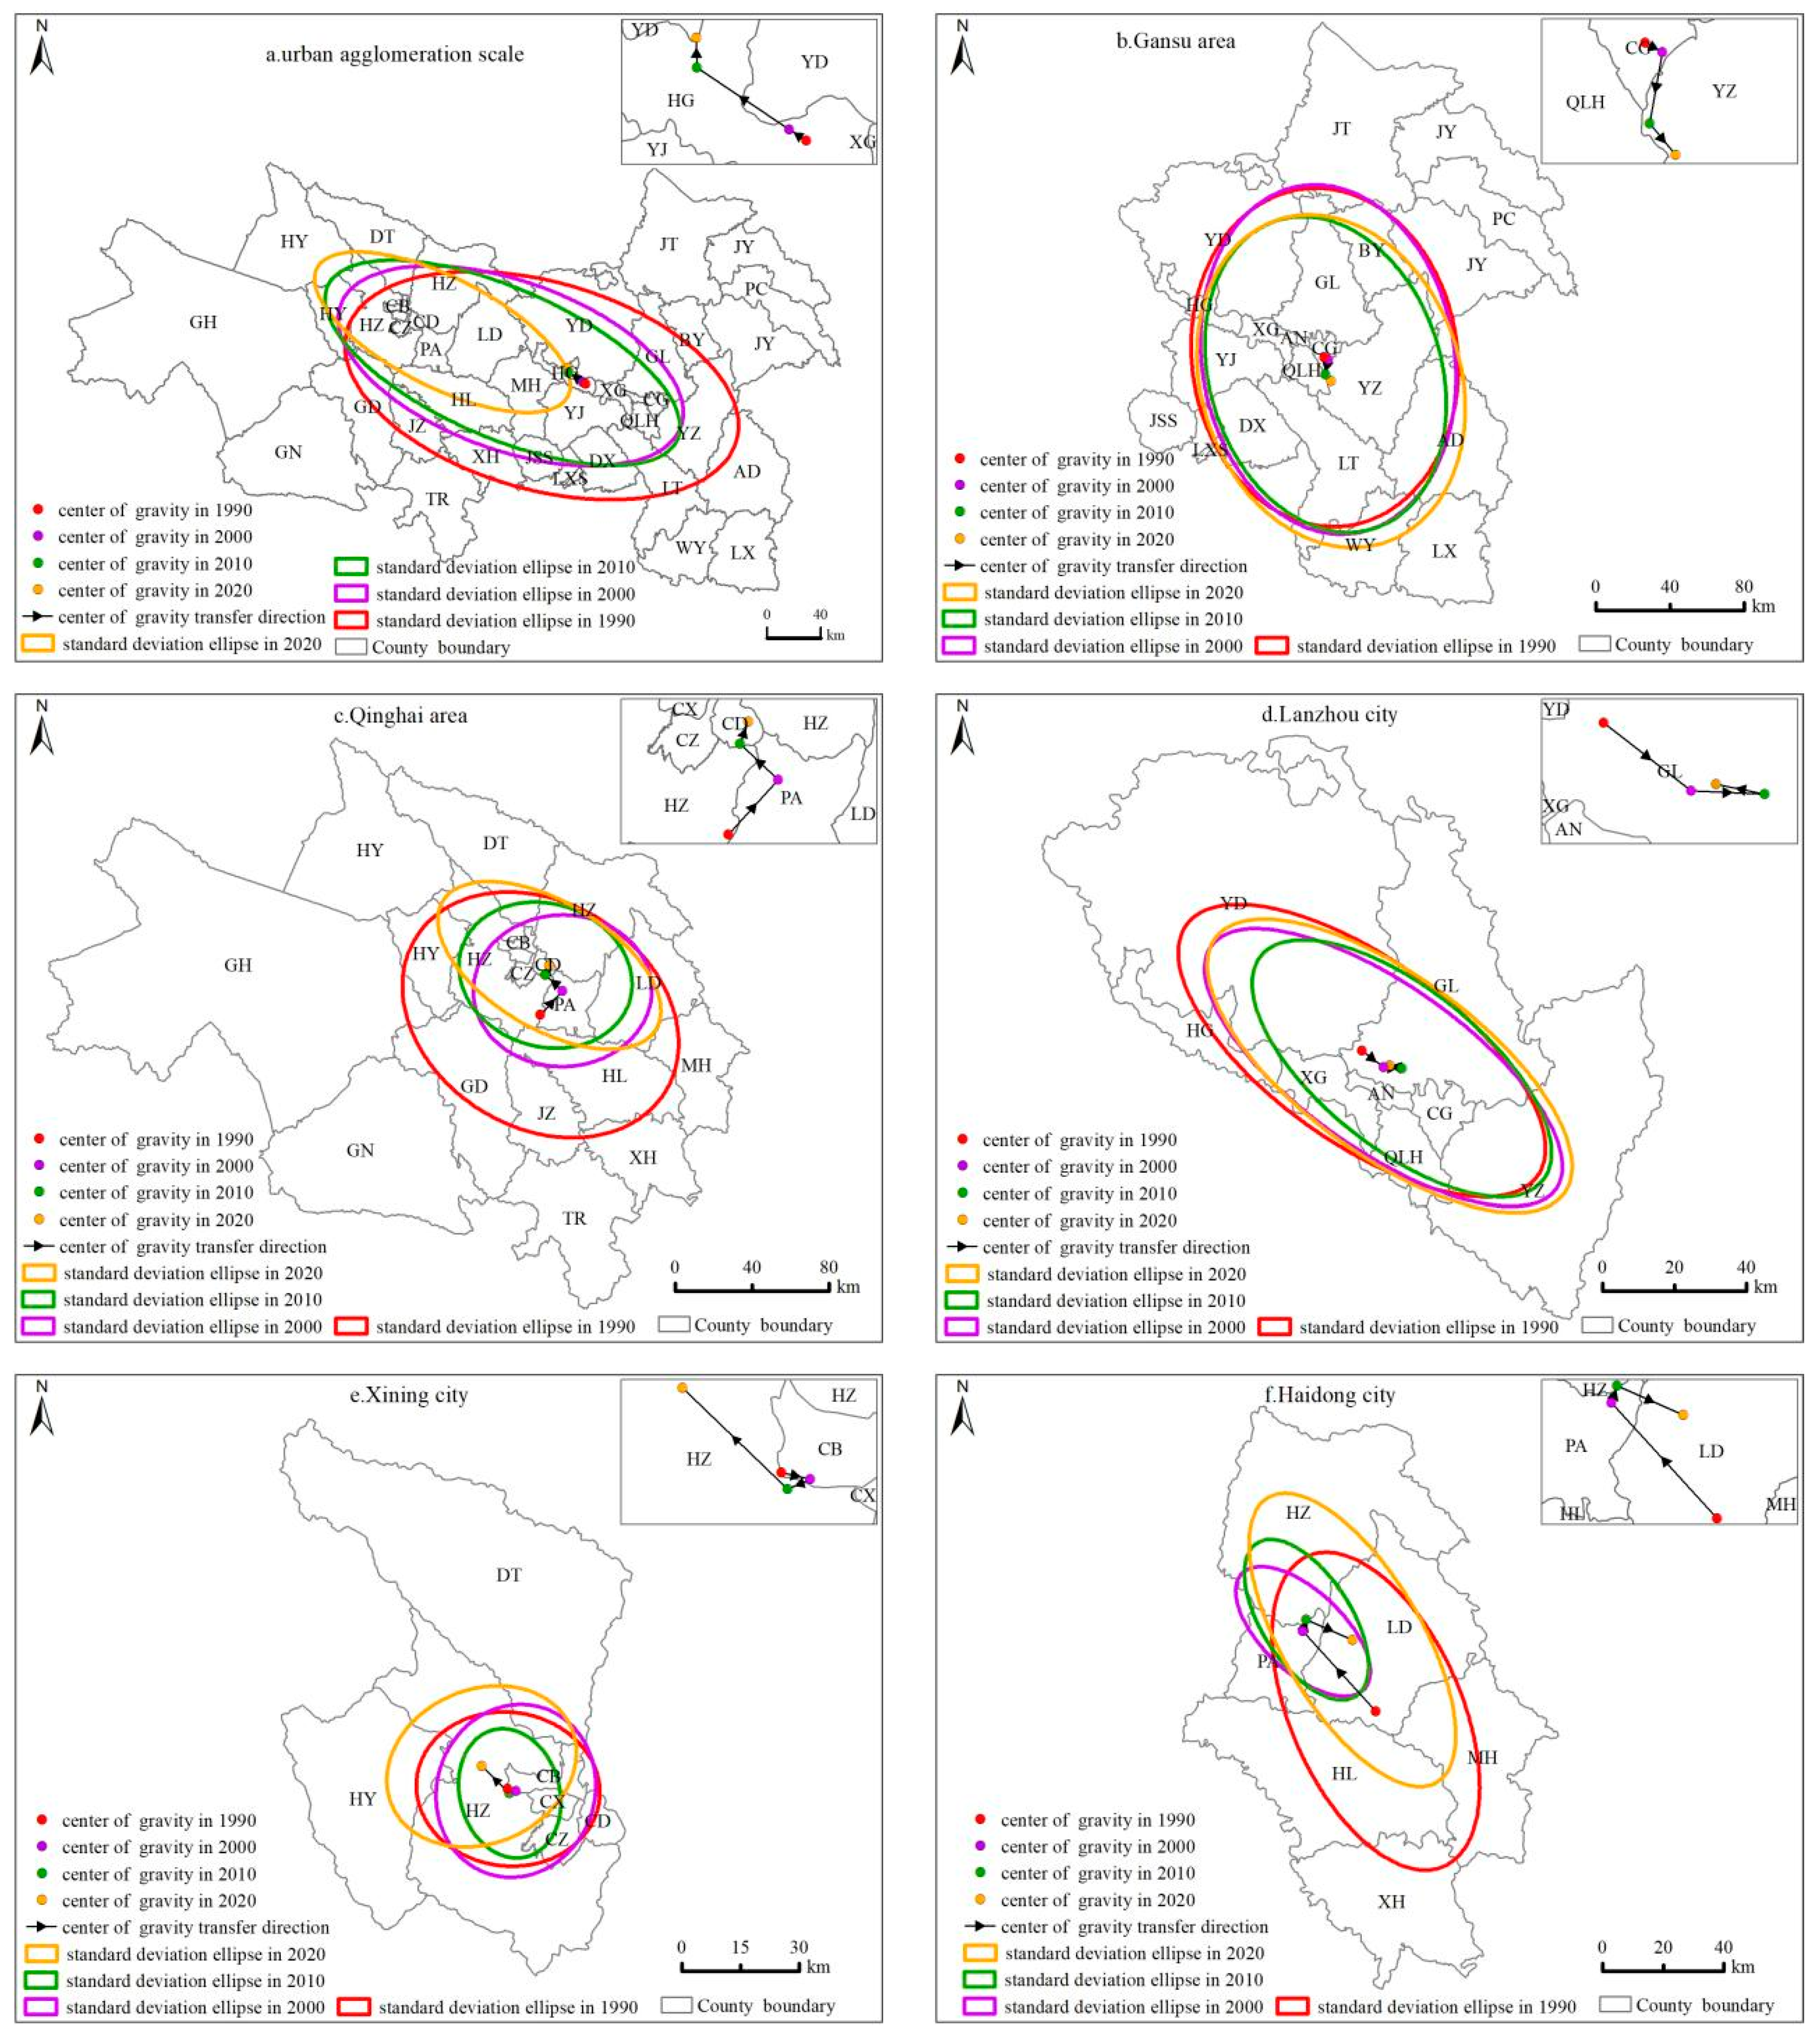
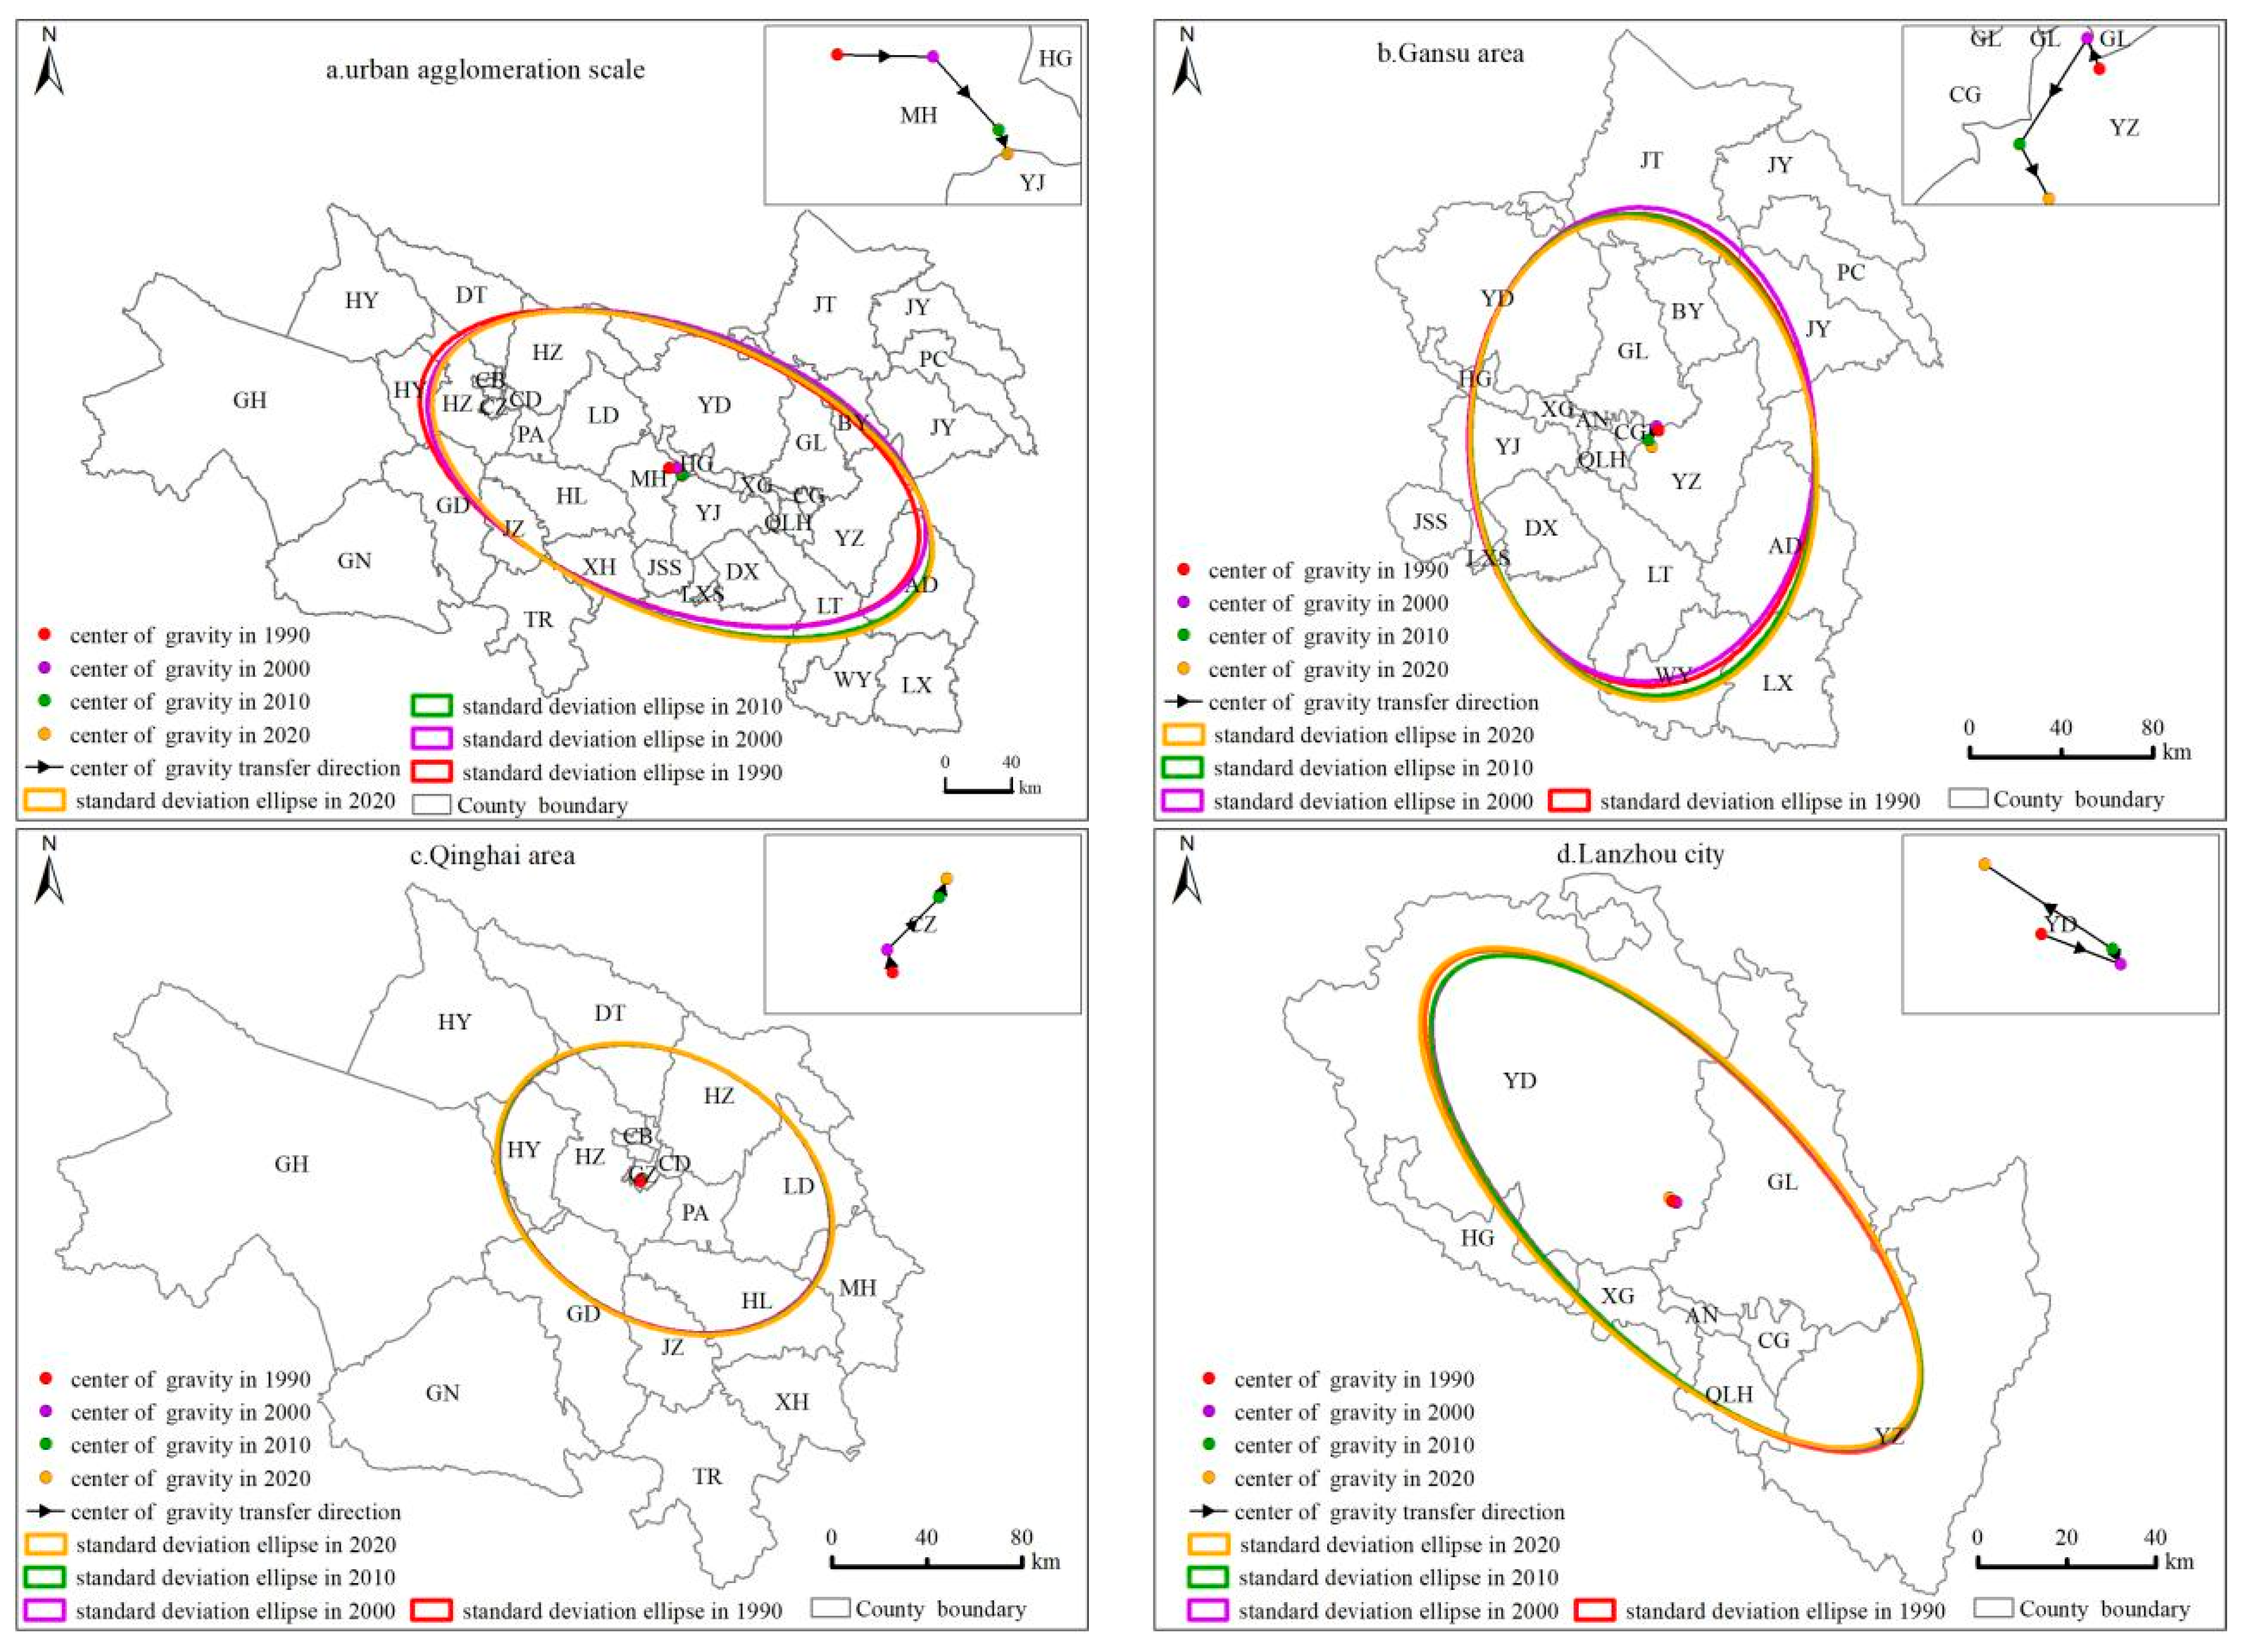
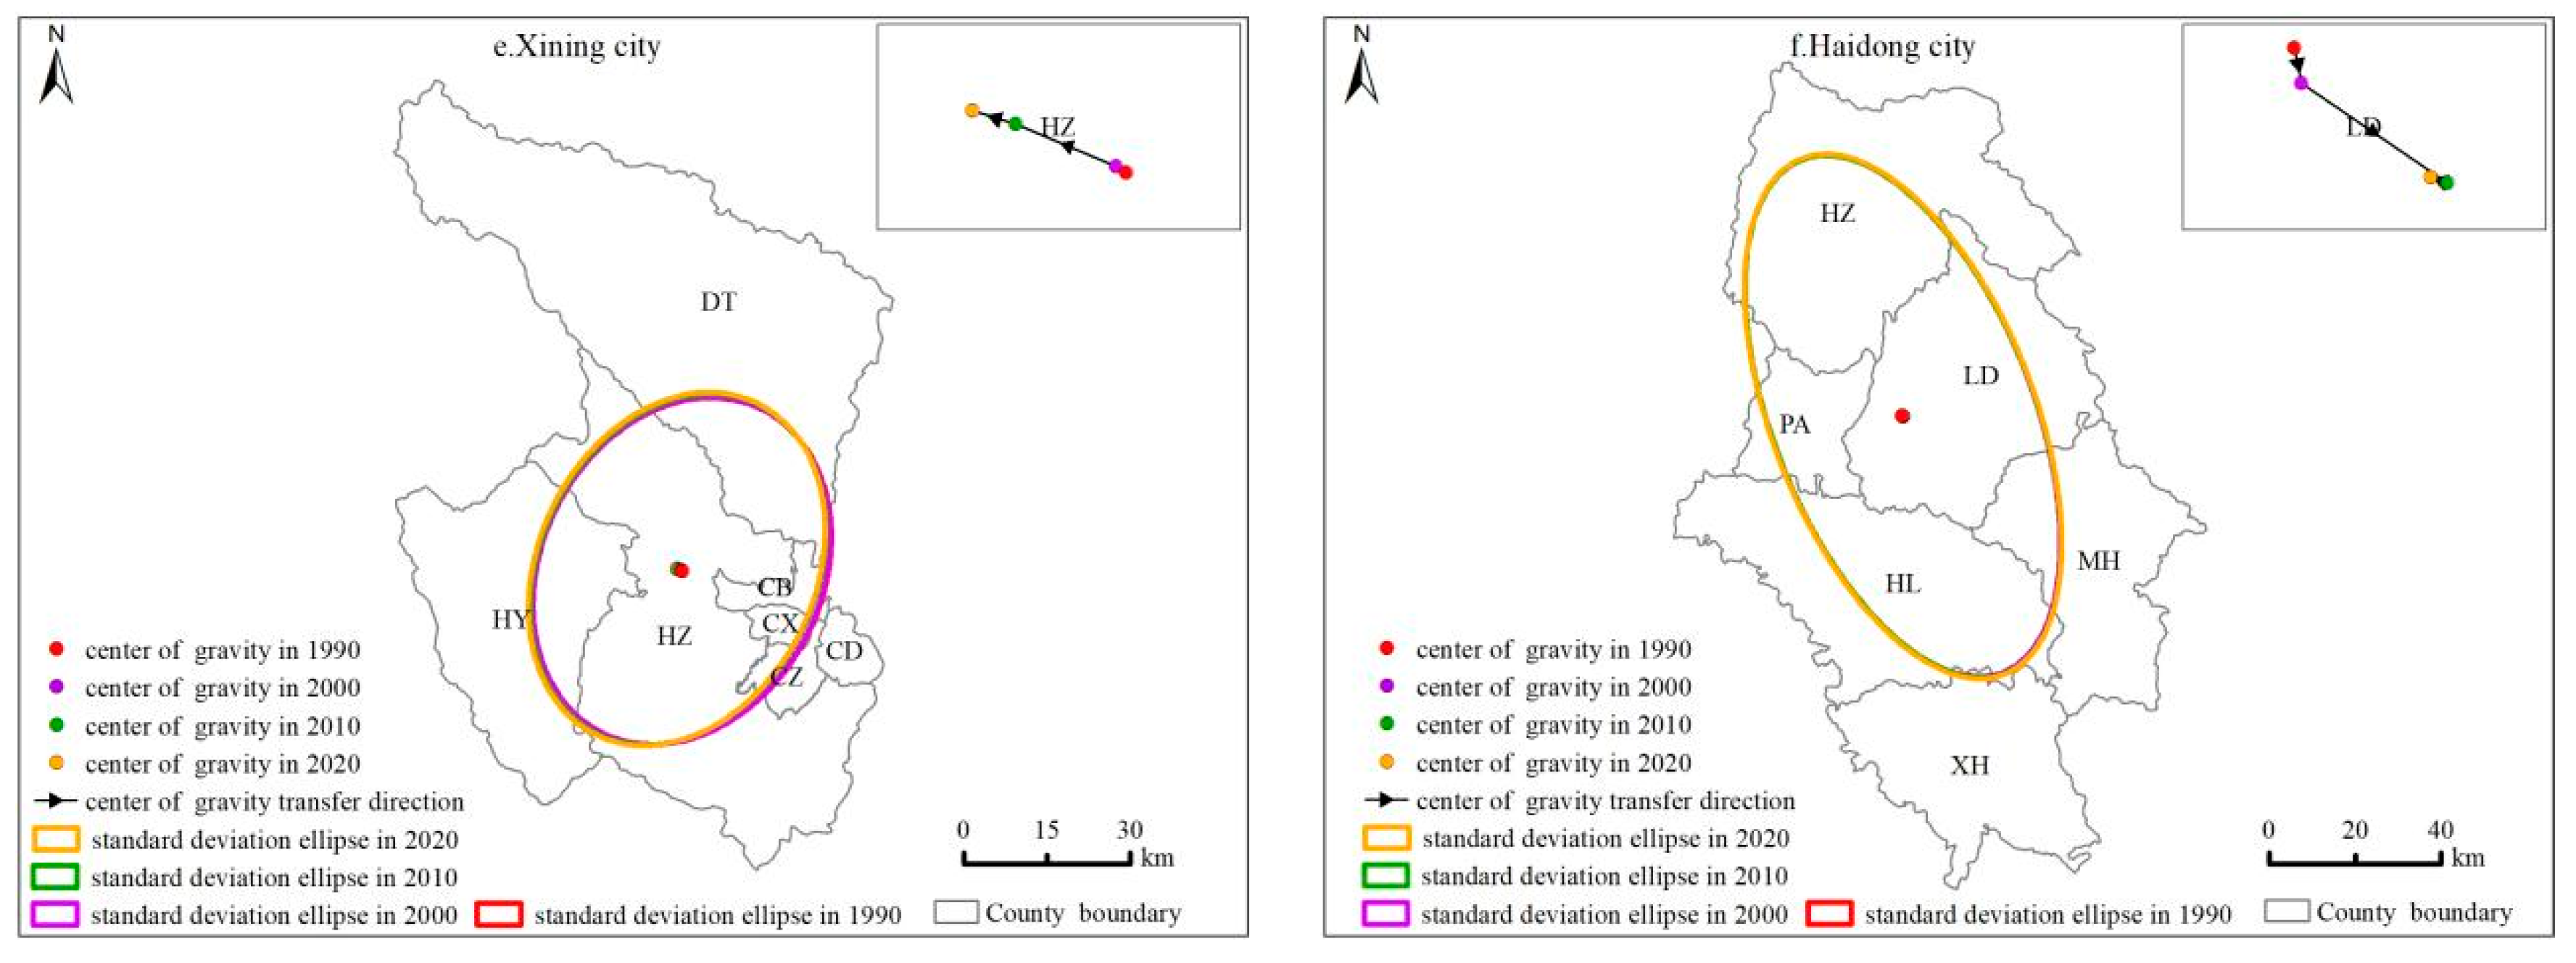
3.2. Analysis of the Spatial Transfer Characteristics of Construction Land

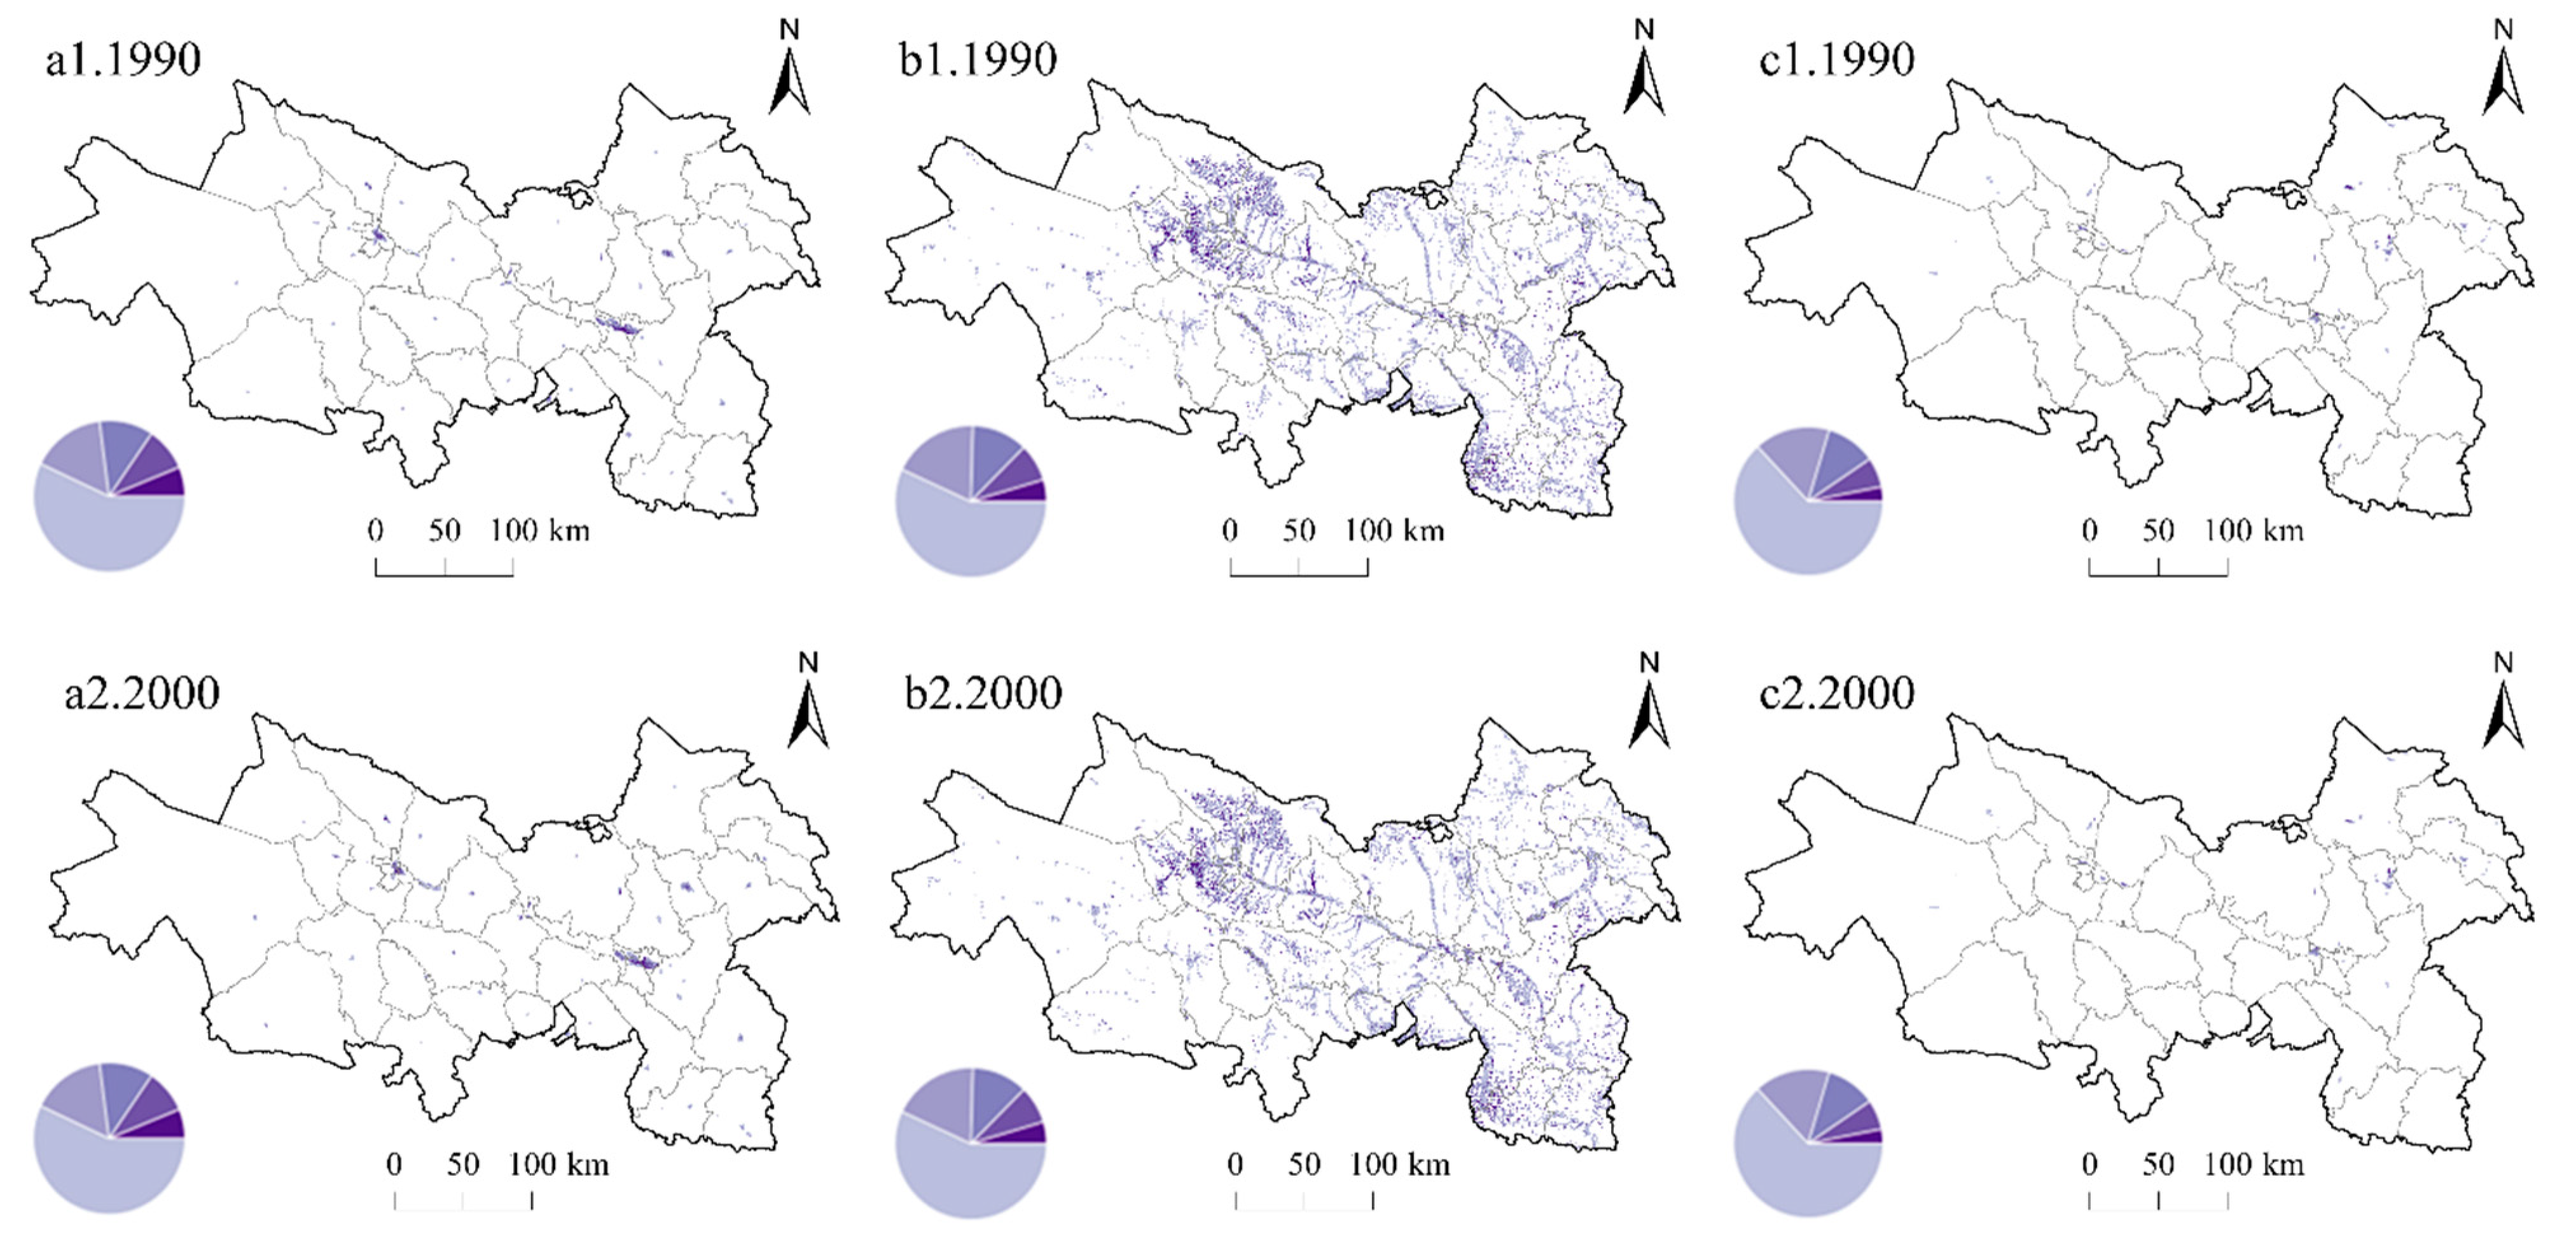
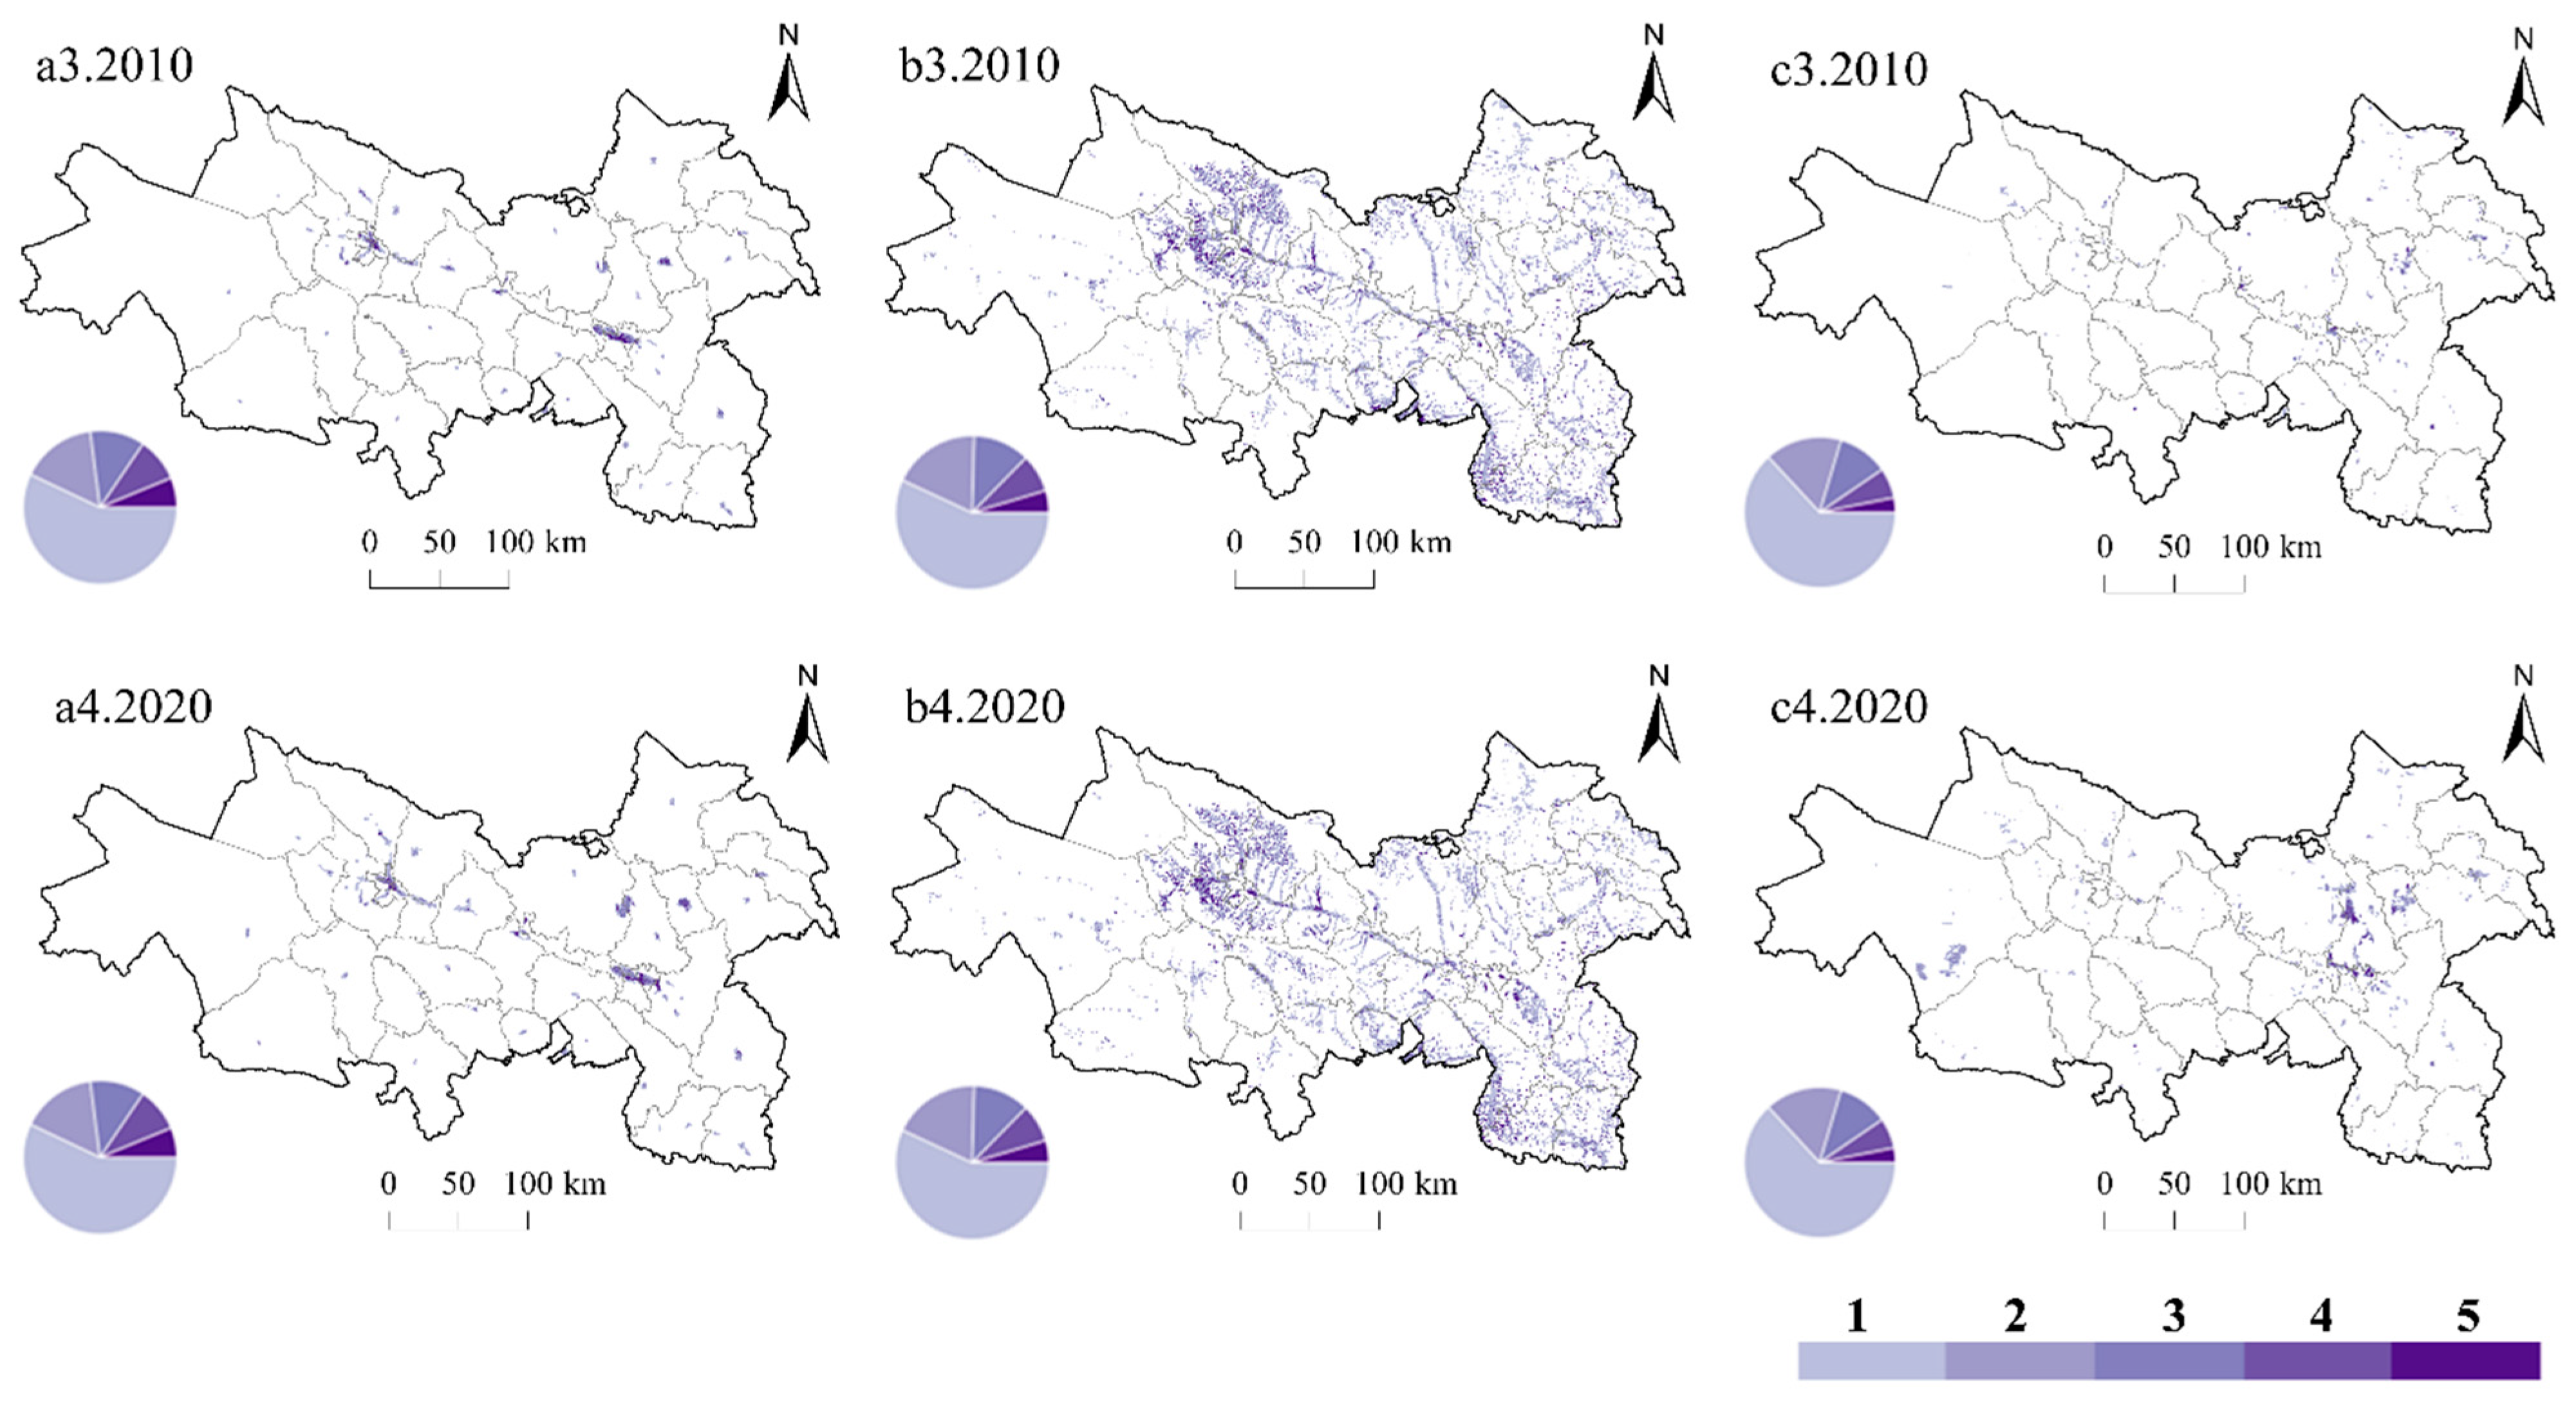
3.2.1. Land for Urban Construction

At the urban agglomeration scale, the center of gravity of urban construction land in the LXUA shifted northwestward, especially after 2000. As shown in Figure 4a, with the implementation of the national “Western Development Strategy”, the distance of the center of gravity of urban construction land in the LXUA shifted the most between 2000 and 2010, with a shift of 12.70 km, and the standard deviation ellipse also became flatter. At the provincial level, the center of gravity of urban construction land in the Gansu area shifted southeastward, the center of gravity of urban construction land in the Qinghai area shifted northeastward, while these two areas expanded in the same direction. From Figure 4b,c, it can be seen that the oval shape and area of the standard deviation of urban construction land in Gansu were basically unchanged throughout the study period, and the distance of the center-of-gravity shift was the largest between 2000 and 2010, at 8.29 km. The oval shape of the standard deviation of urban construction land in the Qinghai area was compact and flat, especially between 1900 and 2000. The oval area of the standard deviation decreased, the shape became similar to a circle, and the distance of the center-of-gravity shift was largest, at 16.96 km, indicating that the urban construction land in the Qinghai area was allocated mainly to the main urban areas of Xining City and Haidong City, driven by the development of the Xining Caojiabao International Airport. At the municipal scale, the centers of gravity of urban construction land in both Lanzhou City and Xining City first shifted southeastward and then northwestward, while the center of gravity of urban construction land in Haidong City first shifted northwestward and then southeastward. From Figure 4d–f, it can be seen that the center of gravity of urban construction land in Lanzhou City shifted toward Yuzhong County in the southeast direction first, mainly due to the jumping and compact land-use patterns in regions such as Peace University City and the Lanzhou University Yuzhong Campus, which prompted the southeastward expansion of urban construction land in Lanzhou City; with the establishment of Lanzhou New District, the urban construction land in Lanzhou City expanded northwestward. The center of gravity of urban construction land in Xining City also shifted southeastward. After 2010, the short axis of the standard deviation ellipse of urban construction land in Xining became longer, and the center of gravity shifted northwestward across a distance of 9.99 km, mainly due to the construction of Haihu New District in Chengxi District. The standard deviation ellipse of urban construction land in Haidong City “first decreased and then increased”, and the area of the standard deviation ellipse of urban construction land in Haidong City “decreased and then increased”. The long axis in the east-west direction elongated, mainly due to the development of Haidong City to the west under the policy guidance of Qinghai Province’s vigorous development of Xining Caojiabao International Airport and the development of Haidong City to the east with the relocation of Haidong Municipal Government’s residence to Ledu District and the construction of Huanghuang New District. Through the above analysis, it can be seen that the center of gravity of urban construction land in the LXUA shifted northwestward throughout the study period, with a compact layout, and that the expansion of urban construction land in the Qinghai and Gansu areas and in Lanzhou and Xining cities had the characteristic of “centrifugal in the same direction”, while the expansion of urban construction land in Xining and Haidong cities had the characteristic of “same frequency”. These results indicate that the “centripetal force” of the Lanzhou–West urban agglomeration needs to be further enhanced to achieve “competitive” development.
At the county (district) scale, the centers of gravity of urban construction land in the vast majority of counties (districts) did not shift significantly, while the centers of gravity of urban construction land in counties (districts) within Lanzhou City, Xining City and Haidong City shifted significantly, and the spatial dispersion of the standard deviation ellipse increased. To analyze the spatial and temporal change characteristics of urban construction land at the county (district) scale, 15 counties (districts) with a medium-rate or higher expansion grades from 1990 to 2020 were selected for standard deviation ellipse analysis. As shown in Figure 5, the standard deviation ellipses flattened and the centers of gravity shifted significantly in Gaolan, Yongdeng and Yuzhong counties in Lanzhou, in Chengbei and Huanzhong districts in Xining, and in Ledu, Pingan and Mutual counties in Haidong, while the standard deviation ellipses and centers of gravity changed slightly in the rest of the counties (districts). At the same time, we also found that the urban construction land in the inner counties (districts) of Lanzhou City increased slightly, while the areas in three counties increased significantly, showing “jump” land-use patterns; in Xining City and Haidong City, urban construction land mainly expanded in the inner counties (districts), showing an “infill” land-use pattern. The more distant the counties (districts) were from these three cities, the weaker the oval variation in the standard deviation of urban construction land and the change in location; these findings are consistent with the result that the intensity of urban construction land expansion in counties (districts) exhibits a “core-edge” pattern.

3.2.2. Rural Settlement Land

At the urban cluster scale, the center of gravity of rural settlements in the Lanzhou–Xining Urban Cluster continued to shift southeastward. As shown in Figure 6a, especially after 2000, with the implementation of the “Three North Protective Forests” and “Returning Cultivated Land to Forests and Grasses” national policies, some farmers in the ecologically fragile areas of the LXUA underwent ecological migration. During the 2000–2010 period, the centers of gravity of rural settlements in the LXUA shifted with a maximum distance of 4.55 km, and the center of gravity shifted from Minhe County in Qinghai to Yongjing County in Gansu. At the provincial level, the centers of gravity of rural settlements in the Gansu area shifted southeastward, and the centers of gravity of rural settlements in the Qinghai area shifted northwestward. From Figure 6b,c, it can be seen that the oval shape and area of the standard deviation of rural settlement land in the Gansu area and Qinghai area basically remained unchanged, and the distance shifted between 2000 and 2010 was largest. At the municipal level, the elliptical shape and size of the standard deviations of Lanzhou, Xining and Haidong were basically unchanged, and the centers of gravity shifted southeastward and then northwestward; then, the centers of gravity of these three regions shifted westward, southward and southeastward, respectively. From Figure 6d–f, it can be seen that the elliptical shape and size of the standard deviation of rural settlement sites in Lanzhou City remained basically unchanged, and the center of gravity shifted northwestward; this was the result, on the one hand, of the area of rural settlement sites decreasing due to the continuous urbanization of Qilihe, Chengguan and Yuzhong in Lanzhou City, while, on the other hand, the area of rural settlement sites in Xining City increased due to the migration of ecological immigrants from other places in Lanzhou New Area. The oval shape and size of the standard difference were basically unchanged, and the center of gravity continued to shift westward, mainly due to the rapid urbanization of the main urban area in the southeastern region, thus reducing the area of rural settlements around the city. The oval shape and size of the standard difference of rural settlements in Haidong City were basically unchanged, and the center of gravity shifted toward agricultural counties such as Minhe in the southeastern area. Through the above analysis, it can be seen that the layout of rural settlements in the east-west direction of the LXUA was scattered, the center of gravity shifted southeastward during the study period, and the standard deviation oval shape and size of the area and typical cities remained basically unchanged, indicating that the layout of rural settlements in the LXUA region remained basically stable. However, in the context of new urbanization modes with county cities as the carriers, the LXUA needs to further revitalize its stock of rural settlement land and improve the efficiency of rural settlement land.
At the county (district) scale, most of the counties (districts) rural residential land-use standard deviation ellipse variations and locations changed significantly throughout the study period, especially the counties (districts) covering Lanzhou City, Xining City and Haidong City, which experienced rapid declines in rural residential land use. To dissect the spatial and temporal characteristics of rural settlement sites at the county (district) scale, 20 counties (districts) with grades above low expansion or below slow decline from 1990 to 2020 were selected for standard deviation ellipse analysis. As shown in Figure 7, the areas where the standard deviation ellipse shape and location of rural settlement sites changed significantly were concentrated mainly in the main urban areas of Lanzhou, Xining and Haidong, and the standard deviation ellipse areas decreased and dispersed, while the standard deviation ellipse areas of rural settlement sites in the suburban counties (districts) of Yuzhong, Jingyuan and Yongjing became larger and dispersed. In the rural settlement sites in the agricultural areas of Jishishan, Dongxiang and Guide counties (districts), the elliptical shape and location of the standard deviations basically remained unchanged.

3.2.3. Other Construction Land

At the urban cluster scale, the center of gravity of other construction land in the Lanzhou–Xining urban cluster continued to shift southwestward, especially after 2000, and the center of gravity also shifted significantly. As shown in Figure 8a, the standard deviation ellipse of other construction land in the LXUA flattened, with a scattered layout in the east-west direction, and the center of gravity shifted from northeastern Yongdeng County to northwestern Honggu District, with the largest shift distance of 40.45 km recorded between 2000 and 2010. At the provincial area scale, the other construction land areas in both Gansu and Qinghai shifted southwestward overall. From Figure 8b,c, it can be seen that the ellipse of the standard deviation of other construction land in the Gansu area diverged in the north-south direction but exhibited a clustering trend, with the center of gravity shifting first southwestward and then southeastward; simultaneously, the center of gravity “jumped” from Jingyuan County to Gaolan County. The ellipse of the standard deviation of other construction land in the Qinghai area tended to be circular, with an increasing clustering trend observed toward the center, and the center of gravity shifted first southeastward and then southwestward; the southeastward shift was driven mainly by major infrastructure such as the Qinghai–Tibet Railway, Beijing–Tibet Expressway and Zhang Wen Expressway, while the southwestward center-of-gravity shift was due to the vigorous development of the PV industry in Qinghai after 2010. At the municipal scale, the ellipses of the standard deviations of other construction land in Lanzhou, Xining and Haidong tended to be circular, and the dispersion was weakened. From Figure 8d–f, it can be seen that the ellipse of standard deviation of other construction land in Lanzhou City first increased and then decreased in the east-west direction, the center of gravity first shifted northwestward and then southeastward. The ellipse of the standard deviation of other construction land in Xining City tended to be circular, but the area continued to increase, and the center of gravity shifted from Datong County to Huanzhong District. Regarding the north-south-direction distribution of other construction land in Haidong City, the dispersion was enhanced, but the aggregation force in the east-west direction was also enhanced, the standard deviation ellipse tended to be circular, and the center of gravity shifted first southeastward and then northeastward. Through the above analysis, it can be seen that the other construction land in the LXUA had the tendency to disperse in the east-west direction, while the agglomerations in the north-south direction in Gansu Area and Lanzhou City were enhanced and the standard deviation ellipses of other construction land in Qinghai Area, Xining City and Haidong City tended to be circular with weakened dispersion, indicating that the other construction land in the LXUA tended to be balanced in the county-scale development, thus compensating for the infrastructure shortcomings.
At the county (district) scale, the majority of counties (districts) underwent significant changes in their standard deviation elliptical shapes and locations of other construction land, especially in the counties (districts) located along the Longhai Railway and the Qinghai–Tibet Railway. To dissect the spatial and temporal change characteristics of other construction land at the county (district) scale, 17 counties (districts) with grades above low expansion or below slow decline from 1990 to 2020 were selected for standard deviation ellipse analysis. As seen from Figure 9, the standard deviation ellipses of other construction land in Jingyuan, Pingchuan and Xigu counties (districts) along the Longhai Railway and in Chengbei, Datong and Haiyan counties (districts) along the Qinghai–Tibet Railway, as well as in Yongdeng and Gaolan counties supporting the construction of Lanzhou New Area, changed significantly during the study period, thereby enhancing the location advantages of counties (districts) along the route under the construction of major national infrastructure and increasing the “logistics and people flow” pattern, under which the areas of other construction land increased.

3.3. Analysis of the Evolutionary Characteristics of the Multiscale Slope Spectrum of Construction Land

3.3.1. Characteristics of the Urban Agglomeration Construction Land Slope Spectrum

The slope spectra of urban construction land, rural settlement land and other construction land in the LXUA from 1990 to 2020 were similar to the topographic slope spectra, and all exhibited skewed slope gradient distributions (Figure 10). The peaks of the slope spectra of all three types of construction land were located in the 1°–2° slope range, and the proportions of land areas gradually decreased as the slope increased after these peaks. The topographic slope spectrum of the LXUA reached a peak in the 2°–3° slope range and gradually decreased after 3°. The slope spectrum of urban construction land intersected the topographic slope spectrum at approximately 6° (Figure 10a). Urban construction land was distributed mainly in areas below 6°, and the proportion of urban construction land in areas below 6° to the total area of urban construction land reached 85.27% in 1990, but this proportion increased over time to 86.27% in 2020; the largest increase occurred from 2010 to 2020, reaching 0.91%. The rural settlement land was distributed mainly in areas below 8° (Figure 10b), and over time, the rural settlement land also showed an upward trend in the dominant area. In contrast, other construction land was distributed mainly in areas below 7° from 1990 to 2010 (Figure 10c), but the T value of other construction land increased to approximately 9° from 2010 to 2020, and the areal proportion of this land type in the dominant area fluctuated over time, with the most obvious change occurring from 2010 to 2020, when the areal proportion in the dominant area increased by 0.59%. By analyzing the change values of the upper-limit slope and the average climbing index of the three types of construction land in the LXUA from 1990 to 2020 (Figure 10d), it can be seen that the ABCI revealed fluctuating changes over time, and the average climbing index values of rural settlement land and other construction land were maximized from 2000 to 2010, at 0.04% and 0.06%, respectively. The maximum value of the change in the upper-limit slope of other construction land from 2000 to 2010 reached 3°. The ABCI and ULSC values of all three types of construction land from 2010 to 2020 were less than 0, indicating that the expansion of construction land in that period was still distributed within the dominant area. These results show that, due to the development characteristics of the population and economy, the construction land in the LXUA mainly expanded horizontally in the dominant area during the study period, while an obvious climbing phenomenon toward the inferior area could be observed from 2000 to 2010.

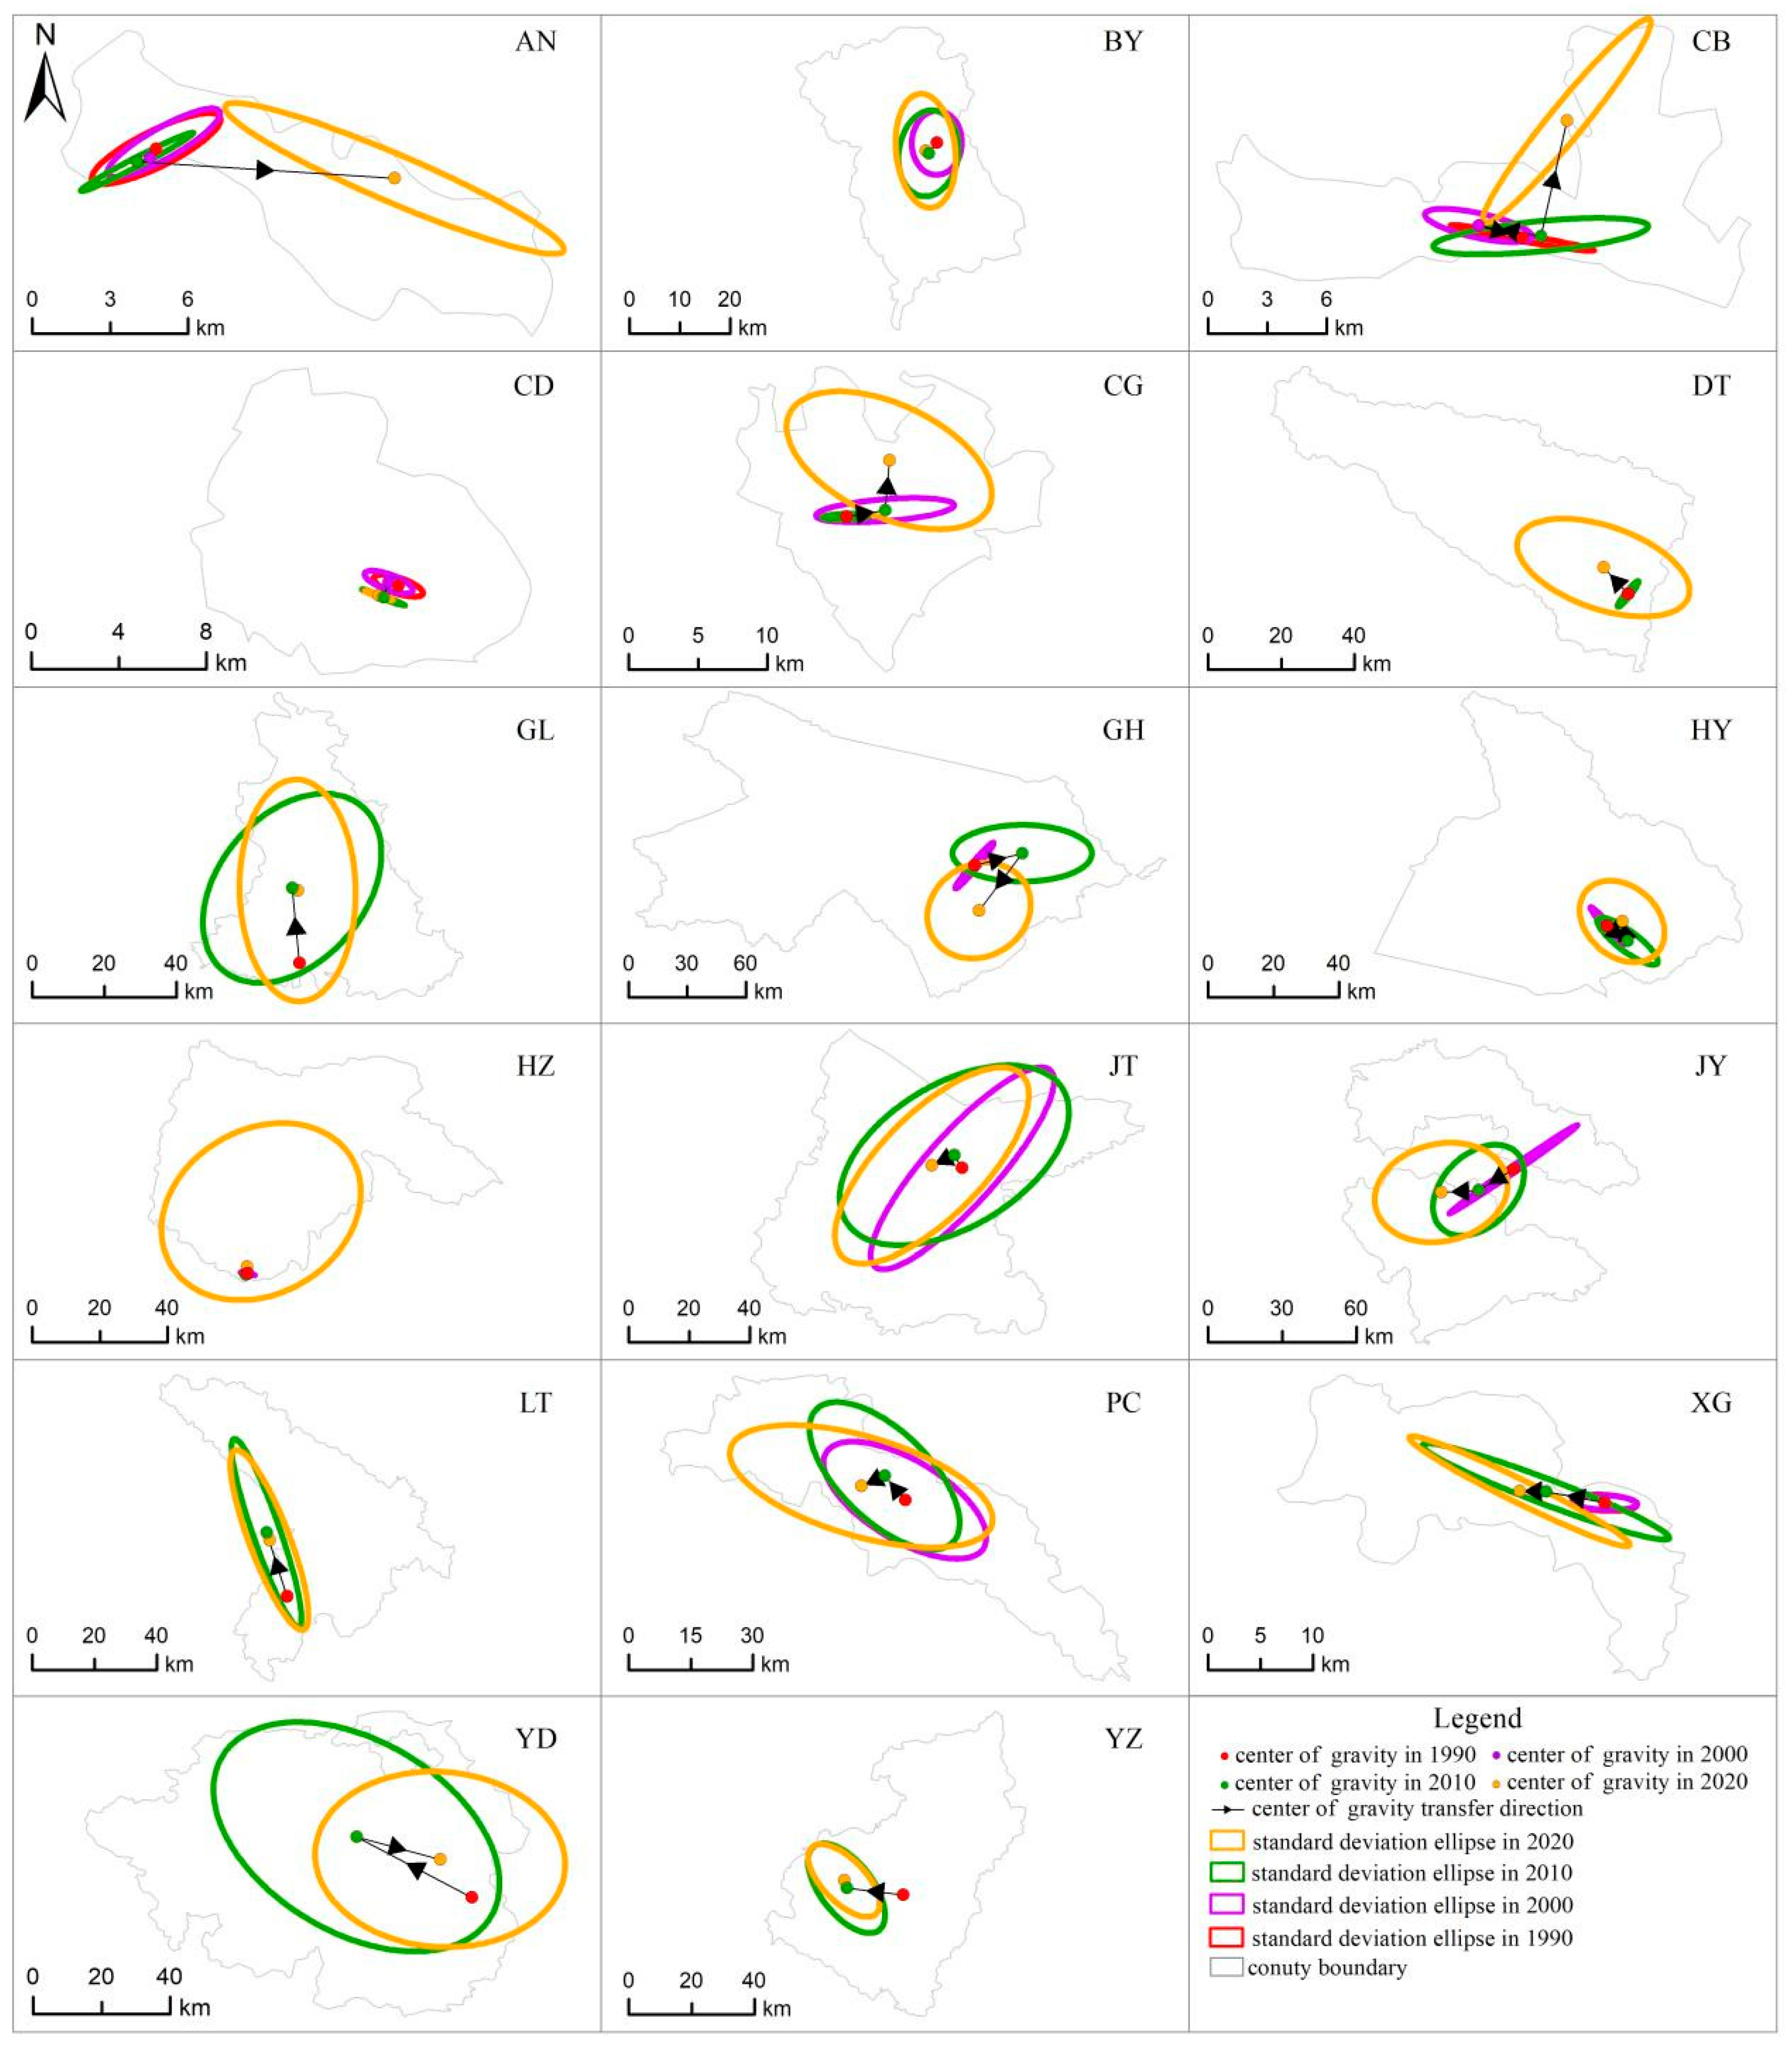
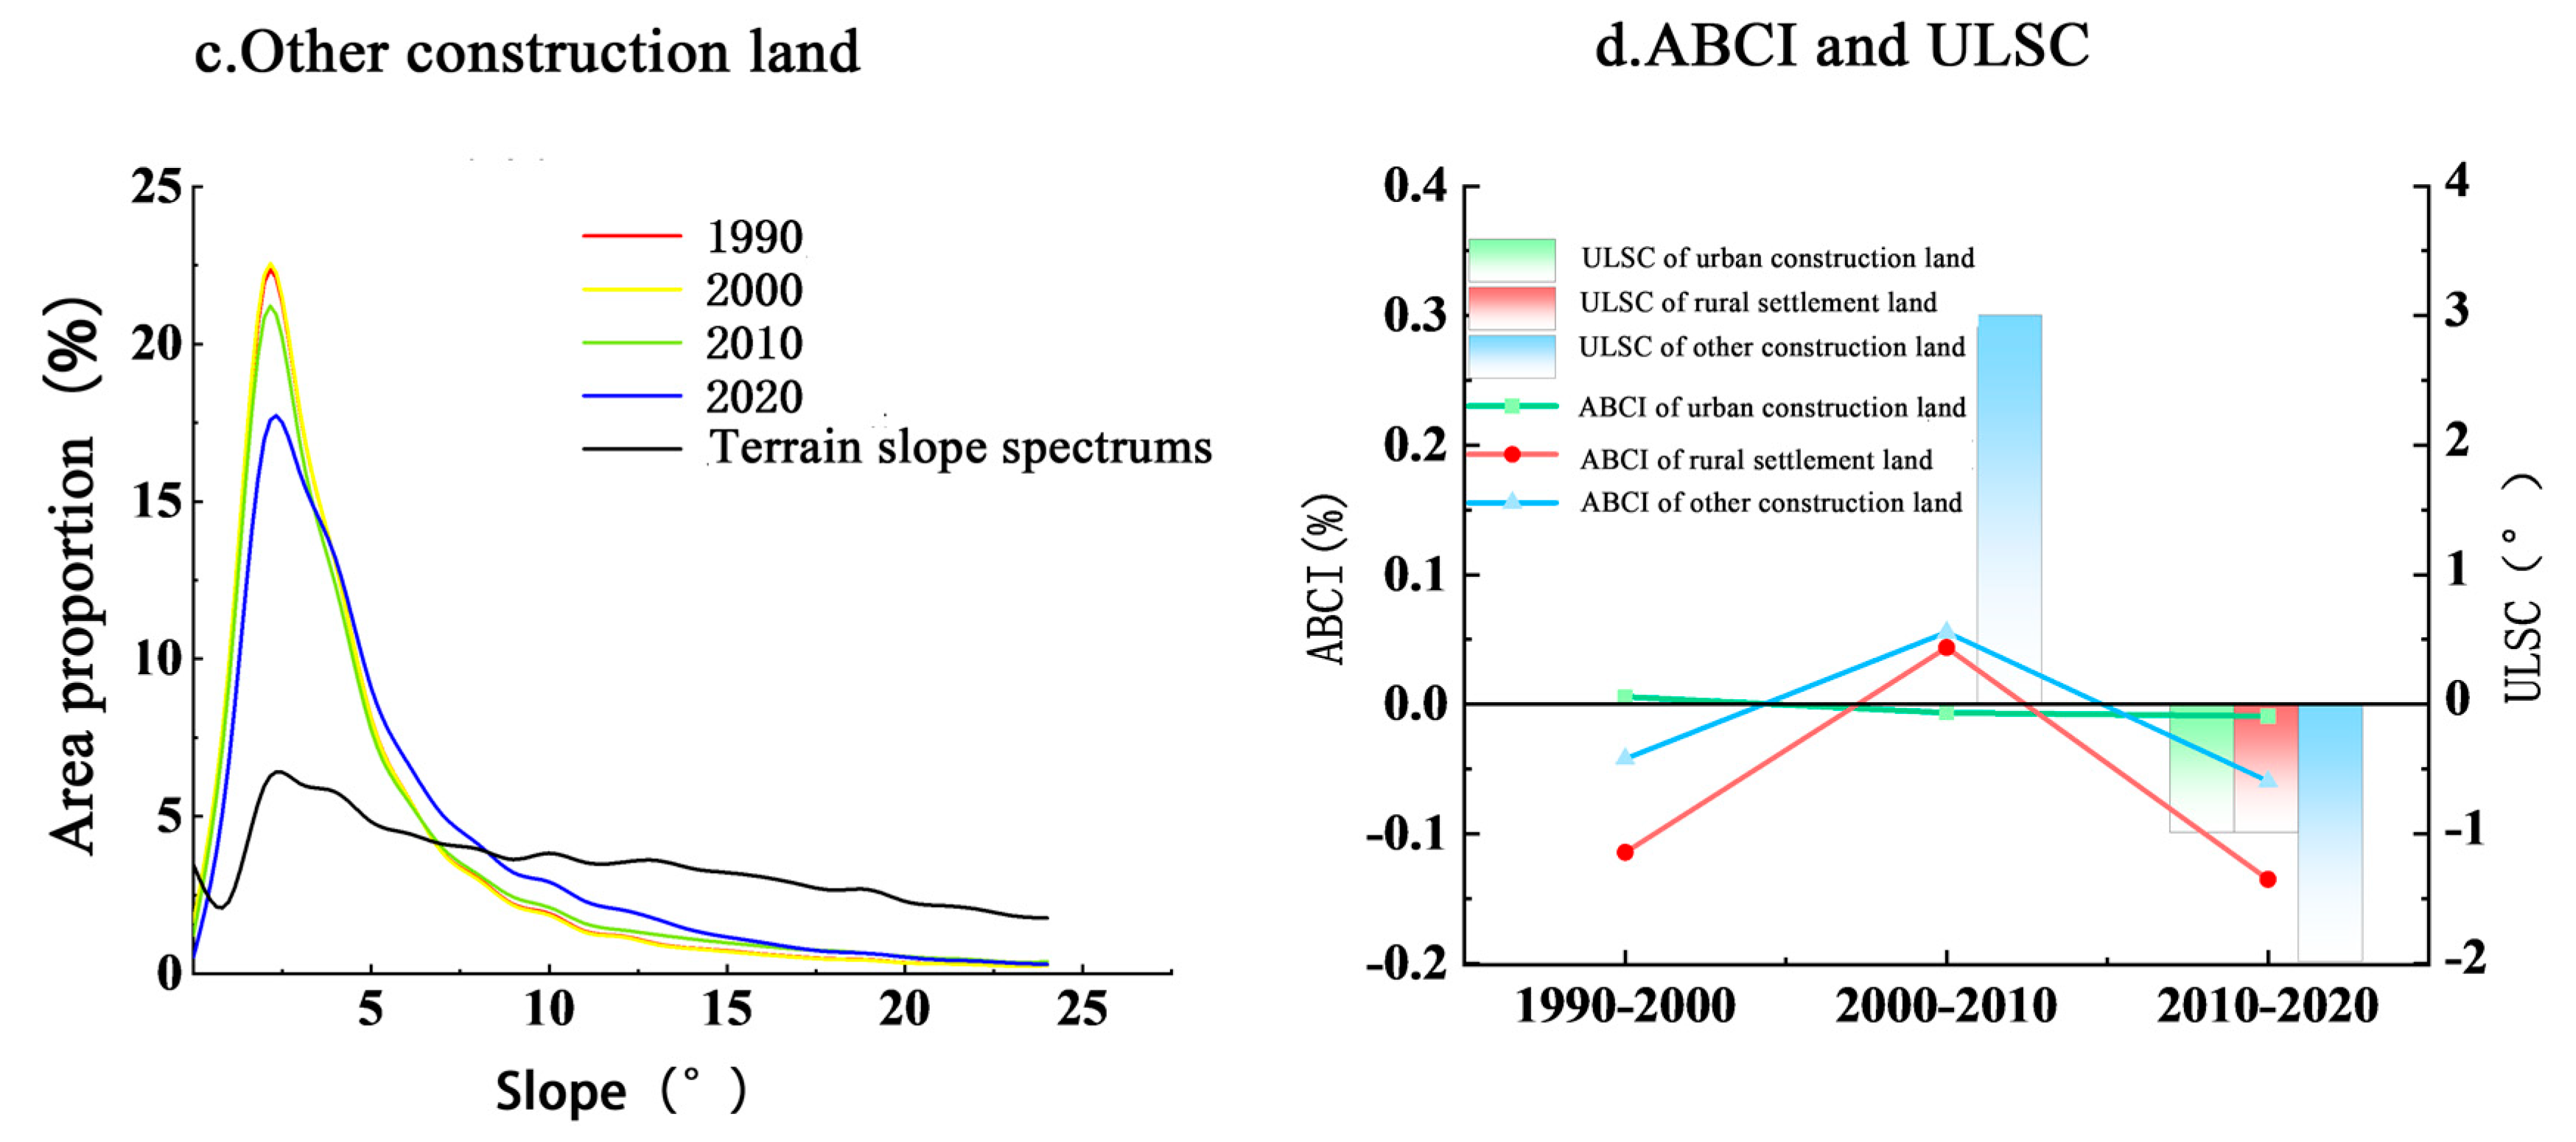
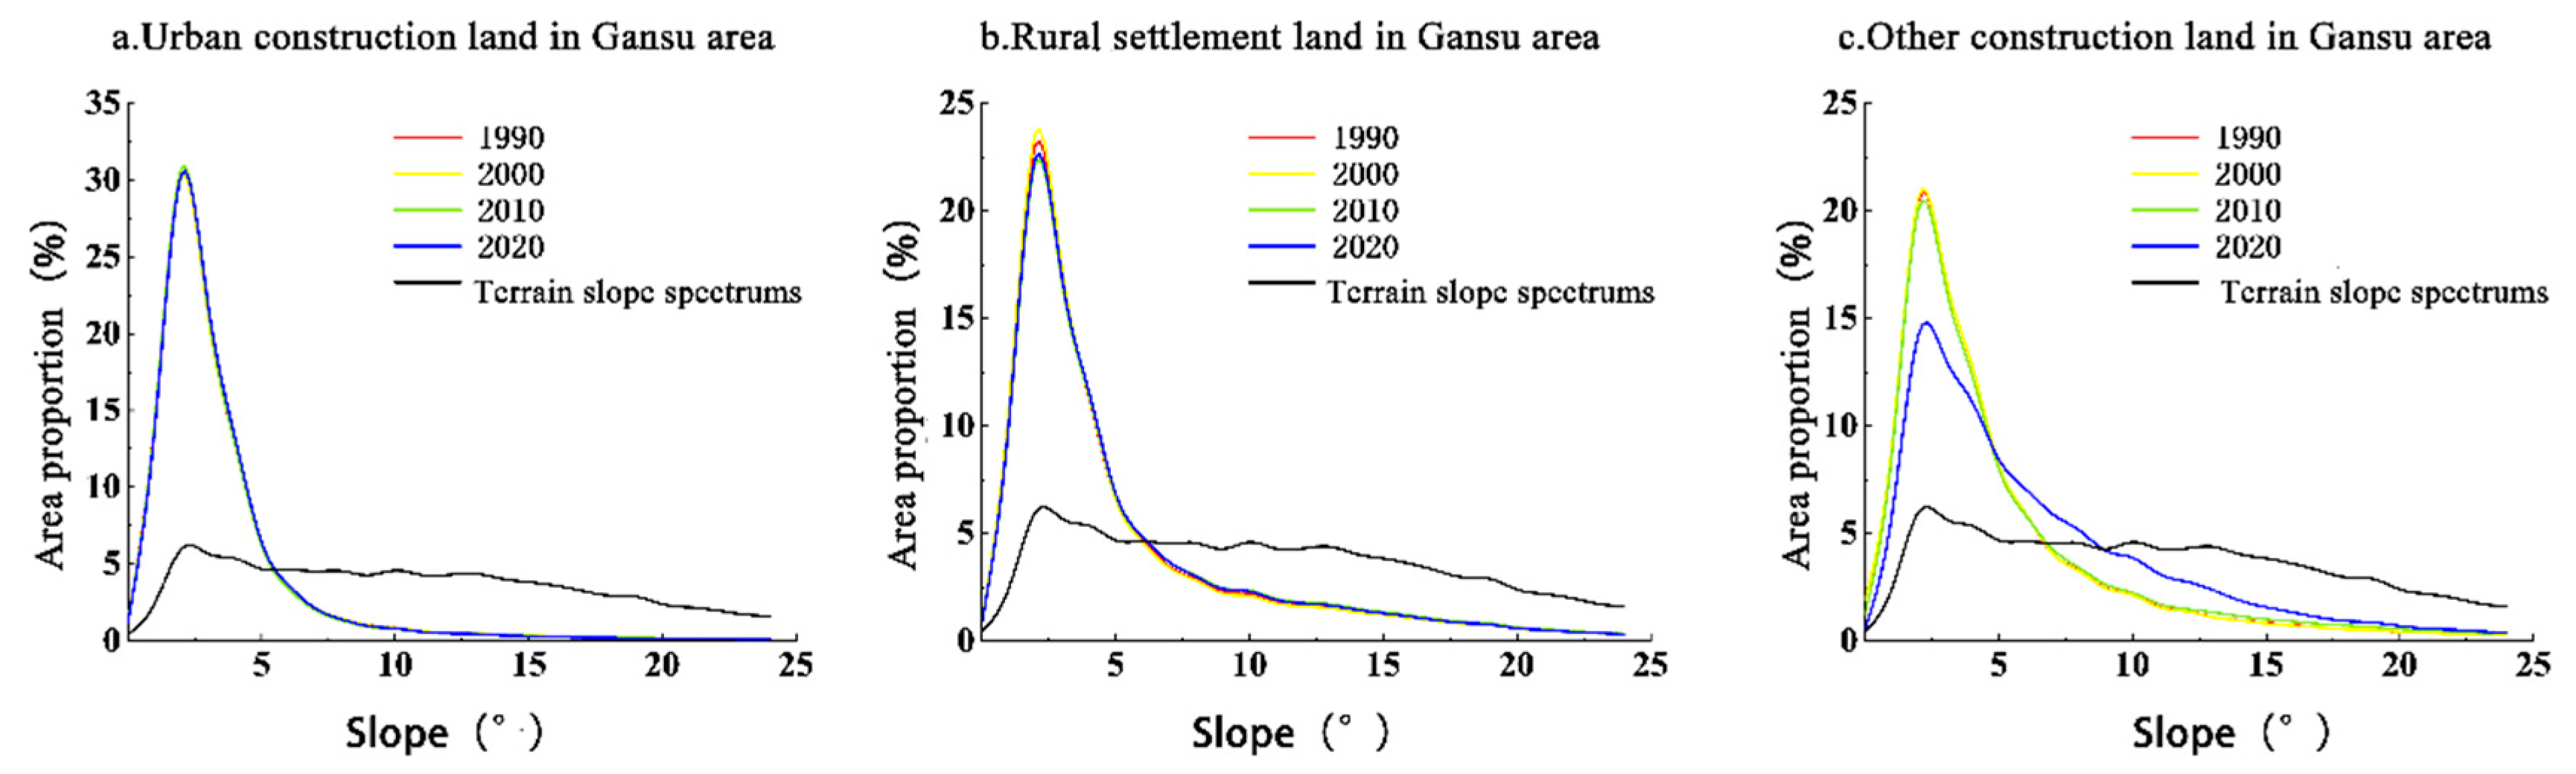
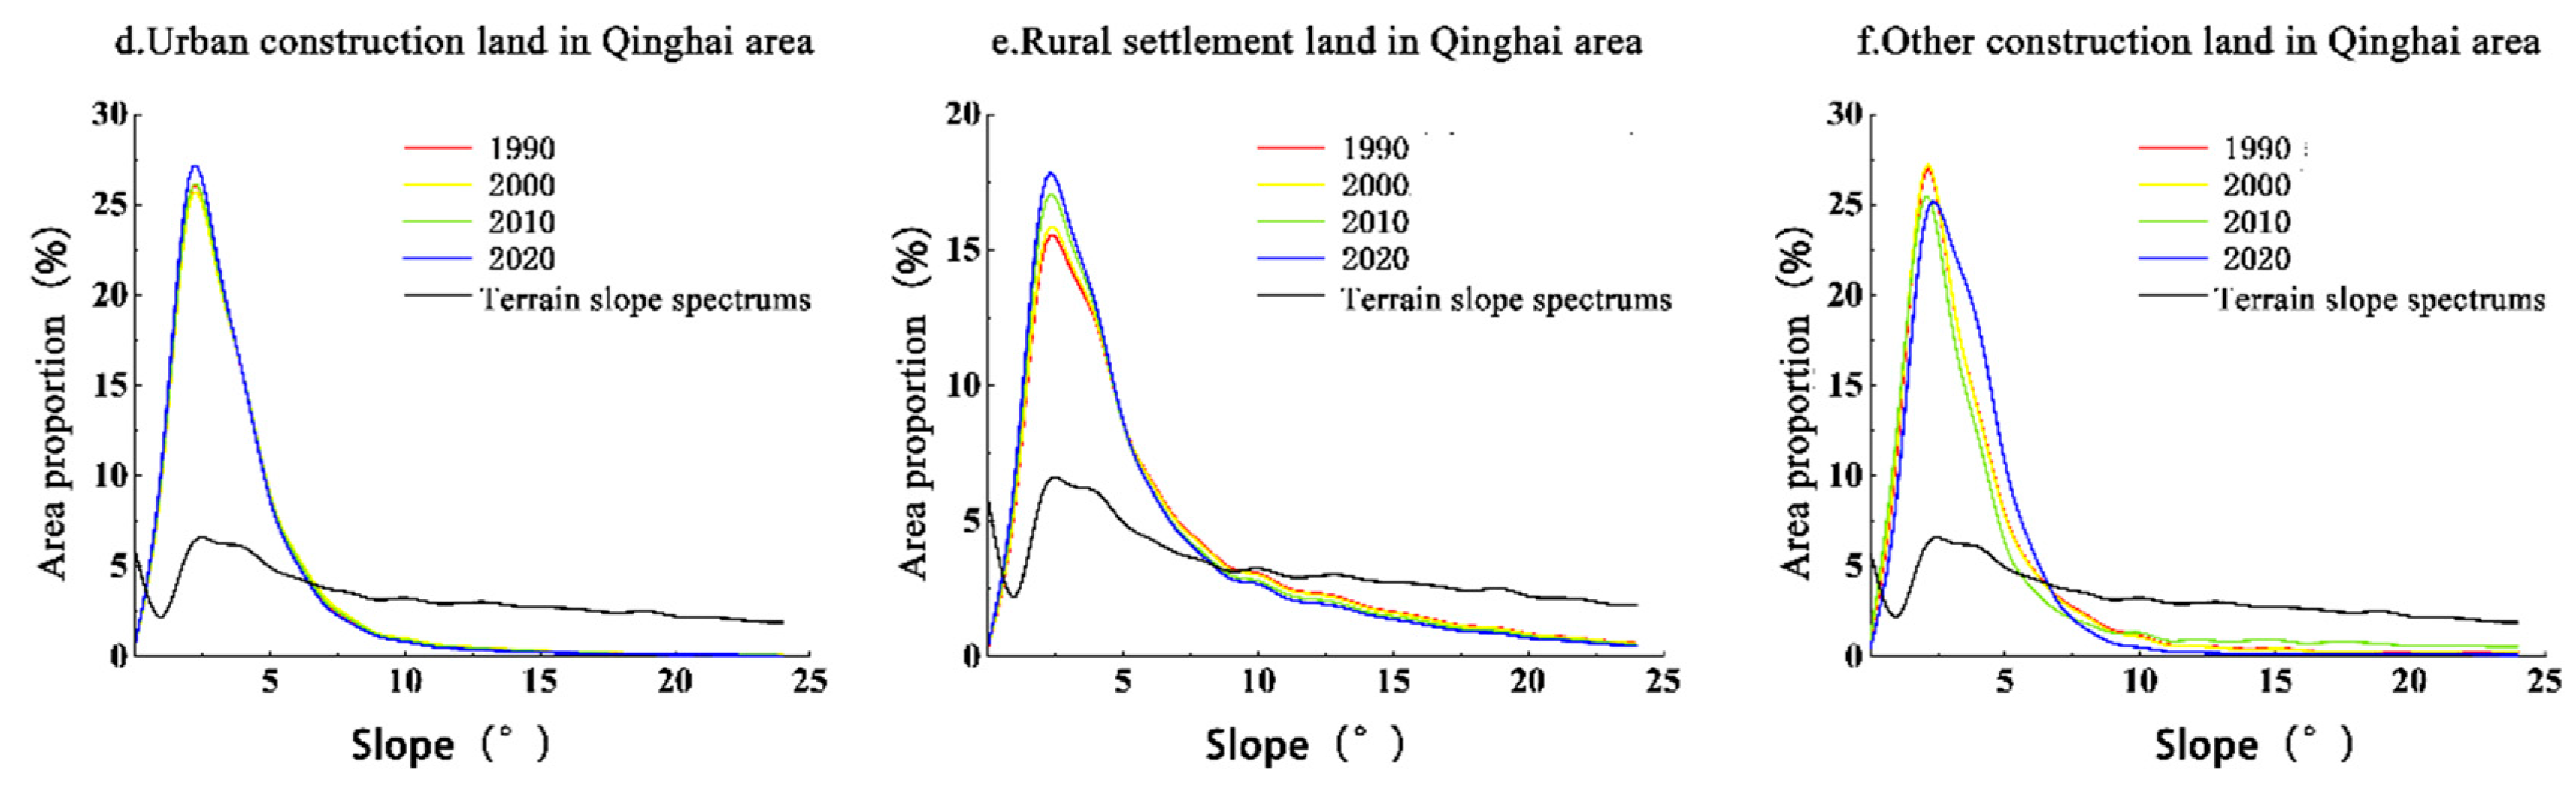
3.3.2. Slope Spectrum Characteristics of Construction Land at the Provincial Tract Scale

Due to their different physical-geographical conditions and regional development stages, the slope spectrum distribution characteristics and the degree of climbing changes of construction land in the Gansu and Qinghai zones also differed (Figure 11). The areal proportions of urban construction land and rural settlement land distributed in the dominant area in 2020 did not differ excessively between the two zones, while 95.84% of other construction land in the Qinghai zone was distributed in the dominant area and only 71.45% was distributed in the Gansu zone. With time, the peak of the slope spectrum of construction land in the Gansu area showed a decreasing trend and moved toward the inferior area (Figure 11a,b), and the peak of other construction land decreased the most, reaching 6.23% (Figure 11c); that is, the rural residential land and other construction land in the Gansu area gradually climbed toward the inferior area. The peaks of the spectra of urban construction land and rural residential land in the Qinghai area both showed increasing trends (Figure 11d,e), while the spectral peak of other construction land decreased and moved toward the inferior area (Figure 11f).
The average slope climbing index (ABCI) values of construction land within different slices of the LXUA all showed fluctuating trends over time, and the upper-limit slope values mostly decreased over time (Figure 12). The upper-limit slope of urban construction land in the Gansu area was distributed at approximately 10° (Figure 12a), and the ABCI peaked at 0.04% from 1990 to 2000 (Figure 12b), indicating a small slope-climbing phenomenon in urban construction land. The upper-limit slope of rural settlement land was distributed at approximately 17° and did not change over time. The ABCI peaked at 0.26% from 2000 to 2010. The increase in the upper-limit slope value of other construction land was accompanied by an increase in the average slope climbing index, which showed obvious slope-climbing characteristics. The urban construction land in the Qinghai area also developed toward the inferior area from 1990 to 2000 (Figure 12a,b) and maintained low slope-level expansion after 2000. From 2000 to 2010, rural settlement land showed a slow climbing phenomenon, while other construction land climbed more drastically, with ULS growth as high as 9° and an ABCI index value as high as 1.04%. These findings are closely related to the large-scale urban and rural construction implemented after the proposal of the “Western Development” strategy. The construction land-use methods of “building up on the mountains” and “cutting the mountains for development” became important means for alleviating land shortages during this period.

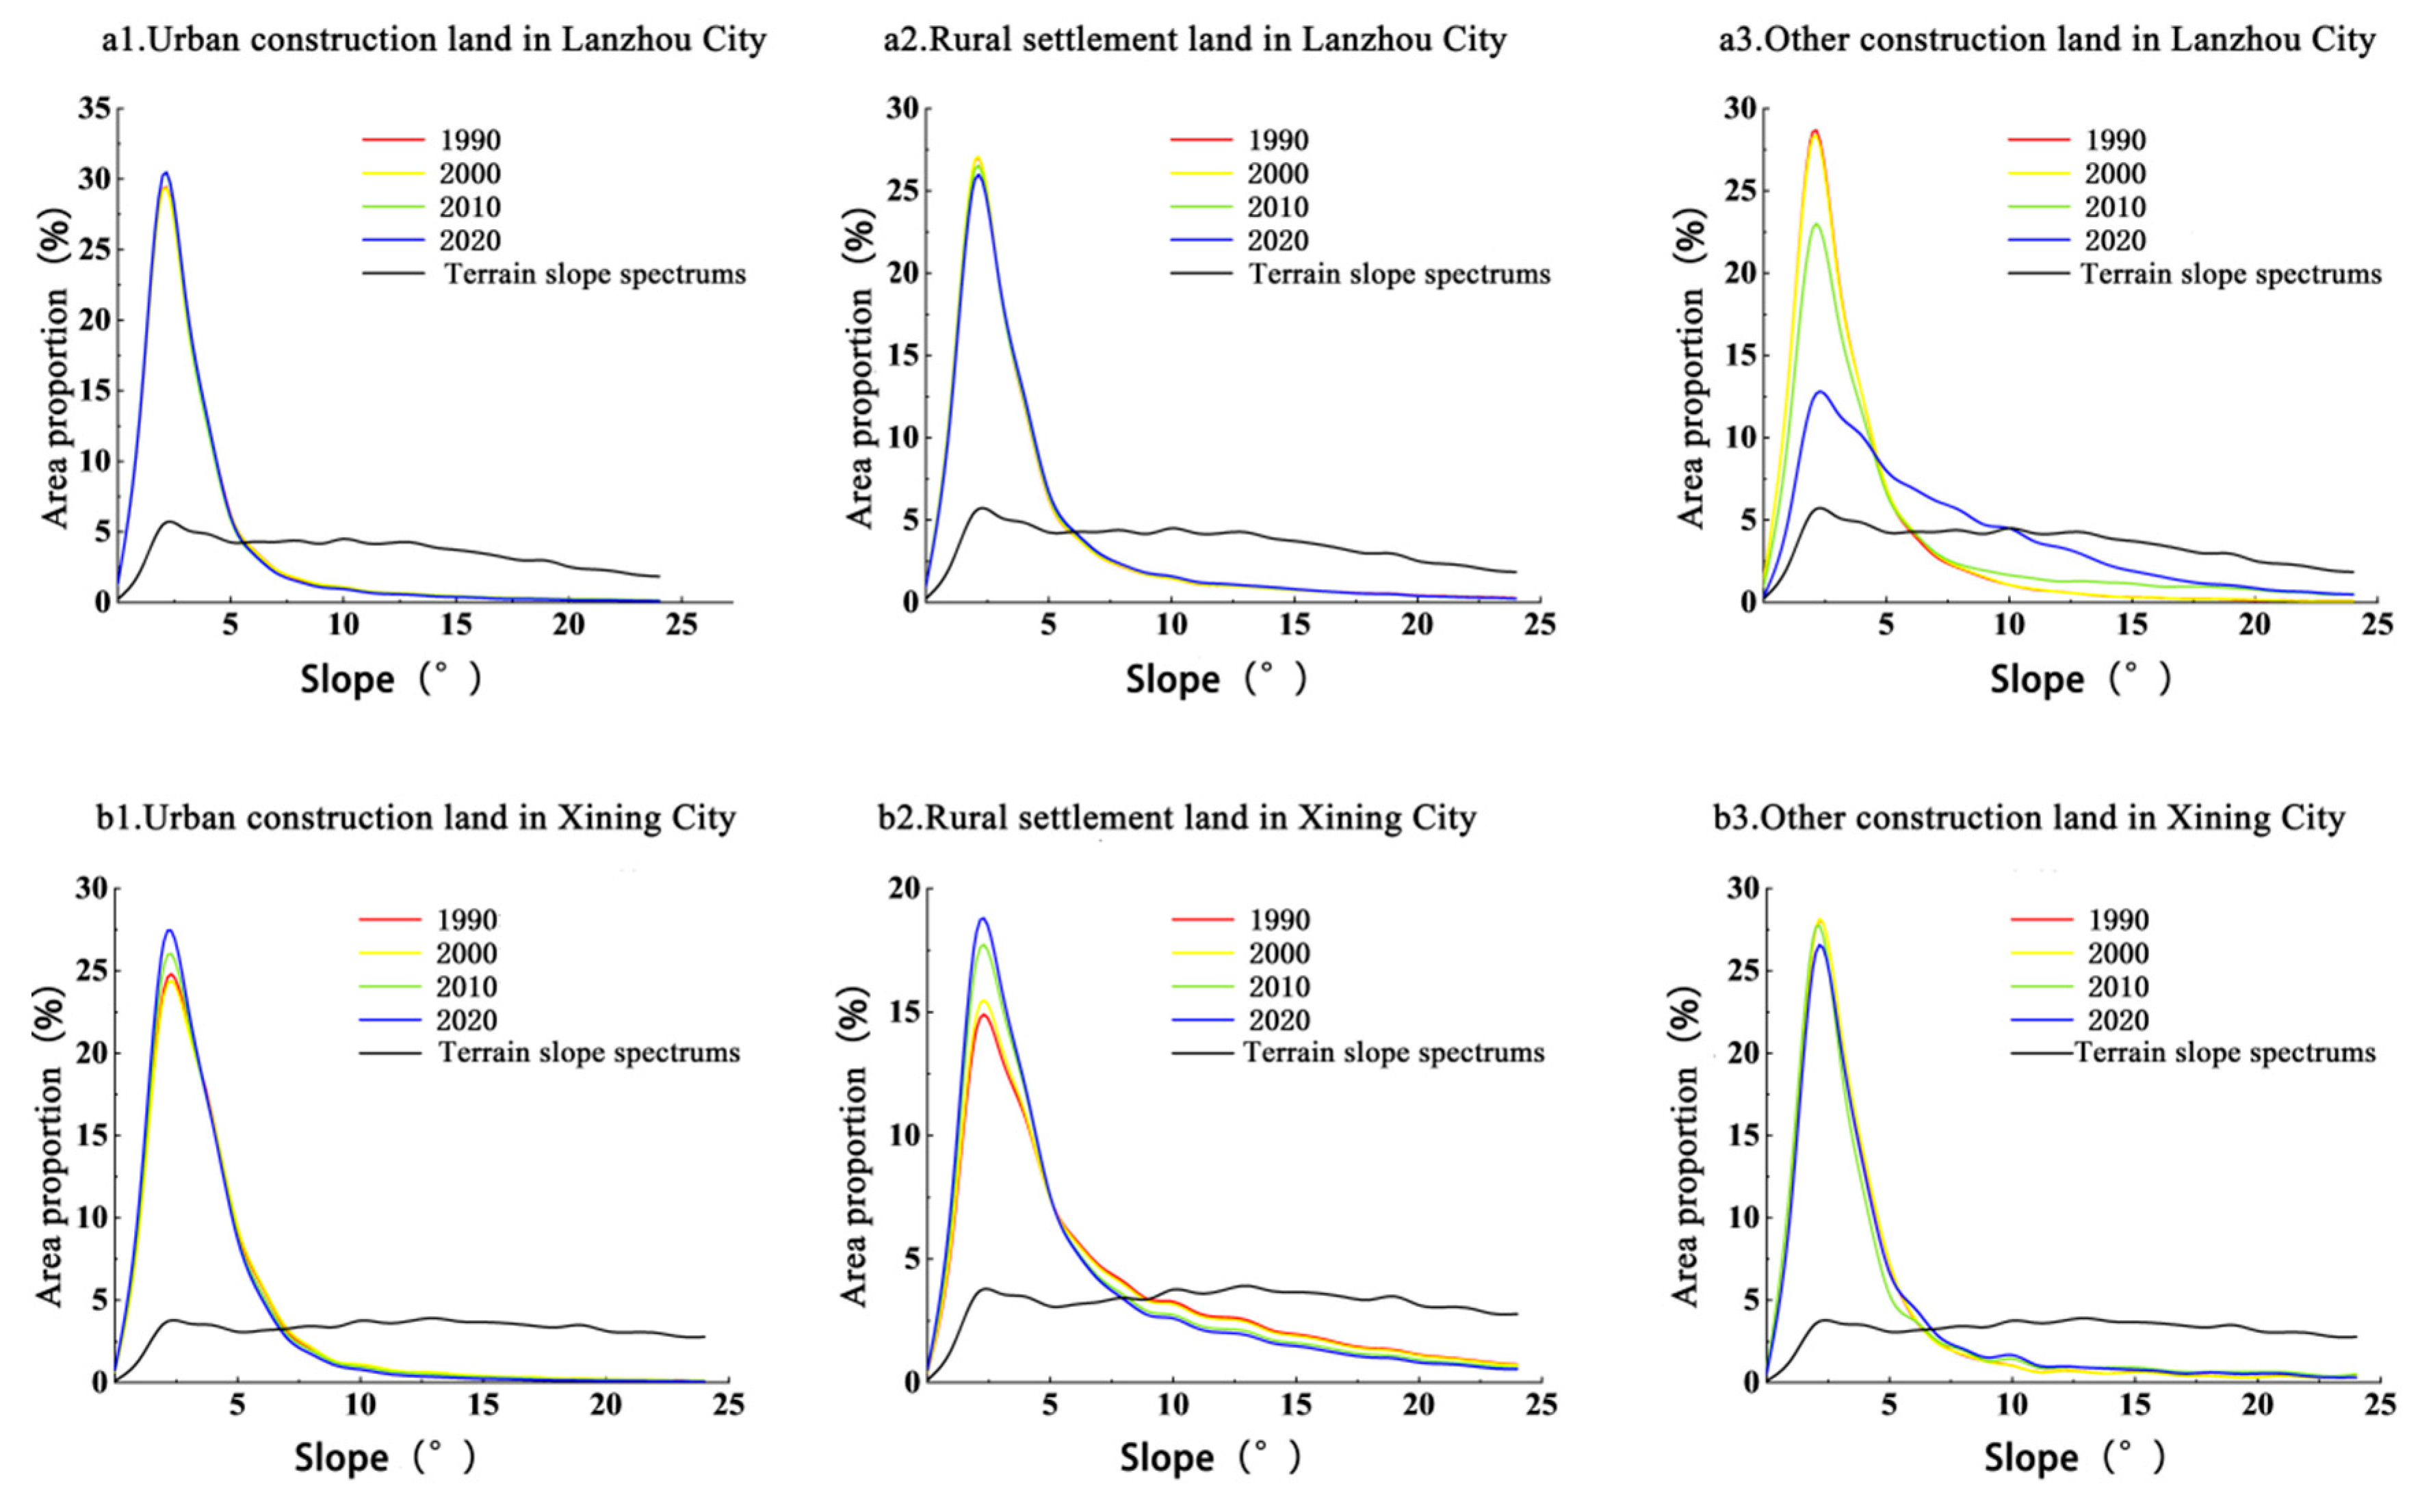
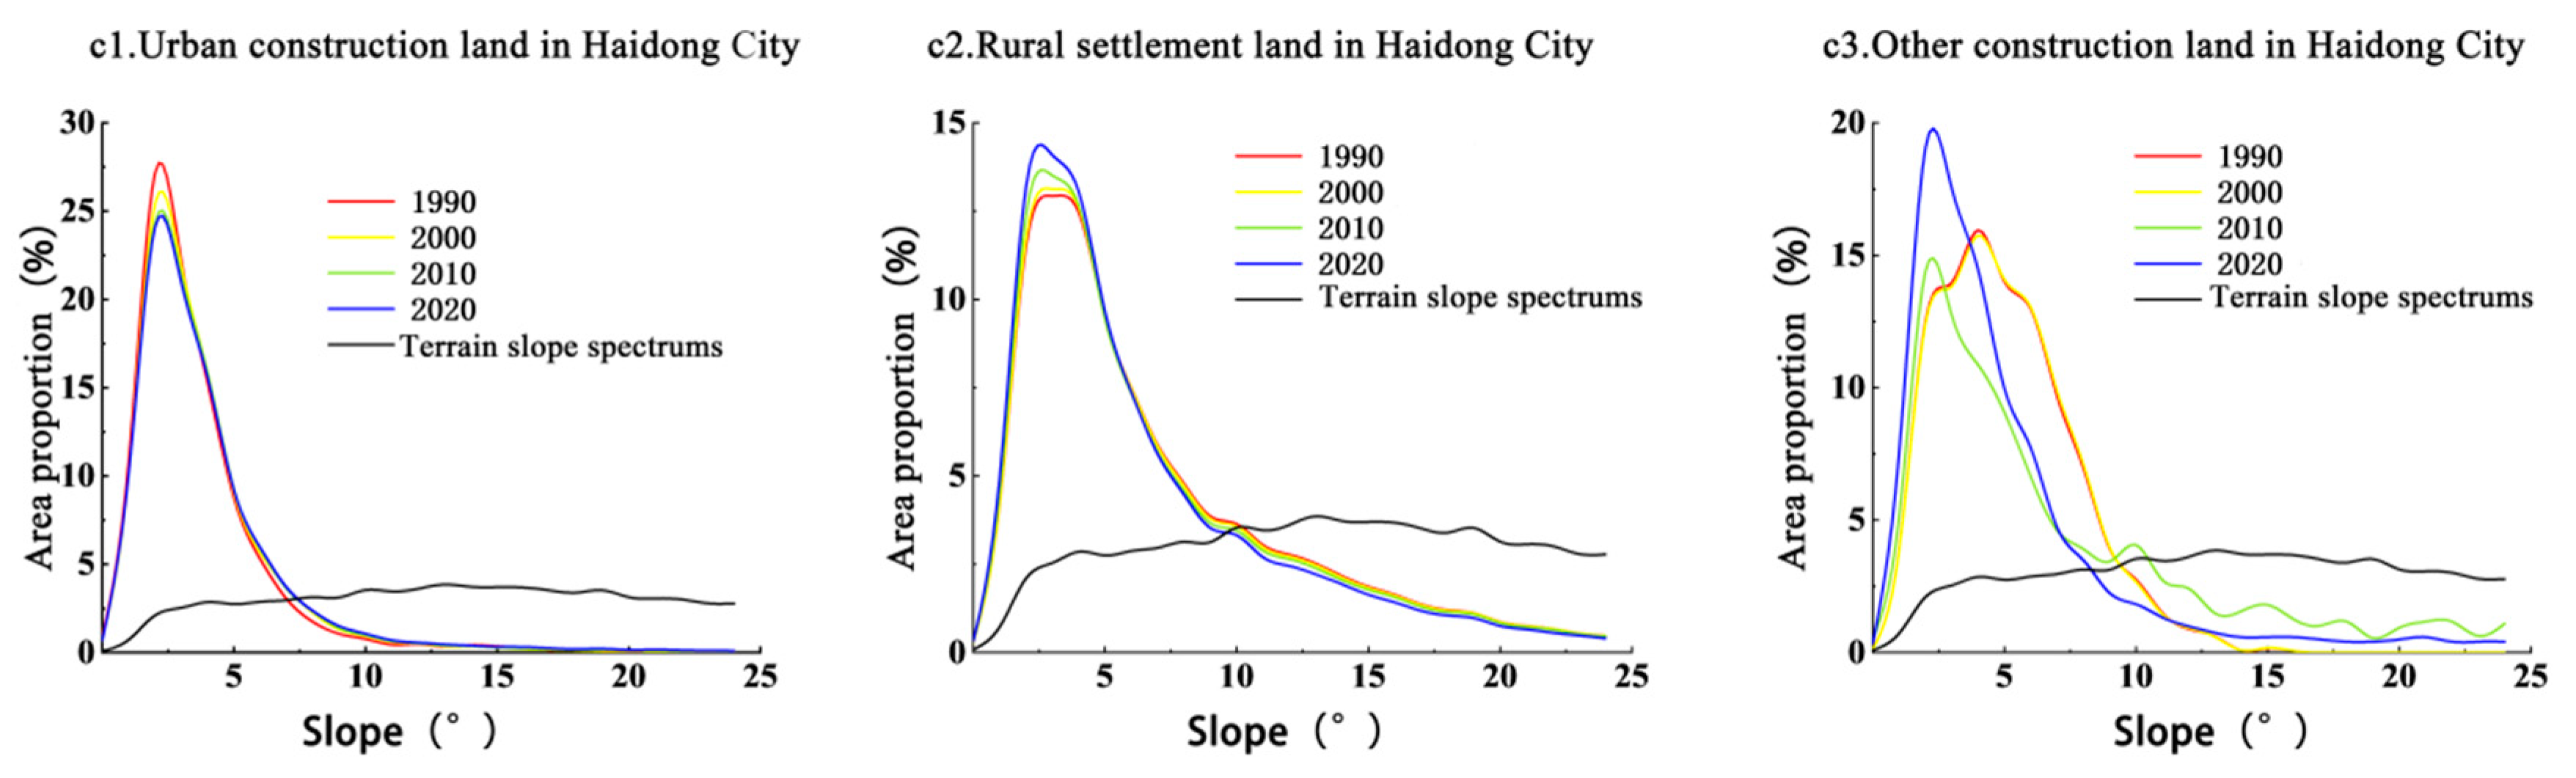
3.3.3. Characteristics of the Construction Land Slope Spectra of Typical Cities

Due to the influence of the natural conditions, the slope spectra of construction land in the three cities differed, and obvious differences in the spatial distributions of the slopes were also observed. By analyzing the slope-spectrum distribution characteristics of construction land in the three cities between 1990 and 2020, we found (Figure 13) that the overall proportion of the three types of construction land distributed in the dominant area in Lanzhou city was approximately 85%. With the passage of time, the proportion of urban construction land in the dominant area gradually increased, and the spectrum peak rose by 1% during the study period, indicating that the urban construction land area expanded in the dominant area (Figure 13(a1)). The proportions of rural settlement land and other construction land in the inferior area gradually increased, and the greatest increase occurred between 2000 and 2010, at 0.74%. The proportions of rural residential land and other construction land in the disadvantaged area gradually increased, with the largest increases of 0.74% and 13.26% between 2000 and 2010, and the spectral peaks both decreased, indicating that rural residential land and other construction land gradually climbed toward the disadvantaged area (Figure 13(b1,c)). The spectral peaks of urban construction land and rural settlement land in Xining City increased during the study period, indicating the expansion of these land types in the dominant area (Figure 13(a2,c)), and significant changes in the distribution of rural settlement land were observed between 2000 and 2010, with the proportion of the dominant area increasing by 4.78% and the spectral peak increasing by 2.22%. The other construction land area had a tendency to climb toward the inferior area (Figure 13(b2)). The spectrum of urban construction land in Haidong City showed a decreasing trend (Figure 13(a3)), with the largest decrease of 1.75% occurring between 1990 and 2000, indicating that urban construction land was climbing toward the inferior area at this time. The slope spectrum of rural settlement land shows a inverted-“U” distribution (Figure 13(b3)), and the spectrum peak was increasing annually; the proportion of land in the superior area was increasing by 4.78%, and the spectrum peak was increasing by 2.22%. The slope spectra of other construction sites exhibited significantly different characteristics (Figure 13(c3)), with a wide range of slope distributions and fluctuating spectral peaks, reaching a maximum value of 19.04% in 2020.
Our comprehensive analysis of the changes in the average construction land slope index and the upper-limit slope at the typical city scale showed that the upper-limit slopes of urban construction land in Lanzhou and Xining both experienced fluctuating trends of “first increasing and then decreasing” from 1990 to 2020, while the upper-limit slope of urban construction land in Haidong City gradually increased with time (Figure 14). The slope of the upper limit of rural residential land in Lanzhou City did not change over time, while the slopes of the upper limits of rural residential land in Xining City and Haidong City both tended to decrease (Figure 14a). The slopes of the upper limits of other construction land in all three cities fluctuated significantly during the study period, with the largest change occurring between 2000 and 2010. The average slope climbing indices of rural residential land and other construction land in Lanzhou City, of urban construction land and other construction land in Xining City, and of construction land in Haidong City all peaked with positive values from 2000 to 2010, indicating that a significant slope climbing phenomenon of construction land was occurring during this period. The average climbing index of urban construction land in Lanzhou City and other construction land in Haidong City all peaked with positive values from 2000 to 2010, indicating that there was an obvious phenomenon of construction land climbing during this period and that the degree of climbing was intense. In addition, the urban construction land in Lanzhou City also exhibited a low-degree climbing phenomenon from 1990 to 2000, and the rural residential land in Xining City also exhibited this phenomenon from 2010 to 2020.

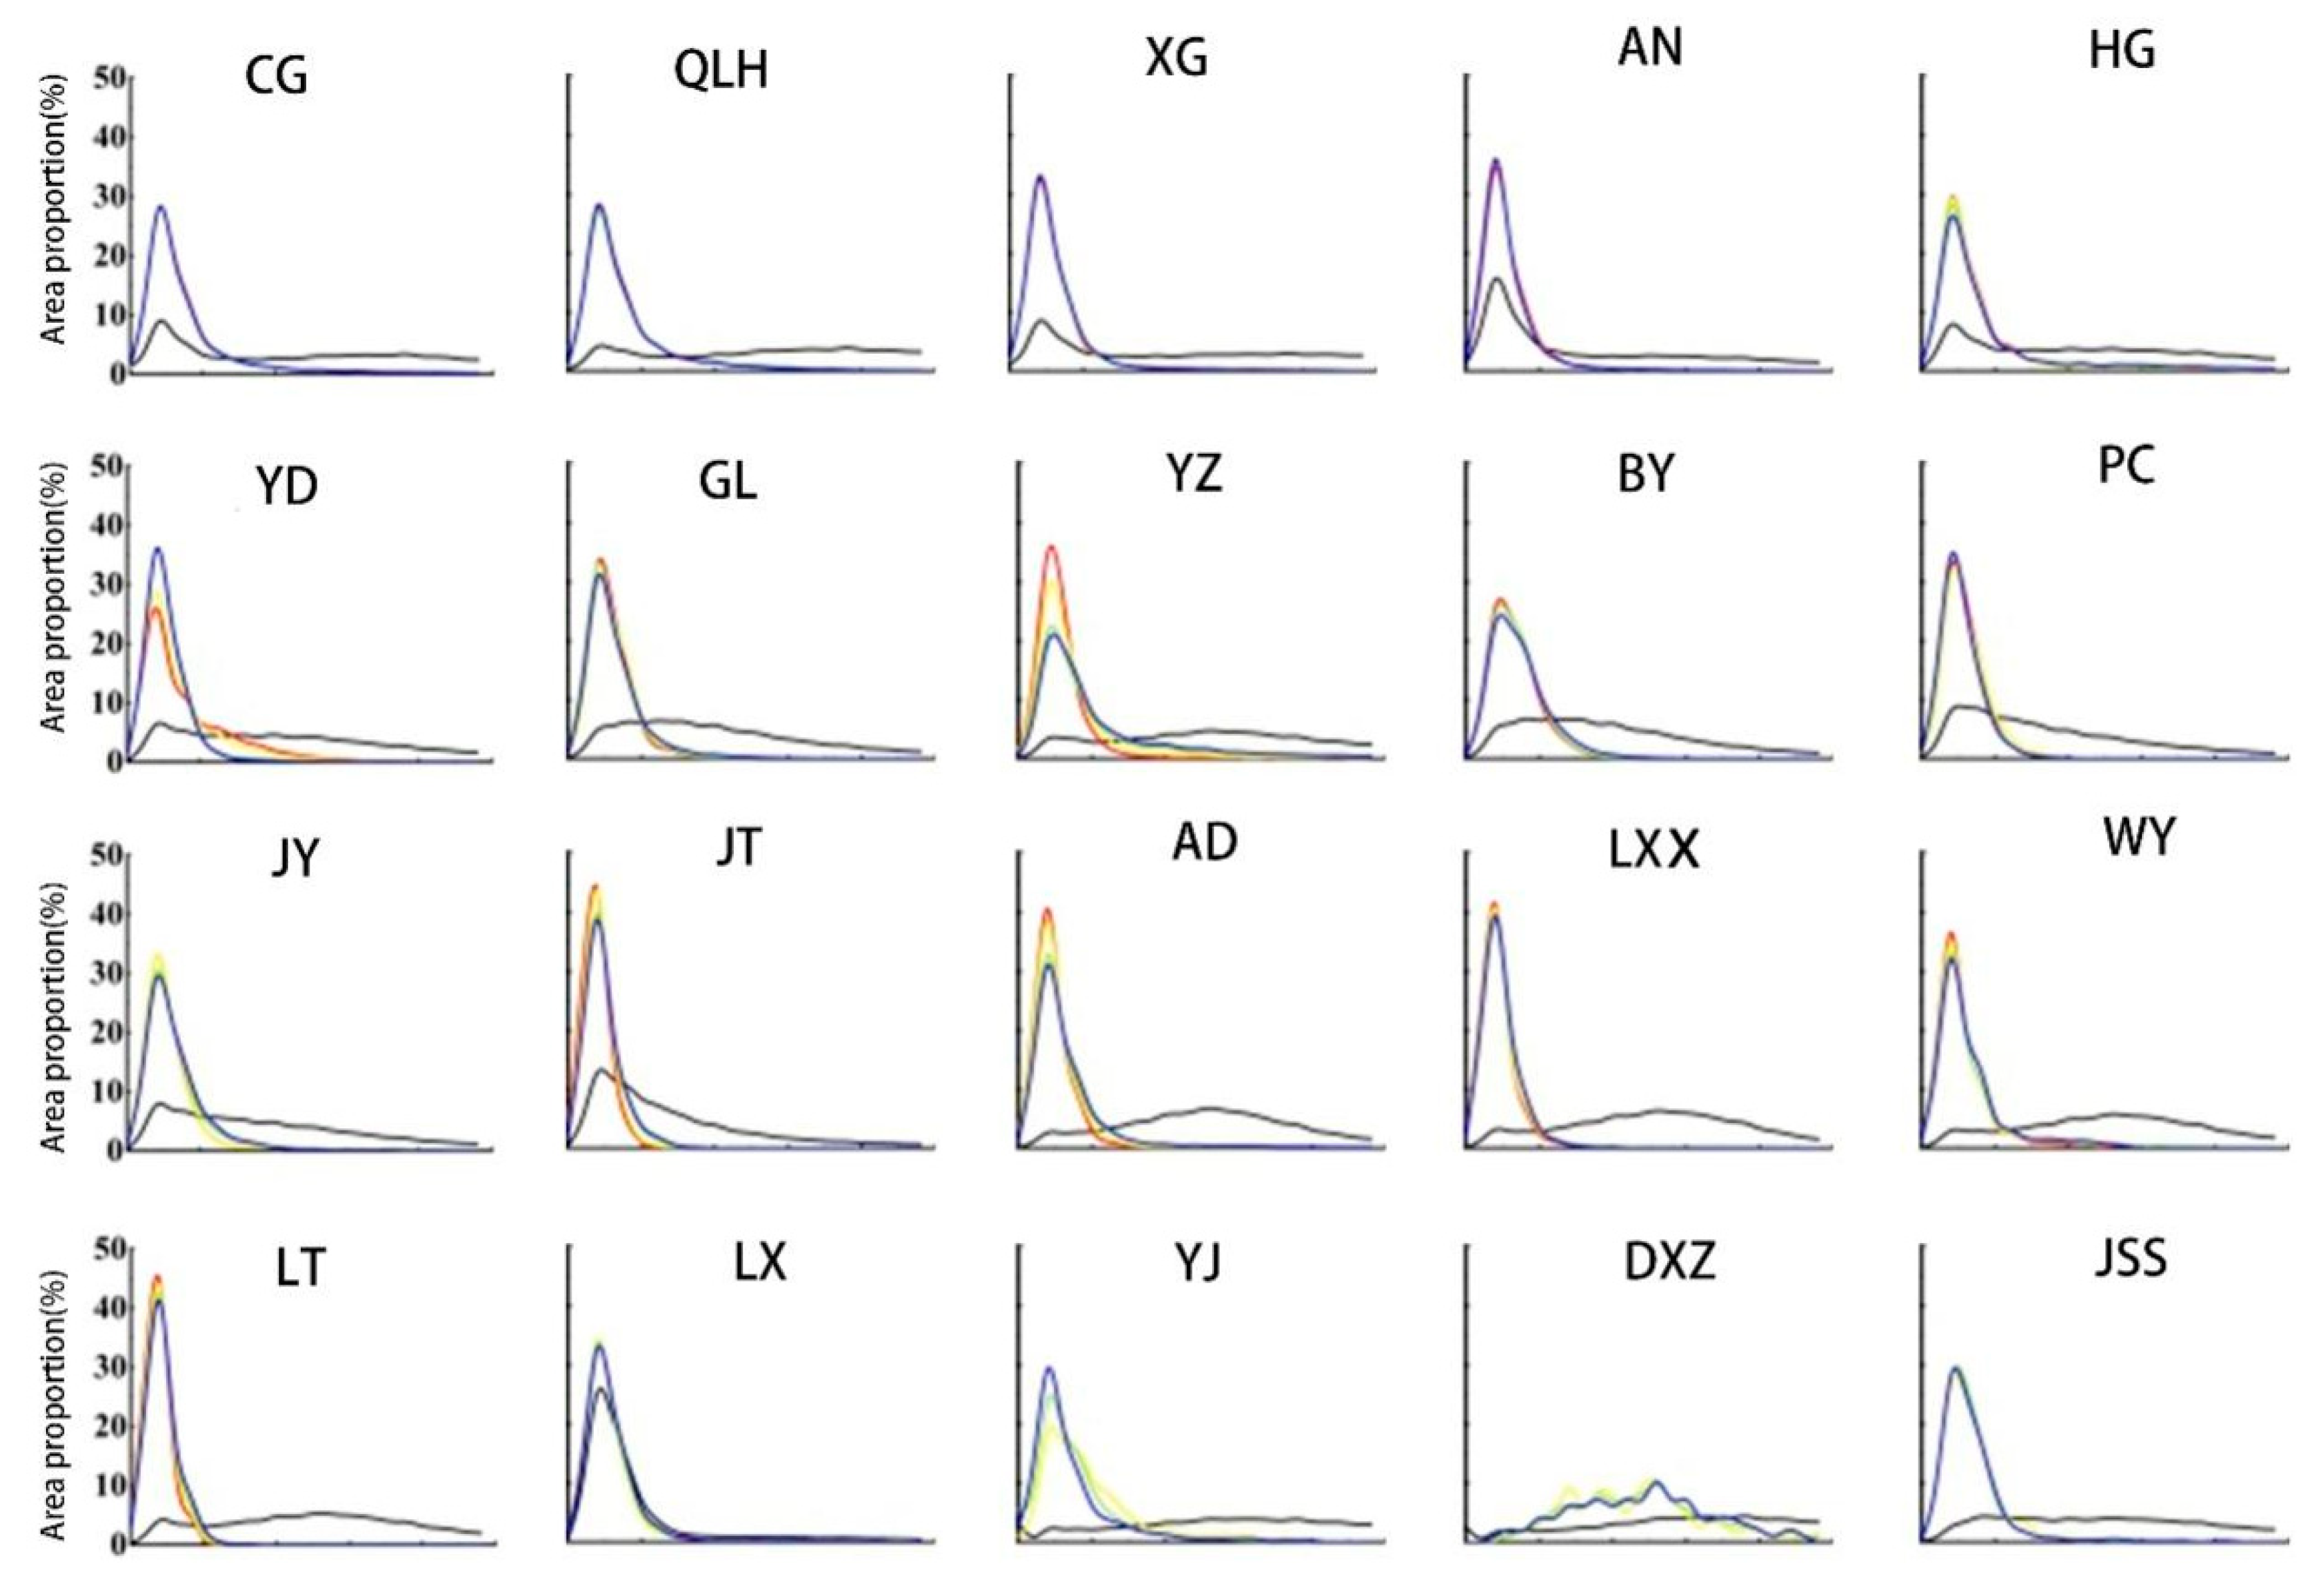
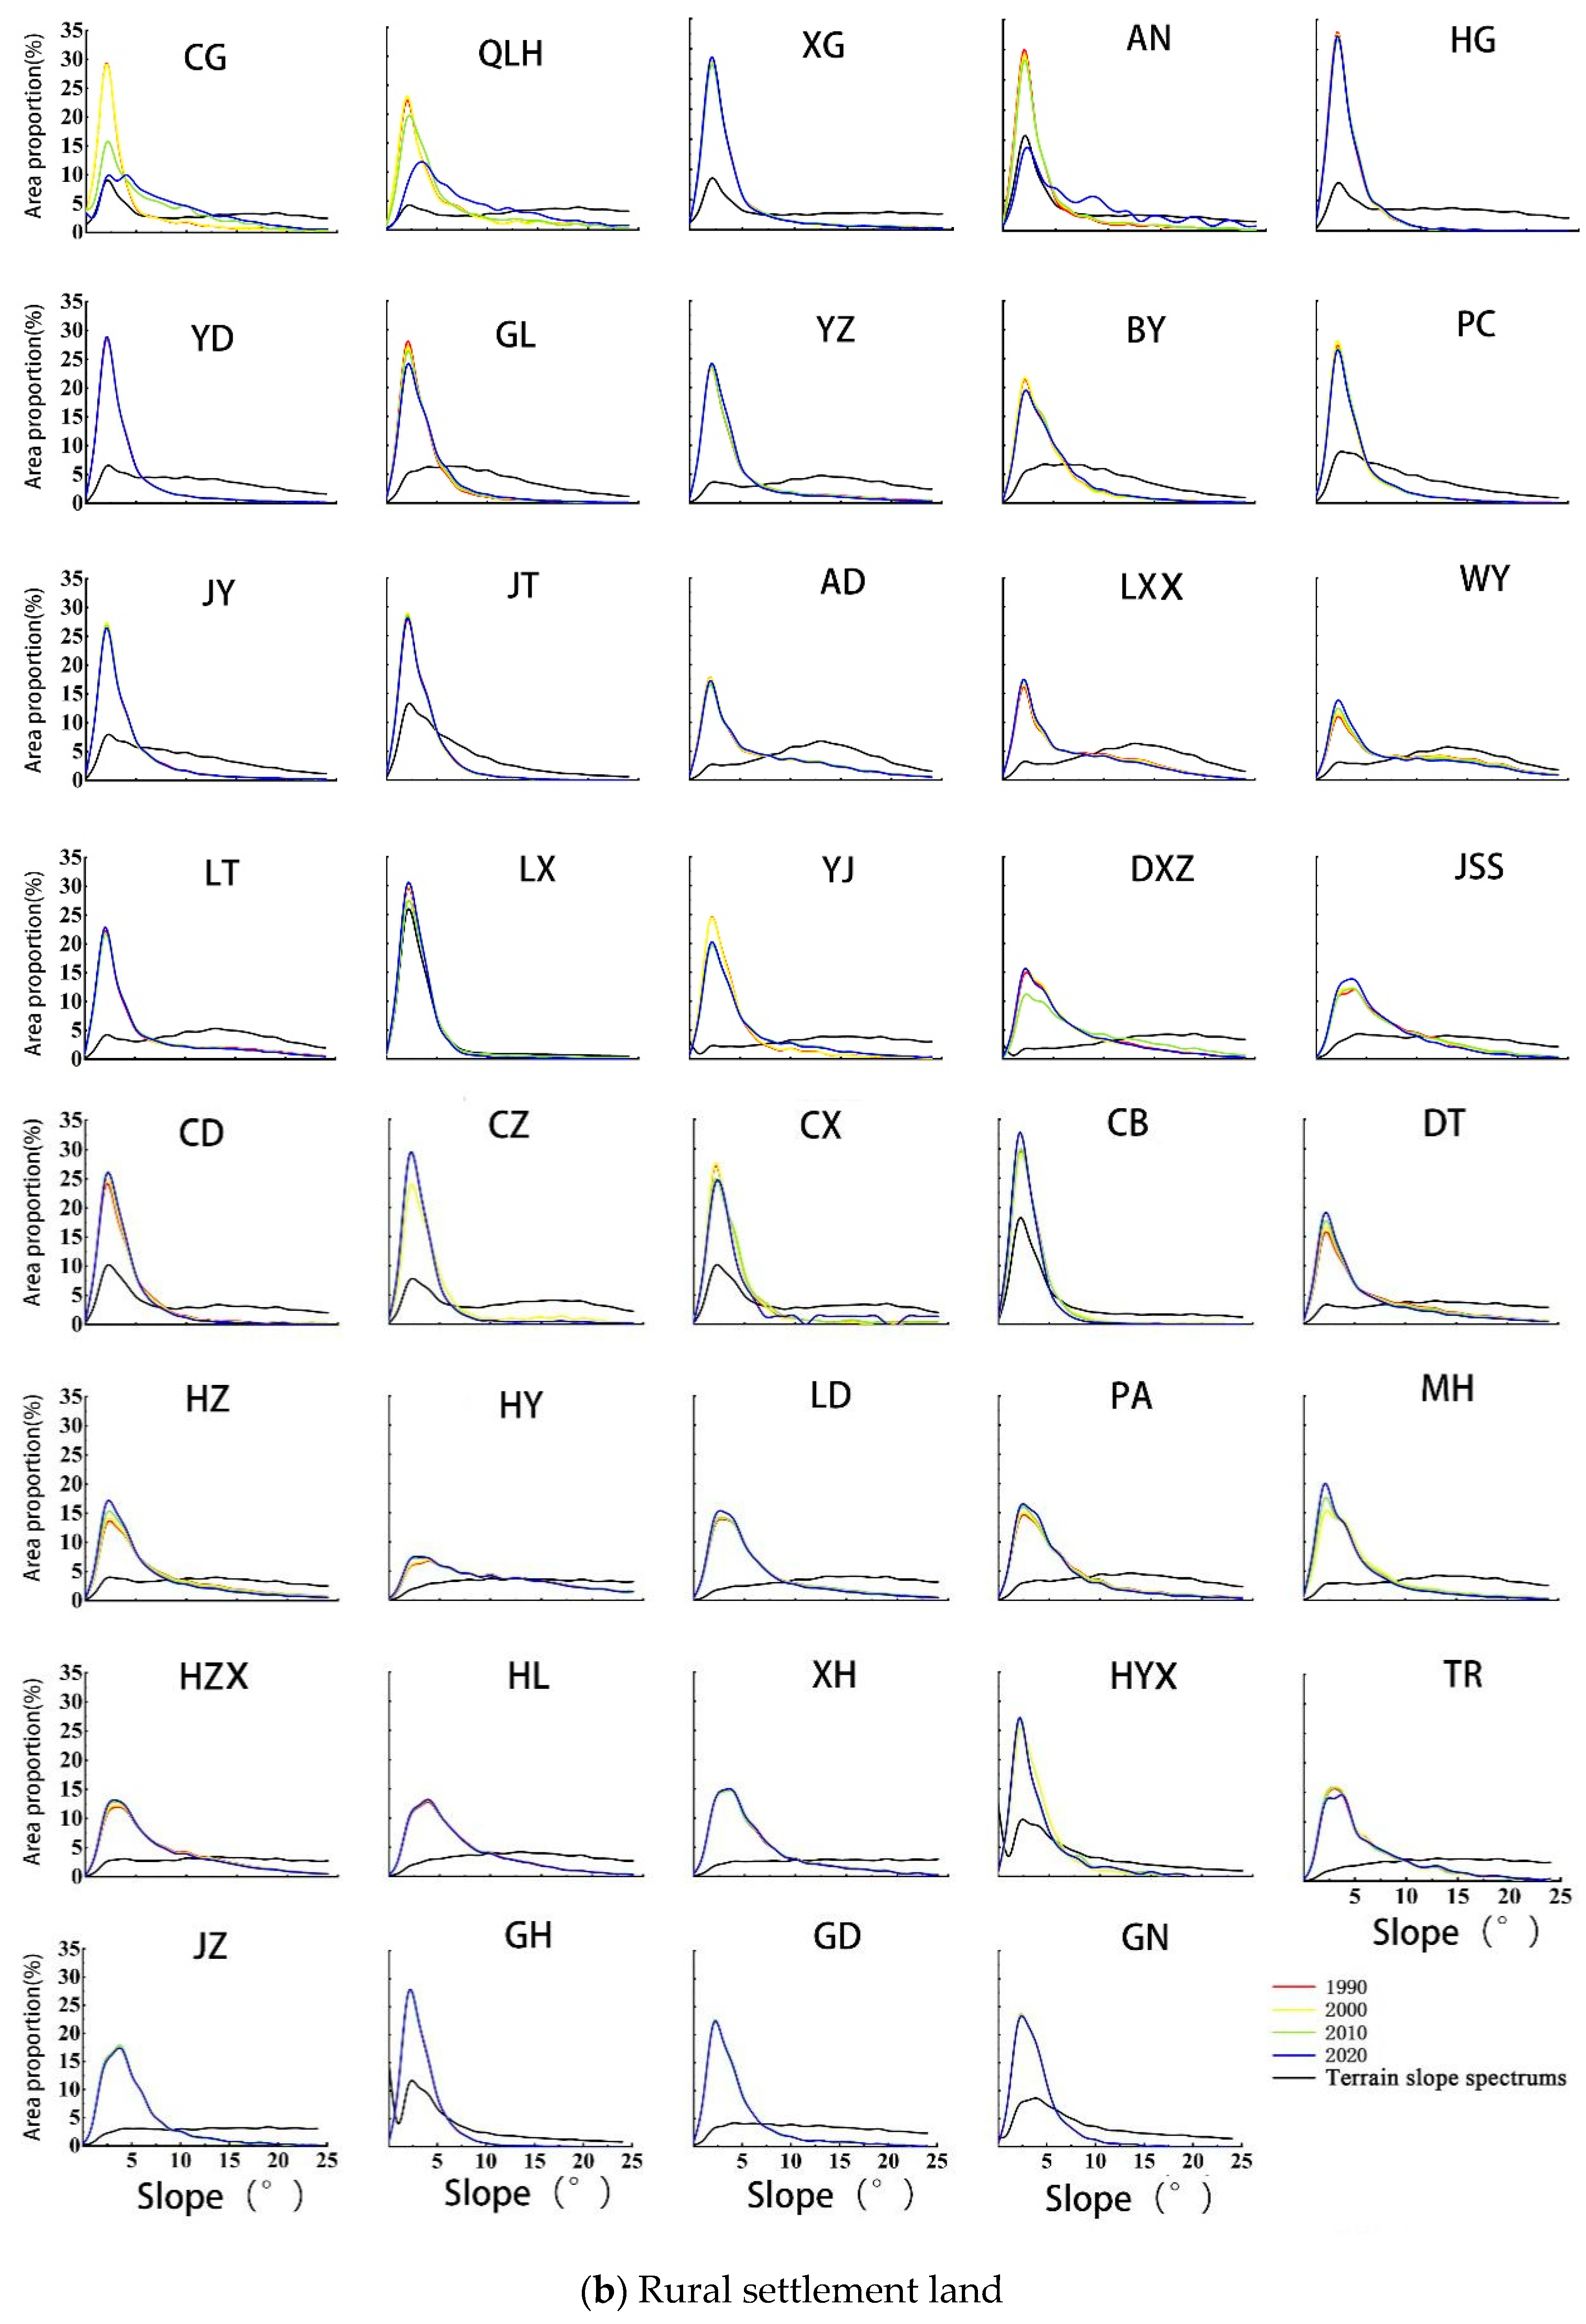
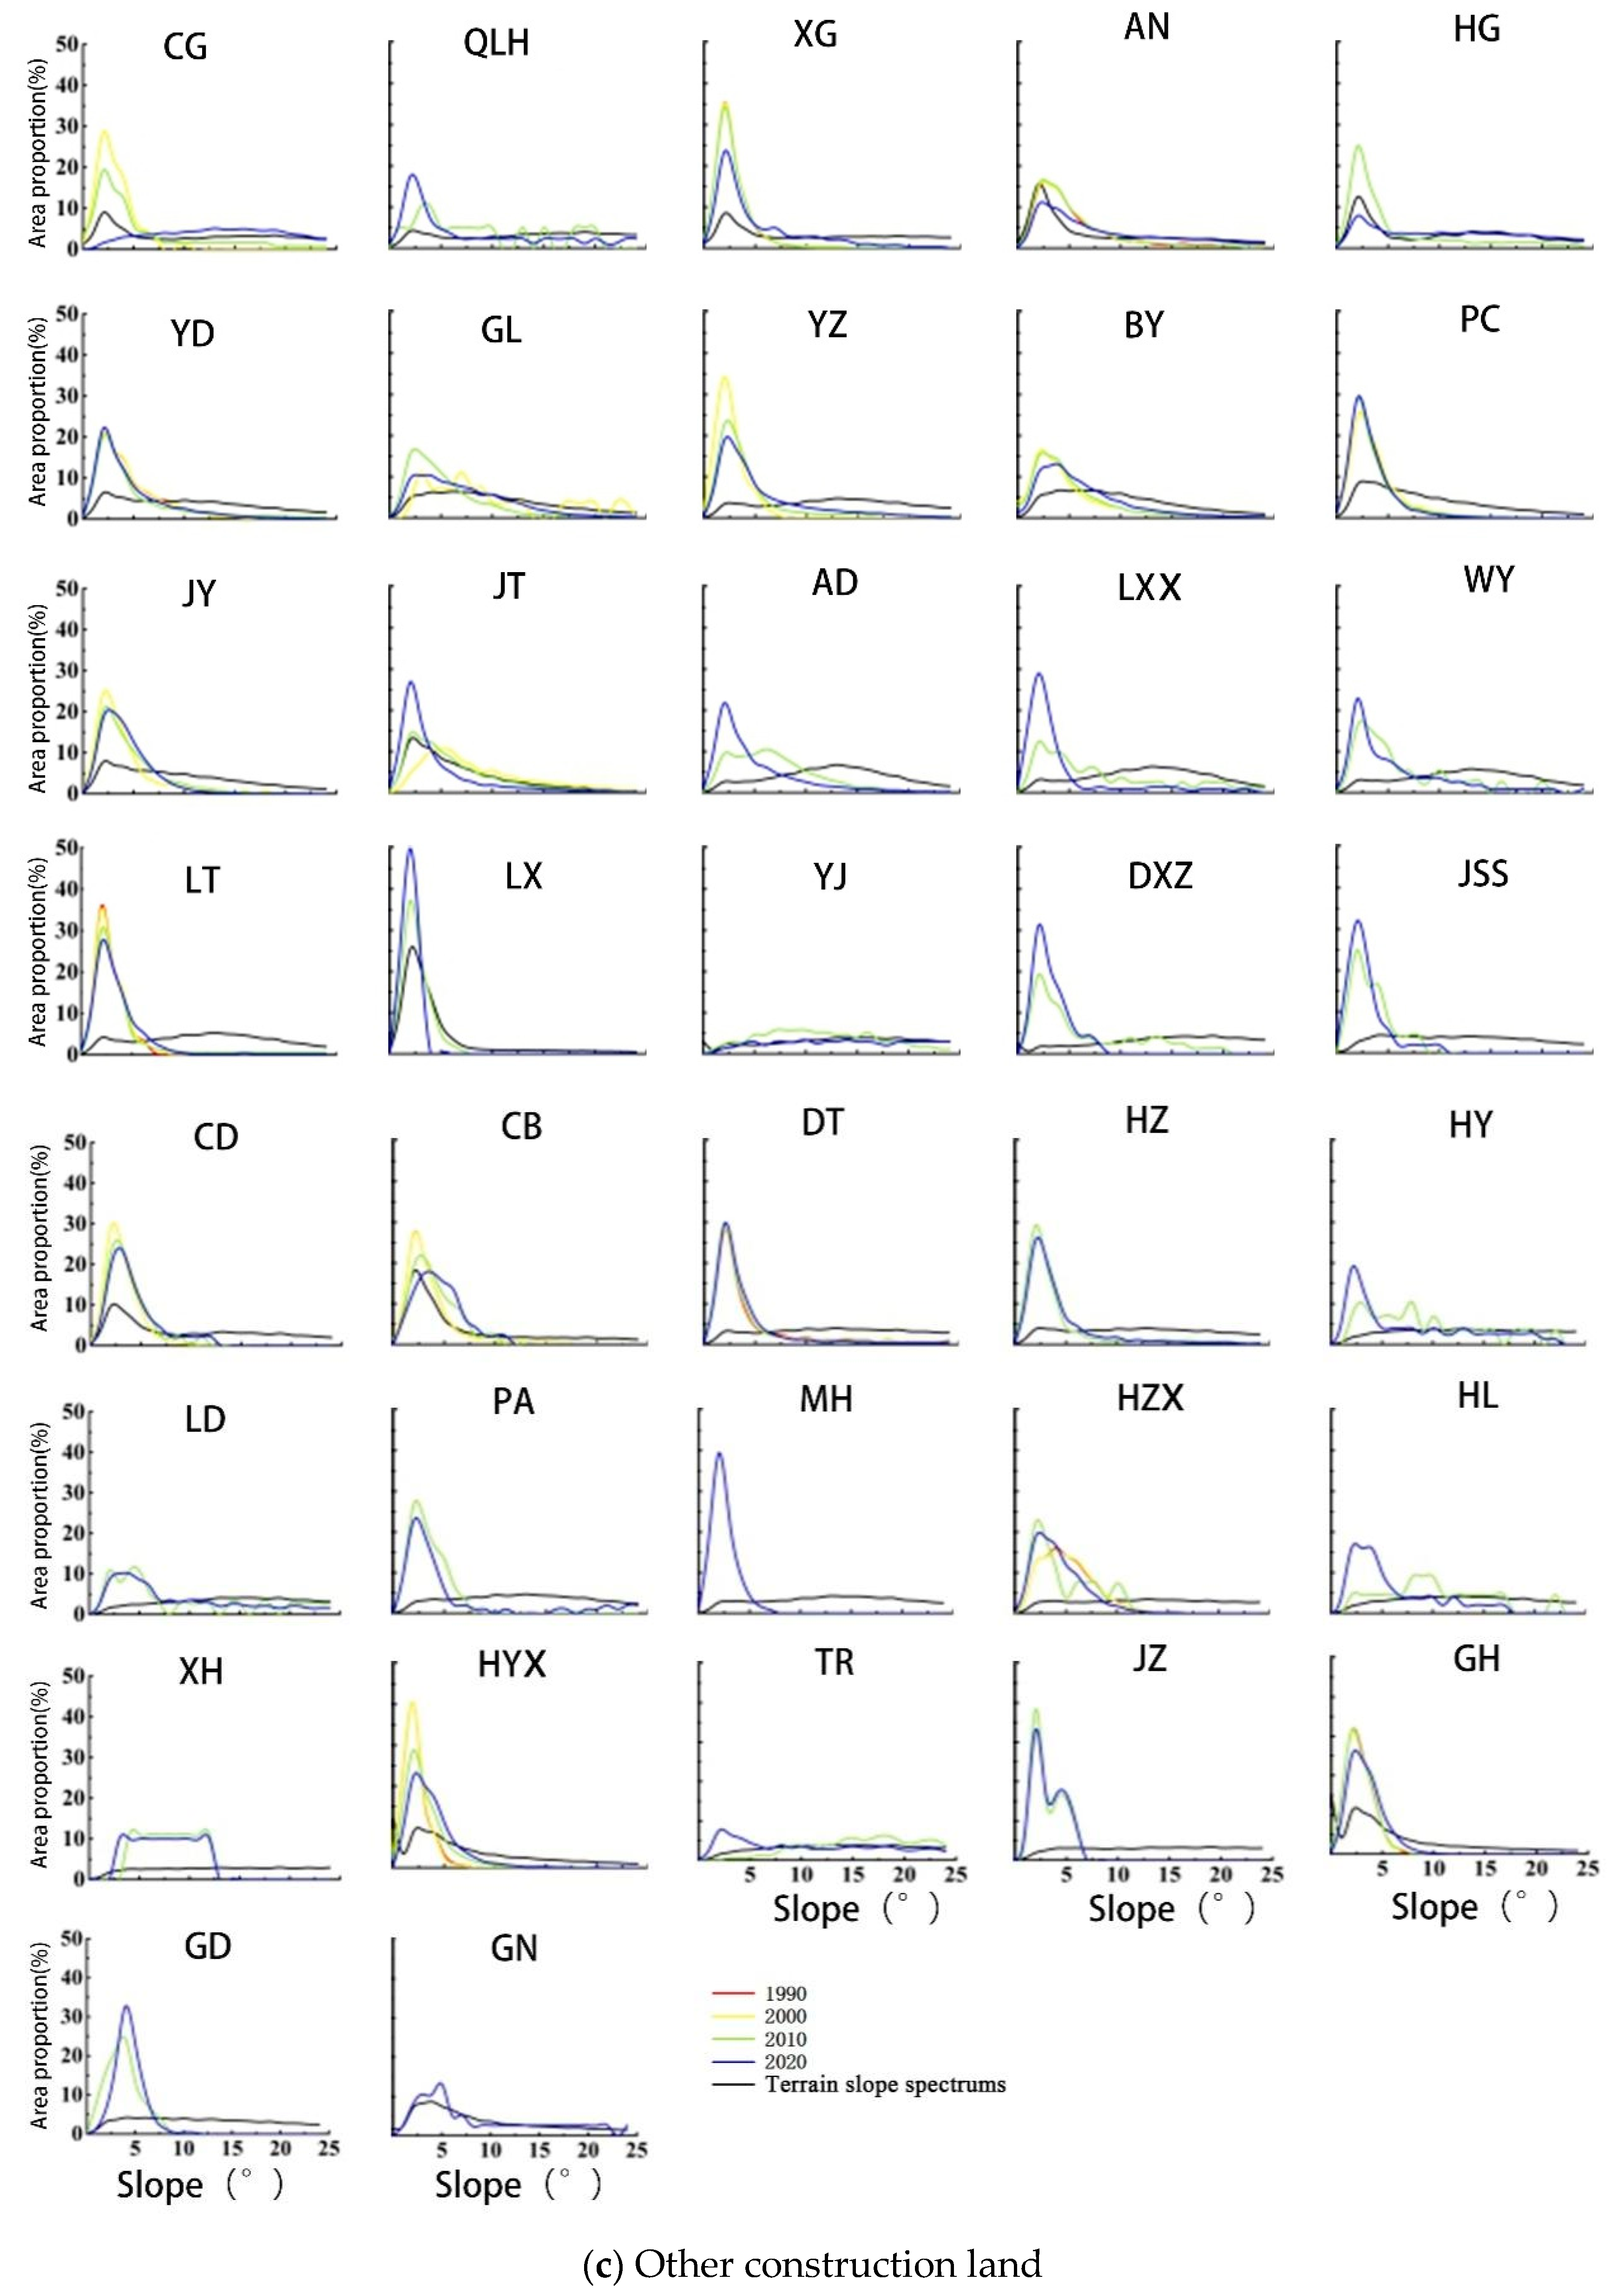
3.3.4. Characteristics of the Slope Spectrum of Construction Land at the County (District) Scale

The spatial distribution of the slope spectrum of construction land in each county (district) also exhibited obvious differences, and by observing the morphology of the three types of construction land slope spectra in each county (district), we found that most of the counties (districts) had smooth, inverted-“V” curves of the construction land slope spectra, highly similar to the morphology of the topographic slope spectra (Figure 15), and the dominant areas were located within these areas in 2020. However, although the slope spectra of construction land in some counties (districts) also showed the trend of “increasing and then decreasing”, several slight fluctuations were observed, and some counties (districts) had a “few” shape in their slope spectra of construction land. For example, for the urban construction land in Jianzha County and Guinan County, the rural residential land in Mutual Aid County and Ledu District, and the other construction land in Baiyin District and Jingyuan County, the proportions of the construction land areas in these counties (districts) were less than 85%, indicating that the slopes of construction land distributions were wide. As determined from the change in the slope spectrum curve of construction land over time, most counties (districts) contained urban construction land and other construction land distributed within the dominant area, and the areal proportion increased gradually over time; that is, the urban construction land expanded horizontally within the dominant area. The rural residential land in most of the counties (districts) exhibited the phenomenon of climbing up toward the inferior area, with the most obvious changes observed in the counties (districts) of Chengzhong District and Huanzhong District, while in other counties (districts), this land type expanded toward the superior area, such as in Chengguan District, Qilihe District and Anning District.
Based on our comprehensive analysis of the average construction land climbing index (ABCI) and the upper-limit slope change (ULSC) values of the three types of analyzed land in the counties (districts) of the LXUA during the study period, the 39 counties (districts) could be roughly divided into three categories: the high-climbing type (HC, ABCI > 0 and ULSC > 0), low-climbing type (LC, ABCI > 0 and ULSC ≤ 0, or ABCI ≤ 0 and ULSC > 0), and horizontally extended type (HZ, ABCI ≤ 0 and ULSC ≤ 0) (Figure 10 and Figure 16). Among them, a high-climbing-type county (district) does not indicate that the climbing slope of the construction land was large, but rather that the value of the upper-limit slope change during the climbing process as well as the degree of climbing were large. The largest climbing magnitudes observed during the study period exhibited the strongest increases in rural settlement sites in Dongxiang County (Figure 16(a2,b,c)). There were three counties (districts) with relatively few distribution areas of other construction land before 2000 and three counties (districts) with obvious climbing phenomena, namely, Lintao County, Chengbei District and Republican County (Figure 16(a3,b,c)). From our analysis, we found that there were 34 urban-construction-land-climbing counties in the 1990–2000 period, 31 in the 2000–2010 period, and 23 in the 2000–2020 period, and both the scale and degree of urban construction land climbing gradually decreased over time (Figure 16(a1,b,c)). The number of rural settlement sites in the 2000–2010 period reached 34 in the climbing-type counties, and regarding the scale and degree of climbing in 2000, the number of counties (districts) with climbing other construction land increased significantly, and Chengguan District showed significant a climbing phenomenon; from 2010 to 2020, the number of counties (districts) with strong climbing degrees rose to 12.

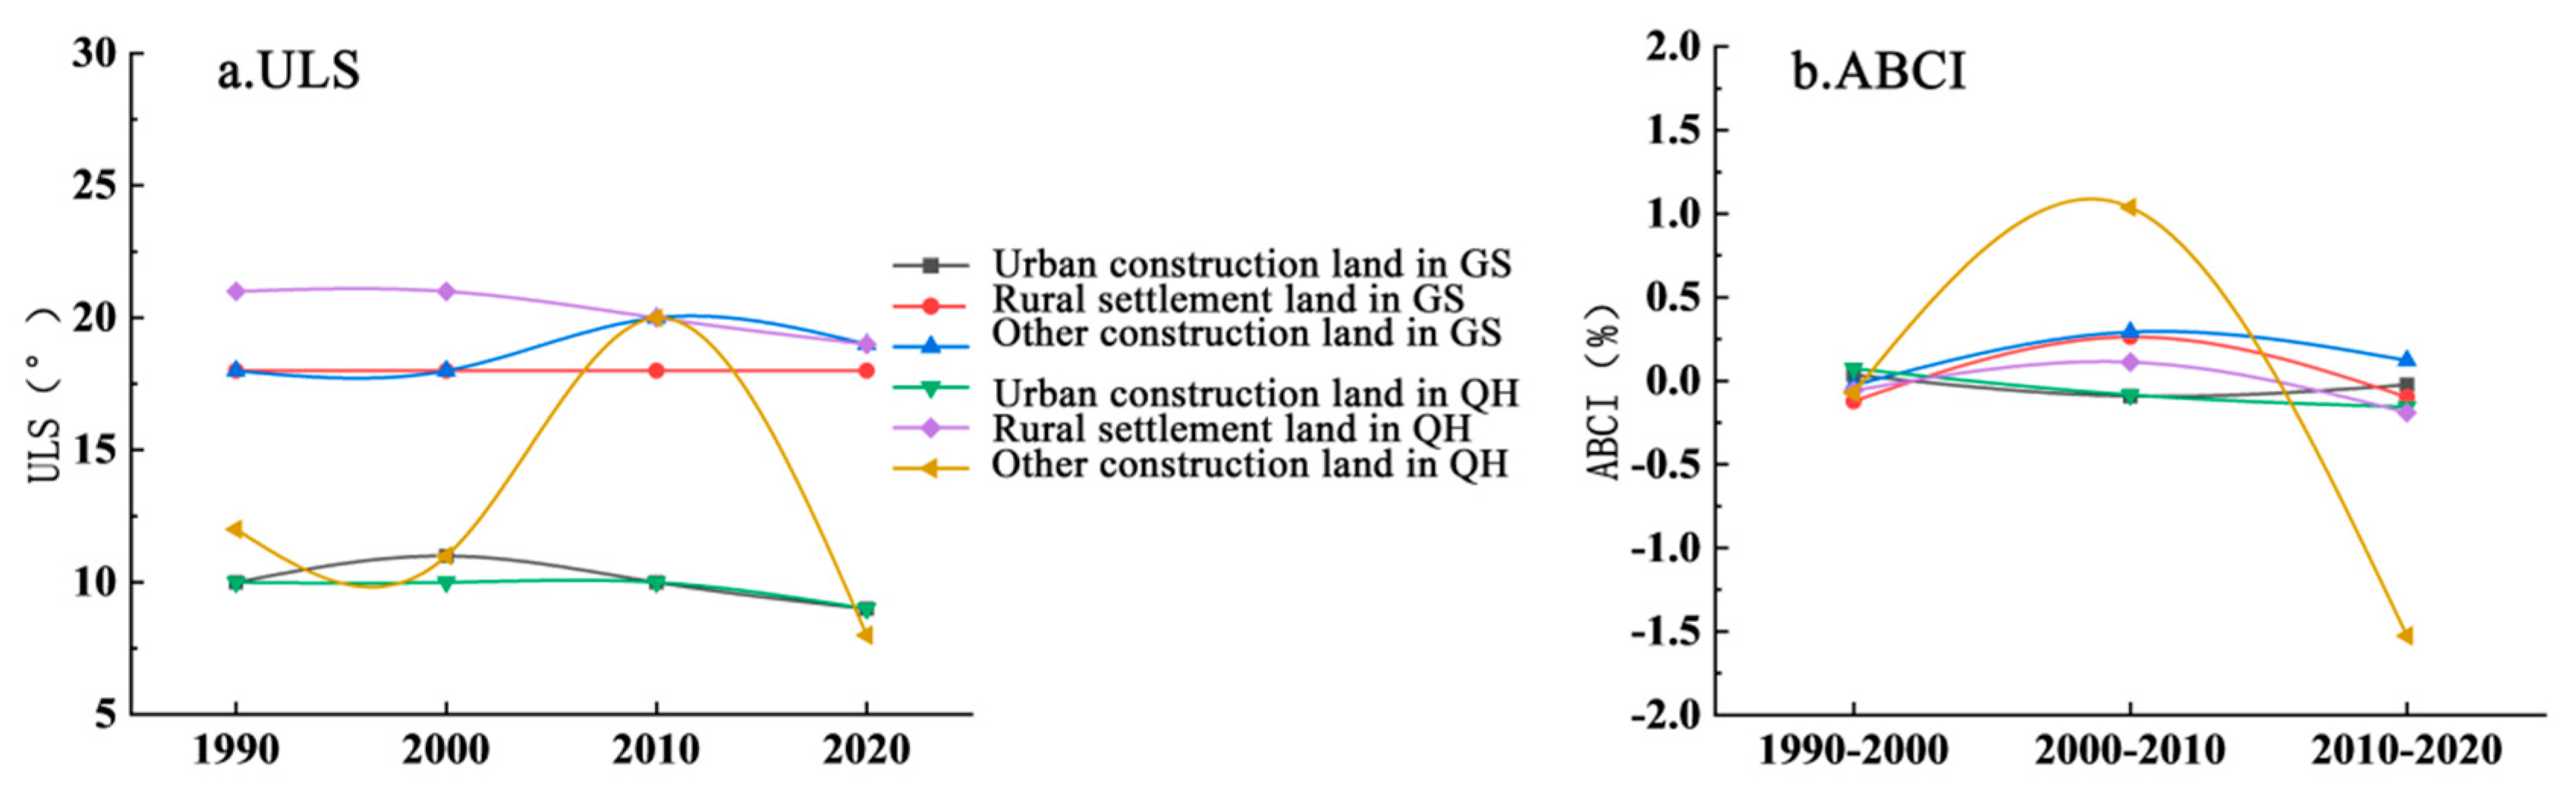
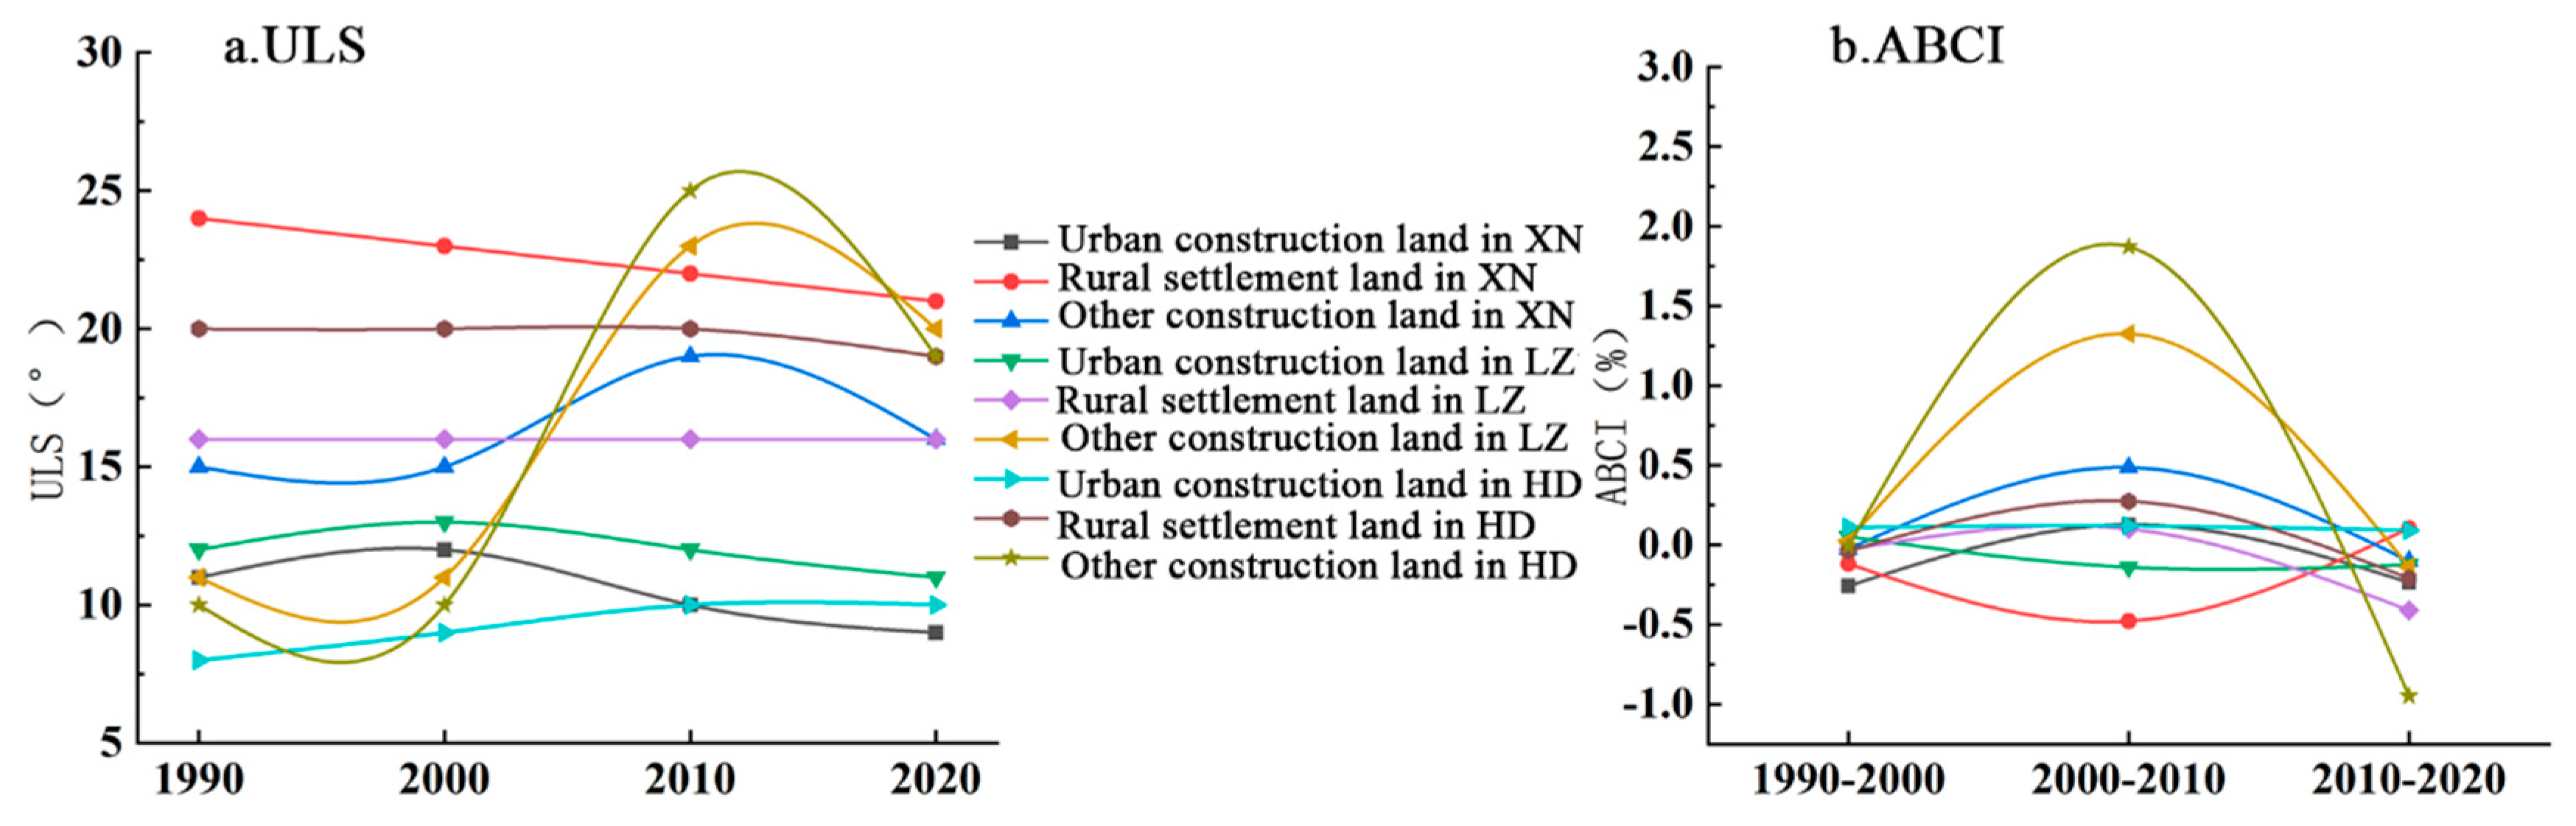
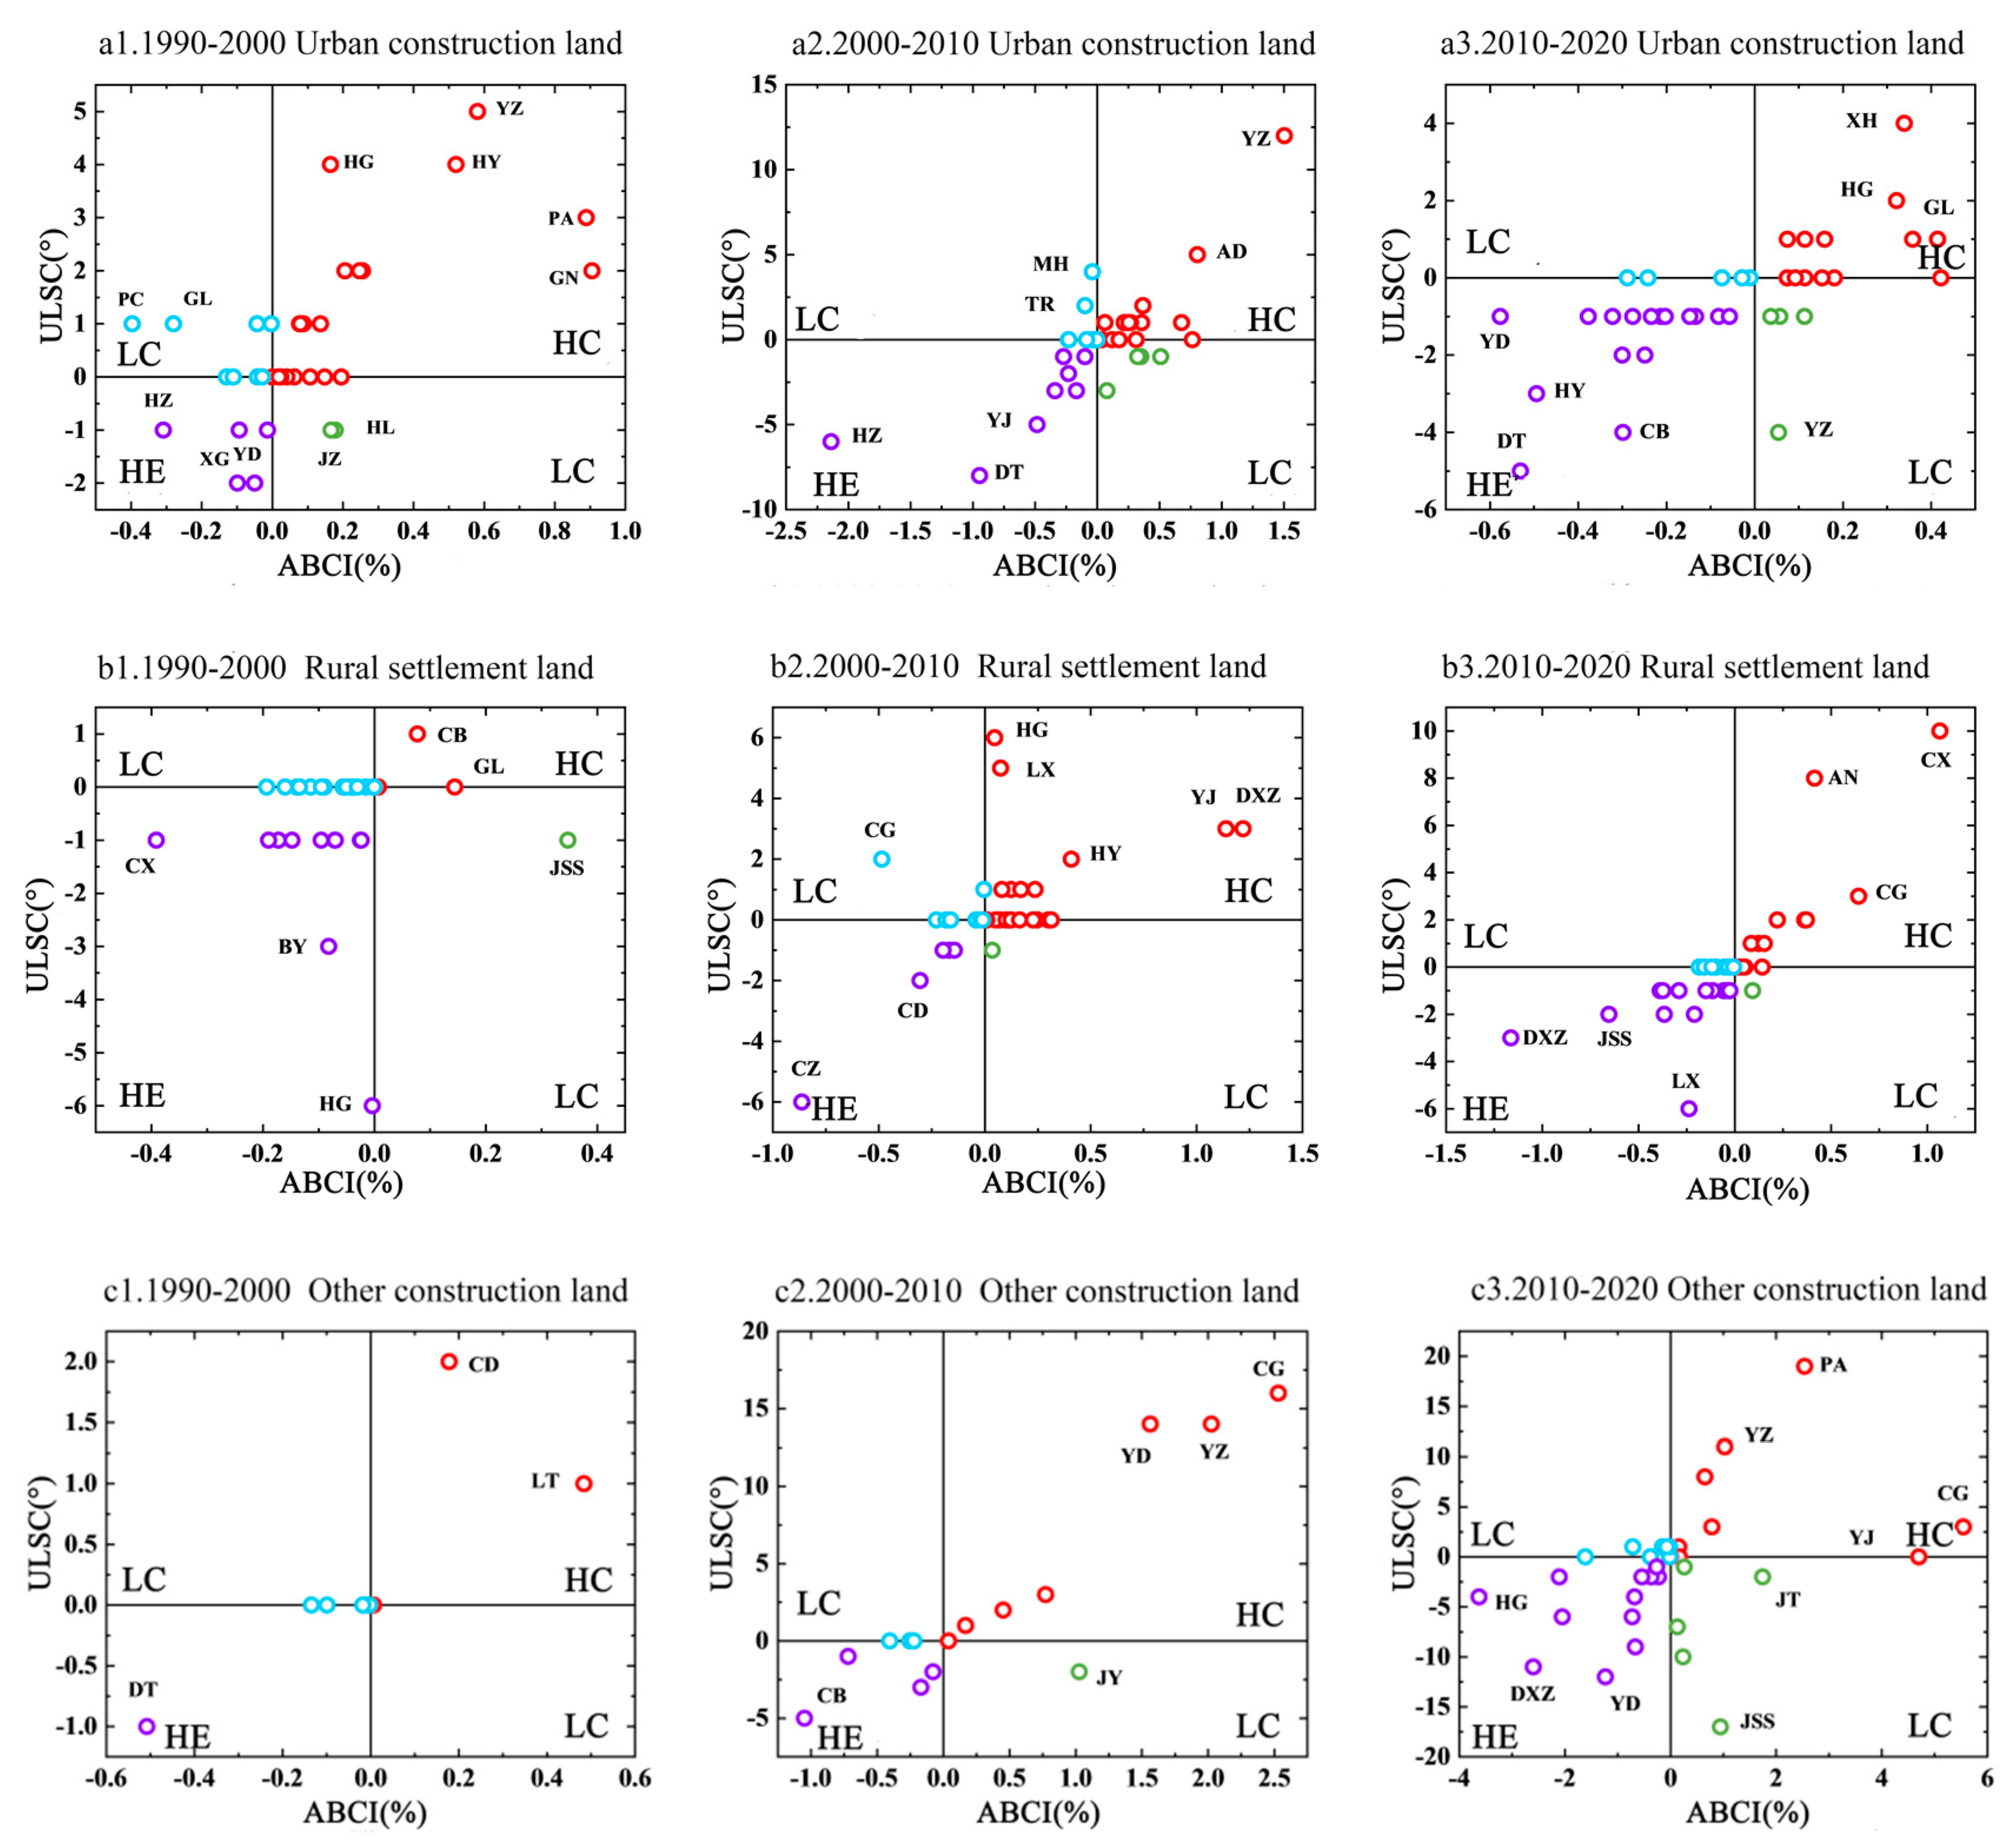
3.4. Analysis of the Construction Land Climbing Gradient Effect

To further explore the relatively hot and cold patterns of the spatial distribution of the construction-land-climbing phenomenon, a map of the slope-share classes of the three types of construction land was drawn based on grid cells (Figure 17). From the four time points of 1990–2000, the relatively hot areas of the three types of climbing construction land slopes showed gradually expanding trends in space. Among them, three main hot zones of slope-climbing were observed for urban construction land in 1990 and 2000, corresponding to the main urban areas of Lanzhou, Xining and Baiyin (Figure 17a). By 2010, a corridor-type climbing hot zone with Lanzhou–Xining as two axes was formed, and obvious scattered hot zones also appeared in Baiyin District of Baiyin City, Dingxi An Ding District, and Yongdeng County of Lanzhou City. These climbing hot zones continued to expand in 2020, and at the same time, with the establishment and development of Lanzhou New District, the number of patches of climbing hot zones in the Lanzhou–Baiyin metropolitan area gradually increased. The climbing relative hot zone of rural residential construction land was distributed mainly in Xining City and connected with Haidong City Lanzhou City to the east, showing an obvious linear hot zone (Figure 17b). From the four change periods, the rural settlement sites basically did not show any major changes in the pattern of climbing hot zones. Other construction sites in the 1990–2010 climbing hot zone were distributed mainly in the area around the Lanzhou–Baiyin metropolitan area, and the climbing hot zone around the Lanzhou–Baiyin metropolitan area continued to expand in 2020 and was basically connected to Lanzhou New District, while new climbing hot zones also appeared in Tongren City and Gonghe County (Figure 17c). However, the relative hot zones of the three types of climbing construction land did not change significantly over time in terms of their areal shares, and the relative hot zone of climbing urban construction land had the highest areal share of 6%. The relative hot zones of rural settlements and other construction land accounted for 4% and 3%, respectively, indicating a synergistic partnership between the horizontal expansion of construction land and the vertical climbing of construction land in the LXUA.

3.5. Correlation Analysis of the Driving Forces of Slope-Climbing Construction Land

The correlation results show (Table 3) that population had the greatest influence on the climbing slope in urban construction land hot zones, with a coefficient of 0.49, followed by the average GDP, with a coefficient of 0.35. These findings indicate that, the faster the population growth and the faster the GDP development, the larger the scale of urban construction land expansion, and the more these factors drive cities uphill. Natural conditions such as elevation, relative humidity and precipitation are the main factors driving the development of rural settlements to higher-slope areas. The better the natural conditions, the better the agricultural infrastructure conditions; additionally, the better the land-use conditions, the greater the increase in new rural settlements in large areas and the rapid development and utilization of mountainous areas. In addition to the socioeconomic and natural conditions, the distribution of other construction land is influenced by the distance from public utilities such as the Qinghai–Tibet Railway, Beijing–Tibet Expressway and Zhang Wen Expressway and by the construction of expressways contributing to the expansion of industrial land.

4. Discussion and Conclusions

4.1. Discussion

The development of construction land has an important impact on urban morphology, the ecological environment and the territorial spatial layout. Due to continuous population growth and agglomeration, urban expansion is characterized by the sustained interaction between horizontal and vertical growth [36,37]. However, existing studies have focused mainly on the expansion of construction land in the horizontal direction, while less research has explored the slope-climbing phenomenon of construction land in the vertical dimension. Therefore, in this paper, we comprehensively analyzed the horizontal expansion and vertical slope-climbing characteristics of construction land from the perspective of urban agglomeration in a multiscale and refined manner, marking the first that construction land has been studied at a fine classification scale and thereby compensating for the shortcomings of existing research. Moreover, this long-time-series study can enhance our understanding of the evolution of spatiotemporal patterns and driving factors of vertical urban sprawl. The latest study found that the underestimation of the urban land area by LULC products can be described by a logarithmic law, and the potential threshold of this law is approximately a 30 m resolution [38]. Therefore, we chose land-use data with a resolution of 30 m × 30 m to best reveal the evolutionary characteristics of construction land in urban agglomerations.
Our results show that the horizontal expansion and vertical slope-climbing of urban construction land in the LXUA coexist and show a continuous and rapid increase, and have obvious spatial variation characteristics; this observation is the same as the existing hotspot studies [23,39,40]. Specifically, the findings of this study are similar to those of the Yangtze River Delta urban agglomeration, the Pacific Coast urban agglomeration of Japan, and Asia and North America. All of these regions show a faster development trend in terms of construction land expansion. The results of the identification of influencing factors indicate that the combination of geographic location and economic development has led to the rapid growth of construction land in the study area, which is consistent with this study, and the effects of average slope, GDP growth and population growth on land use have been widely verified. However, this study again focuses on the influence mechanisms related to urbanization, accessibility and policy factors.
Scientific and effective spatial planning and tailored development models are essential for sustainable urban development [41]. The rural settlement land in the Gansu area decreased after 2010. This finding is consistent with China’s new urbanization strategy and the policy of tapping the stock of land, while, in contrast, the rural settlement land in the Qinghai area has been slowly increasing, although the reality of deep poverty and the many herdsmen in Qinghai Province suggest that the rural settlement land in this region cannot be developed as much as the agricultural area. Although the reality of Qinghai Province is that the land-use types in rural settlements are not as concentrated as those in agricultural areas and the policy of “one house per household” is not as strictly implemented, Qinghai Province still needs to pay more attention to rural land use and to the remediation of “hollow villages”. The results of these studies have important reference value for national differentiated land planning and annual land-allocation indices in China. Facing the contradiction of the “development and protection” of land shortages and fragile ecological environments, determining how to realize the “win-win” goal of “development in protection and protection in development” will be important for the construction and development of the LXUA. In this paper, we studied only the horizontal expansion and vertical slope-spectrum characteristics, gradient effects and driving factors of construction land; in the future, we plan to conduct comprehensive research on construction land, arable land protection and ecological space fragmentation. Long-time-series research and more highly detailed studies of the evolutionary characteristics of construction land using higher-spatial-resolution and higher-precision data are needed in the future. In addition, in determining the driving forces of climbing construction land due to policy influence, we quantified only the influence of the distance of the study area from an ecological reserve. More variables, such as government policies, living customs and historic preservation, should be considered to assess the driving mechanisms. Moreover, from the green and low-carbon target requirements, we plan to study low-carbon construction land-use patterns, make suggestions for the high-quality development of the LXUA, and contribute wisdom to the high-quality protection of the Yellow River basin.

4.2. Conclusions

Our results show that the construction land in the LXUA has continued to expand and exhibits varying expansion characteristics. At the urban agglomeration scale, urban construction land, rural settlement land and other construction land show “linear”, inverted-“U” and “J” growth patterns, respectively. The areas of rural settlements in 9 counties (districts) are decreasing, and the number of counties (districts) with decreasing areas is increasing, while the areas of other construction land in most counties (districts) are increasing. The center of gravity of urban construction land continued to shift northwestward during the study period, and the standard deviation ellipse flattened. The center of gravity of rural settlement land continued to shift southeastward, the center of gravity of other construction land continued to shift southwestward, and the dispersion degree increased in the east-west direction.
The slope-spectra curves of construction land in the LXUA were found to be similar to the topographic slope-spectra curves, and they all exhibited skewed distributions in terms of the slope gradients. Urban construction land expanded at the level of the dominant areas, while rural settlement land and other construction land climbed up to the inferior areas. The relatively hot zones of slope-climbing of construction land in the LXUA showed a trend of gradual expansion with regards to their spatial extent, with relatively small areal-share changes observed. The hot zone of the slope-climbing of urban construction land was centered on the cities of Lanzhou and Xining. Rural settlements appeared as obvious hot zones in Xining city. The hot zones of other construction land climbing areas were concentrated in the Lanzhou–Baiyin metropolitan area. The slope-climbing phenomenon of construction land was subject to the combined effects of natural environmental conditions and social factors, including GDP, population, precipitation and relative humidity. Accessibility was found to be the key factor influencing the other construction land area.

Author Contributions

Conceptualization, J.R.; methodology, J.R. and H.Z.; validation, J.G. and C.L.; formal analysis, J.R.; investigation, H.Z.; resources, X.Z. and Y.G.; data curation, X.Z. and H.Z; writing—original draft preparation, H.Z. and J.R.; writing—review and editing, H.Z. and W.H.; visualization, W.H. and C.L.; supervision, C.L.; project administration, J.R. All authors have read and agreed to the published version of the manuscript.

Funding

This work was supported by the National Social Science Foundation Youth Project of China (21CGL040); the Qinghai Provincial Social Science Foundation General Project (21021); and the Qinghai Provincial Social Science Foundation General Project (22Y011).

Data Availability Statement

The data presented in this study are available from the corresponding author upon request.

Conflicts of Interest

The authors declare that they have no known competing financial interests or personal relationships that could have influenced the work reported in this paper.

References

  1. Ning, J.; Liu, J.; Kuang, W.; Xu, X.; Zhang, S.; Yan, C.; Li, R.; Wu, S.; Hu, Y.; Du, G.; et al. Spatiotemporal patterns and characteristics of land-use change in China during 2010–2015. J. Geogr. Sci. 2018, 28, 547–562. [Google Scholar] [CrossRef] [Green Version]
  2. Liu, J.; Kuang, W.; Zhang, Z.; Xu, X.; Qin, Y.; Ning, J.; Zhou, W.; Zhang, S.; Li, R.; Yan, C.; et al. Spatiotemporal characteristics, patterns, and causes of land-use changes in China since the late 1980s. J. Geogr. Sci. 2014, 24, 195–210. [Google Scholar] [CrossRef]
  3. Ren, J.; Zhou, W.; Guo, J.; Huang, Y.; Hai, W. Analysis on Spatial-Temporal Characteristics and Influencing Factors of Multi-functionality of Land Use in Qinghai-Tibet Alpine Mountain Areas: A Case Study of Haidong City in Qinghai Province, China. China Land Sci. 2021, 35, 90–100. [Google Scholar]
  4. Li, X.B. Explanation of land use changes. Prog. Geogr. 2002, 21, 195–203. [Google Scholar] [CrossRef]
  5. Kuang, W. 70 years of urban expansion across China: Trajectory, pattern, and national policies. Sci. Bull. 2020, 65, 1970–1974. [Google Scholar] [CrossRef] [PubMed]
  6. Angel, S.; Parent, J.; Civco, D.L.; Blei, A.; Potere, D. The dimensions of global urban expansion: Estimates and projections for all countries, 2000–2050. Prog. Plan. 2011, 75, 53–107. [Google Scholar] [CrossRef]
  7. United Nations. World Cities Report 2020: The Value of Sustainable Urbanization.UN-HABITAT. 2020. Available online: https://unhabitat.org/world-cities-report-2020-the-value-of-sustainable-urbanization (accessed on 5 November 2022).
  8. Seto, K.C.; Güneralp, B.; Hutyra, L.R. Global forecasts of urban expansion to 2030 and direct impacts on biodiversity and carbon pools. Proc. Natl. Acad. Sci. USA 2012, 109, 16083–16088. [Google Scholar] [CrossRef] [PubMed] [Green Version]
  9. Qiao, W.; Liu, Y.; Wang, Y.; Fang, B.; Zhao, Y. The relationship of evolution between urban land use types and intensity in Nanjing since the early 21st century. Acta Geogr. Sin. 2015, 70, 1800–1810. [Google Scholar] [CrossRef]
  10. Zhou, L.; Dang, X.; Zhou, C.; Wang, B.; Wei, W. Evolution characteristics of slope spectrum and lope-climbing effects of built-up land in China. Acta Geogr. Sin. 2021, 76, 1747–1762. [Google Scholar] [CrossRef]
  11. Xu, Y.; Zhao, S.; Fan, J. Urban planning construction land standard and its revision based on climate and topography in China. J. Geogr. Sci. 2020, 31, 603–620. [Google Scholar] [CrossRef]
  12. Lv, X.; Huang, X.J.; Zhang, J.Q. A literature review on urban-rural construction land transition. City Plan. Rev. 2015, 39, 105–112. [Google Scholar] [CrossRef]
  13. Ren, J.; Zhou, W.; Liu, X.; Zhou, L.; Guo, J.; Wang, Y.; Guan, Y.; Mao, J.; Huang, Y.; Ma, R. Urban Expansion and Growth Boundaries in an Oasis City in an Arid Region: A Case Study of Jiayuguan City, China. Sustainability 2019, 12, 210. [Google Scholar] [CrossRef] [Green Version]
  14. Luo, J.; Liu, Y.; Yue, W.; Huang, J. Evolution of urban spatial structure in a mountainous city: Transforming from linear expansion along valleys to polycentric urban development. Econ. Geogr. 2013, 33, 61–67. [Google Scholar]
  15. Qiao, W.F.; Mao, G.X.; Wang, Y.H.; Chen, Y.J. Research on urban expansion and land use change in Nanjing over the past 32 years. J. Geo-Inf. Sci. 2016, 18, 200–209. [Google Scholar] [CrossRef]
  16. Wang, D.Y.; Ji, X.P.; Huang, X.J. Spatial and temporal pattern analysis of construction land in Yangtze River Economic Zone since 1990s. Mod. Urban Res. 2018, 4, 30–36. [Google Scholar] [CrossRef]
  17. Gao, Q.; Fang, C.; Zhang, X.; Lui, H.; Ren, Y. Spatio-temporal evolution characteristics and mechanisms of influence of urban construction land expansion in Xinjiang, the Core Area of the Silk Road Economic Belt. Acta Ecol. Sin. 2019, 39, 1263–1277. [Google Scholar] [CrossRef]
  18. Deng, Y.W.; Zhen, J.H.; Ma, C.Y. Multi-scenario simulation of the impact of urban expansion on ecological risk: A case study of Hohhot City, Inner Mongolia. Acta Ecol. Sin. 2021, 41, 1199–1208. [Google Scholar] [CrossRef]
  19. Sun, P.L.; Xu, Y.Q.; Wang, S. Terrain gradient effect analysis of land use change in poverty area around Beijing and Tianjin. Trans. Chin. Soc. Agric. Eng. 2014, 30, 277–288. [Google Scholar] [CrossRef]
  20. Zang, Y.Z.; Liu, Y.S.; Yang, Y.Y. Land use pattern change and its topographic gradient effect in the mountainous areas: A case study of Jinggangshan city. J. Nat. Resour. 2019, 34, 1391–1404. [Google Scholar]
  21. Zhu, C.L.; Zhang, J.F.; Zhao, Y.L.; Liu, C. Topographic gradient effects of typical watershed ecosystem services in the eastern Tibetan plateau: A case study of the upper reaches of Minjiang Rive. Resour. Environ. Yangtze Basin 2017, 26, 1687–1699. [Google Scholar] [CrossRef]
  22. Zhang, J.; Zhu, W.; Zhao, F.; Zhu, L.; Li, M.; Zhu, M.; Zhang, X. Spatial variations of terrain and their impacts on landscape patterns in the transition zone from mountains to plains—A case study of Qihe River Basin in the Taihang Mountains. Sci. China Earth Sci. 2018, 61, 450–461. [Google Scholar] [CrossRef]
  23. Peng, Q.Z.; Ma, S.H.; Deng, Q.H.; Ma, J.W. Relationship between construction land and slope in rapidlyexpanding mountain cities: A case study in Guiyang, China. J. Nat. Resour. 2022, 37, 1865–1875. [Google Scholar]
  24. Guo, H.F.; Xu, Y.Q.; Wu, Y.F. Analysis of the Land Use Spatial Pattern and Spatio-Temporal Changes Based on Terrain Gradient: A Case Study of Pinggu District in Beijing. Econ. Geogr. 2013, 33, 160–166, 186. [Google Scholar]
  25. Fang, C.L.; Zhang, G.Y.; Xue, D.S. High-quality development of urban agglomerations in China and construction of science and technology collaborative innovation community. Acta Geogr. Sin. 2021, 76, 2898–2908. [Google Scholar] [CrossRef]
  26. Luo, J.; Shi, P.J.; Zhang, X.B. Relationship between Topographic Factors and Population Distribution in Lanzhou-Xining Urban Agglomeration. Econ. Geogr. 2020, 40, 106–115. [Google Scholar]
  27. Li, G.P. Multiple measures to promote the high-quality development of urban agglomerations in China. Acad. Front. People’s Forum 2022, 18–28. [Google Scholar] [CrossRef]
  28. Yang, X.; Chen, X.; Qiao, F.; Che, L.; Pu, L. Layout optimization and multi-scenarios for land use: An empirical study of production-living-ecological space in the Lanzhou-Xining City Cluster, China. Ecol. Indic. 2022, 145, 109577. [Google Scholar] [CrossRef]
  29. Qu, S.J.; Hu, S.G.; Tong, L.Y.; Li, Q.F. Spatiotemporal patterns of urban land use transition in the middle Yangtze River Economic Belt. Resour. Sci. 2017, 39, 240–251. [Google Scholar] [CrossRef] [Green Version]
  30. Ren, J.; Liu, X.L.; Yue, J.Y.; Wang, Y.H.; Zhang, T.Z. Delimiting the urban development boundary of Jiayuguan City based on MCE-CA model. Arid Land Geogr. 2016, 39, 1111–1119. [Google Scholar]
  31. Wang, C.; Tang, G.; Li, F. Fundamental conditions of slope spectrum abstraction and application. Sci. Geogr. Sin. 2007, 27, 587–592. [Google Scholar] [CrossRef]
  32. Yu, R.; Cai, J.; Leung, P. The normalized revealed comparative advantage index. Ann. Reg. Sci. 2009, 43, 267–282. [Google Scholar] [CrossRef]
  33. Liu, H.; Shi, P.; Tong, H.; Zhu, G.; Liu, H.; Zhang, X.; Wei, W.; Wang, X. Characteristics and driving forces of spatial expansion of oasis cities and towns in Hexi Corridor, Gansu Province, China. Chin. Geogr. Sci. 2015, 25, 250–262. [Google Scholar] [CrossRef]
  34. Liu, Y.; Song, W.; Deng, X. Understanding the spatiotemporal variation of urban land expansion in oasis cities by integrating remote sensing and multi-dimensional DPSIR-based indicators. Ecol. Indic. 2019, 96, 23–37. [Google Scholar] [CrossRef]
  35. Gauthier, T. Detecting Trends Using Spearman’s Rank Correlation Coefficient. Environ. Forensics 2001, 2, 359–362. [Google Scholar] [CrossRef]
  36. Mahtta, R.; Mahendra, A.; Seto, K.C. Building up or spreading out? Typologies of urban growth across 478 cities of 1 million+. Environ. Res. Lett. 2019, 14, 124077. [Google Scholar] [CrossRef] [Green Version]
  37. Zambon, I.; Colantoni, A.; Salvati, L. Horizontal vs vertical growth: Understanding latent patterns of urban expansion in large metropolitan regions. Sci. Total. Environ. 2018, 654, 778–785. [Google Scholar] [CrossRef]
  38. Li, X.; Chen, G.; Zhang, Y.; Yu, L.; Du, Z.; Hu, G.; Liu, X. The impacts of spatial resolutions on global urban-related change analyses and modeling. iScience 2022, 25, 105660. [Google Scholar] [CrossRef]
  39. Shi, K.; Wu, Y.; Liu, S. Slope climbing of urban expansion worldwide: Spatiotemporal characteristics, driving factors and implications for food security. J. Environ. Manag. 2022, 324, 116337. [Google Scholar] [CrossRef]
  40. Zhou, L.; Dang, X.; Mu, H.; Wang, B.; Wang, S. Cities are going uphill: Slope gradient analysis of urban expansion and its driving factors in China. Sci. Total. Environ. 2021, 775, 145836. [Google Scholar] [CrossRef]
  41. Dong, T.; Jiao, L.; Xu, G.; Yang, L.; Liu, J. Towards sustainability? Analyzing changing urban form patterns in the United States, Europe, and China. Sci. Total. Environ. 2019, 671, 632–643. [Google Scholar] [CrossRef]
Figure 1. The location map of the study area.
Land 12 00745 g001
Figure 2. General research framework.
Land 12 00745 g002
Figure 3. Multiscale areal changes in the three types of construction land in the LXUA from 1990 to 2020. Note: For clarity of the graphical expression, only the top 10 counties in terms of area in 2020 are mapped for the three types of construction land changes at the county scale.
Land 12 00745 g003aLand 12 00745 g003b
Figure 4. Distributions of the central shifts of construction land above the city level in the study area from 1990 to 2020.
Land 12 00745 g004
Figure 5. Distributions of central construction land shifts at the county level in the study area from 1990 to 2020.
Land 12 00745 g005
Figure 6. Distributions of central rural residential land shifts at the city level in the study area from 1990 to 2020.
Land 12 00745 g006aLand 12 00745 g006b
Figure 7. Distributions of the central rural residential land shifts at the county level in the study area from 1990 to 2020.
Land 12 00745 g007
Figure 8. Distributions of central other construction land shifts at the city level in the study area from 1990 to 2020.
Land 12 00745 g008
Figure 9. Distributions of central other construction land shifts at the county level in the study area from 1990 to 2020.
Land 12 00745 g009
Figure 10. Terrain and construction land slope spectra and ABCI and ULSC values in the LXUA from 1990 to 2020.
Land 12 00745 g010aLand 12 00745 g010b
Figure 11. Terrain and construction land slope spectra of two regions within the LXUA from 1990 to 2020.
Land 12 00745 g011aLand 12 00745 g011b
Figure 12. ABCI and ULS results of two regions within the LXUA from 1990 to 2020.
Land 12 00745 g012
Figure 13. Terrain and built-up land slope spectra of typical cities in the LXUA from 1990 to 2020.
Land 12 00745 g013aLand 12 00745 g013b
Figure 14. ABCI and ULS values of typical cities in the LXUA from 1990 to 2020.
Land 12 00745 g014
Figure 15. Terrain and built-up land slope spectra of counties (districts) in the LXUA from 1990 to 2020.
Land 12 00745 g015aLand 12 00745 g015bLand 12 00745 g015cLand 12 00745 g015d
Figure 16. ABCI and ULSC results of counties (districts) in the LXUA from 1990 to 2020.
Land 12 00745 g016
Figure 17. Grades of construction land slope shares corresponding to the three types of analyzed construction land in the LXUA from 1990 to 2020.
Land 12 00745 g017aLand 12 00745 g017b
Table 1. The administrative divisions of the research area.
AgglomerationsProvincial
Area
Typical
Cities
Counties (Districts)
Lanzhou–Xining Urban Agglomerations
(LXUA)
Gansu (GS)Lanzhou (LZ)Chengguan
(CG)
Qilihe
(QLH)
Xigu
(XG)
Anning
(AN)
Honggu
(HG)
Yongdeng
(YD)
Gaolan
(GL)
Yuzhong
(YZ)
Baiyin
(BY)
Pingchaun
(PC)
Jingyuan
(JY)
Jingtai
(JT)
Anding
(AD)
Longxi
(LXX)
Weiyuan
(WY)
Lintao
(LT)
Linxia
(LX)
Yongjing
(YJ)
Dongxiangzu
(DXZ)
Jishishan
(JSS)
Qinghai (QH)Xining (XN)Chengdong
(CD)
Chengxi
(CX)
Chengzhong
(CZ)
Chengbei
(CB)
Datong
(DT)
Huangzhong
(HZ)
Huangyaun
(HY)
Haidong (HD)Ledu
(LD)
Pingan
(PA)
Minhe
(MH)
Huzhu
(HZX)
Hualong
(HL)
Xunhua
(XH)
Haiyan
(HYX)
Tongren
(TR)
Jianzha
(JZ)
Gonghe
(GH)
Guide
(GD)
Guinan
(GN)
Table 2. Descriptions of the data used in this study.
Data NameData SourceData TypeData Description
Meteorological datahttp://data.cma.cn/ accessed on 5 November 2022excelPrecipitation and relative humidity data obtained by interpolation
Spatial population (Nighttime light data)http://www.geodata.cn/ accessed on 5 November 2022500 m × 500 m
raster data
SNPP-VIIRS-like
data (2000–2021)
Road dataOpenstreetmap30 m × 30 m
raster data
Preprocessing of Arcgis Euclidean distance tool
GDPhttps://www.resdc.cn/ accessed on 5 November 20221 km × 1 km
raster data
Preprocessing of Arcgis Euclidean distance tool
Distance from the county government——30 m × 30 m
raster data
Preprocessing of Arcgis Euclidean distance tool
Distance from an ecological reservehttps://data.tpdc.ac.cn/ accessed on 5 November 202230 m × 30 m
raster data
Preprocessing of Arcgis Euclidean distance tool
Level of urbanizationStatistical YearbookexcelArcgis spatial analysis tool
Table 3. Results of the driving factor analysis.
VariableEnvironmental LimitationGeographical LocationEconomic DevelopmentPolicy
X1X2X3X4X5X6X7X8X9X10
Urban−0.06−0.30 **−0.32 **−0.279 **−0.15 **−0.16 **0.49 **−0.030.35 **−0.04
Rural0.10 **0.13 **0.18 **0.138 **−0.01−0.08 **0.10 **0.010.12 **0.09 **
Other0.17 **−0.07 *−0.20 **−0.120 **0.19 **−0.010.21 **0.020.13 **−0.02
Note: ** p < 0.05, * p < 0.1.
Disclaimer/Publisher’s Note: The statements, opinions and data contained in all publications are solely those of the individual author(s) and contributor(s) and not of MDPI and/or the editor(s). MDPI and/or the editor(s) disclaim responsibility for any injury to people or property resulting from any ideas, methods, instructions or products referred to in the content.

