Article

Classification and Evaluation Methods for Optimization of Land Use Efficiency at Village Level

1
School of Urban Design, Wuhan University, Wuhan 430072, China
2
Research Center for Digital City, Wuhan University, Wuhan 430072, China
*
Author to whom correspondence should be addressed.
Land 2023, 12(3), 710; https://doi.org/10.3390/land12030710
Submission received: 28 February 2023 / Revised: 16 March 2023 / Accepted: 17 March 2023 / Published: 19 March 2023

Abstract

:
Land fragmentation hinders sustainable development in rural areas by reducing the efficiency of land use, and it could be mitigated by optimum allocation of land resources. However, most land use allocation models address micro-scale interaction, which is not conducive to the arrangement of the specific implementation plan. Facing such issues, this study proposed a village classification method (LUEOVC) that can provide specific optimization strategies for each village according to different optimization objectives. Specifically, we used a multi-objective particle swarm optimization algorithm to find the best land use adjustment strategies under different land use optimization objectives, and the pros and cons of these strategies are based on land use efficiency evaluation. The proposed village classification method can reflect the impact of the optimal allocation of different types of land resources on the land use efficiency of each village. The results of experiments conducted in Xinxing County, Guangdong Province showed that the village-based land use optimization strategy provided in this method can improve the land use efficiency of the cultivated land with the most serious fragmentation in the study area by 0.9%. The method also enables planners to compare the costs and gains under different objections, so as to better help decision-makers in formulating land use optimization strategies for different villages.

1. Introduction

As we all know, land resources are limited, and with the continuing growth of the population and global warming, land resources will become increasingly scarce [1]. It is necessary to improve the efficiency of land use to better address global challenges such as food security, climate change and ecological security [2,3]. Land use fragmentation is a common phenomenon that reduces the efficiency of land use in rural areas. It also comes into conflict with intensive use of agricultural land, modernization of farm machinery and increase in farmers’ net incomes [4,5,6]. Although some studies believe that land use fragmentation has some positive effects, it is important to note that this requires the degree of land use fragmentation be limited to a certain range [7,8,9]. In addition, land fragmentation tends to intensify over time, eventually leading to land degradation or nonagricultural conversion, which is not conducive to sustainable development in rural areas [10,11,12]. Therefore, it is very necessary to adopt various means to adjust the layout of land use to curb the fragmentation of land use.
The optimum allocation of land resources can mitigate such problems caused by the spatial structure defects of land use and promote the intensive use of land resources. Sustainable land use allocation seeks to take into account the current situation and multiple objectives in order to determine so-called “optimal” land use allocations [13,14]. It also aims to minimize the amount that has to be given up for achieving the optimization [15]. Simple land allocation optimization problems can take evaluation approaches, but when the problem involves more possible solutions, it cannot be solved with evaluation methods anymore. These complex land use allocation problems have been widely formulated as mathematical optimization problems [16]. Most of the optimization problems based on spatial land use allocation are nonlinear multi-objective combinatorial optimization problems. For these problem types, heuristics algorithms are more appropriate than exact solution methods [17]. The commonly used heuristic algorithms for land use optimization problems include: genetic algorithm (GA), nondominated sorting genetic algorithm II (NSGA-II), particle swarm optimization (PSO) and simulated annealing (SA) [18]. Heuristics algorithms help with the evaluation of trade-offs among conflicting objectives and find high-quality solutions. Although the solutions are not necessarily optimal, the near-optimality, speed and simplicity of heuristics algorithms make them acceptable [19].
Despite its many advantages, there are still some problems with the method of land use allocation. For land use allocation, the ultimate goal of a land use problem is to determine the specific locations of a set of land types to maximize or minimize their satisfaction with the relevant objectives. In most studies, the specific locations are homogeneous cells of the observed region, which means the solutions of the land use allocation problems are often detailed and holistic. This makes implementation of the specific plan difficult [14,20]. Due to financial and personnel limitations, simultaneous optimization work is impossible [21]. Therefore, it is necessary to determine optimization goals at the regional level.
One suggestion is to adopt village classification. Village classification extracts villages with similar characteristics based on specific principles and groups them into one category, so as to facilitate the formulation of appropriate strategies or reference recommendations for areas with the same development status and problems [22]. In addition, taxonomic methods can linearly sort items in the form of scores or grades based on the same village evaluation indicators to provide more granular classification and prioritization. The similarity between the spatial morphological characteristics of villages and the functions of land use are important parts of the classification of villages, through which the socioeconomic characteristics and the development potential of villages can be identified [23,24]. Most of the classification results can accurately evaluate the development status of each village and identify villages with similar characteristics but cannot provide accurate spatial optimization opinions.
In connection with the above, the purpose of this article is to develop and present the proposed village classification method called “land use efficiency optimum village classification” (LUEOVC) to improve land use efficiency in rural areas. The LUEOVC mainly relies on land use efficiency evaluation and a multi-objective particle swarm optimization algorithm. The evaluation of land use efficiency, based on land fragmentation, slope complexity and accessibility, facilitates the analysis of the land use efficiency in each village under different land use layouts. The multi-objective particle swarm optimization algorithm is utilized to find the land optimization results with minimal reallocation scale and best land use optimization effect for each village under different optimization goals. The proposed village classification method for improving the efficiency of land use in rural areas reflects the impact of the optimal allocation of different types of land resources on the land use efficiency of each village, so as to assist decision-makers in the field of land resource allocation and coordination to identify the areas where land use needs to be optimized and the optimization measures that need to be taken.

2. Materials and Methods

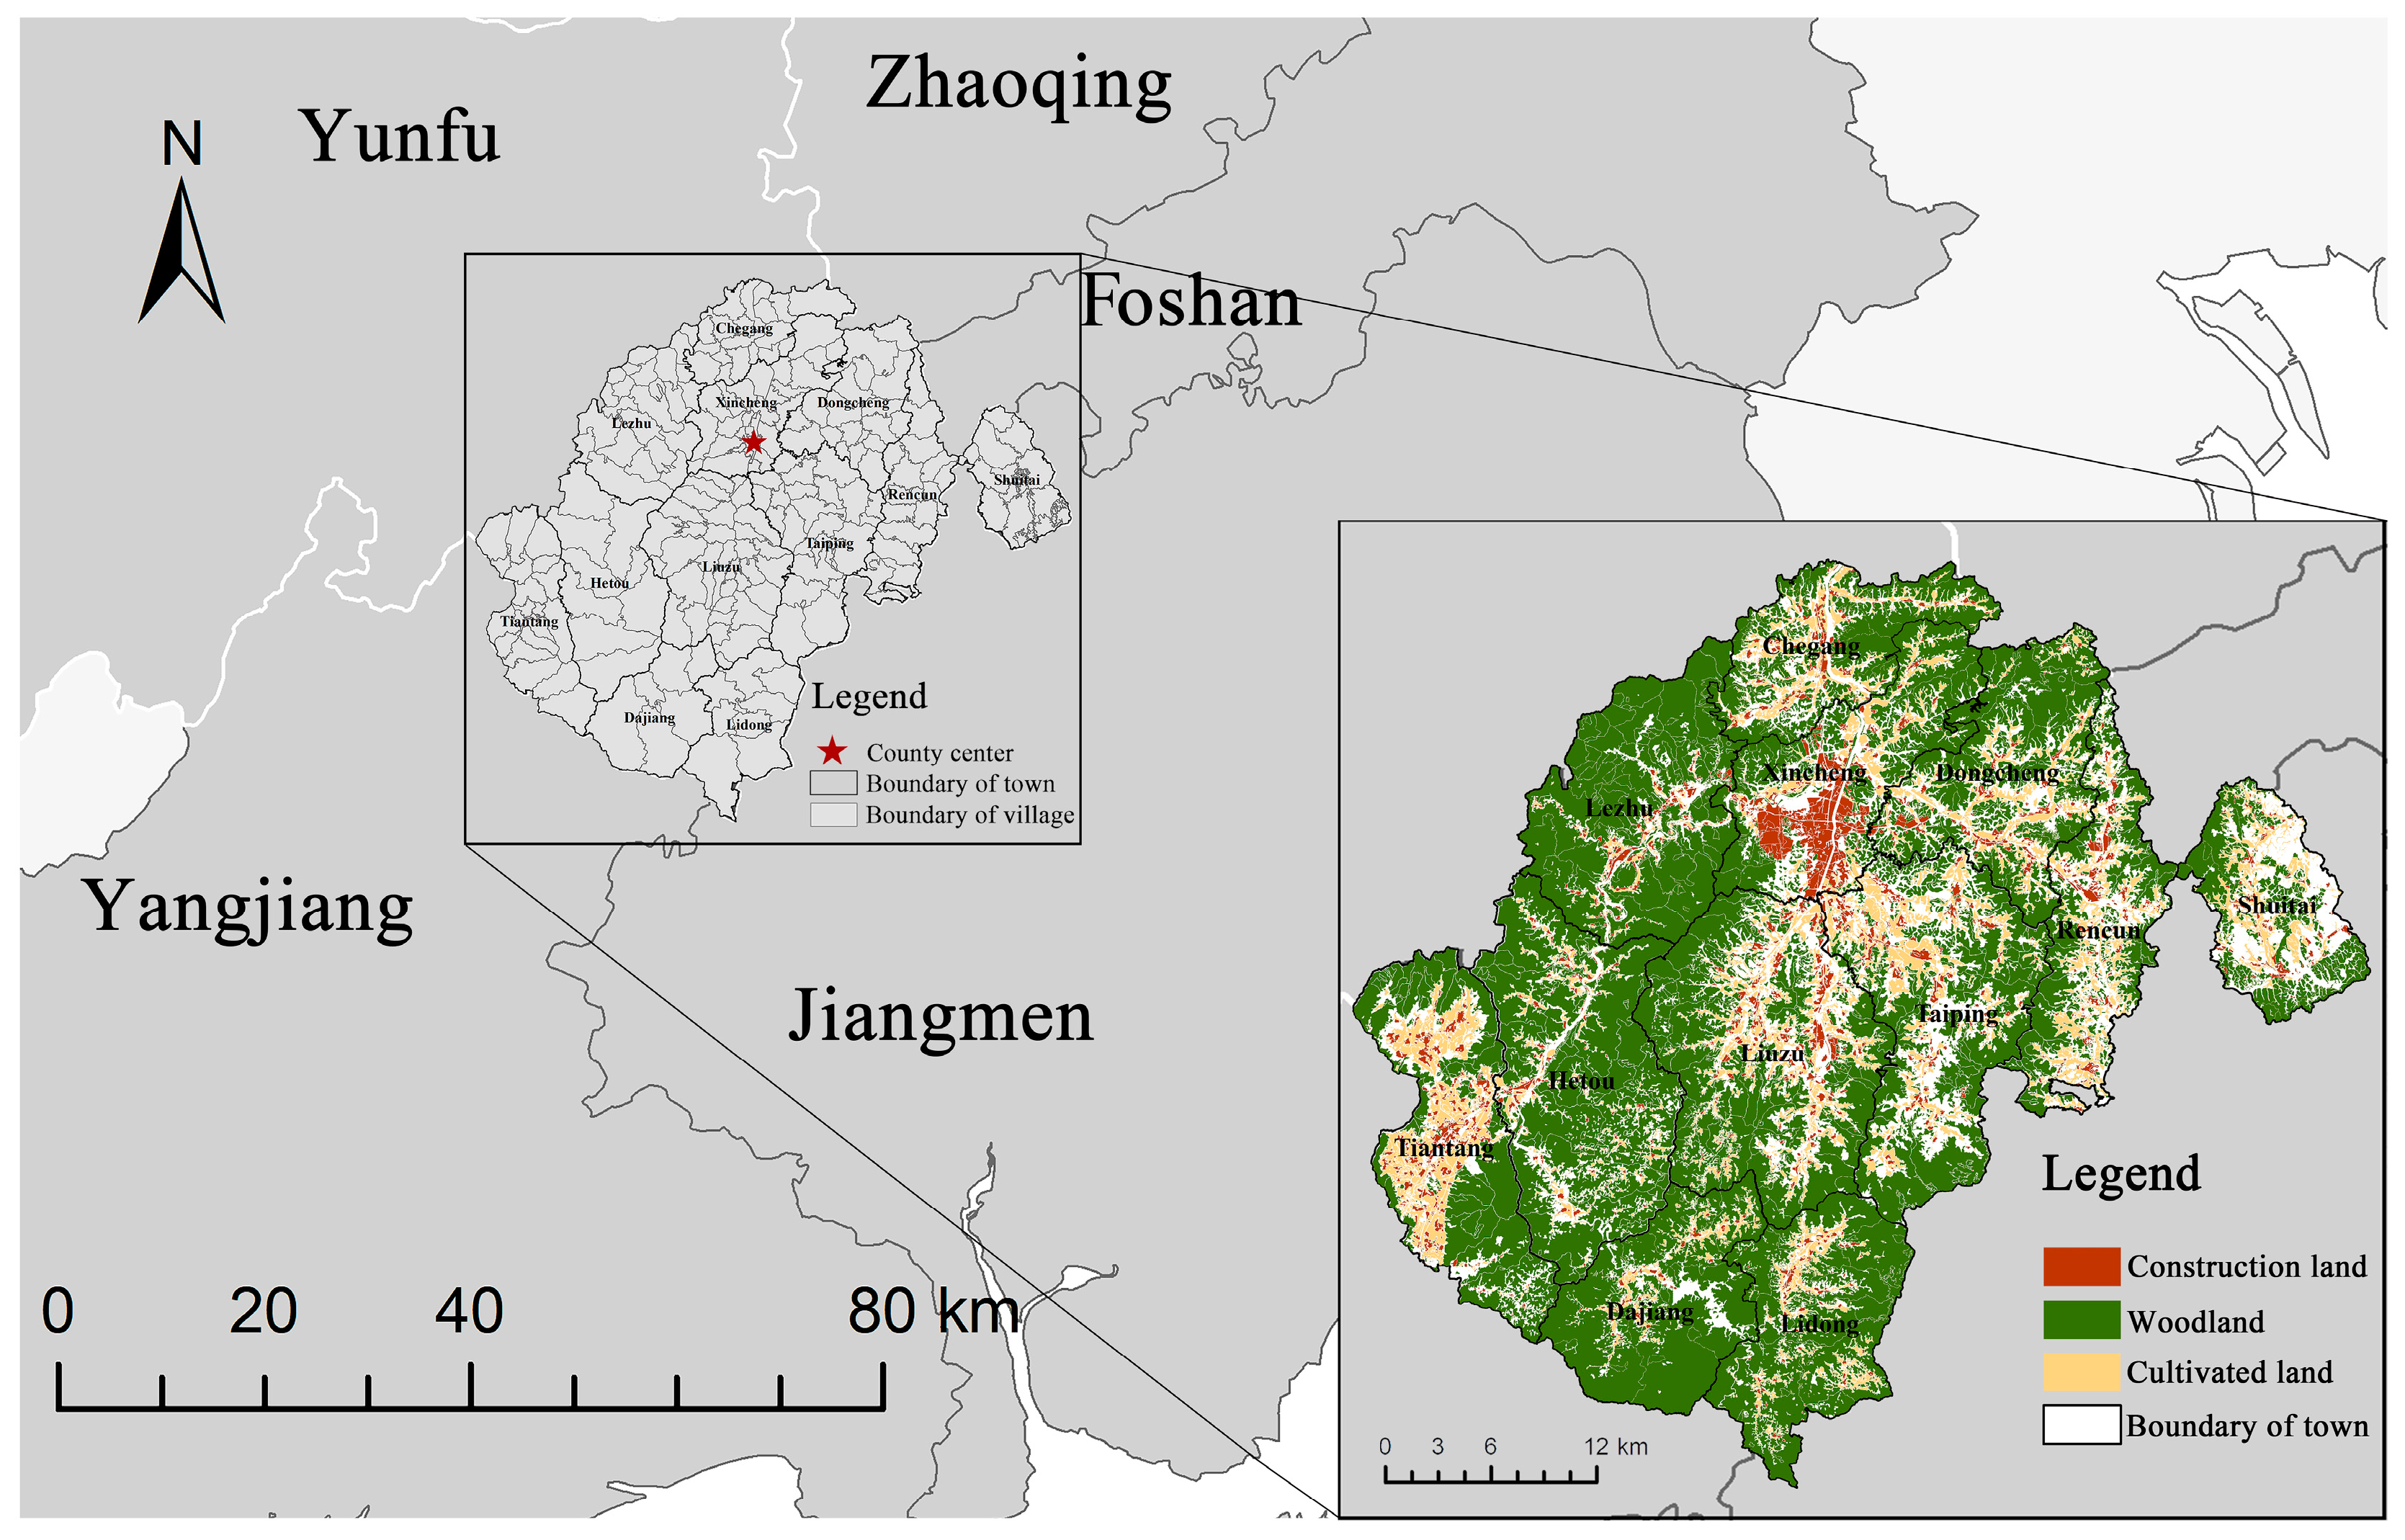
2.1. The Study Area and Data

The area proposed for land use allocation optimization is Xinxing County, which is located in Yunfu City, Guangdong Province, China (Figure 1). The area is 152,168 ha in size and includes 199 villages. Hilly area accounts for 67.4% of the total area of the region, which makes the land use in the area more fragmented, especially the cultivated land. Within the area, 162 villages were selected for our case study. The remaining 37 villages were excluded from the study because of their special attributes. Woodland, cultivated land and construction land are the main types of land use in the study area, and optimizing these three types of land use can effectively improve the overall land resource utilization efficiency of the region. Therefore, woodland, cultivated land and construction land were selected for land use optimization.
The study uses land use data derived from the third national land resource survey of the People’s Republic of China as the basis for assessing and analyzing land use in the study area. The remaining data are 30 m resolution DEM (digital elevation model) data from the geospatial data cloud of the Computer Network Information Center of the Chinese Academy of Sciences and road network data from OSM (Open Street Map).
The research was carried out in this area because of the visible land fragmentation, the partially irrational cultivated land layout and the need to improve agricultural machinery efficiency. A typical land use feature is the fragmentation of land use caused by the disorderly spread of cultivated land in large areas of woodland. By formulating appropriate land use optimization strategies for each village, it will help in reducing land use fragmentation, promote the efficient use of land resources, and achieve sustainable rural development.

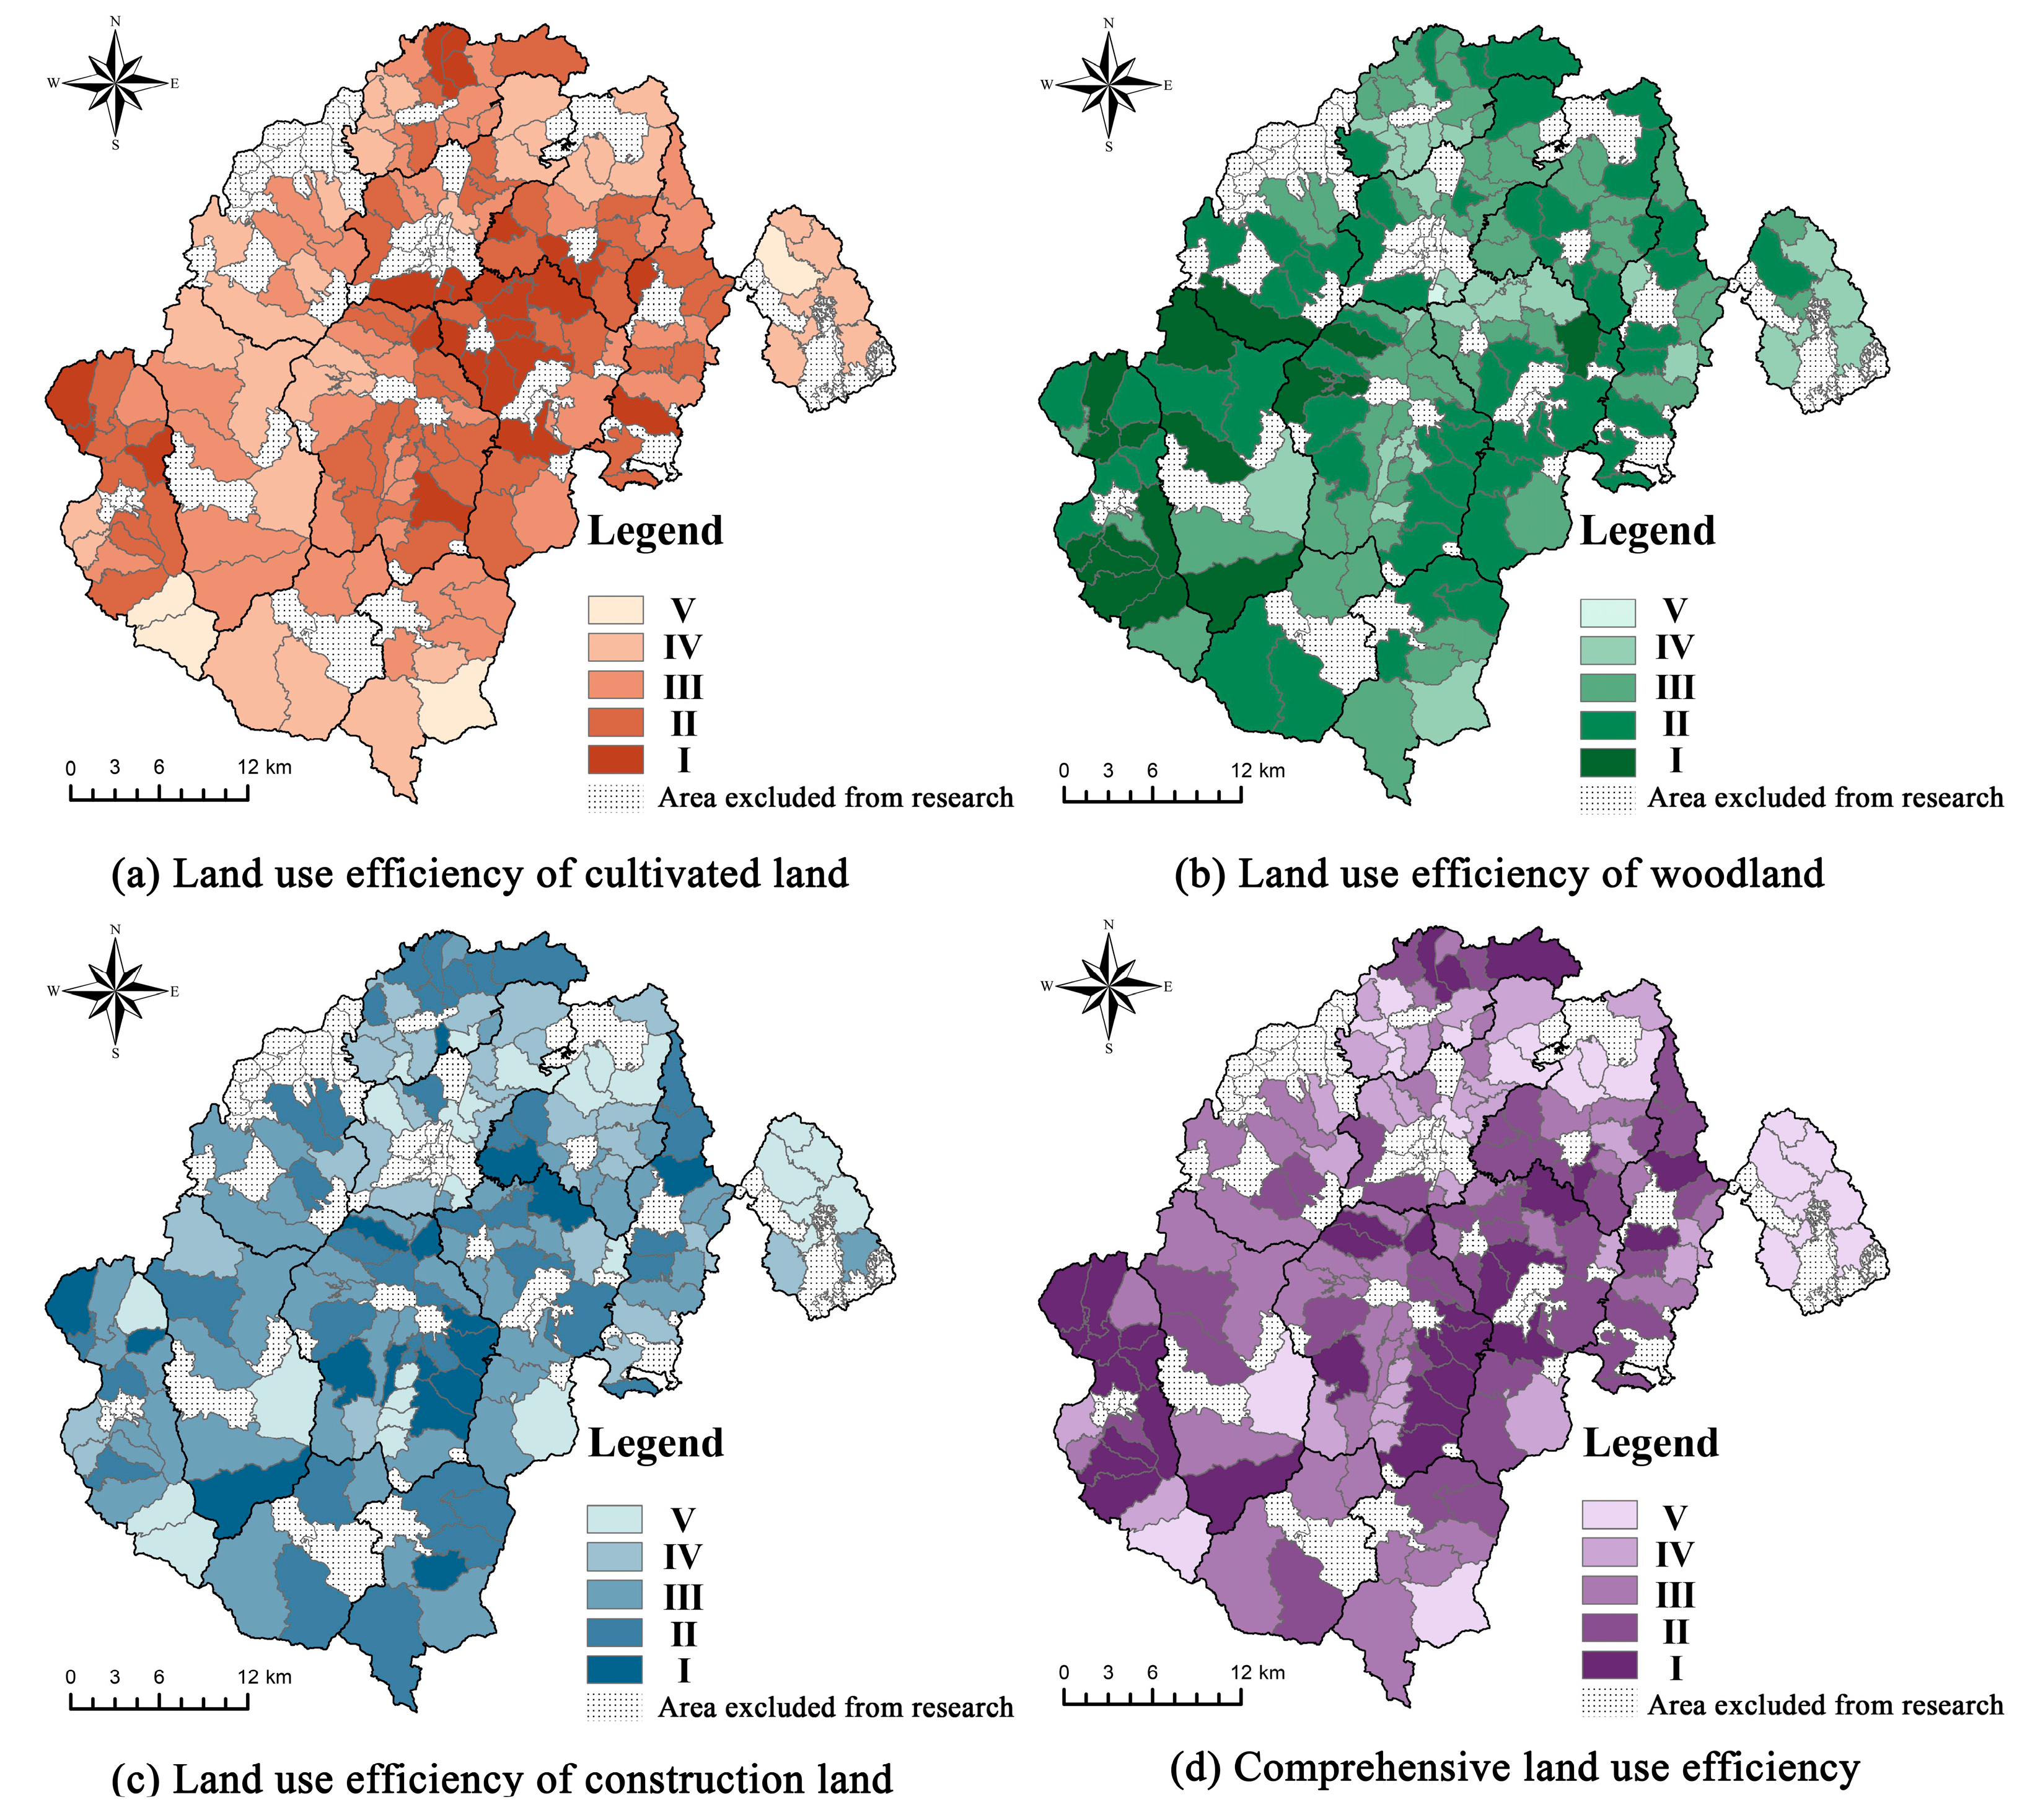
2.2. Land Use Efficiency Evaluation

There are many factors affecting the efficiency of land use, and the three factors that have the greatest and most direct impact on the intensive use of land resources were selected for the study area: land fragmentation, large terrain fluctuations and poor accessibility.
In earlier related studies, the evaluation of land fragmentation mainly used the average size and number of plots [25,26]. Some parameters applied for land fragmentation, such as the Januszewski index, Simpson index and Simmons index also describe the relationship between the number and size of plots in the study area [27,28,29,30]. Quantity and size are indeed important factors affecting the fragmentation of land use, but not all. The more complex indices allow for a synthetic analysis of a wide spectrum of factors, including the shapes, distribution, ownership and accessibility of plots [31,32]. With the advancement of research, the correlation between landscape pattern index and land fragmentation has been carried out, and researchers believe that landscape pattern index can reflect more spatial structural changes [33,34].
Road accessibility affects the value of plots [32]. For cultivated land, on the one hand, higher accessibility save production and transportation costs, thereby increasing the income of villagers [35]; on the other hand, convenient transportation conditions can bring more basic opportunities (such as medical care, education, work, etc.) to the local area, helping people living in the region out of poverty and reducing population loss [36,37]. In most cases, the evaluation of accessibility mainly evaluates the distance of the plot from the road, but accessibility can also be used to assess the ease of access to other resources of the plot, such as water resources, power resources, etc. [38]. In addition, field surveys conducted in the study area found that plots far from major roads were difficult to apply appropriate machinery to, and the agricultural production was inefficient.
Flat terrain conditions favor agricultural mechanization production as well as town construction. According to the Technical Regulations for the Third National Land Survey (TD/T 1055-2019) issued by the Ministry of Natural Resources of China (MNR, PRC), cultivated land is divided into 1–5 grades according to the topographic slope. Plots with a slope of no higher than 6 are considered less prone to soil erosion and are more suitable for agricultural production. The productivity of cultivated land is closely related to the topographic slope. Xu et al. simulated the relationship between crop yield, soil and water loss and topographic condition in the Loess Plateau region, and believed that higher slope reduced crop yields and increased soil erosion, and cultivated land with a slope of less than 5 was appropriate [39]. Compared with cultivated land, woodland provides effective protection from organic matter decline due to erosion process, and is more appropriate for undulating areas [40].
Therefore, based on the previous research results and the specific conditions of the research area, the authors selected six indicators from the three aspects of scale, shape and distribution based on the landscape pattern index to assess the fragmentation of land use. At the same time, combined with the slope complexity index and the access parameters to study the suitability of the land for cultivated land and construction land in the study area, as shown in Table 1. Since the requirements of woodland on the distance from roads and slope complexity are relatively low compared with cultivated land and construction land, and the impact of daily activities of the population on the woodland ecological environment has not yet shown clear pros and cons, the evaluation of the efficiency of land use for woodland does not consider its slope complexity index and accessibility.
The land fragmentation evaluation index was calculated according to the specific algorithm provided by the landscape pattern index, and the accessibility parameters calculate the shortest distance from the plot to the trunk road. The slope complexity index mainly evaluates the degree of slope change within the plot, which can be calculated by the aggregation of the proportion of slope change degree, as shown in Equation (1).
S C = j = 1 k R j S j S m i n S m a x S m i n
where S C is the slope complexity index, R j is the proportion of the land area under the grade j slope to the total land area of the evaluation unit, S j  is the value of j, and S m a x  and S m i n are the maximum and minimum value of the slope in the evaluation unit.
The values of the indicators to measure land use efficiency have different connotation attributes and dimensions, and direct analysis may weaken the indicator values with lower values, resulting in deviations in the comprehensive analysis structure, so the maximum difference normalization method was used to standardize the indicators, as shown in Equation (2).
Y i j = X i j X j m i n / X j m a x X j m i n , P o s i t i v e i n d i c a t o r X j m a x X i j / X j m a x X j m i n , N e g a t i v e i n d i c a t o r
where Y i j is the standardized value, X i j is the actual value of the j-th index in the i-th village, X j m a x  is the maximum value in the index, and X j m i n is the minimum value in the index.
In order to facilitate the comparison of the utilization efficiency of cultivated land, woodland and construction land of each research unit in the study area, the entropy-right method was used to calculate the comprehensive assessment value of a single land type index in each village, as shown in Equations (3)–(5).
P i j = Y i j i = 1 p Y i j
H j = k i = 1 n P i j l n P i j
W j = 1 H j j = 1 p 1 H j
e = i = 1 p Y i j W j
where P i j is the proportion of standardized indicators; H j represents the entropy of the j-th indicator; k = 1 l n n ; W j  is the weight of the j-th indicator; n is the total number of villages evaluated; and p is the total number of evaluation indicators. e is the efficiency coefficient of land use for the single type of land in the i-th village.
Using the above evaluation, three types of land use efficiency coefficients of each village in the entire study area before and after land use optimization could be obtained separately.

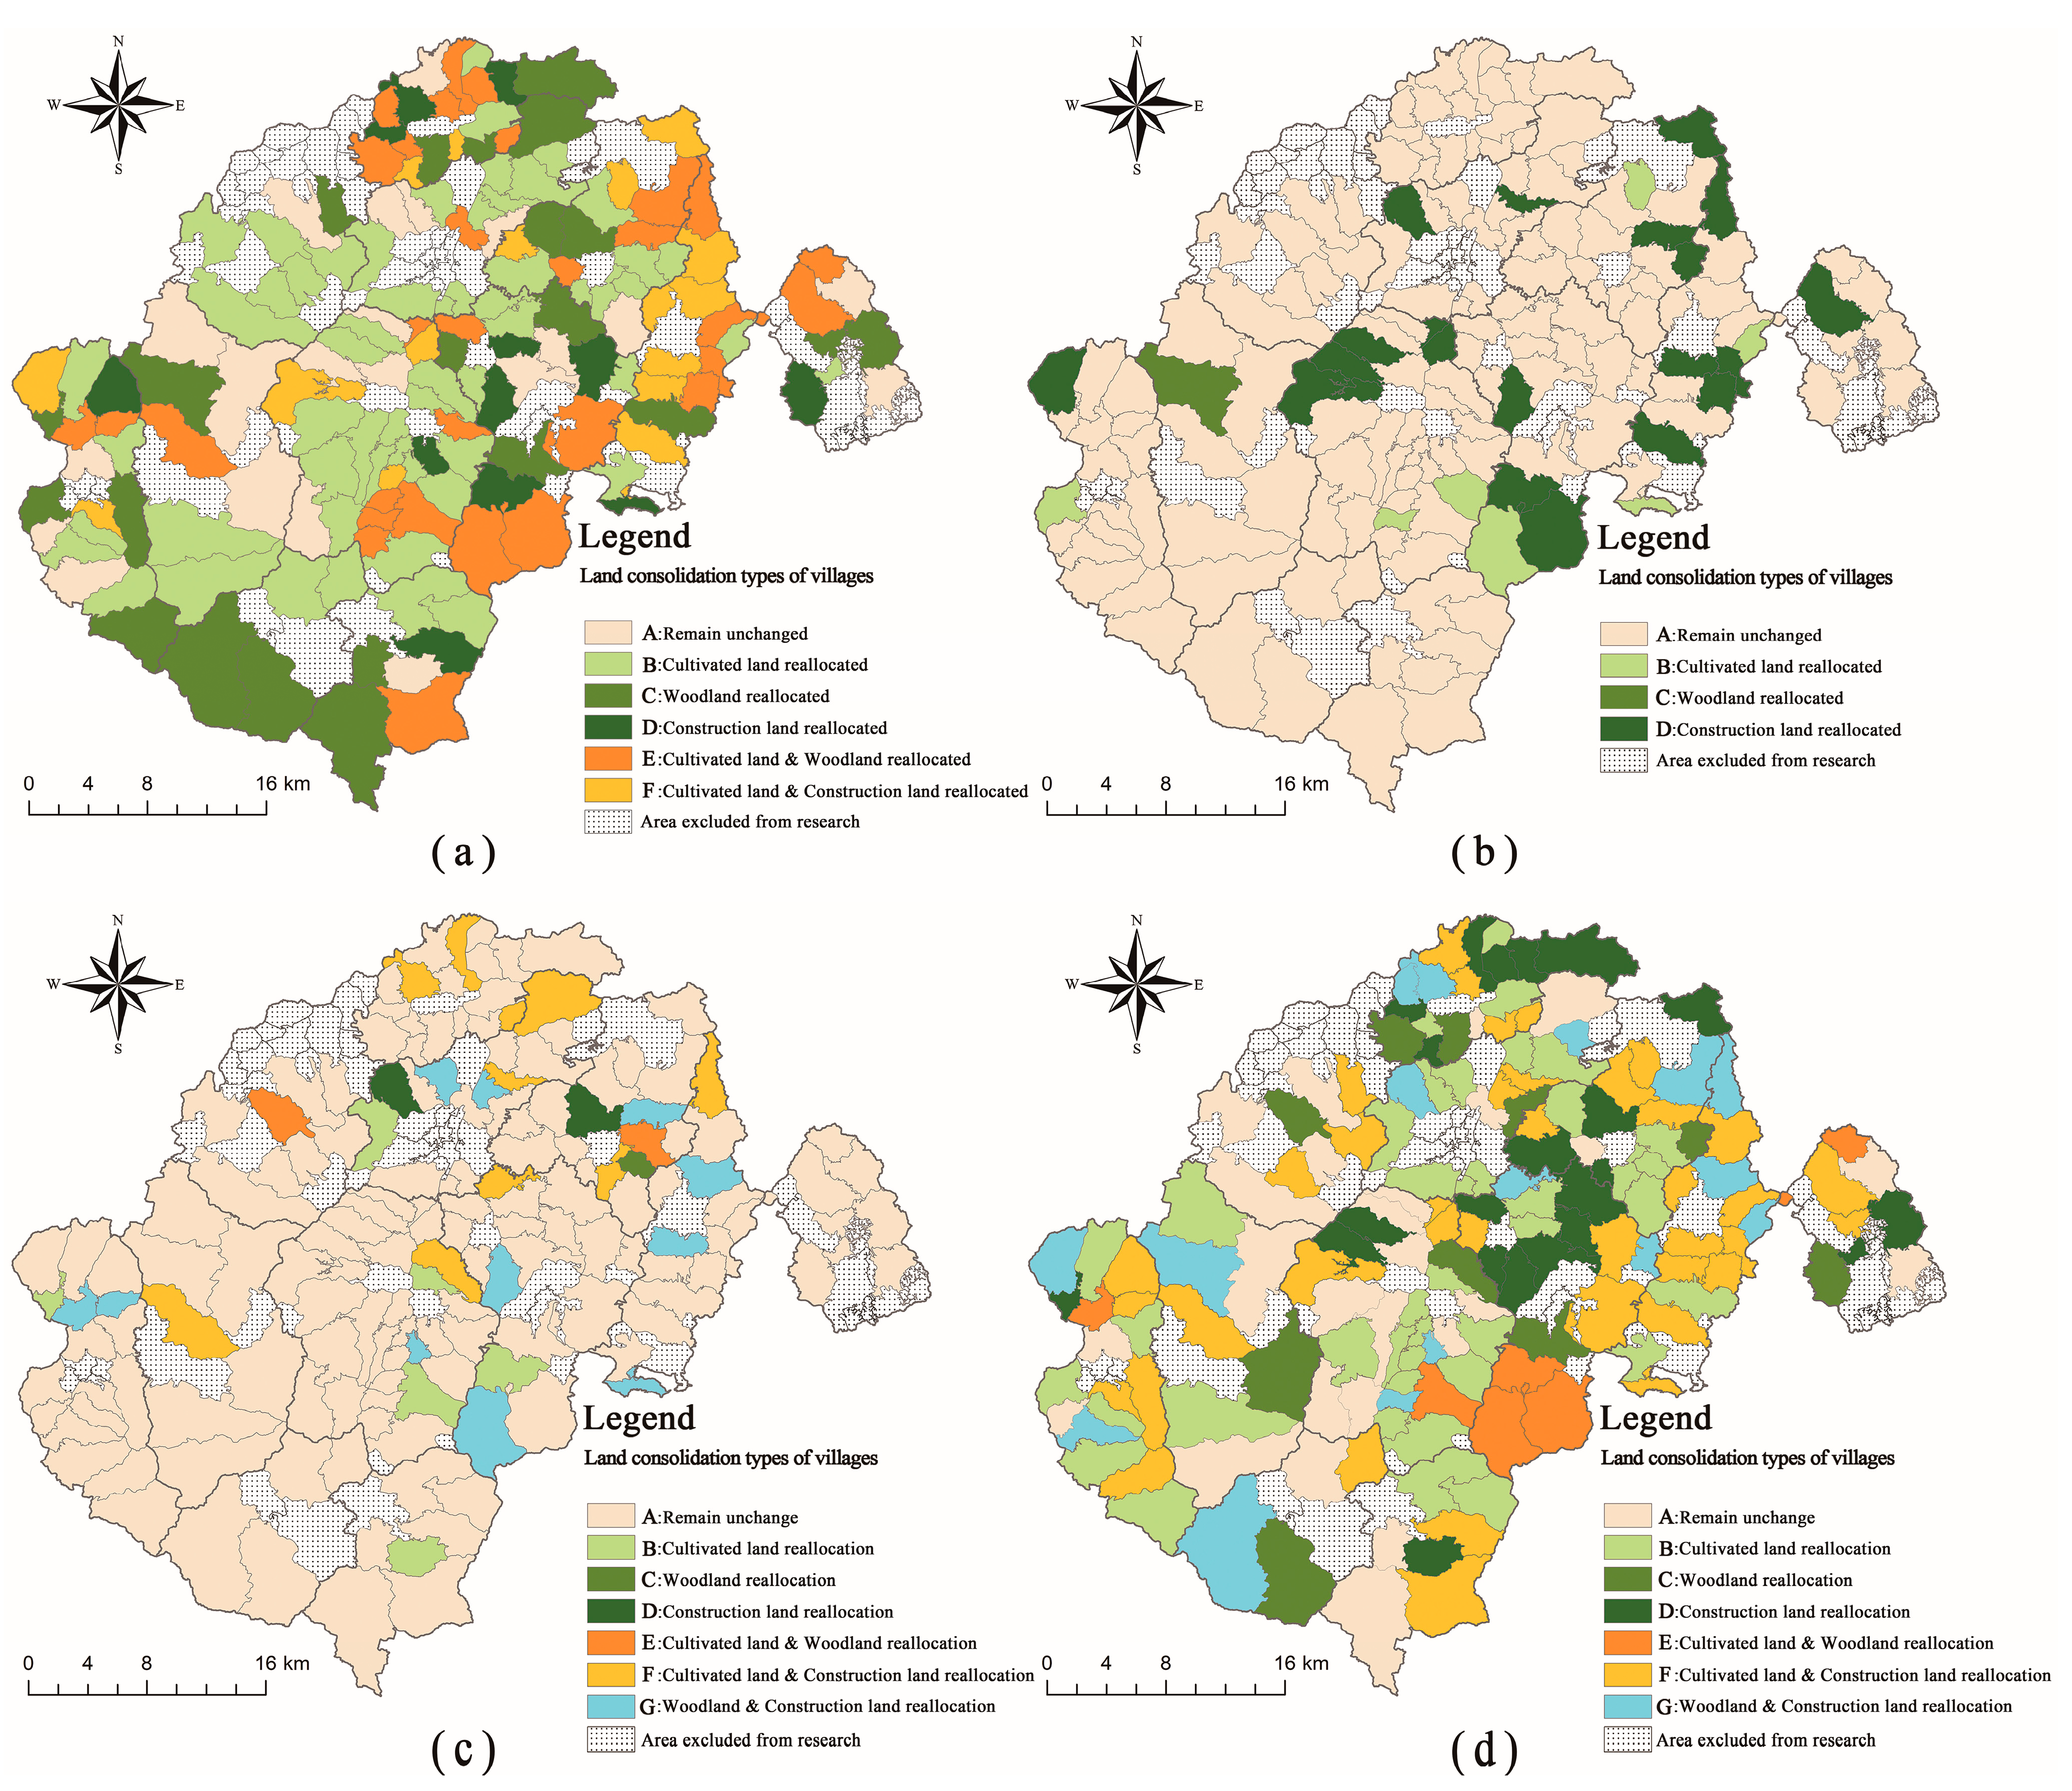
2.3. Village Classification Method for the Purposes of Land Use Efficiency Optimization

For our study, we developed a village classification method to optimize the land use efficiency of each village accurately and efficiency. The entire classification process is composed of two main parts: determination of target plots, and village classification under different optimization objectives.

2.3.1. Determination of Target Plots

At the first stage of the process, the area range of the target plots that need reallocation was determined. The dispersion of a large number of small parcels is the main cause of land fragmentation in rural areas, and it was proposed that smaller land parcels showed a higher potential for improvement [41]. In addition, the area of the plot affects the cost, workload, and ultimate effect of land use optimization. Regarding the exact size of the plot that needs to be optimized and adjusted, most of the studies were based on the researcher’s experience, and usually measured by an average size [42,43]. Some studies explored the relationship between the size of plot and the optimization effect of the land use. Pirjo et al. classified parcel sizes at 5 hectares when studying the parcel characteristics of land consolidation decisions that drive the main crops at farm scale under high latitude conditions, and only considered parcels with an area greater than 0.3 hectares due to the lack of layout information on different crops in farmland parcels with an area of less than 0.3 hectares [44]. In another study on land use optimization for sustainable intensification in high-latitude agricultural systems, they found that when the assessed area exceeded 9 hectares, the parcels could no longer obtain higher assessment scores, and the intensification of parcels with an area of less than 1.7 hectares could make the overall optimization effect better [45]. However, at present, there is no uniform measurement of the area of plots that have a greater impact on land fragmentation.
In this study, the authors counted the number of plots of different sizes in the study area, combined with the previous research, analyzed the land use optimization effect under different size thresholds, and finally selected the target plot size of no more than 1.5 hectares. At the same time, target plots need to meet at least one of the other two types of land. The type of land use that the target plot converse to is determined by the length of the boundary between the plots. According to the slope suitability of cultivated land, the slope of woodland that can be converted into cultivated land should not be higher than 6.
In summary, the target plots for land use optimization need to meet the following conditions:
  • The area should not exceed 1.5 hectares;
  • Border with at least one of the other two types of land;
  • The slope of the woodland should not be higher than 6;
The formation of woodland requires a long time, and the conversion cost between woodland and construction land is high. In addition, the main reason for the fragmentation of land use in the study area is the disorderly spread of cultivated land and construction land, and the original conditions of the woodland are better. Therefore, we made the conversion rules between the three types of target plots shown in Figure 2; cultivated land can be converted to and from two other types of land, but there is no mutual conversion between woodland and construction land.

2.3.2. Village Classification under Different Optimization Objectives

For each village, there are eight possible types shown in Figure 2; we named them from A–H in order, each of which corresponds to different land use optimization measures. For example, if a village is identified as Type A in subsequent classification results, all target plots within the village remain unchanged; if identified as Type B, the target plots of cultivated land in the village need to be reallocated according to the conversion rules described above, and so on. The goal of the decision is to find the appropriate type of classification for each village so that the overall cultivated land, woodland and construction land in the study area would be used more efficiently. At the same time, in order to ensure the food security and development of the research area, the restrictive conditions are that the total area of cultivated land and the total area of construction land are not lower than the current situation. This is a computationally intensive multi-objective Pareto frontier problem, and heuristic algorithms can help find the type for each village that is most conducive to the overall development of the study area [46].
Different heuristic algorithms have different characteristics, the problems to be solved in this study limited the changes to the internal of each village and the choice of village type. The land use within the village was optimized according to the type of village so as to achieve the overall land use optimization objectives of the research area. Our study involves a number of decision variables with constraints, which require the algorithm to have good flexibility to adjust according to the problem, and at the same time to save the calculation cost as much as possible.
The MOPSO algorithm is a multi-objective heuristic algorithm derived from the PSO algorithm. It can be divided into two categories, one that considers each objective function separately, and anther that evaluates all objective functions for each particle and guides the particles by forming nondominated best positions based on the Pareto optimal concept [47]. All Pareto frontier solutions are incapable of improving one objective without impairing another [48]. In our study, both methods were used, and we compared their results. For ease of distinction, here we refer to the first method as SPSO and MPSO as the second method. First, we used the SPSO algorithm to find the optimal solutions that meet different goals under the restrictions. In the second part, we chose the MOPSO (we called MPSO here) algorithm proposed by Coello, Coello, and Lamont (2004), because it has less computational complexity and a quicker convergence [49].
In SPSO, the location of each particle is a solution to the problem in D-dimensional search space, which can be evaluated against the objective function. Each particle can memorize the optimal position of the swarm and that of its own, as well as the velocity. In each generation, the algorithm compares the particle’s current objective function value with the historical best function value and determines the next movement of the particle in the search space until the particles reach balance or optimal state, or go beyond the calculating limits [50]. The velocity and location of a particle are updated according to Equations (7) and (8), respectively.
v i k + 1 = ω v i k + c 1 ξ p i k x i k + c 2 η P i k x i k
x i k + 1 = x i k + r v i k + 1
ω = ω m a x ω m a x ω m i n C u r C o u n t L o o p C o u n t 2
r = 2 | 2 c c 2 4 c , c = c 1 + c 2
where during each iteration, the position of the particle is xi = (x1, x2, … xn); particle velocity is vi = (v1, v2, … vn); the best location in history is Pi = (P1, P2, … Pn); the best position in the current iteration is pi = (p1, p2, … pn); i refers to the i-th particle; k refers to the number of iterations; ξ and η are random numbers that are uniformly in the range (0, 1), providing randomness in the movement of the swarm; c 1  and c 2  are weight factors, also known as cognitive and social parameters, respectively, that control the effect of global optimal positions and particle optimal positions on velocity [51]. ω is the inertia weight and r  is the constraint coefficient used to update the particle’s location. ω m a x  and  ω m i n  are the maximum and minimum values of ω , which is set to 0.9 and 0.4, respectively; C u r C o u n t is the current iteration number; and L o o p C o u n t is the total iteration number of SPSO.
For c 1  and c 2  the same value is usually taken so that the weights for the social and cognition parts are equal to 1. In order to ensure the convergence of the SPSO algorithm, it is necessary to use a constriction factor, at which time the sum of c1 and c2 is usually set to 4.1, and c1 and c2 are 2.05 [52]. r is calculated as 0.729 according to Equation (10).
MPSO extends the PSO strategy for solving multi-objective problems. Unlike single-objective optimization problems, under multi-objective optimization problems, each particle may have a different set of leaders from which just one can be selected to update its position. The leaders are usually stored in a different place from the swarm, called the external archive [49]. At each generation, each particle updates its position according to the leader selected from the external archive and combines a mutation operator to update the overfilled archive. The objective function value is updated by the evaluation of the particle until the optimization criteria are eventually met or the specified number of iterations is reached.
In this article, we first match the two types of method with the problem of village classification. This includes the definition of the final answer, the objective functions, and the constrains.
In the SPSO algorithm used here, each village can be considered as a particle in the search space and has to choose one of the 8 optimization types. The algorithm looks for particle locations that satisfy the objective functions best. First, the swarm is initialized. Then, each particle starts to move at the 8 locations. With any movement of a particle, its value of objective function is calculated. At every step, the algorithm records the position corresponding to the optimal target value generated by individual particles and swarm of particles and uses that position to guide the further movement of the particles. The value of objective function that the final position of the particles corresponding to is the final answer.
Maximizing the benefits of land use optimization requires that the efficiency coefficient of land use be improved, and the cost of optimization is minimized as much as possible. In the objective function of this study, the reason for the use of ranking instead of the land use efficiency coefficient and the total area of land that needs conversion is that there is no comparison between their actual numeric values. For a single category of land, the goal of the classification is to find out the type suitable for each village so that the overall land use efficiency of this type of land is the highest and the total area of the plots that need to be converted is the smallest; when weighing the development of the three types of land and the cost of land conversion to obtain the Pareto optimal solution, the objective function needs to consider the efficiency of the three types of land use. The objective function for each iteration is shown in Equation (11). The land use in the study area is limited by food security and development needs, and Equation (12) is defined as a function of the conversion area coefficient of cultivated land and construction land. The results should be satisfied with no less than zero, otherwise the solution obtained using Equation (7) is invalid.
F : M i n i m i z e f p a r e t o = i = 1 n F l a g ( x i ) ( a i + b i + c i + A i )
f a a = i = 1 n F l a g ( x i ) a a i 0 f c a = i = 1 n F l a g ( x i ) c a i 0
where f p a r e t o is the objective function of the Pareto optimal solution by weighing the efficiency of three types of land use and the scale of land conversion; F l a g ( x i )  is the tag of type and location for each particle, and is set to 1 when the particle selects the location and the corresponding village type, otherwise it equals 0; a i , b i , c i  are the descending ranking of land efficiency coefficients of cultivated land, woodland and construction land; A i  is the ascending ranking of land conversion scale of each village under different types; a a i  and  c a i  are the area coefficients of cultivated land and construction land that need conversion in each village under different types.
In the MPSO algorithm used here, the particles represent every possible arrangement of types for all villages. The goal of the algorithm is to find a nondominant solution set that satisfies the objective functions best while satisfying the limit. There are four objective functions considered separately in this research: maximization of land use efficiency of cultivated land, woodland and construction land; minimization of the reallocation scale. These four objective functions are not merged here, and each particle corresponds to an array of four values. The movement of particles inspired by the comparison between the array of the particles. Ultimately, the nondominant solution set with the highest values of objective functions is found.

3. Results and Discussion

The weight of various indicators on the village land use efficiency coefficient score during the evaluation process is shown in Table 2. MPS had the smallest impact on the three types of land use efficiency coefficient, FN had the greatest impact on the efficiency coefficient of cultivated land and construction land, and PD had the greatest impact on the efficiency coefficient of woodland. The evaluation indicators selected for this study were decided after careful consideration, and on the basis of reference to existing studies, the indicators with the most direct impact on the efficiency of land use were selected. The evaluation avoided the bias caused by the use of only the area and the number of parcels, increased the evaluation of the slope complexity and accessibility, and improved the accuracy of the land use efficiency coefficient evaluation.
As shown in Figure 3, the natural breakpoint method divided the efficiency of land use from high to low into I–V. Villages with high land use efficiency coefficient of cultivated land are concentrated on the southeast side of the county center, which have a large permanent population and are close to the town and main road. Villages with high land use efficiency coefficient of woodland are concentrated in the west of the study area. These villages have a good original ecological environment and large topographic fluctuations, which are not suitable for development and construction, so most of them remain unchanged or make only minor land use adjustments during subsequent land use optimization. Compared with cultivated land and woodland, the villages with high land use efficiency coefficient of construction land are scattered, but the overall evaluation coefficient difference is small. The high-value villages are mainly concentrated in Liuzu town in the middle of the study area. The land use efficiency of construction land is closely related to the local economic conditions and the development planning of the government. Liuzu town has a good cultural heritage. Relying on the historical and cultural protection sites such as Guoen temple, the local area has developed into a tourist town, which has promoted local economic development and infrastructure construction. The distribution of villages with good comprehensive land use efficiency is similar to that of villages with good construction land efficiency, and the economic, ecological, and agricultural development of these areas is better.
We compared the evaluation results of cultivated land use efficiency with farmers’ views on cultivated land use efficiency and production mode in field research. In the summer of 2022, a total of 20 pilot villages were selected from villages with various land use efficiency coefficients of grade V and I for semi-structured interviews. The interviewees were mainly village committee staff, and also asked local farmers in order to obtain more comprehensive information. The interviews in each village lasted about three hours. In addition to agricultural production, other issues such as economic development, infrastructure construction, and population loss were also discussed. All interviews were conducted without informing the interviewees of the evaluation results of local land use efficiency. The interview results were compared with the evaluation results to verify the effectiveness of the evaluation method.
The analysis of the interview results showed that the reliability of the evaluation method is high. The villages with a grade I cultivated land use efficiency coefficient have low cultivated land fragmentation, small slope fluctuation, and good cultivated land quality and yield. They usually adopt mechanical farming for agricultural production activities and are the main grain producing areas of the study area. In addition, the villages located in the northeast of the study area have more convenient agricultural trade terms than other villages in the study area because they are close to the town center. Proximity to towns has promoted the conversion of agricultural land into nonagricultural land in these villages, reducing the area of woodland and increasing the area of construction land. On the contrary, villages with a grade V cultivated land use efficiency coefficient generally have a high degree of fragmentation of cultivated land, and some cultivated land is located in areas with greater reclamation difficulties, such as mountains. The soil quality and the surrounding environment of the plots are not suitable for farming. Due to the large slope of the mountain, the plots are far away from the main road, and small machinery is often unable to reach the plots, resulting in the extremely low production efficiency of cultivated land in these villages. In order to increase their income, farmers choose to plant cash crops in these plots that are not conducive to farming, such as the unique local green plum tree. This conflict between land use allocation and actual function confirms the need for land use optimization in the study area to better promote the efficiency of land use.
The land use efficiency evaluation method was used to calculate the land use efficiency of different types of land after land use optimization in each village. The efficiency of land use after land use optimization served as the basis for the SPSO and MPSO to select the best land use optimization type for each village. According to the different optimization objectives, the villages in the study area were grouped by the classification method. Table 3 shows the optimized land use efficiency of three types of land corresponding to any of the objective functions in the region. It should be noted here that in the SPSO, we set four goals, namely, to maximize the land use efficiency of cultivated land (Objective1), woodland (Objective2), and construction land (Objective3), respectively, under the premise of minimizing the scale of land reallocation, and to minimize the sum of the degrading ranking of the land use efficiency and the ascending ranking of the land redistribution scale (Objective). In the MPSO, we only needed to select the solution with the greatest efficiency coefficient of cultivated land, woodland, and construction land in the final set of results. For comparison, the value of objective functions in current status are also shown.
Figure 4 shows the three-dimensional visualization of the Pareto-front answers and its projection to the two-dimensional objective spaces (a space consisting of only two of the three objectives) under two different algorithms. When each objective function was considered separately in SPSO, the value of each objective function in the best solution related to that objective was higher than the current condition. In addition, the efficiency of land use in cultivated land and woodland was improved more significantly, and the scale of land reallocation under different objectives was smaller. Land use efficiency of the cultivated land with the most serious fragmentation in the study area could be improved by 0.9% with a land use reallocation scale of 852.97 ha. The results of MPSO showed higher potential for improving the efficiency of construction land, but the scale of land reallocation was larger. When the objective was to weigh the efficiency of the three types of land use to achieve the Pareto optimal solution with the smallest land use optimization scale, the classification result chose to sacrifice a small part of the woodland use efficiency to better improve the land use efficiency of cultivated land and construction land and thus promote an improvement in the overall land use efficiency of the region.
In view of the fact that the objective function can achieve better land use efficiency improvement with a smaller land reallocation scale, this paper used the results of the SPSO to classify the villages. The classification results are shown in Figure 5; four small figures in Figure 5, respectively, showed the types of land use optimization required by different villages when optimizing the land use efficiency of cultivated land, woodland, construction land, and comprehensive land use efficiency. Among the village classification results with the optimal land use efficiency of woodland (Figure 5b) and the optimal land use efficiency of construction land (Figure 5c), most villages are classified as Type A; the proportion of villages that need land use optimization was relatively small, 17.3% and 20.4%, respectively. This showed that the land use efficiency of woodland and construction land in the study area is better than that of cultivated land. When the ultimate objective was to optimize the efficiency of woodland, the type of land use optimization that villages needed to carry out, all but Type A, focuses on Type B–D, which means the reallocation of singular land use. When the ultimate goal was to optimize the efficiency of construction land, some villages needed to reallocate two types of land.
In previous work, classification was usually based on evaluation indicators to combine villages with similar characteristics into a group, and then determine the land use optimization strategy for different groups, which may ignore the different potential of villages in land use optimization [21]. Our method determined the classification objectives in terms of land use efficiency improvement, and the classification results obtained according to the algorithm meet the expected objections. At the same time, it can analyze the potential of land use efficiency improvement after land use optimization for each land use type in different villages. The methodology we proposed could serve as a basis for the development of land use optimization projects in rural areas. According to the classification results provided by the method in this paper, the order of land use optimization can be further determined. It is suggested that after determining the land use optimization category of each village in the study area, priority should be assigned to villages with greater land use efficiency improvement under the same land use optimization scale.

4. Conclusions

Land fragmentation is an important factor hindering sustainable development in rural areas, as it reduces the efficiency of land use. Land fragmentation can be effectively mitigated through the optimum allocation of land resources. In the past, a number of land use allocation models were proposed, but most of them address microscale interaction, which is not conducive to the arrangement of the specific implementation plan. Research on village classification attempts to classify villages by the similarity of village characteristics, thereby identifying different land optimization allocation goals, but ignores the spatial differences in the potential for land use efficiency improvement. With the combination of land use efficiency evaluation and multi-objective particle swarm optimization algorithm (MOPSO), a novel village classification method named LUEOVC, is presented in this article. Different from previous works, the proposed method addresses land use optimization objectives at the village level. At first, the LUEOVC evaluated the current land use efficiency of various types of land in different villages using land use efficiency coefficients and considered the factors that cause the difference in land use efficiency according to the actual situation. Then, a multi-objective particle swarm optimization algorithm (MOPSO) module was used to generate optimal classification for each village based on different objective functions.
In this paper, we used two types of MOPSO algorithms, first using the SPSO algorithm to consider different objective functions, and then directly using the MOPSO algorithm (MPSO) proposed by Coello, Coello, and Lamont to find the solutions that match the goals in the Pareto frontier obtained. Through comparison, it was found that the solutions obtained using the first method could achieve a greater improvement of land use efficiency with a smaller scale of land use reallocation, especially for the cultivated land and woodland. Therefore, the classification results obtained by the first method were adopted.
The LUEOVC was applied to the village classification for land use efficiency optimization in Xinxing, a county with severe land fragmentation in China. Four types of village classification under different objective functions were successfully generated by using this proposed method. This indicates that the LUEOVC is an efficient village classification method for land use efficiency optimization. The method reflects the difference in land use efficiency and improvement potential of each village. Furthermore, the method also enables planners to compare the costs and gains under different objections, so as to better help decision-makers in formulating land use optimization strategies for different villages. By adjusting the evaluation indexes of land use and constraints of algorithm, we also expect that this method can provide support for the optimization of land use layout aiming at ecological sensitivity and land use suitability.
It should be noted that different research areas, restrictions on land use optimization, and the algorithm used will lead to differences in the results of village classification. In this study, due to the high degree of land fragmentation in the study area, and considering the cost of land use optimization, we limited the area of the target plots to less than 1.5 hectares. When the area of the target plots increases according to the actual demand, the overall land use efficiency improve. However, there is a lack of relevant research on the relationship between the size of target plots and land use efficiency, which should be further studied in the future.

Author Contributions

Conceptualization, X.C. and Q.Z.; methodology, X.C. and Y.F.; resources, Q.Z.; writing—original draft preparation, X.C.; writing—review and editing, Q.Z. All authors have read and agreed to the published version of the manuscript.

Funding

Key-Area Research and Development Program of Guangdong Province, China: 2020B0202010002; National Natural Science Foundation of China: 52078389.

Institutional Review Board Statement

Not applicable.

Informed Consent Statement

Not applicable.

Data Availability Statement

Not applicable.

Conflicts of Interest

The authors declare no conflict of interest.

References

  1. Smith, P. Managing the global land resource. Proc. Biol. Sci. 2018, 285, 1874. [Google Scholar] [CrossRef] [Green Version]
  2. Li, D.; Fan, K.; Lu, J.; Wu, S.; Xie, X. Research on Spatio-Temporal Pattern Evolution and the Coupling Coordination Relationship of Land-Use Benefit from a Low-Carbon Perspective: A Case Study of Fujian Province. Land 2022, 11, 1498. [Google Scholar] [CrossRef]
  3. Myers, S.S.; Smith, M.R.; Guth, S.; Golden, C.D.; Vaitla, B.; Mueller, N.D.; Dangour, A.D.; Huybers, P. Climate Change and Global Food Systems: Potential Impacts on Food Security and Undernutrition. Annu. Rev. Public Health 2017, 38, 259–277. [Google Scholar] [CrossRef] [PubMed]
  4. Liu, J.; Jin, X.; Xu, W.; Sun, R.; Han, B.; Yang, X.; Gu, Z.; Xu, C.; Sui, X.; Zhou, Y. Influential factors and classification of cultivated land fragmentation, and implications for future land consolidation: A case study of Jiangsu Province in eastern China. Land Use Policy 2019, 88, 104185. [Google Scholar] [CrossRef]
  5. Hartvigsen, M. Land reform and land fragmentation in Central and Eastern Europe. Land Use Policy 2014, 36, 330–341. [Google Scholar] [CrossRef]
  6. Manjunatha, A.V.; Anik, A.R.; Speelman, S.; Nuppenau, E.A. Impact of land fragmentation, farm size, land ownership and crop diversity on profit and efficiency of irrigated farms in India. Land Use Policy 2013, 31, 397–405. [Google Scholar] [CrossRef]
  7. Ciaian, P.; Guri, F.; Rajcaniova, M.; Drabik, D.; y Paloma, S.G. Land fragmentation and production diversification: A case study from rural Albania. Land Use Policy 2018, 76, 589–599. [Google Scholar] [CrossRef]
  8. Ntihinyurwa, P.D.; de Vries, W.T.; Chigbu, U.E.; Dukwiyimpuhwe, P.A. The positive impacts of farm land fragmentation in Rwanda. Land Use Policy 2019, 81, 565–581. [Google Scholar] [CrossRef]
  9. Rybicki, J.; Abrego, N.; Ovaskainen, O. Habitat fragmentation and species diversity in competitive communities. Ecol. Lett. 2020, 23, 506–517. [Google Scholar] [CrossRef]
  10. Sikor, T.; Müller, D.; Stahl, J. Land Fragmentation and Cropland Abandonment in Albania: Implications for the Roles of State and Community in Post-Socialist Land Consolidation. World Dev. 2009, 37, 1411–1423. [Google Scholar] [CrossRef]
  11. Qiu, F.; Laliberté, L.; Swallow, B.; Jeffrey, S. Impacts of fragmentation and neighbor influences on farmland conversion: A case study of the Edmonton-Calgary Corridor, Canada. Land Use Policy 2015, 48, 482–494. [Google Scholar] [CrossRef]
  12. Sklenicka, P. Classification of farmland ownership fragmentation as a cause of land degradation: A review on typology, consequences, and remedies. Land Use Policy 2016, 57, 694–701. [Google Scholar] [CrossRef] [Green Version]
  13. Polasky, S.; Lewis, D.J.; Plantinga, A.J.; Nelson, E. Implementing the optimal provision of ecosystem services. Proc. Natl. Acad. Sci. USA 2014, 111, 6248–6253. [Google Scholar] [CrossRef] [PubMed] [Green Version]
  14. Liu, X.; Ou, J.; Li, X.; Ai, B. Combining system dynamics and hybrid particle swarm optimization for land use allocation. Ecol. Model. 2013, 257, 11–24. [Google Scholar] [CrossRef]
  15. Porta, J.; Parapar, J.; Doallo, R.; Rivera, F.F.; Santé, I.; Crecente, R. High performance genetic algorithm for land use planning. Comput. Environ. Urban Syst. 2013, 37, 45–58. [Google Scholar] [CrossRef]
  16. Aerts, J.C.J.H.; Heuvelink, G.B.M. Using simulated annealing for resource allocation. Int. J. Geogr. Inf. Sci. 2002, 16, 571–587. [Google Scholar] [CrossRef] [Green Version]
  17. Li, F.; Gong, Y.; Cai, L.; Sun, C.; Chen, Y.; Liu, Y.; Jiang, P. Sustainable Land-Use Allocation: A Multiobjective Particle Swarm Optimization Model and Application in Changzhou, China. J. Urban Plan. Dev. 2018, 144, 04018010. [Google Scholar] [CrossRef]
  18. Rahman, M.M.; Szabó, G. Multi-objective urban land use optimization using spatial data: A systematic review. Sustain. Cities Soc. 2021, 74, 103214. [Google Scholar] [CrossRef]
  19. Csuti, B.; Polasky, S.; Williams, P.H.; Pressey, R.L.; Camm, J.D.; Kershaw, M.; Kiester, A.R.; Downs, B.; Hamilton, R.; Huso, M.; et al. A comparison of reserve selection algorithms using data on terrestrial vertebrates in Oregon. Biol. Conserv. 1997, 80, 83–97. [Google Scholar] [CrossRef]
  20. García, G.A.; Rosas, E.P.; García-Ferrer, A.; Barrios, P.M. Multi-Objective Spatial Optimization: Sustainable Land Use Allocation at Sub-Regional Scale. Sustainability 2017, 9, 927. [Google Scholar] [CrossRef] [Green Version]
  21. Stręk, Ż.; Noga, K. Method of Delimiting the Spatial Structure of Villages for the Purposes of Land Consolidation and Exchange. Remote Sens. 2019, 11, 1268. [Google Scholar] [CrossRef] [Green Version]
  22. Habibi, S.M.; Ono, H.; Shukla, A. Geographical Information System (GIS) Based Multi-Criteria Decision Analysis for Categorization of the Villages: In the Case of Kabul New City Villages. Urban Sci. 2021, 5, 65. [Google Scholar] [CrossRef]
  23. Gu, X.; Xie, B.; Zhang, Z.; Guo, H. Rural multifunction in Shanghai suburbs: Evaluation and spatial characteristics based on villages. Habitat Int. 2019, 92, 102041. [Google Scholar] [CrossRef]
  24. Ren, K. Following Rural Functions to Classify Rural Sites: An Application in Jixi, Anhui Province, China. Land 2021, 10, 418. [Google Scholar] [CrossRef]
  25. Niroula, G.S.; Thapa, G.B. Impacts and causes of land fragmentation, and lessons learned from land consolidation in South Asia. Land Use Policy 2005, 22, 358–372. [Google Scholar] [CrossRef]
  26. Tan, S.; Heerink, N.; Qu, F. Land fragmentation and its driving forces in China. Land Use Policy 2006, 23, 272–285. [Google Scholar] [CrossRef]
  27. Januszewski, J.J.G.P. Index of land consolidation as a criterion of the degree of concentration. Geogr. Pol. 1968, 14, 291–296. [Google Scholar]
  28. Blarel, B.; Hazell, P.; Place, F.; Quiggin, J. The Economics of Farm Fragmentation: Evidence from Ghana and Rwanda. World Bank Econ. Rev. 1992, 6, 233–254. [Google Scholar] [CrossRef] [Green Version]
  29. Janus, J.; Łopacka, M.; John, E. Land consolidation in mountain areas. Case study from southern Poland. Geod. Cartogr. 2017, 66, 241–252. [Google Scholar] [CrossRef] [Green Version]
  30. Janus, J.; Markuszewska, I. Land consolidation—A great need to improve effectiveness. A case study from Poland. Land Use Policy 2017, 65, 143–153. [Google Scholar] [CrossRef]
  31. Gonzalez, X.P.; Alvarez, C.J.; Crecente, R. Evaluation of land distributions with joint regard to plot size and shape. Agric. Syst. 2004, 82, 31–43. [Google Scholar] [CrossRef]
  32. Demetriou, D.; Stillwell, J.; See, L. A new methodology for measuring land fragmentation. Comput. Environ. Urban Syst. 2013, 39, 71–80. [Google Scholar] [CrossRef] [Green Version]
  33. Qian, F.; Chi, Y.; Lal, R.; Lorenz, K. Spatio-temporal characteristics of cultivated land fragmentation in different landform areas with a case study in Northeast China. Ecosyst. Health Sustain. 2020, 6, 1800415. [Google Scholar] [CrossRef]
  34. Yu, Q.; Hu, Q.; van Vliet, J.; Verburg, P.H.; Wu, W. GlobeLand30 shows little cropland area loss but greater fragmentation in China. Int. J. Appl. Earth Obs. Geoinf. 2018, 66, 37–45. [Google Scholar] [CrossRef]
  35. Janus, J. A new approach to calculating distances to parcels: A way to increase the accuracy of farm efficiency analyses and the assessment of land consolidation projects. Comput. Electron. Agric. 2020, 175, 105512. [Google Scholar] [CrossRef]
  36. Benevenuto, R.; Caulfield, B. Measuring access to urban centres in rural Northeast Brazil: A spatial accessibility poverty index. J. Transp. Geogr. 2020, 82, 102553. [Google Scholar] [CrossRef]
  37. Melo, P.C.; Rego, C.; Anciães, P.R.; Guiomar, N.; Muñoz-Rojas, J. Does road accessibility to cities support rural population growth? Evidence for Portugal between 1991 and 2011. J. Reg. Sci. 2021, 62, 443–470. [Google Scholar] [CrossRef]
  38. Tezcan, A.; Büyüktaş, K.; Akkaya Aslan, Ş.T. A multi-criteria model for land valuation in the land consolidation. Land Use Policy 2020, 95, 104572. [Google Scholar] [CrossRef]
  39. Xu, Y.; Yang, B.; Liu, G.; Liu, P. Topographic differentiation simulation of crop yield and soil and water loss on the Loess Plateau. J. Geogr. Sci. 2009, 19, 331–339. [Google Scholar] [CrossRef] [Green Version]
  40. Wiśniewski, P.; Märker, M. Comparison of Topsoil Organic Carbon Stocks on Slopes under Soil-Protecting Forests in Relation to the Adjacent Agricultural Slopes. Forests 2021, 12, 390. [Google Scholar] [CrossRef]
  41. Pašakarnis, G.; Maliene, V.; Dixon-Gough, R.; Malys, N. Decision support framework to rank and prioritise the potential land areas for comprehensive land consolidation. Land Use Policy 2021, 100, 104908. [Google Scholar] [CrossRef]
  42. Len, P. Methodology of Prioritization of Land Consolidation and Land Exchange Interventions. IOP Conf. Ser. Earth Environ. Sci. 2017, 95, 032010. [Google Scholar] [CrossRef] [Green Version]
  43. Leń, P. The size of the external patchwork of fields as an indicator of the need for land consolidation and exchange in the villages of the commune of Drzewica. J. Water Land Dev. 2017, 33, 99–106. [Google Scholar] [CrossRef]
  44. Peltonen-Sainio, P.; Jauhiainen, L.; Sorvali, J.; Laurila, H.; Rajala, A. Field characteristics driving farm-scale decision-making on land allocation to primary crops in high latitude conditions. Land Use Policy 2018, 71, 49–59. [Google Scholar] [CrossRef]
  45. Peltonen-Sainio, P.; Jauhiainen, L.; Laurila, H.; Sorvali, J.; Honkavaara, E.; Wittke, S.; Karjalainen, M.; Puttonen, E. Land use optimization tool for sustainable intensification of high-latitude agricultural systems. Land Use Policy 2019, 88, 104104. [Google Scholar] [CrossRef]
  46. Yang, L.; Zhu, A.; Shao, J.; Chi, T. A Knowledge-Informed and Pareto-Based Artificial Bee Colony Optimization Algorithm for Multi-Objective Land-Use Allocation. ISPRS Int. J. Geo-Inf. 2018, 7, 63. [Google Scholar] [CrossRef] [Green Version]
  47. Masoomi, Z.; Mesgari, M.S.; Hamrah, M. Allocation of urban land uses by Multi-Objective Particle Swarm Optimization algorithm. Int. J. Geogr. Inf. Sci. 2013, 27, 542–566. [Google Scholar] [CrossRef]
  48. Verstegen, J.A.; Jonker, J.G.G.; Karssenberg, D.; van der Hilst, F.; Schmitz, O.; de Jong, S.M.; Faaij, A.P.C. How a Pareto frontier complements scenario projections in land use change impact assessment. Environ. Model. Softw. 2017, 97, 287–302. [Google Scholar] [CrossRef] [Green Version]
  49. Reyes-Sierra, M.; Coello, C.C. Multi-objective particle swarm optimizers: A survey of the state-of-the-art. Int. J. Comput. Intell. Res. 2006, 2, 287–308. [Google Scholar]
  50. Wang, D.; Tan, D.; Liu, L. Particle swarm optimization algorithm: An overview. Soft Comput. 2017, 22, 387–408. [Google Scholar] [CrossRef]
  51. Poli, R.; Kennedy, J.; Blackwell, T. Particle swarm optimization. Swarm Intell. 2007, 1, 33–57. [Google Scholar] [CrossRef]
  52. Clerc, M.; Kennedy, J. The particle swarm—explosion, stability, and convergence in a multidimensional complex space. IEEE Trans. Evol. Comput. 2002, 6, 58–73. [Google Scholar] [CrossRef] [Green Version]
Figure 1. Spatial location of the study area in Guangdong Province, China.
Land 12 00710 g001
Figure 2. Conversion rules between the three types of target plots and eight land use optimization types for each village: 8 land use types selected for land use optimization at village level.
Land 12 00710 g002
Figure 3. Spatial pattern of land use efficiency of the three types of land use in Xinxing.
Land 12 00710 g003
Figure 4. Three- and two-dimensional visualizations of Pareto front in SPSO and MPSO related to objectives 1, 2 and 3.
Land 12 00710 g004
Figure 5. Spatial representation of the village classification results. (a) optimal land use efficiency of cultivated land; (b) optimal land use efficiency of woodland; (c) optimal land use efficiency of construction land; (d) optimal comprehensive land use efficiency.
Land 12 00710 g005
Table 1. Indicator system used to evaluate land use efficiency.
Target LayerCriteria LayerIndicator Layer
The degree of fragmentationThe number and size of land patchesMean patch size (MPS)
Patch density (PD)
The shape of land patchesEdge density index (ED)
Area-weighted mean shape index (AWMSI)
The spatial distribution of land patchesFragmentation number index (FN)
Fragmentation index (FS)
The complexity of terrainThe change of slopeSlope complexity index (SC)
The accessibility of plotSum of the shortest distances from the roadAccess parameters (AP)
Table 2. The weight of various indicators in the village land use efficiency assessment.
Indicator LayerWeight in Cultivated Land EvaluationWeight in Woodland EvaluationWeight in Construction Land Evaluation
Mean patch size (MPS)0.0990 0.1362 0.0965
Patch density (PD)0.1313 0.1800 0.1289
Edge density index (ED)0.1238 0.1755 0.1235
Area-weighted mean shape index (AWMSI)0.1282 0.1738 0.1319
Fragmentation number index (FN)0.1364 0.1794 0.1375
Fragmentation index (FS)0.1197 0.1551 0.1195
Slope complexity index (SC)0.1316 ——0.1320
Access parameters (AP)0.1299 ——0.1303
Table 3. The overall land use efficiency coefficient and land use reallocation scale under different objectives and algorithms.
SPSOMPSO
NowObjective1Objective2Objective3ObjectiveObjective1Objective2Objective3
Land use efficiency of cultivated land275.05277.50275.21275.44276.92277.26276.42276.74
Land use efficiency of woodland275.95274.88275.99275.58275.56274.38274.95274.10
Land use efficiency of construction land277.50277.16277.64277.70278.04277.77277.89278.15
Land use reallocation scale (ha)0852.9712.82168.89638.181303.411001.031361.31
Disclaimer/Publisher’s Note: The statements, opinions and data contained in all publications are solely those of the individual author(s) and contributor(s) and not of MDPI and/or the editor(s). MDPI and/or the editor(s) disclaim responsibility for any injury to people or property resulting from any ideas, methods, instructions or products referred to in the content.

