
Coupled and Coordinated Development of the Tourism Industry and Urbanization in Marginal and Less Developed Regions—Taking the Mountainous Border Areas of Western Yunnan as a Case Study
Abstract
:1. Introduction
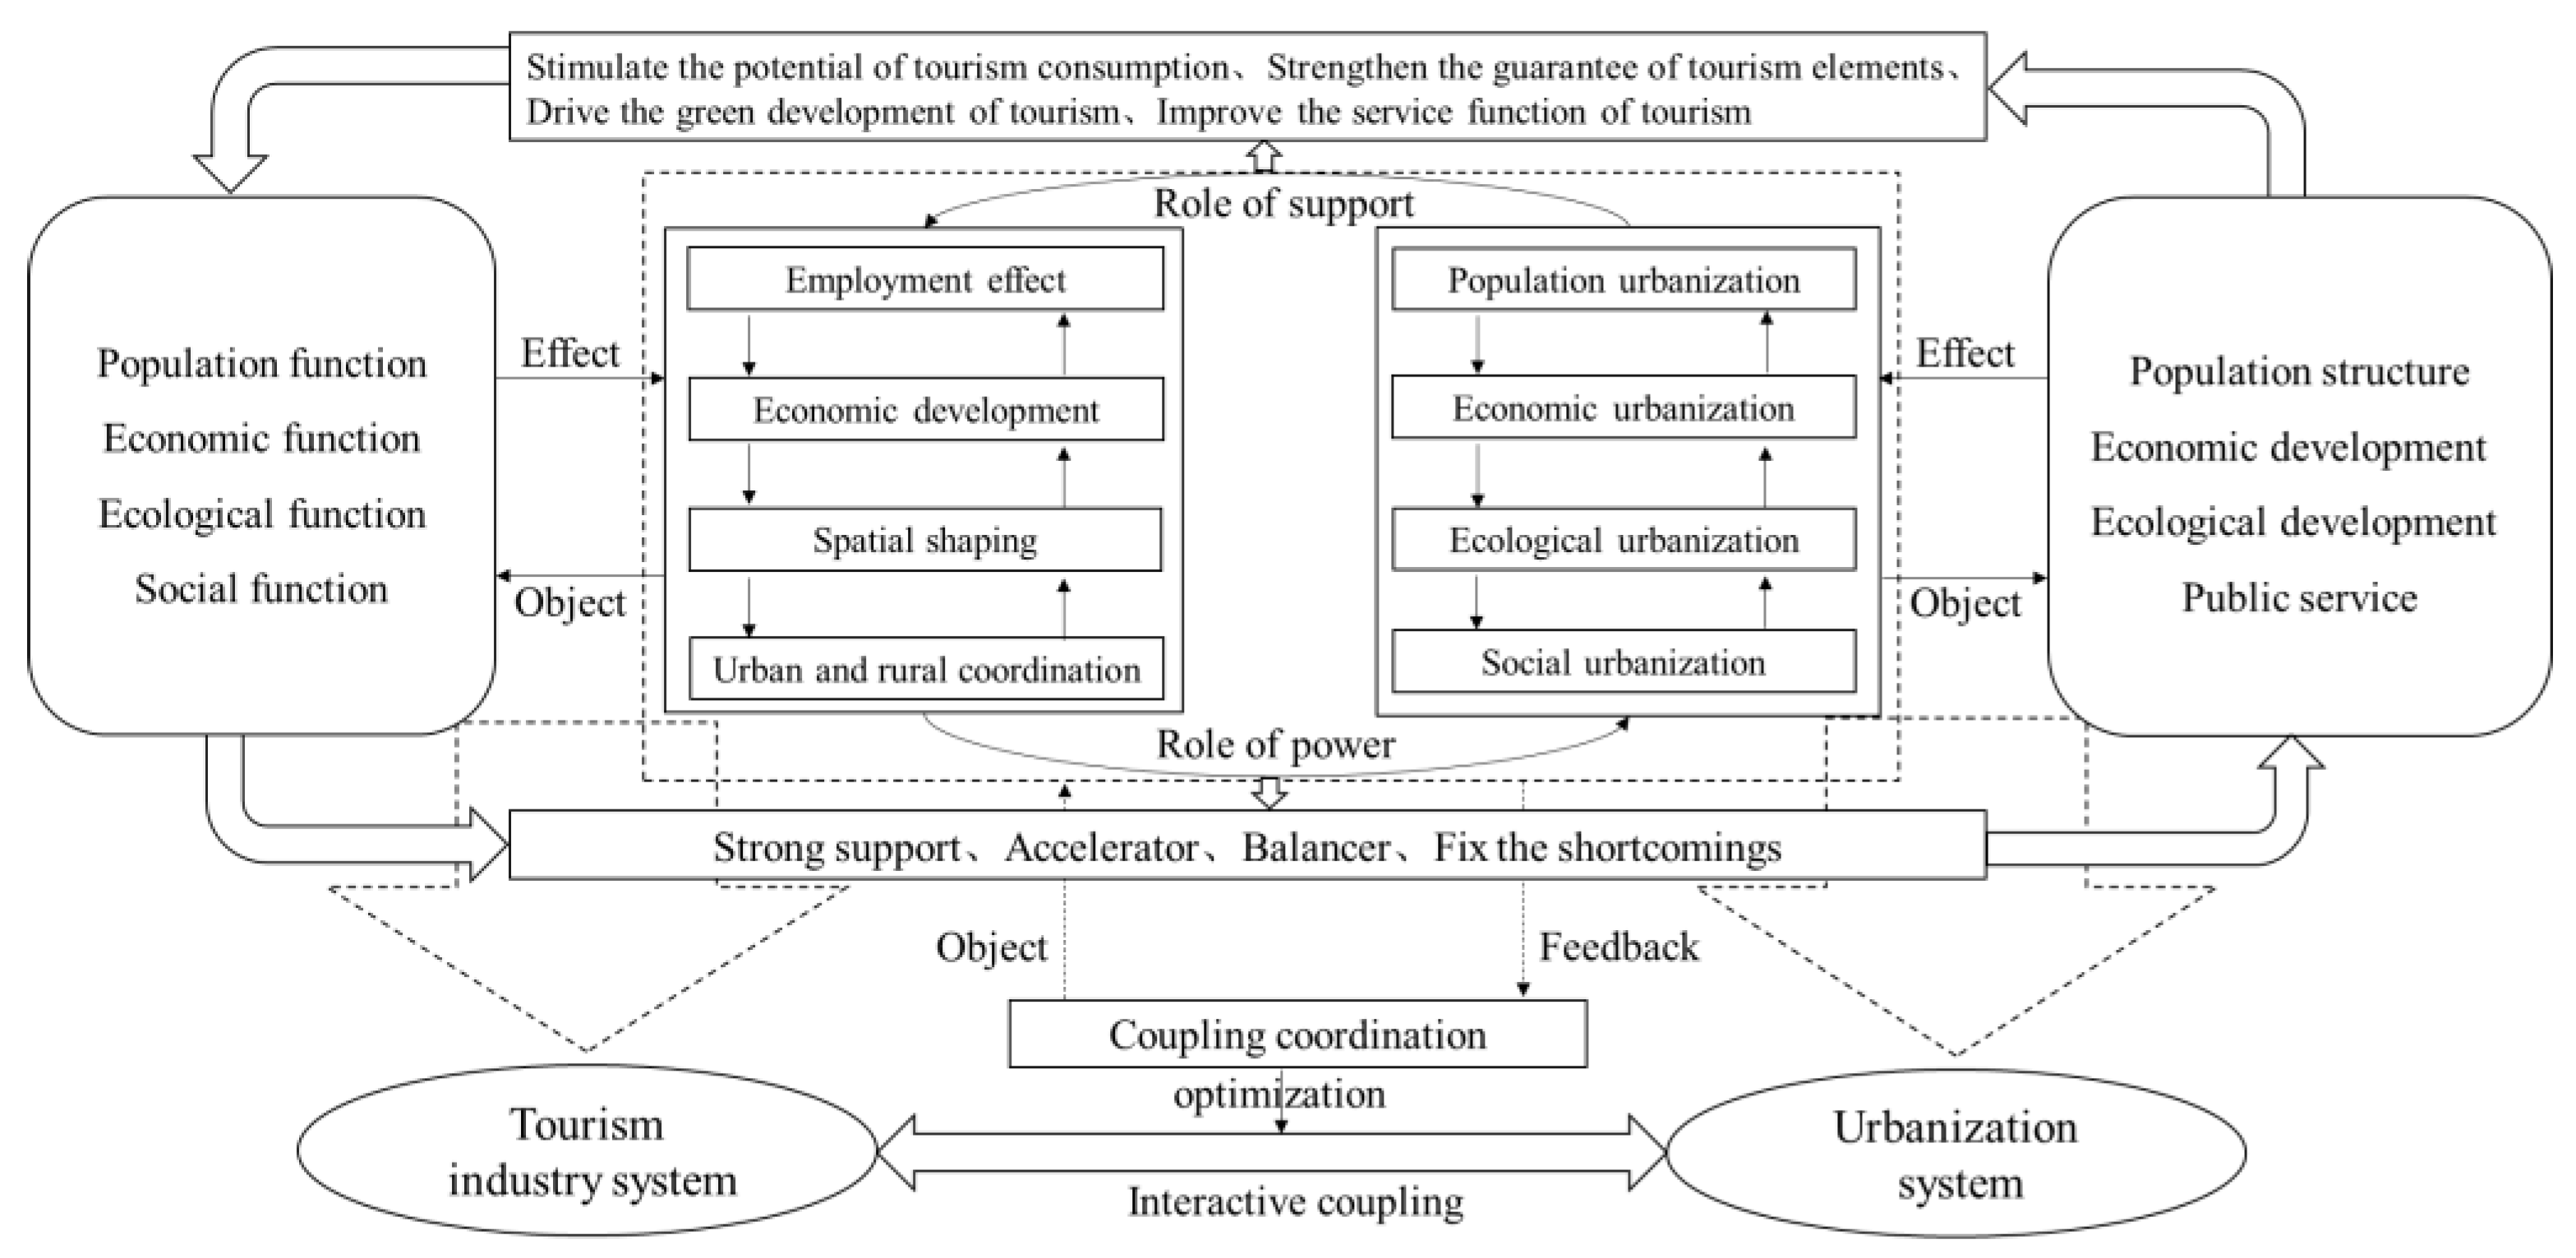
2. The Mechanism of Coupling and Coordination between the Tourism Industry and Urbanization
2.1. Tourism as a Key Driving Force of Urbanization
2.2. Urbanization as Efficient Guarantee Support for Tourism Industry
3. Research Design
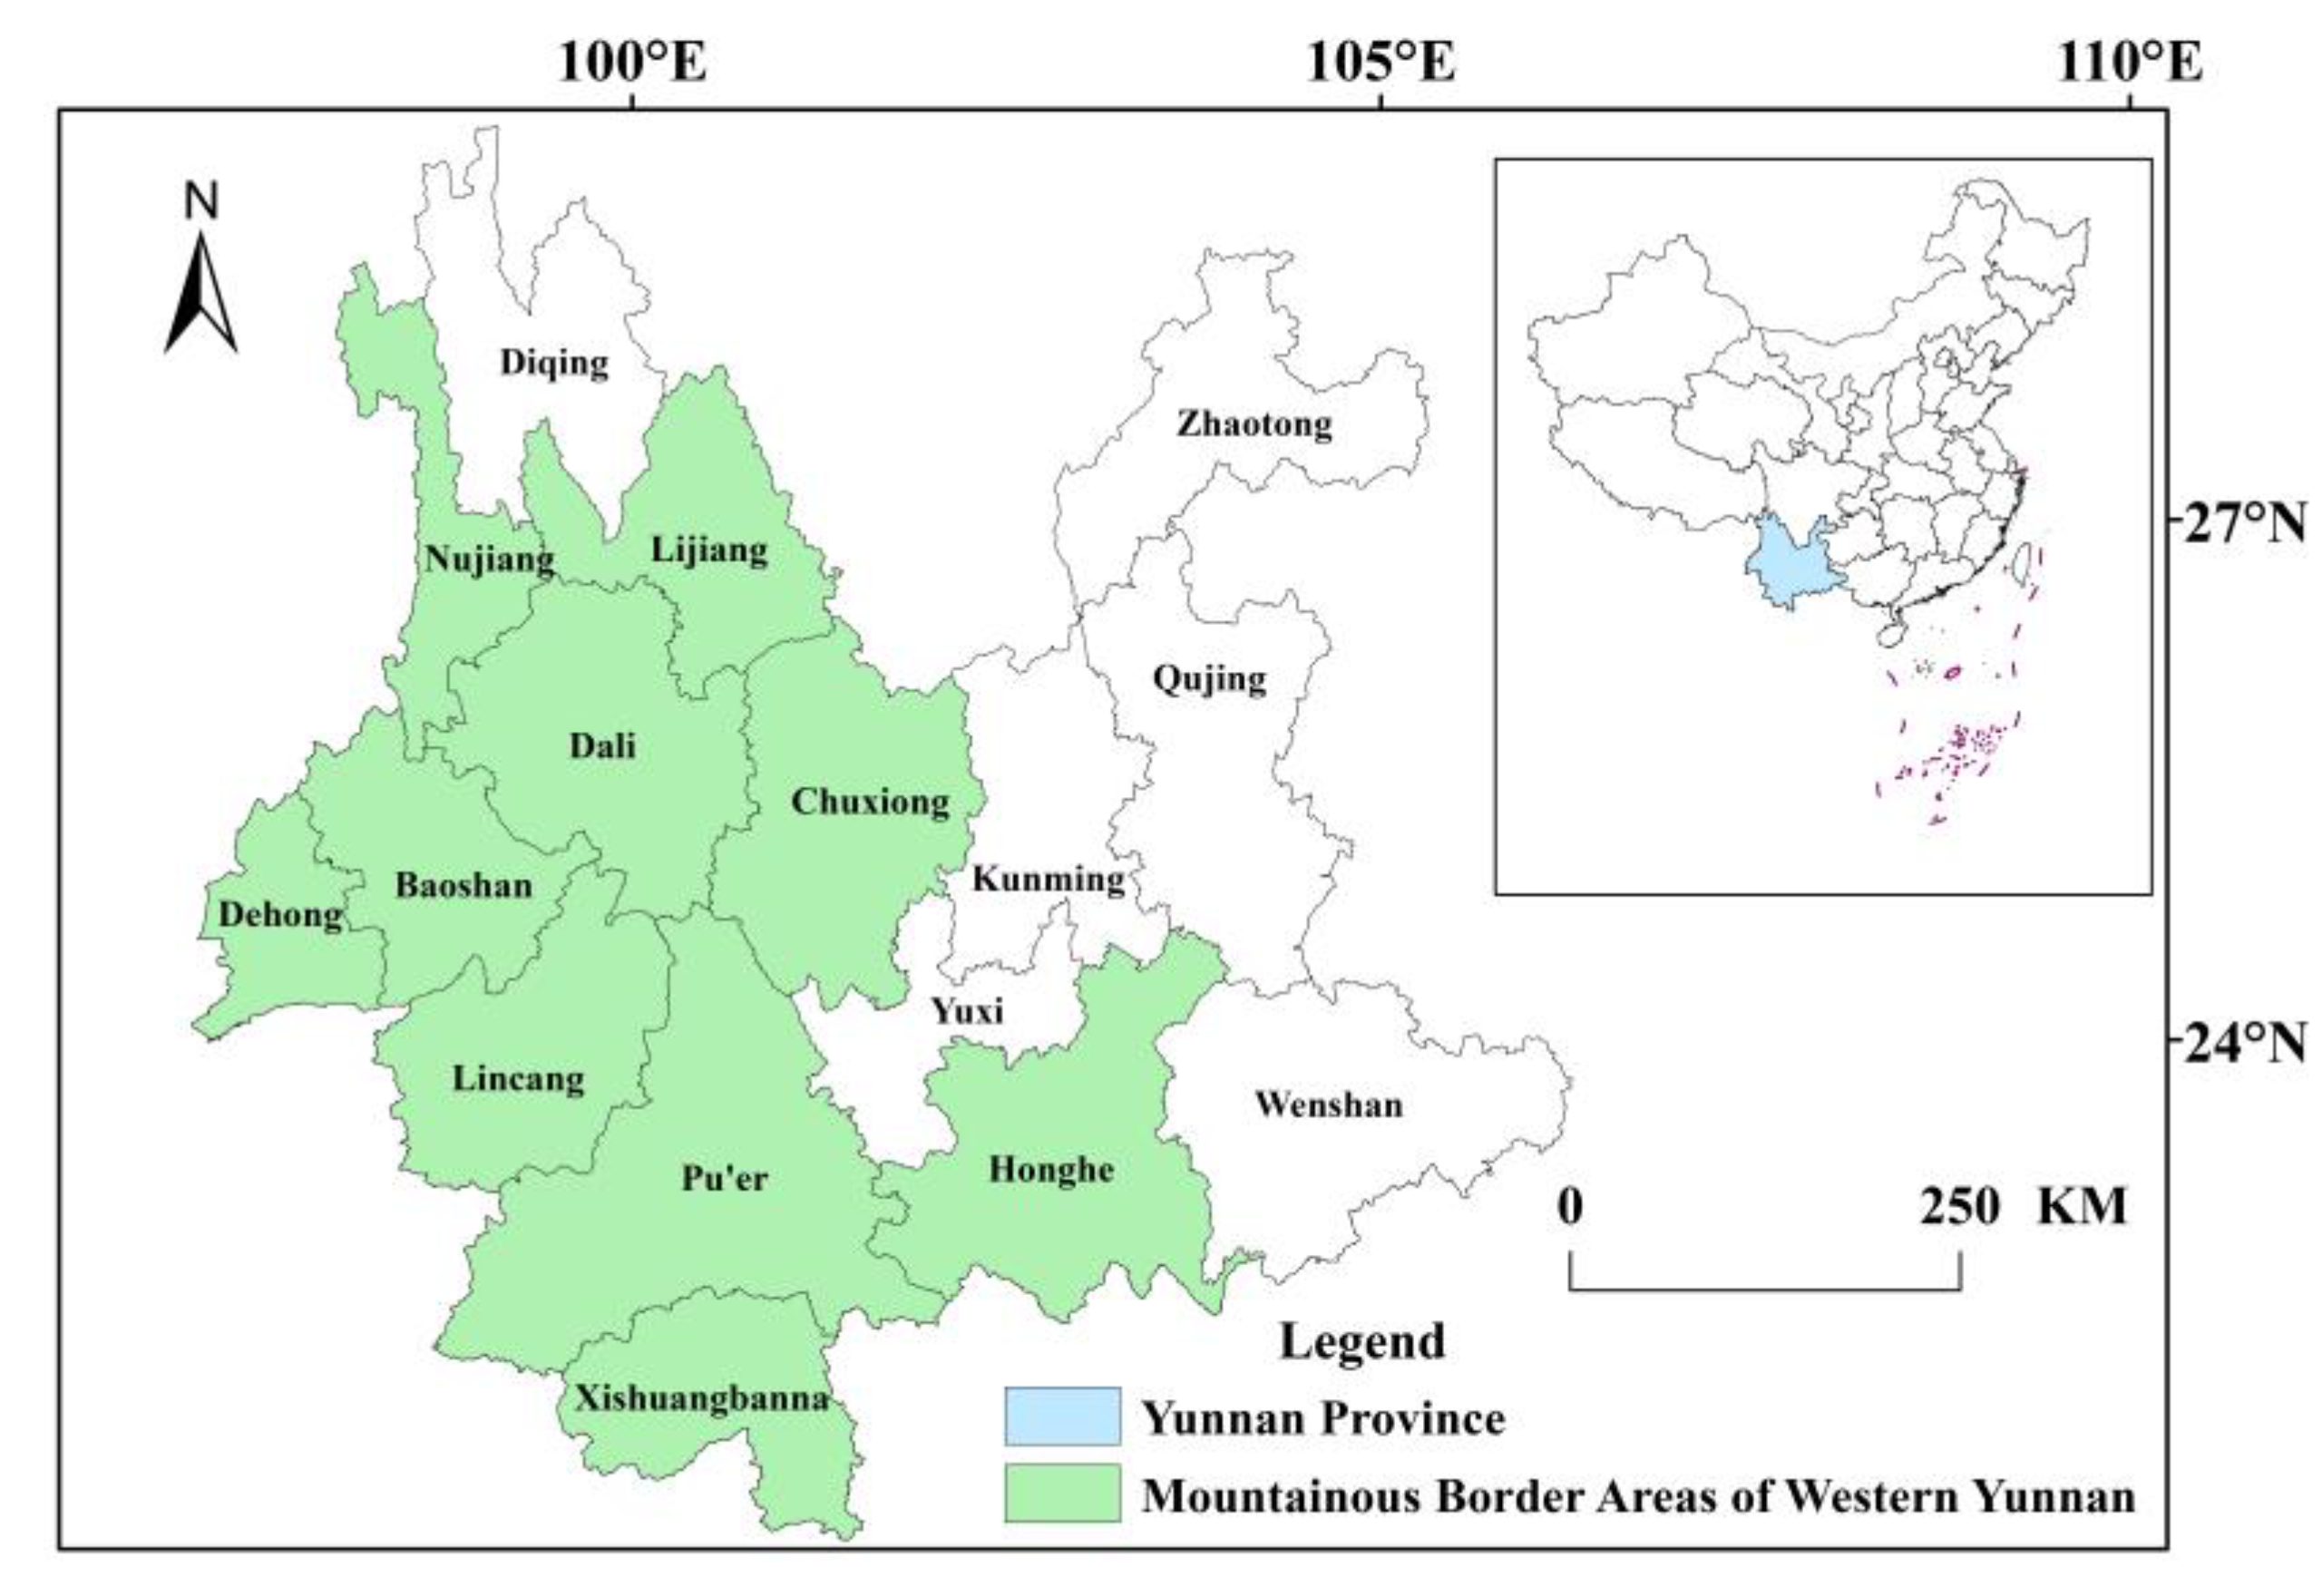
3.1. Research Area
3.2. Construction of Index System and Data Sources
3.2.1. Comprehensive Evaluation Index System of Tourism Industry
3.2.2. Comprehensive Evaluation Index System of Urbanization
3.2.3. Data Sources
3.3. Empirical Method
3.3.1. Index Pretreatment and Weight Solving
3.3.2. Comprehensive Evaluation Value of Tourism Industry and Urbanization
3.3.3. Coupling Coordination Model
3.3.4. Space Gravity Model
3.3.5. Panel Tobit Model
4. Results
4.1. Spatial and Temporal Evolution of Tourism Industry and urbanization Levels
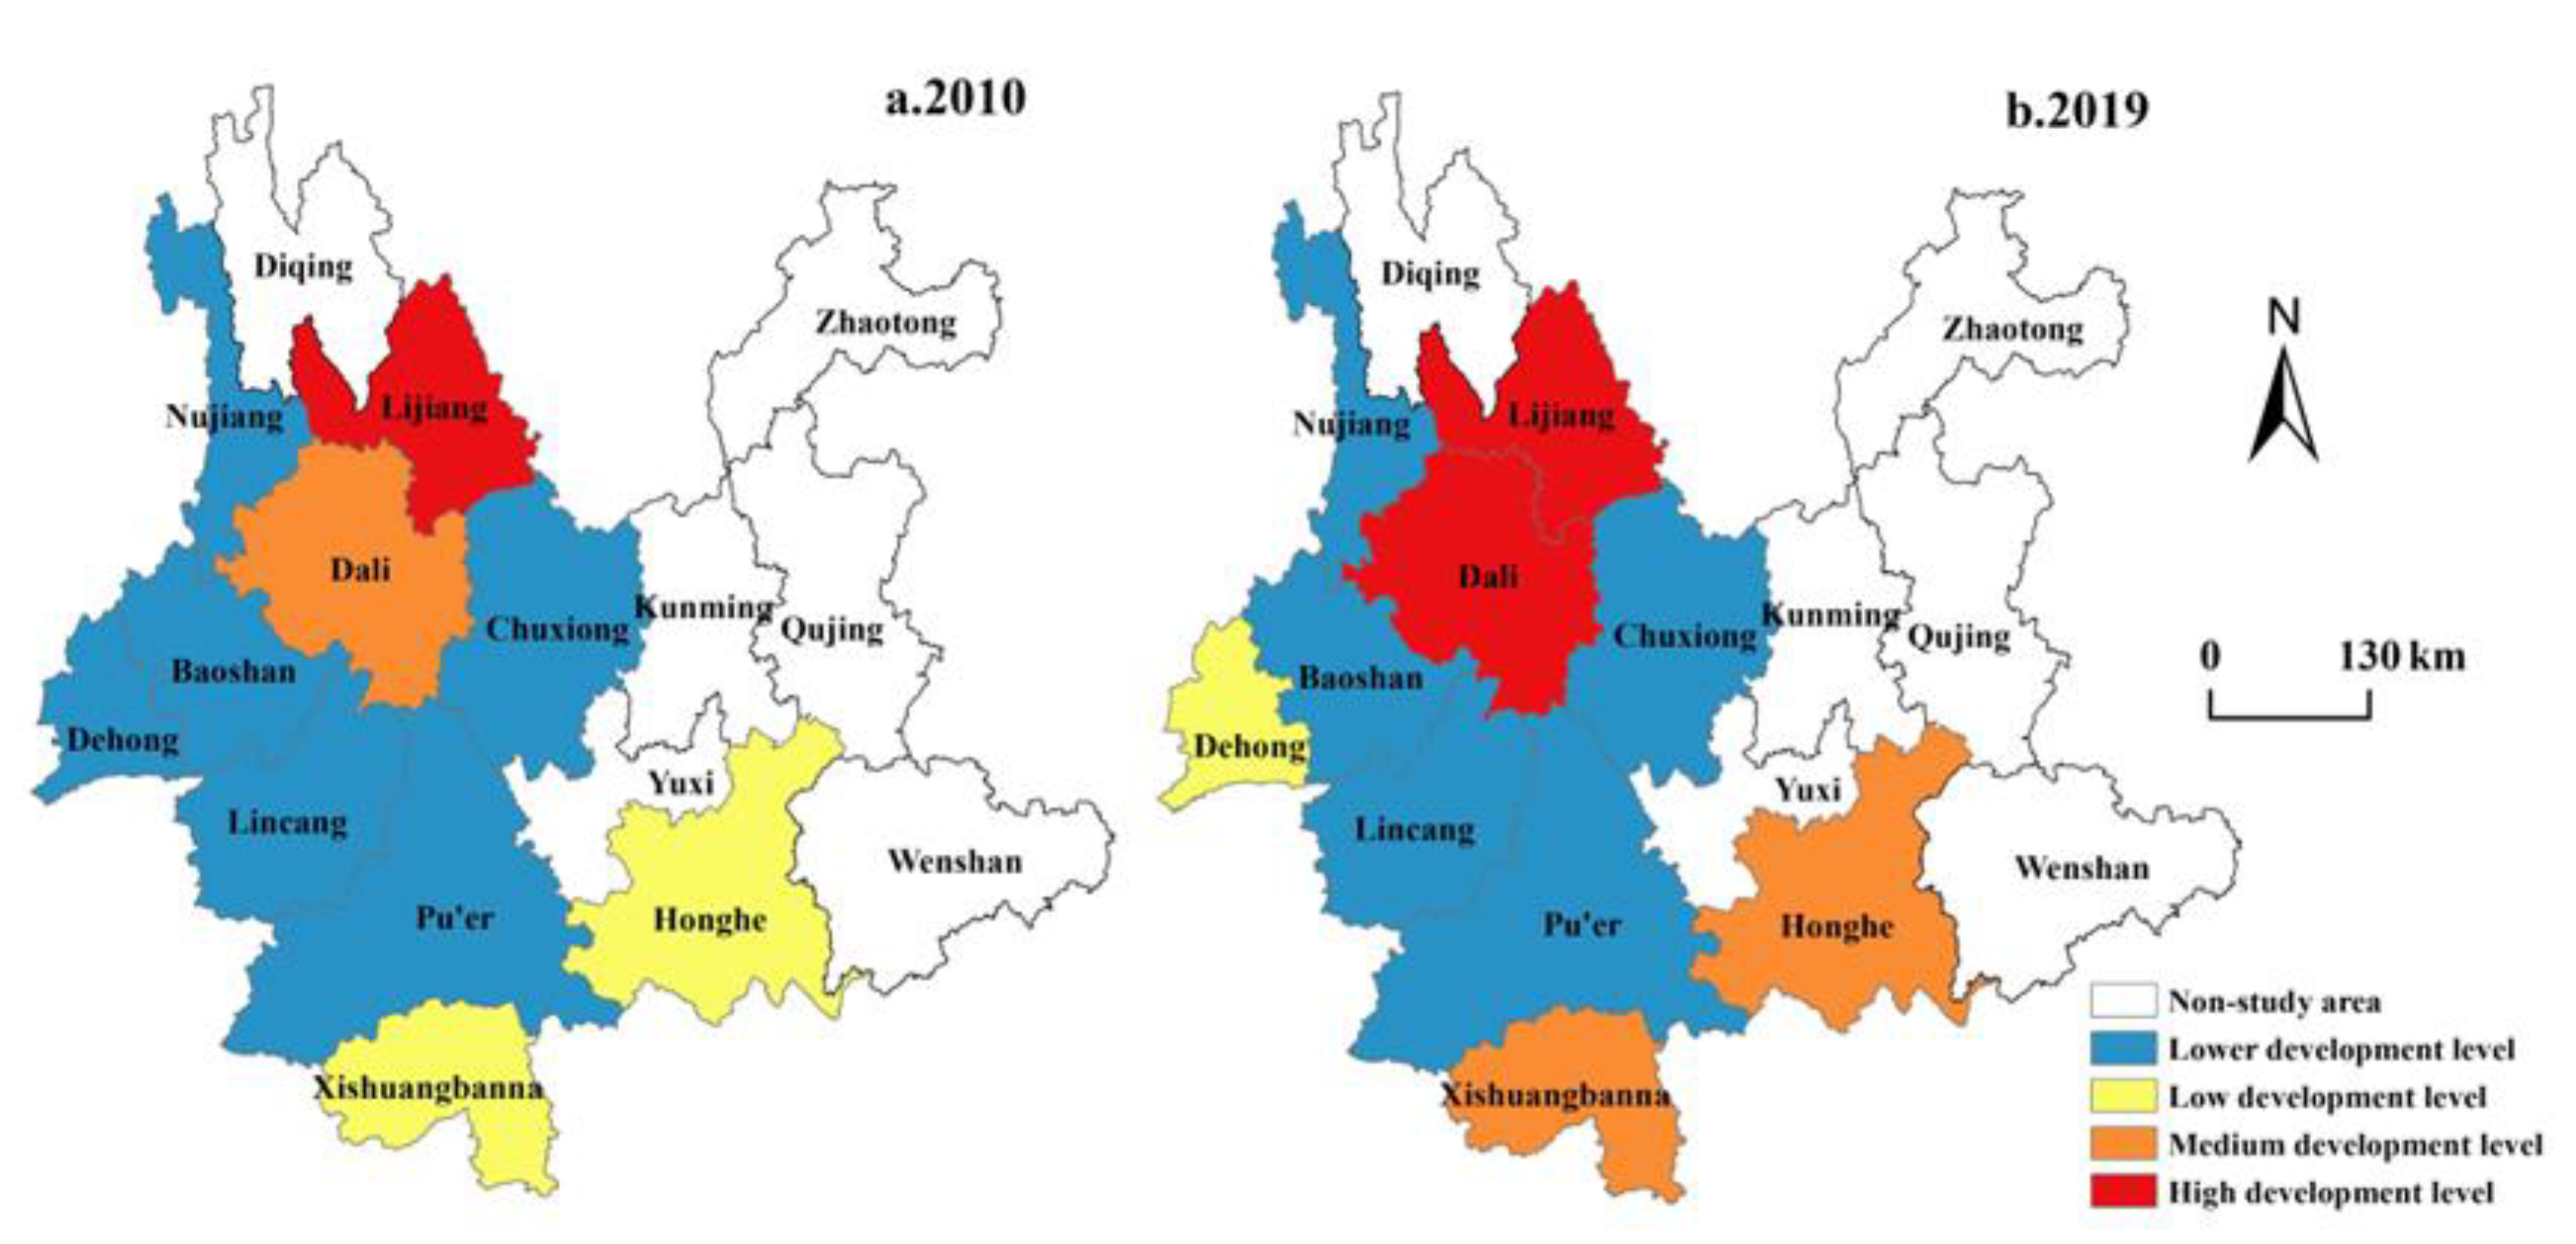
4.1.1. Spatial and Temporal Evolution of Tourism Industry Level
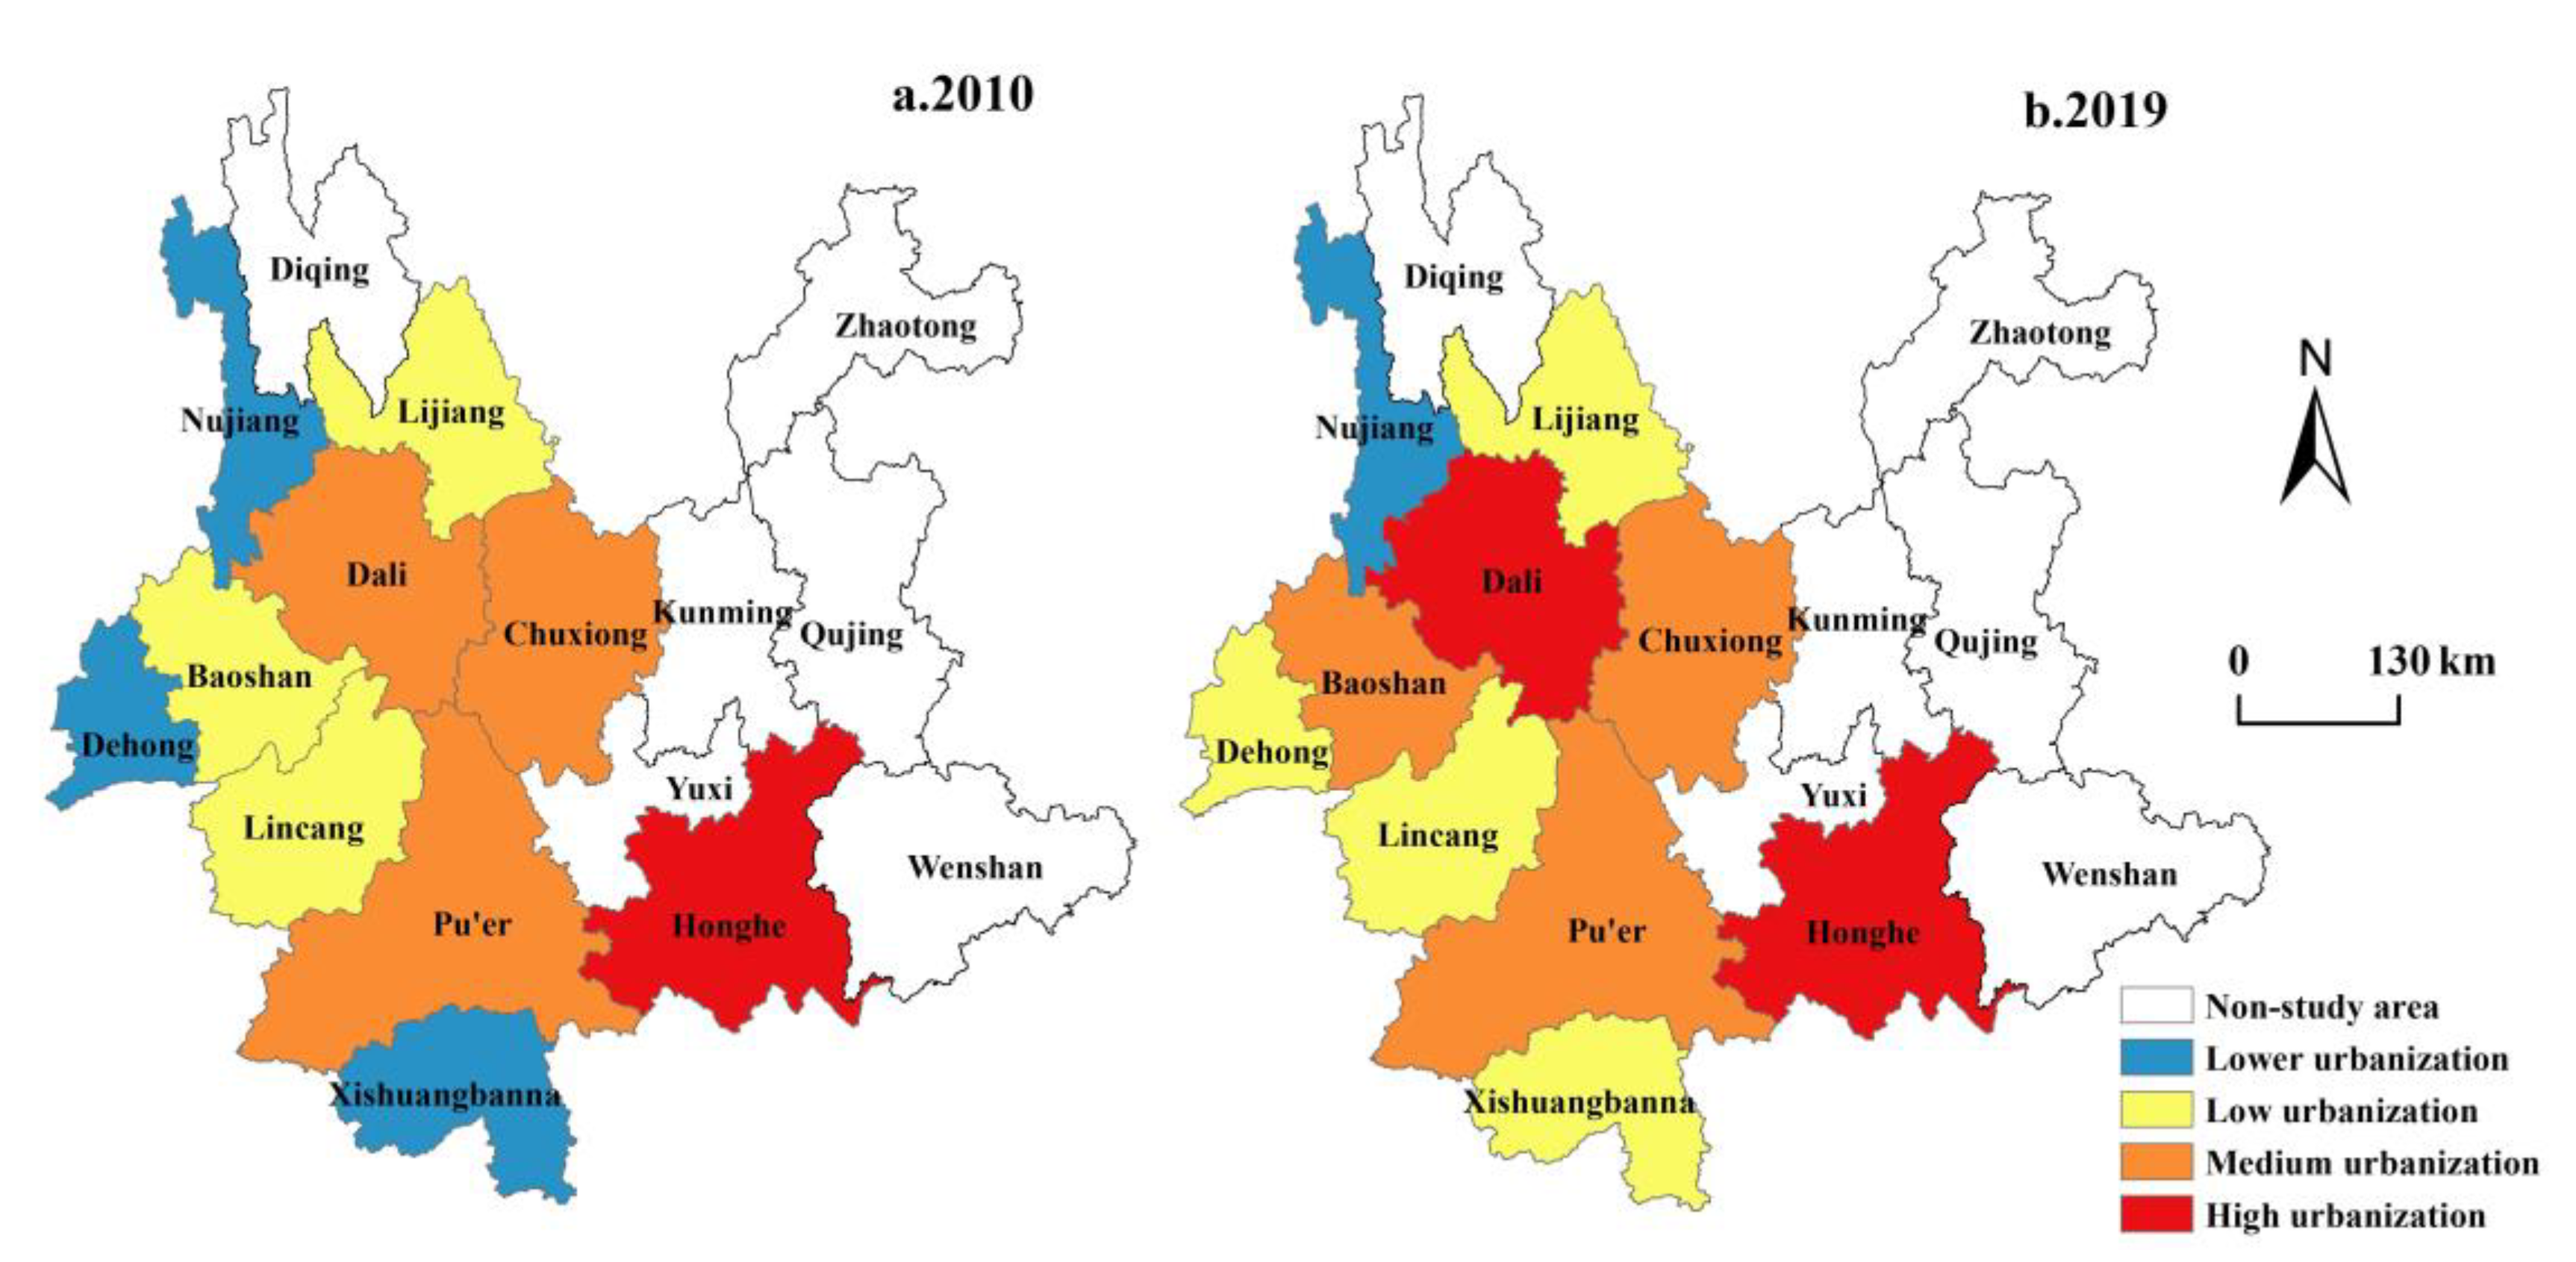
4.1.2. Spatial and Temporal Evolution of Urbanization Level
4.2. Spatial and Temporal Evolution of the Coupling Coordination Degree of Tourism Industry and Urbanization
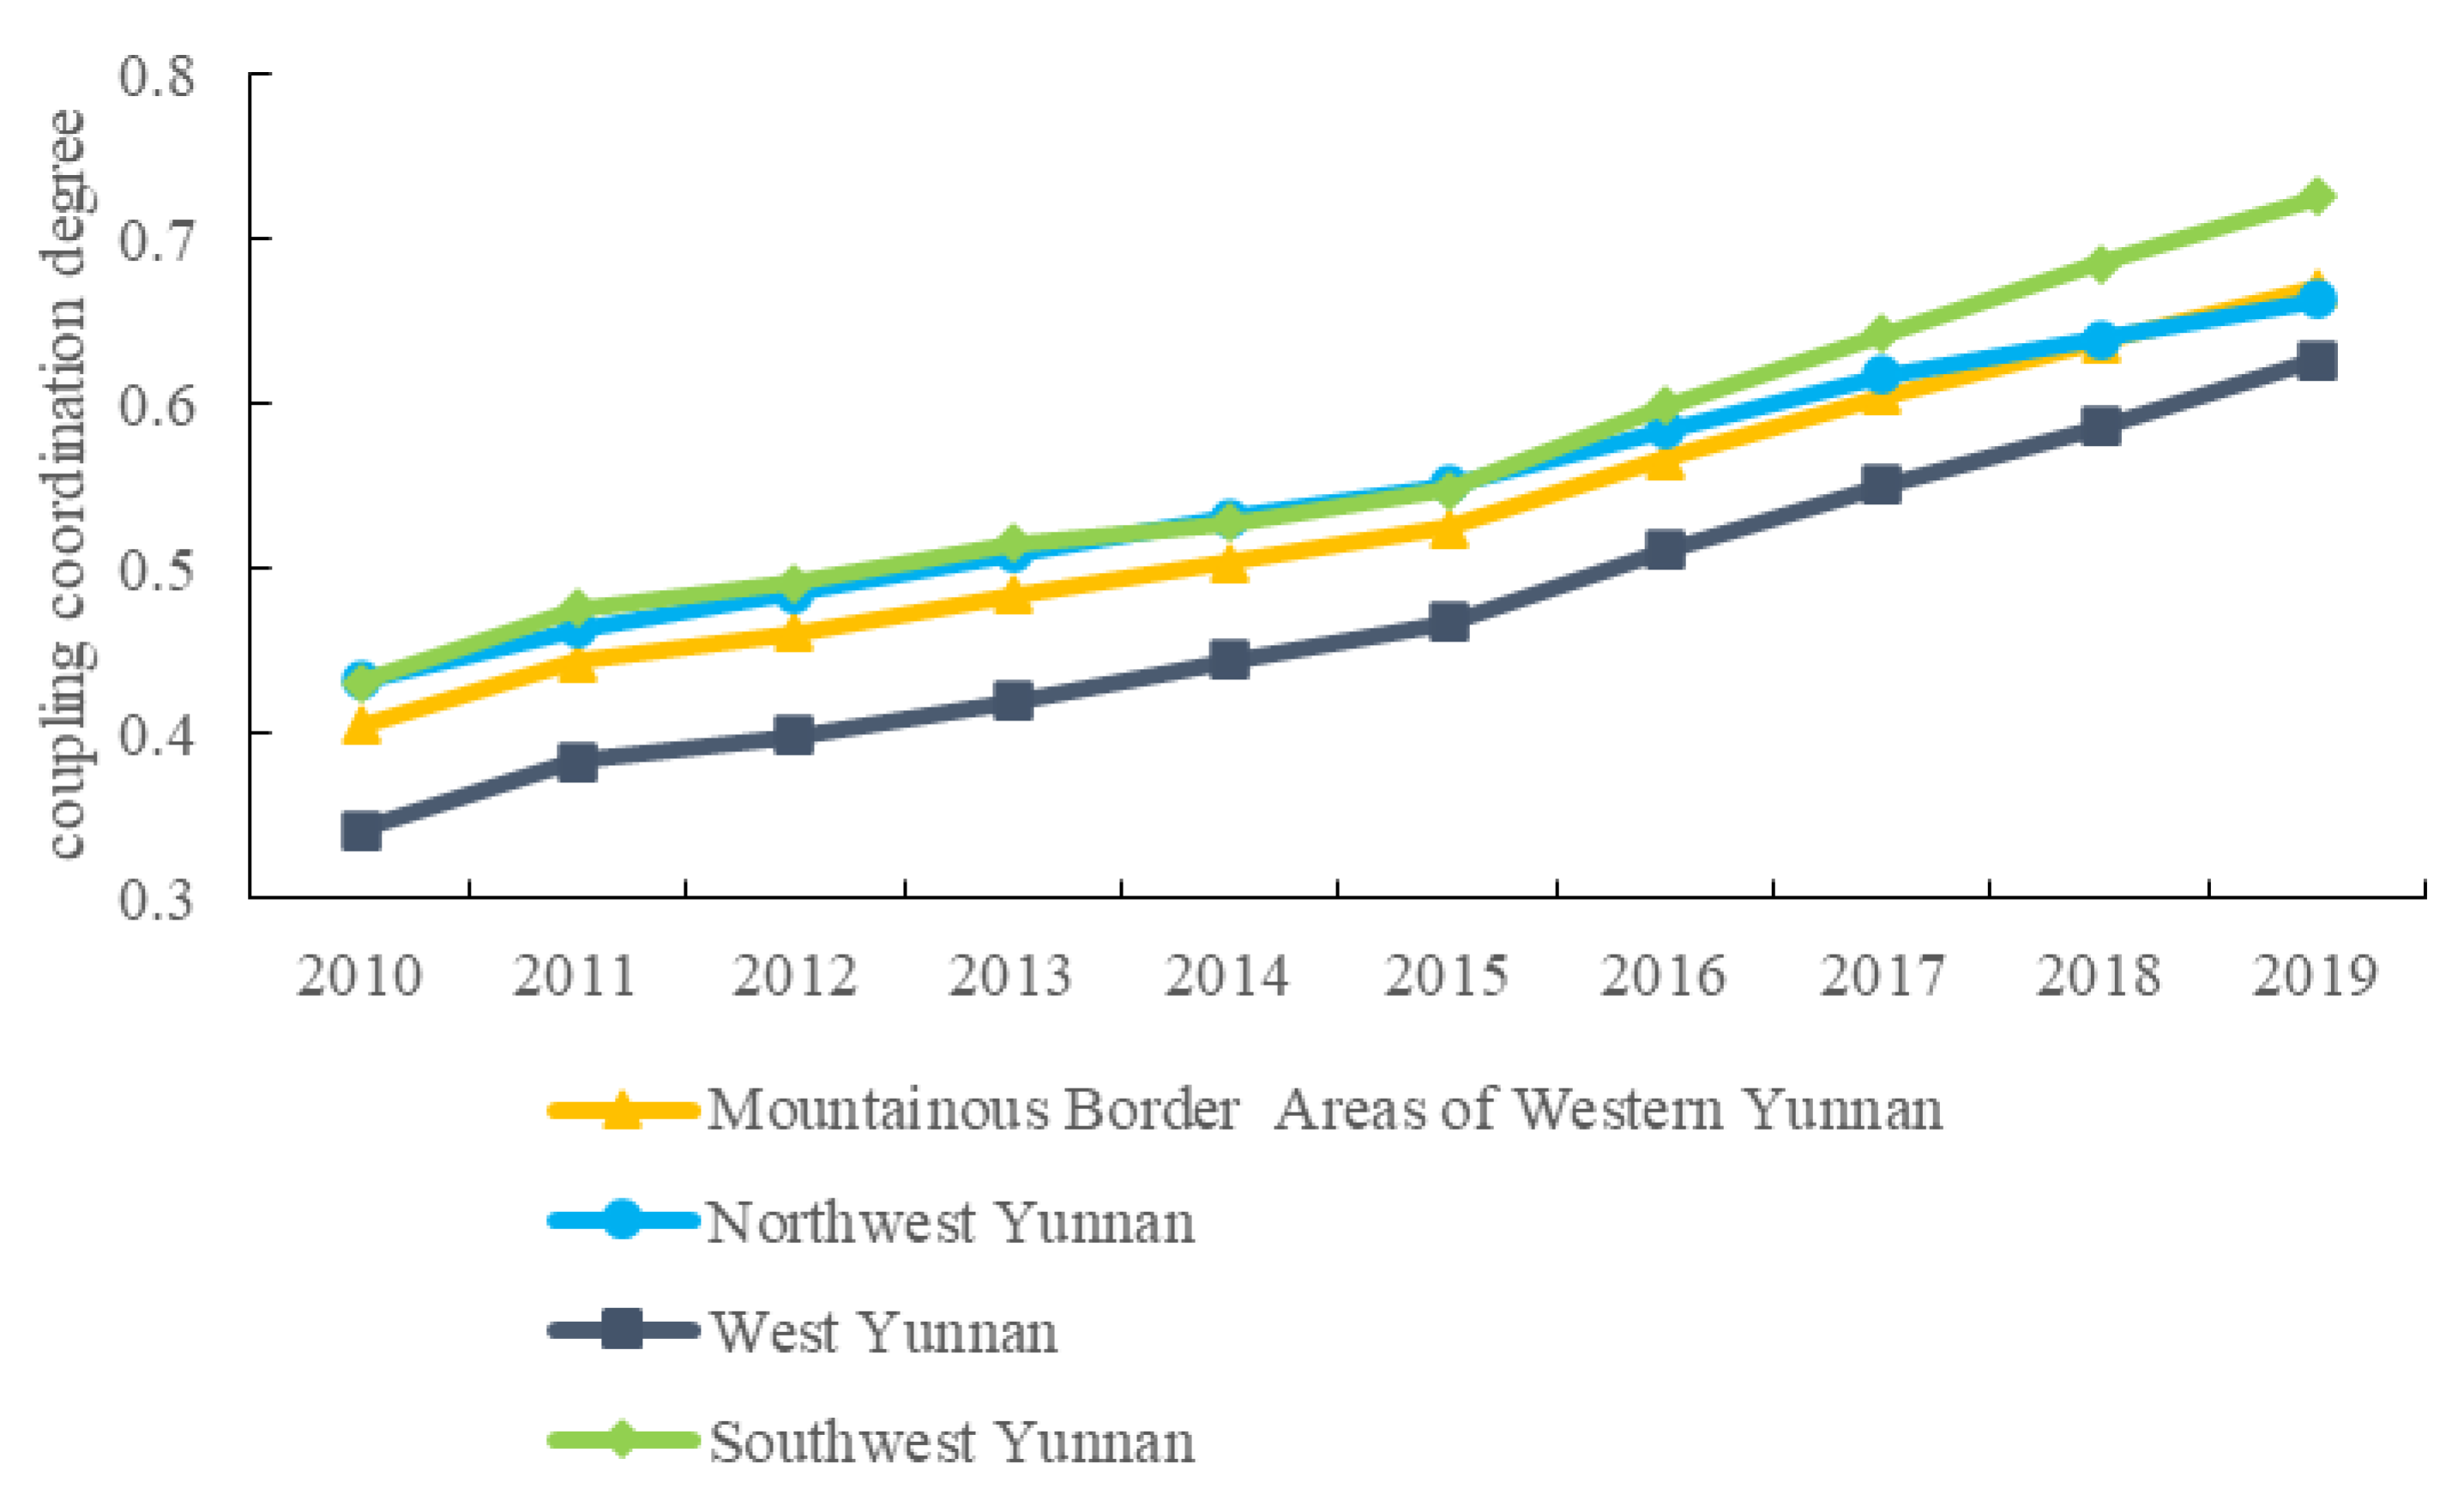
4.2.1. Temporal Evolution of Coupling Coordination Degree
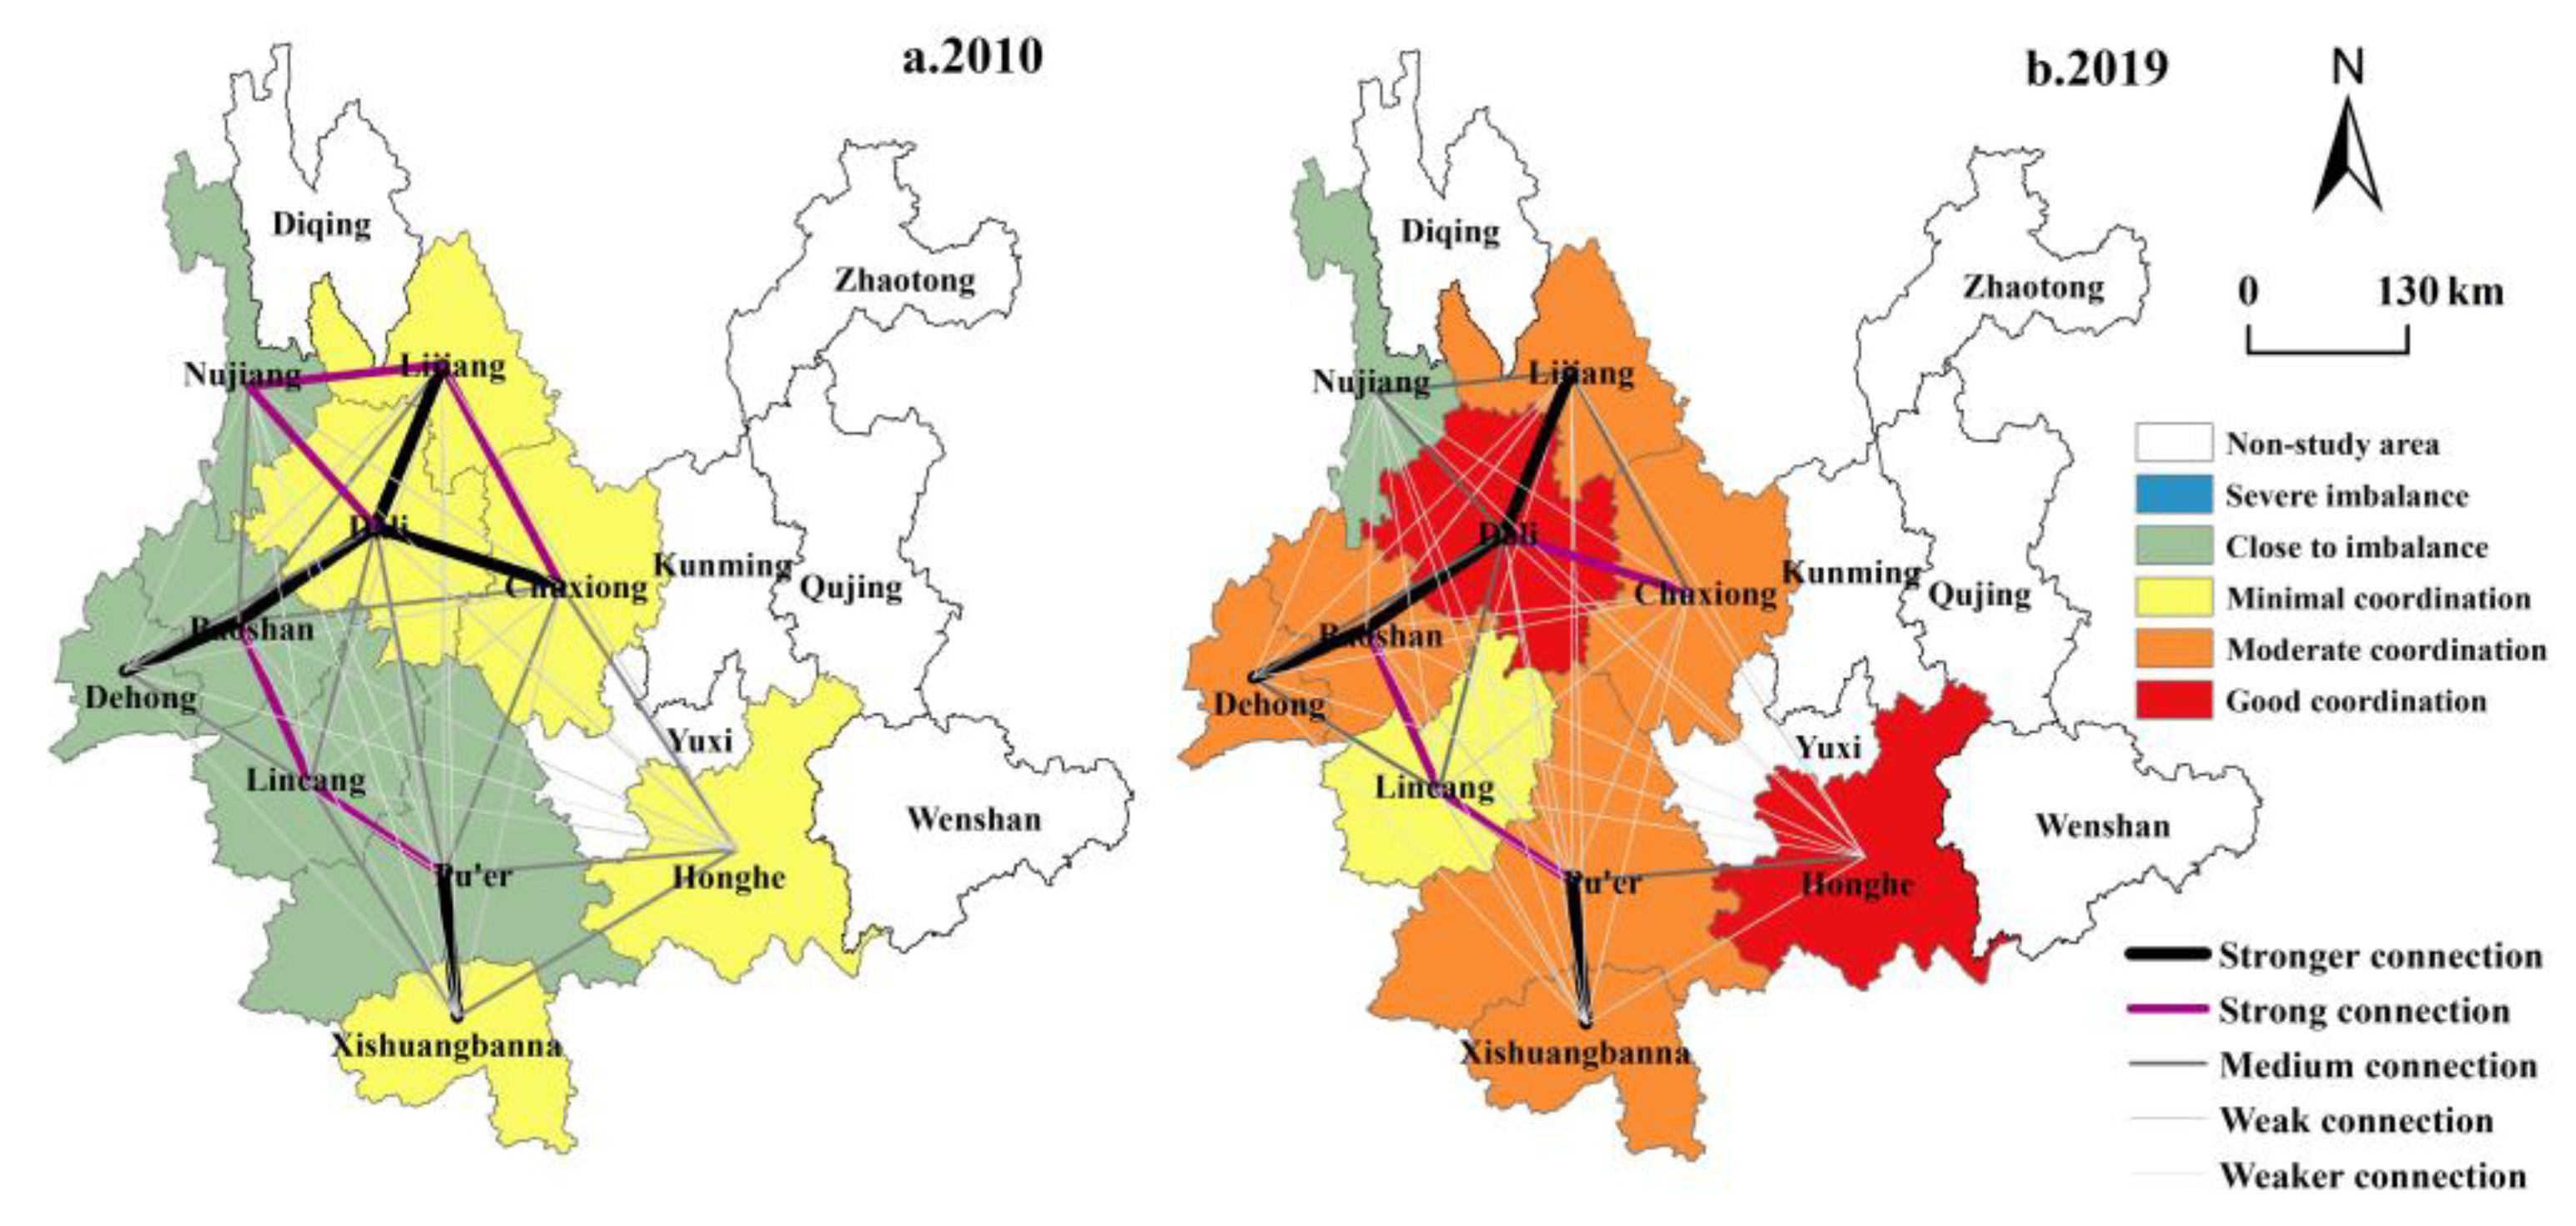
4.2.2. Spatial Evolution of Coupling Coordination
4.3. Spatial Combination and Evolution Pattern of Coupling Degree and Coupling Coordination Degree of Tourism Industry and Urbanization
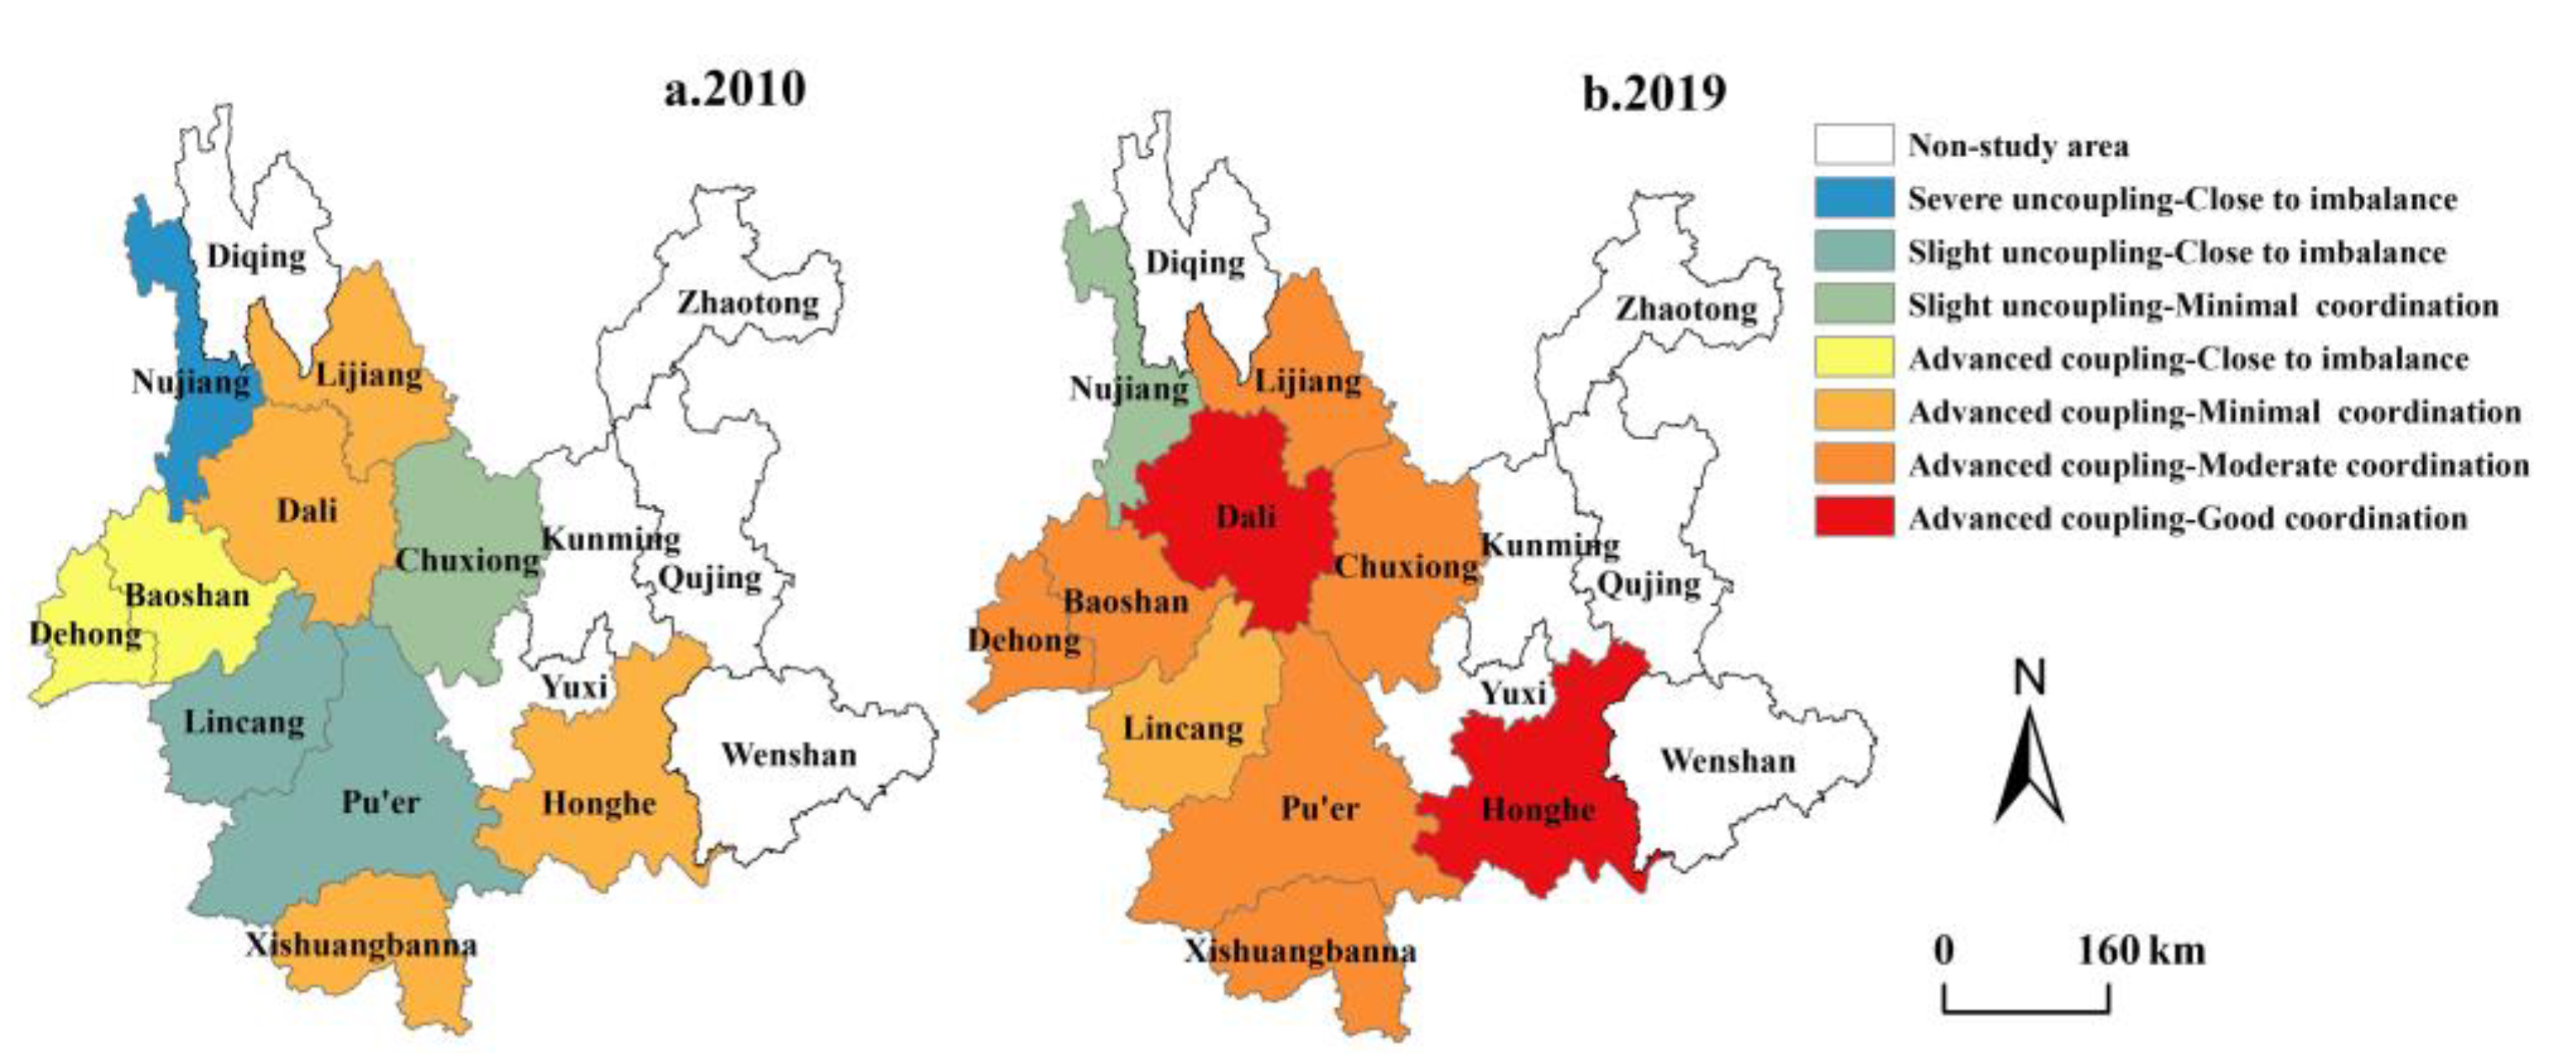
4.3.1. Spatial Combination of Coupling Coordination Types
4.3.2. Evolutionary Model of Coupling Coordination Types
4.4. Influencing Factors of the Coupling and Coordination Degree of Tourism Industry and Urbanization
4.4.1. Model Construction and Variable Selection
4.4.2. Regression Model Analysis
4.4.3. Analysis of Regression Results
4.4.4. Robustness Test
5. Discussion
5.1. Research Findings
5.2. Practical Implications
5.3. Further Discussion: The Complex Relationship between the Tourism Industry, Urbanization and the Ecological Environment
5.4. Limitations
6. Conclusions
- (1)
- The development levels of the tourism industry and urbanization in the mountainous border areas of western Yunnan in the study period showed growth trends, but they were uneven in their spatial distributions.
- (2)
- The coupling coordination degree of the tourism industry and urbanization in the study region also presented a development trend of steady-state growth. However, from the perspective of spatial evolution, the location differences of different cities expanded.
- (3)
- Combining the coupling degree and coupling coordination degree of different cities, four evolutionary patterns were found: balanced development, inertia development, inversion development, and leapfrog development patterns.
- (4)
- The influence degrees of the different factors on the coupling coordination degree were ranked as the following: consumption ability > transportation accessibility > capital effect > industrial structure > talent support > opening up to the outside world.
Author Contributions
Funding
Institutional Review Board Statement
Informed Consent Statement
Data Availability Statement
Acknowledgments
Conflicts of Interest
| 1 | In this paper: the mountainous border areas of western Yunnan were divided into three major regions, northwest Yunnan, west Yunnan, and southwest Yunnan, of which northwest Yunnan includes Chuxiong, Dali, Lijiang, and Nujiang, west Yunnan includes Baoshan, Dehong, and Lincang, and southwest Yunnan includes Pu’er, Xishuangbanna, and Honghe. |
References
- Xiong, G.; Cao, X.; Hamm, N.A.S.; Lin, T.; Zhang, G.; Chen, B. Unbalanced development characteristics and driving mechanisms of regional urban spatial form: A case study of Jiangsu Province, China. Sustainability 2021, 13, 3121. [Google Scholar] [CrossRef]
- Cao, S.; Lv, Y.; Zheng, H.; Wang, X. Challenges facing China’s unbalanced urbanization strategy. Land Use Policy 2014, 39, 412–415. [Google Scholar] [CrossRef]
- Drobnjaković, M.; Panić, M.; Đorđević, J. Traditional undeveloped municipalities in Serbia as a result of regional inequality. Eur. Plan. Stud. 2016, 24, 926–949. [Google Scholar] [CrossRef]
- Romao, J.; Neuts, B. Territorial capital, smart tourism specialization and sustainable regional development: Experiences from Europe. Habitat Int. 2017, 68, 64–74. [Google Scholar] [CrossRef] [Green Version]
- Li, H.; Goh, C.; Zhan, Q.H.; Meng, F. Effect of tourism on balanced regional development: A dynamic panel data analysis in costal inland China. Asia Pac. J. Tour. 2015, 20, 694–713. [Google Scholar] [CrossRef]
- Rogerson, C.M. Tourism and regional development: The case of South Africa’s distressed areas. Dev. S. Afr. 2015, 32, 277–291. [Google Scholar] [CrossRef]
- Lv, Z. Deepening or lessening? The effects of tourism on regional inequality. Tour. Manag. 2019, 72, 23–26. [Google Scholar] [CrossRef]
- Tucki, A.; Pylak, K. Collective or individual? What types of tourism reduce economic inequality in peripheral regions? Sustainability 2021, 13, 4898. [Google Scholar] [CrossRef]
- Goh, C.; Li, H.; Qiu, Z. Achieving balanced regional development in China: Is domestic or international tourism more efficacious? Tour. Econ. 2015, 21, 369–386. [Google Scholar] [CrossRef]
- Lu, L.; Ge, J.B. Reflection on the research progress of tourism urbanization. Geogr. Res. 2006, 25, 741–750. [Google Scholar]
- Afrakhteh, H. The problems of regional development and border cities: A case study of Zahedan, Iran. Cities 2006, 23, 423–432. [Google Scholar] [CrossRef]
- Hutárová, D.; Kozelová, I.; Špulerová, J. Tourism development options in marginal and less-favored regions: A case study of Slovakia´s Gemer Region. Land 2021, 10, 229. [Google Scholar] [CrossRef]
- Fang, C.L. A theoretical analysis of the mechanism and evolutionary law of urban-rural integration development. Acta Geol. Sin. 2022, 77, 759–776. [Google Scholar]
- Yu, B. Ecological effects of new-type urbanization in China. Renew. Sustain. Energy Rev. 2021, 135, 110239. [Google Scholar] [CrossRef]
- Salvatore, R.; Chiodo, E.; Fantini, A. Tourism transition in peripheral rural areas: Theories, issues and strategies. Ann. Tour. Res. 2018, 68, 41–51. [Google Scholar] [CrossRef]
- Zhu, L.; Hu, J.; Xu, J.; Li, Y.; Liang, M. Spatial distribution characteristics and influencing factors of pro-poor tourism villages in China. Sustainability 2022, 14, 15953. [Google Scholar] [CrossRef]
- Huang, Z.F.; Lu, L.; Su, Q.; Zhang, J.H.; Sun, J.X.; Wan, X.C.; Jin, C. Research and development of rural tourism under the background of new urbanization: Theoretical reflection and breakthrough of predicament. Geogr. Res. 2015, 34, 1409–1421. [Google Scholar]
- Pang, X.; Wang, R.; Wang, W. Research on coupling of tourism and urbanization in underdevelopment regions:a case study of Fusong county in Jilin Province. Geogr. Geo-Inf. Sci. 2014, 30, 130–134. [Google Scholar]
- Matlovičová, K.; Kolesárová, J.; Demková, M.; Kostilníková, K.; Mocák, P.; Pachura, P.; Payne, M. Stimulating poverty alleviation by developing tourism in marginalised Roma communities: A case study of the Central Spiš Region (Slovakia). Land 2022, 11, 1689. [Google Scholar] [CrossRef]
- Guo, Y.; Liu, Y. Sustainable poverty alleviation and green development in China’s underdeveloped areas. J. Geogr. Sci. 2022, 32, 23–43. [Google Scholar] [CrossRef]
- Mullins, P. Tourism urbanization. Int. J. Urban Reg. Res. 1991, 15, 326–342. [Google Scholar] [CrossRef]
- Xi, J.; Wang, X.; Kong, Q.; Zhang, N. Spatial morphology evolution of rural settlements induced by tourism. J. Geogr. Sci. 2015, 25, 497–511. [Google Scholar] [CrossRef]
- Lin, L.; Li, J. Analysis on the coupling relationship and coordinated development between the construction of ethnic minority tourist towns and the tourism industry. Sustainability 2021, 13, 2451. [Google Scholar] [CrossRef]
- Tao, H.; Liu, J.M.; Deng, Y.; Du, A. Tourism sectorization opportunity spectrum model and space partition of tourism urbanization area: A case of the Mayangxi ecotourism area, Fujian province, China. J. Mt. Sci. 2017, 14, 595–608. [Google Scholar] [CrossRef]
- Clavé, S.A.; Wilson, J. The evolution of coastal tourism destinations: A path plasticity perspective on tourism urbanisation. J. Sustain. Tour. 2017, 25, 96–112. [Google Scholar] [CrossRef]
- Xiong, J.X.; Wang, W.H.; He, S.H.; Yin, Y.; Tang, C.F. Spatio-temporal pattern and influencing factor of coupling coordination of tourism urbanization system in the Dongting Lake Region. Sci. Geogr. Sin. 2020, 40, 1532–1542. [Google Scholar]
- Zhao, L.; Dong, Y.F. Tourism agglomeration and urbanization: Empirical evidence from China. Asia Pac. J. Tour. Res. 2017, 22, 512–523. [Google Scholar] [CrossRef]
- Gladstone, D.L. Tourism urbanization in the United States. Urban Aff. Rev. 1998, 34, 3–27. [Google Scholar] [CrossRef]
- Szivas, E.; Riley, M.; Airey, D. Labor mobility into tourism: Attraction and satisfaction. Ann. Tour. Res. 2003, 30, 64–76. [Google Scholar] [CrossRef]
- Wang, M. Research on convergence of rural tourism and related industries based on the perspective of holistic tourism: Practice analysis from China. Ekoloji 2019, 28, 4295–4302. [Google Scholar]
- Qian, J.; Feng, D.; Zhu, H. Tourism-driven urbanization in China’s small town development: A case study of Zhapo Town, 1986–2003. Habitat Int. 2012, 36, 152–160. [Google Scholar] [CrossRef]
- Luo, J.M.; Qiu, H.; Lam, C.F. Urbanization impacts on regional tourism development: A case study in China. Curr. Issues Tour. 2016, 19, 282–295. [Google Scholar] [CrossRef]
- Yu, F.L.; Huang, Z.F.; Cao, F.D. Influence of China’s urbanization on tourism economic development. J. Nat. Res. 2014, 29, 1297. [Google Scholar]
- Naidu, S. Exploring the dynamic effects of urbanization and real effective exchange rate on tourism output of Singapore. Asia Pac. J. Tour. Res. 2017, 22, 185–200. [Google Scholar] [CrossRef]
- Grah, B.; Dimovski, V.; Peterlin, J. Managing sustainable urban tourism development: The case of Ljubljana. Sustainability 2020, 12, 792. [Google Scholar] [CrossRef] [Green Version]
- Shen, W.; Huang, Z.; Yin, S.; Hsu, W.-L. Temporal and spatial coupling characteristics of tourism and urbanization with mechanism of high-quality development in the Yangtze River Delta urban agglomeration, China. Appl. Sci. 2022, 12, 3403. [Google Scholar] [CrossRef]
- Cuadrado-Ciuraneta, S.; Durà-Guimerà, A.; Salvati, L. Not only tourism: Unravelling suburbanization, second-home expansion and “rural” sprawl in Catalonia, Spain. Urban Geogr. 2017, 38, 66–89. [Google Scholar] [CrossRef]
- Adedoyin, F.F.; Bekun, F.V. Modelling the interaction between tourism, energy consumption, pollutant emissions and urbanization: Renewed evidence from panel VAR. Environ. Sci. Pollut. Res. 2020, 27, 38881–38900. [Google Scholar] [CrossRef] [PubMed]
- Xie, X.; Zhang, L.; Sun, H.; Chen, F.F.; Zhou, C.S. Spatiotemporal difference characteristics and influencing factors of tourism urbanization in China’s major tourist cities. Int. J. Environ. Res. Public Health 2021, 18, 10414. [Google Scholar] [CrossRef]
- Liu, J.; Li, C.; Tao, J.; Ma, Y.; Wen, X. Spatiotemporal coupling factors and mode of tourism industry, urbanization and ecological environment: A case study of Shaanxi, China. Sustainability 2019, 11, 4923. [Google Scholar] [CrossRef] [Green Version]
- Zhang, F.; Yang, X.; Wu, J.; Ma, D.; Xiao, Y.; Gong, G.; Zhang, J. How new urbanization affects tourism eco-efficiency in China: An analysis considering the undesired outputs. Sustainability 2022, 14, 10820. [Google Scholar] [CrossRef]
- Hao, M.; Li, G.; Chen, C.; Liang, L. A coupling relationship between new-type urbanization and tourism resource conversion efficiency: A case study of the Yellow River Basin in China. Sustainability 2022, 14, 14007. [Google Scholar] [CrossRef]
- Luo, J.M.; Qiu, H.; Goh, C.; Wang, D. An analysis of tourism development in China from urbanization perspective. J. Qual. Assur. Hosp. Tour. 2016, 17, 24–44. [Google Scholar] [CrossRef]
- Ong, C.E.; Liu, Y. State-directed tourism urbanisation in China’s Hengqin. Ann. Tour. Res. 2022, 94, 103379. [Google Scholar] [CrossRef]
- Chen, M.; Ye, C.; Lu, D.; Sui, Y.; Guo, S. Cognition and construction of the theoretical connotation for new-type urbanization with Chinese characteristics. Acta Geogr. Sin. 2019, 74, 633–647. [Google Scholar]
- Zhao, L.; Pan, T.T.; Fang, C.; Lin, S. Tourism industry and new urbanization—A view based on system coupling perspective. Tour. Trib. 2020, 35, 14–31. [Google Scholar]
- Hu, F.Z.; Cao, B.R. Influence of urbanization on tourism development in the Yangtze River Economic Belt. Geogr. Geo-Inf. Sci. 2018, 34, 113–118. [Google Scholar]
- Su, M.M.; Wall, G.; Wang, Y.; Jin, M. Livelihood sustainability in a rural tourism destination-Hetu Town, Anhui Province, China. Tour. Manag. 2019, 71, 272–281. [Google Scholar] [CrossRef]
- Bires, Z.; Raj, S. Tourism as a pathway to livelihood diversification: Evidence from biosphere reserves, Ethiopia. Tour. Manag. 2020, 81, 104159. [Google Scholar] [CrossRef]
- Pulido-Fernández, J.I.; Cárdenas-García, P.J. Analyzing the bidirectional relationship between tourism growth and economic development. J. Travel Res. 2021, 60, 583–602. [Google Scholar] [CrossRef]
- Guo, Y.J.; Chen, Y.N. Tourism spatial economic perspective of global tourism. Tour. Trib. 2016, 31, 28–29. [Google Scholar]
- Su, B. Rural tourism in China. Tour. Manag. 2011, 32, 1438–1441. [Google Scholar] [CrossRef]
- Chen, M.; Gong, Y.; Lu, D.; Ye, C. Build a people-oriented urbanization: China’s new-type urbanization dream and Anhui model. Land Use Policy 2019, 80, 1–9. [Google Scholar] [CrossRef]
- Wu, X.; Huang, Y.; Gao, J. Impact of industrial agglomeration on new-type urbanization: Evidence from Pearl River Delta urban agglomeration of China. Int. Rev. Econ. Financ. 2022, 77, 312–325. [Google Scholar] [CrossRef]
- Zhang, Y.; Wei, T.; Tian, W.; Zhao, K. Spatiotemporal differentiation and driving mechanism of coupling coordination between new-type urbanization and ecological environment in China. Sustainability 2022, 14, 11780. [Google Scholar] [CrossRef]
- Fang, C.L. Basic rules and key paths for high-quality development of the new urbanization in China. Geogr. Res. 2019, 38, 13–22. [Google Scholar]
- Shao, J.; Wang, L. Can new-type urbanization improve the green total factor energy efficiency? Evidence from China. Energy 2023, 262, 125499. [Google Scholar] [CrossRef]
- Feng, Y.; Liu, Y.; Yuan, H. The spatial threshold effect and its regional boundary of new-type urbanization on energy efficiency. Energy Policy 2022, 164, 112866. [Google Scholar] [CrossRef]
- Ma, L.; Xiang, L.; Wang, C.; Chen, N.; Wang, W. Spatiotemporal evolution of urban carbon balance and its response to new-type urbanization: A case of the middle reaches of the Yangtze River urban agglomerations, China. J. Clean Prod. 2022, 380, 135122. [Google Scholar] [CrossRef]
- Shang, J.; Wang, Z.; Li, L.; Chen, Y.; Li, P.F. A study on the correlation between technology innovation and the new-type urbanization in Shaanxi province. Technol. Forecast. Soc. 2018, 135, 266–273. [Google Scholar] [CrossRef]
- Chen, M.; Sui, Y.; Guo, S. Perspective of China’s new urbanization after 19th CPC national congress. Geogr. Res. 2019, 38, 181–192. [Google Scholar]
- Xu, J.; Li, W. The impact of the digital economy on innovation: New evidence from Panel Threshold Model. Sustainability 2022, 14, 15028. [Google Scholar] [CrossRef]
- Xiao, R.; Lin, M.; Fei, X.; Li, Y.; Zhang, Z.; Meng, Q. Exploring the interactive coercing relationship between urbanization and ecosystem service value in the Shanghai–Hangzhou bay metropolitan region. J. Clean Prod. 2020, 253, 119803. [Google Scholar] [CrossRef]
- An, S.; Zhang, S.; Hou, H.; Zhang, Y.; Xu, H.; Liang, J. Coupling coordination analysis of the ecology and economy in the Yellow River Basin under the background of high-quality development. Land 2022, 11, 1235. [Google Scholar] [CrossRef]
- Huang, C.; Lin, F.; Chu, D.; Wang, L.; Liao, J.; Wu, J. Coupling relationship and interactive response between intensive land use and tourism industry development in China’s major tourist cities. Land 2021, 10, 697. [Google Scholar] [CrossRef]
- Chen, Z.; Zhang, Q.; Li, F.; Shi, J. Comprehensive evaluation of land use benefit in the Yellow River Basin from 1995 to 2018. Land 2021, 10, 643. [Google Scholar] [CrossRef]
- Zhang, J.; Wang, S.; Yang, P.; Fan, F.; Wang, X. Analysis of scale factors on China’s sustainable development efficiency based on Three-Stage DEA and a Double Threshold Test. Sustainability 2020, 12, 2225. [Google Scholar] [CrossRef] [Green Version]
- Chen, J.; Ma, C.; Chen, S. Determinant of the tourism economy in Chinese cities: From an urban centrality perspective. Tour. Econ. 2022, 135481662211321. [Google Scholar] [CrossRef]
- Li, L.; Ma, S.; Wang, R.; Wang, Y.; Zheng, Y. Citizen participation in the co-production of urban natural resource assets: Analysis based on social media big data. J. Glob. Inf. Manag. 2021, 30, 1–21. [Google Scholar] [CrossRef]
- Zhang, L. Spatial-temporal evolution of county urbanization and its influencing factors in Zhejiang province. Geogr. Res. 2016, 35, 1151–1163. [Google Scholar]


| Goal Layer | Criterion Layer | Indicator Layer | Unit | Index Attribute * | Weights |
|---|---|---|---|---|---|
| Tourism industry | Economic benefit | Total tourism income | Billion CNY | + | 0.155 |
| Tourism foreign exchange earnings | Billion USD | + | 0.196 | ||
| Market size | Domestic tourist arrivals | Million people | + | 0.105 | |
| Overseas tourist arrivals | Million people | + | 0.178 | ||
| Industry scale | Number of travel agencies | Ind | + | 0.161 | |
| Number of scenic spots | Ind | + | 0.071 | ||
| Number of employees in the accommodation and catering industry | Million people | + | 0.086 | ||
| Development potential | The growth rate of domestic tourist arrivals | % | + | 0.013 | |
| The growth rate of overseas tourist arrivals | % | + | 0.035 | ||
| Urbanization | Population structure | Proportion of urban population | % | + | 0.026 |
| Population density | People/square kilometer | - | 0.057 | ||
| Economic development | Number of industrial enterprises above designated size | Ind | + | 0.066 | |
| Number of key service enterprises | Ind | + | 0.047 | ||
| Non-agricultural industry as a proportion of GDP | % | + | 0.039 | ||
| Disposable income of urban residents | CNY | + | 0.037 | ||
| Per capita GDP | CNY | + | 0.046 | ||
| Ecological environment | Comprehensive index of air pollution | mg/m3 | - | 0.037 | |
| Green coverage rate of built district | % | + | 0.016 | ||
| Number of days when the air quality reaches and is better than the second level | Per day | + | 0.016 | ||
| Treatment rate of domestic sewage | % | + | 0.021 | ||
| Per capita public green space area | Square meters | + | 0.028 | ||
| Public services | Postal traffic business volume as a proportion of GDP | % | + | 0.049 | |
| Public libraries | Ind | + | 0.073 | ||
| Number of beds in health institutions | Sheet | + | 0.070 | ||
| Passenger car ownership by city | 10,000 trucks | + | 0.073 | ||
| General public budget expenditure | Billion CNY | + | 0.054 | ||
| Extent of graded roads | Kilometers | + | 0.052 | ||
| Number of villages benefitting from tap water | Ind | + | 0.081 | ||
| Rural electricity consumption | Billion kilowatt hours | + | 0.112 |
| Coupling Degree Value | Coupling Level | Characteristic |
|---|---|---|
| 0.0 < C ≤ 0.3 | Severe uncoupling | Poor interconnectivity |
| 0.3 < C ≤ 0.5 | Slight uncoupling | Increased interconnectedness with simultaneous inhibition |
| 0.5 < C ≤ 0.8 | Primary coupling | System enters benign coupling |
| 0.8 < C ≤ 1.0 | Advanced coupling | Good resonance, jointly promote development |
| Type | Numerical Value | Subtype | Numerical Value | Coupling Coordinator Subtype |
|---|---|---|---|---|
| Coordinated development | 0.8 < D ≤ 1.0 | Good coordination | G(y)−F(x) > 0.1 | Good coordination—Tourism industry lagging behind |
| F(x)−G(y) > 0.1 | Good coordination—Urbanization lagging behind | |||
| 0 < |G(y)−F(x)| ≤ 0.1 | Good coordination | |||
| 0.6 < D ≤ 0.8 | Moderate coordination | G(y)−F(x) > 0.1 | Moderate coordination—Tourism industry lagging behind | |
| F(x)−G(y) > 0.1 | Moderate coordination—Urbanization lagging behind | |||
| 0 < |G(y)−F(x)| ≤ 0.1 | Moderate coordination | |||
| Transformational development | 0.4 < D ≤ 0.6 | Minimal coordination | G(y)−F(x) > 0.1 | Minimal coordination—Tourism industry lagging behind |
| F(x)−G(y) > 0.1 | Minimal coordination—Urbanization lagging behind | |||
| 0 < |G(y)−F(x)| ≤ 0.1 | Minimal coordination | |||
| Uncoordinated development | 0.2 < D ≤ 0.4 | Close to imbalance | G(y)−F(x) > 0.1 | Close to imbalance—Tourism industry lagging behind |
| F(x)−G(y) > 0.1 | Close to imbalance—Urbanization lagging behind | |||
| 0 < |G(y)−F(x)| ≤ 0.1 | Close to imbalance | |||
| 0.0 < D ≤ 0.2 | Severe imbalance | G(y)−F(x) > 0.1 | Severe imbalance—Tourism industry lagging behind | |
| F(x)−G(y) > 0.1 | Severe imbalance—Urbanization lagging behind | |||
| 0 < |G(y)−F(x)| ≤ 0.1 | Severe imbalance |
| Year | Tourism Industry | Urbanization | ||||
|---|---|---|---|---|---|---|
| Mean | SD | CV | Mean | SD | CV | |
| 2010 | 0.117 | 0.150 | 1.282 | 0.300 | 0.306 | 1.020 |
| 2019 | 0.451 | 0.251 | 0.556 | 0.530 | 0.537 | 1.014 |
| Variate | (1) Random-Effects Tobit Regression | (2) Tobit Regression after Indicator Replacement | (3) Truncated Regression | (4) Random-Effects OLS Regression | (5) Clad Estimate |
|---|---|---|---|---|---|
| lnis | 0.135 (0.043) *** | 0.135 (0.043) *** | 0.195 *** (4.00) | 0.138 *** (3.86) | 0.072 (1.43) |
| lnta | 0.354 (0.088) *** | 0.357 (0.091) *** | 0.264 *** (3.64) | 0.377 *** (5.00) | 0.278 *** (4.30) |
| lnop | −0.025 (0.029) | −0.035 (0.037) | −0.08 (−1.90) | −0.049 ** (−2.03) | −0.087 * (−2.07) |
| lnce | 0.131 (0.058) ** | 0.148 (0.062) ** | 0.223 *** (3.30) | 0.1567 *** (3.35) | 0.342 *** (4.76) |
| lnca | 0.446 (0.091) *** | 0.464 (0.089) *** | 0.352 *** (3.63) | 0.281 *** (3.84) | 0.338 *** (4.26) |
| lnts | 0.115 (0.035) *** | 0.118 (0.036) *** | 0.116 *** (3.43) | 0.097 *** (3.21) | 0.099 ** (2.83) |
| Constant | −0.072 (0.033) ** | −0.088 (0.022) *** | −0.034 (−1.27) | −0.005 (−0.19) | −0.041 (−1.78) |
| sigma_u | 0.03 (0.014) ** | 0.031 (0.0138) ** | |||
| sigma_e | 0.08 (0.007) *** | 0.079 (0.007) *** | |||
| LR | p = 0.048 | p = 0.041 |
Disclaimer/Publisher’s Note: The statements, opinions and data contained in all publications are solely those of the individual author(s) and contributor(s) and not of MDPI and/or the editor(s). MDPI and/or the editor(s) disclaim responsibility for any injury to people or property resulting from any ideas, methods, instructions or products referred to in the content. |
© 2023 by the authors. Licensee MDPI, Basel, Switzerland. This article is an open access article distributed under the terms and conditions of the Creative Commons Attribution (CC BY) license (https://creativecommons.org/licenses/by/4.0/).
Share and Cite
Zhang, P.; Zhang, L.; Han, D.; Wang, T.; Zhu, H.; Chen, Y. Coupled and Coordinated Development of the Tourism Industry and Urbanization in Marginal and Less Developed Regions—Taking the Mountainous Border Areas of Western Yunnan as a Case Study. Land 2023, 12, 640. https://doi.org/10.3390/land12030640
Zhang P, Zhang L, Han D, Wang T, Zhu H, Chen Y. Coupled and Coordinated Development of the Tourism Industry and Urbanization in Marginal and Less Developed Regions—Taking the Mountainous Border Areas of Western Yunnan as a Case Study. Land. 2023; 12(3):640. https://doi.org/10.3390/land12030640
Chicago/Turabian StyleZhang, Pengyang, Lewen Zhang, Dandan Han, Tingting Wang, He Zhu, and Yongtao Chen. 2023. "Coupled and Coordinated Development of the Tourism Industry and Urbanization in Marginal and Less Developed Regions—Taking the Mountainous Border Areas of Western Yunnan as a Case Study" Land 12, no. 3: 640. https://doi.org/10.3390/land12030640