
Coordinated Development and Sustainability of the Agriculture, Climate and Society System in China: Based on the PLE Analysis Framework

Abstract
:1. Introduction
2. Literature Review
3. Research Design
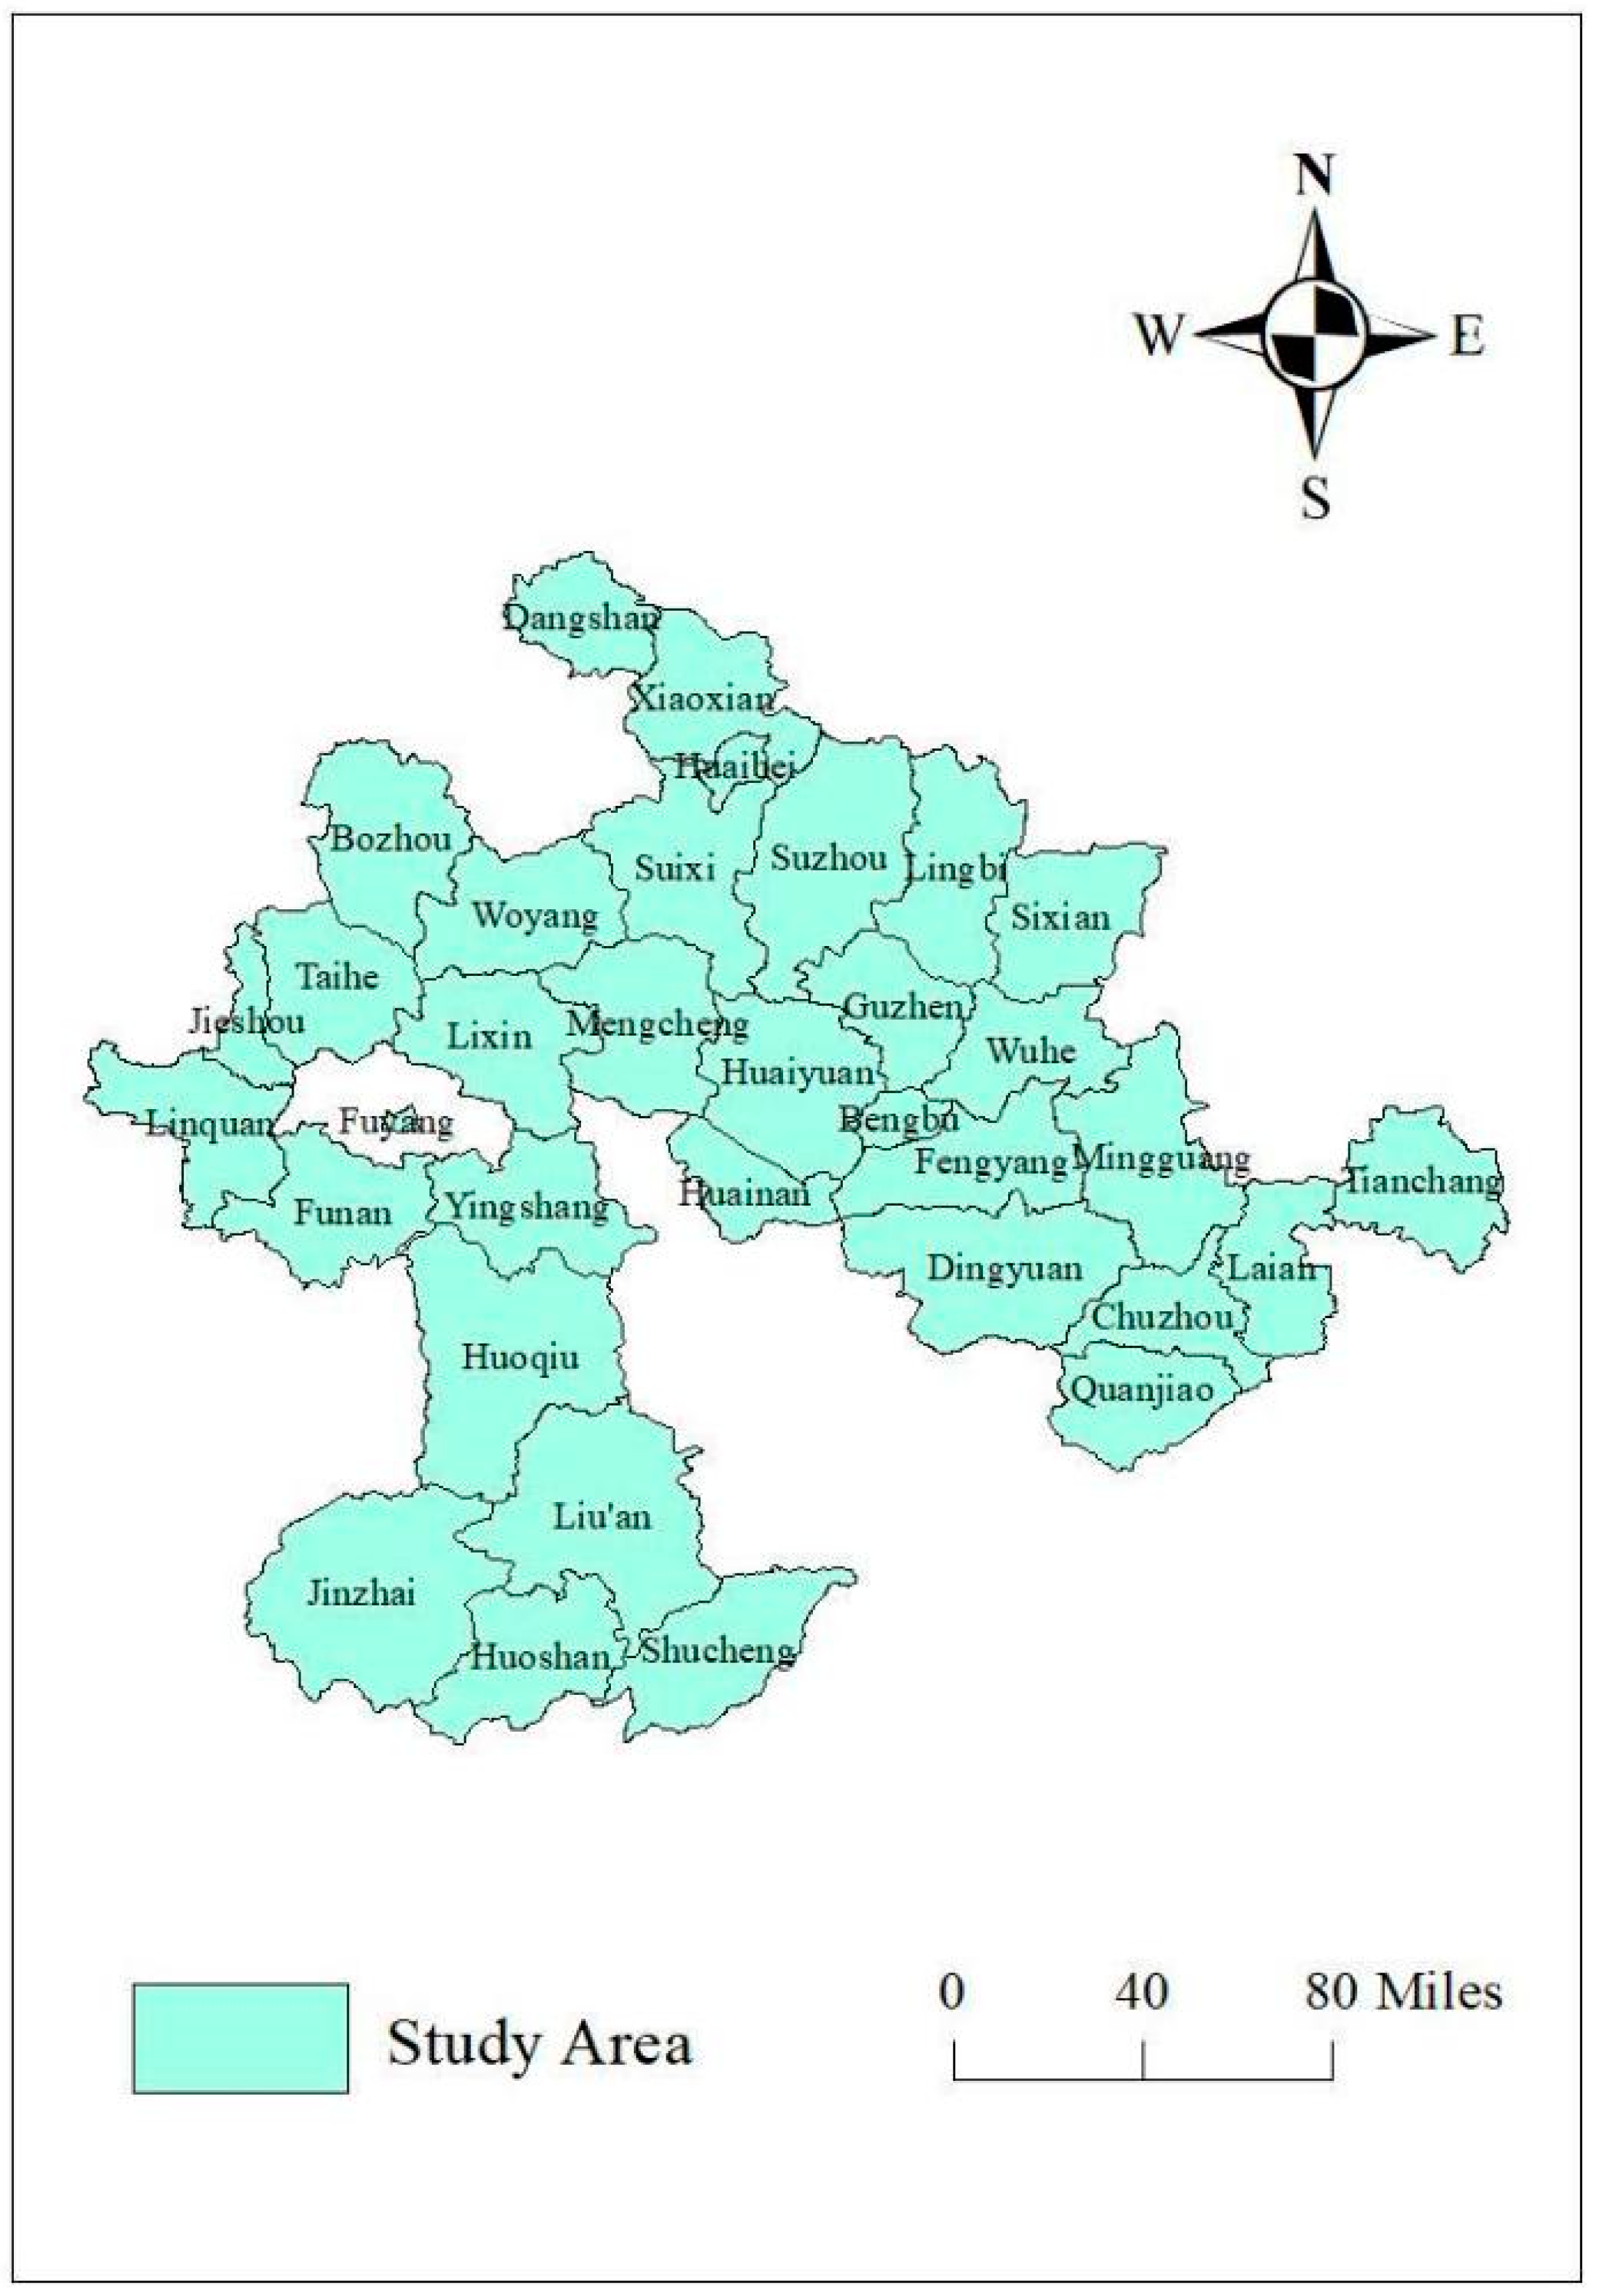
3.1. Study Area
3.2. Index System
3.3. Data Resource
3.4. Methods
3.4.1. Coupling Degree Model
3.4.2. Coupling coordination Degree Model
3.4.3. Geographical Detectors
4. Model Regression Results and Analysis
4.1. The Overall Situation of the Development of Each Subsystem
4.2. Analysis of Spatial—Temporal Evolution of the Coupling Coordination Degree of the APLE System
4.2.1. Time Change Characteristics of the Coupling Coordination Relationship
4.2.2. Spatial Evolution Trend of Coupling Coordination
4.3. An Examination of the Influencing Factors and Driving Mechanisms
4.3.1. Analysis of Influencing Factors
4.3.2. Driving Mechanism Analysis
- (1)
- The internal driving forces
- (2)
- External driving forces
5. Discussion
6. Conclusions and Suggestions
6.1. Conclusions
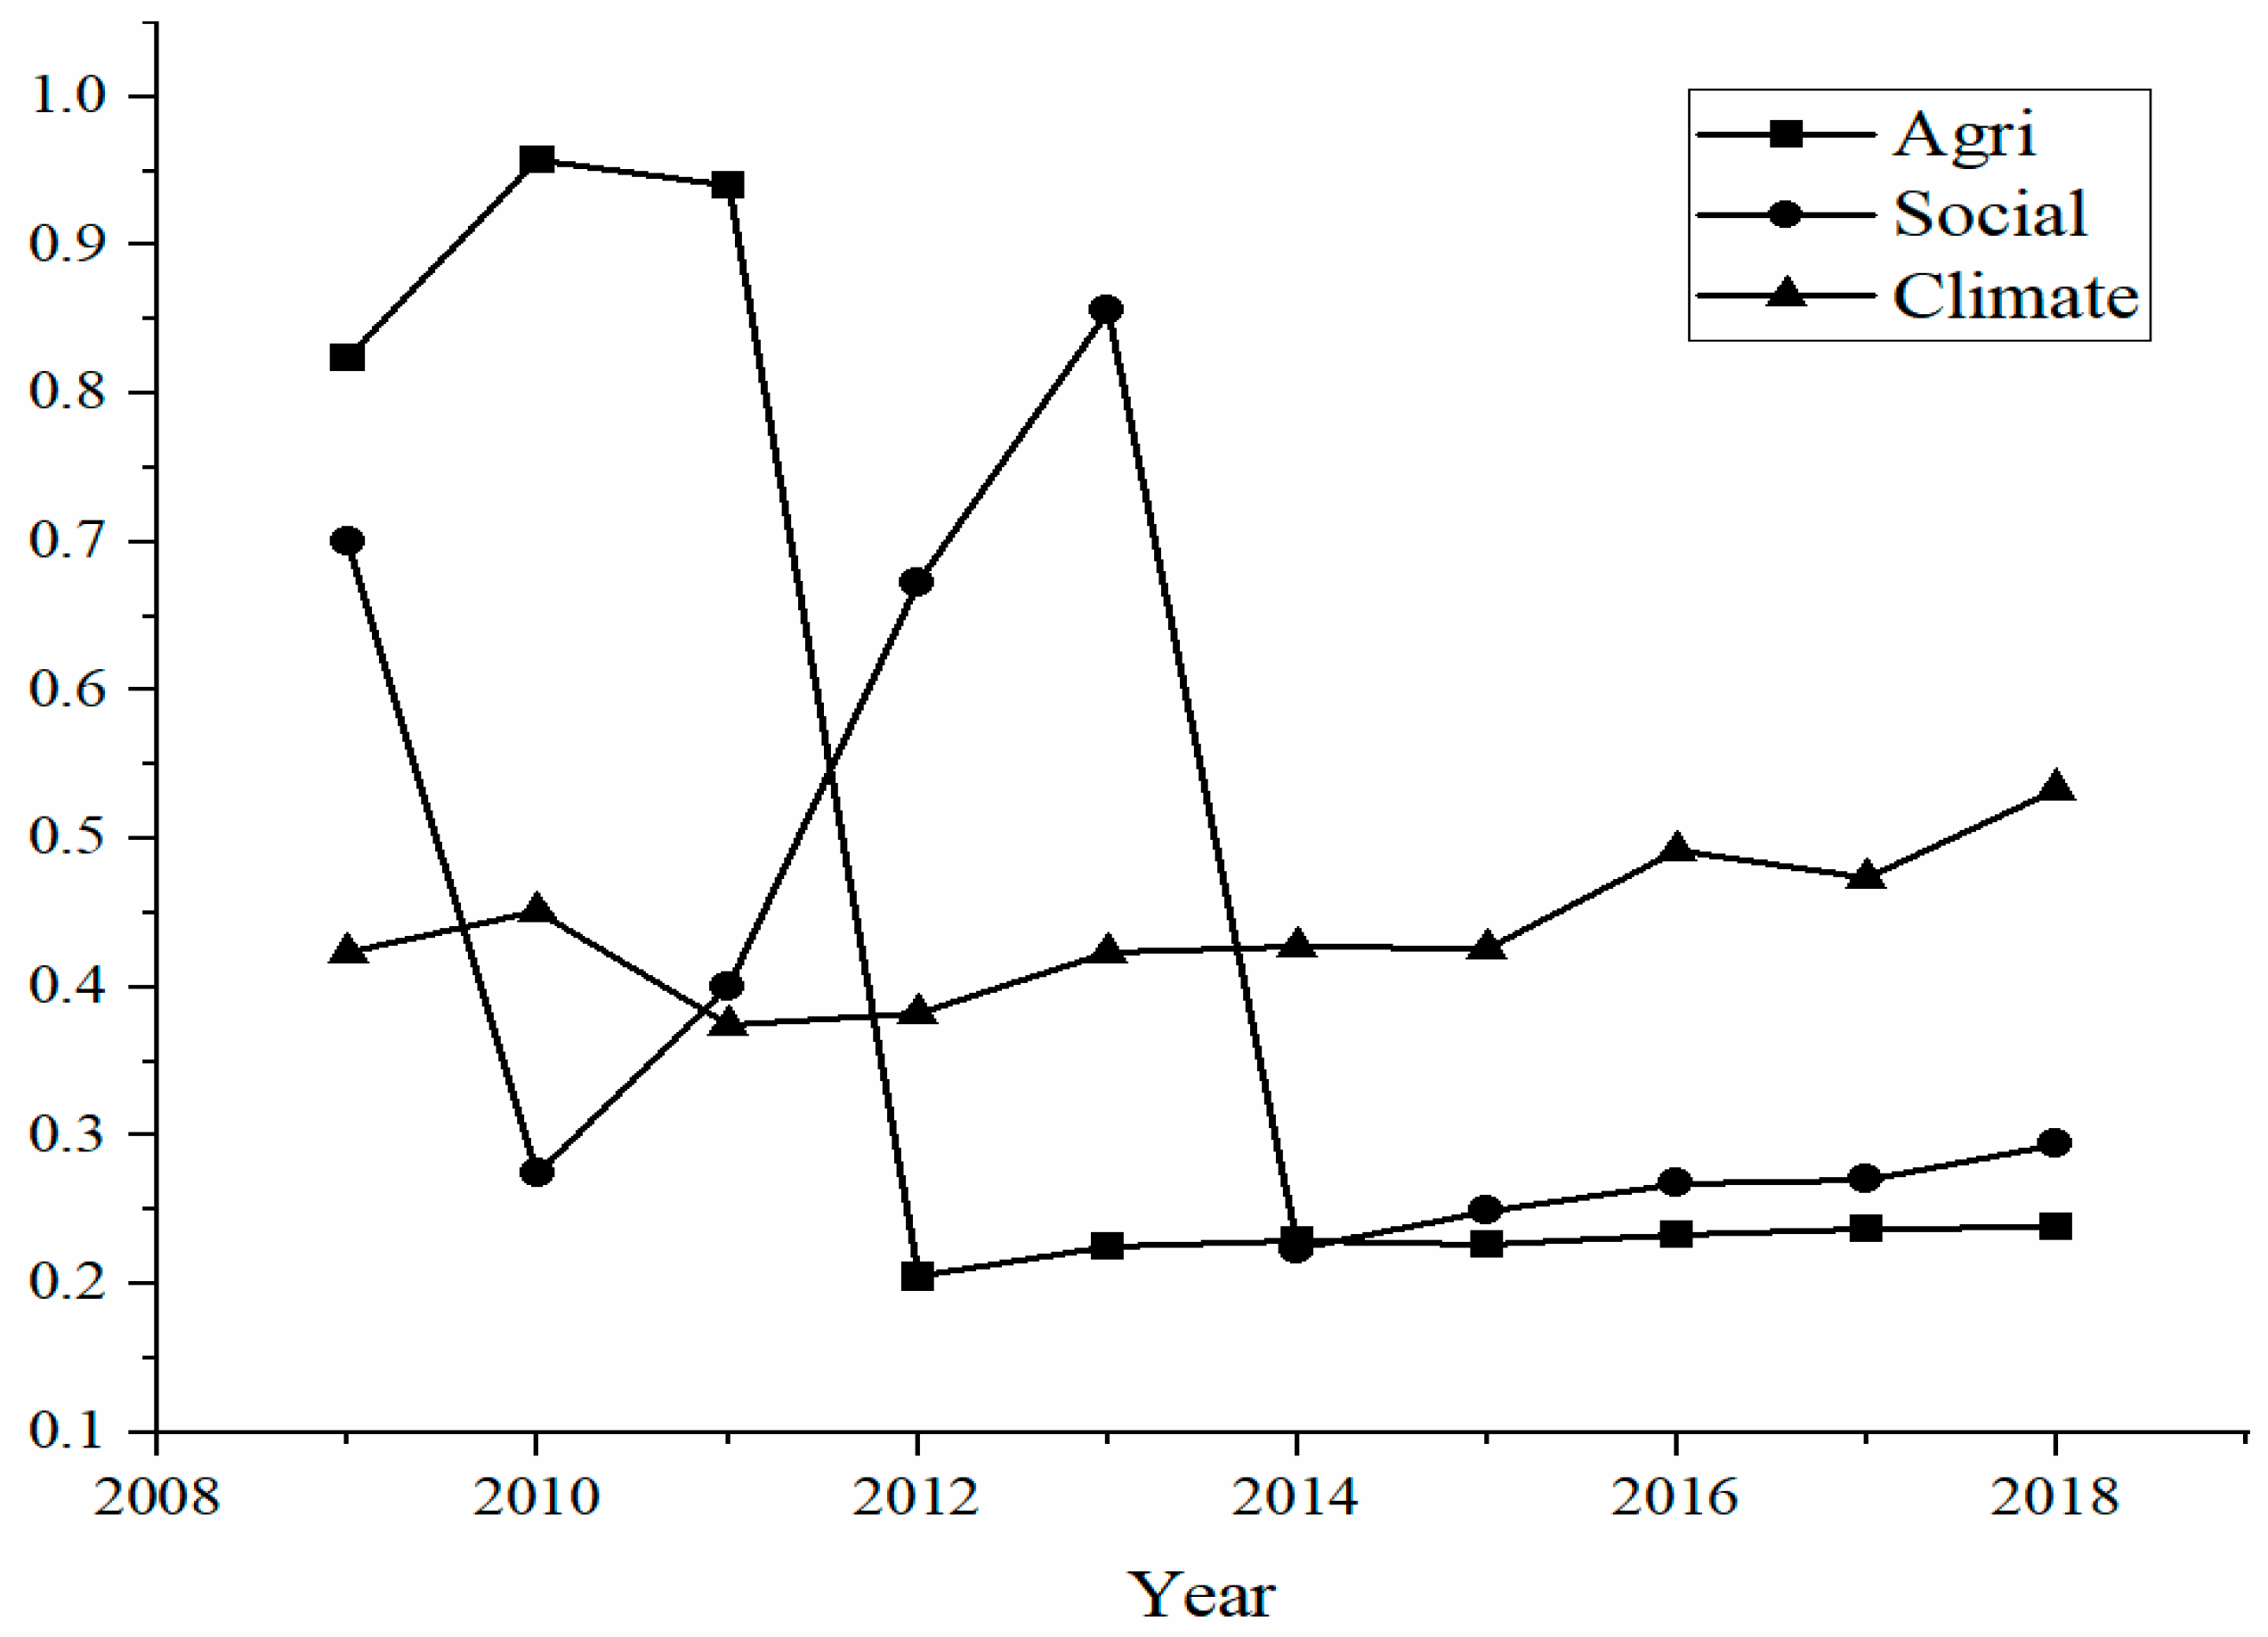
- (1)
- From 2009 to 2018, the average level of agricultural and social system development quality in the HREB displayed clear stages and volatile change characteristics. The change in the average climate was relatively stable, and the overall trend was “steadily rising”. Meanwhile, from 2009 to 2014, the agricultural and social systems formed a “scissor difference”, and the quality of the development of the 3 subsystems showed steady and balanced slow growth from 2015 to 2019.
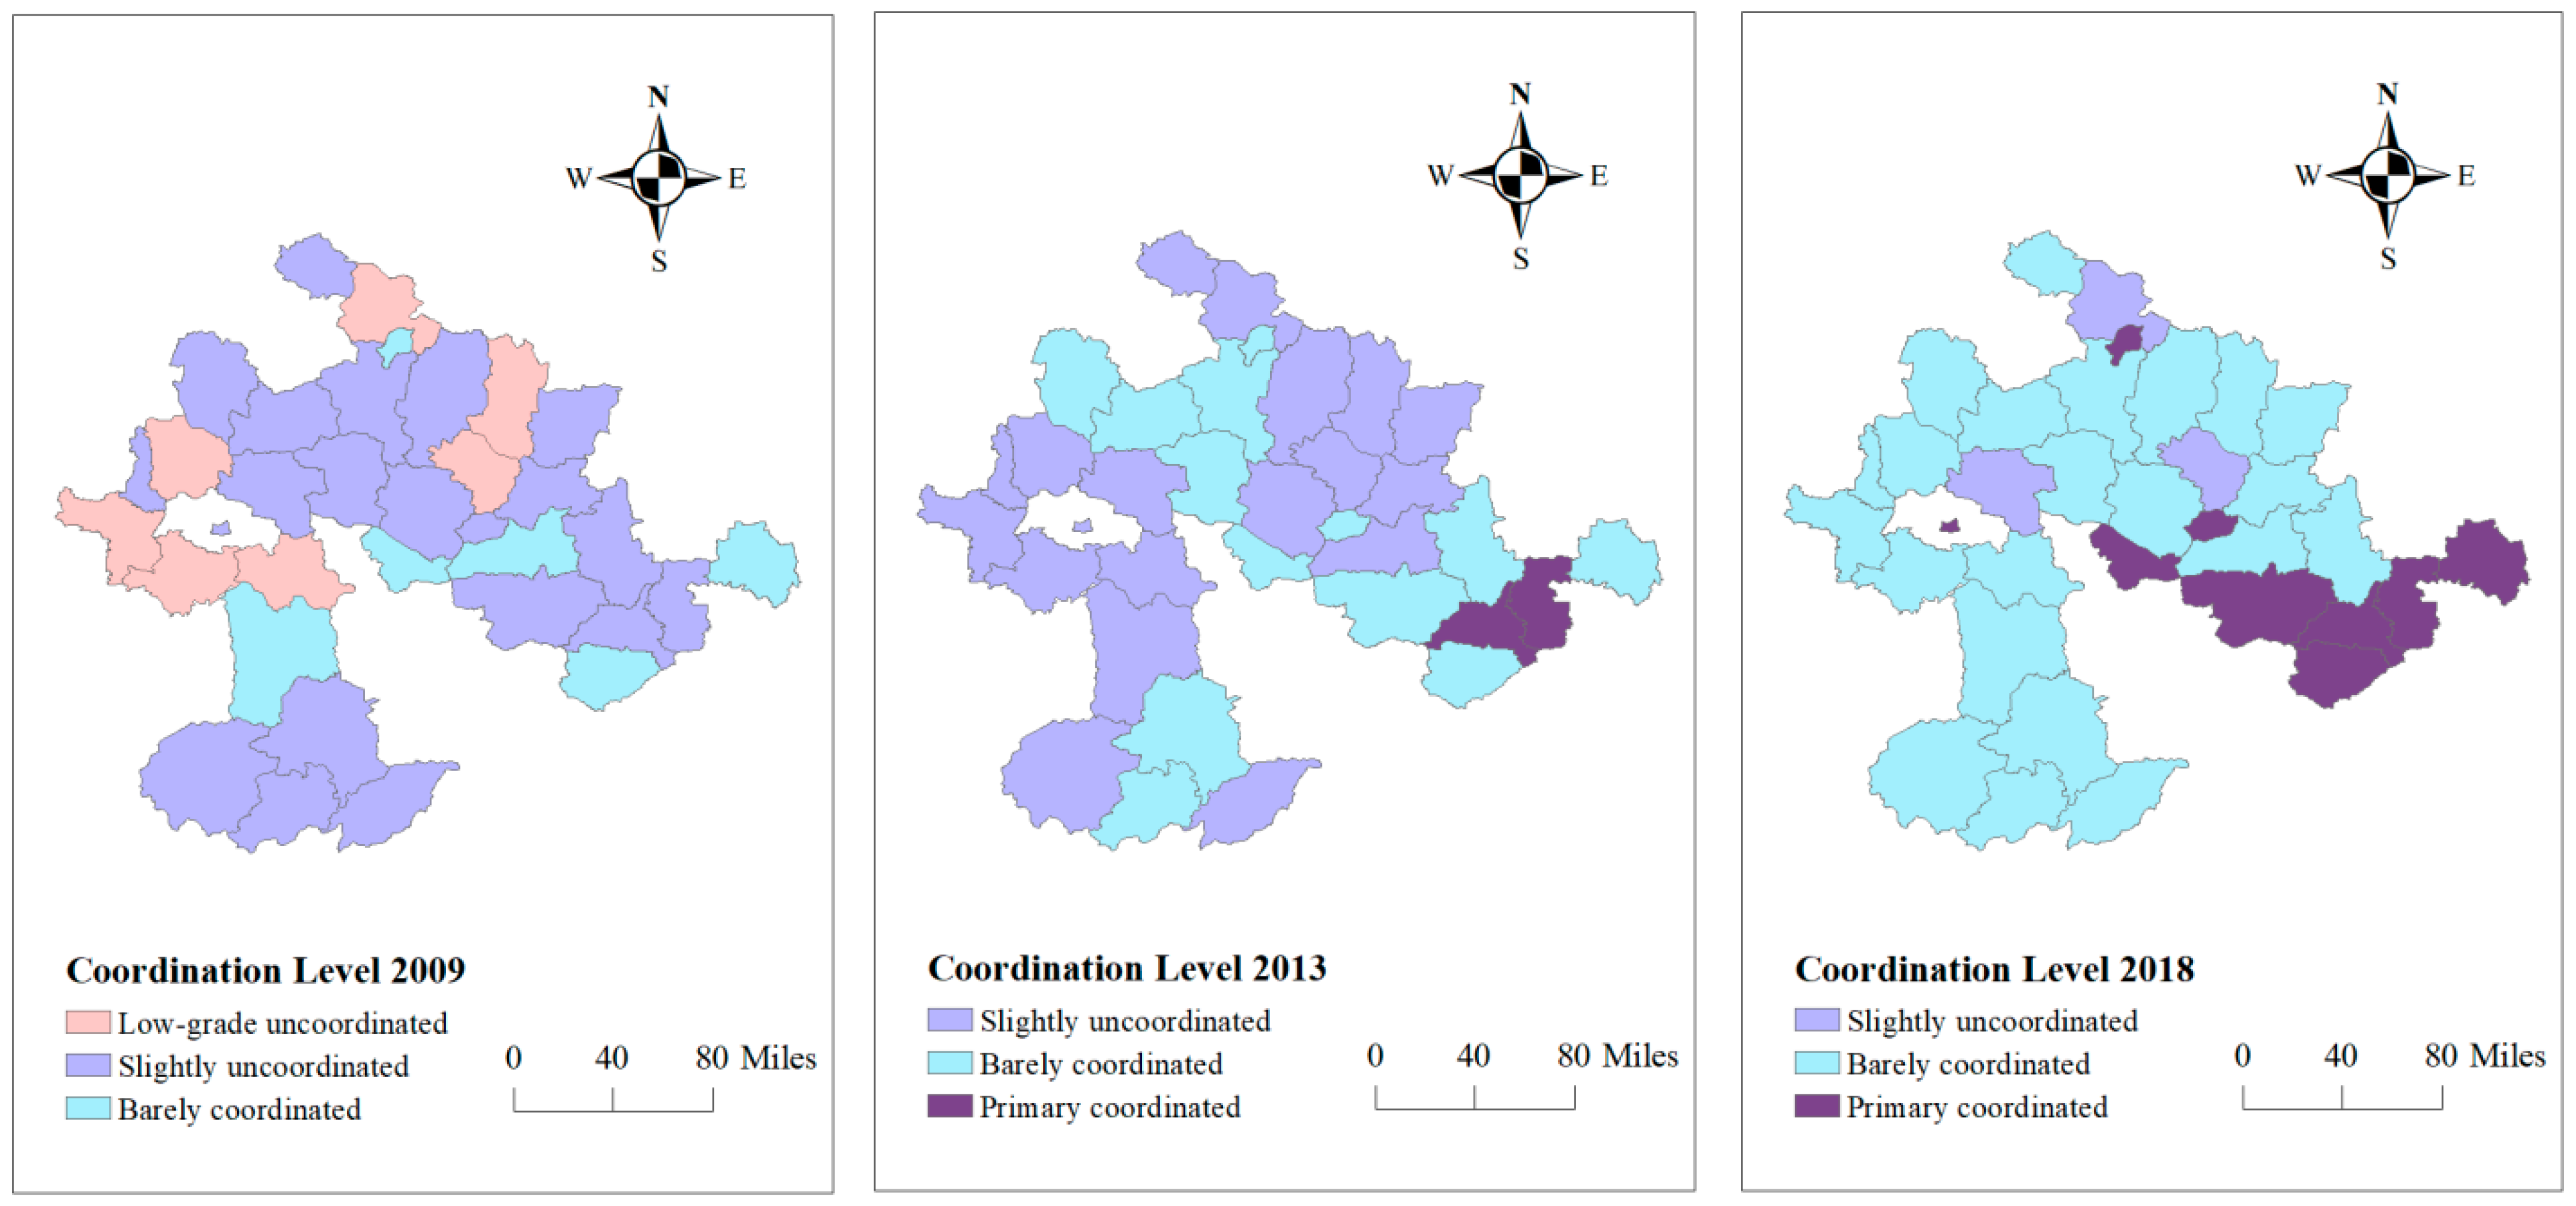
- (2)
- The coupling and coordinated development of the APLE system in the HREB is relatively stable, and the development of the coupling coordination degree shows an upward trend, but there is still large room for improvement. Furthermore, the spatial differences in the coupling coordination degree among counties are obvious and show the basic characteristics of being high in the southeast and low in the northwest. In particular, the counties located in the Hefei and Nanjing metropolitan areas have a higher level of coupled and coordinated development.
- (3)
- The results of the risk factor detection using geographical detectors show that the drought and flood protection yield, effective irrigation rate, per capita electricity consumption in agriculture, number of beds in medical institutions per 10,000 people, per capita disposable income of urban residents, annual average temperature, and annual precipitation are the main influencing factors for the spatial differentiation of the coupling and coordinated development of the three systems. Judging from the detection results of factor interaction, the two-way interaction is stronger than that of the factor alone.
- (4)
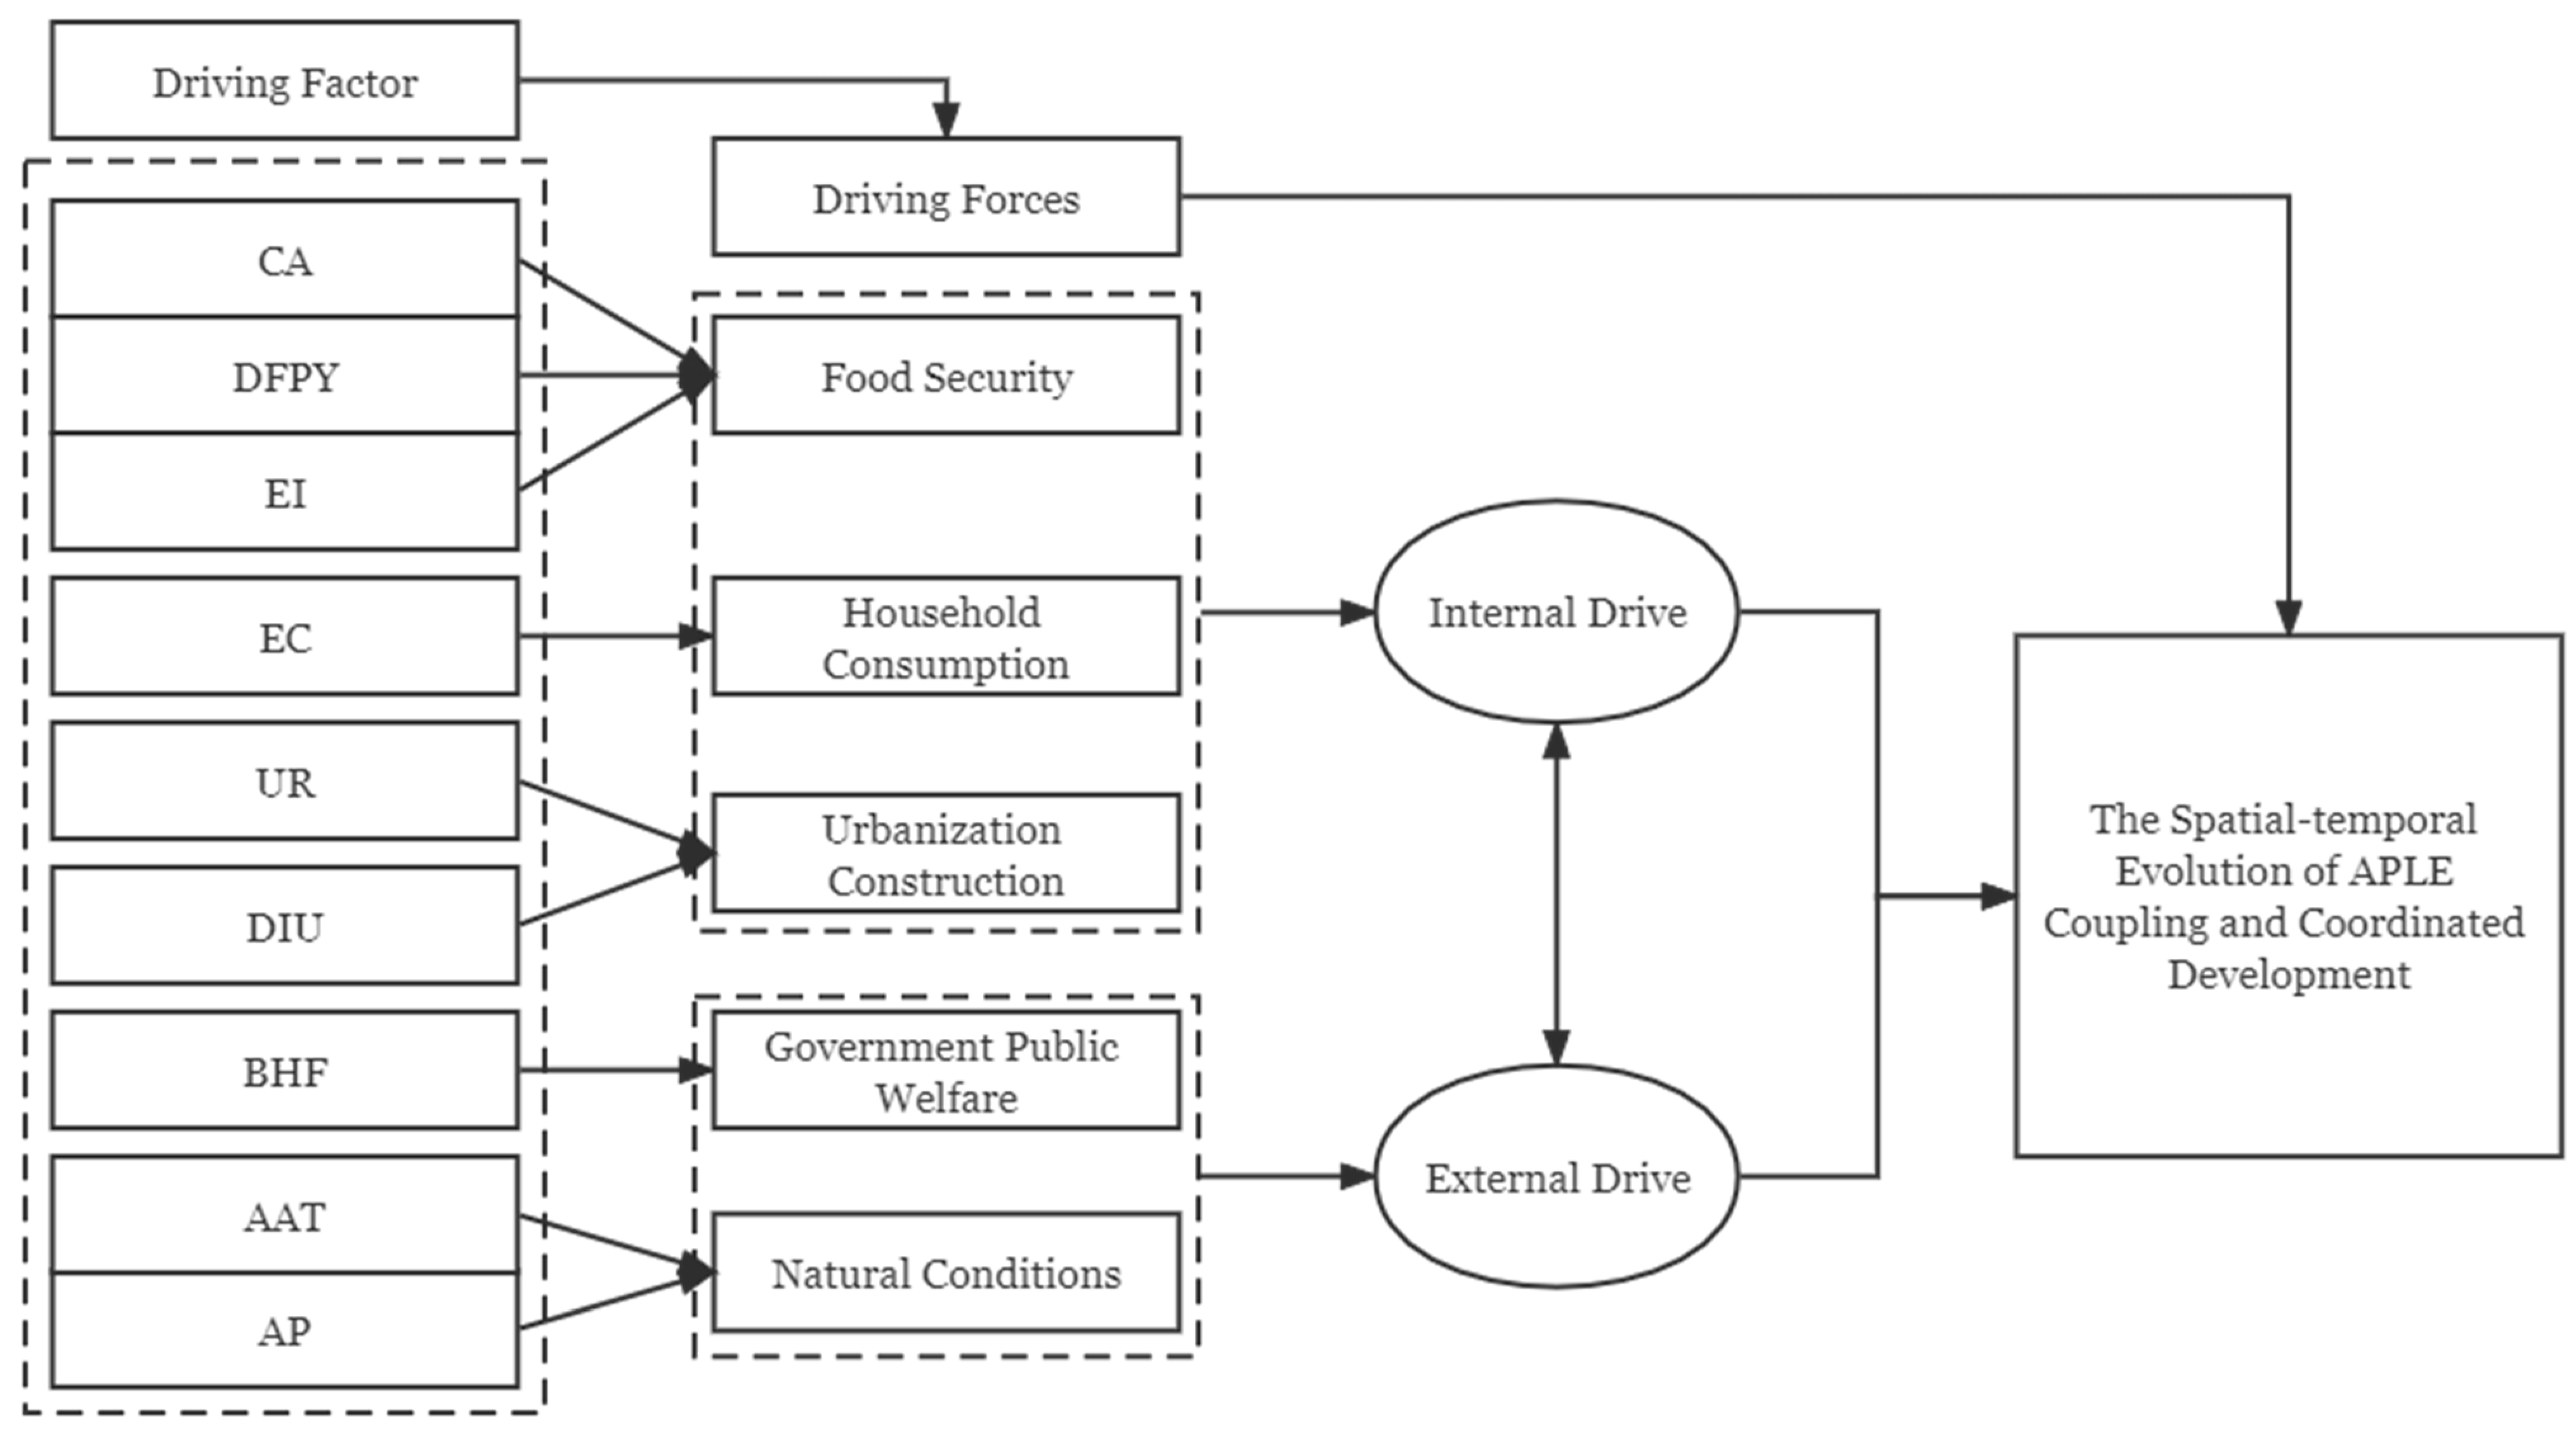
- The spatial–temporal evolution of the coupling and coordinated development of the APLE system is the result of the comprehensive effect of internal driving forces, such as food security, the consumption level of rural residents, and the development level of urbanization construction, and external driving forces such as government public welfare and natural conditions.
6.2. Suggestions
Author Contributions
Funding
Institutional Review Board Statement
Informed Consent Statement
Data Availability Statement
Acknowledgments
Conflicts of Interest
References
- Chen, Y.; Wang, G.; Sun, W. Agricultural Status and Agricultural Development in the Rural Revitalization Strategy. Issues Agric. Econ. 2018, 457, 20–26. [Google Scholar] [CrossRef]
- Liu, D.; Zhu, X.; Wang, Y. China′s agricultural green total factor productivity based on carbon emission: An analysis of evolution trend and influencing factors. J. Clean. Prod. 2021, 278, 123692. [Google Scholar] [CrossRef]
- Zhou, Y.; Li, X.; Liu, Y. Rural land system reforms in China: History, issues, measures and prospects. Land Use Policy 2020, 91, 104330. [Google Scholar] [CrossRef]
- Myers, S.S.; Smith, M.R.; Guth, S.; Golden, C.D.; Vaitla, B.; Mueller, N.D.; Dangour, A.D.; Huybers, P. Climate Change and Global Food Systems: Potential Impacts on Food Security and Undernutrition. Annu. Rev. Public Health 2017, 38, 259–277. [Google Scholar] [CrossRef]
- Wijerathna-Yapa, A.; Pathirana, R. Sustainable Agro-Food Systems for Addressing Climate Change and Food Security. Agriculture 2022, 12, 1554. [Google Scholar] [CrossRef]
- Vogel, E.; Donat, M.G.; Alexander, L.V.; Meinshausen, M.; Ray, D.K.; Karoly, D.; Meinshausen, N.; Frieler, K. The effects of climate extremes on global agricultural yields. Environ. Res. Lett. 2019, 14, 054010. [Google Scholar] [CrossRef]
- Ortiz-Bobea, A.; Ault, T.R.; Carrillo, C.M.; Chambers, R.G.; Lobell, D.B. Anthropogenic climate change has slowed global agricultural productivity growth. Nat. Clim. Change 2021, 11, 306–312. [Google Scholar] [CrossRef]
- Hansen, J.; Hellin, J.; Rosenstock, T.; Fisher, E.; Cairns, J.; Stirling, C.; Lamanna, C.; van Etten, J.; Rose, A.; Campbell, B. Climate risk management and rural poverty reduction. Agric. Syst. 2019, 172, 28–46. [Google Scholar] [CrossRef]
- Fu, J.; Bu, Z.; Jiang, D.; Lin, G. Identification and Classification of Urban PLES Spatial Functions Based on Multisource Data and Machine Learning. Land 2022, 11, 1824. [Google Scholar] [CrossRef]
- Zhang, Z.; Xiong, C.; Yang, Y.; Liang, C.; Jiang, S. What Makes the River Chief System in China Viable? Examples from the Huaihe River Basin. Sustainability 2022, 14, 6329. [Google Scholar] [CrossRef]
- Mao, G.; Jin, W.; Zhu, Y.; Mao, Y.; Hsu, W.-L.; Liu, H.-L. Environmental Pollution Effects of Regional Industrial Transfer Illustrated with Jiangsu, China. Sustainability 2021, 13, 12128. [Google Scholar] [CrossRef]
- Pan, Z.; Ruan, X.; Qian, M.; Hua, J.; Shan, N.; Xu, J. Analysis of the Spatial Distribution Characteristics of Livestock and Poultry Farming Pollution and Assessment of the Environmental Pollution Load in Anhui Province. Hydrol. Res. 2018, 49, 177–193. [Google Scholar] [CrossRef] [Green Version]
- Hou, W.; Wu, S.; Yang, L.; Yin, Y.; Gao, J.; Deng, H.; Wu, M.; Li, X.; Liu, L. Production–Living–Ecological Risk Assessment and Corresponding Strategies in China’s Provinces under Climate Change Scenario. Land 2022, 11, 1424. [Google Scholar] [CrossRef]
- Lyu, H.-M.; Xu, Y.-S.; Cheng, W.-C.; Arulrajah, A. Flooding Hazards across Southern China and Prospective Sustainability Measures. Sustainability 2018, 10, 1682. [Google Scholar] [CrossRef] [Green Version]
- Liao, R.; Liu, G.; Chen, J.; Zhang, L. Interdecadal Variability of Summer Extreme Rainfall Events over the Huaihe River Basin and Associated Atmospheric Circulation. Atmosphere 2022, 13, 1189. [Google Scholar] [CrossRef]
- Chandio, A.A.; Akram, W.; Sargani, G.R.; Twumasi, M.A.; Ahmad, F. Assessing the impacts of meteorological factors on soybean production in China: What role can agricultural subsidy play? Ecol. Inform. 2022, 71, 101778. [Google Scholar] [CrossRef]
- Chandio, A.A.; Jiang, Y.; Rehman, A.; Rauf, A. Short and long-run impacts of climate change on agriculture: An empirical evidence from China. Int. J. Clim. Change Strateg. Manag. 2020, 12, 201–221. [Google Scholar] [CrossRef]
- Zhang, H.; Chandio, A.A.; Yang, F.; Tang, Y.; Ankrah Twumasi, M.; Sargani, G.R. Modeling the Impact of Climatological Factors and Technological Revolution on Soybean Yield: Evidence from 13-Major Provinces of China. Int. J. Environ. Res. Public Health 2022, 19, 5708. [Google Scholar] [CrossRef]
- Zhang, H.; Tang, Y.; Chandio, A.A.; Sargani, G.R.; Ankrah Twumasi, M. Measuring the Effects of Climate Change on Wheat Production: Evidence from Northern China. Int. J. Environ. Res. Public Health 2022, 19, 12341. [Google Scholar] [CrossRef]
- Huang, X.; Xu, X.; Wang, Q.; Zhang, L.; Gao, X.; Chen, L. Assessment of Agricultural Carbon Emissions and Their Spatiotemporal Changes in China, 1997-2016. Int. J. Environ. Res. Public Health 2019, 16, 3105. [Google Scholar] [CrossRef] [Green Version]
- Mendelsohn, R.; Basist, A.; Kurukulasuriya, P.; Dinar, A. Climate and Rural Income. Clim. Chang. 2007, 81, 101–118. [Google Scholar] [CrossRef]
- Barbier, E.; Hochard, J. Poverty, rural population distribution and climate change. Environ. Dev. Econ. 2018, 23, 234–256. [Google Scholar] [CrossRef] [Green Version]
- Barua, A.; Katyaini, S.; Mili, B.; Gooch, P. Climate change and poverty: Building resilience of rural mountain communities in South Sikkim, Eastern Himalaya, India. Reg. Environ. Chang. 2014, 14, 267–280. [Google Scholar] [CrossRef]
- Sinha, M.; Sendhil, R.; Chandel, B.S.; Malhotra, R.; Singh, A.; Jha, S.K.; Sankhala, G. Are Multidimensional Poor more Vulnerable to Climate change? Evidence from Rural Bihar, India. Soc. Indic. Res. 2022, 162, 123–149. [Google Scholar] [CrossRef]
- Shen, Z.; Balezentis, T.; Chen, X.; Valdmanis, V. Green growth and structural change in Chinese agricultural sector during 1997–2014. China Econ. Rev. 2018, 51, 83–96. [Google Scholar] [CrossRef]
- Tan, R.; Wang, R.; Heerink, N. Liberalizing rural-to-urban construction land transfers in China: Distribution effects. China Econ. Rev. 2020, 60, 101147. [Google Scholar] [CrossRef]
- Shi, Z. Thinking on promoting the high-quality development of Huaihe River Ecological Economic Belt. Econ. Res. Guide 2021, 484, 38–40. [Google Scholar]
- Sun, J.; Yi, S. Research on Ways to Promote the High-quality Development of Huaihe river Ecological Economic belt. Financ. Trade Res. 2020, 31, 43–48. [Google Scholar] [CrossRef]
- Ji, T.; Chen, T.; Mao, G. Assessment of water resources carrying capacity in Huaihe River Ecological Economic Belt based on entropy weight Topsis. China Agric. Resour. Reg. Plan. 2018, 39, 130–135. [Google Scholar]
- Liu, Z.; Wang, H.; Li, N.; Zhu, J.; Pan, Z.; Qin, F. Spatial and Temporal Characteristics and Driving Forces of Vegetation Changes in the Huaihe River Basin from 2003 to 2018. Sustainability 2020, 12, 2198. [Google Scholar] [CrossRef] [Green Version]
- Hsu, W.-L.; Shen, X.; Xu, H.; Zhang, C.; Liu, H.-L.; Shiau, Y.-C. Integrated Evaluations of Resource and Environment Carrying Capacity of the Huaihe River Ecological and Economic Belt in China. Land 2021, 10, 1168. [Google Scholar] [CrossRef]
- Ren, Z.; Zhu, K. Study on the Effect of rural human capital increase and its Spatial characteristics in Huaihe River Ecological Economic Belt. J. Shanxi Agric. Univ. (Soc. Sci. Ed.) 2019, 18, 54–61. [Google Scholar] [CrossRef]
- Liang, J.; Pan, S.; Chen, W.; Li, J.; Zhou, T. Cultivated Land Fragmentation and Its Influencing Factors Detection: A Case Study in Huaihe River Basin, China. Int. J. Environ. Res. Public Health 2021, 19, 138. [Google Scholar] [CrossRef]
- Weng, Q.; Peng, S.; Qiang, Z.; Rui, Y.; Youzhen, W.; Fanrui, B.; Min, X. Temporal and spatial Variation of extreme temperature in the Huaihe River Basin under non-stationary conditions and analysis of teleconferences and circulation characteristics. Resour. Environ. Yangtze Basin 2019, 28, 2513–2526. [Google Scholar]
- Liu, S.; Xie, Y.; Fang, H.; Du, H.; Xu, P. Trend Test for Hydrological and Climatic Time Series Considering the Interaction of Trend and Autocorrelations. Water 2022, 14, 3006. [Google Scholar] [CrossRef]
- Chang, F. Study on Evaluation Index System of Urban Competitiveness in Huaihe River Ecological Economic Belt: An empirical analysis based on dynamic factor model. Water Econ. 2021, 39, 7–14. [Google Scholar]
- Suo, L.; Li, F.; Zhu, X. Analysis of Industrial Undertaking Capacity and Direction in Huaihe River Ecological Economic Belt. Ecol. Econ. 2021, 37, 64–69. [Google Scholar]
- Li, N.; Da Jia, H.; Kim, D.J. Coordinated Development of Agricultural Insurance, Agricultural Loans, and the Agricultural Industry in China. J. Asian Financ. Econ. Bus. 2022, 9, 205–217. [Google Scholar] [CrossRef]
- Deng, F.; Jia, S.; Ye, M.; Li, Z. Coordinated development of high-quality agricultural transformation and technological innovation: A case study of main grain-producing areas, China. Environ. Sci. Pollut. Res. Int. 2022, 29, 35150–35164. [Google Scholar] [CrossRef]
- Wang, Y.; Jin, C.; Peng, Q.; Liu, J.; Wu, X. Systematic Measurement and Evolution Situation of Coupling Coordination Level between Intensive Cultivated Land Utilization and New-Type Urbanization. Sustainability 2022, 14, 11716. [Google Scholar] [CrossRef]
- Chen, K.; Tian, G.; Tian, Z.; Ren, Y.; Liang, W. Evaluation of the Coupled and Coordinated Relationship between Agricultural Modernization and Regional Economic Development under the Rural Revitalization Strategy. Agronomy 2022, 12, 990. [Google Scholar] [CrossRef]
- Yang, M.; Jiao, M.; Zhang, J. Coupling Coordination and Interactive Response Analysis of Ecological Environment and Urban Resilience in the Yangtze River Economic Belt. Int. J. Environ. Res. Public Health 2022, 19, 11988. [Google Scholar] [CrossRef] [PubMed]
- Chen, J.; Liu, Y.; Wang, L. Research on Coupling Coordination Development for Photovoltaic Agriculture System in China. Sustainability 2019, 11, 1065. [Google Scholar] [CrossRef] [Green Version]
- Cai, J.; Li, X.; Liu, L.; Chen, Y.; Wang, X.; Lu, S. Coupling and coordinated development of new urbanization and agro-ecological environment in China. Sci. Total Environ. 2021, 776, 145837. [Google Scholar] [CrossRef]
- Zhang, X.; Xu, Z. Functional Coupling Degree and Human Activity Intensity of Production–Living–Ecological Space in Underdeveloped Regions in China: Case Study of Guizhou Province. Land 2021, 10, 56. [Google Scholar] [CrossRef]
- Wang, C.; Ma, Y.; Zhang, A.; Hu, M. Spatio-Temporal Coordination Analysis of Urban Welfare and Tourism Development in the Yangtze River Delta Region. Systems 2022, 10, 222. [Google Scholar] [CrossRef]
- Tang, H.; Chen, Y.; Ao, R.; Shen, X.; Shi, G. Spatial–Temporal Characteristics and Driving Factors of the Coupling Coordination between Population Health and Economic Development in China. Sustainability 2022, 14, 10513. [Google Scholar] [CrossRef]
- Gan, W.; Yao, W.; Huang, S.; Liu, Y. A Study on the Coupled and Coordinated Development of the Logistics Industry, Digitalization, and Ecological Civilization in Chinese Regions. Sustainability 2022, 14, 16390. [Google Scholar] [CrossRef]
- Liu, Y.; Yang, R.; Sun, M.; Zhang, L.; Li, X.; Meng, L.; Wang, Y.; Liu, Q. Regional sustainable development strategy based on the coordination between ecology and economy: A case study of Sichuan Province, China. Ecol. Indic. 2022, 134, 108445. [Google Scholar] [CrossRef]
- Fan, Y.; Fang, C.; Zhang, Q. Coupling coordinated development between social economy and ecological environment in Chinese provincial capital cities-assessment and policy implications. J. Clean. Prod. 2019, 229, 289–298. [Google Scholar] [CrossRef]
- Liu, Q.; Yang, D.; Cao, L. Evolution and Prediction of the Coupling Coordination Degree of Production–Living–Ecological Space Based on Land Use Dynamics in the Daqing River Basin, China. Sustainability 2022, 14, 10864. [Google Scholar] [CrossRef]
- Wang, Y.; Xiang, P. Urban Sprawl Sustainability of Mountainous Cities in the Context of Climate Change Adaptability Using a Coupled Coordination Model: A Case Study of Chongqing, China. Sustainability 2018, 11, 20. [Google Scholar] [CrossRef] [Green Version]
- Paramesh, V.; Kumar, P.; Shamim, M.; Ravisankar, N.; Arunachalam, V.; Nath, A.J.; Mayekar, T.; Singh, R.; Prusty, A.K.; Rajkumar, R.S.; et al. Integrated Farming Systems as an Adaptation Strategy to Climate Change: Case Studies from Diverse Agro-Climatic Zones of India. Sustainability 2022, 14, 11629. [Google Scholar] [CrossRef]
- Liu, T.; Ren, C.; Zhang, S.; Yin, A.; Yue, W. Coupling Coordination Analysis of Urban Development and Ecological Environment in Urban Area of Guilin Based on Multi-Source Data. Int. J. Environ. Res. Public Health 2022, 19, 12583. [Google Scholar] [CrossRef]
- Liu, Z.; Jing, D.; Han, Y.; Yu, J.; Lu, T.; Zhangzhong, L. Spatiotemporal Distribution Characteristics and Influencing Factors Analysis of Reference Evapotranspiration in Beijing–Tianjin–Hebei Region from 1990 to 2019 under Climate Change. Sustainability 2022, 14, 6277. [Google Scholar] [CrossRef]
- Lu, Q.; Yang, Y.; Li, B.; Li, Y.; Wang, D. Coupling Relationship and Influencing Factors of the Water–Energy–Cotton System in Tarim River Basin. Agronomy 2022, 12, 2333. [Google Scholar] [CrossRef]
- Willemen, L.; Hein, L.; van Mensvoort, M.E.F.; Verburg, P.H. Space for people, plants, and livestock? Quantifying interactions among multiple landscape functions in a Dutch rural region. Ecol. Indic. 2010, 10, 62–73. [Google Scholar] [CrossRef]
- Liao, Z. Quantitative evaluation and classification system of the Coordinated development of environment and economy: A case study of the Pearl River Delta urban Agglomeration. J. Trop. Geogr. 1999, 19, 171–177. [Google Scholar]
- Li, J.; Zhou, Q.; Yin, P.; Khan, F. Smart and IoT-Based Coupling and Coordination Development for Financial and Logistics Industries. Mob. Inf. Syst. 2021, 2021, 3227408. [Google Scholar] [CrossRef]
- Li, J.; Sun, W.; Li, M.; Linlin, M. Coupling coordination degree of production, living and ecological spaces and its influencing factors in the Yellow River Basin. J. Clean. Prod. 2021, 298, 126083. [Google Scholar] [CrossRef]
- Wang, J. Geodetector: Principle and prospective. Acta Geogr. Sin. 2017, 72, 116–134. [Google Scholar] [CrossRef]
- Wang, J.F.; Li, X.H.; Christakos, G.; Liao, Y.L.; Zhang, T.; Gu, X.; Zheng, X.Y. Geographical Detectors-Based Health Risk Assessment and its Application in the Neural Tube Defects Study of the Heshun Region, China. Int. J. Geogr. Inf. Sci. 2010, 24, 107–127. [Google Scholar] [CrossRef]
- Thou, Z. Achieving food security in China: Past three decades and beyond. China Econ. Rev. 2010, 2, 251–275. [Google Scholar] [CrossRef]
- Ruiz, Y.D.; Nariño, O.S.; Almonte, J.M.J.; Domínguez, J.A.M. Household Food Security as a Complex System—Contributions to the Social Sciences from the Cuban Perspective during a Pandemic. Sustainability 2022, 14, 11783. [Google Scholar] [CrossRef]
- Zhu, Y.; Huo, C. The Impact of Agricultural Production Efficiency on Agricultural Carbon Emissions in China. Energies 2022, 15, 4464. [Google Scholar] [CrossRef]
- Zang, D.; Hu, Z.; Yang, Y.; He, S. Research on the Relationship between Agricultural Carbon Emission Intensity, Agricultural Economic Development and Agricultural Trade in China. Sustainability 2022, 14, 11694. [Google Scholar] [CrossRef]
- Tao, Z.; Xiang, G. Study on the relationship between the construction of new urban-rural relationship and rural revitalization: A case study of Hunan Province. China Agric. Resour. Reg. Plan. 2020, 41, 83–90. [Google Scholar]
- Wang, L.; Wang, Z.; Ma, Q.; Fang, G.; Yang, J. The development and reform of public health in China from 1949 to 2019. Glob. Health 2019, 15, 45. [Google Scholar] [CrossRef] [PubMed] [Green Version]
- Grigorescu, A.; Lincaru, C.; Pîrciog, S.; Chiţescu, R.-I. Competitiveness and sustainable development in public services. Management & Marketing. Chall. Knowl. Soc. 2019, 14, 108–129. [Google Scholar] [CrossRef] [Green Version]
- Yang, S.; Xu, J.; Yang, R. Research on Coordination and Driving Factors of Sports Industry and Regional Sustainable Development—Empirical Research Based on Panel Data of Provinces and Cities in Eastern China. Sustainability 2020, 12, 813. [Google Scholar] [CrossRef] [Green Version]
- Wei, G.; Sun, P.; Zhang, Z.; Ouyang, X. The Coordinated Relationship between Investment Potential and Economic Development and Its Driving Mechanism: A Case Study of the African Region. Sustainability 2020, 12, 442. [Google Scholar] [CrossRef] [Green Version]
- Liu, D.; Zhang, K. Analysis of Spatial Differences and the Influencing Factors in Eco-Efficiency of Urban Agglomerations in China. Sustainability 2022, 14, 12611. [Google Scholar] [CrossRef]


| Subsystem | Indicator Layer | Metric Definition | Indicator Direction | References |
|---|---|---|---|---|
| Agriculture (Production) | AO | Agricultural output per capita (10,000 yuan) | + | Li et al., 2022 [37] Deng et al., 2022 [38] |
| CA | Cultivated area per capita (hectare) | + | Wang et al., 2022b [39] | |
| EI | Effective irrigation rate (%) | + | Chen et al., 2022 [40] | |
| DFPY | Drought and flood protection yield (%) | + | Yang et al., 2022 [41] | |
| MP | Mechanical power per capita (KW) | + | Chen et al., 2019 [42] | |
| EC | Per capita electricity consumption in agriculture (degree) | + | Wang et al., 2022b [39] | |
| FCF | Fertilizer consumption per unit of farmland (ton) | + | Chen et al., 2019 [42] | |
| FCS | Per capita food crops are sown (hectare) | + | Cai et al., 2021 [43] | |
| Society (Living) | IFA | Per capita investment in fixed assets (10,000 yuan) | + | Zhang, 2021 [44] Yang et al., 2022 [41] |
| TRS | Total retail sales of consumer goods per capita (10,000 yuan) | + | Wang et al., 2022 [45] | |
| FR | Fiscal revenue per capita (10,000 yuan) | + | Tang et al., 2022 [46] | |
| UR | Level of urbanization (%) | + | Gan et al., 2022 [47] | |
| BHF | Number of beds in healthcare facilities per 10,000 people | + | Zhang et al., 2021 [44] | |
| DIU | Per capita disposable income of urban residents (10,000 yuan) | + | Liu et al., 2022a [48] | |
| EXP | Expenditure on science, education, culture, and public health per capita (10,000 yuan) | + | Fan et al., 2019 [49] | |
| Climate (Ecological) | AL | Altitude (m) | − | Liu et al., 2022b [50] |
| AAT | Average annual temperature (°C) | + | Liu et al., 2022b [50] | |
| AP | Annual precipitation (mm) | + | Liu et al., 2022b [50] | |
| NDAR | Number of days of annual rainstorms (day) | − | Wang et al., 2018 [51] Jia et al., 2018 [52] | |
| RD | Rainy days per year (day) | + | Paramesh et al., 2022 [53] | |
| AARH | Average annual relative humidity (%) | + | Liu et al., 2022c [54] | |
| ASH | Annual sunshine hours (h) | + | Liu et al., 2022c [55] | |
| MAPD | Maximum annual permafrost depth (cm) | + | Wang et al., 2019a [33] | |
| AAWS | Average annual wind speed (m/s) | + | Wang et al., 2019a [33] |
| Degree | Coordination Level | Degree | Coordination Level |
|---|---|---|---|
| [0.0–0.1] | Extremely uncoordinated | (0.5–0.6] | Barely coordinated |
| (0.1–0.2] | Severely uncoordinated | (0.6–0.7] | Primarily coordinated |
| (0.2–0.3] | Moderately uncoordinated | (0.7–0.8] | Moderately coordinated |
| (0.3–0.4] | Low-grade uncoordinated | (0.8–0.9] | Highly coordinated |
| (0.4–0.5] | Slightly uncoordinated | (0.9–1.0] | Excellently coordinated |
| 2009 | 2010 | 2011 | 2012 | 2013 | 2014 | 2015 | 2016 | 2017 | 2018 | |
|---|---|---|---|---|---|---|---|---|---|---|
| Bengbu | 0.490 | 0.495 | 0.498 | 0.520 | 0.544 | 0.568 | 0.580 | 0.600 | 0.608 | 0.668 |
| Bozhou | 0.416 | 0.420 | 0.431 | 0.459 | 0.501 | 0.499 | 0.513 | 0.546 | 0.540 | 0.555 |
| Chuzhou | 0.492 | 0.595 | 0.568 | 0.562 | 0.622 | 0.607 | 0.586 | 0.616 | 0.610 | 0.630 |
| Yanshan | 0.417 | 0.428 | 0.442 | 0.455 | 0.476 | 0.487 | 0.465 | 0.516 | 0.523 | 0.526 |
| Dingyuan | 0.481 | 0.468 | 0.474 | 0.509 | 0.526 | 0.541 | 0.567 | 0.575 | 0.579 | 0.601 |
| Fengyang | 0.509 | 0.453 | 0.465 | 0.466 | 0.491 | 0.493 | 0.502 | 0.519 | 0.524 | 0.539 |
| Funan | 0.359 | 0.367 | 0.394 | 0.414 | 0.429 | 0.473 | 0.504 | 0.530 | 0.543 | 0.575 |
| Fuyang | 0.416 | 0.426 | 0.416 | 0.435 | 0.475 | 0.499 | 0.534 | 0.514 | 0.540 | 0.600 |
| Guzhen | 0.347 | 0.368 | 0.382 | 0.396 | 0.422 | 0.446 | 0.449 | 0.467 | 0.438 | 0.485 |
| Huaiyuan | 0.426 | 0.439 | 0.442 | 0.465 | 0.496 | 0.500 | 0.532 | 0.552 | 0.513 | 0.555 |
| Huaibei | 0.503 | 0.507 | 0.522 | 0.532 | 0.560 | 0.557 | 0.552 | 0.592 | 0.595 | 0.600 |
| Huainan | 0.540 | 0.554 | 0.555 | 0.574 | 0.588 | 0.575 | 0.609 | 0.591 | 0.626 | 0.643 |
| Huoqiu | 0.508 | 0.434 | 0.441 | 0.455 | 0.463 | 0.482 | 0.467 | 0.498 | 0.509 | 0.548 |
| Huoshan | 0.477 | 0.496 | 0.495 | 0.514 | 0.524 | 0.551 | 0.549 | 0.572 | 0.563 | 0.587 |
| Jieshou | 0.413 | 0.426 | 0.428 | 0.443 | 0.433 | 0.463 | 0.511 | 0.546 | 0.576 | 0.599 |
| Jinzhai | 0.421 | 0.437 | 0.439 | 0.453 | 0.480 | 0.504 | 0.508 | 0.543 | 0.540 | 0.536 |
| Lai’an | 0.494 | 0.506 | 0.517 | 0.528 | 0.605 | 0.601 | 0.620 | 0.644 | 0.623 | 0.668 |
| Lisin | 0.453 | 0.366 | 0.372 | 0.454 | 0.497 | 0.470 | 0.482 | 0.500 | 0.482 | 0.496 |
| Linquan | 0.311 | 0.326 | 0.339 | 0.351 | 0.402 | 0.446 | 0.481 | 0.471 | 0.500 | 0.529 |
| Lingbi | 0.347 | 0.361 | 0.373 | 0.395 | 0.426 | 0.502 | 0.443 | 0.483 | 0.487 | 0.500 |
| Lu’an | 0.462 | 0.480 | 0.555 | 0.579 | 0.553 | 0.574 | 0.571 | 0.568 | 0.564 | 0.577 |
| Mencheng | 0.476 | 0.422 | 0.440 | 0.457 | 0.506 | 0.530 | 0.532 | 0.556 | 0.549 | 0.563 |
| Mingguang | 0.414 | 0.467 | 0.481 | 0.492 | 0.523 | 0.528 | 0.532 | 0.556 | 0.560 | 0.577 |
| Quanjiao | 0.505 | 0.516 | 0.511 | 0.526 | 0.562 | 0.571 | 0.585 | 0.608 | 0.605 | 0.619 |
| Shucheng | 0.435 | 0.432 | 0.434 | 0.453 | 0.447 | 0.481 | 0.483 | 0.522 | 0.510 | 0.521 |
| Si | 0.416 | 0.400 | 0.426 | 0.468 | 0.489 | 0.470 | 0.463 | 0.497 | 0.509 | 0.529 |
| Suzhou | 0.429 | 0.429 | 0.444 | 0.463 | 0.463 | 0.464 | 0.467 | 0.522 | 0.502 | 0.514 |
| Suixi | 0.437 | 0.445 | 0.457 | 0.475 | 0.501 | 0.561 | 0.525 | 0.547 | 0.540 | 0.557 |
| Taihe | 0.373 | 0.385 | 0.385 | 0.394 | 0.417 | 0.448 | 0.490 | 0.506 | 0.533 | 0.542 |
| Tencho | 0.539 | 0.533 | 0.537 | 0.551 | 0.584 | 0.589 | 0.609 | 0.631 | 0.620 | 0.638 |
| Guoyang | 0.452 | 0.390 | 0.395 | 0.414 | 0.511 | 0.497 | 0.503 | 0.525 | 0.526 | 0.533 |
| Wuhe | 0.416 | 0.437 | 0.462 | 0.468 | 0.478 | 0.503 | 0.522 | 0.551 | 0.527 | 0.541 |
| Xiao | 0.391 | 0.398 | 0.383 | 0.415 | 0.420 | 0.451 | 0.437 | 0.478 | 0.485 | 0.496 |
| Yingshang | 0.399 | 0.404 | 0.421 | 0.434 | 0.454 | 0.473 | 0.511 | 0.515 | 0.522 | 0.537 |
| Year | CA | EI | DFPY | EC | UR | BHF | DIU | AAT | AP |
|---|---|---|---|---|---|---|---|---|---|
| 2009 | 0.153 | 0.169 | 0.109 | 0.063 | 0.072 | 0.215 | 0.164 | 0.135 | 0.106 |
| 2013 | 0.149 | 0.007 | 0.116 | 0.199 | 0.045 | 0.041 | 0.142 | 0.060 | 0.210 |
| 2018 | 0.065 | 0.128 | 0.153 | 0.132 | 0.044 | 0.156 | 0.250 | 0.244 | 0.188 |
| Interaction Factor | 2009 | 2013 | 2018 | Interaction Factor | 2009 | 2013 | 2018 |
|---|---|---|---|---|---|---|---|
| CA ∩ EI | TWE | NLE | TWE | DFPY ∩ DIU | TWE | NLE | NLE |
| CA ∩ DFPY | NLE | TWE | NLE | DFPY ∩ AAT | NLE | NLE | NLE |
| CA ∩ EC | NLE | TWE | NLE | DFPY ∩ AP | NLE | NLE | TWE |
| CA ∩ UR | NLE | NLE | NLE | EC ∩ UR | TWE | NLE | NLE |
| CA ∩ BHF | NLE | NLE | NLE | EC ∩ BHF | NLE | TWE | NLE |
| CA ∩ DIU | NLE | TWE | NLE | EC ∩ DIU | NLE | NLE | NLE |
| CA ∩ AAT | NLE | NLE | NLE | EC ∩ AAT | NLE | NLE | NLE |
| CA ∩ AP | NLE | TWE | NLE | EC ∩ AP | NLE | TWE | NLE |
| EI ∩ DFPY | NLE | NLE | NLE | UR ∩ BHF | NLE | NLE | NLE |
| EI ∩ EC | NLE | NLE | NLE | UR ∩ DIU | NLE | NLE | NLE |
| EI ∩ UR | NLE | NLE | NLE | UR ∩ AAT | NLE | NLE | NLE |
| EI ∩ BHF | NLE | NLE | NLE | UR ∩ AP | NLE | NLE | TWE |
| EI ∩ DIU | NLE | NLE | NLE | BHF ∩ DIU | NLE | NLE | NLE |
| EI ∩ AAT | NLE | NLE | NLE | BHF ∩ AAT | NLE | NLE | NLE |
| EI ∩ AP | NLE | NLE | NLE | BHF ∩ AP | NLE | NLE | NLE |
| DFPY ∩ EC | NLE | NLE | NLE | DIU ∩ AAT | NLE | NLE | NLE |
| DFPY ∩ UR | NLE | NLE | NLE | DIU ∩ AP | NLE | NLE | NLE |
| DFPY ∩ BHF | NLE | NLE | NLE | AAT ∩ AP | NLE | NLE | NLE |
Disclaimer/Publisher’s Note: The statements, opinions and data contained in all publications are solely those of the individual author(s) and contributor(s) and not of MDPI and/or the editor(s). MDPI and/or the editor(s) disclaim responsibility for any injury to people or property resulting from any ideas, methods, instructions or products referred to in the content. |
© 2023 by the authors. Licensee MDPI, Basel, Switzerland. This article is an open access article distributed under the terms and conditions of the Creative Commons Attribution (CC BY) license (https://creativecommons.org/licenses/by/4.0/).
Share and Cite
Li, X.; Jiang, J.; Cifuentes-Faura, J. Coordinated Development and Sustainability of the Agriculture, Climate and Society System in China: Based on the PLE Analysis Framework. Land 2023, 12, 617. https://doi.org/10.3390/land12030617
Li X, Jiang J, Cifuentes-Faura J. Coordinated Development and Sustainability of the Agriculture, Climate and Society System in China: Based on the PLE Analysis Framework. Land. 2023; 12(3):617. https://doi.org/10.3390/land12030617
Chicago/Turabian StyleLi, Xuelan, Jiyu Jiang, and Javier Cifuentes-Faura. 2023. "Coordinated Development and Sustainability of the Agriculture, Climate and Society System in China: Based on the PLE Analysis Framework" Land 12, no. 3: 617. https://doi.org/10.3390/land12030617