1. Introduction
Water is an essential resource for human survival and an important condition for the sustainable development of regional economies and ecosystems [
1]. With the acceleration of human production and urbanization, the demand for water resources is also increasing rapidly. At the same time, the environmental pollution of water and water shortages that are caused by human activities are becoming more and more serious [
2]. The magnitude of global desalination water production, which is the total water produced by desalination technology globally, provides critical information on the research and application of global desalination technology and its contribution to mitigating the water shortage issue [
3]. Therefore, the study of the spatial and temporal distribution and change in water yield and water purification services is particularly important for the rational development and utilization of regional water resources. As the most important function of ecosystem services: water yield and water purification services play a key role in improving the hydrological conditions of watersheds and regulating the water cycle [
4]. Water yield is the process and capacity of an ecosystem to store and hold water in a given time and space [
5]. Non-rainy season drainage and recharge of the ecological base flow in a watershed ensure water for human life and social development [
6]. Water purification services refer to the ability of an ecosystem to absorb, transform, and redistribute pollutants in a water body through its own natural ecological processes and material cycles [
7]. Therefore, the visualization and quantitative assessment of the spatial and temporal variation of water yield and water purification services in a watershed and their influencing factors have become a trend and a popular topic in the fields of ecology and hydrology [
8]. This topic has an important application value and a guiding significance for the optimal allocation of water resources and the sustainable development of ecosystems in watersheds.
Due to the limitations of traditional methods in the number of monitoring stations and conditions of observation equipment, the large spatial scale estimation produces large significant errors [
9]. Commonly used water quality evaluation methods can only evaluate the water quality of the river wetlands and other water quality conditions; it is not possible to estimate the water purification services of the ecosystem [
10]. With the development and application of remote sensing and GIS technology, more models in the fields of ecology and hydrology can realize the simulation and evaluation of water yield and water purification services in a watershed. The main ones are the TOPMODEL model [
11], the Xin’anjiang model [
12], the SWAT model [
13], the MIMES model [
14], the SolVES model [
15,
16], the ARIES model [
17], and the InVEST model [
18]. Among them, the InVEST model has significant advantages in terms of low data requirements, easy access to a few parameters, quantification of spatial data, a scenario simulation function, and the visualization of results. The InVEST water yield module is based on the water balance principle. Water yield is calculated from precipitation, surface evaporation, plant transpiration, soil depth, and other parameters [
19]. The water quality purification module uses nitrogen (N) and phosphorus (P) content to characterize the water quality status. The water quality purification function is achieved by reducing and removing N and P content through the storage and conversion of plants and soil [
20]. In recent years, the InVEST model has become more widely applied in China and abroad. Mulatu et al. discussed the possibility of the Naivasha Lake basin development and water ecosystem service plan in Kenya [
21]. Schmalz et al. assessed water ecosystem services in three lowland river basins in western Siberia [
22]. Sun Xiaoyin et al. simulated the water yield of the South Four Lakes’ watershed for nearly 25a based on the InVEST model. Additionally, ArcGIS was used to analyze the spatial distribution pattern of water yield and trend change. The relationship between natural geographic factors such as precipitation and topography; socio-economic factors such as population, land use, and gross domestic product (GDP); and the dynamic changes in the spatial pattern of water yield were explored [
23]. Mei et al. analyzed the spatial and temporal variation of water purification in the Guan Hall reservoir watershed using the InVEST model; their study showed that water quality purification services in the watershed showed an increasing trend [
24].
These studies provide a valuable reference for regional water resource management and ecological planning. We found that, in addition to considering the effects of land type conversion on changes in water ecosystem services, the factors influencing water-related ecosystem service functions in arid and semi-arid regions would help to more systematically and comprehensively assess the effects of land-use change on changes in regional water ecosystem services. The InVEST model enables effective assessment of the status of ecosystem services, and spatial the InVEST model can provide a valid assessment of ecosystem services and spatial analysis, providing valid and critical information for management decisions. However, detailed assessments of aquatic ecosystem services using this model are currently rare in arid regions.
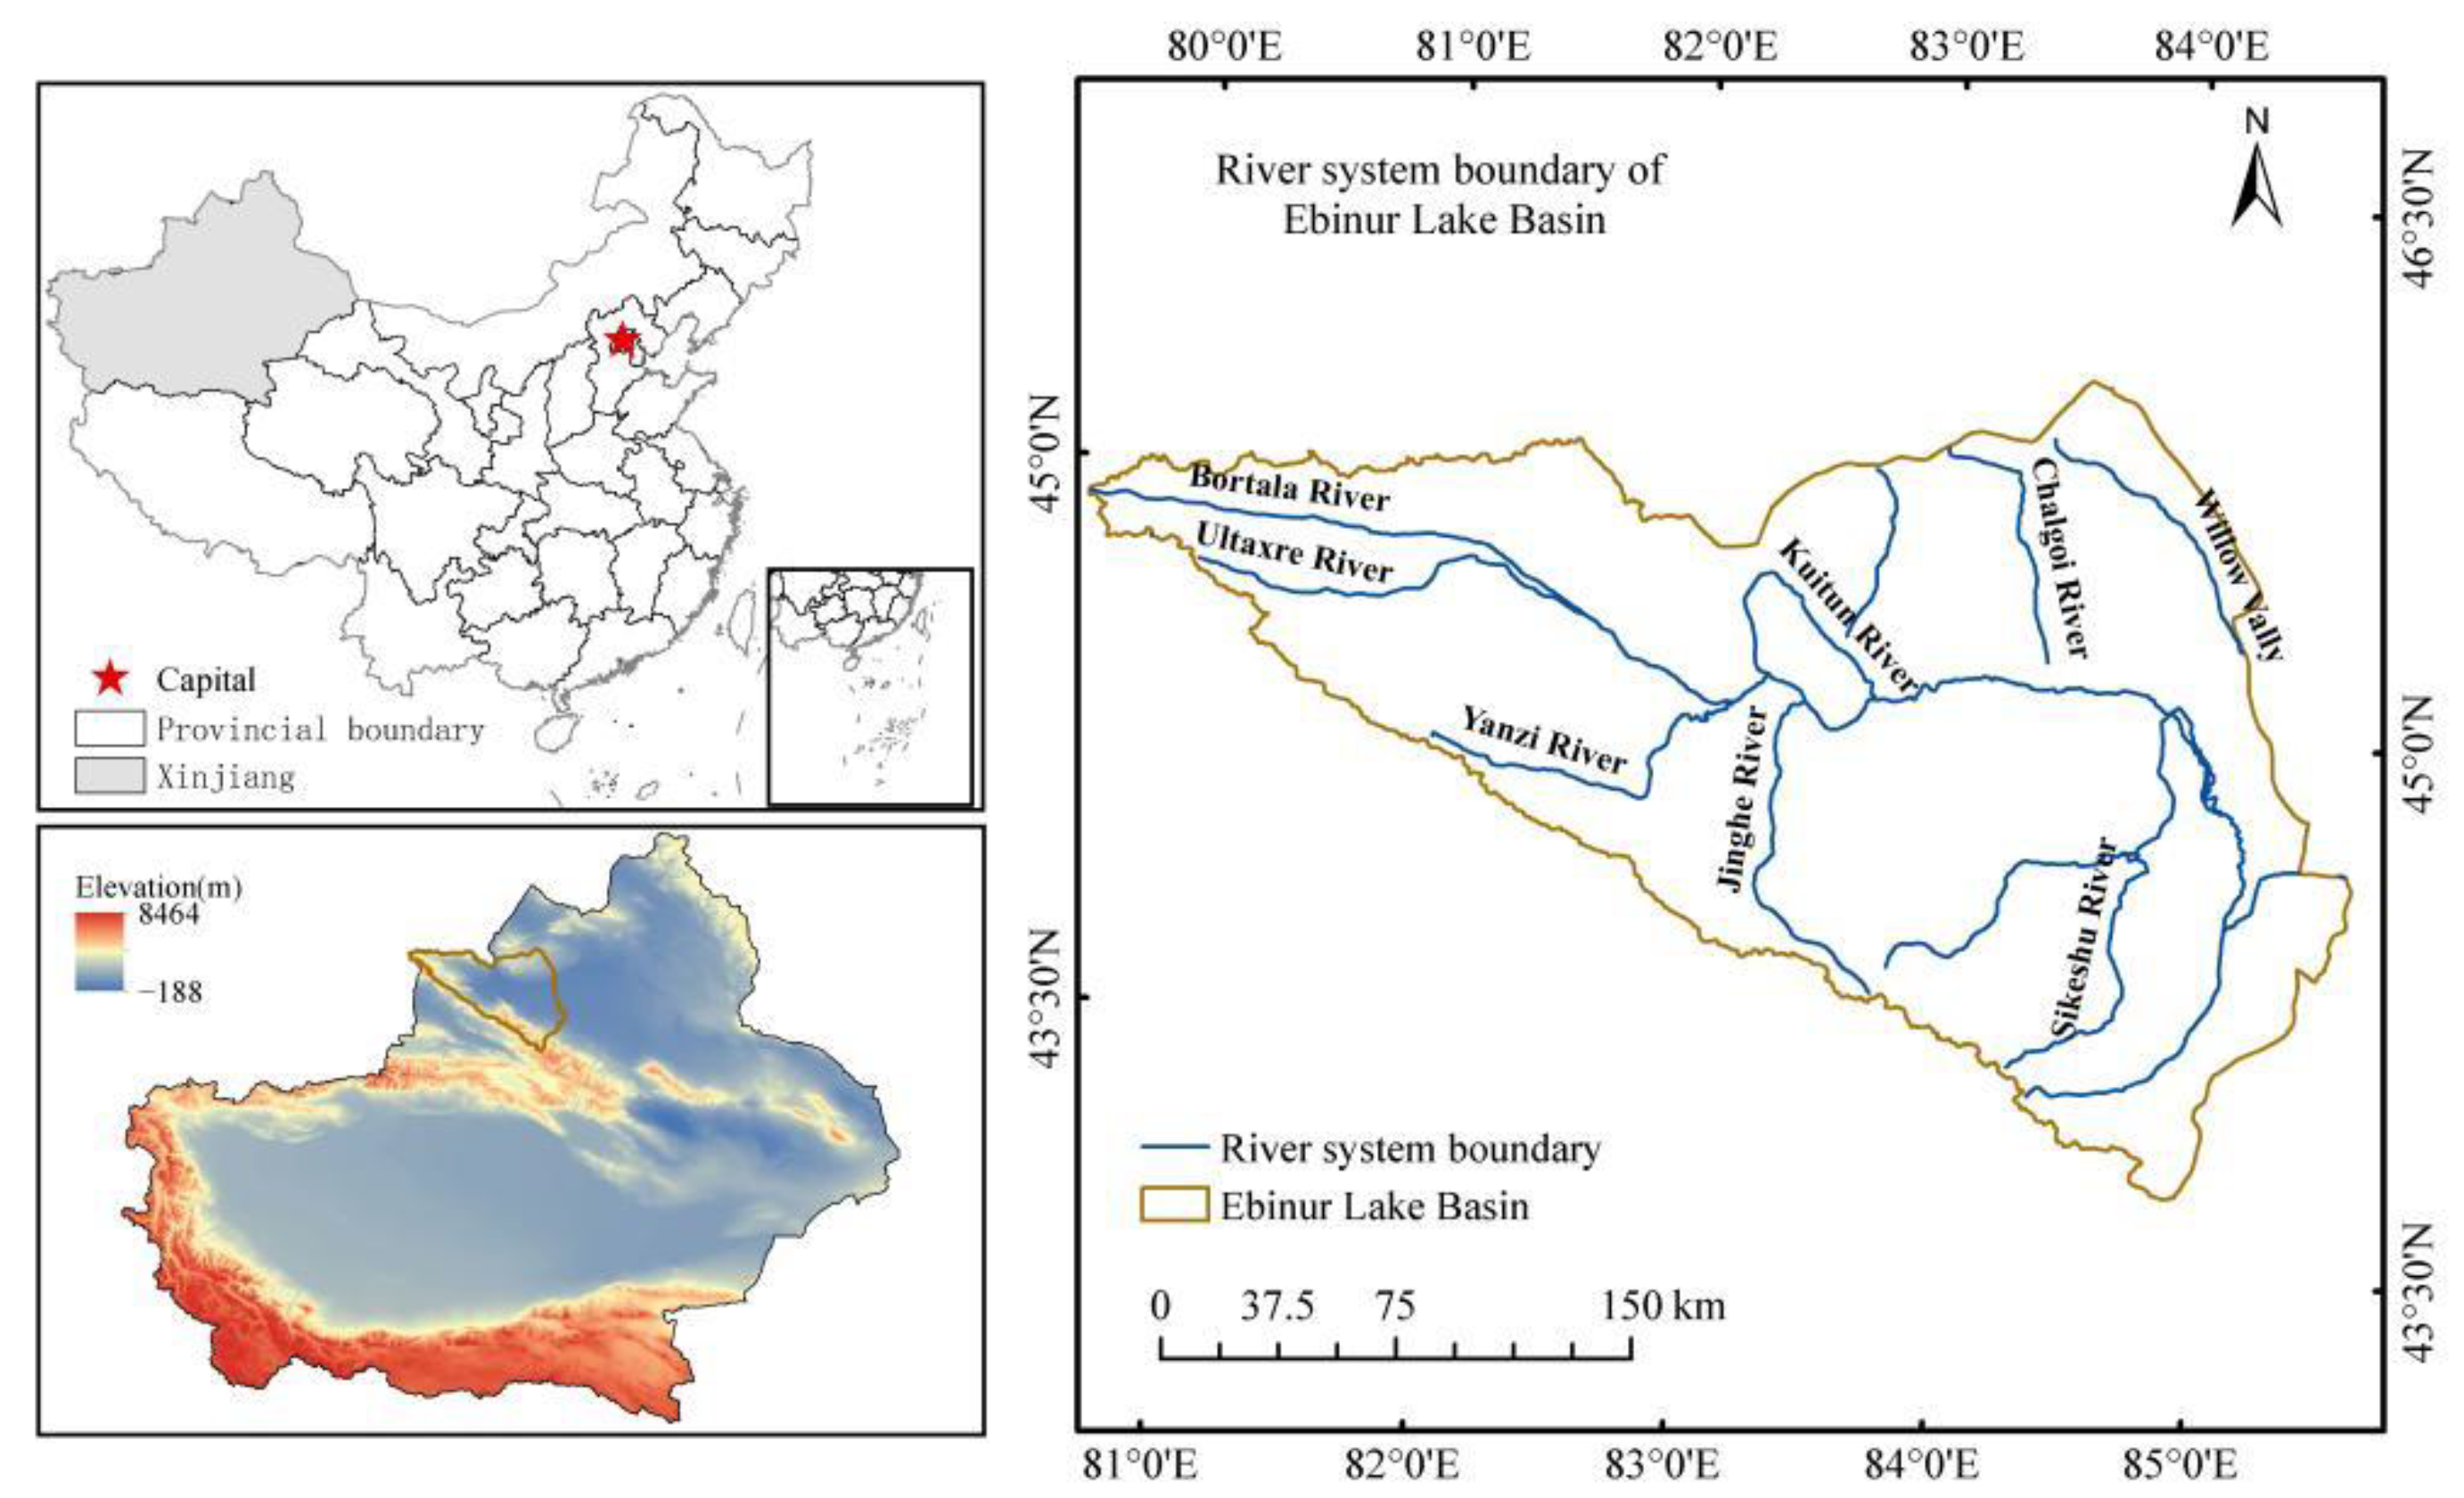
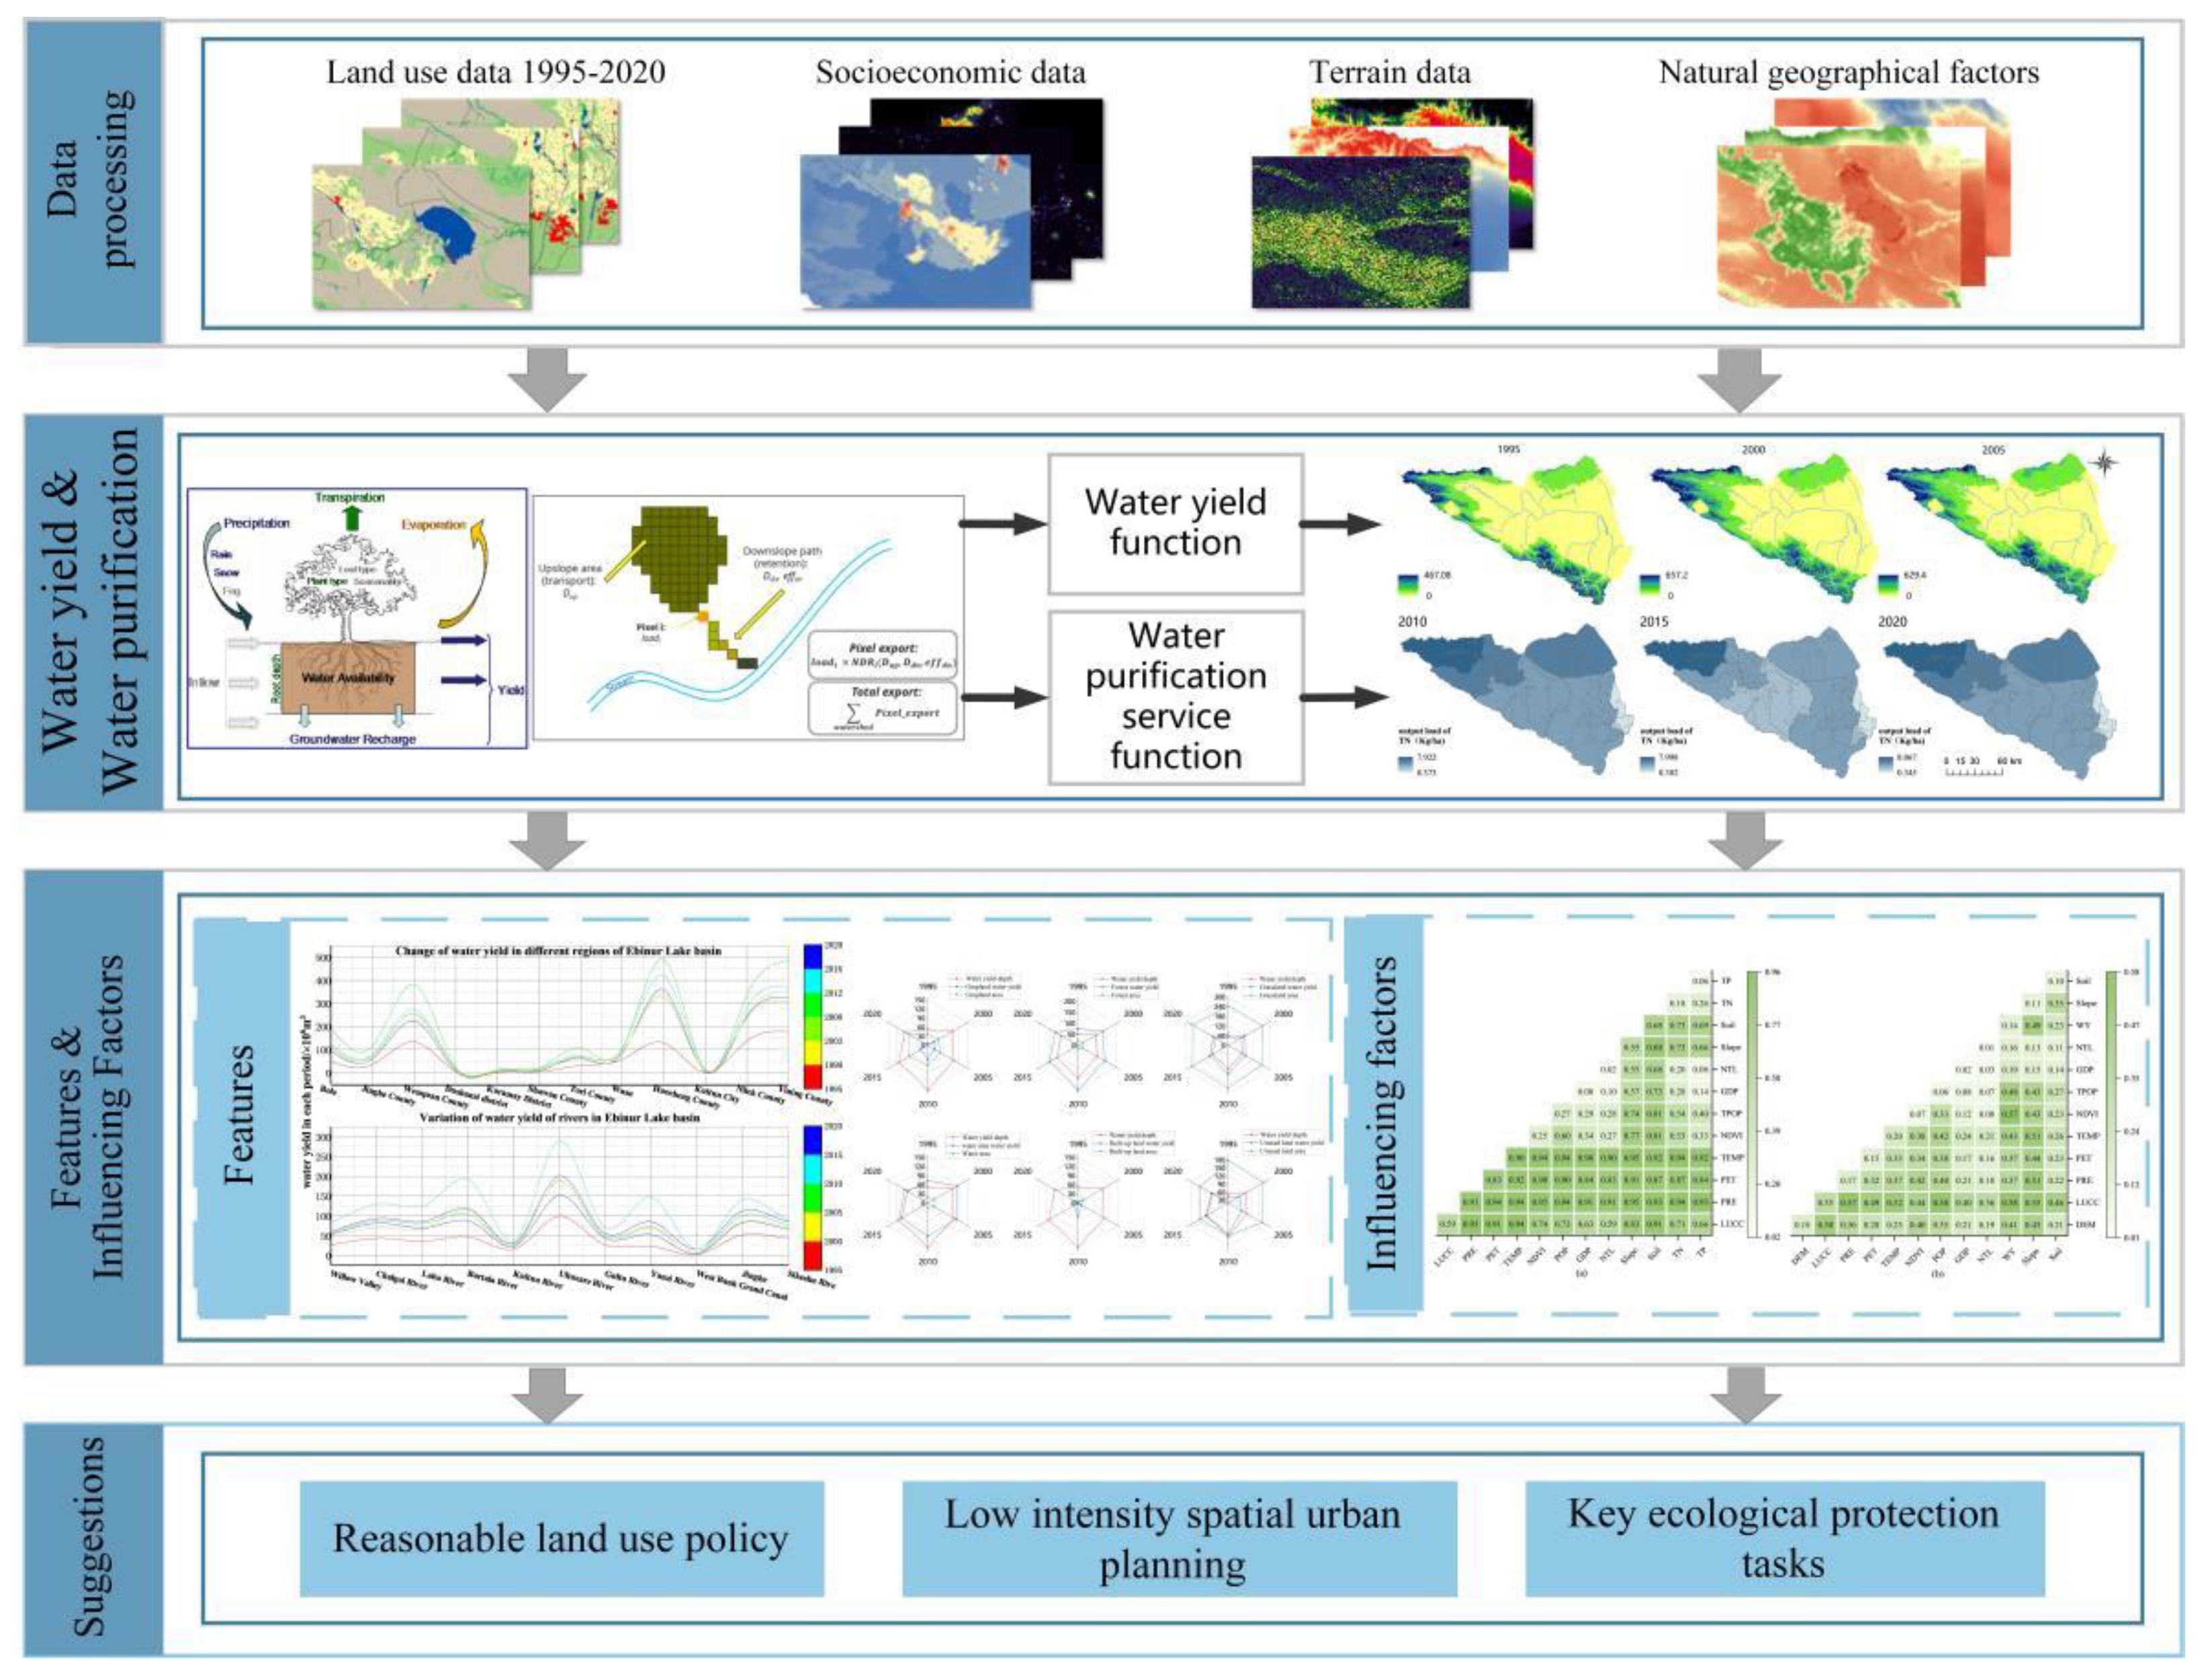
River runoff from the Ebinur Lake Basin is the main source of irrigation in the northwestern region of Xinjiang and the main water resource for maintaining the ecological balance of the entire Bortala Mongol Autonomous Prefecture, hence occupying an important social and ecological location. The region’s main inlet rivers, the Jing River and the Bortala River, pass through areas such as Hot Spring County, Bole City, and Jinghe County. Water shortages and pollution are prominent in this ecosystem due to the influence of local land use and climate change. Based on the InVEST model and geographic probes, this study proposes a feasible and replicable framework for land-use decision-making in ecologically fragile areas. This framework not only contributes to an in-depth understanding of urban growth patterns in the study area but also helps to inform different land-use stakeholders. The overall objective of this study is to assess the spatial and temporal patterns and evolutionary characteristics of water production and water purification services in the Lake Ebinur basin and to analyze their relationship to land-use change. The use of a geodetector model to explore the dominant drivers of changes to ecosystem water production and water purification is scientifically important for promoting ecosystem management and conservation in the northwest arid zone of China, alleviating increasingly serious water resource problems, and achieving sustainable development.
3. Results and Analysis
3.1. Spatial and Temporal Changes of Land Use in the Ebinur Lake Basin
The land-use structure of the Ebinur Lake Basin from 1995 to 2020 is dominated by grassland, unused land, and cropland (
Figure 4). The annual average area proportions are 49.97%, 30.89%, and 11.06%, respectively. Next, the land-use structure is followed by water area and forest land, which account for 3.49% and 3.77%, respectively. The built-up land only accounted for 0.77%. In terms of dynamic attitude and rate of change, the built-up land area increased the most. It increased from 159.84 km
2 to 612.08 km
2, an increase of about 282.93%, whereas the dynamic attitude increased by 11.32%. The next largest change was in cropland, with a rate of change of 96.29%. The dynamic attitude is 3.85%. Grassland has the smallest increase, from 24,538.88 km
2 to 25,765.82 km
2. The area of forest land, unused land, and water area is decreasing. Among them, forest land decreased the most, reaching −48.28%. The area of unused land decreased from 2185.67 km
2 to 1130.49km
2, a decrease of −21.03%. The rate of change in water area is −15.8% (
Table 3).
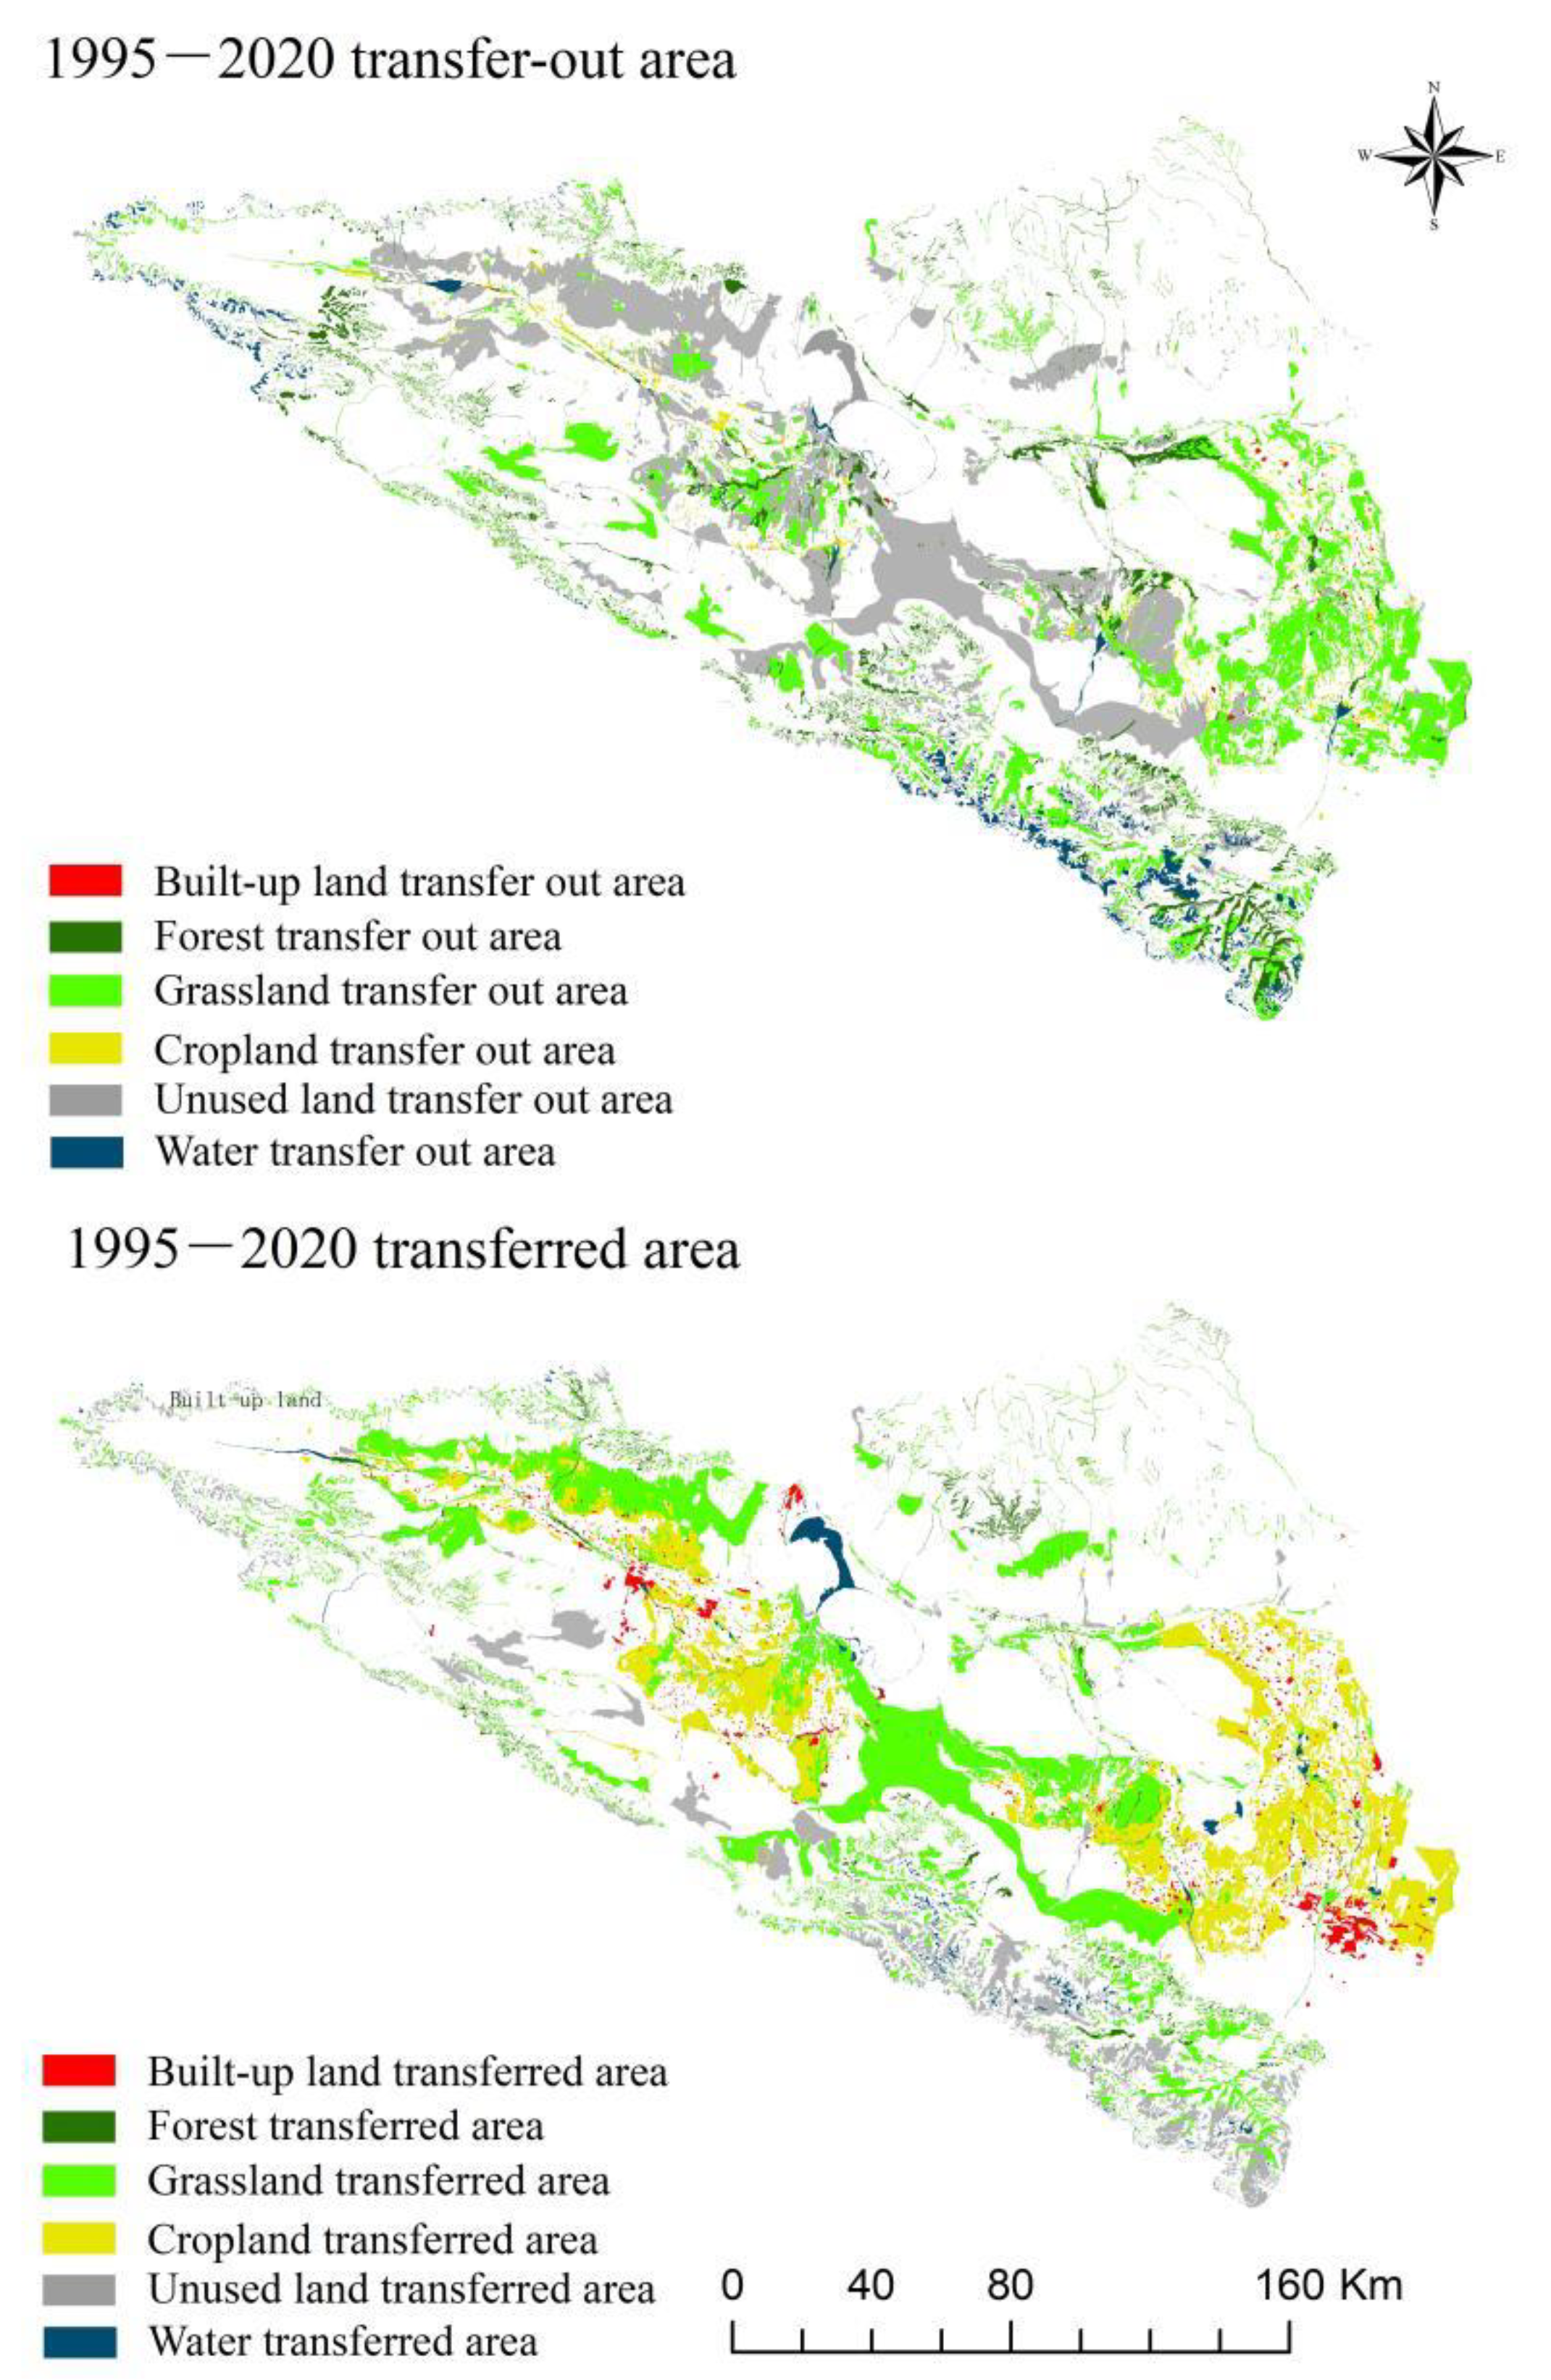
The largest transferred-in and transferred-out areas were grassland and unused land, followed by cropland (
Figure 4). Among them, the transferred area of grassland reached 25,763.4 km
2. The main sources of transfer were unused land and forest land. The percentages of transferred-in area were 17.38% and 4.38%, respectively. The transferred-out area of grassland was 24,535.42 km
2. The main transfer-out area was cropland with 2502.68 km
2. The transfer-out area of unused land reaches 17,720.36 km
2. The main transfer-out area was grassland, with a percentage of 25.26%. This area was followed by cropland with 6.8%, which indicates that a larger development and utilization of unused land was carried out. The area transferred from cropland reached 7249.59 km
2. The main source of transfer was grassland, followed by unused land. There was a mutual transfer between unused land, grassland, and cropland (
Table 4). The largest transferred-out area of the water area was unused land.
In terms of an overall perspective, during 1995–2020, the land-use types in the study area were characterized by “two increases, two decreases and two stabilizations.” The “two increases” refer to the increasing trend of the area of arable land and construction land during the study period; the “two decreases” refer to the decreasing trend of the area of forest land and unused land during the study period; the “two stabilizations” refer to the area of the watershed and grassland that remained mostly stable during the study period. Spatially, the change was greater in the south-east, as arable land in the east is expanded towards the south of the study area. This area is mainly located in the plain cultivation zone, where human activities are relatively frequent, and alongside urban and rural settlement areas, bare land, and low-coverage grassland, so the land-use changes in this area are more evident.
The rows in the table represent i land-use types in 1995, and the columns represent j land-use types in 2020; A represents the area where the land-use type in 1995 was transformed into the land-use type in 2020, i.e., the original transfer matrix T; B (%) represents i land-use types as a percentage of area transferred out in 1995; C (%) represents j land-use types as a percentage of transferred area in 2020.
3.2. Analysis of Water Yield Change in the Ebinur Lake Basin and the Impact of Land-Use Change on Water Yield
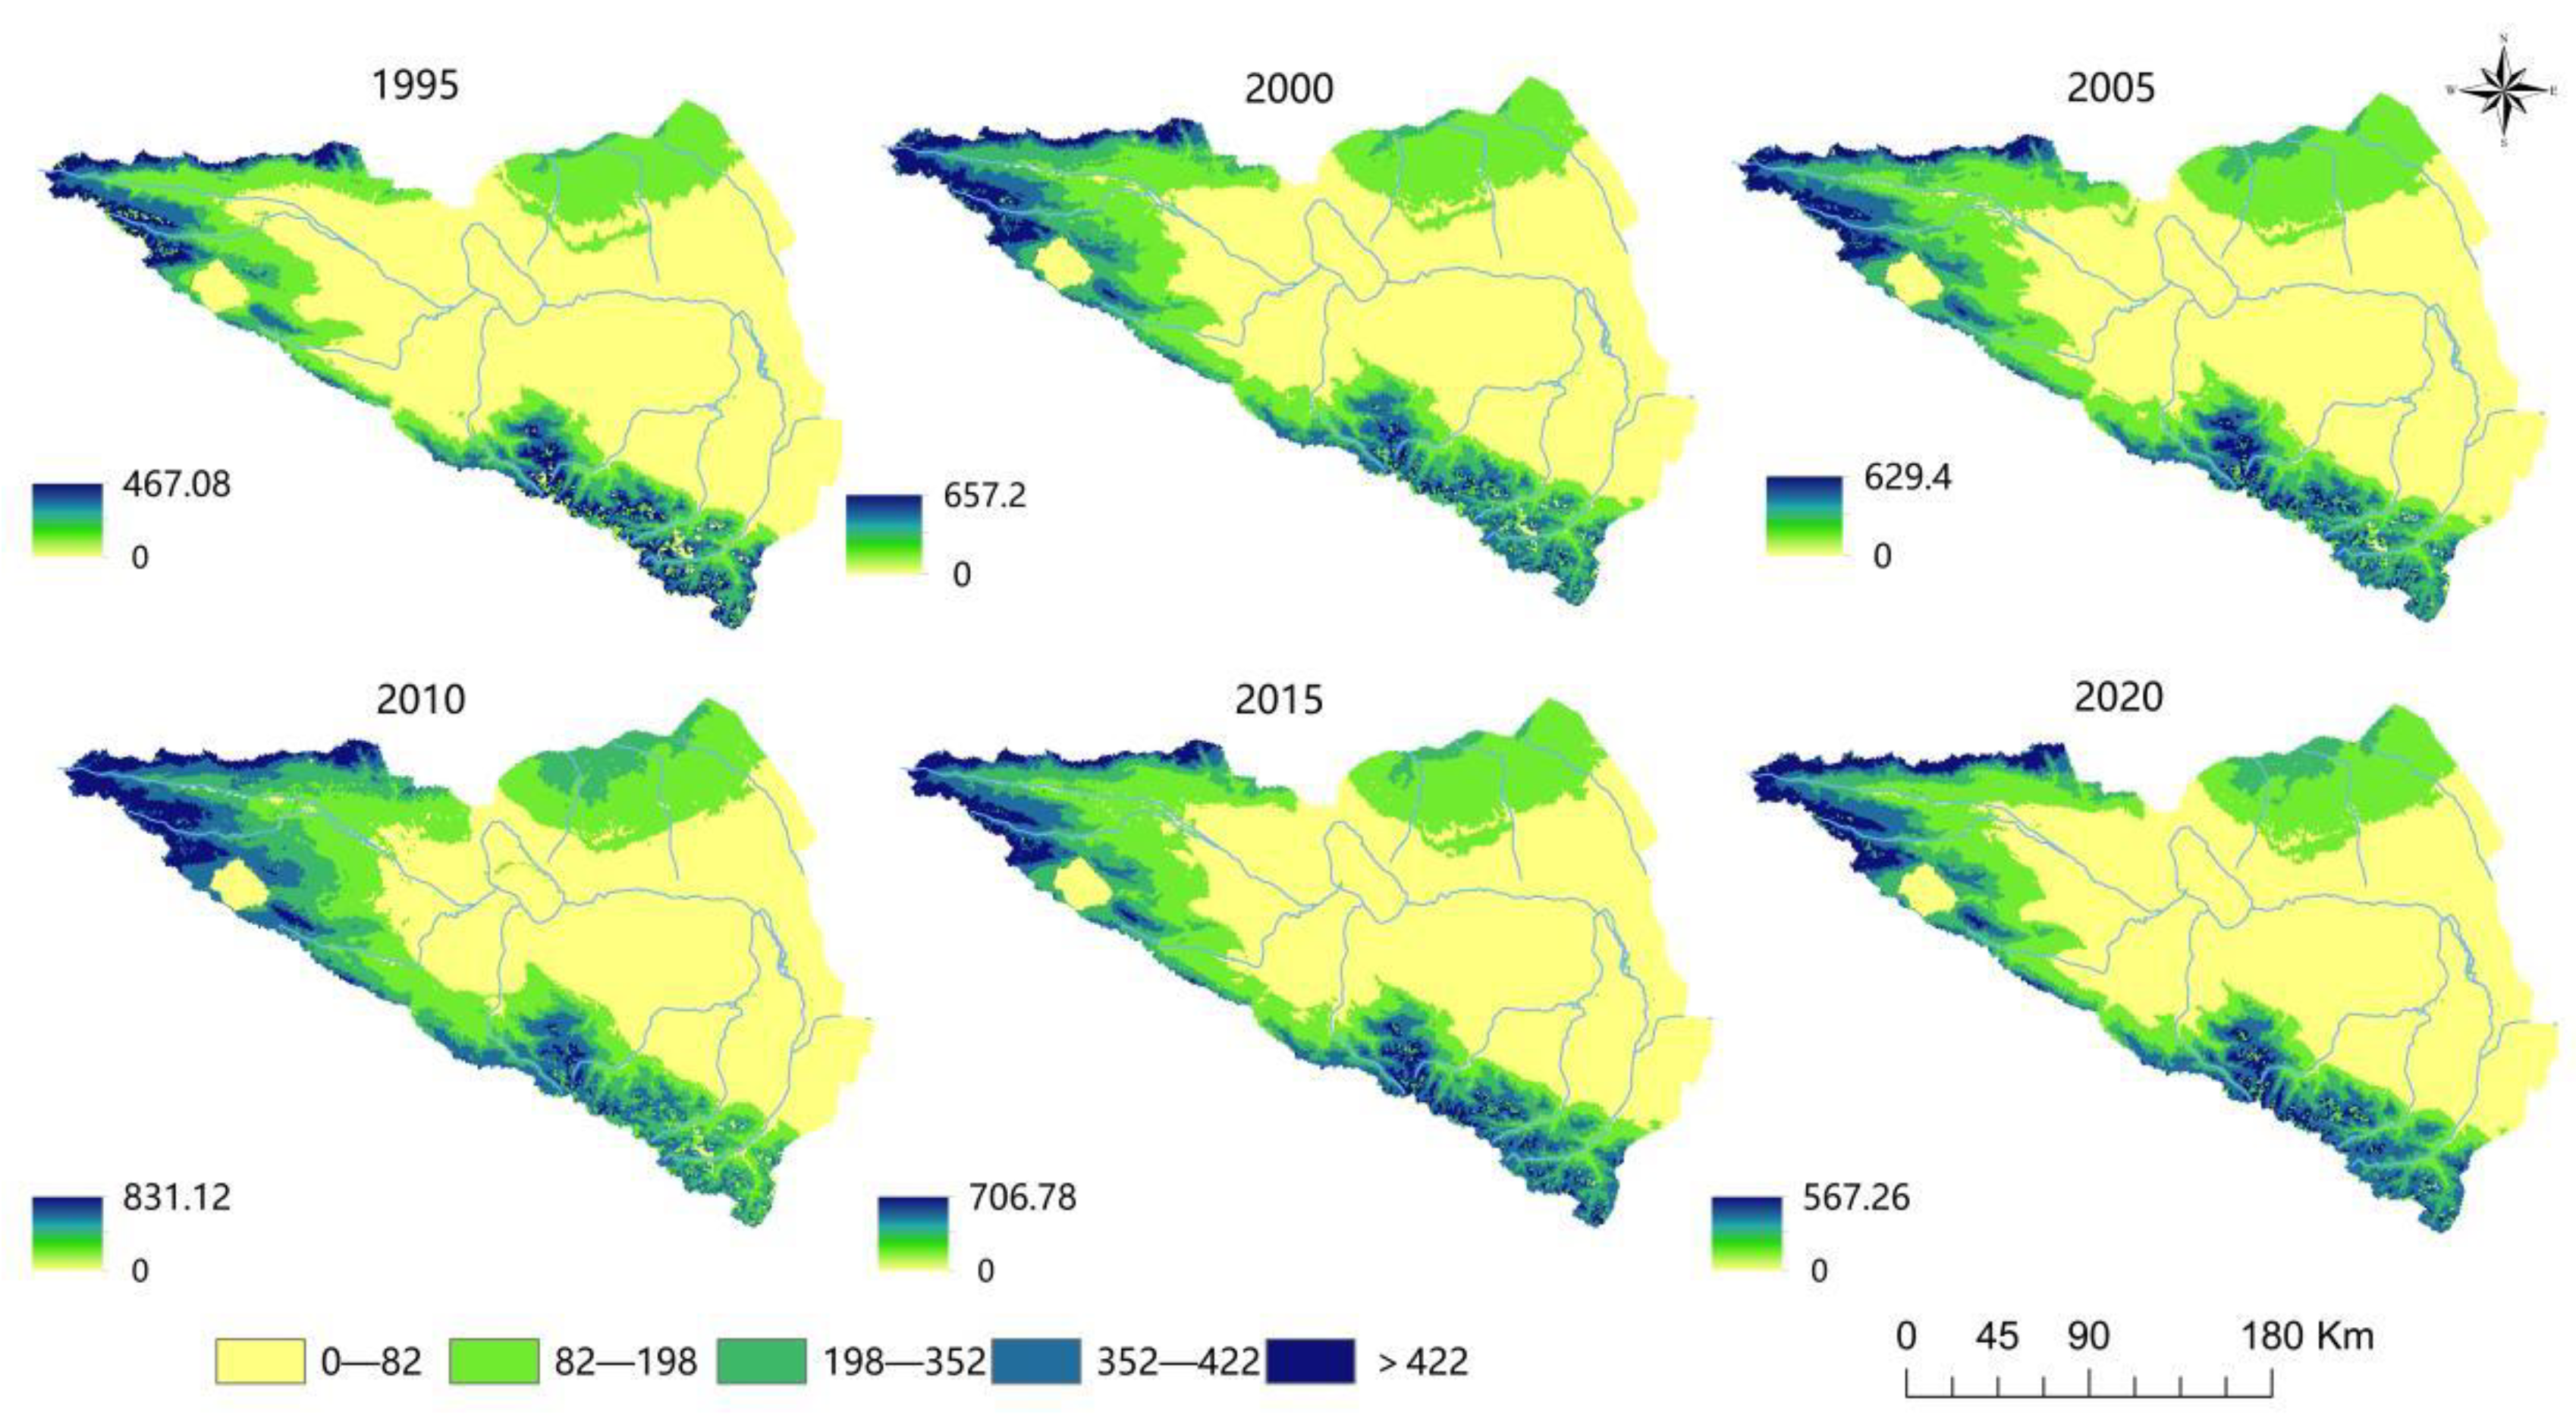
From the spatial distribution (
Figure 5), water yield in the Ebinur Lake basin from 1995 to 2020 shows a clear high in the northwest and some parts of the southeast. The central and eastern areas are low. Low-grade areas are distributed in clusters, while other graded areas are distributed in bands. The high-gradewater yield areas are mainly concentrated in the upper reaches of the Ultaqsaray, Bortala, and Jinghe rivers, while the low-gradewater yield areas are mainly concentrated in the Kuitun and Gurtu rivers. The highest value in terms of time change occurred in 2010, and the lowest value was in 1995. The total water yield in the Ebinur Lake Basin are ranked as follows: 2010 (831.12 × 10
6m
3) > 2015 (706.78 × 10
6m
3) > 2000 (657.2 × 10
6m
3) > 2005 (629.4 × 10
6m
3) > 2020 (567.26 × 10
6m
3) > 1995 (467.08 × 10
6m
3). Where from 1995 to 2010, water yield increased by 364.04 × 10
6m
3, but from 2010 to 2020, water yield decreased by 263.86 × 10
6m
3, at an annual variation rate of 3.17%. From 1995 to 2020, water yield showed a trend of increase followed by a decrease.
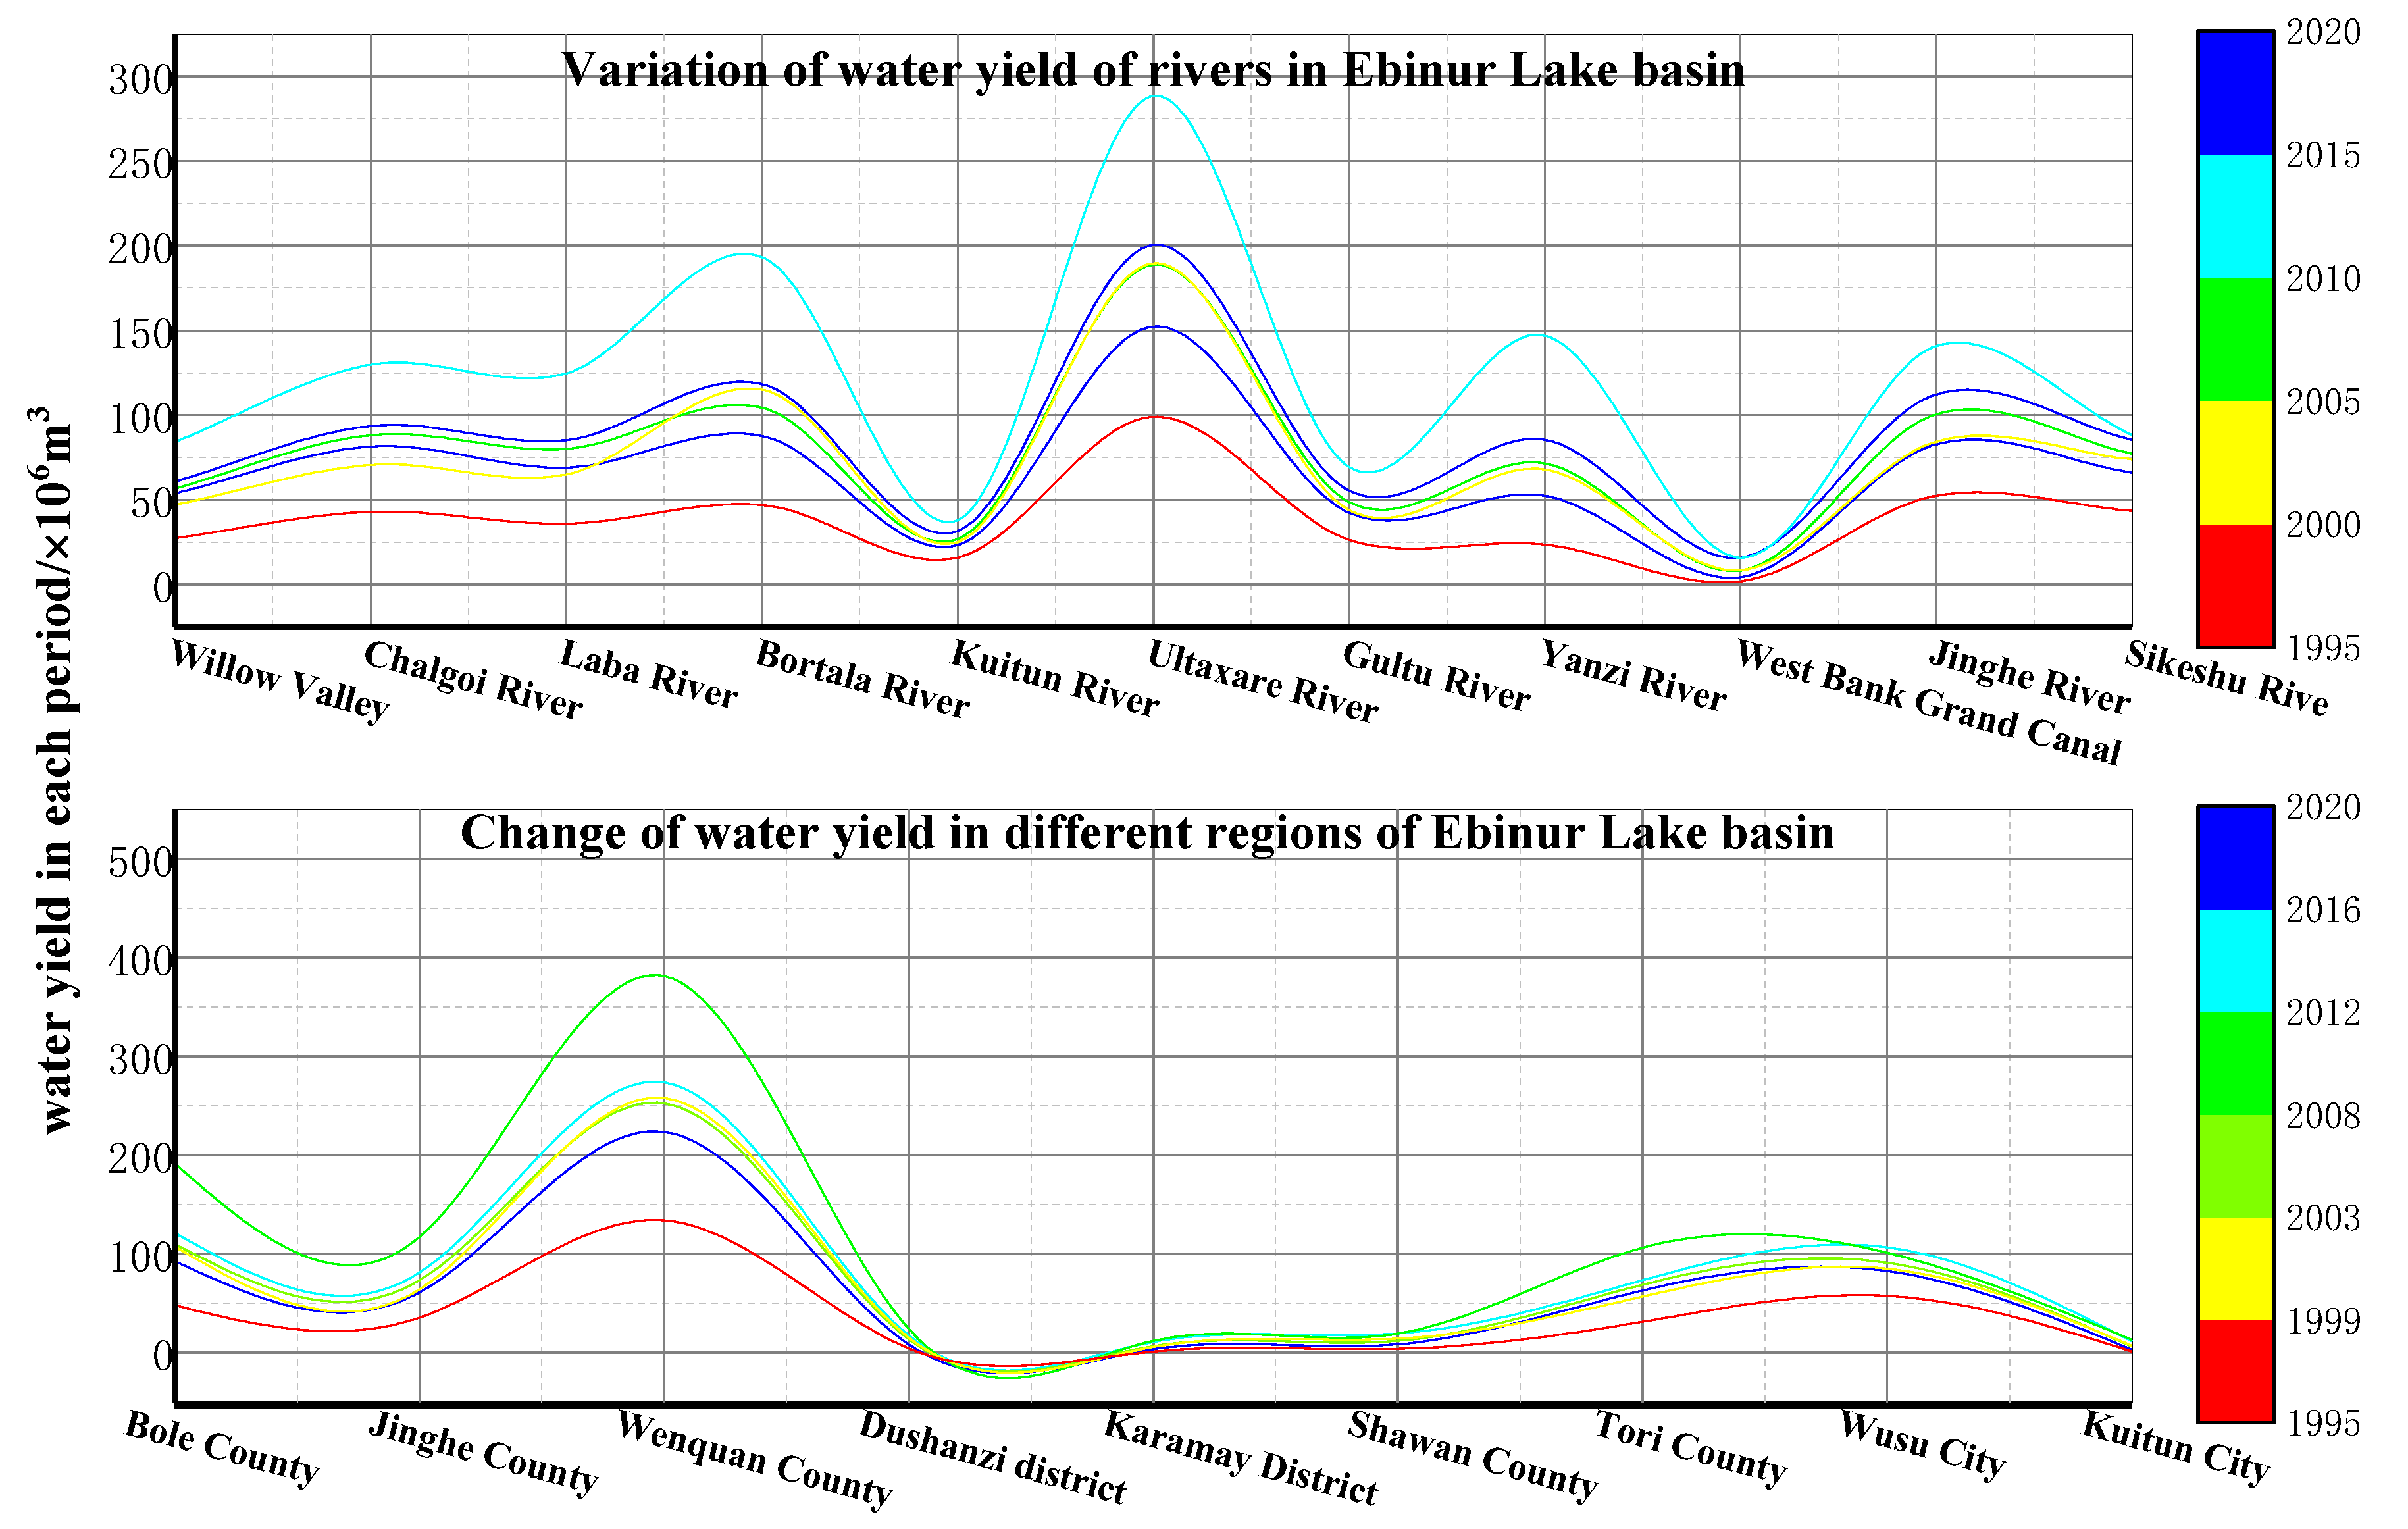
The average water yield of the administrative regions, in descending order, is as follows: Wenquan County > Bole City > Wusu City > Tori County > Jinghe County > Shawan County > Dushanzi District > Karamay District > Kuitun City > Alashankou City. Water yield service function is higher in the northwest and southeast parts of the Ebinur Lake Basin. The central part of the watershed has a lower water yield service capacity, including Alashankou City, Kuitun City, and Karamay District. The total water yield in the Lake Ebinur Basin and water yield service in each region show some consistency in space between different years (
Figure 6). In terms of the changes in average water yield of each sub-basin, the average water yield of the Ultaxare River, Boltara River, Jinghe River, and Dahe River along the river system is higher. The highest water yield value is 288.3 × 10
6m
3. Water yield value is lower in the West Bank Canal, Kuitun River and Gurtu River, and the lowest water yield is up to 1.8 × 10
6m
3. The average water yield of the remaining sub-basins is 27.2 × 10
6m
3. The spatial variability between different sub-basins is more obvious. Additionally, the Ultaxare, Bortala, and Jinghe rivers are the main contributing rivers to the average water yield.
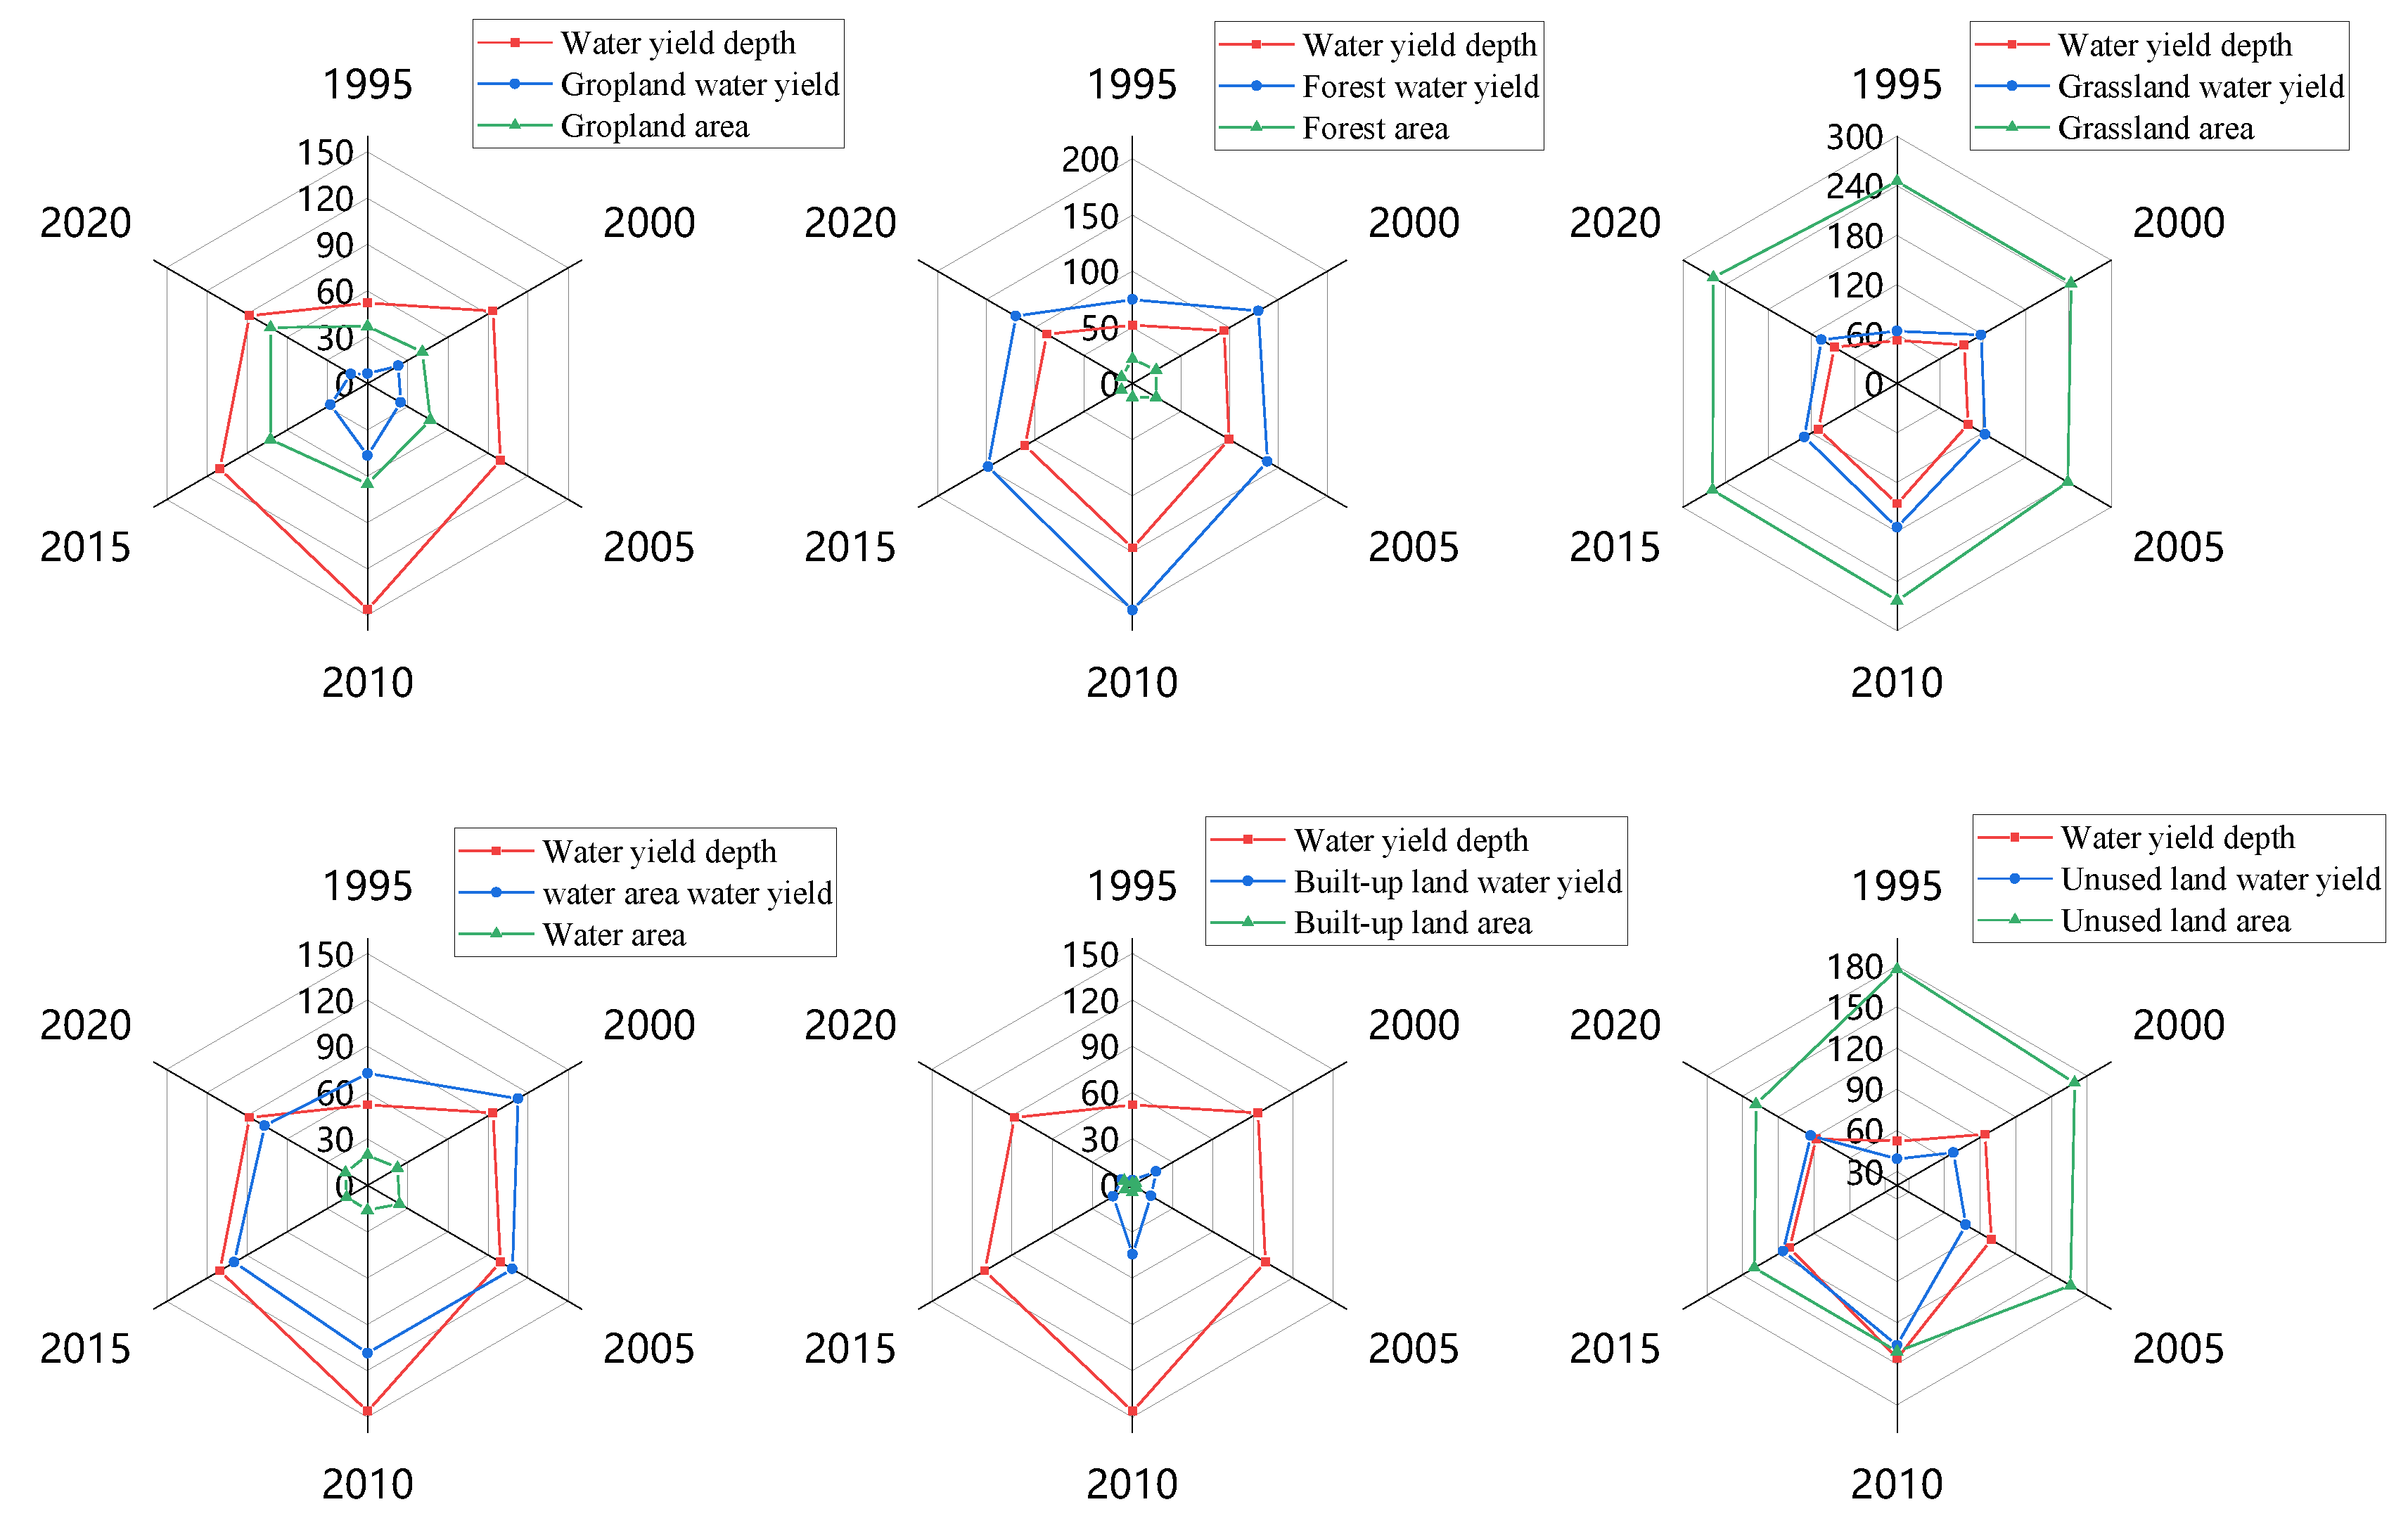
The area of land-use types and the relationship between the change in water yield and the average depth of water yield in the basin are shown in
Figure 7. The values of different land-use types contributing to water yield in the basin, in descending order, are as follows: forest land > grassland > water area > unused land > cropland > built-up land. The area of built-up land and cropland in the Ebinur Lake Basin increases year by year. The area of unused land decreases yearly. The forest land, grassland, and water area have more fluctuations. Additionally, forest land and grassland contribute more to the average water yield and are the main contributing land types. From 1995 to 2010, the major trend in the water yield of cropland, built-up land, and average water yield depth were all increasing and positively correlated. 2010–2020 is a negative correlation. The area of grassland and forest land accounts for 50.23% of the total area of the region, which makes the average multi-year water yield of forest land and grassland higher. The average annual water yield of forest land and grassland is 135.39 × 10
6m
3 and 119.31 × 10
6m
3, respectively. This finding is followed by cropland and unused land, 96.37 × 10
6 m
3 and 88.22 × 10
6 m
3, respectively. Forest land, grassland, and unused land types were negatively correlated with water yield from 1995 to 2010, and the trend was consistent and positive from 2010 to 2020. The trends in water types were consistent and positively correlated only in 1995–2005. The other periods showed the opposite variation. There is a large difference in the relationship between average water yield and type-area change on each land-use type. On the one hand, this difference in the relationship between average water yield and type-area change is due to land-use cover and land-use change. On the other hand, it is closely related to the influence of climate change and human activities on water yield.
3.3. Evaluation of Water Purification Service Function and Distribution of Nitrogen and Phosphorus in Different Land-Use Types in the Ebinur Lake Basin
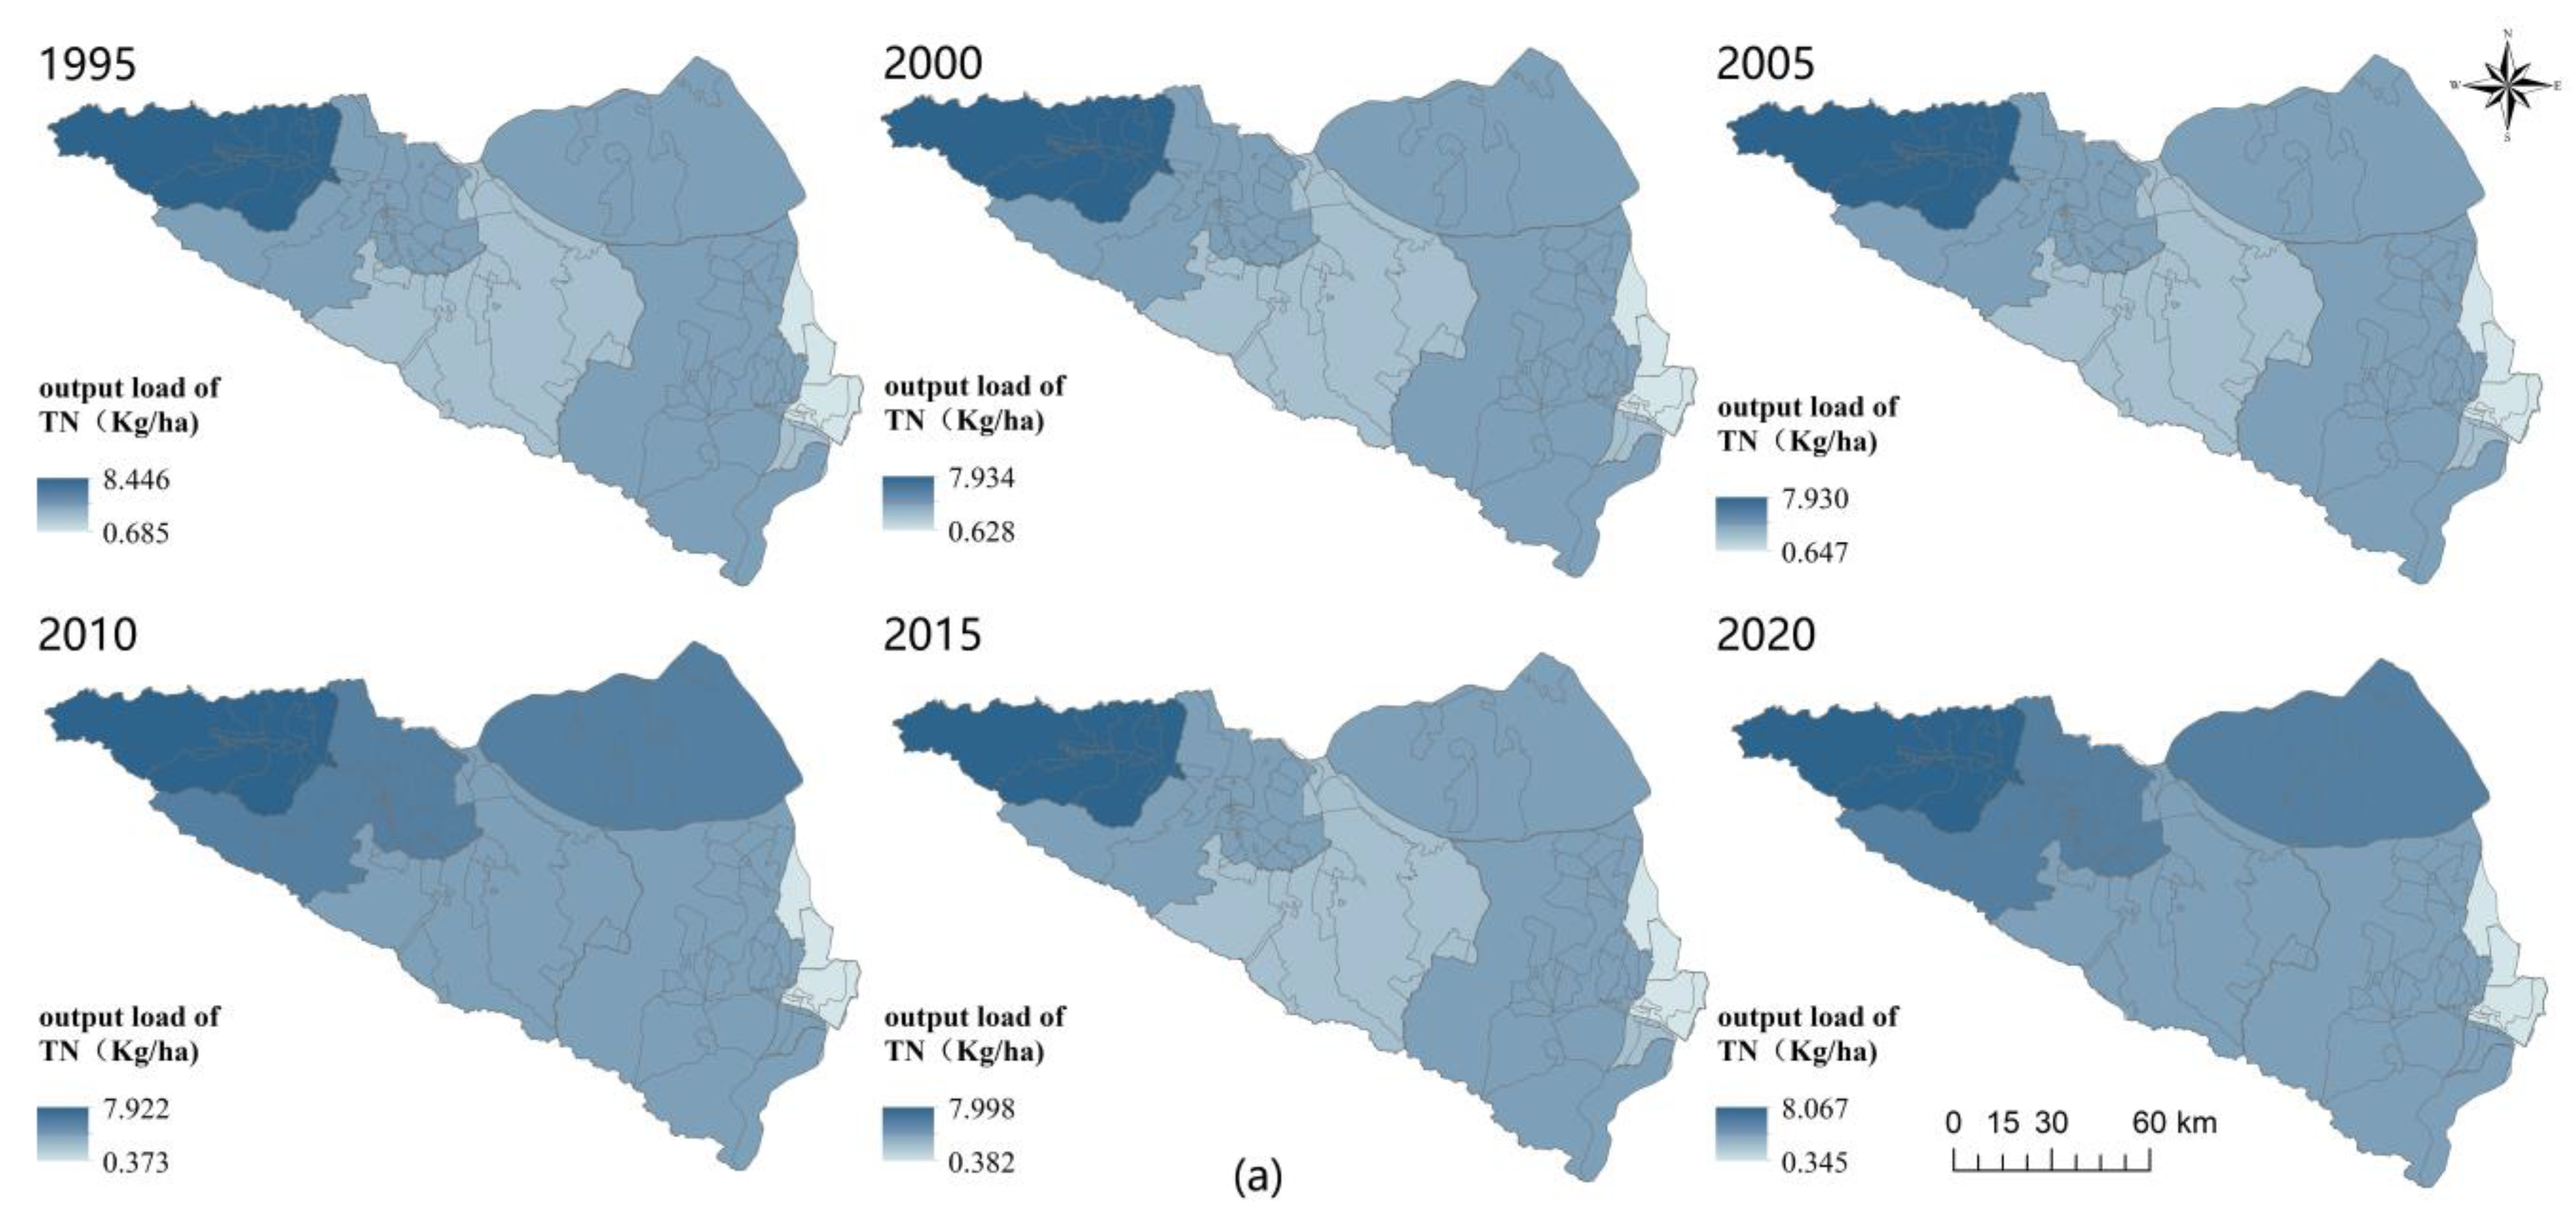
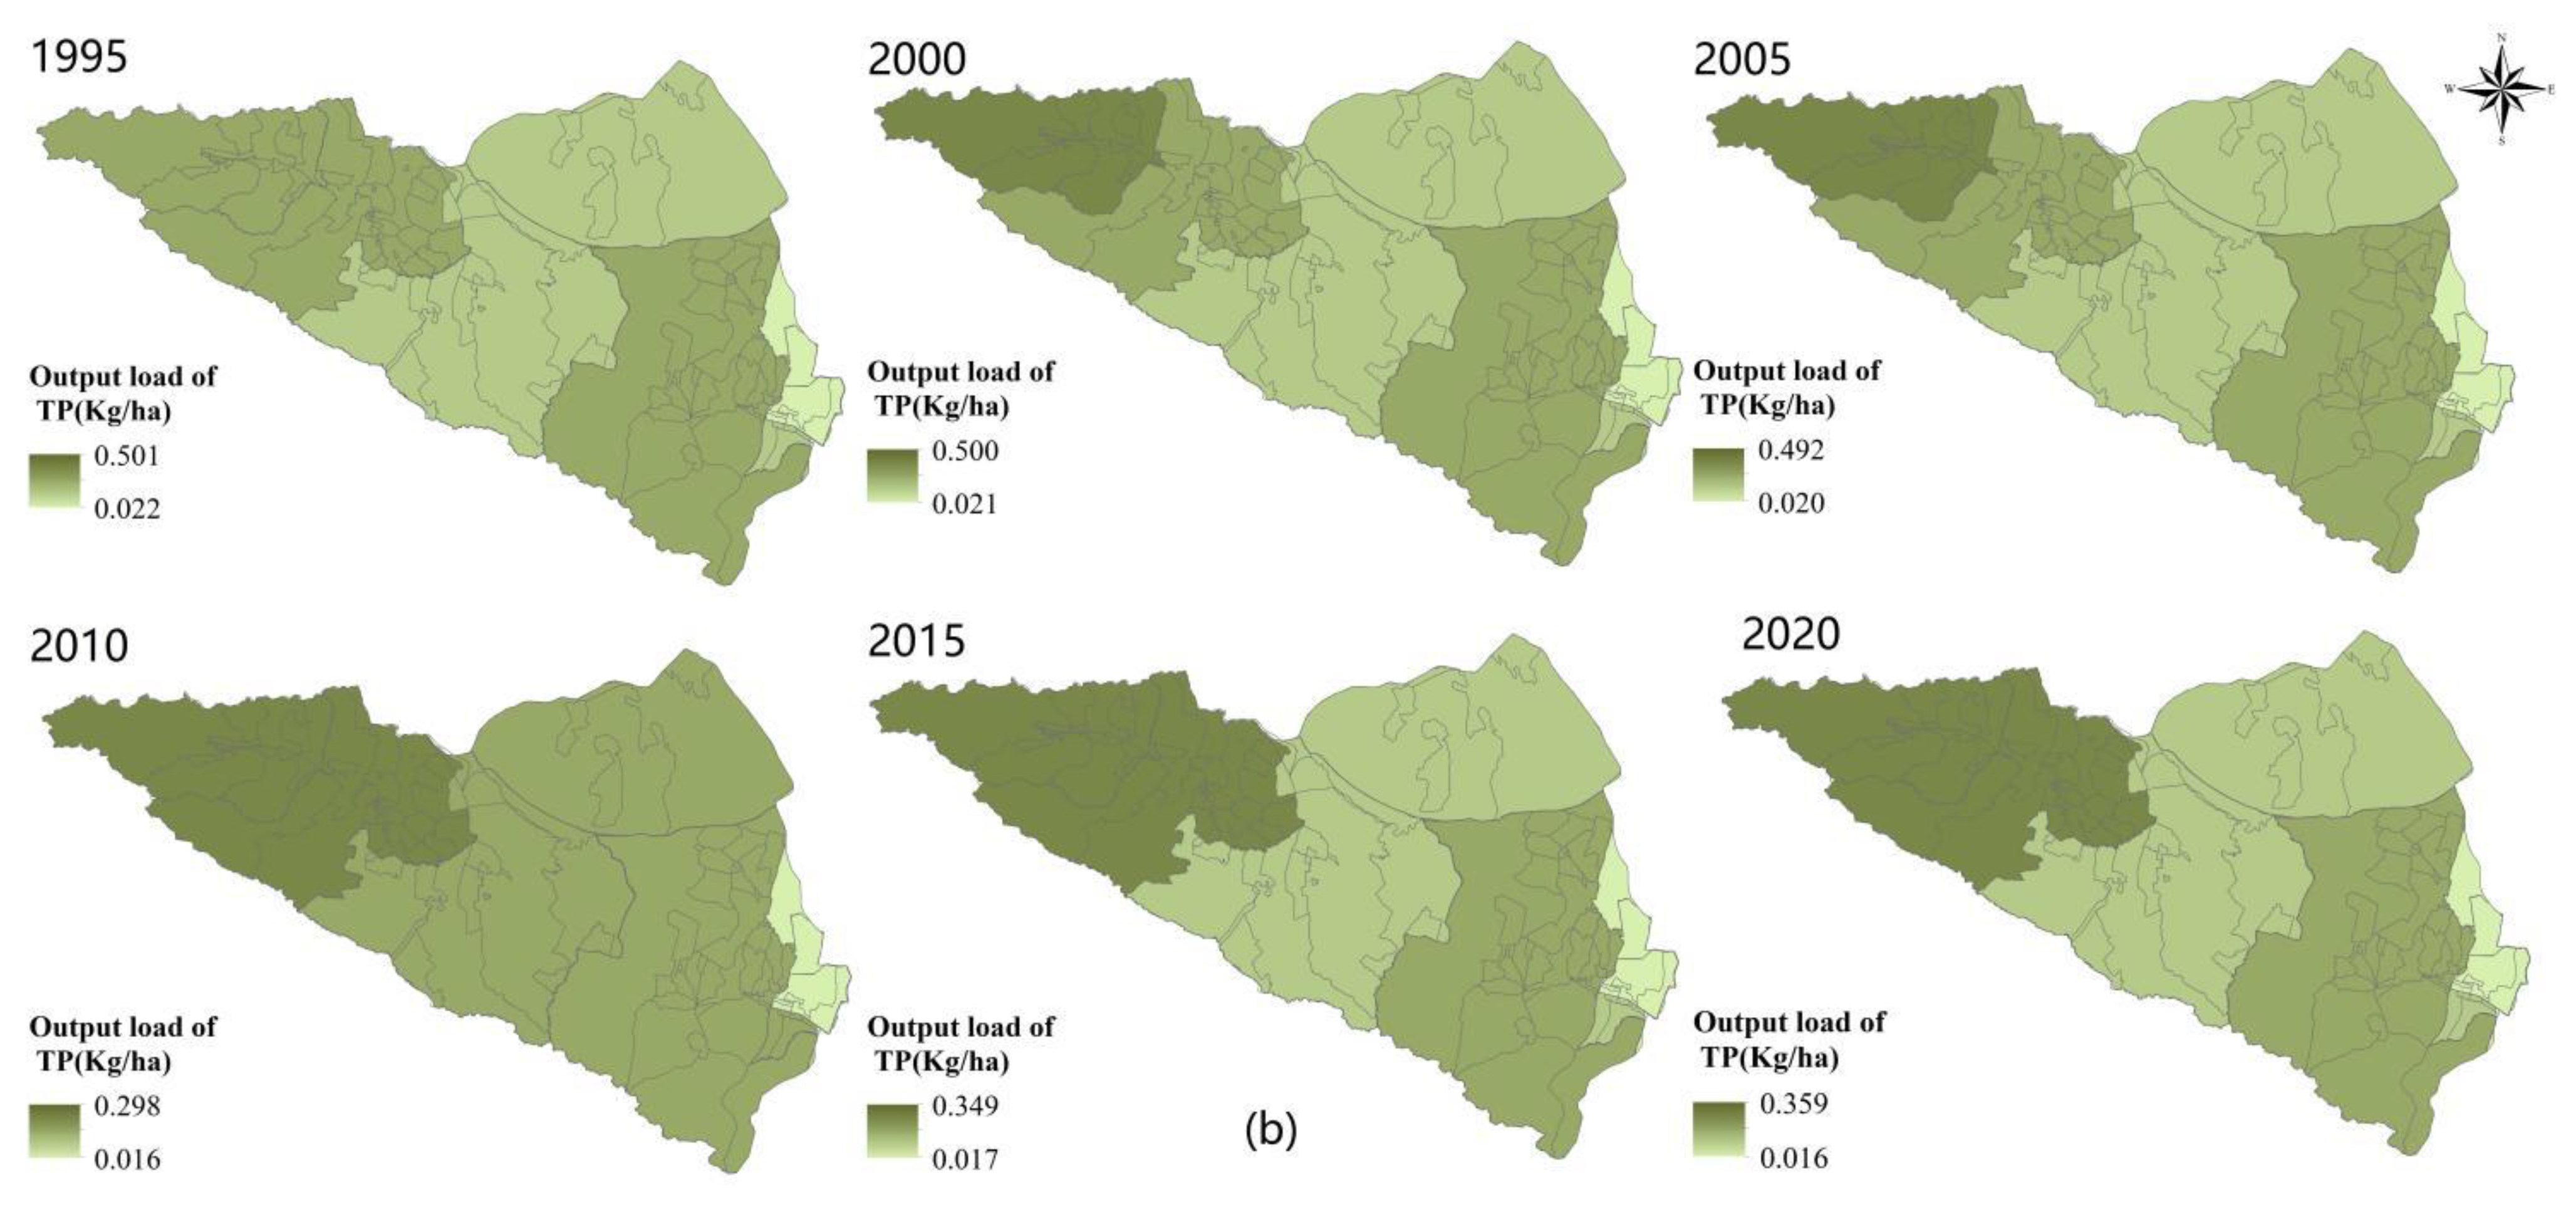
Using the InVEST model water purification module, the water purification service function of the Ebinur Lake Basin from 1995 to 2020 was evaluated (
Figure 8). The nitrogen output load of the Ebinur Lake Basin was ranked as follows: 1995 (58.754 kg/ha) > 2000 (57.859 kg/ha) > 2005 (56.749 kg/ha) > 2020 (55.297 kg/ha) > 2015 (54.679 kg/ha) > 2010 (53.206 kg/ha). The average nitrogen export load of the basin decreases significantly from 4.519 kg/ha in 1995 to 4.092 kg/ha in 2010, and then increases slightly to 4.253 kg/ha in 2020. The phosphorus export load of the Lake Ebinur basin is ranked as follows: 1995 (2.176 kg/ha) > 2000 (2.148 kg/ha) > 2005 (2.013 kg/ha) (2.013 kg/ha) > 2020 (1.679 kg/ha) > 2015 (1.645 kg/ha) > 2010 (1.575 kg/ha). The average phosphorus export load in the basin decreased significantly from 0.167 kg/ha in 1995 to 0.121 kg/ha in 2010, and then increased slightly to 0.129 kg/ha in 2020. The results of the study show that the water quality purification in the Ebinur Lake Basin has a certain consistency between different years. The areas with higher nitrogen and phosphorus output loads and lower water quality purification capacities are concentrated in the northwest and northeast of the basin, including Wenquan County; Bole City; Tori County; and Wusu City. Meanwhile, the areas with lower nitrogen and phosphorus output loads and higher water quality purification capacities are concentrated in the central and eastern parts of the basin, including Jinghe, Kuitun, and Karamay districts. From 1995 to 2010, the output load of nitrogen and phosphorus in the basin of Lake Ebinur decreased and the water quality purification capacity increased. From 2010 to 2020, the output load of nitrogen and phosphorus in the basin of Lake Ebinur increased, while the water quality purification capacity decreased.
Cropland contributed the most to nitrogen and phosphorus output, while forest land and basin contributed the least. The main land-use types in the areas with low water purification capacity are cropland and built-up land. This finding indicates that human activities, especially agricultural activities, are the main cause of water environment pollution, perhaps due to the use of large amounts of chemical fertilizers and pesticides in agricultural activities. Therefore, the nitrogen and phosphorus elements that are not absorbed by crops flow directly into the water bodies, which leads to an increase in the output load of nitrogen and phosphorus elements, thus weakening the water purification capacity of the basin. Nitrogen and phosphorus retention on each land-use type in the Ebinur Lake Basin from 1995 to 2020, in descending order, are as follows: cropland > grassland > unused land > built-up land > forest land > water area. The overall amount of nitrogen and phosphorus retention on each land-use type in the basin is increasing, and the overall amount of nitrogen and phosphorus retention on forest land is decreasing. This finding is not consistent with the area change of each land-use type. Land-use change affects the storage and removal efficiency of nutrients such as N and P via vegetation by changing the land-use structure and spatial pattern, affecting basin water quality. The increase in cultivated land and the decrease in forest land degraded the water quality purification function in the study area. In addition, the built-up land and basin area are small, so they have a smaller impact on the water quality purification function in the study area.
3.4. Analysis of Driving Factors of Water Yield and Water Purification Change in the Ebinur Lake Basin
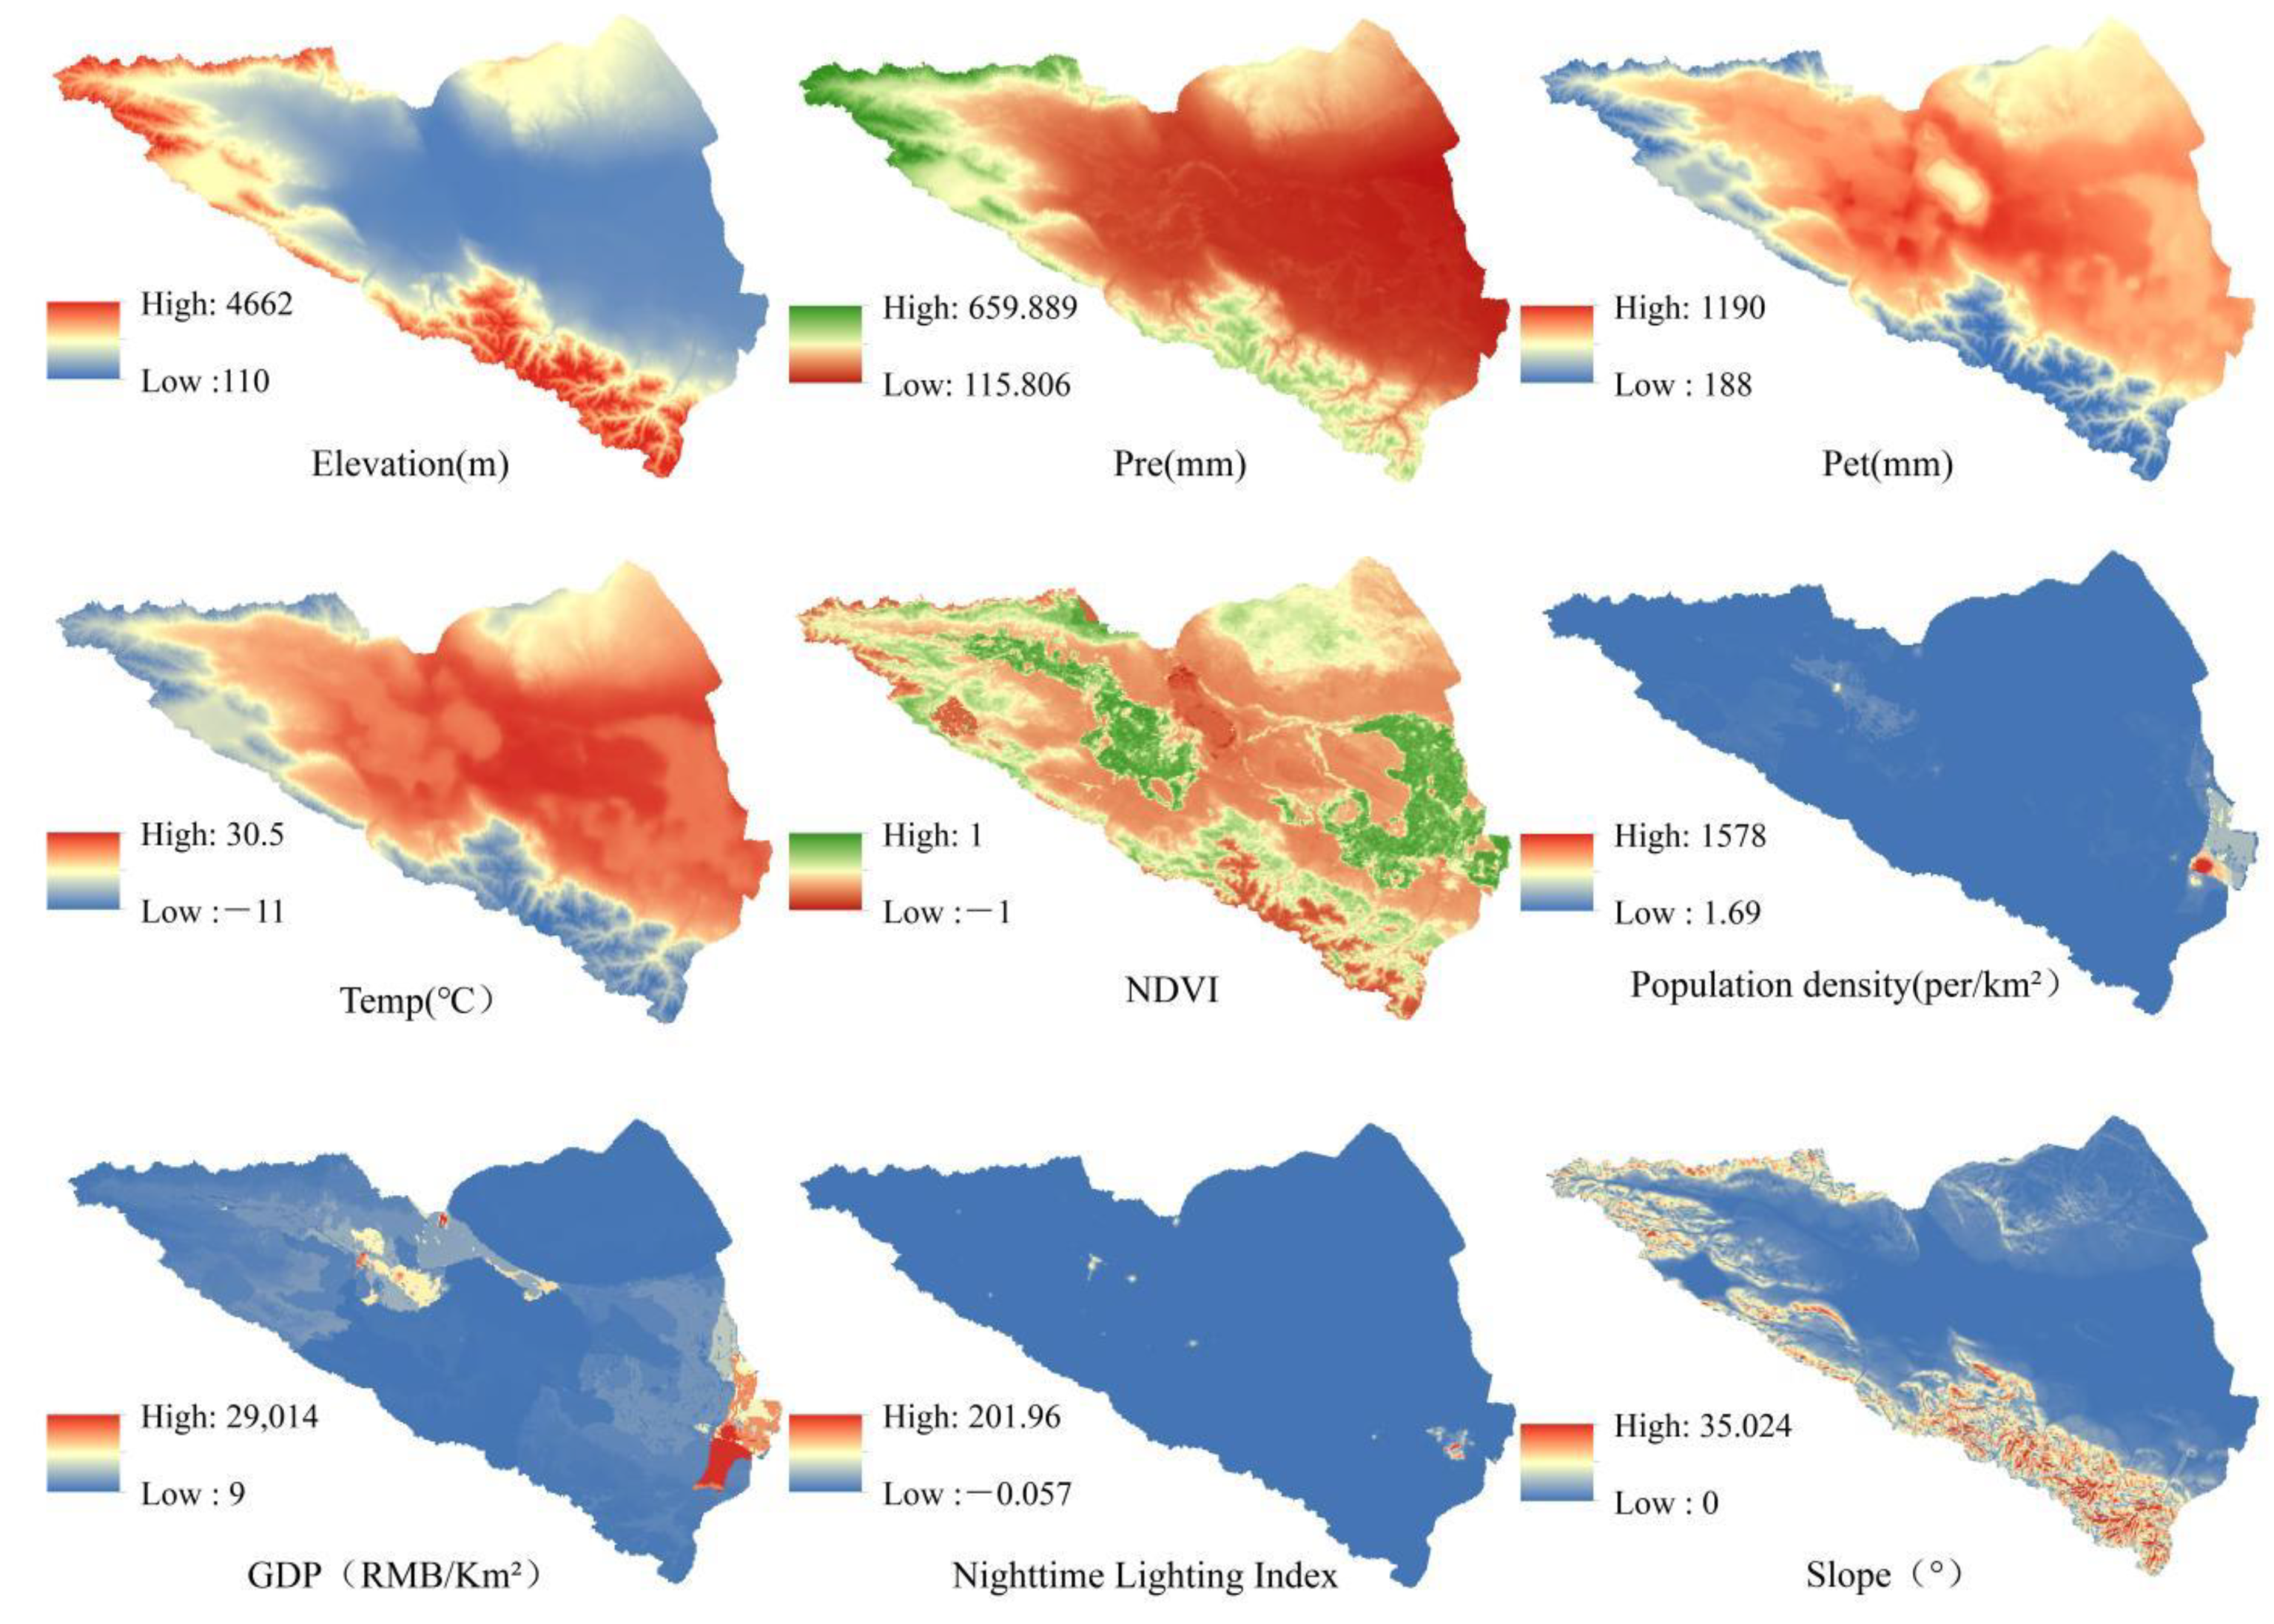
This study was based on the spatial and temporal distributions of water production and water quality services in the Ebinur Lake Basin, combining natural and anthropogenic factors for quantitative research. Using the data for 2020 as an example, the natural and anthropogenic data were gridded using the grid method to create 2098 grid points at a size of 10 km × 10 km within the study area and were used to match water yield and water quality services (detection factor) with influencing factors (explanation factor). The interaction between the various factors and water production and water quality services in the Ebinur Lake Basin, and whether there were significant differences between them, thus revealed the main driving forces influencing the spatial distribution.
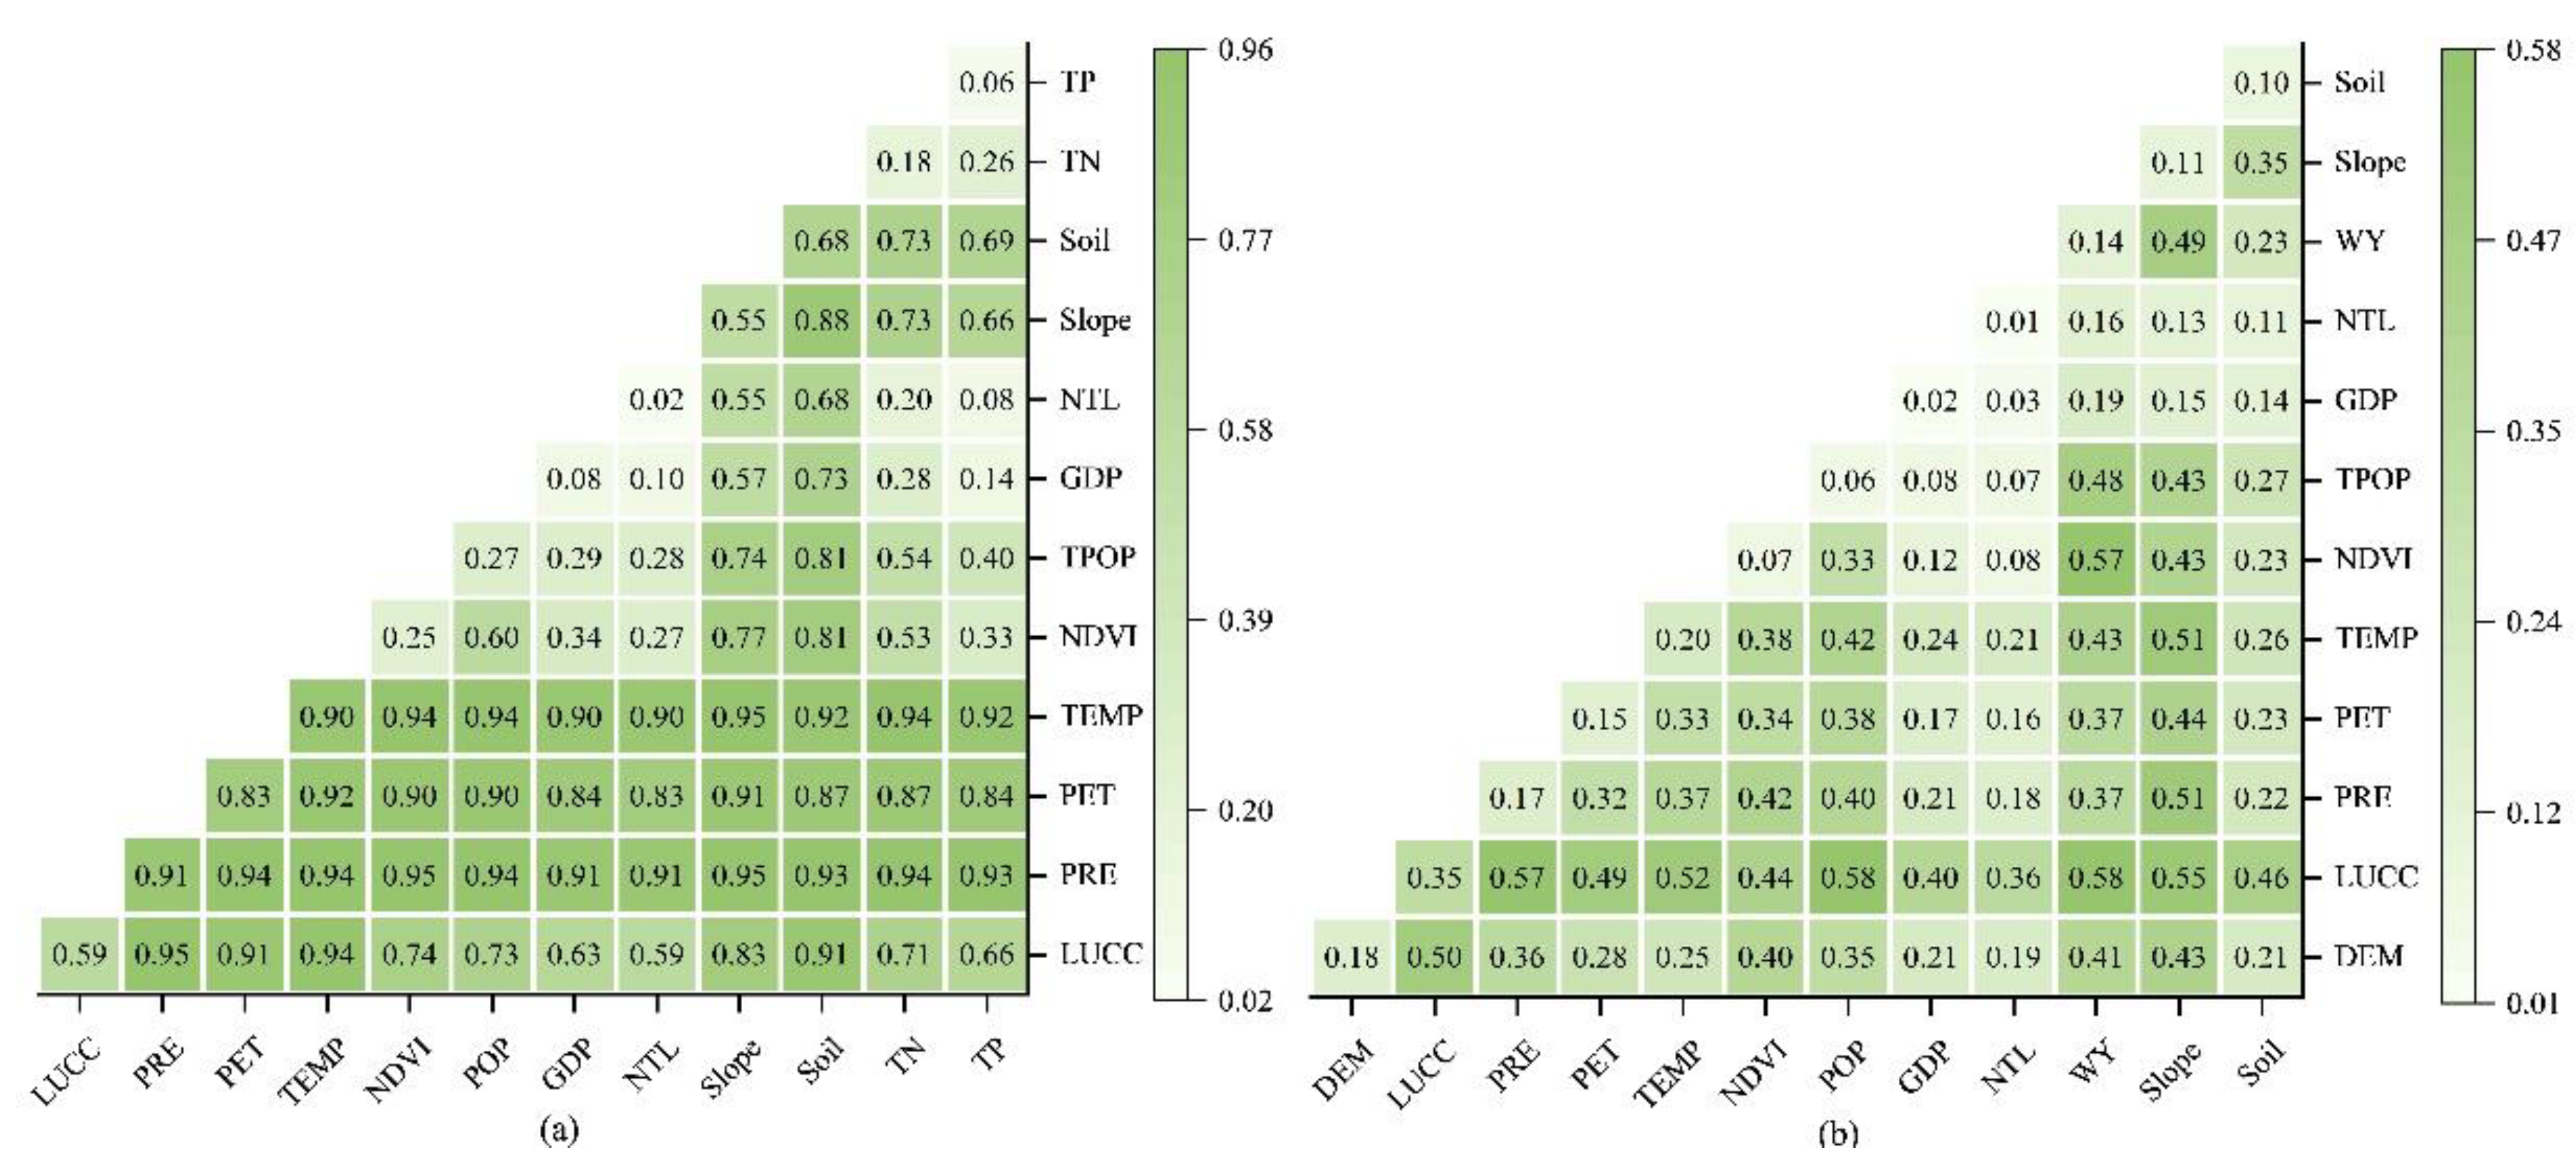
From
Figure 9a, it can be seen that the different factors, in descending order of q-values of their power to determine water yield, are as follows: PRE (0.91) > TEMP (0.90) > PET (0.83) > Soil (0.68) > LUCC (0.59) > Slope (0.55) > POP (0.27) > NDVI (0.25) > TN (0.18) > GDP (0.08) > TP (0.06) > NTL (0.02). Using the results of factor detection, we can see that the first dominant factor affecting the distribution of spatial variation in water yield is PRE, with a contribution of 0.91. The next factors are TEMP, PET, Soil, and LUCC with equal influence. The rest have relatively small contributions to the spatial variation in water yield. In terms of the magnitude of the interaction produced, TEMP ∩ Slope (0.95), PRE ∩ Slope (0.95), LUCC ∩ PRE (0.95), and LUCC ∩ TEMP (0.94). The interaction between LUCC and TEMP, PET, and PRE types in the study area is evident. The Soil and Slope interaction is more significant compared to the interaction between other factors.
From
Figure 9b, the first dominant factor affecting the spatial distribution of water purification is LUCC, with a contribution rate of 0.35, followed by TEMP (0.20). The contribution rate of other factors to the spatial change of water purification is relatively small. From the perspective of the maximum interaction, the interaction between LUCC and other factors is significant in the study area, including LUCC and WY (0.58), LUCC and POP (0.58), LUCC and PRE (0.57), LUCC and TEMP (0.52), LUCC and PET (0.49), LUCC and Soil (0.46), and LUCC and NDVI (0.44). The interaction between WY and Slope is more significant than that between other factors. The distribution pattern of different ecosystem types is determined by different land-use type structures. The interaction between LUCC factors and other factors is more prominent than that between other factors. This finding fully shows that changes in climate conditions and land-use patterns in the Ebinur Lake Basin have a certain impact on the distribution trend of water yield and water purification (
Figure 10). Therefore, it is necessary to strengthen the restoration of ecological projects in the study area, thereby enhancing the ecological service function of the water ecosystem, so as to improve the purification function of water production and water quality in the study area.
4. Discussion
4.1. Changes in Land Use and Ecosystem Water-Related Functions
Against the background of land-use change, the balance between the water ecological environment and social development in the northwest arid region of China is becoming increasingly unstable, and the water ecological environment will be more likely to be damaged. Appropriate measures should be taken to curb the deterioration of the water’s ecological environment in the northwest arid region. We assessed the impact of land-use change on the provision of two water-related services in the ecosystem of the Ebinur Lake Basin, which is rarely discussed. The results show that land-use change has exerted great pressure on the ability of ecosystems to provide ecosystem services. According to existing research, the impact of climate change on water conservation is greater than that of land-use change on a large scale. For soil output and nutrient output, the impact of land use is greater than that of climate change [
38]. On a smaller spatial scale, such as the ecological area investigated in this study, the forest area is decreasing, and land-use change has a greater impact on all water-related ecosystem services.
The results show that the land use in the Ebinur Lake Basin covers a large area of grassland, cultivated land, and unused land, while the area of other land types is relatively small. The construction land and cultivated land are mainly distributed in the west and southeast of the basin, while the forest land and water area are scattered in the basin. The area of construction land and cultivated land in the basin is increasing annually, while the unused land area decreases year by year. The area of forest land, grassland, and water area fluctuates greatly. From 1995 to 2020, the water yield of the Ebinur Lake Basin increased first and then decreased, and the water production service function was enhanced first and then weakened. The northwest and southeast parts of the basin had high water yield service functions. The change in average water yield in the basin is consistent with that of cultivated land and construction land but inconsistent with that of grassland, forest land, water area, and unused land. Among them, forest land and grassland contribute the most to the water yield. Although the construction land increases year by year, due to the small proportion of the area, the impact on the total water yield is weak, and the contribution to water yield is the lowest. The relationship between the average water yield and the area change of each land-use type is quite different. The output of nitrogen and phosphorus in the Ebinur Lake Basin decreased first and then increased from 1995 to 2020, and the water purification service function of the basin weakened. Areas with high water purification capacity are concentrated in the middle and northeast of the basin, including Jinghe County, Toli County, and Kuitun City. The land-use changes with different nitrogen and phosphorus outputs are consistent with the changes in cultivated land, grassland, water area, construction land, and unused land, but not with the change in forest land. Cultivated land contributed the most to nitrogen and phosphorus output, while forest land and water area contributed the least to nitrogen and phosphorus output. The main types of land use in areas with low water purification capacity are cultivated land and construction land.
4.2. Countermeasures and Impacts
Our method can help identify popular spots of ecosystem service gains and losses and can be used for more intelligent environmental investment decisions. Our maps and comparisons provide a potential tool for determining which regions are most sensitive to land-use change and climate change, enabling us to determine the spatial objectives of investment needs cost-effectively to enhance or restore ecosystem services [
39]. Our results show that forest land and grassland, as typical vegetation types, play an important role in implementing major ecological restoration in the Ebinur Lake Basin. Afforestation, conversion of farmland to forest, ecological forest protection, and restoration of degraded grassland have an important impact on the transfer of forest land and grassland. From the perspective of land-use mode, the Ebinur Lake Basin still faces uneven spatial distribution of water production functions due to the difference in land-use allocation, which requires more scientific and reasonable water resource regulation and land-use allocation in the future. At the same time, it is of great significance to pay attention to the role of different sub-basins and reasonably plan and balance the functional positioning of sub-basins for regulating the water production function of the Ebinur Lake Basin. For example, the Ultaxare River, Bortala River, and Jinghe River are basins with the largest contribution to water production, and by balancing reasonable water resource functional zoning based on the different characteristics of water production in different sub-basins, we can further improve the implementation efficiency of regional and macro policies in the future. Agriculture is the main economic development mode in arid areas, and pesticides and fertilizers have become the largest pollution sources. The use of pesticides and fertilizers should be controlled to improve the utilization rate. Protect the quality of water resources, and strengthen the control of pollutants and sewage treatment.
In addition, from science to policy, a clear spatial map of water-related ecosystem services can provide an important basis for landscape policy and management decisions. These maps provide a means to quantify changes in ecosystem services driven by land use and climate factors. In the analysis of our geographical detectors, we showed that the impact of land-use change on soil conservation and nitrogen and phosphorus output is significantly higher than climate change. Our findings show that smart land-use management can improve the ability of ecosystems to provide water-related ecosystem services. To sum up, the analysis framework proposed in this study not only provides an effective tool for identifying popular spots of ecosystem service gains and losses using visual-spatial maps, but also provides policymakers with a better understanding of how to determine the spatial objectives of investment in a cost-effective manner to strengthen or restore ecosystem services. Our analytical framework also applies to other regions. However, special attention should be paid to the local planning scale, and effective measures should be formulated according to local conditions.
4.3. Research Limitations and Future Studies
The main elements of our method are factor selection, ecosystem service assessment, and factor analysis. Our approach explores the possible impacts of land-use change on two water-related ecosystem services. This method is simple and can be popularized in other regions. The analysis of the main driving factors of water yield and water quality purification by geographical detectors provides a reference for further revealing the driving forces affecting the watershed. Rainfall, potential evapotranspiration, and land-use data have a significant impact on water yield and water quality purification, which can be regarded as direct driving factors affecting water yield and water quality purification services. In addition, soil type, slope, and terrain data, as the main components, also play a significant role. Although this factor is not a direct driving factor, its impact on water production and water purification presents an indirect role, especially since the interaction between other factors is more significant. This factor shows that climate conditions and land use are also the main driving factors. In summary, in the analysis of the leading driving factors of water production and water quality purification, rainfall, potential evapotranspiration, land use, and temperature in the Ebinur Lake Basin were determined to be the main driving forces, while soil type, terrain, and slope were the indirect driving forces. The distinction between the main driving forces and the indirect driving forces has guiding significance for the macro and micro policy guidance of the whole Ebinur Lake Basin and its sub-basins. Despite these advantages, this study also has some limitations. For example, the InVEST cannot include seasonal or monthly fluctuations in nutrient load, which may lead to a potential time-scale mismatch between the InVEST output and management. Another method, time decomposition modeling is needed to solve the impact of time fluctuation runoff on water quality.
5. Conclusions
In order to explore the impact mechanism of human activities on the water ecosystem service functions in the watershed and provide suggestions for land-use decision-makers, this study evaluated the water ecosystem service functions of the Ebinur Lake Basin watershed using the InVEST model and a geographical detector to analyze the relationship with land-use changes. Due to the large proportion of grassland area, the overall change in water yield is more evident than on other lands. Grassland changes play an important role in the water production function of watersheds. The main land-use types in areas with a large change rate of water purification function in the basin are cultivated land and construction land, which shows that human activities, especially agricultural activities, are the main cause of water environment pollution. Therefore, in agricultural production, it is necessary to fertilize rationally and reduce the use of chemical fertilizers. While ensuring the stability of cultivated land, forest land, and grassland should be scientifically and rationally matched to ensure the ecological security of the watershed. The main drivers of changes in water ecosystem services include rainfall, potential evaporation, temperature, and land use. In most of the regions we studied, land-use change had an inhibitory effect on water ecosystem services at the watershed scale. Our study also supports the hypothesis that reasonable land use will have a positive impact on the water production function of the ecosystem to a certain extent, and effective management can help managers formulate more comprehensive spatial planning.
The results of this study reflect the macro evolution trend based on the assessment of water ecosystem services and propose a feasible and replicable framework for land-use decision-making in ecologically fragile areas. The combination of spatiotemporal changes in land use and geographical detector analysis allows for a more comprehensive assessment of the impact of drivers on ecosystem services. This study not only helps to gain insight into urban growth patterns in the study area but also helps to inform different land-use stakeholders. However, based on the availability of data, this paper does not fully consider the influencing factors and indicators of water quality and only shows limited results, but the research findings are practical, methodological, and policy-relevant. These findings can support the use of ecosystem service information in land planning and the development of more effective ecosystem conservation strategies.


 ,
, 


