Technical Note

Soil Moisture Change Detection with Sentinel-1 SAR Image for Slow Onsetting Disasters: An Investigative Study Using Index Based Method

1
Graduate School of Sciences and Technology for Innovation, Yamaguchi University, 2-16-1, Ube 755-8611, Japan
2
Faculty of Engineering, Assam Down Town University, Panikhaiti, Guwahati 781026, India
*
Author to whom correspondence should be addressed.
Land 2023, 12(2), 506; https://doi.org/10.3390/land12020506
Submission received: 16 January 2023 / Revised: 13 February 2023 / Accepted: 16 February 2023 / Published: 17 February 2023

Abstract

:
Understanding physical processes in nature, including the occurrence of slow-onset natural disasters such as droughts and landslides, requires knowledge of the change in soil moisture between two points in time. The study was conducted on a relatively bare soil, and the change in soil moisture was examined with an index called Normalized radar Backscatter soil Moisture Index (NBMI) using Sentinel-1 satellite data. Along with soil moisture measured with a probe on the ground, a study of correlation with satellite imagery was conducted using a Multiple Linear Regression (MLR) model. Furthermore, the Dubois model was used to predict soil moisture. Results have shown that NBMI on a logarithmic scale provides a good representation of soil moisture change with R2~86%. The MLR model showed a positive correlation of soil moisture with the co-polarized backscatter coefficient, but an opposite correlation with the surface roughness and angle of incidence. The results of the Dubois model showed poor correlation of 44.37% and higher RMSE error of 17.1, demonstrating the need for detailed and accurate measurement of surface roughness as a prerequisite for simulating the model. Of the three approaches, index-based measurement has been shown to be the most rapid for understanding soil moisture change and has the potential to be used for understanding some mechanisms of natural disasters under similar soil conditions.

1. Introduction

The volume of water trapped in the voids of a soil mass contributes to soil moisture. It is an important parameter affecting a wide range of physical science, and thus its monitoring, estimation, and prediction are important in the context of land management [1] and agricultural production [1,2], and its changing profile affects the occurrence of natural disasters such as droughts, floods, and landslides [3,4,5]. However, it is difficult to estimate the parameter with reasonable accuracy when the area is large. Remote sensing observations from ground and satellites help in collecting data for simulation of semi-empirical or physical models for its estimation [6]. The models have their own assumptions and data requirements, and the process requires detailed planning and time. In addition to the exact values, the change in soil moisture between two points in time is also important and can be accessed through an index. The advantage of the index may be that it does not require measurement of ground roughness. Thus, if the roughness does not change significantly between two observation times, the index may be a good representation of the state of moisture change on the soil. This paper presents a case study of this possibility using an existing index, the Normalized radar Backscatter soil Moisture Index (NBMI). It was introduced to calculate the relative soil moisture at a particular location and it used the radar backscatter of two different dates [7]. This index is based on a multi-temporal strategy that uses a ratio technique that enables common multiplicative effects on backscatter, which are mostly caused by variations in soil type and surface roughness, to be minimized [8]. The advantage of NBMI, is the removal of contribution in the backscattering coefficient due to the soil type and the surface height. At the same time, the study attempts to determine and predict soil moisture using Multi Linear Regression (MLR) and Dubois models, and highlights the challenges that must be overcome to achieve a high level of accuracy in the predicted results.

Some Indices of Soil Moisture
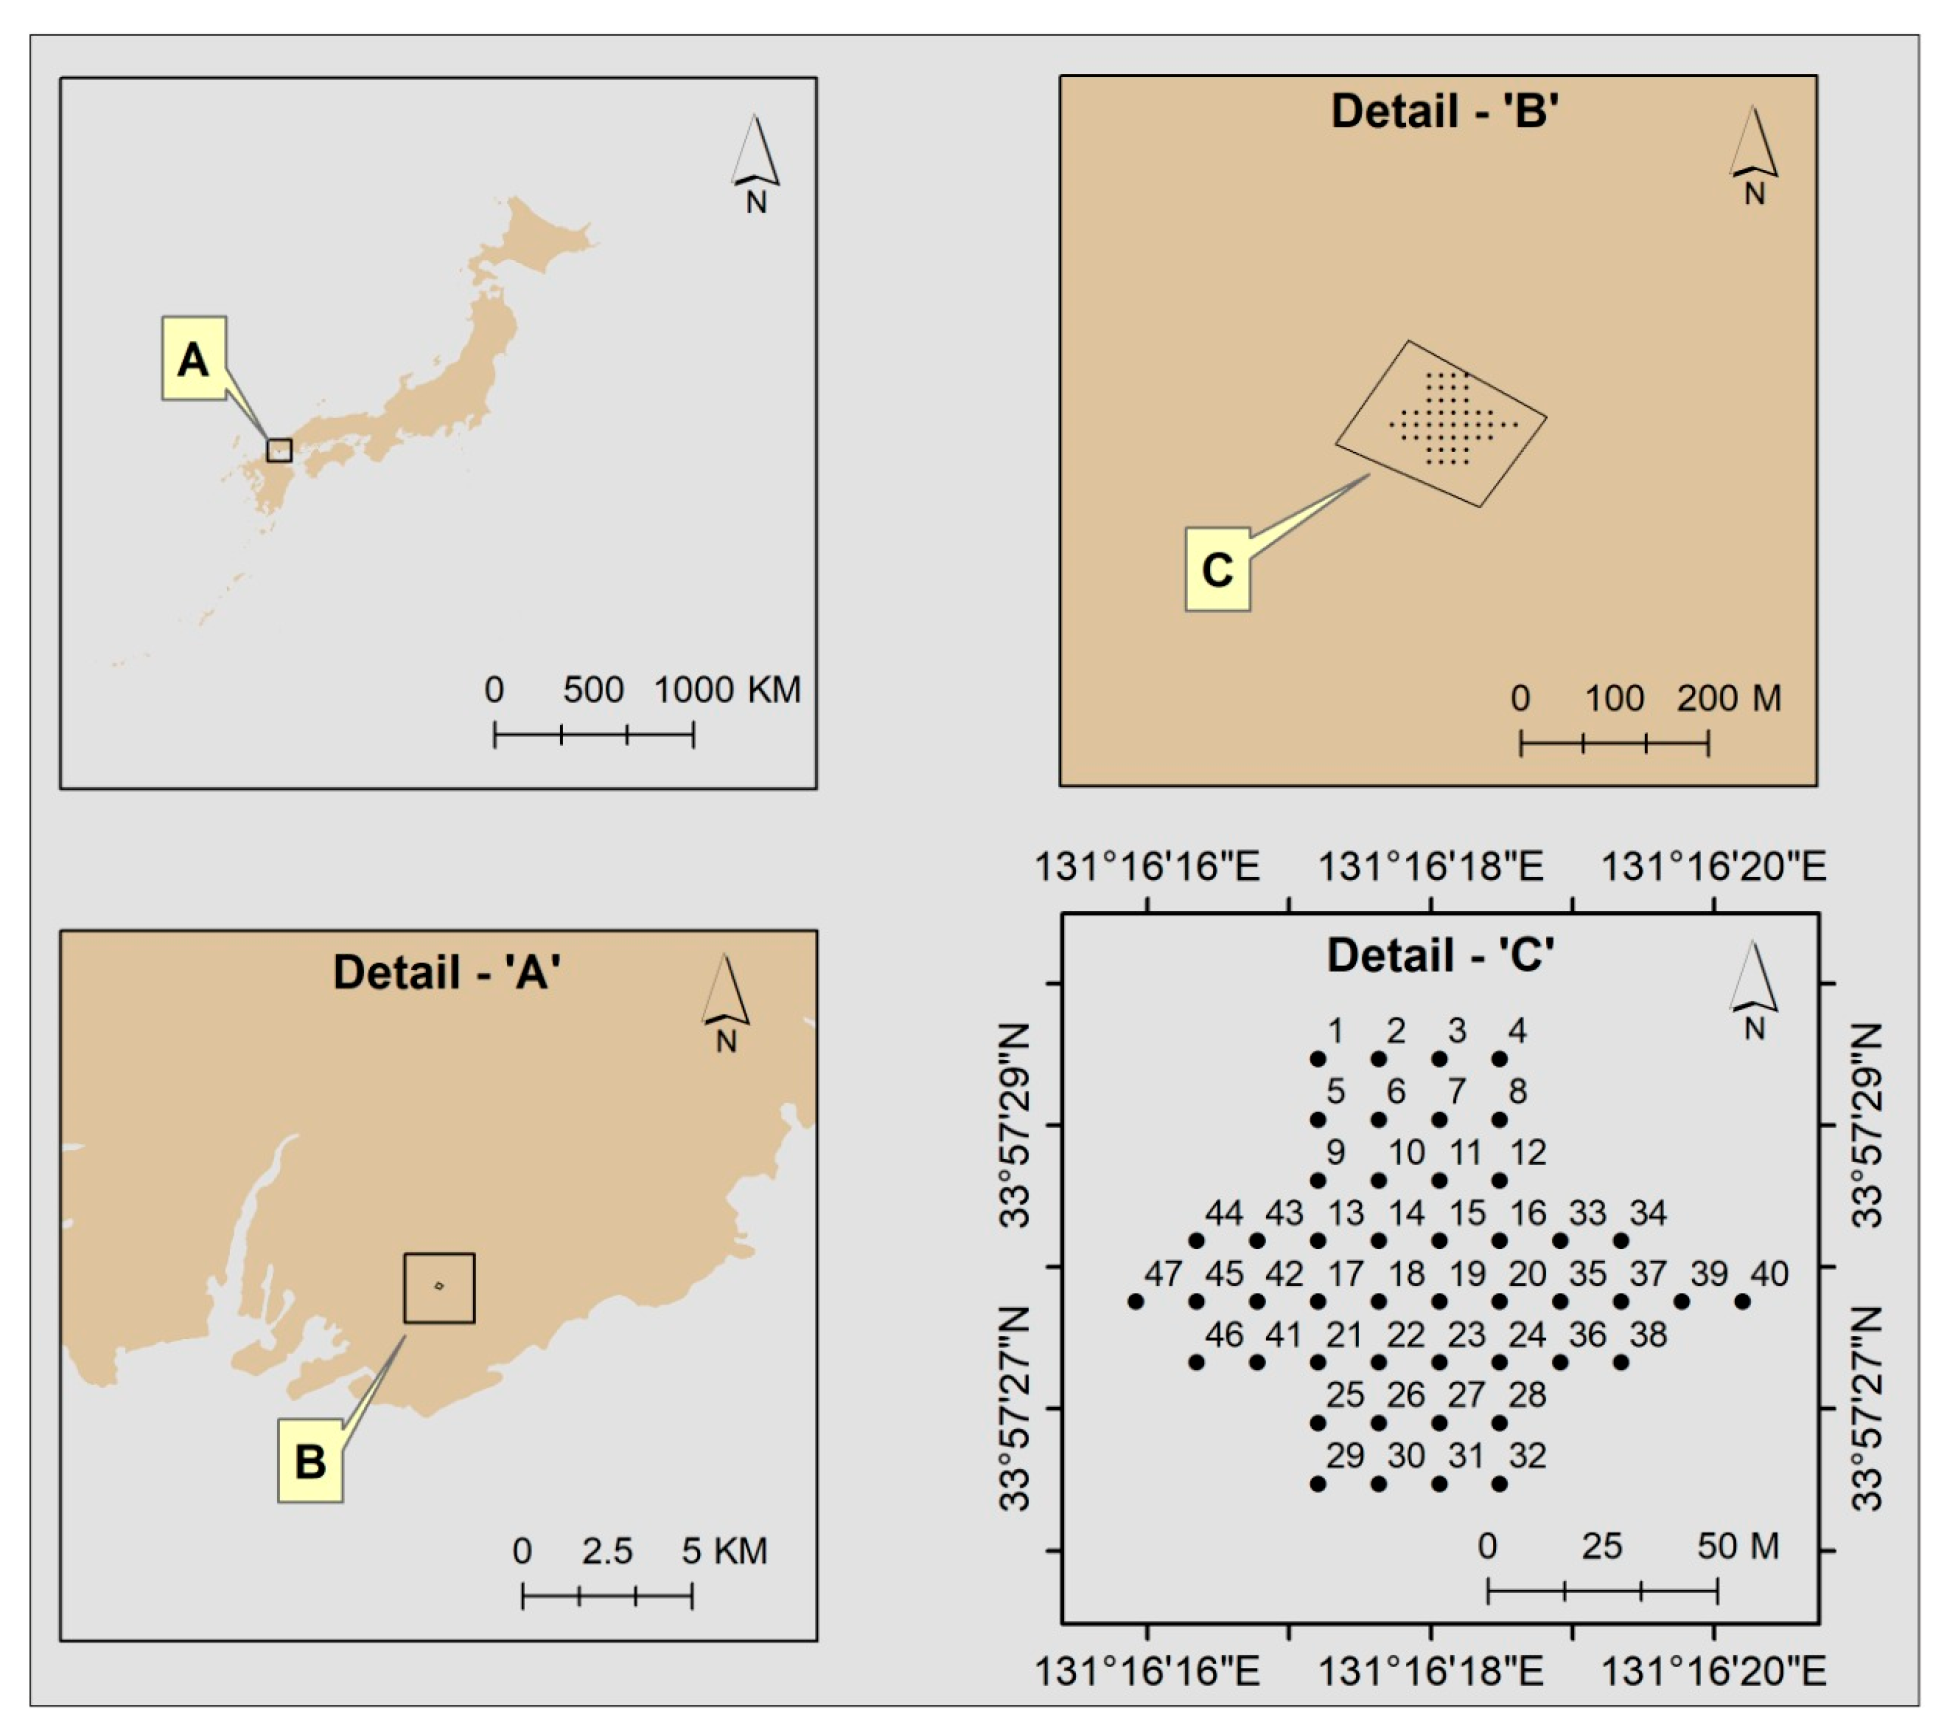
Since its beginnings in the 1960s, the use of remote sensing to estimate soil moisture has evolved considerably. The ability to use both passive and active sensors to monitor the soil surface, which is related to the amount of water in the soil, was just being explored by researchers at the time. For passive optical methods, the availability of finer resolution remains an advantage [9], while the penetration capability of active sensors is an advantage that can be used to interrogate soil moisture at the subsurface level. As part of an overview of established methods in both fields, there are some detailed reviews of the evaluation of remote sensing methods [6,10,11], a current state of use in the microwave domain [12], and some significant recent advances [13] carried out by researchers at recent years. One of the earlier methods is the extraction of soil moisture from the uppermost layer [14]. Other applications focused on establishing a link between soil parameters, vegetation indices and surface radiation temperature, which were studied and progressively developed [15,16,17]. Some of the models and approaches in this area include the universal triangular relationship method, brightness models, statistical analysis techniques, and the application of neural networks [11]. In passive environments, thermal sensors, including thermal infrared (TIR) sensors, can monitor soil surface temperature and reveal details about subsurface soil moisture content. In dry or arid regions, where the presence of water can have a significant impact on soil temperature, these sensors are particularly useful for assessing soil moisture [18,19,20]. Because soil moisture content has a significant effect on the emission of thermal microwave radiation from the soil, some of the first algorithms for estimating it using passive microwave data were developed in parallel and have contributed significantly to our understanding of the relationship between microwave emissions and soil moisture. The Land Surface Microwave Emission Model (LSMEM) is one such useful tools for estimating soil moisture from passive microwave data and offers crucial results for a variety of applications. The Semi-Empirical Model (SEM) is a hybrid model that incorporates physical and empirical links widely used for soil moisture retrieval from passive microwave data. Similar models have yielded high precision and high-resolution surface soil moisture predictions with the utilizing of radar and radiometer microwave remote sensing by combining the complementary strengths and sensitivities into an integrated and unified retrieval framework [21,22,23]. Since optical remote sensing imagery is affected by weather conditions and the accuracy of soil moisture estimates is affected by vegetation cover on the ground surfaces, active sensors on the other hand have the advantage of being on-board satellites and can achieve ground resolution of up to 10 m available freely for public use. However, these measurements are extremely sensitive to surface geometry, including soil texture, vegetation structure, orientation, incidence angle, and polarization, among other factors. Therefore, a straightforward retrieval method for determining soil moisture is often not available, and various physical, empirical, or semi-empirical models exist for this purpose. Site-independent correlations are provided by physical models such as Integral Equation Model (IEM), Small Perturbation Model (SPM), Geometrical Optic Model (GOM) and Physical Optic Model (POM), but their applicability is limited depending on the soil roughness [16]. On the other hand, the semi-empirical or empirical models are often valid only for certain soil conditions and need to be calibrated to other soil conditions. Such examples include the Oh model [24,25,26,27,28] and the Dubois model [29].
The developments of the sensors and methods have contributed to construct important indices that can provide information about the state of soil moisture on the ground. The Normalized Difference Moisture Index (NDMI), which measures the water content of plants, is one of the important indices used in the optical region. Normalized Difference Vegetation Index (NDVI), Normalized Difference Water Index (NDWI), and Enhance Vegetation Index (EVI), etc. can be used as proxy measurements for the purpose. Other similar indices include the Atmospherically Resistant Vegetation Index (ARVI), the Structure Insensitive Pigment Index (SIPI), etc. [30]. In the microwave range, the Soil Moisture Active Passive (SMAP) index is derived from data collected by the European Space Agency’s Soil Moisture and Ocean Salinity (SMOS) satellite. It allows the collection of information from the top 5 cm of the soil, which is crucial for agricultural productivity. For a deeper layer of information, index such as Advanced Microwave Scanning Radiometer-Earth Observing System (AMSR-E) can be utilized from instruments onboard NASA’s aqua satellite. The Passive Microwave Remote Sensing Soil Moisture index (PMRSM) is another in this category that can be derived from a variety of satellites, including the active passive soil moisture index such as Soil Moisture and Ocean Salinity (SMOS), the AMSR-E index (AMSR-E), and the Special Sensor Microwave/Imager index (SSM/I), etc. In addition, there are physics-based models that use optical data, and many of them are used to predict slow-onset disasters such as droughts. The Soil Water Index (SWI) from the SAR satellites is an example of quantifying the soil moisture index at different depths on a larger scale. The Soil Moisture Index (SMI) is a widely used index that uses parameterization of the relationship between Land Surface Temperature (LST) and the Normalized Difference Vegetation Index (NDVI) [31]. Ultimately, satellite-based soil moisture indices have contributed to a better understanding of soil moisture on the ground by providing a thorough and spatially continuous perspective of soil moisture at the surface, through improving spatial and temporal monitoring capabilities and advancing models and indices.

2. The Study Area

The study area was a baseball field roughly of size 0.02 sq km in the Yamaguchi University premises in Ube city, Yamaguchi prefecture, Japan as shown in (Figure 1). It was predominantly bare soil with very sparse weeds where maximum twig heights reached not more than 15 cm having an average diameter of about 1 mm. Observations were made at 47 specific points, as shown in the same figure. The soil type was dominantly hard reddish brown Lateritic type of soil.
According to Japan Meteorological Organization (JMO) data recorded at Yamaguchi Station, the average air temperature, humidity, and total precipitation for the month of September, when the observations were made, were 24.8 °C, 78%, and 363.5 mm, respectively. Two satellite observations from the Sentinel-1 C-band satellite on 16 and 28 September 2022 were used for the study. Of note, there was precipitation of about 32 mm prior to the second satellite observation on the previous day, which likely contributed to an increase in soil moisture in the study area.

3. The Satellite Data

Soil moisture values at ground level were collected using an MC7828SOIL kit with a probe from a depth of approximately (5–6) cm. There was a total of 47 observation points, as shown in (Figure 1 detail “C”). Four observations were collected around each point at approximately 1.7 m intervals (Figure 2), and the average values of these observations were considered the mean soil moisture around that point.
Field data collection of soil moisture began at 18:00 in the evening, about three hours before satellite observation over the area, which occurred at 21:17, and continued for four hours until 22:00 at night. Both observations were made in the IW mode with descending view to the right and with VH and VV polarizations.
The baseball field was equipped with floodlights so that data collection was possible at night. A Landsat-8 image of the area taken on 23 September was used for the NDVI calculation. Table 1 provides further information regarding the Sentinel-1 observations.

4. Methodology

The methodology began with downloading and processing satellite imagery from Sentinel-1 and Landsat-8 satellites to extract radar backscatter and NDVI values. On the respective dates, the field measurements of soil moisture were carried out with the probe. A GPS device was used to identify the points from where the soil moisture was to be collected. A schematic diagram of the workflow and methodology is shown in (Figure 3).
The Sentinel-1 images were later processed to extract the radar backscatter and incidence angles. Those were used in NBMI, MLR and the Dubois models. A correlation between NBMI and soil moisture change was investigated. The accuracy of the inverted Dubois solution was tested using field values for soil moisture in relation to the RMSE. The following subsections describe each step-in detail.

4.1. The Estimation of Radar Backscatter Coefficients

The Sentinel-1 data obtained were processed for radiometric calibration and geometric correction using SNAP software developed by European Space Agency (ESA). The radiometric calibration changed the Digital Number (DN) values of backscatter intensity to radar backscatter coefficients using the Equation (1).
σ 0 p q = D N i 2 A i 2
where, A i was the corresponding sigma-nought value depending on a Look up table (LUT). Here, pq describes the polarization. After the radiometric calibration, the linear backscatter units were converted into decibel (dB) units using Equation (2) to represent the power of the radar signal.
σ 0 d B = 10 l o g 10 σ 0 p q
The images were geometrically corrected and co registered with bi-linear interpolation with an RMSE value < 0.5 of a pixel and projected to WGS84 map projection. A 3 × 3 lee filter was applied to both the images to reduce speckle. The study area was located in the satellite images and 47 observation points were identified and related to individual pixels in the satellite images for backscatter measurement.

4.2. The NBMI

In an original study, the NBMI for ERS-2 SAR backscatter with C-band data and an incidence angle of 23° was used to determine the relationship between the concentration of soil moisture on the ground with the index [7]. It was applied in the transition between a humid and a semi-arid climate. The Equation (3) defines the NBMI [7].
N B M I = σ 0 d B T 1 + σ 0 d B T 2 σ 0 d B T 1 σ 0 d B T 2
Here, σ 0 d B T 1 and σ 0 d B T 2 are the radar backscatter coefficients of day1 and day2 of observations. For our study, these corresponded to backscatter measured on 16 and 28 September 2022 respectively.

4.3. The MLR Model

The Multiple Linear Regression (MLR) model used the field measured values of Soil Moisture (SM) to construct a linear relationship with the independent parameters of radar backscatter coefficients σ 0 d B , incidence angle ( θ ) and surface roughness ( H r m s ) as described in Equation (4) [32]. Here a, b, c and d are the constants.
S M = a + b σ 0 d B + c θ + d H r m s

4.4. Measurement of Surface Roughness ( H r m s )

One of the influencing factors that affects radar backscatter is the surface roughness [6,33]. Thus, its accurate measurement is critical in determining the soil moisture. The conventional methods of using a pin profilometer is not used here to save time and instead roughness is derived using equations involving the cross and like polarized backscatter values [34,35] as shown in Equations (5) and (6) respectively. We have used the constant values from the given papers as ground conditions were similar and mostly flat level terrain. The values of A, B, C and D are considered 4.27, 0.22, 1.850, 0.120 respectively as suggested in the original equations from both the papers. σ 0 V H   a n d   σ 0 V V (in dB) are the measurements of radar backscatter coefficients in VH and VV polarizations.
H r m s = A + B σ 0 V H σ 0 V V
H r m s = C + D σ 0 V H / σ 0 V V

4.5. The Dubois Model

The Dubois model is a semi empirical model to retrieve soil moisture derived from scatterometer data [29]. The optimized algorithm is best suited for the bare surfaces which satisfy the conditions within the range as shown in Table 2 [29,36]. In this study, the five parameters achieved are shown in the same table. The K H r m s (cm) value is within the required condition (<2.5) only by one method [34]. This indicated the necessity of measuring the height on ground as uncertainty is very well present in the calculation when using dual polarization backscattering information for height estimation.
Here, θ was the incidence angle, K = 2π/λ and H r m s = average values of surface roughness. λ was wavelength of Sentinel-1 observation = 5.54 cm for this study. The surface roughness   H r m s was derived using Equations (5) and (6).
The Normalized Difference Vegetation Index (NDVI) of the study area was calculated using the Landsat-8 data of 23 September 2022 using Equation (7). These were resampled to 10 m for purpose of analysis.
N D V I = N I R S R V R S R N I R S R + V R S R
where, N I R S R   a n d   V R S R were Surface Reflectance values of Near Infra-Red band and Visible Red band.
The model proposes a set of equations to simulate the backscatter coefficients (in linear scale) for HH and VV polarized observations as mentioned in Equations (8) and (9) [32]. For this study, Equation (9) has been considered as our observation engaged VV polarization.
σ 0 H H = 10 2.75 c o s 1.5 θ s i n 5 θ 10 0.028 ε r t a n θ K . H r m s . s i n θ 1.4 λ 0.7
σ 0 V V = 10 2.35 c o s 3 θ s i n 3 θ 10 0.046 ε r t a n θ K . H r m s . s i n θ 1.1 λ 0.7
Here, θ is the incident angle in radians, ε r is the real part of the dielectric constant, H r m s is the roughness of the surface in cm, K   is wave number = 2π/λ. The inverse solution of the Dubois as shown in Equation (10) has been used to find the dielectric constant in our study with VV polarization [32].
ε r = 1 0.046 t a n θ l o g 10 10 2.35 ( s i n θ ) 3 σ 0 V V c o s θ 3 λ 0.7 K . H r m s . s i n θ 1.1
Finally, the volumetric soil moisture was derived using Equation (11) proposed in [32,37].
S M = 5.3 10 2 + 2.92 10 2 ε r 5.5 10 4 ε r 2 + 4.3 10 6 ε r 3

4.6. Error Calculation

The values of the measured soil moisture were tested against the model predicted results with Root Mean Square Error (RMSE) using Equation (12)-
R M S E = 1 N i = 1 n Y m e a s u r e d Y p r e d i c t e d 2

5. Results

Soil moisture collected in the field on the two days was tested for normality and basic statistics. It can be seen in Figure 4, that the p value of the data > [α = (0.05)] for the Kolmogorov-Smirnov test does not reject the null hypothesis and the data are from a normally distributed population.
The preliminary statistical analyses have shown that minimum and the maximum values of volumetric soil moisture measured were 1.1% and 35.4% with a mean of 12.8 and standard deviation of 7.04 (Table 3).

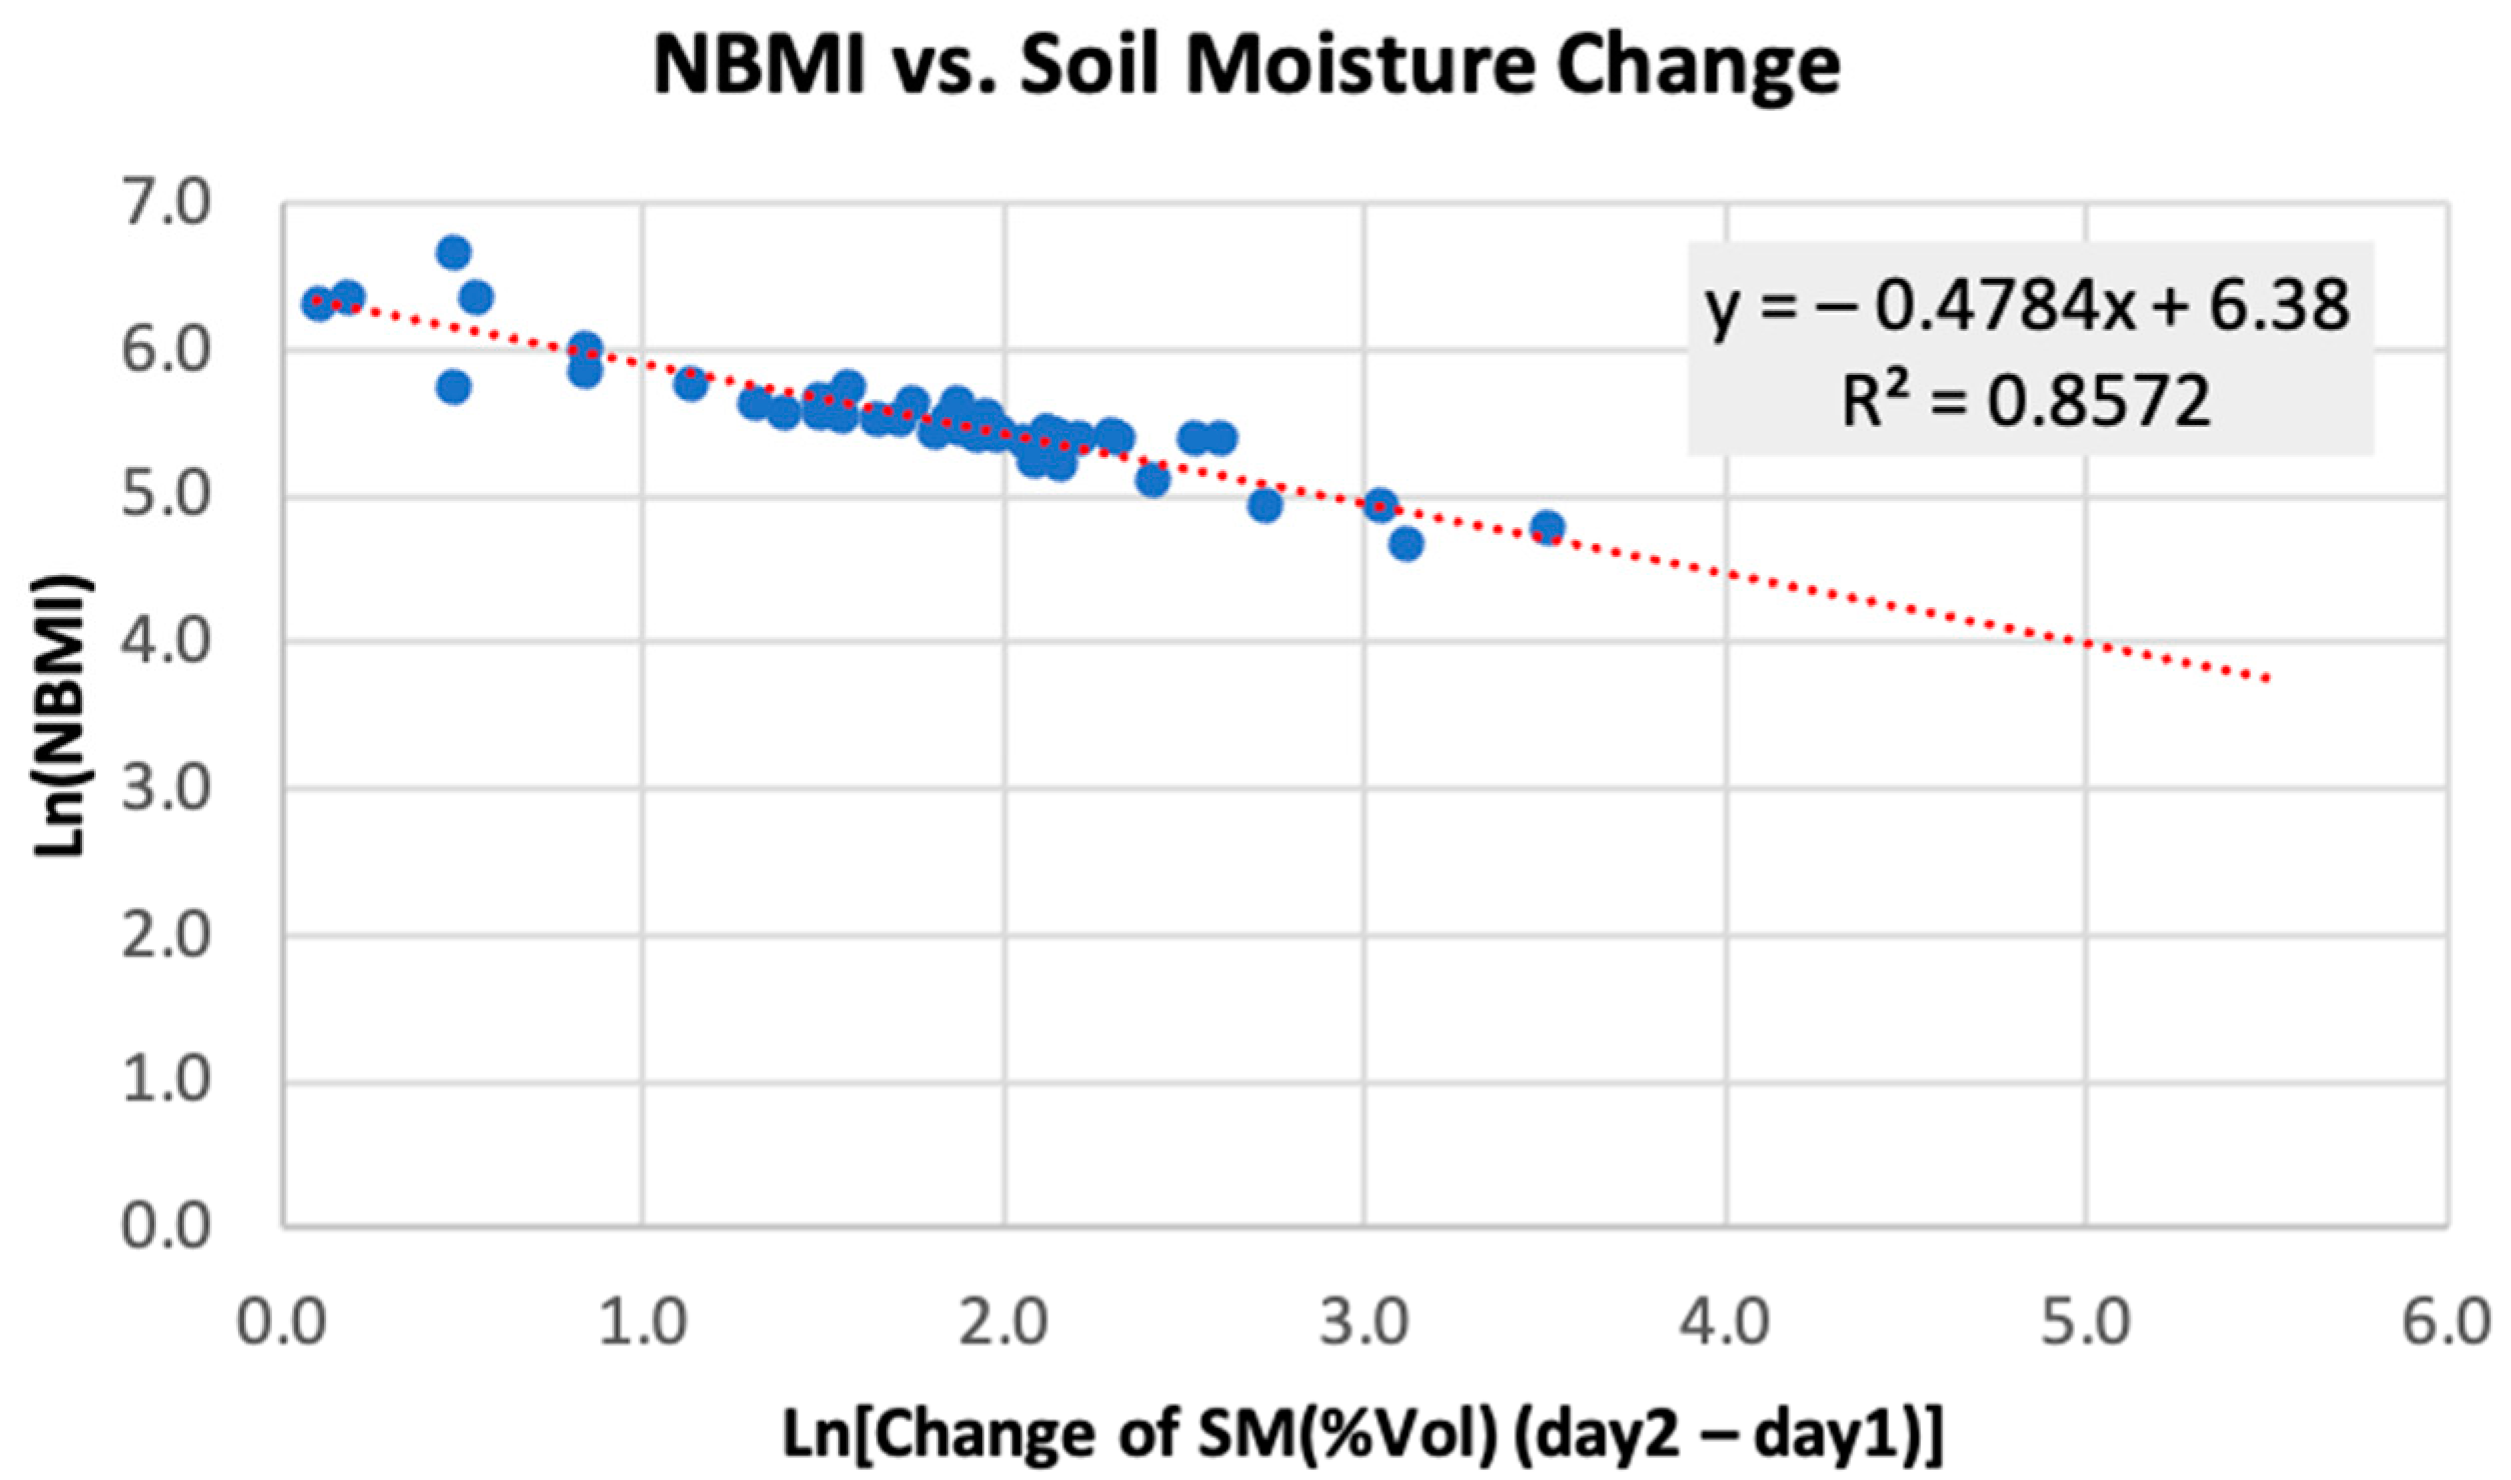
5.1. Co-Relation and Sensitivity Analyses

The measured values of volumetric Soil Moisture (Vol%) were studied for their sensitivity with the radar backscatter values in both the polarizations. It was observed the VV polarization was slightly better in this with the individual R 2   value of 48% as shown in Figure 5.

5.2. Result of NBMI

For all the values bigger than zero in X-axis, the NBMI has been able to represent a significant relationship with the change of soil moisture between day2 and day1 as shown by the scatterplot on a logarithmic scale in the (Figure 6). It shows a correlation coefficient close to 86% in the VV polarization in the form of the Equation (13).
ln N B M I = 6.380 0.4784 ln c h a n g e   o f   S M   V o l %   f r o m   d a y   2   t o   d a y 1

5.3. Result of MLR

The MLR tried to establish a relationship of soil moisture as dependent variable with other parameters of as described in Equation (4). To reduce the uncertainty in MLR model, we have normalized the independent variables. This way it is easier to understand the relative influence of each independent variable over dependent variable. It was found that both the incidence angle and the surface roughness had a negative relationship with the soil moisture while the backscattering was having a positive relationship in case of co-polarized data (VV). MLR has given the best R 2   value as 54.57%, while the 5-fold cross validation gave R 2   as 49.97%. The model is shown in Equation (14) with the Regression Equation.
S M = 11.10 + 26.34 σ 0 d B 8.20   θ 7.84 H r m s

5.4. Result of Dubois Model

The output of the Dubois model was plotted against the measured values of soil moisture and it is shown in (Figure 7) for VV polarization. The model result has shown a poor R 2 value of 44.3% with a higher RMSE of 17.10.
This behavior is strongly suspected to be caused by poor surface roughness measurements that need significant correction which can be carried out using ground measurement techniques such as pin profiling or lidar surveys.

6. Discussion

As mentioned earlier, soil moisture was observed on two different dates corresponding to satellite passes over the same set of points on the ground using the same technique 12 days apart. The roughness of the field was preserved and the vegetation scenario too did not change much during the time. Therefore, it could be assumed that any change in soil moisture was likely due to a change in dielectric constant due to precipitation on the day before the second day observation. The use of index-based method to see this relative change of soil moisture was a justification for this study. The sensitivity of the radar signal to soil moisture is demonstrated in numerous studies as a function of various target parameters [38,39] and radar configurations [12,40,41,42,43]. Studies have shown that over bare soil, X band is comparatively more sensitive in HH polarization and a relative lower incidence angle [44,45]. Investigating the same in C-band Sentinel-1 SAR data was one of the goals of this work. Like other studies it has shown that sensitivity to soil moisture in C-band is approximately the same as in L-band but less than X band [44,46] and inversely dependently on the incidence angle [47,48,49]. The initial analysis of sensitivity at C band shows that the VV polarization has a higher correlation with the radar backscatter demonstrating that VV in Sentinel-1 has greater potential for soil moisture estimation than VH. This finding supports another research in the field [32,50].
The results have shown that NBMI has given a better correlation than the other methods. This can be used to understand the change of SM condition simply by obtaining the backscatter values without a ground measurement of roughness in a condition like this. At the same time the study highlights the effect of roughness on the absolute measurement of soil moisture using Dubois model which is of utmost importance and the scope remains for a quick and accurate measurement technique for retrieval of absolute values of soil moisture [51]. This study has shown that a possibility of detecting soil moisture change without knowing the actual surface roughness which is the case in most of the remote areas where slow onsetting disaster happens, can be achieved in a similar ground condition.

Author Contributions

Conceptualization, A.B. and M.N.; Methodology, A.B.; Validation, A.B.; Formal analysis, A.B. and V.K.; Data curation, A.B. and V.K.; Writing—original draft preparation, A.B. and V.K.; Writing—review & editing, A.B., M.N., V.K., D.I. and T.E.; Supervision, M.N.; Funding acquisition, M.N. All authors have read and agreed to the published version of the manuscript.

Funding

This work was supported by Council for Science, Technology and Innovation (CSTI), Cross-ministerial Strategic Innovation Promotion Program (SIP), Enhancement of National Resilience against Natural Disasters (Funding agency: National Research Institute for Earth Science and Disaster Prevention (NIED)).

Data Availability Statement

Data will be provided upon request.

Acknowledgments

The authors are thankful to the Copernicus Programme of the European Space Agency and Alaska Satellite Facility for freely providing the Sentinel-1 data.

Conflicts of Interest

The authors declare no conflict of interest.

References

  1. Hohenbrink, T.L.; Lischeid, G.; Schindler, U.; Hufnagel, J. Disentangling the Effects of Land Management and Soil Heterogeneity on Soil Moisture Dynamics. Vadose Zone J. 2016, 15, 1–12. [Google Scholar]
  2. Chatterjee, S.; Desai, A.R.; Zhu, J.; Townsend, P.A.; Huang, J. Soil Moisture as an Essential Component for Delineating and Forecasting Agricultural Rather than Meteorological Drought. Remote Sens. Environ. 2022, 269, 112833. [Google Scholar] [CrossRef]
  3. Wasko, C.; Nathan, R. Influence of Changes in Rainfall and Soil Moisture on Trends in Flooding. J. Hydrol. 2019, 575, 432–441. [Google Scholar] [CrossRef]
  4. Zhao, B.; Dai, Q.; Zhuo, L.; Zhu, S.; Shen, Q.; Han, D. Assessing the Potential of Different Satellite Soil Moisture Products in Landslide Hazard Assessment. Remote Sens. Environ. 2021, 264, 112583. [Google Scholar] [CrossRef]
  5. Abraham, M.T.; Satyam, N.; Rosi, A.; Pradhan, B.; Segoni, S. Usage of Antecedent Soil Moisture for Improving the Performance of Rainfall Thresholds for Landslide Early Warning. Catena 2021, 200, 105147. [Google Scholar] [CrossRef]
  6. Li, Z.-L.; Leng, P.; Zhou, C.; Chen, K.-S.; Zhou, F.-C.; Shang, G.-F. Soil Moisture Retrieval from Remote Sensing Measurements: Current Knowledge and Directions for the Future. Earth Sci. Rev. 2021, 218, 103673. [Google Scholar] [CrossRef]
  7. Shoshany, M.; Svoray, T.; Curran, P.; Foody, G.M.; Perevolotsky, A. The Relationship between ERS-2 SAR Backscatter and Soil Moisture: Generalization from a Humid to Semi-Arid Transect. Int. J. Remote Sens. 2000, 21, 2337–2343. [Google Scholar] [CrossRef]
  8. Svoray, T.; Shoshany, M. Multi-Scale Analysis of Intrinsic Soil Factors from SAR-Based Mapping of Drying Rates. Remote Sens. Environ. 2004, 92, 233–246. [Google Scholar] [CrossRef]
  9. Wang, L.; Qu, J.; Zhang, S.; Hao, X.; Dasgupta, S. Soil Moisture Estimation Using MODIS and Ground Measurements in Eastern China. Int. J. Remote Sens. 2007, 28, 1413–1418. [Google Scholar] [CrossRef]
  10. Zhuo, L.; Han, D. The Relevance of Soil Moisture by Remote Sensing and Hydrological Modelling. Procedia Eng. 2016, 154, 1368–1375. [Google Scholar] [CrossRef] [Green Version]
  11. Ahmed, A.; Zhang, Y.; Nichols, S. Review and Evaluation of Remote Sensing Methods for Soil-Moisture Estimation. SPIE Rev. 2011, 2, 028001. [Google Scholar]
  12. Das, K.; Paul, P.K. Present Status of Soil Moisture Estimation by Microwave Remote Sensing. Cogent Geosci. 2015, 1, 1084669. [Google Scholar] [CrossRef]
  13. Peng, J.; Loew, A. Recent Advances in Soil Moisture Estimation from Remote Sensing. Water 2017, 9, 530. [Google Scholar] [CrossRef] [Green Version]
  14. Walker, J.P.; Troch, P.A.; Mancini, M.; Willgoose, G.R.; Kalma, J.D. Profile Soil Moisture Estimation Using the Modified IEM. In Proceedings of the IGARSS’97—1997 IEEE International Geoscience and Remote Sensing Symposium Proceedings, Remote Sensing—A Scientific Vision for Sustainable Development, Singapore, 3–8 August 1997; Volume 3, pp. 1263–1265. [Google Scholar]
  15. Gillies, R.; Kustas, W.; Humes, K. A Verification of the’triangle’method for Obtaining Surface Soil Water Content and Energy Fluxes from Remote Measurements of the Normalized Difference Vegetation Index (NDVI) and Surface e. Int. J. Remote Sens. 1997, 18, 3145–3166. [Google Scholar] [CrossRef]
  16. Kumar, D.; Shekhar, S. Statistical Analysis of Land Surface Temperature–Vegetation Indexes Relationship through Thermal Remote Sensing. Ecotoxicol. Environ. Saf. 2015, 121, 39–44. [Google Scholar] [CrossRef] [PubMed]
  17. Sandholt, I.; Rasmussen, K.; Andersen, J. A Simple Interpretation of the Surface Temperature/Vegetation Index Space for Assessment of Surface Moisture Status. Remote Sens. Environ. 2002, 79, 213–224. [Google Scholar] [CrossRef]
  18. Lei, S.; Bian, Z.; Daniels, J.L.; Liu, D. Improved Spatial Resolution in Soil Moisture Retrieval at Arid Mining Area Using Apparent Thermal Inertia. Trans. Nonferrous Met. Soc. China 2014, 24, 1866–1873. [Google Scholar] [CrossRef]
  19. Mohamed, E.; Ali, A.; El-Shirbeny, M.; Abutaleb, K.; Shaddad, S.M. Mapping Soil Moisture and Their Correlation with Crop Pattern Using Remotely Sensed Data in Arid Region. Egypt. J. Remote Sens. Space Sci. 2020, 23, 347–353. [Google Scholar] [CrossRef]
  20. Sahaar, S.A.; Niemann, J.D.; Elhaddad, A. Using Regional Characteristics to Improve Uncalibrated Estimation of Rootzone Soil Moisture from Optical/Thermal Remote-Sensing. Remote Sens. Environ. 2022, 273, 112982. [Google Scholar] [CrossRef]
  21. Hasan, S.; Montzka, C.; Rüdiger, C.; Ali, M.; Bogena, H.R.; Vereecken, H. Soil Moisture Retrieval from Airborne L-Band Passive Microwave Using High Resolution Multispectral Data. ISPRS J. Photogramm. Remote Sens. 2014, 91, 59–71. [Google Scholar] [CrossRef]
  22. Liu, Y.Y.; Dorigo, W.A.; Parinussa, R.; de Jeu, R.A.; Wagner, W.; McCabe, M.F.; Evans, J.; Van Dijk, A. Trend-Preserving Blending of Passive and Active Microwave Soil Moisture Retrievals. Remote Sens. Environ. 2012, 123, 280–297. [Google Scholar] [CrossRef]
  23. Akbar, R.; Das, N.; Entekhabi, D.; Moghaddam, M. Active and Passive Microwave Remote Sensing Synergy for Soil Moisture Estimation. In Satellite Soil Moisture Retrieval; Elsevier: Amsterdam, The Netherlands, 2016; pp. 187–207. [Google Scholar]
  24. Oh, Y.; Sarabandi, K.; Ulaby, F.T. Semi-Empirical Model of the Ensemble-Averaged Differential Mueller Matrix for Microwave Backscattering from Bare Soil Surfaces. IEEE Trans. Geosci. Remote Sens. 2002, 40, 1348–1355. [Google Scholar] [CrossRef] [Green Version]
  25. Oh, Y.; Sarabandi, K.; Ulaby, F.T. An Inversion Algorithm for Retrieving Soil Moisture and Surface Roughness from Polarimetric Radar Observation. In Proceedings of the IGARSS ’94—1994 IEEE International Geoscience and Remote Sensing Symposium, Pasadena, CA, USA, 8–12 August 1994; Volume 3, pp. 1582–1584. [Google Scholar]
  26. Oh, Y.; Sarabandi, K.; Ulaby, F.T. An Empirical Model and an Inversion Technique for Radar Scattering from Bare Soil Surfaces. IEEE Trans. Geosci. Remote Sens. 1992, 30, 370–381. [Google Scholar] [CrossRef]
  27. Oh, Y.; Kay, Y.C. Condition for Precise Measurement of Soil Surface Roughness. IEEE Trans. Geosci. Remote Sens. 1998, 36, 691–695. [Google Scholar]
  28. Oh, Y. Quantitative Retrieval of Soil Moisture Content and Surface Roughness from Multipolarized Radar Observations of Bare Soil Surfaces. IEEE Trans. Geosci. Remote Sens. 2004, 42, 596–601. [Google Scholar] [CrossRef]
  29. Dubois, P.C.; Van Zyl, J.; Engman, T. Measuring Soil Moisture with Imaging Radars. IEEE Trans. Geosci. Remote Sens. 1995, 33, 915–926. [Google Scholar] [CrossRef] [Green Version]
  30. Acharya, U.; Daigh, A.L.; Oduor, P.G. Soil Moisture Mapping with Moisture-Related Indices, OPTRAM, and an Integrated Random Forest-OPTRAM Algorithm from Landsat 8 Images. Remote Sens. 2022, 14, 3801. [Google Scholar] [CrossRef]
  31. Hunt, E.D.; Hubbard, K.G.; Wilhite, D.A.; Arkebauer, T.J.; Dutcher, A.L. The Development and Evaluation of a Soil Moisture Index. Int. J. Climatol. J. R. Meteorol. Soc. 2009, 29, 747–759. [Google Scholar] [CrossRef]
  32. Sekertekin, A.; Marangoz, A.M.; Abdikan, S. ALOS-2 and Sentinel-1 SAR Data Sensitivity Analysis to Surface Soil Moisture over Bare and Vegetated Agricultural Fields. Comput. Electron. Agric. 2020, 171, 105303. [Google Scholar] [CrossRef]
  33. Dobson, M.C.; Ulaby, F. Microwave Backscatter Dependence on Surface Roughness, Soil Moisture, And Soil Texture: Part III-Soil Tension. IEEE Trans. Geosci. Remote Sens. 1981, GE-19, 51–61. [Google Scholar] [CrossRef]
  34. Rao, S.S.; Kumar, S.D.; Das, S.N.; Nagaraju, M.S.S.; Venugopal, M.V.; Rajankar, P.; Laghate, P.; Reddy, M.S.; Joshi, A.K.; Sharma, J.R. Modified Dubois Model for Estimating Soil Moisture with Dual Polarized SAR Data. J. Indian Soc. Remote Sens. 2013, 41, 865–872. [Google Scholar]
  35. Srivastava, H.; Patel, P.; Navalgund, R.; Sharma, Y. Retrieval of Surface Roughness Using Multi-Polarized Envisat-1 ASAR Data. Geocarto Int. 2008, 23, 67–77. [Google Scholar] [CrossRef]
  36. Singh, A.; Gaurav, K.; Meena, G.K.; Kumar, S. Estimation of Soil Moisture Applying Modified Dubois Model to Sentinel-1; a Regional Study from Central India. Remote Sens. 2020, 12, 2266. [Google Scholar] [CrossRef]
  37. Topp, G.C.; Davis, J.; Annan, A.P. Electromagnetic Determination of Soil Water Content: Measurements in Coaxial Transmission Lines. Water Resour. Res. 1980, 16, 574–582. [Google Scholar] [CrossRef] [Green Version]
  38. Pierdicca, N.; Pulvirenti, L.; Ticconi, F.; Brogioni, M. Radar Bistatic Configurations for Soil Moisture Retrieval: A Simulation Study. IEEE Trans. Geosci. Remote Sens. 2008, 46, 3252–3264. [Google Scholar] [CrossRef]
  39. Ulaby, F.T.; Batlivala, P.P.; Dobson, M.C. Microwave Backscatter Dependence on Surface Roughness, Soil Moisture, and Soil Texture: Part I-Bare Soil. IEEE Trans. Geosci. Electron. 1978, 16, 286–295. [Google Scholar] [CrossRef]
  40. Choker, M.; Baghdadi, N.; Zribi, M.; El Hajj, M.; Paloscia, S.; Verhoest, N.E.; Lievens, H.; Mattia, F. Evaluation of the Oh, Dubois and IEM Backscatter Models Using a Large Dataset of SAR Data and Experimental Soil Measurements. Water 2017, 9, 38. [Google Scholar] [CrossRef]
  41. Baghdadi, N.; Aubert, M.; Cerdan, O.; Franchistéguy, L.; Viel, C.; Martin, E.; Zribi, M.; Desprats, J.F. Operational Mapping of Soil Moisture Using Synthetic Aperture Radar Data: Application to the Touch Basin (France). Sensors 2007, 7, 2458–2483. [Google Scholar] [CrossRef] [PubMed]
  42. Baghdadi, N.N.; El Hajj, M.; Zribi, M.; Fayad, I. Coupling SAR C-Band and Optical Data for Soil Moisture and Leaf Area Index Retrieval over Irrigated Grasslands. IEEE J. Sel. Top. Appl. Earth Obs. Remote Sens. 2015, 9, 1229–1243. [Google Scholar] [CrossRef] [Green Version]
  43. Aubert, M.; Baghdadi, N.; Zribi, M.; Douaoui, A.; Loumagne, C.; Baup, F.; El Hajj, M.; Garrigues, S. Analysis of TerraSAR-X Data Sensitivity to Bare Soil Moisture, Roughness, Composition and Soil Crust. Remote Sens. Environ. 2011, 115, 1801–1810. [Google Scholar] [CrossRef] [Green Version]
  44. Choker, M. Estimation of Surface Roughness over Bare Agricultural Soil from Sentinel-1 Data. Ph.D. Thesis, AgroParisTech, Paris, France, 2018. [Google Scholar]
  45. Anguela, T.P.; Zribi, M.; Baghdadi, N.; Loumagne, C. Analysis of Local Variation of Soil Surface Parameters with TerraSAR-X Radar Data over Bare Agricultural Fields. IEEE Trans. Geosci. Remote Sens. 2009, 48, 874–881. [Google Scholar] [CrossRef]
  46. Narvekar, P.S.; Entekhabi, D.; Kim, S.-B.; Njoku, E.G. Soil Moisture Retrieval Using L-Band Radar Observations. IEEE Trans. Geosci. Remote Sens. 2015, 53, 3492–3506. [Google Scholar] [CrossRef]
  47. Baghdadi, N.; Zribi, M.; Loumagne, C.; Ansart, P.; Anguela, T.P. Analysis of TerraSAR-X Data and Their Sensitivity to Soil Surface Parameters over Bare Agricultural Fields. Remote Sens. Environ. 2008, 112, 4370–4379. [Google Scholar] [CrossRef] [Green Version]
  48. Palmisano, D.; Mattia, F.; Balenzano, A.; Satalino, G.; Pierdicca, N.; Guarnieri, A.V.M. Sentinel-1 Sensitivity to Soil Moisture at High Incidence Angle and the Impact on Retrieval over Seasonal Crops. IEEE Trans. Geosci. Remote Sens. 2020, 59, 7308–7321. [Google Scholar] [CrossRef]
  49. Fung, A.K. Microwave Scattering and Emission Models and Their Applications; Artech House: Norwood, MA, USA, 1994. [Google Scholar]
  50. Abdikan, S.; Sekertekin, A.; Madenoglu, S.; Ozcan, H.; Peker, M.; Pinar, M.O.; Koc, A.; Akgul, S.; Secmen, H.; Kececi, M. Surface Soil Moisture Estimation from Multi-Frequency SAR Images Using ANN and Experimental Data on a Semi-Arid Environment Region in Konya, Turkey. Soil Tillage Res. 2023, 228, 105646. [Google Scholar] [CrossRef]
  51. Neusch, T.; Sties, M. Application of the Dubois-Model Using Experimental Synthetic Aperture Radar Data for the Determination of Soil Moisture and Surface Roughness. ISPRS J. Photogramm. Remote Sens. 1999, 54, 273–278. [Google Scholar] [CrossRef]
Figure 1. The overview of the study area where A and B shows the location of the study area in the country and in the prefecture respectively and C is the location of the observation points.
Land 12 00506 g001
Figure 2. Soil moisture measurement on ground.
Land 12 00506 g002
Figure 3. Schematic diagram of the whole methodology and workflow.
Land 12 00506 g003
Figure 4. Normality plot of the measured soil moisture data.
Land 12 00506 g004
Figure 5. Correlation of the soil moisture with radar backscatter.
Land 12 00506 g005
Figure 6. Scatterplot of change of soil moisture (Vol%) and NBMI on a logarithmic scale.
Land 12 00506 g006
Figure 7. Scatterplot of measured and predicted values of soil moisture by Dubois Inverse Solution.
Land 12 00506 g007
Table 1. Details of the Sentinel-1 observation.
SatelliteObs. DateLocal TimeAcquisition ModePassPolarizationAntenna LookProduct
Sentinel 1A16 September 202221:16:58IWDescendingVH/VVRightGRD
Sentinel 1A28 September 202221:16:58IWDescendingVH/VVRightGRD
Table 2. Prerequisite parameters for best results by Dubois model.
VariablesRequired (for Best Results)Achieved
K H r m s (cm)<2.53.18 and 2.31
NDVI<0.40.131
θ 30 ° < θ < 65 ° 38.210 °
Frequency (f) ( 1.5 < f < 11 ) G H z 5.405 GHz
VH/VV<10.222
Table 3. Basic statistics of the field value of soil moisture.
VariableNMeanSt DevMin.Max.Range
SM (Vol%)9412.87.041.135.434.3
Disclaimer/Publisher’s Note: The statements, opinions and data contained in all publications are solely those of the individual author(s) and contributor(s) and not of MDPI and/or the editor(s). MDPI and/or the editor(s) disclaim responsibility for any injury to people or property resulting from any ideas, methods, instructions or products referred to in the content.

