Article

Analysis of Anthropogenic Disturbances of Green Spaces along an Urban–Rural Gradient of the City of Bujumbura (Burundi)

by
Henri Kabanyegeye
1,2,
Yannick Useni Sikuzani
3,
Kouagou Raoul Sambieni
4,5,
Didier Mbarushimana
6,
Tatien Masharabu
1 and
Jan Bogaert
2,*
1
Research Centre for Natural and Environmental Sciences, University of Burundi, Bujumbura P.O. Box 2700, Burundi
2
Gembloux Agro-Bio Tech, University of Liège, Passage des Déportés 2, 5030 Gembloux, Belgium
3
Ecology, Ecological Restoration and Landscape Research Unit, Faculty of Agricultural Sciences, University of Lubumbashi, Lubumbashi P.O. Box 1825, Congo
4
Regional Post-Graduate Training School on Integrated Management of Tropical Forests and Lands (ERAIFT), Kinshasa P.O. Box 15373, Congo
5
Faculty of Architecture, University of Lubumbashi, Lubumbashi P.O. Box 1825, Congo
6
Burundian Office for Environmental Protection, Bujumbura P.O. Box 2757, Burundi
*
Author to whom correspondence should be addressed.
Land 2023, 12(2), 465; https://doi.org/10.3390/land12020465
Submission received: 13 December 2022 / Revised: 2 February 2023 / Accepted: 3 February 2023 / Published: 12 February 2023
(This article belongs to the Special Issue Urban Ecosystem Services III)

Abstract

:
Bujumbura city has diversified but unevenly distributed green spaces. The typology and anthropogenic disturbances of these green spaces are still unknown. This study presents a typology of green spaces along the urban–rural gradient through a literature review. It assesses the presence of anthropogenic disturbances through inventories in 100 m × 100 m grids. Data reveal that Bujumbura’s green spaces are made up of green squares concentrated exclusively in urban areas, cemeteries present in peri-urban areas and sports green spaces observable all along the urbanization gradient. These green spaces are more exposed to trampling, which is more present in administrative entities with a peri-urban morphological status, as opposed to various constructions in administrative entities with an urban status. Finally, significative pairwise associations of anthropogenic disturbances were observed. The results show the need to protect these green spaces from all kinds of anthropogenic disturbances by raising the eco-responsible awareness of the population and the municipal authorities.

1. Introduction

Urbanization has become a global phenomenon as a result of the urban transition that started in the second half of the 20th century [1,2]. Indeed, in 1950, only 30% of the world’s population lived in urban areas, a proportion that has increased to 57% in 2021 [3]. Urbanized areas, which occupy nearly six million square kilometers, or 1.17% of the Earth’s surface, are expected to increase by more than one million square kilometers by 2030 [4].
In developing countries, particularly in Sub-Saharan Africa, urbanization is currently happening at a high speed due to the combined effects of rural–urban migration, natural population growth and civil wars [5]. In addition, this demographic explosion in urbanized areas takes place in a context of absence of planning that has prevailed since the 1950s [6]. The result is an accelerated urban spatial dynamic materialized through a dual process of densification of already built spaces and generally of an anarchic extension of the built environment in an area that conserves its rural characteristics, leading to the creation of urban and peri-urban areas, respectively [7,8]. This situation is not without environmental consequences.
Indeed, through uncontrolled urban spatial expansion, urbanization puts significant pressure on natural ecosystems through their fragmentation, leading to a regression of the green space coverage [9,10] and an alteration of their ecological functionality [8,11,12,13,14]. Yet, green spaces, considered as vegetated surfaces in urbanized environments, are essential in urbanized environments to mitigate several scourges, such as temperature increase, biodiversity loss, and degradation of social interactions, health conditions and the wellbeing of inhabitants [15,16,17,18]. However, the degree of influence of green spaces on the wellbeing of urban dwellers varies according to several criteria, such as the type of green space and the types and magnitudes of anthropogenic disturbances [19,20,21].
Several typologies of green spaces have been proposed based on function, ownership status and physical characteristics [22,23,24,25,26,27,28,29]. Other typologies have been based on the degree of naturalness by distinguishing between natural, rural and peri-urban green spaces [30]. However, these typologies focus rather on European and Asian cities, and rarely on African cities where the few existing typologies focus only on the city of Kumasi in Ghana [31] and the cities of Kinshasa [7] and Lubumbashi [12,13] in the Democratic Republic of the Congo. No typology, however, has a universal scope due to the high variability in environmental and urban planning contexts, a situation that makes it difficult to compare studies [32].
In African cities, green spaces in urbanized areas are subject to anthropogenic disturbances [8,13]. These disturbances are consequent to the observed gaps in their land tenure security, the uncooperative attitude of the general public, the low level of coordination among stakeholders involved in their management and the low priority given to them in the municipal budgets [33,34].
Bujumbura city, the political and economic capital of the Republic of Burundi, is not spared by this alarming trend since its spatial growth is marked by the densification of existing central neighborhoods, and by the progressive destruction of green spaces to install new habitats and other infrastructures such as roads and monuments [5,35]. In addition, housing estates are being created on the outskirts of the city without any overall plan or coherence in order to contain the constantly increasing demand for housing [5], amplifying the anthropogenic disturbance of the various residual green spaces in the city, which are unevenly distributed and whose ecological functionality is still poorly known [35]. It has recently been known that the recent green spaces typology of Bujumbura was only based on soil moisture (terra firma and wetland green spaces) and socio-economic factors (domestic garden) [36]. There is, on the one hand, a need for a more detailed typological analysis of the public green spaces of Bujumbura to improve and adapt their management. On the other hand, adapting the green spaces preservation measures is important to characterize the anthropogenic disturbances to which they are subjected, and which are assumed to act in a synergistic manner. However, considering the spatial pattern, the ecological functionalities and management of green spaces change according to the extent of urbanization [13], which is crucial to study green spaces within cities by considering separately urban and peri-urban areas.
Thus, the purpose of our study is based on three hypotheses: (i) the green spaces of Bujumbura city are not only less diversified in types but also more concentrated in the urban area due to the proximity of diverse public services involved in their management; (ii) due to building extension and modernization, the most important anthropogenic disturbances of the green spaces of the city of Bujumbura are constructions, which are present in zones with urban morphological status; (iii) there are associations of anthropogenic disturbances in the studied green spaces in the urban and peri-urban zones.

2. Materials and Methods
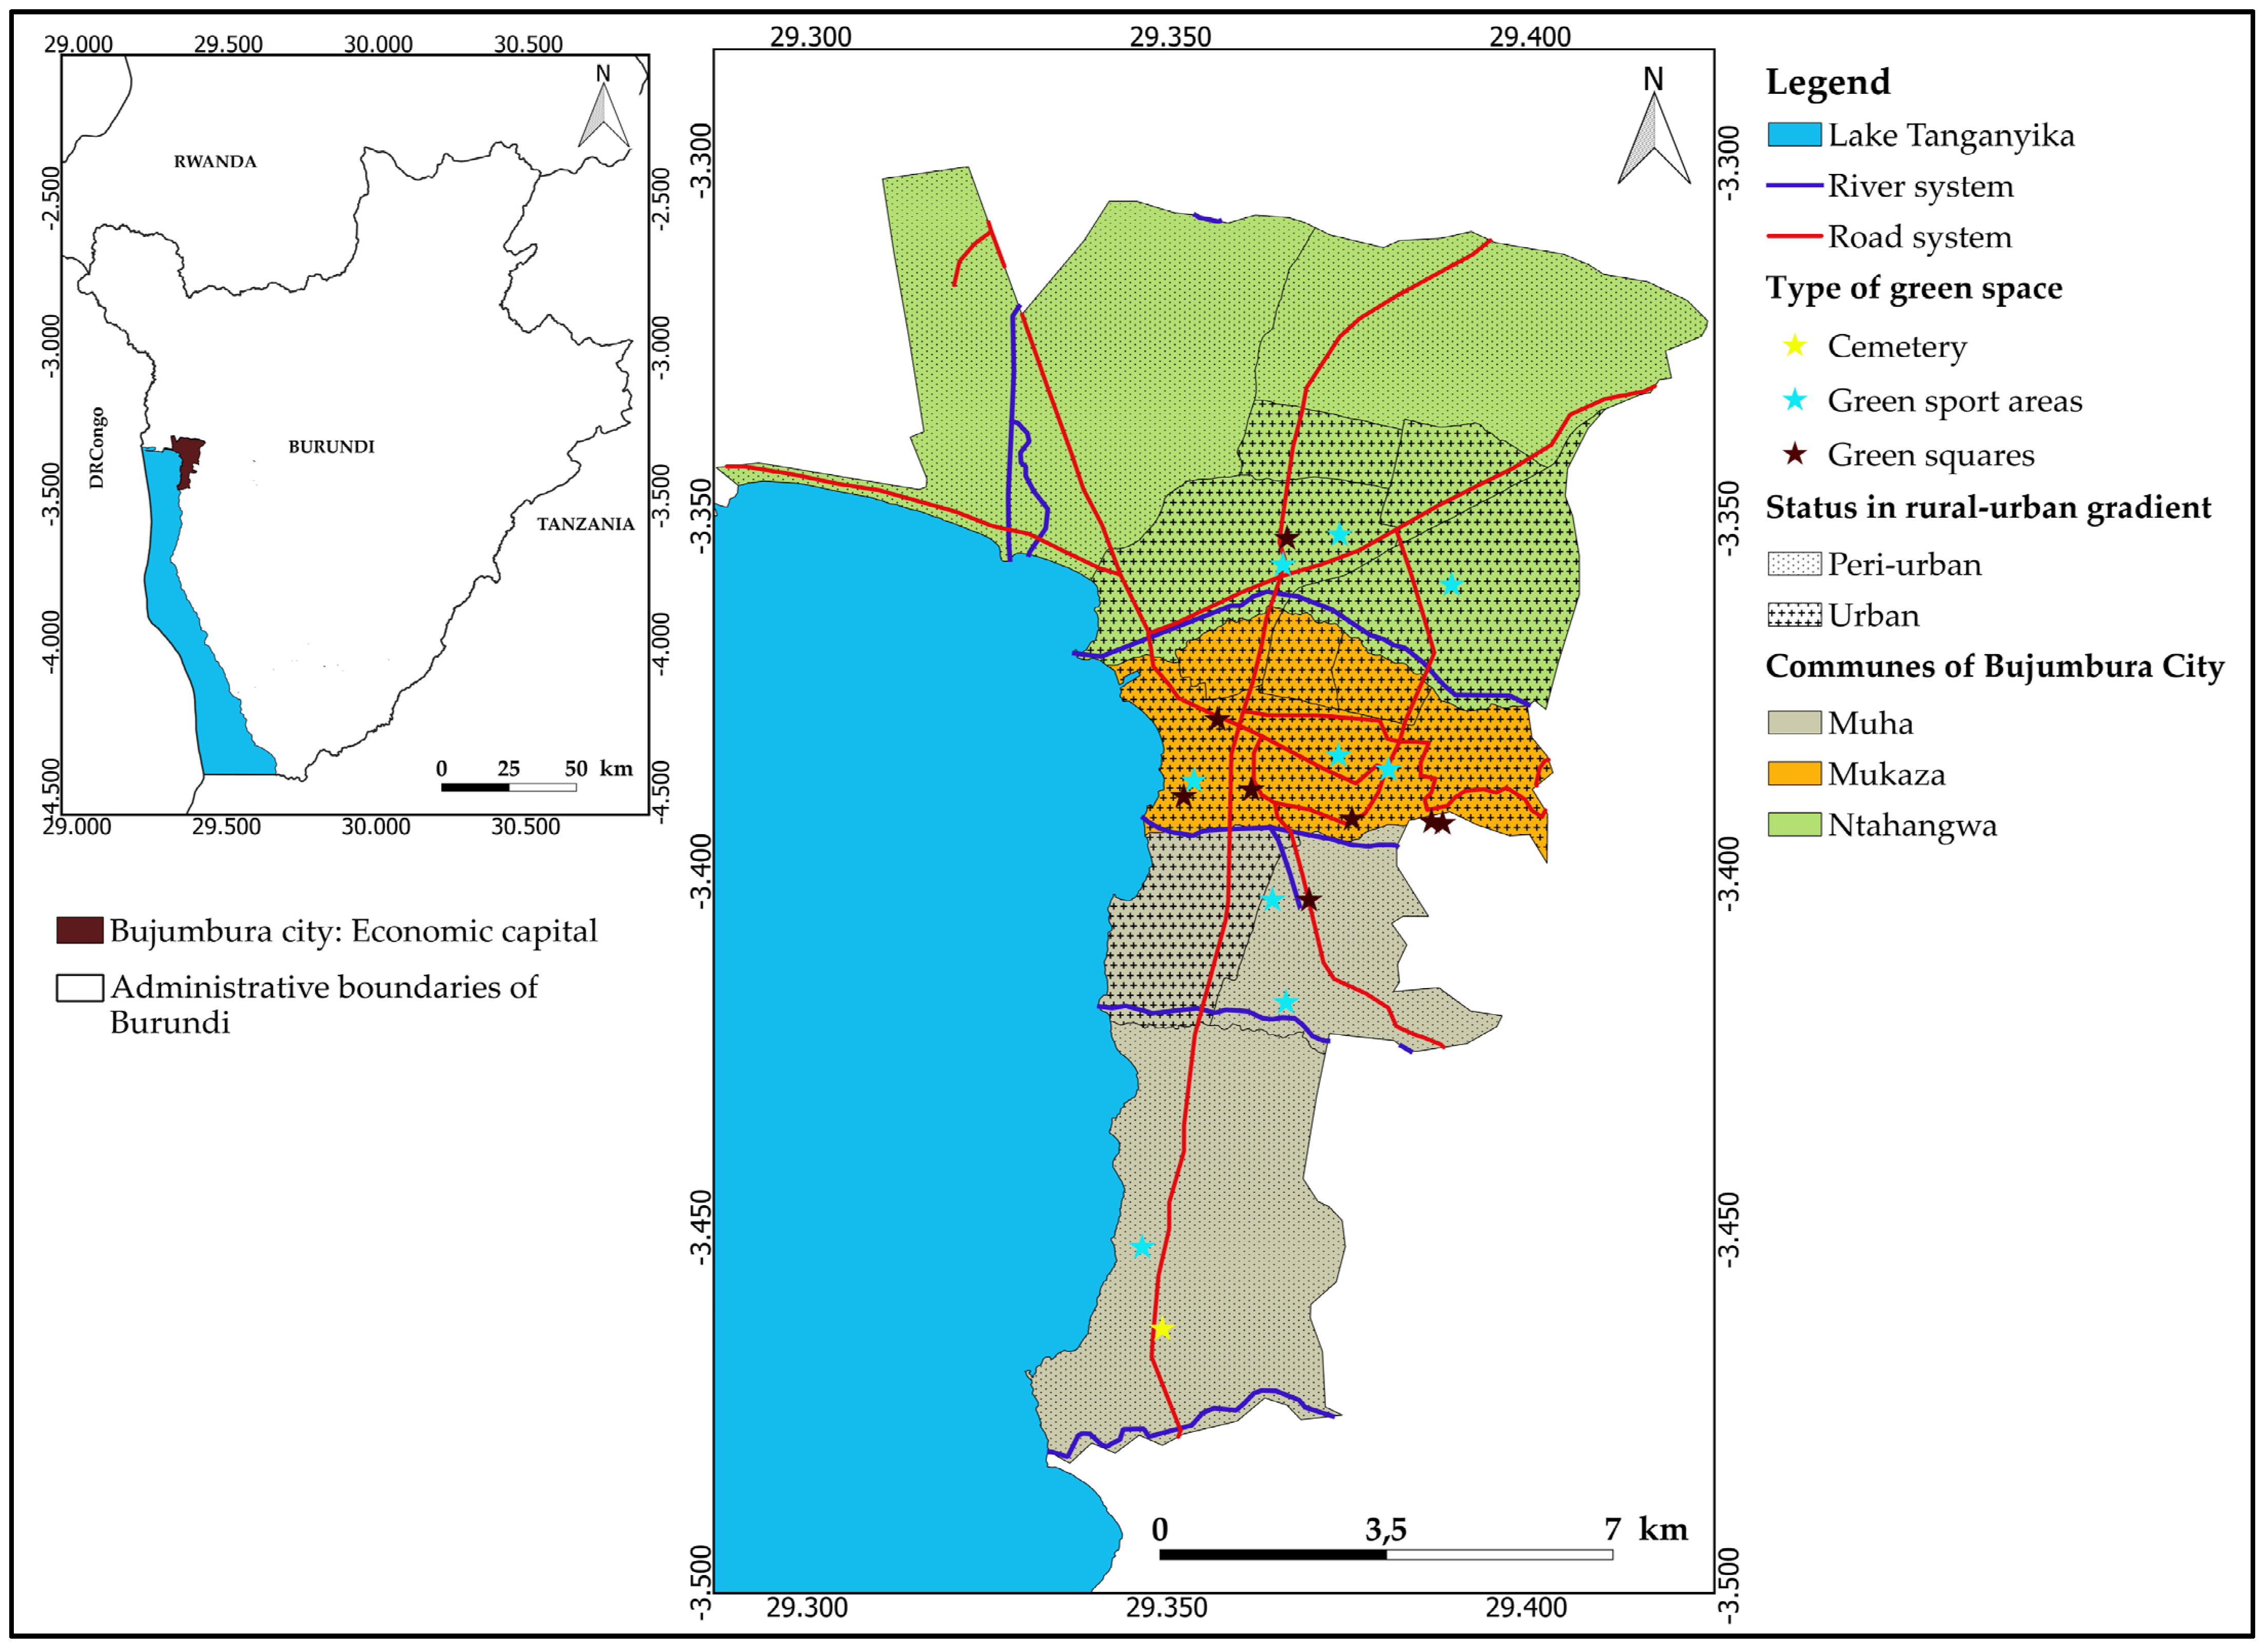
2.1. Study Area

The city of Bujumbura was created in 1897 on the borders of Tanganyika lake by the Germans on a site called Kajaga. Since then, it was known as the economic and political capital of the country until February 2019 [37]. Located in the western part of Burundi (Figure 1), between latitudes 3°30′ and 3°51′ S and longitudes 29°31′ and 29°42′ E, it covers an area of 10,462 hectares, whereas it was estimated at 30 hectares in 1907 [38]. It is administratively split into three communes (Muha, Mukaza and Ntahangwa) that cover thirteen administrative entities or urban zones. A municipality, whether urban or rural, is a decentralized territorial authority with legal personality and organic and financial autonomy [39]. A group of rural municipalities form a province; a group of urban municipalities compose a city. A rural municipality is subdivided into zones and census hills while the urban municipality is subdivided into zones and districts. Consequently, a zone is a deconcentrated district of the municipality, an intermediate between the municipality and the census hill or district.
The climate of Bujumbura is characterized by a dry season and a rainy season, each with two variations: the long dry season (June to mid-September), the short dry season (mid-December to mid-February), the long rainy season (mid-February to May) and the short rainy season (mid-September to December). The average annual temperature is above 23 °C with a total rainfall of between 800 and 1000 mm [40]. The relief is characterized by a plain that rises from west to east, with an average altitude of 820 m. Ntahangwa is the largest river flowing through the city. If clay soils dominate the north of this river, the south is dominated by sandy soils [35]. Water-logged or flooded during the rainy season, clay soils become very hard during the dry season and show shrinkage cracks. The natural vegetation of the region is savanna, miombo woodland and wetlands [41]. Miombo woodland is mainly dominated by trees of the genus Brachystegia and Uapaca. The undergrowth is very sparse and is dominated by grass species [42]. According to the phytogeographical classification of [43], Burundi is covered by two regional centers of endemism: the Afromontane region (an archipelago-like regional center of endemism) and the Lake Victoria Regional Mosaic. Bujumbura belongs to the Lake Victoria Regional Mosaic. The natural vegetation has almost disappeared in the Bujumbura region, except in the Rusizi Natural Reserve (5932 ha), located 15 km north of the city, and in Kibira National Park, the largest montane rain forest reserve of the country (40,000 ha), located less than 35 km to the northeast [36]. This is due, among other reasons, to the use of charcoal as the main energy source for the urban population of Bujumbura [44]. It has previously been demonstrated that, when studying the spontaneous vegetation in the city of Bujumbura, ruderal plant assemblages dominate in the most urbanized areas, while in the outskirts of the city, the vegetation shows similarities to natural plant assemblages in the region [41]. Fishing, industry, administration and urban agriculture are the main socio-economic activities carried out by the city’s population, estimated at 497,166 inhabitants in 2008 [45] and 792,504 inhabitants in 2022 [46]. In this city, urban agriculture has considerable importance. It is dominant in 50% of the urban territory that is not built. All food plants adapted to the soils and climate of the region are grown in these spaces (e.g., maize, cassava, soybeans, peanuts and vegetables), mainly for consumption at the household level. Cultivation of rice in the swamps northwest of the city (Kiyange and Carama) and cotton is an important source of income for urban farmers. Urban horticulture is also under development within this city, and it currently receives support (since November 2001) from the Burundian Ministry of Agriculture and the Food Agriculture Organization (FAO). It has been reported that the average number of children per household and the literacy rate were about 4.8 and 82.6%, respectively, in 2017 [47]. Traditional practitioners of Burundian medicine collect further plants from these wetlands and from terra firma vegetation to treat various diseases of humans and livestock [48].

2.2. Segmentation of the Urban–Rural Gradient Zones

In order to analyze the morphological status of the different administrative entities composing the city, Bujumbura was gridded by 698 square grids of 25 ha each, enabling the observation of urbanization morphology on Google Earth [49]. A flowchart based on the morphological characteristics of the different zones along the urban–rural gradient was used to qualify each of the sub-zones as urban or peri-urban [50]. Urban zones combine high densities and proportions of built-up zones as opposed to peri-urban zones that have some discontinuity of the built-up area at lower proportions [50]. In the context of Bujumbura (Figure 1), the zones with an urban morphological status area are characterized by popular neighborhoods and medium standing, very dense buildings and paved streets. Unfortunately, with houses that date from 1850 to 1983, they can have a small part with no marked roads. Zones with peri-urban morphological status are under development and generally not characterized by a clear road infrastructure. The older part of the peri-urban area consists of houses that date from 1983.

2.3. Data Collection

2.3.1. Green Space Sampling

To facilitate a parcel analysis [50], we first made a pre-identification on Google Earth of the green spaces that have a minimum surface of one hectare. These were identified in the field in November 2020, in a rather random and simple way by following the boulevards, pavements and avenues of the city [7,34,51,52]. The geographical coordinates of the sampled green spaces were mapped using Arc GIS 10.2 software (Figure 1).

2.3.2. Typological Analysis

The inventory focused on public green spaces without taking into account their management type. The literature review of existing green space inventories as well as the field observations allowed the establishment of an adapted typology.
In the absence of a single typology that covers all these particularities, we combined four existing typologies to characterize the green spaces of Bujumbura: (i) the typology of the Association of Engineers of the Cities of France (1995) described by [53], (ii) the typology of [22] in France, (iii) the typology implemented by [23] in Belgium and (iv) the typology used by [7] in the Democratic Republic of the Congo. Among the existing typologies, those of [7,13,31] were used in this study since they are adapted to the socio-ecological context of the city since they have the particularity of classifying green spaces on the land use.

2.3.3. Definition and Inventory of Anthropogenic Disturbances of Bujumbura’s Green Spaces and Their Indicators

Definitions of the types of anthropogenic disturbances and their indicators were developed prior to the fieldwork. They were based on exploratory observations and contacts with the population living close to the green spaces. Indeed, exchanges with local populations, through focus groups of 9 to 12 people, made it possible to identify and validate the types of anthropogenic disturbance. In total, ten focus groups were organized, as more than eight new indicators were no longer cited. Eight disturbance types were selected (Table 1) and their identification consisted of noting the presence or absence of the corresponding indicator(s) in each grid cell in which green spaces were identified. The size of the selected grid cells allowed for a parcel-based and sub-square kilometer analysis [50]. The number of grid cells for each green space depended on its area and shape. In total, 18 green spaces were identified. These green spaces were located in five administrative entities with different morphological statuses. A total of 14 green spaces, with 111 grid cells, were located in entities with urban morphological status. Four green spaces, located in two entities with peri-urban morphological status, were covered by 48 grid cells.
Based on the study of [54], the data analysis was based on the model which describes disturbance processes according to a set of characteristics; notably, type of disturbance (classification of events or observations), frequency (extent of the disturbance), the spatial structure of the disturbance (in this case the urban–rural gradient) and synergy (the interaction with other disturbances). Relative frequencies were calculated for each type of anthropogenic disturbance from the presence-absence data [54]. To test that the most important anthropogenic disturbances of the green spaces of the city of Bujumbura are constructions, mainly present in zones with urban morphological status, the Friedman test, an alternative procedure to the analysis of variance method for repeated measures [55,56], was performed under SPSS to compare the different types of disturbance in terms of their frequencies [53,57]. It allowed the comparison of more than two matched samples by determining whether the values of the samples were different from those of the other samples [55,58]. When the null hypothesis of the Friedman test, assuming there is no difference between the frequencies of occurrence of the eight disturbance types along the urbanization gradient, was rejected, post hoc tests were applied [55,56] to compare pairwise the different types of disturbance in order to identify those disturbances that would be different from each other in terms of frequency of occurrence. To verify the existence of associations of anthropogenic disturbances in the studied green spaces in the urban and peri-urban zones, a Chi-square test of independence was performed to assess the presence of positive or negative associations between disturbance types [49].

3. Results

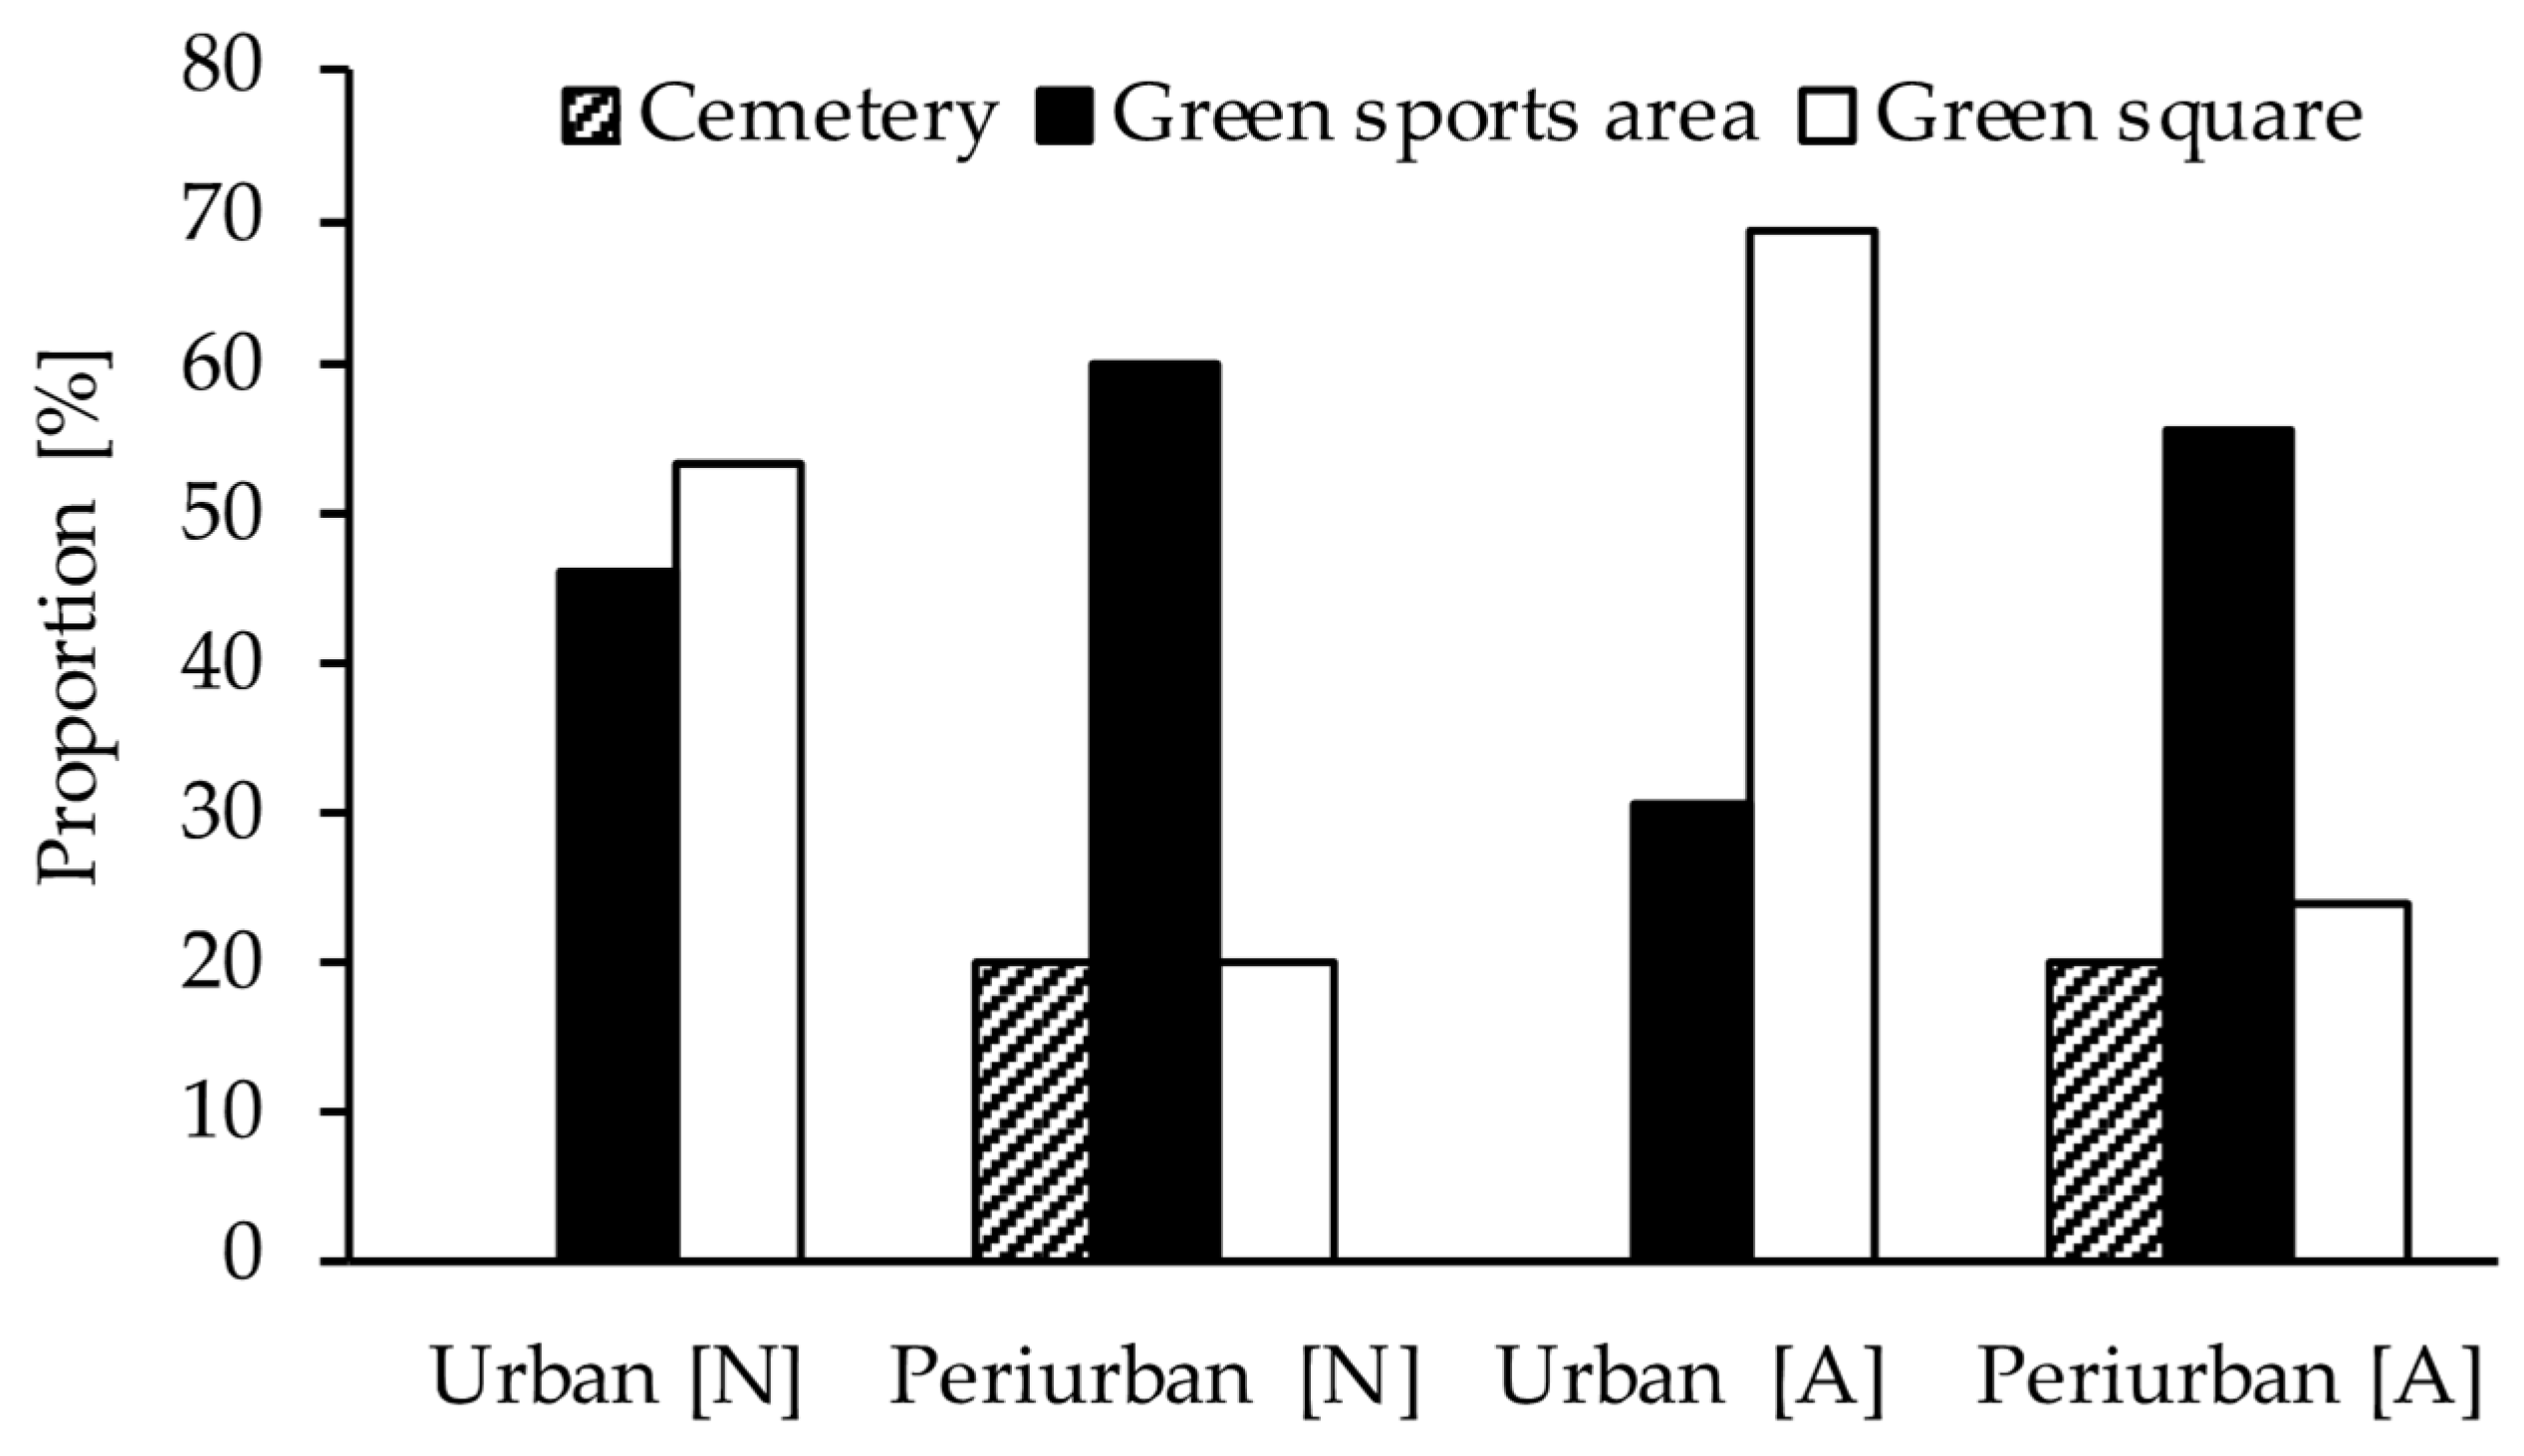
3.1. Typology of Green Spaces along the Urban–Rural Gradient of the City of Bujumbura

The literature review and the field observations revealed that the green spaces in Bujumbura are mainly made up of green sports areas (stadiums and sports centers), green spaces accompanying roads, green spaces accompanying public buildings (whose role is to enhance the building), green spaces accompanying industrial and commercial establishments, green spaces of social and educational establishments (gardens of nurseries, primary and secondary schools and universities), trees of alignment, green squares, cemeteries, traffic circles and nurseries. These green spaces can be grouped into three distinct types: green squares, green sports areas and cemeteries, and are rather small in size, only up to 20 hectares for the largest green space (Table 2).
In relation to the number of green spaces found in urban and peri-urban zones, cemeteries are absent in urban zones but present in peri-urban zones in small proportions (20.0%). Green sports areas are present in urban (46.2%) and peri-urban (60.0%) zones. Green squares are also present in urban (53.8%) and peri-urban zones (20.0%). Considering the importance of each type of green space as a proportion of the total area, cemeteries represent 20.2% in the zones with peri-urban morphological status, against 55.6% and 24.3% for green sports areas and green squares, respectively. In the zones with urban morphology, green squares dominate green sports areas (69.15% vs. 30.82%) while cemeteries are absent (Figure 2).

3.2. Types and Indicators of Disturbance of Green Spaces in Bujumbura

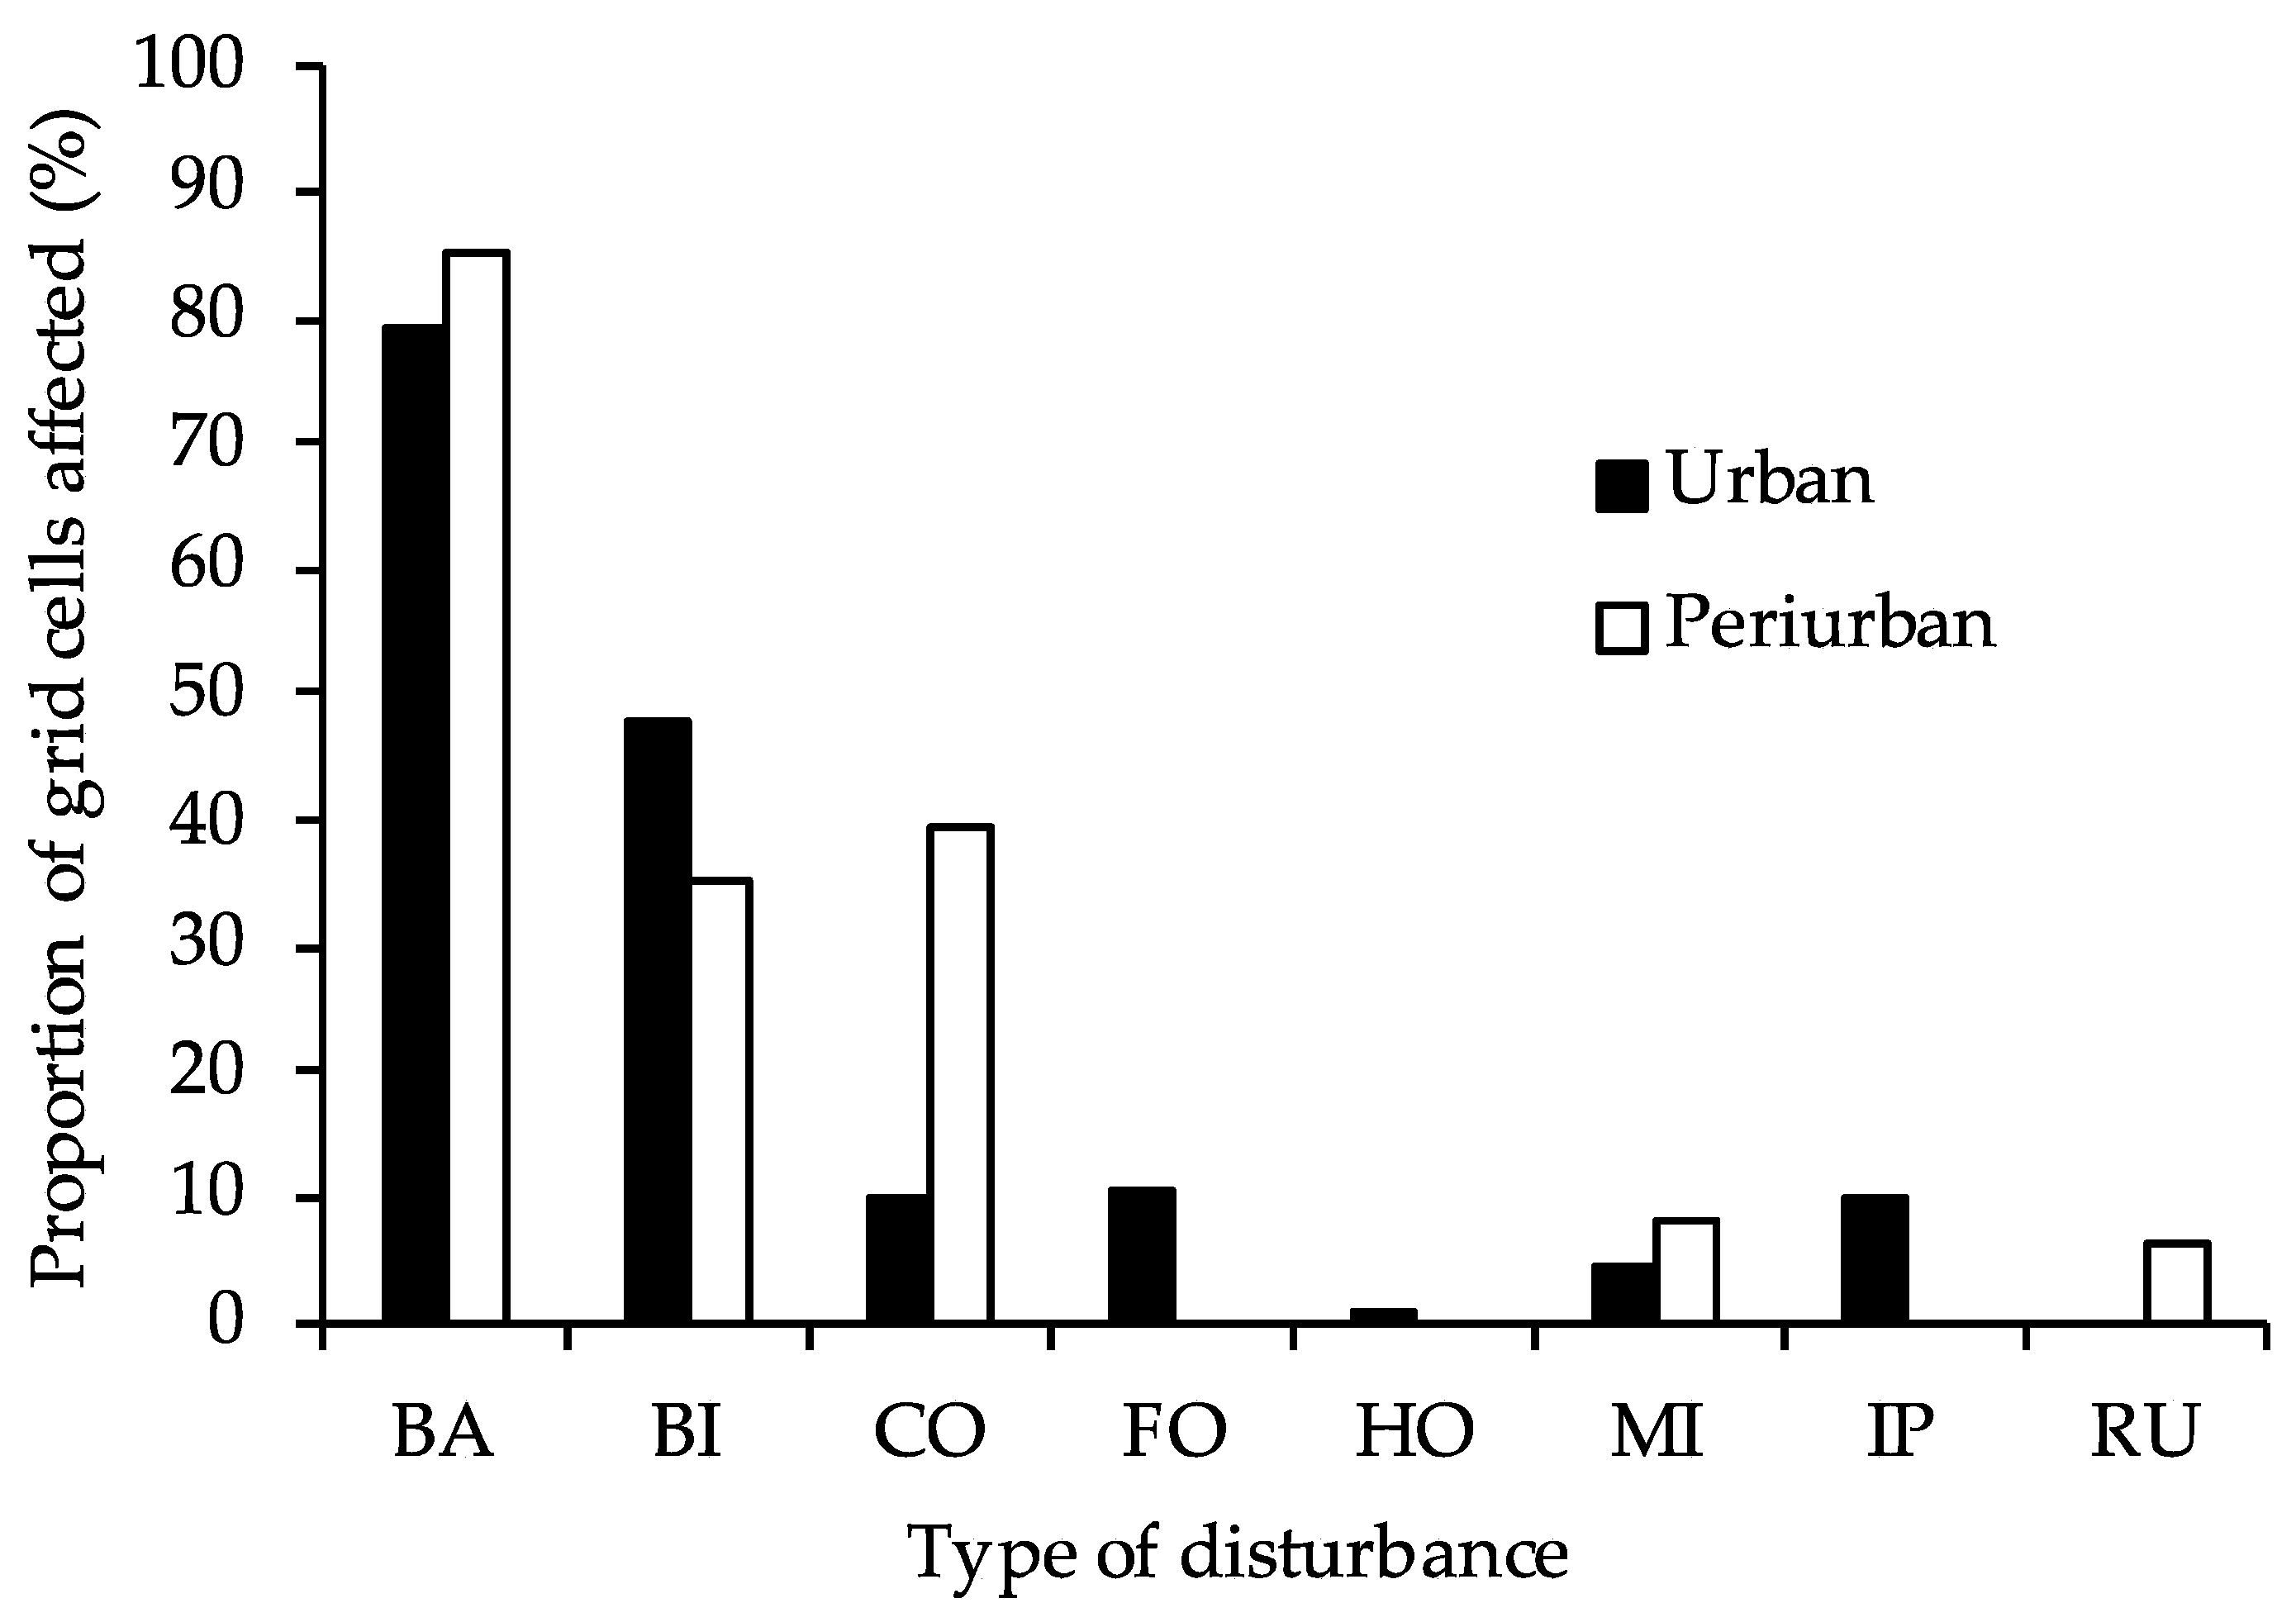
3.2.1. Distribution of the Types of Anthropogenic Disturbances of the Green Spaces of Bujumbura Observed in the Field

A study of the distribution of the eight types of anthropogenic disturbance on the identified green spaces indicated different frequencies of occurrence according to the urbanization gradient considered. In the administrative entities with an urban morphological status, bare soil and constructions were the most frequent types of disturbance, with proportions of about 79.3% and 47.7%, respectively, of the total number of grid cells inventoried. The other types of disturbance showed low or zero frequencies, as is the case of rubble. In the administrative entities with a peri-urban morphological status, bare soil, constructions and crops were the dominant types of disturbance with proportions of about 85.4%, 35.4% and 39.6% of the total inventoried grid cells, respectively. Rubble and military installations showed low frequencies while flooding, garbage and improvised parking lots showed zero frequencies (Figure 3).
In addition, the results of the Friedman test with χ 2 = 368.86 (p < 0.001) in urban and χ 2 = 146.43 (p < 0.001) in peri-urban entities showed a highly significant difference between the frequencies of the eight disturbance types along the urbanization gradient. The results of the post hoc test indicated that the disturbance types “buildings” and “bare soil” showed significant differences (p < 0.05) from the other disturbance types in terms of frequencies of occurrence. For the other frequencies regarding crops, rubble, flooding, military installations, garbage and improvised parking lots, significant differences were not observed.

3.2.2. Association between the Types of Anthropogenic Disturbance of the Green Spaces of Bujumbura

In the parts of the city with a peri-urban morphological status, one single association was observed, that of which between buildings and bare soil. In the parts of the city with an urban morphological status, buildings were linked to military installations and improvised parking. An association between crops and military installations was also observed; the military installations interact with the improvised parking lots (Table 3).

4. Discussion

4.1. Typology of Green Spaces in Bujumbura

Several typologies of green spaces have been proposed and no inventory is able to cover all the particularities that exist in every city around the world due to the differences in natural conditions (geomorphological, climatic, biological), history and social composition [32]. In a European context, the authors of [59] clearly showed differences between green spaces as parks and gardens; natural and semi-natural spaces; green corridors; allotments, community gardens and urban farms; outdoor sports facilities; amenity green spaces; provisions for children and young people; cemeteries, churchyards and other burial grounds; and other public spaces. The authors of [60] produced an inventory of 25 urban green space types, falling into 10 subgroups and 4 main groups (amenity green spaces, functional green spaces, semi-natural habitats and linear green spaces). Other inventories are based on usage [61], based mainly on scale [62] or cover informal urban green spaces [28]. Some typologies combine urban green spaces with other open spaces such as squares, pedestrian areas, or cycling areas [63]. In China, the authors of [24] reclassified green spaces into nine types (public parks, plaza-green spaces, nurseries, green buffer zones, attached green spaces, residential green spaces, roadside green spaces, riparian green spaces and scenery forests). This classification is based on urban green space functions, land use and property information. In Africa, the authors of [31] revealed that there are different forms of urban green spaces and grouped them into seven categories (semi-private spaces; parks, street trees and roadside plantations; public green areas; public and private tree plantations on vacant lots; green belts; woodlands and peri-urban farming areas; rangelands and forests close to urban areas; natural forests under urban influence; and trees planted for environmental protection and aesthetic purposes).
Furthermore, social initiatives, technological advances, environmental awareness and the creativity of urban planners and city dwellers are perpetually leading to new types of urban green spaces [32]. In this study, we combined four existing typologies, which have the advantage of associating each type of green space with the corresponding land use, as well as the status of the owner [7]. Consequently, these typologies allowed us to classify the green spaces of the city of Bujumbura into green squares, green sports spaces and cemeteries on the basis of their land use. These green spaces are present with varying frequencies along the urbanization gradient. In fact, green squares are present exclusively in urban entities, while sport green areas are present in urban and peri-urban zones and cemeteries are present in peri-urban zones only, hence confirming our first hypothesis. Indeed, the distribution of green spaces in Bujumbura city is based on the age of the different neighborhoods of the city and their socio-economic diversity [35,64]. Thus, in the Rohero zone, the oldest, inherited from the colonization period and characterized by a high standard of living, there are many green squares and sports green areas. In contrast, in the Kanyosha zone, the most recent city part and characterized by a precarious standard of living, only a few sports green areas and a cemetery are present.

4.2. Anthropogenic Disturbances of Green Spaces in Bujumbura

Urban green spaces are among the most degraded ecosystems in African cities [31], in particular, due to the rapid and unplanned expansion of built-up areas [8,11]. In this context, the desire to transform the architectural image of Bujumbura city, the objective of the public authorities to provide sports infrastructure and the phenomenon of gentrification [64] were at the origin of the construction of new infrastructures such as hotel residences, offices, commercial buildings and banks. In addition, the concern to commemorate the history of Burundi following the socio-political events that have characterized it since its independence, together with the objective to protect military strategic places in the city, are at the origin of the fragmentation and the shrinking of some emblematic green spaces in favor of monuments and military positions. In the African context, this situation is quite similar to the one observed in the municipalities of Treichville in Abidjan (Ivory Coast), in Lubumbashi and in Kolwezi (both situated in the southeastern part of the Democratic Republic of the Congo) where green spaces are threatened by the construction of shops, informal businesses, the installation of car garages, residential landmarks, etc., [65,66,67]. However, the installation of military positions in green spaces is a particularity of Bujumbura city, in order to protect strategic positions in the city. The authors of [68] specify that peri-urbanization and associated actions on green spaces will continue until 2090 without any planning.
In addition, with the repeated passages of residents on green spaces, bare soil areas appear rapidly, leading to a modification of soil properties by sealing them [69,70]. However, our results underline that the green spaces of Bujumbura are not only threatened by bare soil resulting from trampling following improvised passages, but also from various constructions along the urbanization gradient at different frequencies. Indeed, residents of green spaces consider these areas as shortcuts, thus testifying to the presence of trampling [70]. These observations confirm partly our second hypothesis according to which various constructions as well as bare soil, especially due to trampling, is visible along the urbanization gradient, while military positions are only present in administrative entities with an urban morphological status. These perturbations are largely due to the incivility and absence of eco-responsible behavior of local populations who consider these spaces free of any restriction [65].
In Sub-Saharan Africa, agriculture is a growing activity for survival in peri-urban areas, but its development threatens (semi-)natural vegetation elements and formations, which are considered crucial for sustainable development. This corroborates our findings that crop disturbances are significantly more present in peri-urban green spaces in Bujumbura and confirm the second part of our second hypothesis. The authors of [54,55,71] argue that populations living in peri-urban areas seek to ensure their survival, by any means, in a context of economic degradation and with little concern for the preservation of vegetation. This is typically the case of the military forces who install small fields next to their positions, a practice also observed concerning the guards of sports infrastructures.

4.3. Association between Types of Anthropogenic Disturbances of Green Spaces in Bujumbura

The authors of [72] state that human disturbances often interact synergistically, hence confirming our results. Indeed, within the green spaces of Bujumbura, each time constructions such as monuments or sports facilities were erected, access paths were laid out and parking lots were created. In addition, the Republic of Burundi has experienced a decade of socio-political instability leading to a certain degree of insecurity in the cities, including Bujumbura [73,74]. To improve this situation, military positions have been set up in green spaces, which required the construction of housing or shelters, in addition to parking lots for their vehicles on which water could stagnate after cleaning them. Similarly, according to the UNDP, 64.9% of the Burundi population lives on less than USD 0.0196 (BIF 41.054) per adult per month in the context of acute food insecurity [75]. As a result, there is an economy of scavenging characterized by, among other things, the development of vegetable gardens by the military, near their positions in green spaces, a situation also observed in Lubumbashi in the southeastern part of the Democratic Republic of the Congo [13]. The tendency for vegetable gardening development is also another phenomenon observed within sports infrastructures. Indeed, the guards arrange vegetable gardens for the production of food for their respective families, due to the scarcity of the land [76], thus supporting our third hypothesis related to the association of anthropogenic disturbances. It corroborates the findings of [54] that certain anthropogenic disturbances are often related to other types of degradation. Urban developments coupled with anthropogenic actions have been reported by [77], who state that they are the main constraints to the sustainability of urban vegetation.

5. Conclusions

This study presented a typology of the green spaces of Bujumbura city. It also identified the anthropogenic disturbances to which these spaces are subjected. A literature review revealed that green squares, green sports areas and cemeteries are among the types of green spaces encountered in Bujumbura. On the basis of the inventories, it appears that green spaces are exposed to anthropogenic disturbances, notably agriculture in peri-urban areas, as opposed to the development of military positions and the construction of monuments, buildings and sports facilities, which are more pronounced in urban areas. Trampling as a type of anthropogenic disturbance is present on green spaces in urban and peri-urban areas. The synergies between the different types of anthropogenic disturbances amplify their negative impact.
This study is a continuation of our research on green spaces in the city of Bujumbura and on the analysis of the anthropogenic pressures to which they are exposed. It was written to raise awareness. All stakeholders (municipal technical services, local administrations, non-profit associations and sports club associations) in charge of managing green spaces should invest more in protecting their green spaces against all kinds of disturbances. They should also promote environmental education in order to safeguard them and the ecosystem goods and services that they provide.

Author Contributions

Conceptualization, H.K., Y.U.S., T.M. and J.B.; methodology, H.K., Y.U.S., K.R.S., T.M. and J.B.; software, H.K.; validation, H.K., Y.U.S., K.R.S., T.M. and J.B.; formal analysis, H.K., Y.U.S., K.R.S., T.M. and J.B.; investigation, H.K. and D.M.; resources, H.K., Y.U.S., T.M. and J.B.; data curation, H.K.; writing—original draft preparation, H.K.; writing—review and editing, H.K., Y.U.S., K.R.S., D.M., T.M. and J.B.; visualization, H.K., Y.U.S., K.R.S., D.M., T.M. and J.B.; supervision, H.K., Y.U.S., K.R.S., D.M., T.M. and J.B.; project administration, H.K., T.M. and J.B.; funding acquisition, J.B. All authors have read and agreed to the published version of the manuscript.

Funding

This research was funded by the Académie de Recherche et d’Enseignement Supérieur-Commission de la Coopération au Développement (ARES-CCD, PSRCI-UB programme and PRD CHARLU).

Data Availability Statement

Not applicable.

Conflicts of Interest

The authors declare no conflict of interest.

References

  1. Turan, S.Ö.; Kadioǧullari, A.I.; Günlü, A. Spatial and temporal dynamics of land use pattern response to urbanization in Kastamonu. Afr. J. Biotechnol. 2010, 9, 640–647. [Google Scholar]
  2. Halleux, J.M. Les territoires périurbains et leur développement dans le monde: Un monde en voie d’urbanisation et de périurbanisation. In Territoires Périurbains: Développement, Enjeux et Perspectives dans les Pays du Sud; Bogaert, J., Halleux, J.M., Eds.; Presses Agronomiques de Gembloux: Gembloux, Belgium, 2015; pp. 43–61. [Google Scholar]
  3. United Nations. Departement of Economic and Social Affairs, Population Division (UNDSA), World Urbanization Prospects: The 2018 Revision; United Nations: New York, NY, USA, 2019. [Google Scholar]
  4. Tian, G.; Liu, J.; Xie, Y.; Yang, Z.; Zhuang, D.; Niu, Z. Analysis of spatio-temporal dynamic pattern and driving forces of urban land in China in 1990s using TM images and GIS. Cities 2005, 22, 400–410. [Google Scholar] [CrossRef]
  5. Kabanyegeye, H.; Useni, S.Y.; Sambieni, K.R.; Masharabu, T.; Havyarimana, F.; Bogaert, J. Trente-trois ans de dynamique spatiale de l’occupation du sol de la ville de Bujumbura, République du Burundi. Afrique Sci. 2021, 18, 203–2015. [Google Scholar]
  6. Vermeiren, K.; Van Rompaey, A.; Loopmans, M.; Serwajja, E.; Mukwaya, P. Urban growth of Kampala, Uganda: Pattern analysis and scenario development. Landsc. Urban Plan. 2012, 106, 199–206. [Google Scholar] [CrossRef]
  7. Sambieni, K.R.; Useni, S.Y.; Kaleba, S.C.; Moyene, A.B.; Kankumbi, F.M.; Nzuzi, F.L.; Occhiuto, R.; Bogaert, J. Les espaces verts en zone urbaine et périurbaine de Kinshasa en République Démocratique du Congo. Tropicultura 2018, 36, 478–491. [Google Scholar] [CrossRef]
  8. Useni, S.Y.; André, M.; Mahy, G.; Kaleba, S.C.; Kankumbi, F.M.; Bogaert, J. Interprétation paysagère du processus d’urbanisation à Lubumbashi: Dynamique de la structure spatiale et suivi des indicateurs écologiques entre 2002 et 2008. In Anthropisation des Paysages Katangais; Bogaert, J., Colinet, G., Mahy, G., Eds.; Presses Universitaires de Liège-Agronomie-Gembloux: Gembloux, Belgium, 2018; pp. 281–296. [Google Scholar]
  9. Sikuzani, Y.U.; Kaleba, S.C.; Halleux, J.M.; Bogaert, J.; Kankumbi, F.M. Caractérisation de la croissance spatiale urbaine de la ville de Lubumbashi (Haut-Katanga, RD Congo) entre 1989 et 2014. Tropicultura 2018, 36, 99–108. [Google Scholar]
  10. Sikuzani, Y.U.; Kaleba, S.C.; Khonde, C.N.; Mwana, Y.A.; Malaisse, F.; Bogaert, J.; Kankumbi, F.M. Vingt-cinq ans de monitoring de la dynamique spatiale des espaces verts en réponse à l’urbanisation dans les communes de la ville de Lubumbashi (Haut-Katanga, RD Congo). Tropicultura 2017, 35, 300–311. [Google Scholar] [CrossRef]
  11. Alberti, M. The effects of urban patterns on ecosystem function. Int. Reg. Sci. Rev. 2005, 28, 168–192. [Google Scholar] [CrossRef]
  12. Useni Sikuzani, Y.; Malaisse, F.; Cabala Kaleba, S.; Kalumba Mwanke, A.; Yamba, A.M.; Nkuku Khonde, C.; Bogaert, J.; Munyemba Kankumbi, F. Tree diversity and structure on green space of urban and peri-urban zones: The case of Lubumbashi City in the Democratic Republic of Congo. Urban For. Urban Green. 2019, 41, 67–74. [Google Scholar] [CrossRef]
  13. Useni Sikuzani, Y.; Sambiéni Kouagou, R.; Maréchal, J.; Ilunga wa Ilunga, E.; Malaisse, F.; Bogaert, J.; Munyemba Kankumbi, F. Changes in the spatial pattern and ecological functionalities of green spaces in Lubumbashi (the Democratic Republic of Congo) in relation with the degree of urbanization. Trop. Conserv. Sci. 2018, 11, 1–17. [Google Scholar] [CrossRef]
  14. Maréchal, J.; Useni, S.Y.; Bogaert, J.; Munyemba, K.F.; Mahy, G. La perception par des experts locaux des espaces verts et de leurs services écosystémiques dans une ville tropicale en expansion: Le cas de Lubumbashi. In Anthropisation des Paysages Katangais; Bogaert, J., Colinet, G., Mahy, G., Eds.; Les Presses Universitaires de Liège: Liège, Belgium, 2018; pp. 59–69. [Google Scholar]
  15. Rasidi, M.H.; Jamirsah, N.; Said, I. Urban green space design affects urban residents’social interaction. Procedia-Soc. Behav. Sci. 2012, 68, 464–480. [Google Scholar] [CrossRef]
  16. Buyadi, S.N.A.; Mohd, W.M.N.W.; Misni, A. Impact of land use changes on the surface temperature distribution of area surrounding the National Botanic Garden, Shah Alam. Procedia-Soc. Behav. Sci. 2013, 101, 516–525. [Google Scholar] [CrossRef]
  17. Robert, A.; Yengué, J.L. When Allotment gardens become urban green spaces like others, providing cultural ecosystem services. Environ. Ecol. Res. 2017, 5, 453–460. [Google Scholar] [CrossRef] [Green Version]
  18. Wood, E.; Harsant, A.; Dallimer, M.; Cronin de Chavez, A.; McEachan, R.R.; Hassall, C. Not all green space is created equal: Biodiversity predicts psychological restorative benefits from urban green space. Front. Psychol. 2018, 9, 1–13. [Google Scholar] [CrossRef]
  19. Gonzales, L.P.; Magnaye, D.C. Measuring the urban biodiversity of green spaces in a highly urbanizing environment and its implications for human settlement resiliency planning: The case of Manila city, Philippines. Procedia Environ. Sci. 2017, 37, 83–100. [Google Scholar] [CrossRef]
  20. Xiao, X.D.; Dong, L.; Yan, H.; Yang, N.; Xiong, Y. The influence of the spatial characteristics of urban green space on the urban heat island effect in Suzhou Industrial Park. Sustain. Cities Soc. 2018, 40, 428–439. [Google Scholar] [CrossRef]
  21. Aram, F.; Higueras García, E.; Solgi, E.; Mansournia, S. Urban Green Space Cooling Effect in Cities. Heliyon 2019, 5, e01339. [Google Scholar] [CrossRef]
  22. Jancel, R. Typologie Des Espaces Verts. In Les Plantes dans la Ville: Angers (France); Les Colloques, N., Ed.; COLLOQUES-INRA: Paris, France, 1997; pp. 69–80. [Google Scholar]
  23. Hermy, M.; Cornelis, J.; Hermy, M.; Cornelis, J. Towards a monitoring method and a number of multifaceted and hierarchical biodiversity indicators for urban and suburban parks. Landsc. Urban Plan. 2000, 49, 149–162. [Google Scholar] [CrossRef]
  24. Kong, F.; Nakagoshi, N. Changes of urban green spaces and their driving forces: A case study of Jinan City, China. J. Int. Dev. Coop. 2005, 11, 97–109. [Google Scholar] [CrossRef]
  25. Guerin, M. Etablissement d’une Typologie pour la Sélection des Espaces verts de la Région Centre du Programme SERVEUR; Université d’Orléans. M. QUODVERTE Philippe: Orléans, France, 2013. [Google Scholar]
  26. Neuenschwander, N.; Hayek, U.W.; Grêt-Regamey, A. Integrating an urban green space typology into procedural 3D visualization for collaborative planning. Comput. Environ. Urban Syst. 2014, 48, 99–110. [Google Scholar] [CrossRef]
  27. Hansen, R.; Rall, E.L.; Chapman, E.; Rolf, W.; Pauleit, S. Urban Green Infrastructure Planning: A Guide for Practitioners; Green Surge; University of Copenhagen: Copenhagen, Denmark, 2017. [Google Scholar]
  28. Rupprecht, C.D.; Byrne, J.A. Informal urban greenspace: A typology and trilingual systematic review of its role for urban residents and trends in the literature. Urban For. Urban Green. 2014, 13, 597–611. [Google Scholar] [CrossRef]
  29. Amontcha, A.A.M.; Djego, J.G.; Lougbegnon, T.O.; Sinsin, B.A. Typologie et répartition des espaces verts publics dans le grand Nokoué (Sud Bénin). Eur. Sci. J. ESJ 2017, 13, 79–97. [Google Scholar] [CrossRef]
  30. Mili, M. Module: Espaces Verts; Université Mohamed Boudiaf de M’sila, Institut de Gestion des Techniques Urbaines: M’Sila, Algeria, 2018. [Google Scholar]
  31. Mensah, C.A. Urban green spaces in Africa: Nature and challenges. Int. J. Ecosyst. 2014, 4, 1–11. [Google Scholar] [CrossRef]
  32. Rall, L.; Niemela, J.; Pauleit, S.; Pintar, M.; Lafortezza, R.; Santos, A.; Železnikar, Š. A Typology of Urban Green Spaces, Eco-System Services Provisioning Services and Demands. Report D3 1, UE. 2015. Available online: https://assets.centralparknyc.org/pdfs/institute/p2p-upelp/1.004_Greensurge_A+Typology+of+Urban+Green+Spaces.pdf (accessed on 27 October 2022).
  33. Mensah, C.A. Is Kumasi still a garden city? Land use analysis between 1980–2010. J. Environ. Ecol. 2014, 5, 2. [Google Scholar] [CrossRef]
  34. Osseni, A.A.; Mouhamadou, T.; Tohoain, B.A.C.; Sinsin, B. SIG et gestion des espaces verts dans la ville de Porto Novo au Bénin. Tropicultura 2015, 33, 146–156. [Google Scholar]
  35. Kabanyegeye, H.; Masharabu, T.; Sikuzani, Y.U.; Bogaert, J. Perception sur les espaces verts et leurs services écosystémiques par les acteurs locaux de la ville de Bujumbura (République du Burundi). Tropicultura 2020, 38, 1–17. [Google Scholar] [CrossRef]
  36. Bigirimana, J. Plant Diversity Patterns, Processes and Conservation Value in Bujumbura (Burundi), an Urban Ecology Study in Sub-Saharan Africa. Ph.D. Thesis, Université libre de Bruxelles, Brussels, Belgium, 2012. [Google Scholar]
  37. République du Burundi, Cabinet du Président. Loi n°1/04 du 04 Février 2019 Portant Fixation de la Capitale Politique et de la Économique du Burundi; République du Burundi, Cabinet du Président: Bujumbura, Burundi, 2019. [Google Scholar]
  38. République du Burundi, Ministère des Finances. Analyse des facteurs de risques, évaluation des dommages et propositions pour un relèvement et une reconstruction durables. In Evaluation Rapide Conjointe Suite à la Catasrtophe des 9-10 Février 1014 aux Alentours de Bujumbura; République du Burundi, Ministère des Finances: Bujumbura, Burundi, 2014. [Google Scholar]
  39. République du Burundi, Présidence de la République. Loi n°1/33 du 28 Novembre 2014 Portant Révision de la loi n°1/20 du 25 Janvier 2010 Portant Organisation de l’administration Communale; République du Burundi, Présidence de la République: Bujumbura, Burundi, 2014. [Google Scholar]
  40. République du Burundi, Ministère de l’Aménagement du Territoire, du Territoire et de l’Environnement. Plan d’Action National d’Adaptation Aux Changements Climatiques (PANA); République du Burundi, Ministère de l’Aménagement du Territoire, du Territoire et de l’Environnement: Bujumbura, Burundi, 2007. [Google Scholar]
  41. Bigirimana, J.; Bogaert, J.; De Canniere, C.; Lejoly, J.; Parmentier, I. Alien plant species dominate the vegetation in a city of Sub-Saharan Africa. Lands. Urb. Plan. 2011, 100, 251–267. [Google Scholar] [CrossRef]
  42. Hakizimana, P.; Bangirinama, F.; Masharabu, T.; Habonimana, B.; De Cannière, C.; Bogaert, J. Caractérisation de la végétation de la forêt dense de Kigwena et de la forêt claire de Rumonge au Burundi. Bois For. Trop. 2012, 312, 43–52. [Google Scholar] [CrossRef]
  43. White, F. The Vegetation of Africa: A Descriptive Memoir to Accompany the UNESCO/AETFAT/UNSO Vegetation Map of Africa; UNESCO: Paris, France, 1983. [Google Scholar]
  44. Bangirinama, F.B.; Nzitwanayo, B.; Hakizimana, P. Utilisation du charbon de bois comme principale source d’énergie de la population urbaine: Un sérieux problème pour la conservation du couvert forestier au Burundi. Bois For. Trop. 2016, 328, 45–53. [Google Scholar] [CrossRef]
  45. République du Burundi. Ministère de l’intérieur, Bureau Central du Recensement. Recensement Général de la Population et de l’habitat du Burundi 2008, Synthèse des Résultats Définitifs; République du Burundi. Ministère de l’intérieur, Bureau Central du Recensement: Bujumbura, Burundi, 2011. [Google Scholar]
  46. République du Burundi. Projections Démographiques 2010–2050 Niveau National et Provincial, ProService Des Etudes et Statistiques Démographiques; République du Burundi: Bujumbura, Burundi, 2017. [Google Scholar]
  47. République du Burundi. Ministère de la Santé Publique et de la Lutte Contre le Sida, Institut de Statistiques et d’Études Économiques du Burundi. Enquête Démographique et de Santé Au Burundi 2016–2017: Rapport de Synthèse; République du Burundi. Ministère de la Santé Publique et de la Lutte Contre le Sida, Institut de Statistiques et d’Études Économiques du Burundi: Bujumbura, Burundi, 2018. [Google Scholar]
  48. Byavu, N.; Henrard, C.; Dubois, M.; Malaisse, F. Phytothérapie traditionnelle des bovins dans les élevages de la plaine de la Ruzizi. Biotechnol. Agron. Soc. Environ. 2000, 4, 135–156. [Google Scholar]
  49. Sambieni, K.R.; Messina Ndzomo, J.P.; Biloso Moyene, A.; Halleux, J.M.; Occhiuto, R.; Bogaert, J. Les statuts morphologiques d’urbanisation des communes de Kinshasa en République Démocratique du Congo. Tropicultura 2018, 3, 520–530. [Google Scholar]
  50. André, M.; Mahy, G.; Lejeune, P.; Bogaert, J. Vers une synthèse de la conception et une définition des zones dans le gradient urbain-rural. Biotechnol. Agron. Soc. Environ. 2014, 18, 61–74. [Google Scholar]
  51. Polorigni, B.; Radji, R.; Kokou, K. Perceptions, tendances et préférences en foresterie urbaine: Cas de la ville de Lomé au Togo. Eur. Sci. J. 2014, 10, 261–277. [Google Scholar]
  52. Vroh, B.T.A.; Tiebre, M.S.; N’Guessan, K.E. Diversité végétale urbaine et estimation du stock de carbone: Cas de la commune du Plateau Abidjan, Côte d’Ivoire. Afrique Sci. Rev. Int. des Sci. Technol. 2014, 10, 329–340. [Google Scholar]
  53. Bougé, F. Caractérisation des Espaces verts Publics en Fonction de leur Place dans le Gradient Urbain Rural. Cas d’étude : La Trame verte de l’Agglomération Tourangelle; Projet de Fin d’Etudes-Université François: Tours, France, 2009. [Google Scholar]
  54. Rakotondrasoa, O.L.; Ayral, A.; Stein, J.; Rajoelison, G.L.; Ponette, Q.; Malaisse, F.; Ramamonjisoa, B.S.; Raminosoa, N.; Verheggen, F.J.; Poncelet, M.; et al. Analyse des facteurs anthropiques de dégradation des bois de tapia (Uapaca bojeri) d’Arivonimamo. In Les vers à Soie Malgaches. Enjeux Écologiques et Socio-Économiques; Verheggen, F., Bogaert, J., Haubruge, E., Eds.; Les Presses Agronomiques de Gembloux: Gembloux, Belgium, 2013; pp. 151–162. [Google Scholar]
  55. Demšar, J. Statistical comparisons of classifiers over multiple data sets. J. Mach. Learn. Res. 2006, 7, 1–30. [Google Scholar]
  56. Pereira, D.G.; Afonso, A.; Medeiros, F.M. Overview of Friedman’s test and post-hoc analysis. Commun. Stat. Simul. Comput. 2015, 44, 2636–2653. [Google Scholar] [CrossRef]
  57. Rakotondrasoa, O.L.; Malaisse, F.; Rajoelison, G.L.; Rabearisoa, M.R.; Ramamonjisoa, B.S.; Raminosoa, N.; Verheggen, F.J.; Poncelet, M.; Haubruge, E.; Bogaert, J. Identification des indicateurs de dégradation de la forêt de tapia (Uapaca bojeri) par une analyse sylvicole. Tropicultura 2013, 31, 10–19. [Google Scholar]
  58. Calavas, D.; Sulpice, P.; Lepetitcolin, E.; Bugnard, F. Appréciation de la fidélité de la pratique d’une méthode de notation de l’état corporel des brebis dans un cadre professionnel. Vet. Res. 1998, 29, 129–138. [Google Scholar]
  59. Bell, S.; Montarzino, A.; Travlou, P. Mapping research priorities for green and public urban space in the UK. Urban For. Urban Green 2007, 6, 103–115. [Google Scholar] [CrossRef]
  60. Swanwick, C.; Dunnett, N.; Woolley, H. Nature, role and value of green space in towns and cities: An overview. Built Environ. 2003, 29, 94–106. [Google Scholar] [CrossRef]
  61. Hofmann, M.; Gerstenberg, T. A user-generated typology of urban green spaces. In Proceedings of the 17th International Conference of the European Forum on Urban Forestry (EFUF), Lausanne, Switzerland, 3–7 June 2014. [Google Scholar]
  62. Byrne, J.; Sipe, N. Green and Open Space Planning for Urban Consolidation—A Review of the Literature and Best Practice. Urban Reseach Program, Issues Paper 11; Griffith University, 2010. Available online: https://core.ac.uk/download/pdf/143882947.pdf (accessed on 27 October 2022).
  63. DTLR–Department for Transport, Local Government and the Regions. Green Spaces, Better Places. Final Report of the Urban Green Spaces Taskforce; DTLR–Department for Transport, Local Government and the Regions: London, UK, 2002. [Google Scholar]
  64. Toyi, O. Politiques Publiques Urbaines de l’habitat dans la ville de Bujumbura de 1962 a 2009. Ph.D. Thesis, Université de Pau et des Pays de l’Adour, Pau, France, 2012. [Google Scholar]
  65. Gauthier, K.B.A.A.; Célestin, A.Y. Problématique de la gestion durable des espaces verts publics urbains à Abidjan: Cas de Treichville (côte d’ivoire). Revue Scientifique du Tchad 2017, 1, 63–72. [Google Scholar]
  66. Useni, Y.S.; Malaisse, F.; Yona, J.M.; Mwamba, T.M.; Bogaert, J. Diversity, use and management of household-located fruit trees in two rapidly developing towns in Southeastern D.R. Congo. Urban For. Urban Green 2021, 63, 127220. [Google Scholar] [CrossRef]
  67. Useni Sikuzani, Y.; Mpibwe Kalenga, A.; Yona Mleci, J.; N’Tambwe Nghonda, D.; Malaisse, F.; Bogaert, J. Assessment of street tree diversity, structure and protection in planned and unplanned neighborhoods of Lubumbashi City (DR Congo). Sustainability 2022, 14, 3830. [Google Scholar] [CrossRef]
  68. Muteya, H.K.; Nghonda, D.D.N.; Malaisse, F.; Waselin, S.; Sambiéni, K.R.; Kaleba, S.C.; Kankumbi, F.M.; Bastin, J.F.; Bogaert, J.; Sikuzani, Y.U. Quantification and Simulation of Landscape Anthropization around the Mining Agglomerations of Southeastern Katanga (DR Congo) between 1979 and 2090. Land 2022, 11, 850. [Google Scholar] [CrossRef]
  69. Lorenz, K.; Lal, R. Biogeochemical C and N cycles in urban soils. Environ. Internat. 2009, 35, 1–8. [Google Scholar] [CrossRef] [PubMed]
  70. Boukelouha, R.; Labii, B. Re-Définir la Marchabilité Urbaine Une revue de littérature. Les Ann. l’université d’Alger 1 2019, 33, 776–800. [Google Scholar]
  71. Trefon, T.; Cogels, S. La gestion des ressources naturelles dans les zones périurbaines d’Afrique centrale: Une approche privilégiant les parties prenantes. Cad. Estud. Africanos 2007, 13–14, 101–126. [Google Scholar] [CrossRef]
  72. Peres, C.A.; Barlow, J.; Laurance, W.F. Detecting anthropogenic disturbance in tropical forests. Trends Ecol. Evol. 2006, 21, 227–229. [Google Scholar] [CrossRef] [PubMed]
  73. Havyarimana, F.; Masharabu, T.; Kouao, J.K.; Bamba, I.; Nduwarugira, D.; Bigendako, M.-J.; Hakizimana, P.; Mama, A.; Bangirinama, F.; Banyankimbona, G.; et al. La Dynamique Spatiale de La Foret Situee Dans La Reserve Naturelle Forestiere de Bururi Au Burundi. Tropicultura 2017, 35, 158–172. [Google Scholar]
  74. Havyarimana, F.; Bamba, I.; Barima, Y.S.S.; Masharabu, T.; Nduwarugira, D.; Bigendako, M.J.; Bogaert, J. La contribution des camps de déplacés à la dynamique paysagère au sud et au sud-est du Burundi. Tropcultura 2018, 36, 243–257. [Google Scholar]
  75. République du Burundi. Rapport National sur le Développement Humain; Programmes; République du Burundi: Bujumbura, Burundi, 2019. [Google Scholar]
  76. Bogaert, J.; Biloso, A.; Vranken, I.; André, M. Peri-urban dynamics: Landscape ecology perspectives. In Territoires Périurbains: Développement, Enjeux et Perspectives dans les Pays du Sud; Bogaert, J., Halleux, J.M., Eds.; Presses agronomiques de Gembloux: Gembloux, Belgium, 2015; pp. 63–73. [Google Scholar]
  77. Aziz, O.A.; Brice, S.; Ismaïla, T.I. Analyse des contraintes de viabilite de la vegetation urbaine: Cas des arbres d’alignement dans la ville de porto-novo au Bénin. Eur. Sci. J. 2014, 10, 1–15. [Google Scholar]
Figure 1. Location of Bujumbura city in the Republic of Burundi, near Tanganyika Lake. The municipalities of the city have both morphological statuses of urban and peri-urban areas. Within these areas, three types of green spaces have been found and located.
Land 12 00465 g001
Figure 2. Presence and abundance of green spaces in the urban and peri-urban parts of Bujumbura expressed as a proportion of the number of green spaces (N) or as a function of the total area (A) of the green spaces.
Land 12 00465 g002
Figure 3. Proportion of grid cells affected by type of disturbance in sampled green spaces in urban and peri-urban zones of the city of Bujumbura. BA: bare ground, BI: building, CO: crops, FO: flooding, HO: household waste, MI: military installations, IP: improvised parking lot, RU: rubble.
Land 12 00465 g003
Table 1. List of types and indicators of anthropogenic disturbances of green spaces in the city of Bujumbura, based on exploratory observations made from September to October 2021.
Types of DisturbanceIndicators
BuildingsPresence of houses, monuments, parking lots, tiles, sports surfaces, bleachers, makeshift housing
CropsPresence of crop plants
RubblePresence of construction debris
FloodingPresence of stagnant water from washing vehicles, carpets or tents
Military installationsPresence of tents, obstacles, shelters, trenches, etc.
Household wasteUnauthorized dumping of household waste
Improvised parking lotsPresence of vehicles, motorcycles and bicycles
Bare floorsObservation of the ground without vegetation cover, mainly due to trampling and livestock grazing
Table 2. Spatial data of the 18 green spaces present along the urban–rural gradient of the Bujumbura city. GS: green space, EA: administrative entity, GC: geographic coordinates, SL: southern latitude, EL: eastern longitude, MS: morphological status, NC: number of grid cells, P: perimeter, TG: type of green space, GS: green squares, GA: green sports area, CE: cemetery.
GSAEGCMSNCArea (m2)P (m)TG
SLEL
1Rohero3°22′42.43”29°21′24.24”U35207,800.002011.89GS
2Kanyosha3°27′09.54”29°20′47.20”PU1897,441.961274.12GA
3Musaga3°24′13.74”29°22′10.29”PU1056,600.501034.88GS
4Kanyosha3°27′50.94”29°20′57.39”PU1047,051.50965.45CE
5Rohero3°23′32.67”29°22′31.64”U1162,860.08932.60GS
6Gihosha3°21′33.89”29°23′21.23”U943,474.50859.68GA
7Rohero3°23′00.59”29°22′24.81”U949,677.99846.90GA
8Rohero3°23′13.48”29°21′12.48”U639,878.50842.18GA
9Rohero3°23′21.44”29°21′07.40”U639,236.00833.60GS
10Rohero3°23′34.76”29°23′17.02”U835,719.96795.65GS
11Ngagara3°21′10.58”29°21′58.83”U437,514.10787.11GS
12Ngagara3°21′23.97”29°21′56.81”U630,754.55757.94GA
13Rohero3°23′33.83”29°23′11.44”U731,144.50742.86GS
14Musaga3°24′13.73”29°21′51.95”PU622,272.00653.29GA
15Rohero3°23′07.56”29°22′49.81”U414,071.00477.12GA
16Ngagara3°21′08.67”29°22′25.13”U411,440.00432.09GA
17Musaga3°25′05.41”29°21′58.85”PU410,054.93421.35GA
18Rohero3°23′17.93”29°21′41.29”U210,680.51405.18GS
Table 3. Results of χ 2 independence tests for association of anthropogenic disturbances in Bujumbura green spaces (* = p < 0.05). The baseline data are from gridded inventories of these disturbance types conducted on 18 green spaces in the city of Bujumbura of at least 1 ha in area in November 2020. BA: bare ground, BI: building, CO: crops, FO: flooding, HO: household waste, MI: military installations, IP: improvised parking lot, RU: rubble.
Peri-urban zones
BARUCOMI
BI4.49 *1.762.842.39
BA 0.903.480.75
RU 2.102.62
CO 0.39
Urban zones
BAFOHOCOMIIP
BI3.491.120.920.630.52 *9.12 *
BA 0.140.260.051.371.01
FO 0.121.480.643.43
HO 0.110.050.11
CO 14.71 *1.34
MI 5.31 *
Disclaimer/Publisher’s Note: The statements, opinions and data contained in all publications are solely those of the individual author(s) and contributor(s) and not of MDPI and/or the editor(s). MDPI and/or the editor(s) disclaim responsibility for any injury to people or property resulting from any ideas, methods, instructions or products referred to in the content.

