Article

A GIS-Based Typological Interpretation of Cultivated Land Loss: A Spatiotemporal Analysis of Tai’an Prefecture in the North China Plain

1
School of Geography, Faculty of Geographical Science, Beijing Normal University, Beijing 100875, China
2
College of Urban and Environmental Sciences, Peking University, Beijing 100871, China
3
Key Laboratory of Territorial Spatial Planning and Development-Protection, Ministry of Natural Resources of PRC, Beijing 100871, China
4
Center for Urban Future Research, Peking University, Beijing 100871, China
5
China Land Surveying and Planning Institute, Beijing 100035, China
*
Author to whom correspondence should be addressed.
Land 2023, 12(2), 372; https://doi.org/10.3390/land12020372
Submission received: 27 December 2022 / Revised: 27 January 2023 / Accepted: 28 January 2023 / Published: 30 January 2023

Abstract

:
Loss of cultivated land has become a global issue that is especially critical in populous and rapidly urbanizing countries. However, knowledge in this field in general and its spatiality in particular have long been restrained in developing countries for the lack of accurate and reliable data. This study addresses this issue from a typological perspective by distinguishing the patterns and determinants of the conversion of cultivated land to nonagricultural use, nongrain use, and ecological land use. By using land use survey data from 2009 to 2019, and taking villages as the research units, the cultivated land loss in an ordinary prefecture, Tai’an, in the North China Plain was investigated from its temporal–spatial patterns, destination uses, and various driving factors. GIS methods such as spatial visualization, overlay analysis, and hotspot analysis were used to depict the geography of cultivated land loss in total and by cause. Multiple linear regression models were then developed to explore the roles of natural, locational, economic, social, and policy factors in predicting the overall and three types of cultivated land loss. The results show that (1) the cultivated land area in Tai’an Prefecture decreased by 1338.3 km2 over the decade, which was 32.4% of that in 2009. Ecological use, rather than the widely blamed urban expansion, was the dominant reason, accounting for 55.6% of the total loss of cultivated land. (2) The hotspot areas of cultivated land loss were mainly distributed in the northeastern mountainous area and villages around cities and county seats in the southwest. The hotspot areas of nongrain and ecological conversion were mainly located around the central city, whereas those of nonagricultural conversion were the most extensive around county centers. (3) The factors were found to have heterogeneous effects on the three types of cultivated land loss. For example, land transfer is conducive to large-scale farming and is thus associated with a lower probability of nonagricultural conversion of cultivated land. However, it often facilitates ecological conversion of cultivated land. (4) The basic farmland protection policy was proven to be effective in preventing all three types of cultivated land loss. The above results indicate the great heterogeneity among the three types of cultivated land loss in their geography and determinants, demonstrating the necessity and significance of the typological perspective adopted to interpreting cultivated land loss in urbanizing and transitional societies. To some extent, only by reasonably distinguishing, spatially analyzing, and fully understanding the different types, various causes, and internal structure of cultivated land loss can we formulate more targeted and effective policies of cultivated land protection.

1. Introduction

Cultivated land loss has become a global issue in the era of rapid urbanization [1,2,3]. It has posed great threats to agricultural productivity, food security, local climate, biological diversity, etc. [4,5]. Unfortunately, this unfavorable phenomenon has been found everywhere across the globe and is extremely serious in less-developed countries [6,7,8]. The main reasons for cultivated land loss include urbanization, industrialization, infrastructure development, dislocation of land property rights, and frequent natural disasters [1,8,9]. Given the great spatial variation of cultivated land loss, GIS has been widely employed as a key methodology to depict and understand this phenomenon. For example, in the United States, the rapid increase in housing and commercial space has led to a massive loss of cultivated land [10]. Due to the misalignment of land rights, the area of cultivated land in Russia decreased by more than 15 percent from 130 million hm2 in 1992 to 110 million hm2 in 2018 [11,12]. With the largest area of cultivated land in the world, India’s food production is less than half that of China due to the country’s severe environmental pollution, poor infrastructure and inefficient production; hence the threat of cultivated land loss to food security therein cannot be underestimated despite the large scale of the total farmland [3]. Many countries have introduced various policies to protect cultivated land whereas the effects have been generally limited [13,14,15]. Studies show that urban expansion will reduce global cultivated land by another 1.8–2.4% by 2030, and the regional impact will be severe and differentiated; 80% of the loss of cultivated land will occur in less developed societies in Asia and Africa [2]. Therefore, it is of utmost importance to adopt a temporal–spatial perspective and use GIS methods to examine the spatial distribution characteristics and influencing factors of cultivated land loss, which is not only a central topic in land use change studies but also crucial for improving policies of farmland protection.
In China, the most populous country in the world, cultivated land loss threatens food security [16]. In China, the population is on the rise, there is less farmland, and there are fewer reserve land resources that can be reclaimed [17]. China feeds 22% of the world’s population with only 7% of the world’s farmland. Given this, protecting farmland and ensuring food security have always been the greatest concerns of the Chinese government [18,19]. Rapid urbanization in China is the main reason for cultivated land loss, which has multiple impacts on farmlands [20]. The direct impact is reflected in the farmland being directly affected by urban development, that is, the farmland being converted to nonagricultural use [21]. Indirect impact is reflected in the change of farmland utilization mode in the rapid development of urbanization, which leads to farmland not being used for grain cultivation, that is, nongrain and ecological conversion of cultivated land [22]. These two conversions differ from nonagricultural conversions in terms of land change, but they still cause serious damage to the farmland soil layer, making it difficult to grow grain crops, thus affecting national food security [23,24]. To effectively control the problem of cultivated land loss in China, we should analyze the impact of these three cultivated land conversions, which is of great significance to national food security.
Cultivated land loss is a hot topic that has attracted much scholarly attention. However, several gaps remain in the existing literature. First, the majority of previous studies have rarely examined the multiple causes and internal structure of cultivated land loss. They have mainly focused on the overall or one type of cultivated land loss caused by one reason. For instance, many studies have explored the nonagricultural conversion of cultivated land [21], while others have discussed nongrain and ecological conversion of cultivated land [22,23]. They commonly fail to understand their inherent differences and can only present limited opinions on cultivated land protection policies. This failure is extremely problematic in developing countries where nongrain and ecological conversion of cultivated land are simultaneously remarkable and causing massive loss of cultivated land. In this sense, a typological perspective is necessary and will be insightful for identifying the spatial and structural patterns and exploring the multiple determinants of cultivated land loss. It would also provide a new base for developing more targeted policies of cultivated land protection.
The second research gap lies in the cases chosen by previous studies. They mainly focus on megacities and urban agglomerations but pay less attention to ordinary cities [25,26]. However, studying the loss of cultivated land in ordinary cities is important for national food security [23,24]. On the one hand, the number of ordinary cities is large, and these cities usually undertake more farmland protection tasks. On the other hand, megacities and urban agglomerations not only have a small number of cities but also a small area of cultivated land, which cannot represent the loss of cultivated land in the vast majority of Chinese cities. Therefore, using ordinary cities as research areas can provide universal suggestions for urban management and decision making in China.
Thirdly, existing studies mainly consider cities and counties as research units with limited attention paid to refine units [22]. Some studies have considered plots as research units [23,26]. The former provides limited advice for city administrators on how to implement fine management, whereas the latter is greatly influenced by researchers’ subjectivity. Considering that rural land is owned by the collective, the village, as the most basic carrier of rural land use change, is the smallest administrative unit in China’s social and economic development [27]. Research at the village scale can retain more details of spatial patterns, and spatial dependence is more obvious than at other scales, which can better reveal the essential characteristics of cultivated land change [16,23]. The relevant research results can also provide more detailed and accurate information and suggestions for urban managers and decision makers [21,28].
Finally, data availability has been another crucial issue, especially in developing countries. Without reliable and accurate spatial data at a refined scale, research on land use change in general and cultivated land loss in particular has relied mainly on remote sensing data. However, the limitation of these data in spatial resolution, land use classification, and spatial linkages with land policies and socioeconomic development data would be amplified when they were used in relatively small rural areas [29,30]. Fortunately, China has conducted three rounds of national land survey since the late 1990s, which provided reliable and accurate land use data for investigating the spatiotemporal patterns and determinants of land use changes. The latest two rounds of land survey, carried out in 2009 and 2019, respectively, used compatible land classification systems and are thus comparable [29]. For these reasons, a case study was conducted in a prefecture where the land survey data were available to explore the spatiality, structure, and predictors of cultivated land loss.
Considering the research gaps in the existing literature, this study adopted a typological perspective and compared the losses of cultivated land by destination, namely land converted for nonagricultural, nongrain, and ecological uses. Taking Tai’an Prefecture in The North China Plain as the study area, we used data from land use surveys conducted in 2009 and 2019 and took villages as the research units to identify the spatial patterns and influencing factors of these three types of cultivated land loss. Specifically, we addressed the following three issues: (1) identifying the dominant destination of cultivated land loss, (2) exploring the spatial patterns of the three types of cultivated land loss, and (3) analyzing and comparing the influencing factors of cultivated land loss in total and in different destinations. The conclusion of this study not only provides suggestions for the formulation of farmland protection policies in the process of rapid urbanization in China but can also serve as a reference for solving the problem of cultivated land loss in the urbanization process of other developing countries.
This paper is divided into six sections. Section 2 presents an analysis of the factors that influence the loss of cultivated land. Section 3 describes the materials and methods. After the following parts of results and discussion, the final section presents the conclusions and future work.

2. Influencing Factors of Cultivated Land Loss

A relatively complete basic framework was used to analyze the factors influencing land use change. The framework focuses on the following five perspectives: natural conditions and location, economic, social, and policy factors [31,32,33]. As cultivated land loss is a type of land use change, this study adopted the same analytical framework to analyze the impact of different factors on cultivated land loss [9,34].

2.1. Natural Conditions

The influence of natural conditions on regional land use change is usually a slow accumulation process; however, it is also a basic constraint factor [23,31]. Natural conditions include natural elements such as topography, climate, hydrology, vegetation, and soil [9]. For the analysis of land use change at the metropolitan area scale, the terrain is a key factor affecting land use changes because the study area was in the same climate zone [26,35]. The impact of terrain conditions on farmland loss is mainly due to terrain slope and altitude. Terrain slope has a direct impact on farming conditions, and altitude affects water and heat distribution and land use change [25].
Farmland terrain conditions determine their potential utilization value and use [36]. Thus, flat farmland can reduce labor input through the large-scale replacement of agricultural machinery and effectively reduce the impact of rising labor prices [37]. The flatter the land, the more likely it is to be utilized for growing food, and the smaller the possibility of nongrain conversion of cultivated land [4,24,35]. However, the gap between labor productivity in mountainous and hilly areas and that in plain areas has increased because harsh terrain conditions can seriously hinder the development of agricultural mechanization. In this case, farmers can only improve their agricultural production profits through the nongrain conversion of cultivated land [35]. Additionally, relevant studies have found that terrain conditions significantly restrict the expansion of construction land [26]. Due to its low development cost, urban construction occupies most of the high-quality farmland with flat topography [20].

2.2. Location

Land use change depends on both natural conditions and location factors [38]. In his Isolated State, von Thunen first pointed out that distance from the urban center is an important factor affecting agricultural land rent, which results in different types of agricultural land use from the urban center to the periphery [39]. The influence of location factors on farmland change is manifested in two ways. Markets of different scales have different impacts on agricultural land use. At the scale of metropolitan areas, changes in products and services provided by administrative centers of different levels affect the demand for land, leading to spatial differences in nonagricultural, nongrain, and ecological conversion of cultivated land [31]. Alternately, improvements in transportation infrastructure conditions will affect the development and utilization of farmland, leading to spatial differences in nonagricultural, nongrain, and ecological conversion [23,31].
Empirical studies have shown that distance to different levels of administrative centers has different effects on farmland development and utilization [31,40,41]. For example, Dong (2006) found that the proportion of nongrain cultivated land was significantly higher in areas close to administrative centers [42]. Relevant studies have found that the improvement in transportation conditions is also an important reason for the change in farmland use [31]. Construction of traffic roads will not only occupy a large amount of land, including farmland, but the development of roads will also increase regional accessibility, thus promoting farmland development and utilization. Kong (2020) highlighted that for some local governments, it is easier to carry out urban greening on both sides of transport routes, widen the width of trees, and occupy farmland, which leads to the ecological conversion of cultivated land [43]. Furthermore, transportation conditions improve the economic and temporal distance between the production and consumption markets of agricultural products and ensure rapid transportation and preservation of relatively profitable cash crops [42]. Xiao et al. (2015) noted that the continuous improvement and perfection of transportation conditions are some of the main factors promoting the nongrain and ecological conversion of cultivated land [31].

2.3. Economic Development

Economic development is also an important factor that affects changes in farmland use in villages. Based on the relevant literature, this study measures the impact of economic factors on farmland in villages from the perspective of the level of economic development, industrial structure, and economic activity [44].
Due to the different levels of economic development, the types of cultivated land loss in villages differ. Villages with low levels of economic development are subject to the benefit trend of economic development and pursue maximization of economic benefits. They are more likely to increase profitable cash crops, leading to nongrain conversion of cultivated land [23]. More serious is the excessive economic development of nonagricultural industries, resulting in the nonagricultural conversion of cultivated land [45]. In addition, with the improvement in economic development, many communities plant trees on farmland in the name of green environment, resulting in the ecological conversion of cultivated land [24,43].
In terms of industrial structure, rapid economic development not only leads to a continuous decrease in the proportion of China’s primary industry but also the transformation of the planting structure of farmland from grain cultivation to relatively efficient cash crops [46,47]. The development of secondary industry provides many employment opportunities for rural residents and generates a large demand for construction land, which inevitably leads to the nonagricultural conversion of cultivated land [48]. Furthermore, the development of the tertiary industry provides convenient transportation conditions for villages. Improvements in transportation conditions encourage vigorous development of rural tourism, resulting in a large demand for green land, which again leads to the ecological conversion of cultivated land [49]. In the final analysis, the comparative benefits of farmland for grain cultivation were lower than those of the other land use methods.
The higher the frequency of land transfers in villages, the higher the degree of land activity. Therefore, the relevant literature uses the proportion of land transfer areas to measure the economic activity of villages [44]. In villages with high economic activity, peasants can realize large-scale farming through land transfer to improve profits, which inhibits the nonagricultural conversion of cultivated land [50]. However, with the increase in the land transfer area, land transfer costs have become one of the main costs of agricultural production. To obtain higher economic benefits, farmers turn their farmland to garden and forest land to offset the rising cost of land transfer, which leads to nongrain and ecological conversion of cultivated land [4,50].

2.4. Social Factors

Rural areas in China are also experiencing rich social changes, among which social factors promote the transformation of the use and function of rural farmlands [31,34]. Demographic characteristics are often used to characterize the social factors of villages [51,52,53]. With the increase in urban population, cities will spread outwards and inevitably occupy the farmland of villages around cities [54]. Moreover, an increase in population also increases the demand for diversified agricultural products [24]. Therefore, most farmers meet the diversified demands of the market through nongrain conversion of cultivated land [24]. However, in remote villages, with the loss of the local population and lack of demand for land transfer, farmers generally invest in extensive planting methods, resulting in the ecological conversion of cultivated land [52,55].
The labor force structure is an important factor in population characteristics and is crucial for changes in farmland use [23]. As the rural agricultural labor force shifts to nonagricultural employment, cities need more land to serve the growing labor force, which promotes substantial growth of urban construction land. A large increase in urban construction land will inevitably occupy farmland in surrounding areas [9,56]. The increase in employment opportunities in nonagricultural industries also weakens the social security function of farmlands. In this case, farmers are more willing to turn to nonagricultural industries for employment and simultaneously establish some planting methods with a low agricultural labor force, leading to the ecological conversion of cultivated land [24,47,57]. Liao et al. analyzed the impact of labor structure on the nongrain conversion of cultivated land and found that farmers face an increase in labor costs with a decrease in the agricultural labor force, which promotes the transformation of farmland from food cultivation to cash crops with higher comparative benefits [35].

2.5. Policy

Land use is characterized by externalities, and the personal and public goals of land use frequently conflict with each other. The personal goal of land use often emphasizes economic benefits, whereas the public management goal of land focuses more on social and environmental benefits [9]. Therefore, all countries adopt constitutions and laws to control land use behavior, leading to institutional factors playing an increasingly critical role in the process of land use change [3,58].
China has implemented strict farmland protection policies, especially the demarcation of permanent basic farmland around cities, which has played an important role in inhibiting the nonagricultural conversion of cultivated land [13]. This is because the policy focuses more on curbing nonagricultural uses such as urban construction. In the implementation of this policy, the administrative department conducts law enforcement inspections using satellite images, which can detect farmland converted to nonagricultural uses, and orders its restoration [23,53]. However, some studies have found that basic farmland protection policies have no inhibitory effect on the nongrain and ecological conversion of cultivated land [23,52]. First, the policy lacks control means and monitoring tools for agricultural activities other than grain cultivation in farmlands [23]. Second, permanent basic farmland is generally high-quality farmland that can only be used for food production with low interest; this leads to a contradiction in the low operating income of high-quality farmland [45]. To improve returns, farmers generally plant forest products and cash crops with higher benefits, which leads to the nongrain and ecological conversion of cultivated land.

3. Materials and Methods
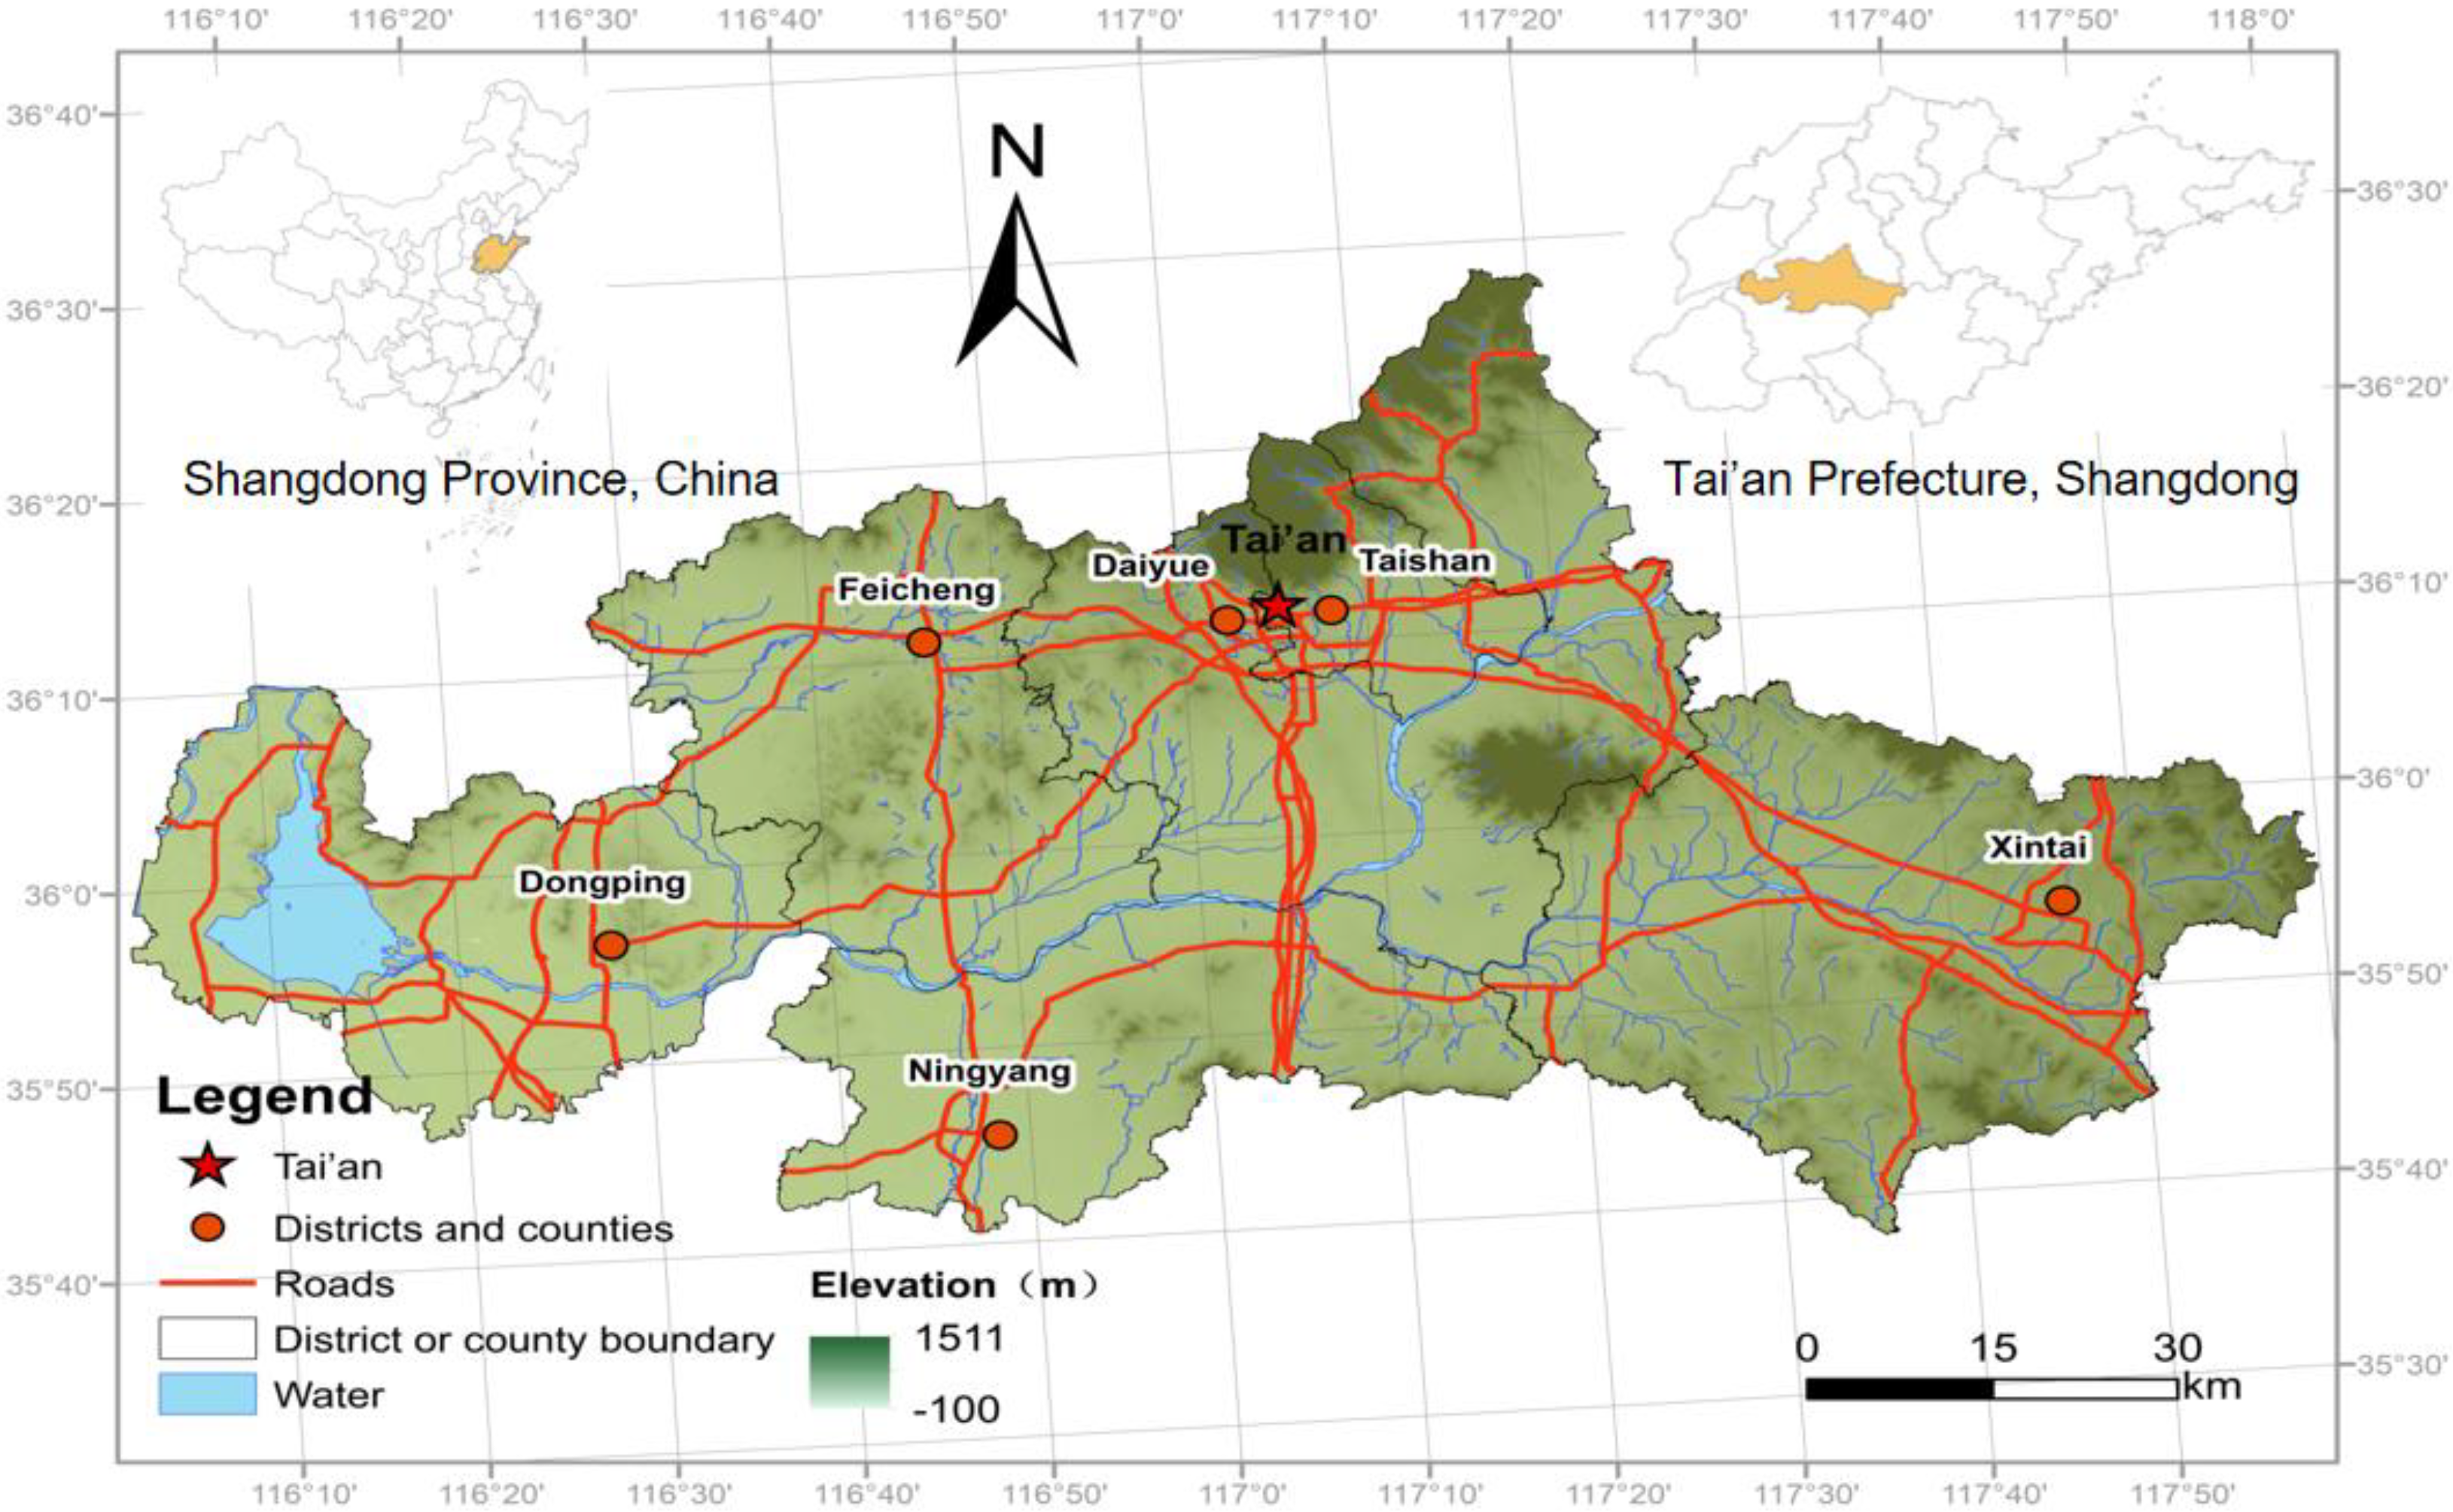
3.1. Study Area

Tai’an Prefecture is located on the North China Plain, an important major grain-producing area in the middle of Shandong Province. In 2019, the total population of the prefecture was 5.73 million, of which 3.55 million resided in urban areas, accounting for 61.87% of the total population [59]. There are six county-level administrative units under its jurisdiction. The central city is composed of Taishan District and Daiyue District; Xintai City and Feicheng City are two more developed county-level cities, and Ningyang County and Dongping County are far away from the central city and less developed (Figure 1).
Tai’an Prefecture was chosen as a case study for the following three reasons. First, it has diverse geomorphic types, including mountains, hills, plains, basins, and lakes. Second, farmland is the main type of land used in this area. The total land area of the prefecture is 7761 km2, of which 4125.4 km2 is covered by farmland, accounting for 53.2% of the total land area. Third, Tai’an, similar to other ordinary cities in China, has experienced rapid urbanization over the recent decade, resulting a dramatic shrinkage of cultivated land. The recent two rounds of national land survey revealed that nearly one third of cultivated land in 2009 was converted to other uses in the following decade (Figure 2). For these reasons, we chose Tai’an as a typical case of ordinary cities in China to examine the geography and predictors of cultivated land loss from a typological perspective. In fact, the Tai’an prefecture has been employed as a typical case of Chinese ordinary cities in several previous studies and found to be a good case for examining land use changes, rural transitions, and policy assessment [60,61].

3.2. Data

3.2.1. Data Sources and Descriptive Statistics

Farmland data were obtained from land use survey data of Tai’an Prefecture in 2009 and 2019. Basic farmland protection area data were obtained from the land use plan of the Tai’an Prefecture (2006–2020). The administrative zoning map of the village was obtained from the 2019 village-level administrative boundary map of Tai’an. Social and economic statistics were obtained from the village-level social and economic statistics database of Tai’an’s Municipal Bureau of Statistics. Road network data were obtained from Baidu map definitions, and data sources and descriptive statistics of variables are listed in Table 1.

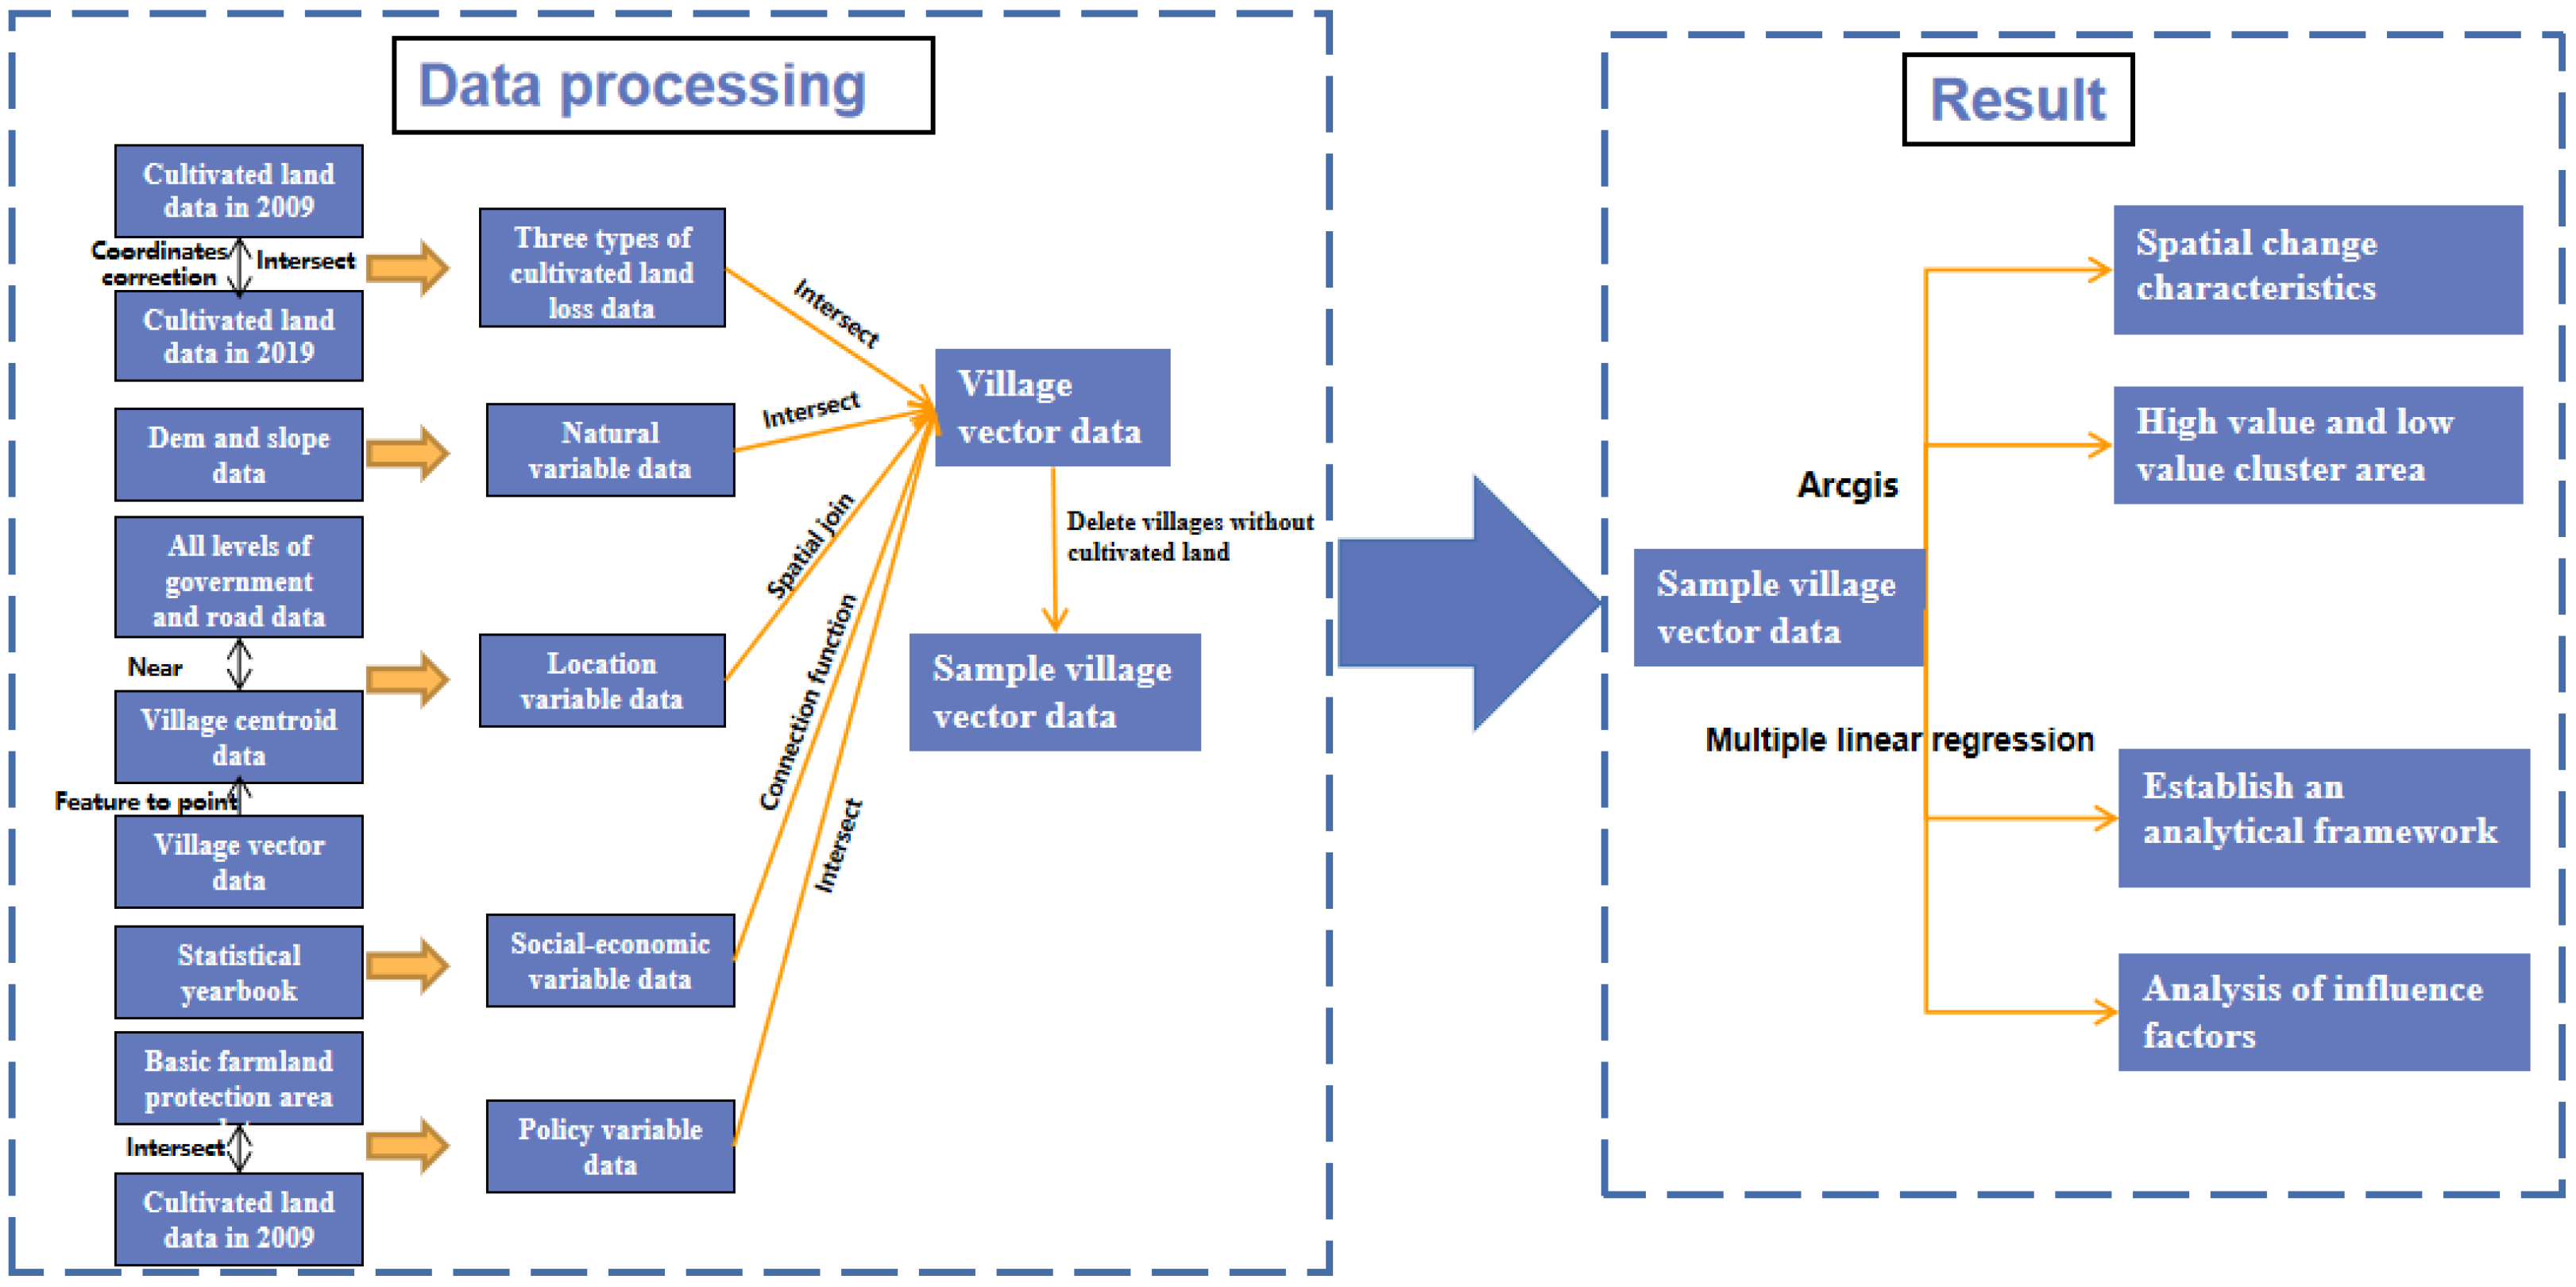
3.2.2. Data Processing

The intersect tool of the ArcGIS software was used to intersect the cultivated land maps in 2009 and 2019 to identify the loss of cultivated land in the decade. The maps and results were then overlaid with the administrative boundary of villages by which the cultivated land loss area could be calculated with the summary statistical tool. Similar methods were adopted to obtain village-level data of the three types of cultivated land loss, respectively. The distances between villages and multilevel administrative centers, the nearest road, and the nearest rivers were calculated through the following two steps. First, the centroid points of each village were obtained by using the feature to point tool in ArcGIS software. Second, the near tool was used to calculate the distance from the centroid point of each village to the abovementioned features. The village-level indicators were then used to estimate the multiple linear regression models. The detailed technical process is shown in Figure 3.

3.3. Methods

Using villages as research samples, this study analyzed the spatial distribution characteristics of three types of cultivated land loss in Tai’an Prefecture. In addition, the factors influencing the three types of cultivated land loss are discussed. The research methods were primarily based on the following three aspects:

3.3.1. Spatial Distribution Characteristics of Cultivated Land Loss

Cultivated land loss refers to the conversion of farmland to other land use types. Cultivated land loss can be divided into nonagricultural, nongrain, and ecological conversion of cultivated land. Nongrain conversion refers to the process of converting farmland into garden land and pit ponds. Ecological conversion refers to the conversion of farmlands into woodlands and grasslands. Nonagricultural conversion is a process in which farmland is transformed into nonagricultural land for residence, commerce, industry, and transportation.
This study uses the rate of cultivated land loss, the rate of nongrain conversion of cultivated land, rate of ecological conversion of cultivated land, and rate of nonagricultural conversion of cultivated land to represent the severity of cultivated land loss in total and the three reasons, respectively. The formula is as follows:
Y i = b i a i = 1,2 , 3,4
where Yi represents the rate of cultivated land loss, rate of nongrain conversion of cultivated land, rate of ecological conversion of cultivated land, and rate of nonagricultural conversion of cultivated land in the region. bi represents the total area of conversion from farmland to non-farmland, area of conversion from farmland to garden land and pit pond land, area of conversion from farmland to forest land and grassland, and area of conversion from farmland to nonagricultural land during the study period. a is the area of farmland in the initial period.

3.3.2. Getis–Ord Gi

In order to further explore the degree of spatial correlation of cultivated land loss between a village and its surrounding villages, this paper uses the local correlation index G* proposed by Ord and Getis to identify the spatial agglomeration areas of high value (hot spot) and low value (cold spot) of cultivated land loss in Tai’an Prefecture. The specific formula of Getis–Ord local statistical index G* is as follows:
G i d = j = 1 n W i j d X j / j = 1 n X j ,
The standardized statistic for Gi* (d) test is
Z G i = G i E G i V a r G i ,
where Xj is the attribute value of spatial unit j; Wij is the weight; and E(Gi*) and Var(Gi*) are the mathematical expectation and coefficient of variation of Gi*(d), respectively. Z(Gi*) is significantly positive, indicating that village i is a high-value aggregation area of cultivated land loss, which is a hotspot for cultivated land loss. Z(Gi*) is significantly negative, indicating that village i is a low-value aggregated area of cultivated land loss and belongs to the cold spot area of cultivated land loss.

3.3.3. Empirical Model

In this study, an econometric model was used to analyze the factors influencing the cultivated land loss, nonagricultural conversion, nongrain conversion, and ecological conversion of cultivated land. The calculation formula is as follows:
Y = μ + β 1 X 1 + β 2 X 2 + β 3 X 3 + β n X n + ε ,
where Y is the dependent variable, μ is the constant term, X1, X2, X3, … Xn are all independent variables, β1, β2, β3, … βn represent the regression coefficients of the corresponding independent variables, respectively, and ε represents the random error.
  • (1) Dependent variables
The dependent variables of the model are the rate of cultivated land loss, rate of nongrain conversion, rate of ecological conversion, and rate of nonagricultural conversion.
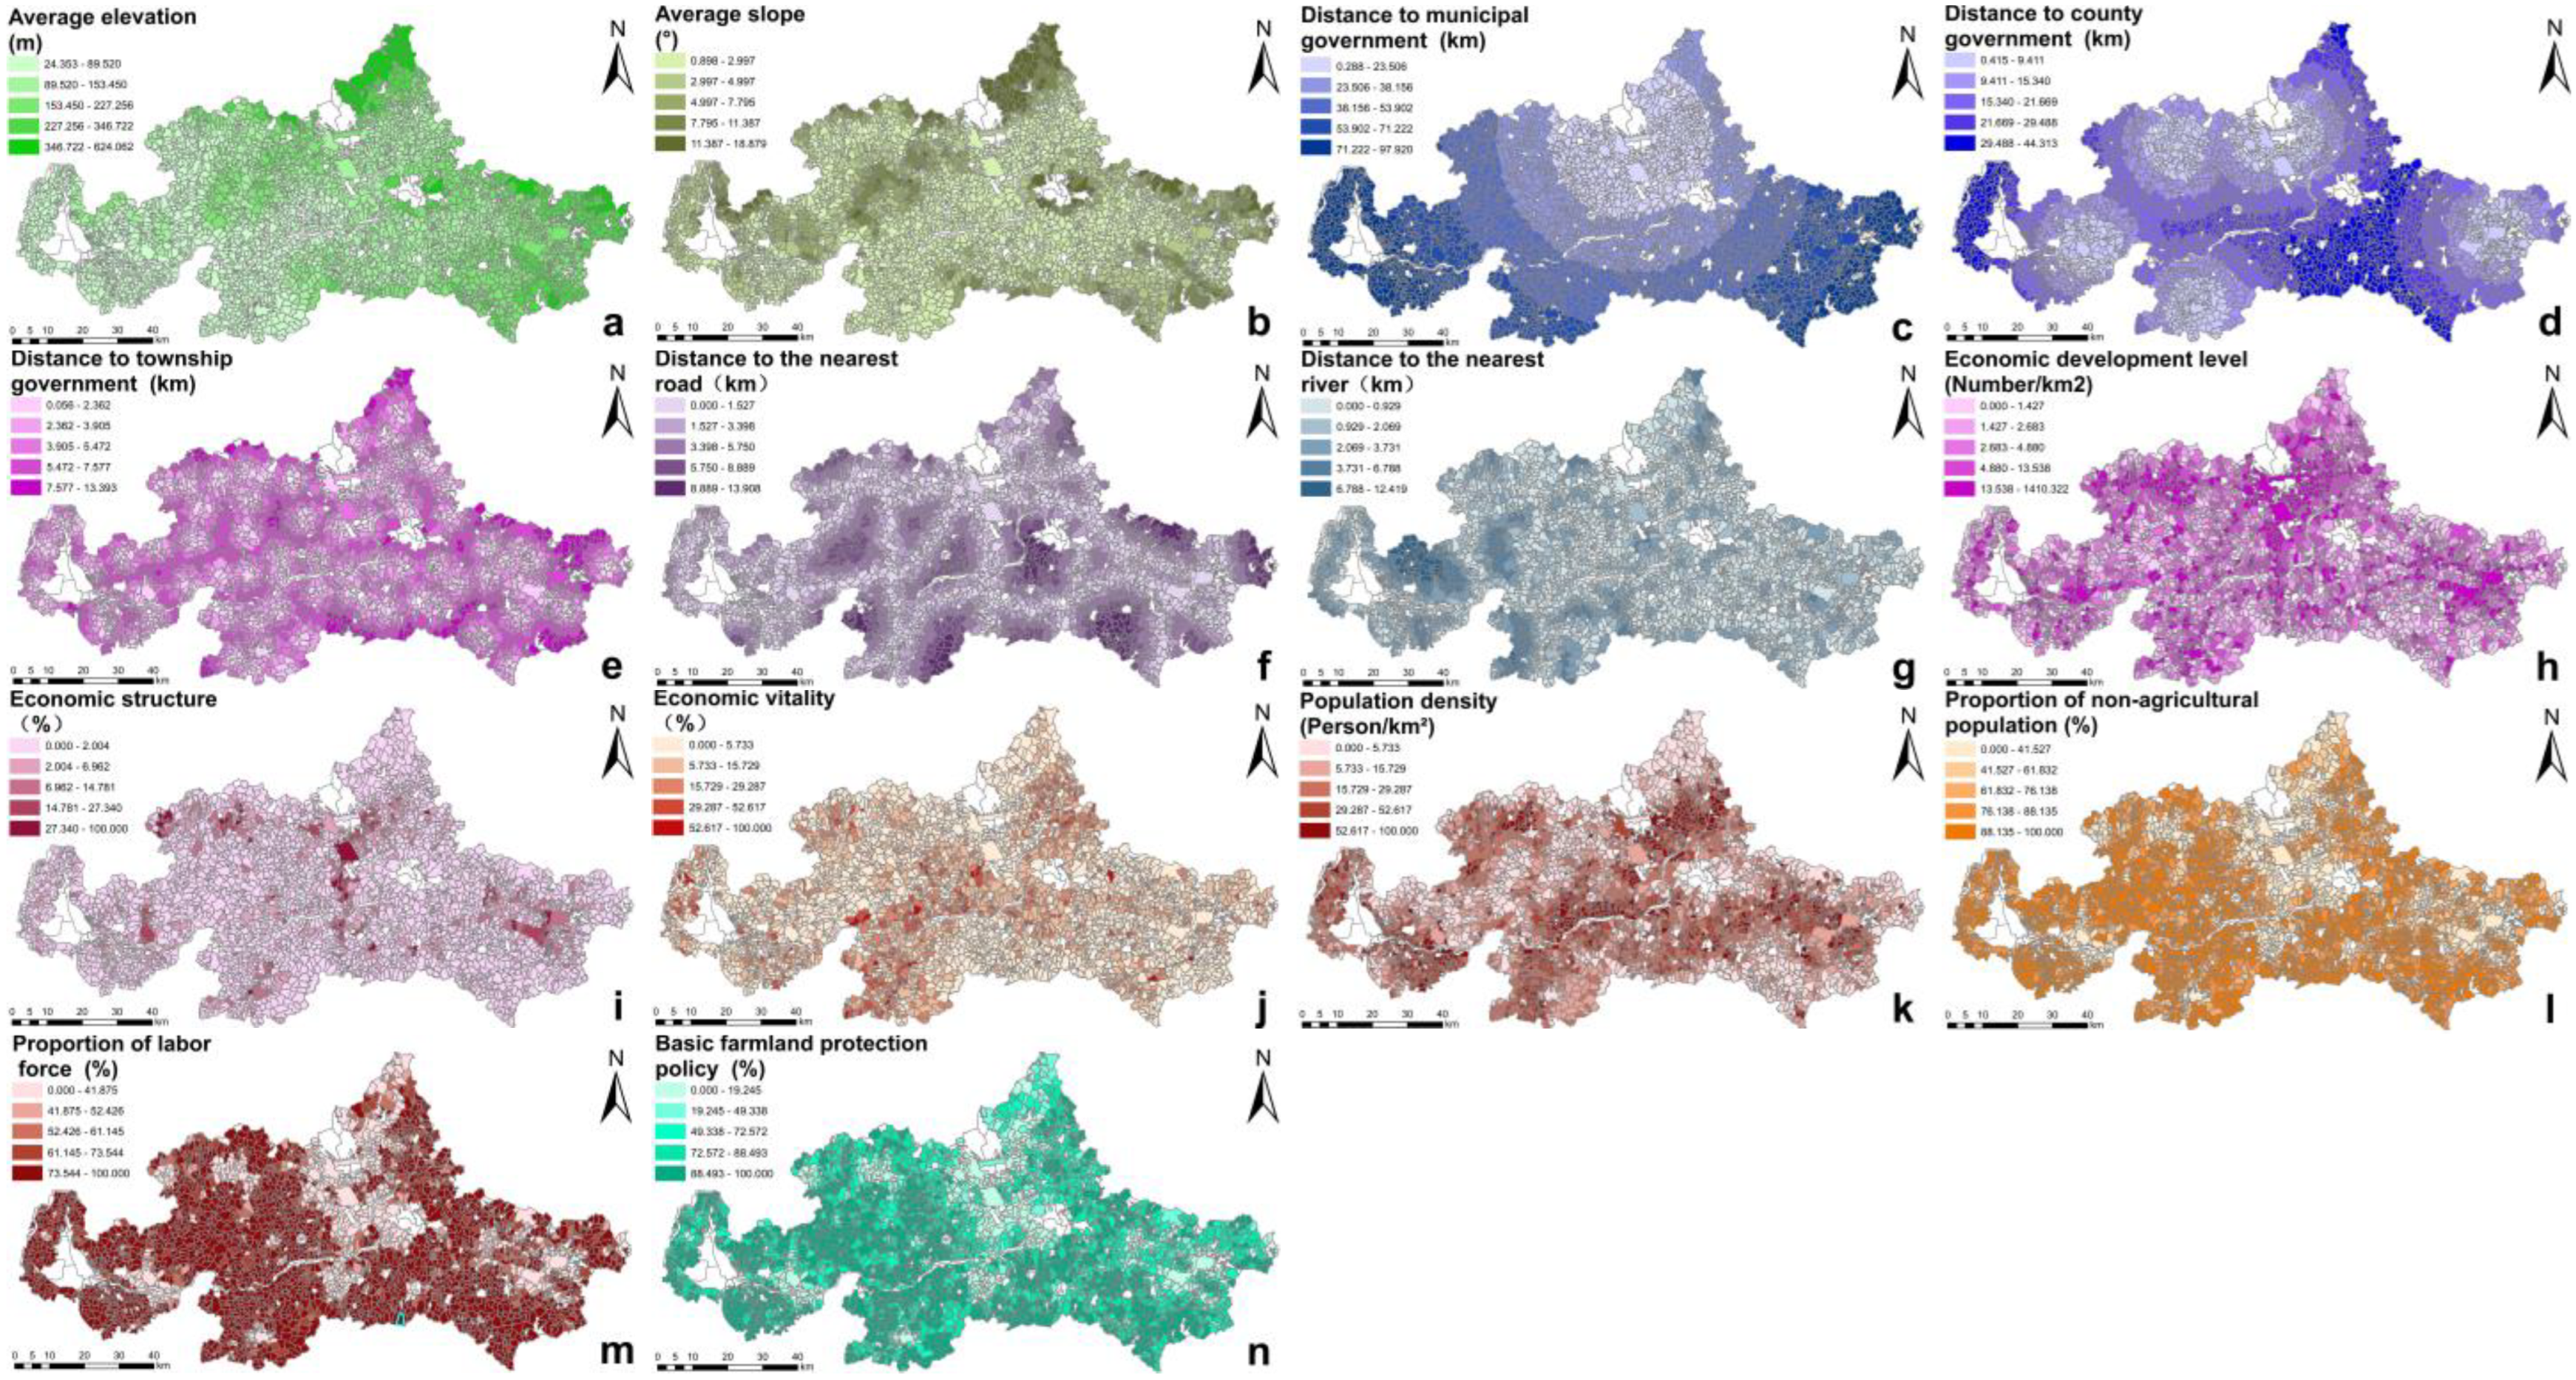
  • (2) Independent variables
According to the previous analytical framework, this study analyzed the influence of various variables on the rate of cultivated land loss, rate of nongrain conversion, rate of ecological conversion, and rate of nonagricultural conversion from five aspects: natural conditions, location factors, economic factors, social factors, and policy factors. The spatial distribution of each influencing factor is shown in Figure 4.
Natural conditions: The average elevation and terrain slope of the villages were selected to reflect the impact of natural conditions on cultivated land loss.
Location factors: The distance between villages and municipal governments, the distance between villages and county governments, the distance between villages and township governments, the distance between villages and roads, and the distance between villages and rivers were selected to reflect the influence of location factors on cultivated land loss.
Economic factors: POI density, the proportion of industrial land area, and the proportion of land transfer area of villages were selected to reflect the impact of the villages’ economic development level, industrial structure, and economic vitality on cultivated land loss.
Social factors: this study selected population density, the proportion of the nonagricultural population, and the proportion of the labor force to reflect the impact of social factors on cultivated land loss.
Policy factors: In China, the basic farmland protection policy is the most critical policy tool for the government to protect cultivated land [41]. In this study, the ratio of the basic farmland area to cultivated land area was selected to reflect the impact of the basic farmland protection policy on cultivated land loss.

4. Results

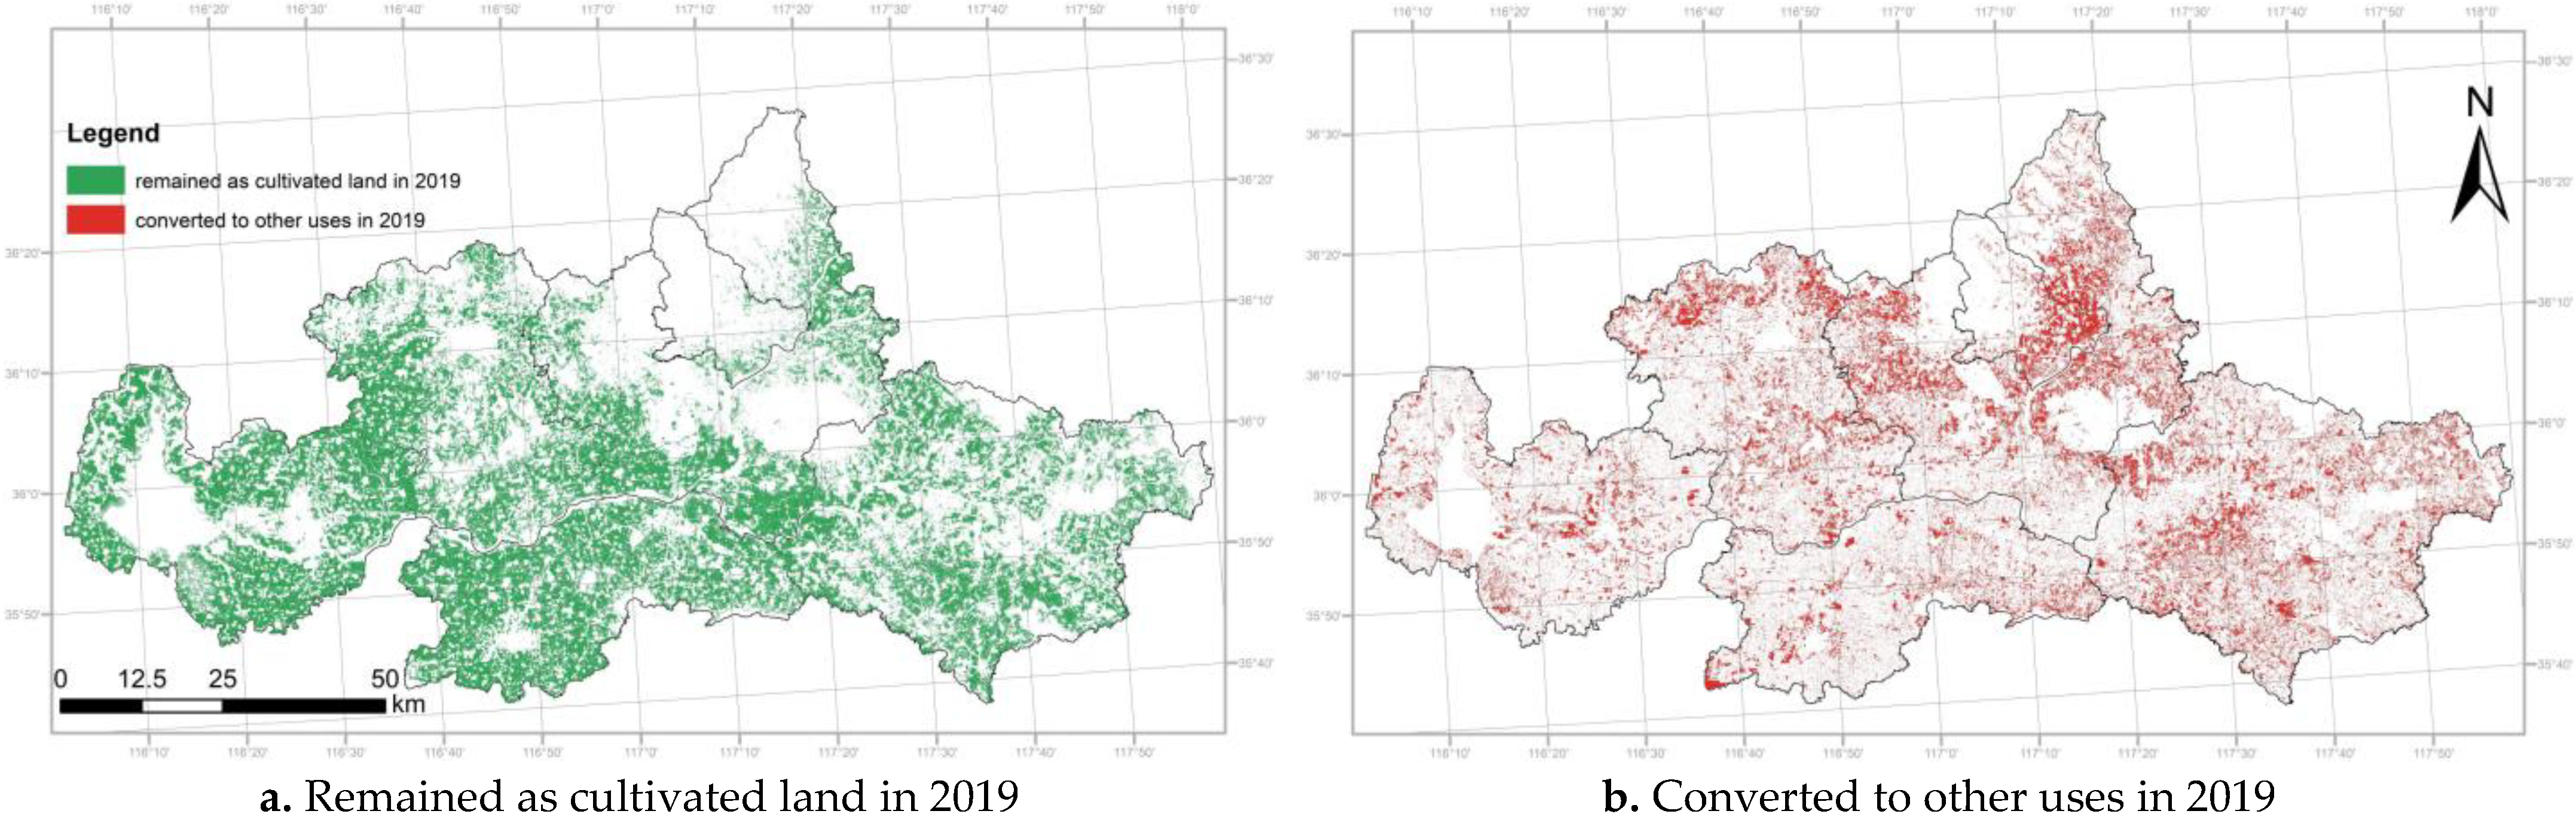
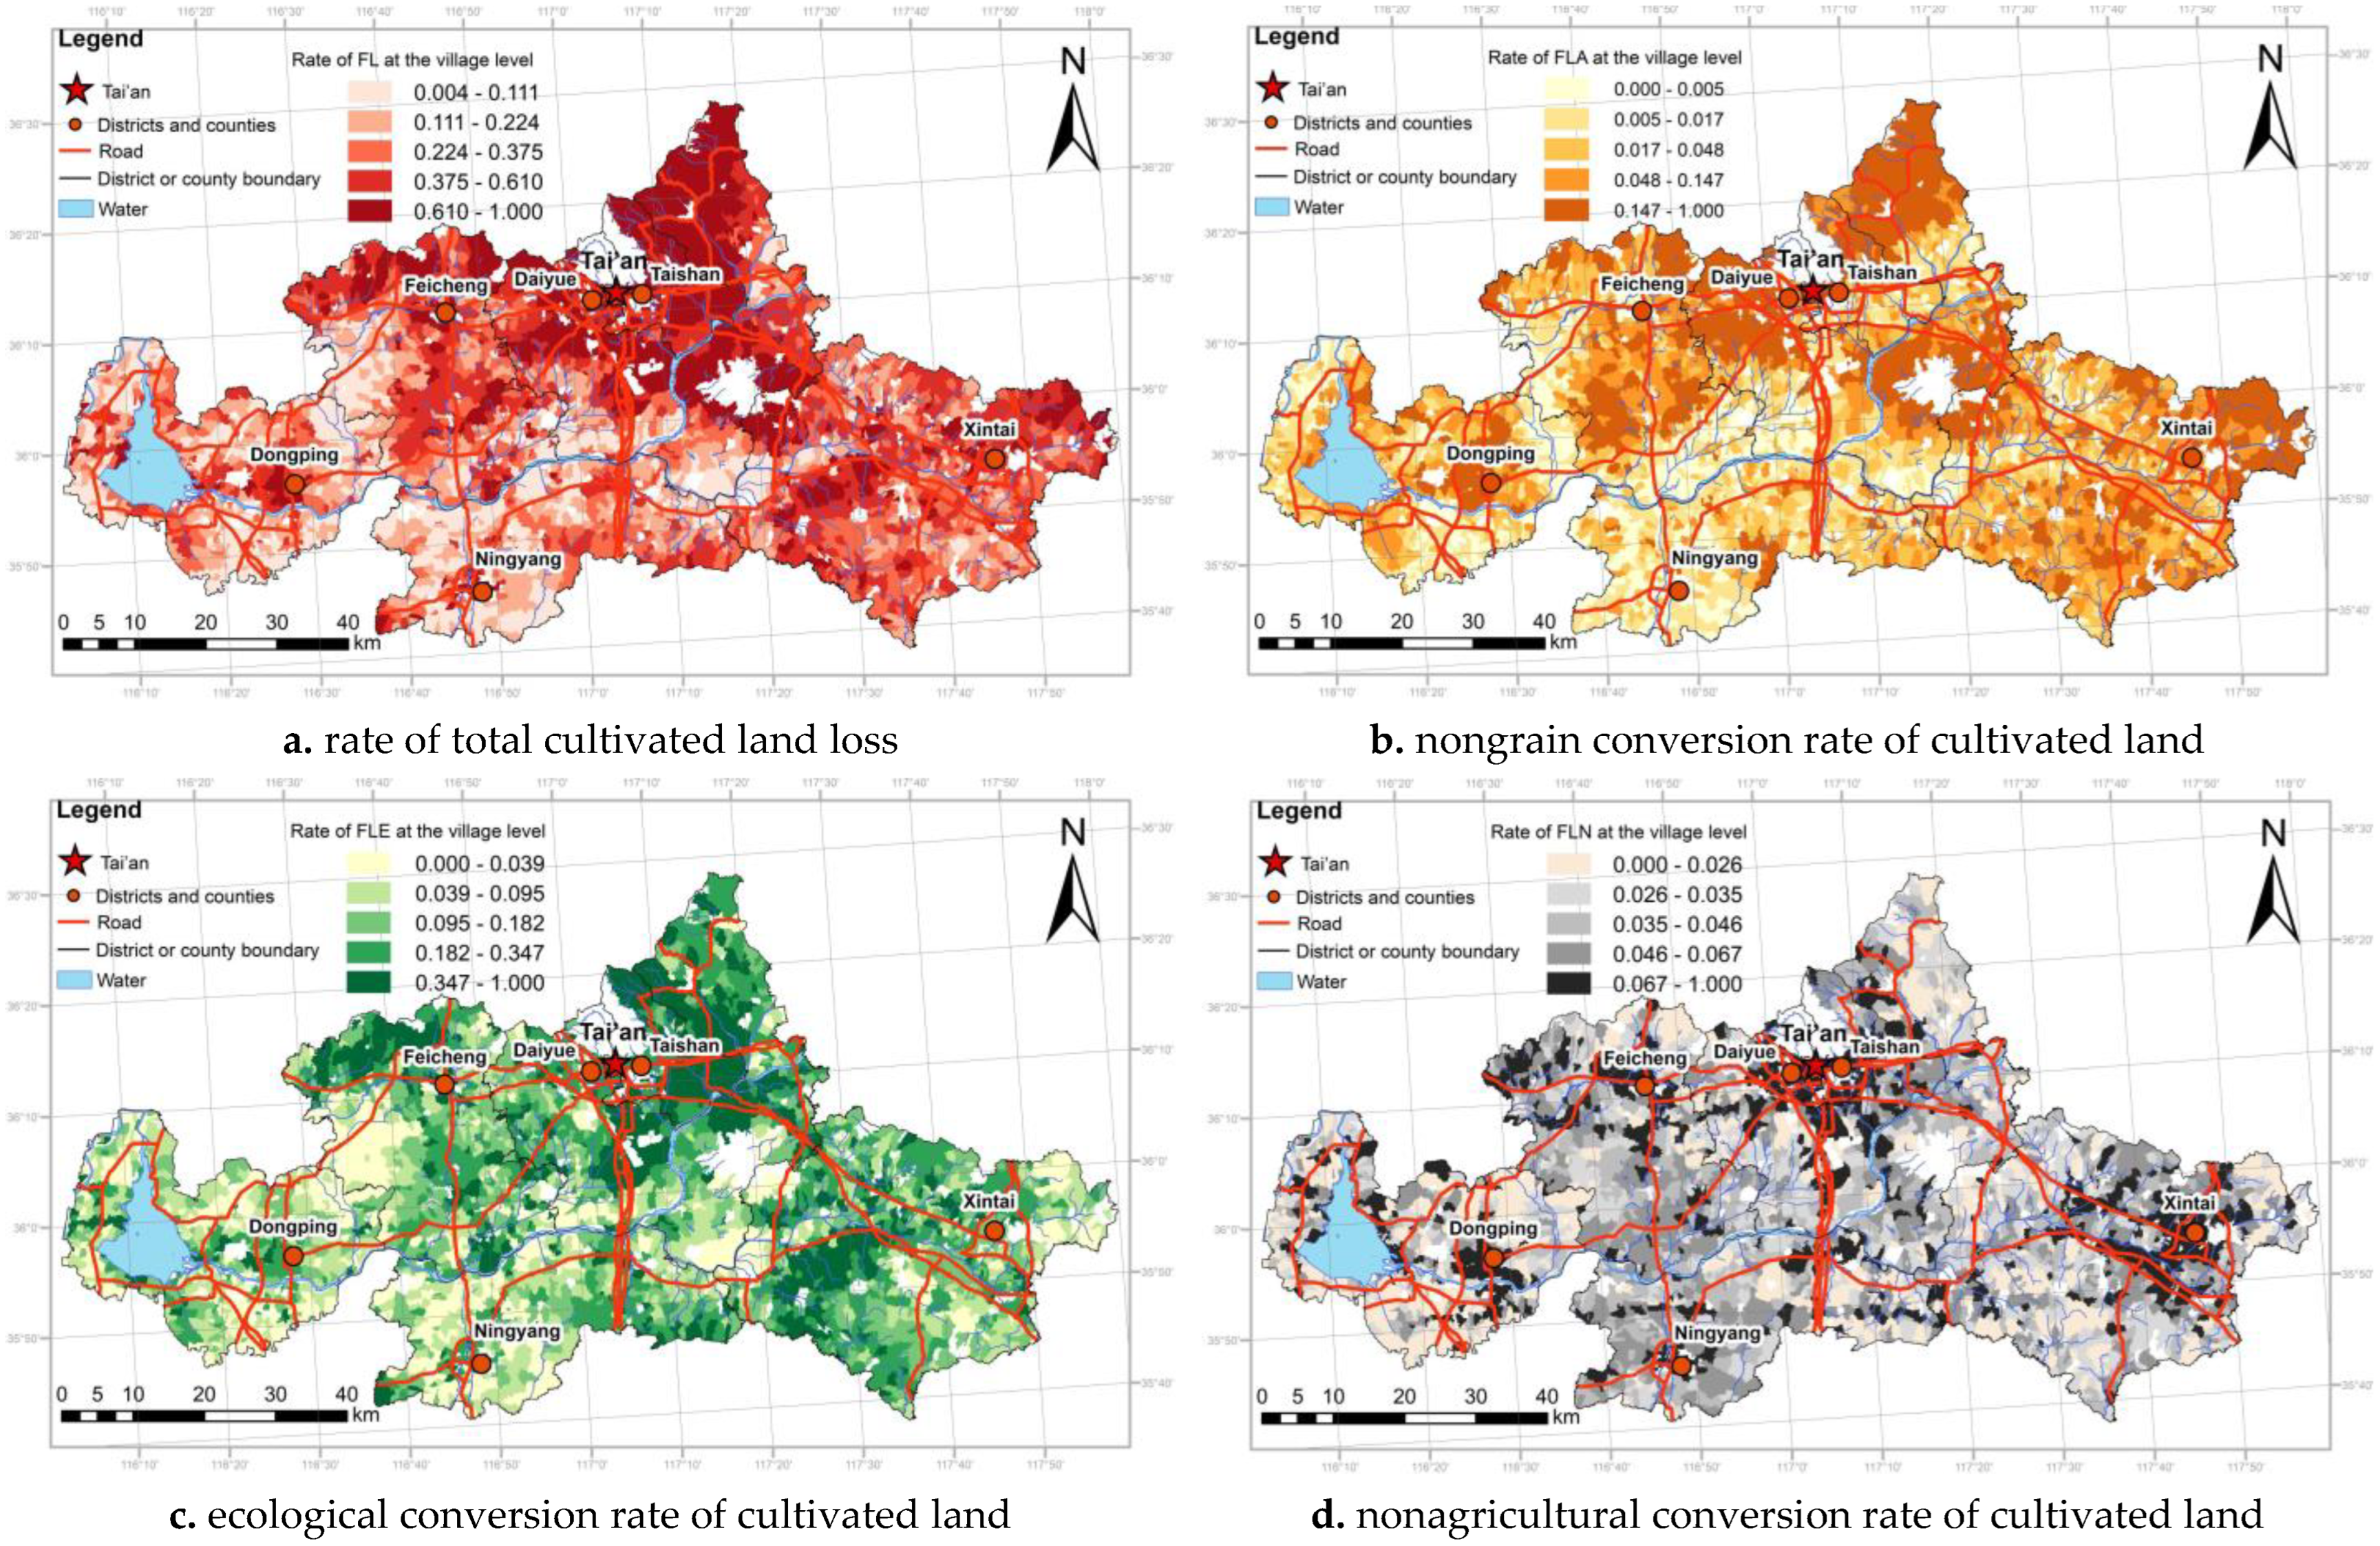
4.1. Spatial Distribution Characteristics of Cultivated Land Loss

4.1.1. Spatial Disparity of Cultivated Land Loss

Cultivated land loss is common and severe in the Tai’an Prefecture, where all districts (counties) have experienced cultivated land loss. The total area of cultivated land was 4125.4 km2 in 2009, which decreased by 1338.3 km2 from 2009 to 2019, and the rate of cultivated land loss was 32.4% (Table 2). In this decade, nearly a third of farmland was converted to other uses. Among the three reasons of cultivated land loss, ecological conversion has been the dominant one, with an area of 744.4 km2, accounting for 55.6% of the total loss.
The spatial distribution characteristics of the cultivated land loss rate in Tai’an Prefecture gradually decreased from the northeast to the southwest (Figure 5a). The highest rate of cultivated land loss was found in the Taishan District, which was as high as 76.2%. The sub-core areas of cultivated land loss were Daiyue, Xintai, and Feicheng. Ningyang and Dongping experienced a relatively slight loss of farmland. The two counties are relatively far from the central city and less-developed; therefore, they undertake more grain production tasks, and farmland has been effectively protected. The rate of cultivated land loss is higher in economically developed areas closer to urban centers. Economic factors and distance from urban centers may have great impacts on the loss of cultivated land.
The rates of nonagricultural, nongrain, and ecological conversion of cultivated land also showed similar but different spatial distributions (Figure 5). The rate of nongrain conversion showed a decreasing trend from the central city to the periphery and from the main roads to remote areas (Figure 5b). The results suggest that the distance to the central market may play an important role in the expansion of more profitable cash crops. The ecological conversion rate increased with the elevation (Figure 5c). It was the highest in mountainous Taishan District and the lowest in lowland Dongping County. The spatial distribution characteristics of the nonagricultural conversion rate showed a decreasing trend from the central city and county seats to the periphery (Figure 5d). The farther away from prefectural and county governments, the lower the rate of nonagricultural conversion.

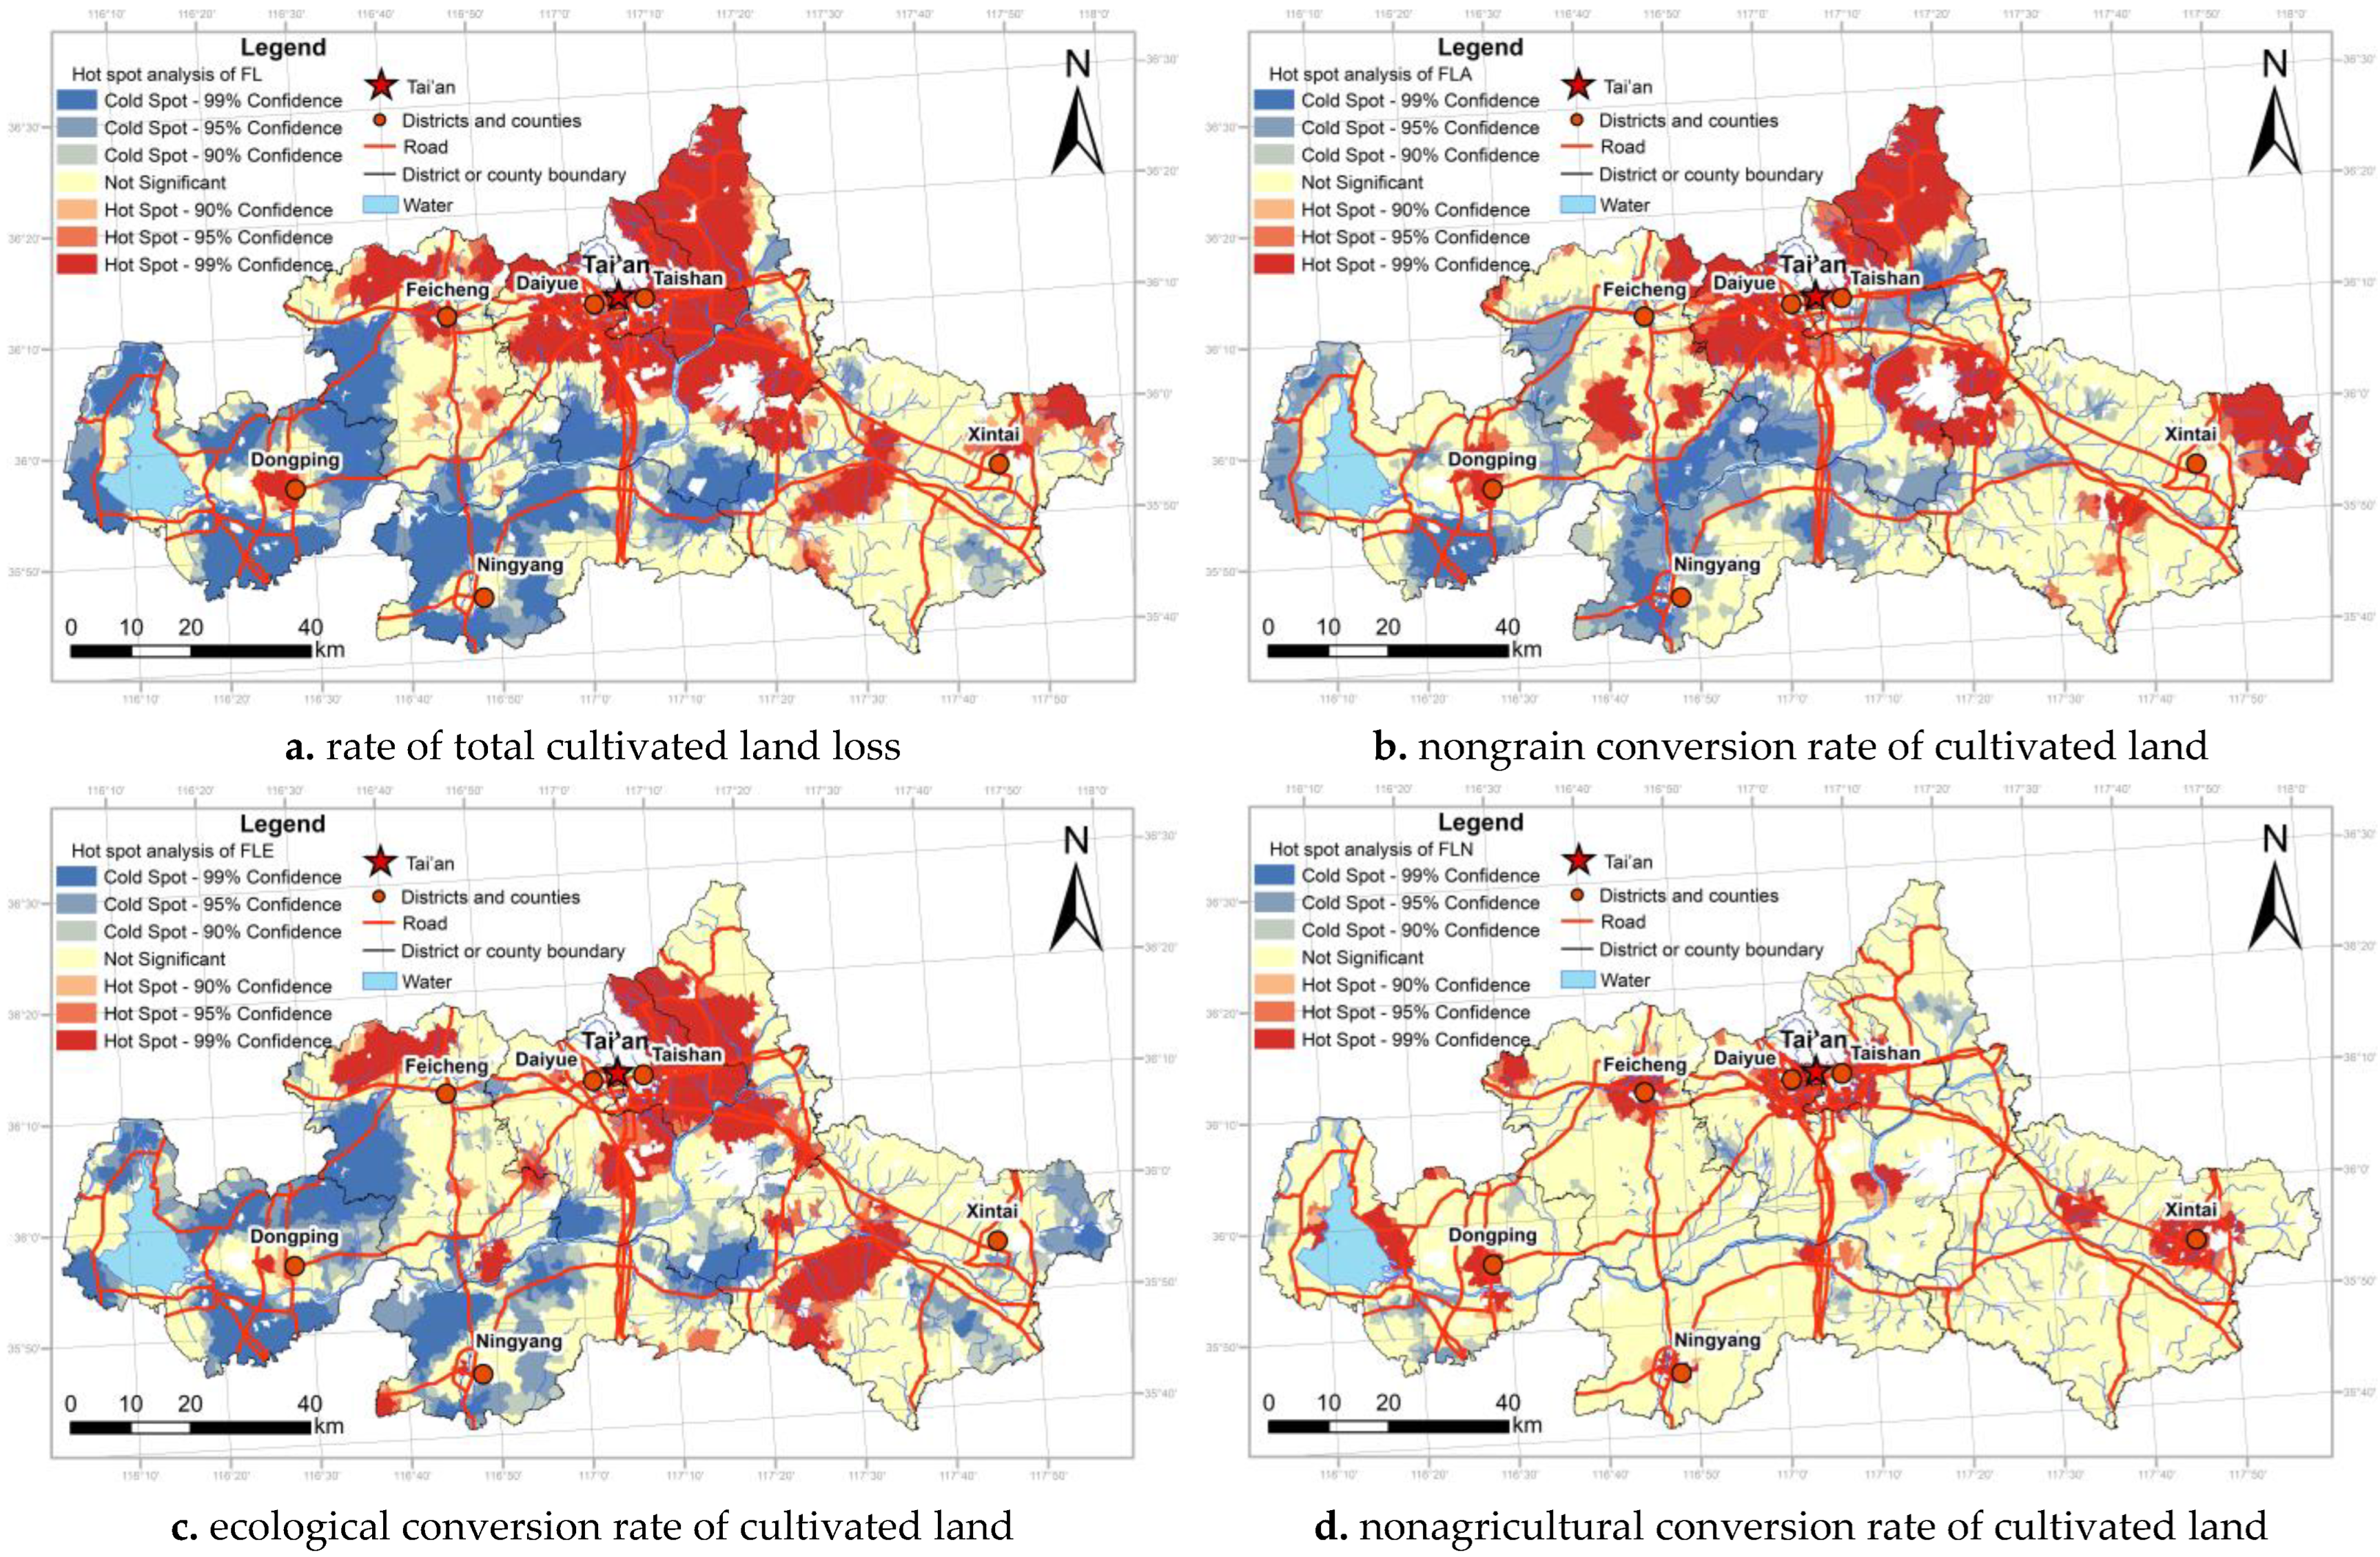
4.1.2. Spatial Agglomeration of Cultivated Land Loss

Because most land use decisions made by peasants are based on the maximization of personal interests, the high economic returns of one rural household obtained from the change in farmland use motivate the surrounding residents to engage in the same type of economic activity [62]. Therefore, spatial autocorrelation was used to explore the spatial agglomeration characteristics of the overall and three types of cultivated land loss.
Figure 6 shows that there are obvious hot- and cold-spot areas in the rates of cultivated land loss in total and the three types. The hotspots of cultivated land loss are mainly distributed in the northeast and the villages around the district and county governments in the southwest (Figure 6a). This is because there is more demand for development in villages closer to urban centers. The cold spots of cultivated land loss are mainly distributed in the villages on the southwestern edge of the metropolitan area, which is relatively far from the central city. These remote areas are relatively underdeveloped and undertake more agricultural production tasks. Therefore, farmland was effectively protected in these areas.
Hotspot areas of nonagricultural, nongrain, and ecological conversion of cultivated land showed significant spatial differences. The hotspot area of nongrain conversion of cultivated land concentrated surrounding the central city (Figure 6b). The hotspot areas for the ecological conversion of cultivated land were mainly distributed in the suburb of the central city and mountainous eastern areas (Figure 6c). The hotspot areas of nonagricultural conversion of cultivated land present a polycentric spatial distribution feature (Figure 6d), which is mainly concentrated in villages around prefectural and county governments.

4.2. Influencing Factors of Cultivated Land Loss

Based on the previous analysis of the spatial distribution characteristics of cultivated land loss in Tai’an Prefecture, this study used 3392 villages from the same area as research samples. Influence of natural conditions, location, economic, social, and policy factors on the rate of cultivated land loss, the rate of nonagricultural, nongrain, and ecological conversion of cultivated land in villages in Tai’an prefecture were quantitatively analyzed using an econometric model. Table 3 shows the regression results.
Regarding natural conditions, altitude and slope are positively correlated with the rate of cultivated land loss and nongrain conversion of cultivated land, which is consistent with the results reported by Liao et al. (2021). This is because terrain conditions seriously hinder the development of agricultural mechanization in mountainous and hilly areas, resulting in a growing gap between labor productivity in mountainous and hilly areas and that in plain areas. In this case, farmers can only improve their agricultural production profits through nongrain conversion of cultivated land.
Regarding location factors, distance to the central city was negatively correlated with the rate of cultivated land loss (β = −0.285), the rate of nongrain conversion of cultivated land (β = −0.131), and the rate of ecological conversion of cultivated land (β = −0.277). This shows that the diversified market demand for agricultural products is generated mainly by the central city of Tai’an. However, villages far away from the urban center and less developed areas bear more tasks of food production, so farmland has been effectively protected. This result is also consistent with the hotspot area distribution of cultivated land loss (Figure 6a). The distance to district and county governments is negatively correlated with the rate of nonagricultural conversion of cultivated land, indicating that there is a large construction demand around district and county governments, which increases farmland occupation. Therefore, the hotspot areas of the nonagricultural conversion present a polycentric spatial distribution pattern (Figure 6d). The distance to the road was negatively correlated with the ecological conversion of cultivated land (β = −0.104).
Almost all economic factors have a significant relationship with the rate of cultivated land loss and the rate of agricultural, nongrain, and ecological conversion of cultivated land. Indicators of the level of economic development and industrial structure show a significant negative correlation with the nongrain conversion of cultivated land. This is because villages with low levels of economic development are driven by the interests of economic development demand and pursue the maximization of economic benefits. Furthermore, they greatly increase the proportion of cash crops planted, leading to nongrain conversion of cultivated land. However, the indicators of the economic development level and industrial structure are significantly positively correlated with the ecological and nonagricultural conversion of cultivated land, indicating that the negative effects of rapid economic development and industrial structure change may be the main reason for the ecological and nonagricultural conversion of cultivated land. In addition, economic activity is positively correlated with the ecological conversion of cultivated land, whereas it is negatively correlated with the nonagricultural conversion of cultivated land. This is because, in villages with high economic activity, farmers can realize large-scale farming through land transfer to improve their income. However, with the increasing proportion of land transfer, land transfer costs have become one of the main costs of agricultural production. Planting more efficient forest products on farmlands can offset the rising costs of land transfer.
Regarding social factors, population density had a strong positive correlation with the rate of cultivated land loss (β = 0.122) and the rate of nonagricultural conversion of cultivated land (β = 0.325), indicating that an increase in population size produces a large demand for construction land. As the main source of construction land, farmland inevitably becomes nonagricultural. There was a strong positive correlation between the proportion of the nonagricultural population and the rate of ecological conversion of cultivated land because the increase in employment opportunities in nonagricultural industries also weakens the social security function of farmlands. In this case, farmers are more willing to switch to nonagricultural employment and invest in extensive farming patterns. The basic farmland protection policy has a negative correlation with the rate of cultivated land loss, nongrain conversion, and ecological conversion and nonagricultural conversion. This shows that the basic farmland protection policy was found effective in preventing cultivated land from all types of conversion.

5. Discussion

Although three types of cultivated land loss have shared the core–periphery pattern of spatial distribution, their differences are apparent as well. Nongrain conversion is found significantly more in areas near main roads than remote areas, indicating the importance of accessibility to regional transportation system for profitable cash crops. Demand for large-scale and diversified agricultural products has been generated not only by local market of the central city but also by the accessibility to regional and national market through the high-level road system. Ecological conversion of cultivated land is closely associated with geographical landscape and the rate is the highest in mountainous areas. Urban greening in the suburb of the central city and massive planting of barren mountains have been the two main reasons for China’s growing forest area, which has been found in previous studies and confirmed in this case study. The hotspot areas of nonagricultural conversion of cultivated land present a polycentric spatial distribution feature, which is mainly concentrated in villages around the central city and county seats. This is because, under the urban administrative management system of cities and counties, the expansion of construction land is characterized by obvious polycentric expansion [63]. Farmlands close to urban and county governments are inexpensive to develop and the existing infrastructure is an inherent advantage compared to rural areas far from cities.
The basic farmland protection policy was found effective in preventing cultivated land from all types of conversion. Its negative correlation with the rate of cultivated land loss and nonagricultural conversion found in this study is consistent with the results of most previous studies [26,40], indicating that the policy plays a positive role in controlling cultivated land loss, especially the nonagricultural conversion of cultivated land because the policy focuses more on the suppression of nonagricultural uses, such as urban construction. Su et al. studied the impact of policies on cultivated land loss and found that the basic farmland protection policy promoted the nongrain conversion of cultivated land and the ecological conversion of cultivated land [23]. This differs from the results of our study, in which the basic farmland protection policy had a negative impact on the rate of nongrain conversion of cultivated land and the rate of ecological conversion of cultivated land, indicating that the policy played a positive role in controlling the conversion of farmland to forestland and garden land.
Based on the main findings of this research, three policy recommendations are proposed. (1) A typological and spatially heterogenous perspective is urged in land management in general and cultivated land protection in particular. In the era of rapid urbanization, cultivated land loss is caused not only by nonagricultural uses, but also by the nongrain and ecological conversion [31,52,62]. The typological and integrated analysis of this study on cultivated land loss revealed its spatially heterogenous structure and determinants. Therefore, delicacy management strategies should be adopted in spatial planning and land policies. For example, the close restraint on cultivated land conversion is reasonable in general and for nonagricultural and ecological uses, while it is not a valid reason for preventing conversion for nongrain uses to meet people’s increasing demand for food diversification. Ecological development might be important for many regions. However, conversion of cultivated land for ecological uses is often reasonable in hilly areas and urban fringe but not a good choice for most plain areas.
(2) Land transfer promotion policy should not legalize the nongrain conversion of cultivated land and pose new threat to food security in populous China. In China, land transfer for developing large-scale farming has been seen as almost the only way to develop modern agriculture and enhance the international competitiveness of agricultural products [62,64]. While land transfer brings social and economic benefits, it also leads to the transformation of farmland from grain cultivation to other types of agricultural production with higher interest, thus triggering the government’s concern about food security [23,43]. Therefore, when encouraging the transfer of land operation rights from individual farmers to agricultural cooperatives or enterprises, local governments should not only regulate land use but also clarify the use of farmland and crop types through land transfer contracts to ensure food security.
(3) The cultivated land protection is facing new challenges and needs to be enhanced. In contrast to the results of Su et al. [23], this study found that the basic farmland protection policy played a significant role in controlling all of the three types of cultivated land loss. Nevertheless, we also find great potential threats to farmland protection and food security in China. In metropolitan areas, the nongrain and ecological conversion of cultivated land remain serious and tend to spatially agglomerate. This is because farmers’ land use decisions are easily influenced by those of surrounding farmers [62]. The high returns obtained from nongrain and ecological conversion of cultivated land will strongly stimulate surrounding farmers to plant more efficient cash crops and forest products and then promote the same type of cultivated land loss in adjacent areas (Figure 6b,c). Therefore, for sustainable food production in the future, the primary farmland policy should be insisted on and more high-quality farmland should be designated as farmland protection areas. In addition, the government should make full use of satellite remote sensing technology to monitor the actual use of farmland and gradually strengthen the responsibility of primary farmland protection in ensuring food security in the long run.

6. Conclusions and Future Work

This study proposed a typological interpretation of cultivated land loss by distinguishing the land converted to nonagricultural, nongrain, and ecological uses. The spatial patterns and influencing factors of overall and three types of cultivated land loss were investigated by taking a major grain-producing area, Tai’an prefecture, in the North China Plain as the case study, using spatially refined land use survey data in 2009 and 2019, incorporating village-level geographical, statistical and big data, and adopting GIS methods and econometric models.
The results were summarized the following. The cultivated land area in Tai’an Prefecture decreased by 1338.3 km2 over the decade, which was 32.4% of that in 2009. Ecological use, rather than the widely blamed urban expansion, was the dominant reason, accounting for 55.6% of the total loss of cultivated land. The hotspot areas of cultivated land loss were mainly distributed in the northeastern mountainous area and villages around cities and county seats in the southwest. The hotspot areas of nongrain and ecological conversion were mainly located around the central city, whereas those of nonagricultural conversion were the most extensive around county centers. The factors were found to have heterogeneous effects on the three types of cultivated land loss. For example, land transfer is conducive to large-scale farming and is thus associated with a lower probability of nonagricultural conversion of cultivated land. However, it often facilitates ecological conversion of cultivated land. The basic farmland protection policy was proven to be effective in preventing all three types of cultivated land loss.
The above results indicate the great heterogeneity among the three types of cultivated land loss in their geography and determinants, demonstrating the necessity and significance of the typological perspective adopted to interpreting cultivated land loss in urbanizing and transitional societies. To some extent, only by reasonably distinguishing, spatially analyzing, and fully understanding the different types, various causes, and internal structure of cultivated land loss can we formulate more targeted and effective policies of cultivated land protection.
This study also has some limitations that could be improved in future work. First of all, although the GIS models used in village-level analysis have drawn insightful conclusions, their applications at parcel level are also expected to extend our knowledge on the patterns and mechanisms of cultivated land loss and thus worthy of future study. Second, this study has revealed the common and specific factors influencing various types of cultivated land loss, while how these factors have these effects has remained vague and needs further investigation. Finally, policy has always been fundamental for land use changes and especially important for cultivated land protection. Given the natural and institutional contexts in China, it is a good case for examining the policy–practice relationship. This study is only a start point for evaluating the effectiveness of China’s well-known primary farmland policy. Much more efforts are urged in this field for its great potential in deepening the academic knowledge of land use changes and improving land policies in developing countries.

Author Contributions

Conceptualization, D.H. and T.L.; methodology, D.H., Y.C. and T.L.; software, Y.C.; validation, D.H. and Y.C.; formal analysis, Y.C.; investigation, Y.C.; resources, D.H.; data curation, Y.C.; writing—original draft preparation, D.H. and Y.C.; writing—review and editing, T.L., D.H. and M.L.; visualization, Y.C. and M.L.; supervision, D.H. and T.L.; project administration, D.H.; funding acquisition, D.H. All authors have read and agreed to the published version of the manuscript.

Funding

This research was funded by the National Natural Science Foundation of China (No: 42271262).

Data Availability Statement

Data used in this study were obtained from local land management authorities and are not publicly available.

Conflicts of Interest

The authors declare no conflict of interest.

References

  1. Bren d′Amour, C.; Reitsma, F.; Baiocchi, G.; Barthel, S.; Guneralp, B.; Erb, K.H.; Haberl, H.; Creutzig, F.; Seto, K.C. Future urban land expansion and implications for global croplands. Proc. Natl. Acad. Sci. USA 2017, 114, 8939–8944. [Google Scholar] [CrossRef] [PubMed] [Green Version]
  2. Shi, K.; Chen, Y.; Yu, B.; Xu, T.; Li, L.; Huang, C.; Liu, R.; Chen, Z.; Wu, J. Urban Expansion and Agricultural Land Loss in China: A Multiscale Perspective. Sustainability 2016, 8, 790. [Google Scholar] [CrossRef] [Green Version]
  3. Li, H.; Song, W. Spatial transformation of changes in global cultivated land. Sci. Total Environ. 2023, 859, 160194. [Google Scholar] [CrossRef] [PubMed]
  4. Qiu, T.; Luo, B.; Choy, S.T.B.; Li, Y.; He, Q. Do land renting-in and its marketization increase labor input in agriculture? Evidence from rural China. Land Use Policy 2020, 99, 104820. [Google Scholar] [CrossRef]
  5. Karen, C.S.; Navin, R. Hidden linkages between urbanization and food systems. Science 2016, 352, 943–945. [Google Scholar] [CrossRef]
  6. Walid, O.; Julien, S.; JunJie, W. Urbanization and agricultural productivity: Some lessons from European cities. J. Econ. Geogr. 2019, 19, 225–249. [Google Scholar] [CrossRef]
  7. García-Nieto, A.P.; Geijzendorffer, I.R.; Baro, F.; Roche, P.K.; Bondeau, A.; Cramer, W. Impacts of urbanization around Mediterranean cities: Changes in ecosystem service supply. Ecol. Indic. 2018, 91, 589–606. [Google Scholar] [CrossRef] [Green Version]
  8. Pribadi, D.O.; Pauleit, S. The dynamics of peri-urban agriculture during rapid urbanization of Jabodetabek Metropolitan Area. Land Use Policy 2015, 48, 13–24. [Google Scholar] [CrossRef]
  9. Ustaoglu, E.; Williams, B. Determinants of Urban Expansion and Agricultural Land Conversion in 25 EU Countries. Environ. Manag. 2017, 60, 717–746. [Google Scholar] [CrossRef]
  10. Yan, J.; Li, Y. American farmland protection policies and implications. Chin. Land Sci. 1995, 9, 47–48. [Google Scholar] [CrossRef]
  11. Prishchepov, A.V.; Müller, D.; Dubinin, M.; Baumann, M.; Radeloff, V.C. Determinants of agricultural land abandonment in post-Soviet European Russia. Land Use Policy 2013, 30, 873–884. [Google Scholar] [CrossRef] [Green Version]
  12. Tan, X.; Liu, J.; Zhang, B.; Fu, Y. Potential analysis of reserve cultivated land resources in Russia’s Far East. Soil Crops 2021, 10, 314–323. [Google Scholar]
  13. Liu, X.; Zhao, C.; Song, W. Review of the evolution of cultivated land protection policies in the period following China’s reform and liberalization. Land Use Policy 2017, 67, 660–669. [Google Scholar] [CrossRef]
  14. Jaeger, W.K.; Plantinga, A.J.; Grout, C. How has Oregon’s land use planning system affected property values? Land Use Policy 2012, 29, 62–72. [Google Scholar] [CrossRef]
  15. Tsuchiya, K.; Hara, Y.; Thaitakoo, D. Linking food and land systems for sustainable peri-urban agriculture in Bangkok Metropolitan Region. Landsc. Urban Plan. 2015, 143, 192–204. [Google Scholar] [CrossRef] [Green Version]
  16. Cheng, Q.; Jiang, P.; Cai, L.; Shan, J.; Zhang, Y.; Wang, L.; Li, M.; Li, F.; Zhu, A.; Chen, D. Delineation of a permanent basic farmland protection area around a city centre: Case study of Changzhou City, China. Land Use Policy 2017, 60, 73–89. [Google Scholar] [CrossRef]
  17. Fukase, E.; Martin, W. Who Will Feed China in the 21st Century? Income Growth and Food Demand and Supply in China. J. Agric. Econ. 2016, 67, 3–23. [Google Scholar] [CrossRef] [Green Version]
  18. Xin, L.; Li, X. China should not massively reclaim new farmland. Land Use Policy 2018, 72, 12–15. [Google Scholar] [CrossRef]
  19. Huang, Z.; Du, X.; Castillo, C. How does urbanization affect farmland protection? Evidence from China. Resour. Conserv. Recycl. 2019, 145, 139–147. [Google Scholar] [CrossRef] [Green Version]
  20. Chen, W.; Ye, X.; Li, J.; Fan, X.; Liu, Q.; Dong, W. Analyzing requisition-compensation balance of farmland policy in China through telecoupling: A case study in the middle reaches of Yangtze River Urban Agglomerations. Land Use Policy 2019, 83, 134–146. [Google Scholar] [CrossRef]
  21. Wu, X. A Review of Research on Non-Agriculturalization of Arable Land. Geogr. Geo-Inf. Sci. 2006, 22, 51–56. [Google Scholar] [CrossRef]
  22. Wu, Y.; Zhang, P.; Yu, Y.; Xie, R. Research progress and prospect of non-grain conversion of cultivated land in China from the perspective of food security. China Land Sci. 2021, 35, 9. [Google Scholar]
  23. Su, Y.; Qian, K.; Lin, L.; Wang, K.; Guan, T.; Gan, M. Identifying the driving forces of non-grain production expansion in rural China and its implications for policies on cultivated land protection. Land Use Policy 2020, 92, 104435. [Google Scholar] [CrossRef]
  24. Zhao, Y.; Li, X.; Xin, L.; Hao, H. Driving forces of “poplar expansion and cropland shrinkage” in the North China Plain: A case study of Wenan County, Hebei Province. Geogr. Res. 2012, 31, 323–333. [Google Scholar] [CrossRef]
  25. Hu, Y.; Kong, X.; Zheng, J.; Sun, J.; Wang, L.; Min, M. Urban Expansion and Farmland Loss in Beijing during 1980–2015. Sustainability 2018, 10, 3927. [Google Scholar] [CrossRef] [Green Version]
  26. Huang, D.; Jin, H.; Zhao, X.; Liu, S. Factors Influencing the Conversion of Arable Land to Urban Use and Policy Implications in Beijing, China. Sustainability 2014, 7, 180–194. [Google Scholar] [CrossRef] [Green Version]
  27. Huang, D.; Huang, J.; Liu, T. Delimiting urban growth boundaries using the CLUE-S model with village administrative boundaries. Land Use Policy 2019, 82, 422–435. [Google Scholar] [CrossRef]
  28. Wu, Y.; Yang, G.; Wang, R. Advances in Researches on Relations between Cultivated Land Change and Socio-economic Development. Prog. Geogr. 2008, 27, 90–98. [Google Scholar]
  29. Zhou, Y.; Zhong, Z.; Cheng, G. Cultivated land loss and construction land expansion in China: Evidence from national land surveys in 1996, 2009 and 2019. Land Use Policy 2023, 125, 106496. [Google Scholar] [CrossRef]
  30. Liu, T.; Liu, H.; Qi, Y. Construction land expansion and cultivated land protection in urbanizing China: Insights from national land surveys, 1996–2006. Habitat Int. 2015, 46, 13–22. [Google Scholar] [CrossRef]
  31. Xiao, R.; Su, S.; Mai, G.; Zhang, Z.; Yang, C. Quantifying determinants of cash crop expansion and their relative effects using logistic regression modeling and variance partitioning. Int. J. Appl. Earth Obs. Geoinf. 2015, 34, 258–263. [Google Scholar] [CrossRef]
  32. Hitzhusen, F. Land resource and sustainable development-economic-policies and the common good. Am. J. Agric. Econ. 1994, 76, 337. [Google Scholar] [CrossRef]
  33. Polimeni, J.M. Simulating agricultural conversion to residential use in the Hudson River Valley: Scenario analyses and case studies. Agric. Hum. Values 2005, 22, 377–393. [Google Scholar] [CrossRef]
  34. Verburg, P.H.; Van Eck JR, R.; de Nijs, T.C.; Dijst, M.J.; Schot, P. Determinants of land-use change patterns in the Netherlands. Environ. Plan. B Plan. Des. 2004, 31, 125–150. [Google Scholar] [CrossRef] [Green Version]
  35. Liao, L.; Gao, X.; Long, H.; Tang, L.; Chen, K.; Ma, E. A comparative study of farmland use morphology in plain and mountainous areas based on farmers’ land use efficiency. Acta Geogr. Sin. 2021, 76, 471–486. [Google Scholar] [CrossRef]
  36. Mueller, D.; Leitao, P.J.; Sikor, T. Comparing the determinants of cropland abandonment in Albania and Romania using boosted regression trees. Agric. Syst. 2013, 117, 66–77. [Google Scholar] [CrossRef]
  37. Jiang, G.; Wang, M.; Qu, Y.; Zhou, D.; Ma, W. Towards cultivated land multifunction assessment in China: Applying the “influencing factors-functions-products-demands” integrated framework. Land Use Policy 2020, 99, 104982. [Google Scholar] [CrossRef]
  38. Xiao, R.; Liu, Y.; Huang, X.; Shi, R.; Yu, W.; Zhang, T. Exploring the driving forces of farmland loss under rapidurbanization using binary logistic regression and spatial regression: A case study of Shanghai and Hangzhou Bay. Ecol. Indic. 2018, 95, 455–467. [Google Scholar] [CrossRef]
  39. Von Thunen, J.H.; Wartenberg, C.M.; Hall, P. Von Thunen’s Isolated State: An English Edition of Der Isolierte Staat; Pergamon Press: Oxford, UK, 1966. [Google Scholar]
  40. Cheng, L.; Jiang, P.; Chen, w.; Li, M.; Wang, L.; Gong, Y.; Pian, Y.; Xia, N.; Duan, Y.; Huang, Q. Farmland protection policies and rapid urbanization in China: A case study for Changzhou City. Land Use Policy 2015, 48, 552–566. [Google Scholar] [CrossRef]
  41. Huang, D.; Tan, X.; Liu, T.; Chu, E.; Kong, F. Effects of Hierarchical City Centers on the Intensity and Direction of Urban Land Expansion: A Case Study of Beijing. Land 2020, 9, 312. [Google Scholar] [CrossRef]
  42. Dong, X.; Huang, J.; Scott, R.; Wang, H. Study on geographical location transportation infrastructure and planting structure adjustment. Manag. World 2006, 9, 59–63+79. [Google Scholar] [CrossRef]
  43. Kong, X. The Problems, causes and countermeasures of non-grain conversion of cultivated land. China Land 2020, 418, 19–21. [Google Scholar] [CrossRef]
  44. Qin, X.; Li, Y.; Lu, Z.; Pan, W. What makes better village economic development in traditional agricultural areas of China? Evidence from 338 villages. Habitat Int. 2020, 106, 102286. [Google Scholar] [CrossRef]
  45. Zhu, D. Economic mechanism and governance path of non-grain conversion of cultivated land. China Land 2021, 7, 9–11. [Google Scholar] [CrossRef]
  46. Xu, M.; Zhang, Z. Spatial differentiation characteristics and driving mechanism of rural-industrial Land transition: A case study of Beijing-Tianjin-Hebei region, China. Land Use Policy 2021, 102, 105239. [Google Scholar] [CrossRef]
  47. Liu, X.; Xu, Y.; Engel, B.A.; Sun, S.; Zhao, X.; Wu, P.; Wang, Y. The impact of urbanization and aging on food security in developing countries: The view from Northwest China. J. Clean. Prod. 2021, 292, 126067. [Google Scholar] [CrossRef]
  48. Chen, Z.; Zhang, X.; Huang, X.; Chen, Y. Influence of government leaders’ localization on farmland conversion in Chinese cities: A “sense of place” perspective. Cities 2019, 90, 74–87. [Google Scholar] [CrossRef]
  49. Zhang, D.; Jia, Q.; Xu, X.; Yao, S.; Chen, H.; Hou, X.; Zhang, J.; Jin, G. Assessing the coordination of ecological and agricultural goals during ecological restoration efforts: A case study of Wuqi County, Northwest China. Land Use Policy 2019, 82, 550–562. [Google Scholar] [CrossRef]
  50. Wang, Y.; Chen, Y.; Yi, X.; Xiao, B. The non-grain problem in the process of land transfer and the countermeasures. Chin. J. Agric. Resour. Reg. Plan. 2011, 32, 13–16. [Google Scholar]
  51. Su, B.; Li, Y.; Li, L.; Wang, Y. How does nonfarm employment stability influence farmers’ farmland transfer decisions? Implications for China’s land use policy. Land Use Policy 2018, 74, 66–72. [Google Scholar] [CrossRef]
  52. Su, S.; Zhou, X.; Wan, C.; Li, Y.; Kong, W. Land use changes to cash crop plantations: Crop types, multilevel determinants and policy implications. Land Use Policy 2016, 50, 379–389. [Google Scholar] [CrossRef]
  53. Gao, J.; Song, G.; Sun, X. Does labor migration affect rural land transfer? Evidence from China. Land Use Policy 2020, 99, 105096. [Google Scholar] [CrossRef]
  54. Li, J.; Fang, W.; Wang, T.; Qureshi, S.; Alatalo, J.M.; Bai, Y. Correlations between Socioeconomic Drivers and Indicators of Urban Expansion: Evidence from the Heavily Urbanised Shanghai Metropolitan Area, China. Sustainability 2017, 9, 1199. [Google Scholar] [CrossRef] [Green Version]
  55. Yang, Q.; Zhang, D. The influence of agricultural industrial policy on non-grain production of cultivated land: A case study of the “one village, one product” strategy implemented in Guanzhong Plain of China. Land Use Policy 2021, 108, 105579. [Google Scholar] [CrossRef]
  56. Li, S.; Li, X.; Sun, L.; Cao, G.; Fischer, G.; Tramberend, S. An estimation of the extent of cropland abandonment in mountainous regions of China. Land Degrad. Dev. 2018, 29, 1327–1342. [Google Scholar] [CrossRef]
  57. Yan, L.; Min, Q. Discussion on Concept and Proportion of Economic Forest and Ecologic Forest in Returning Cultivated Land to Forest. Res. Soil Water Conserv. 2004, 11, 50–53. [Google Scholar]
  58. Lichtenberg, E.; Ding, C. Assessing farmland protection policy in China. Land Use Policy 2008, 25, 59–68. [Google Scholar] [CrossRef]
  59. National Bureau of Statistics of Tai’an. Tai’an Statistical Yearbook; China Statistics Press: Beijing, China, 2010.
  60. Shi, H.; Yu, K.; Feng, Y.; Dong, X.; Zhao, H.; Deng, X. RS and GIS-based Analysis of Landscape Pattern Changes in Urban-rural Ecotone: A Case Study of Daiyue District, Tai’ an City, China. J. Landsc. Res. 2012, 4, 20–23. [Google Scholar] [CrossRef]
  61. Yang, H.; Du, L.; Guo, H.; Zhang, J. Tai’an Land Use Analysis and Prediction Based on RS and Markov Model. Procedia Environ. Sci. 2011, 10, 2625–2630. [Google Scholar] [CrossRef] [Green Version]
  62. Su, Y.; Li, C.; Wang, K.; Deng, J.; Shahtahmassebi, A.R.; Zhang, L.; Ao, W.; Guan, T.; Pan, Y.; Gan, M. Quantifying the spatiotemporal dynamics and multi-aspect performance of non-grain production during 2000–2015 at a fine scale. Ecol. Indic. 2019, 101, 410–419. [Google Scholar] [CrossRef]
  63. Huang, D.; Chu, E.; Liu, T. Spatial Determinants of Land Conversion for Various Urban Use: A Case Study of Beijing. ISPRS Int. J. Geo-Inf. 2020, 9, 708. [Google Scholar] [CrossRef]
  64. Zhang, Z.; Du, Z. Will land transfer lead to “non-grain”?—Empirical analysis based on monitoring data of 1740 family farms in China. Econ. Perspect. 2015, 655, 65–71. [Google Scholar]
Figure 1. Location and map of the Tai’an prefecture.
Land 12 00372 g001
Figure 2. (a,b) The conversion of 2009 cultivated land over the following decade in the Tai’an prefecture.
Land 12 00372 g002
Figure 3. Technical flowchart of cultivated land loss analysis.
Land 12 00372 g003
Figure 4. (an) Maps of independent variables used to predict cultivated land loss in the Tai’an prefecture.
Land 12 00372 g004
Figure 5. (ad) Rate of cultivated land loss in the Tai’an prefecture.
Land 12 00372 g005
Figure 6. (ad) Hotspot analysis of cultivated land loss in the Tai’an prefecture.
Land 12 00372 g006
Table 1. Variables, data sources, and descriptive statistics.
FactorVariableAbbr.UnitDefinitionData SourceMean MaxMinS.D.
Dependent variable
Rate of cultivated land lossFLR(%)The proportion of cultivated land loss area to the original cultivated land area of the villageLand use survey data of Tai’an in 2009 and 201936.57100.000.420.07
Rate of nongrain conversionFLAR(%)The proportion of nongrain conversion area to the original cultivated land area of the villageSame as above9.9399.890.000.03
Rate of ecological conversionFLER(%)The proportion of ecological conversion area to the original cultivated land area of the villageSame as above20.65100.000.000.04
Rate of nonagricultural conversionFLNR(%)The proportion of nonagricultural area to the original cultivated land area of the villageSame as above5.98100.000.000.01
Independent variable
Natural conditionsAverage elevationElevmAverage elevation of village30 × 30 dem data (geospatial data cloud www.gscloud.cn/ accessed on 26 December 2022)126.99624.0624.326295.69
Average slopeSlop°Average slope of villageSame as above3.7818.880.89827.48
Location
factors
Distance to municipal governmentDistcitykmDistance from village to Tai’an municipal governmentBaidu map location data (https://maplocation.sjfkai.com/ accessed on 26 December 2022)47.1697.920.29477.77
Distance to county governmentDistcounkmDistance from village to its county governmentSame as above18.1944.310.4284.89
Distance to township governmentDisttownkmDistance from village to its township governmentSame as above4.1413.390.064.11
Distance to the nearest roadDistroadkmDistance from village to the nearest roadData from a land use survey in 20192.7713.910.006.50
Distance to the nearest riverDistrivekmDistance from village to the nearest riverSame as above1.5212.420.002.46
Economic factorsEconomic development levelEcondeveNumber/km2Ratio of POI number to village areaMap POI data21.891410.320.005816.83
Economic structureEconstru%Ratio of industrial land area to village areaData from a land use survey in 20191.9556.460.000.00
Economic vitalityEconvita%Ratio of land transfer area to village areaSame as above10.25100.000.000.02
Social factorsPopulation densityDenspopuPerson
/km²
The population density of the villageTai’an Statistics Bureau769.1529,753.3627.391,185,241.06
Proportion of nonagricultural population Propnon-farm%Proportion of nonagricultural labor force to the labor force of the villageSame as above69.74100.000.000.04
Proportion of labor forceProplabo%Proportion of labor force to the population of the villageSame as above56.58100.0011.920.01
Policy factorsBasic farmland protection policyPolibasi%Proportion of basic farmland area to cultivated land of the villageGeneral plan of land use for Tai’an (2006–2020)71.32100.000.000.10
Table 2. Cultivated land loss by county from 2009 to 2019 (km2, %).
Cultivated Land (km2)Cultivated Land Loss (km2)Rate of Cultivated Land Loss (%)
20092019TotalNongrainEcologicalNonagriculturalFLRFLARFLERFLNR
Taishan82.921.163.24.851.47.076.2%5.8%61.9%8.4%
Daiyue779.3455.0351.5128.8184.937.845.1%16.5%23.7%4.8%
Xintai1037.6747.1380.9121.1209.350.536.7%11.7%20.2%4.9%
Feicheng712.2534.6234.971.1125.838.133.0%10.0%17.7%5.3%
Ningyang761.0640.6156.322.395.938.120.5%2.9%12.6%5.0%
Dongping752.4623.7151.638.877.335.620.2%5.2%10.3%4.7%
Tai’an4125.43022.11338.3386.9744.4207.032.4%9.4%18.0%5.0%
Note: the cultivated land area in 2019 includes the newly increased cultivated land in this decade, which is not covered by this paper.
Table 3. Impact analysis of cultivated land loss rate in Tai’an prefecture.
FLRFLARFLERFLNR
Elev0.270 *** (12.670)0.279 *** (12.805)0.155 *** (6.051)−0.069 *** (−3.120)
Slop0.201 *** (10.263)0.357 *** (17.865)−0.051 ** (−2.153)0.070 *** (3.488)
Distcity−0.285 *** (−19.852)−0.131 *** (−8.917)−0.277 *** (−16.064)0.029 * (1.951)
Distcoun−0.036 *** (−2.637)−0.060 *** (−4.231)0.027 (1.623)−0.070 *** (−4.882)
Disttown0.026 * (1.771)−0.019 (−1.288)0.016 (0.939)0.084 *** (5.614)
Distroad−0.076 *** (−5.380)−0.000 (−0.025)−0.104 *** (−6.172)0.016 (1.132)
Distrive−0.021 (−1.489)0.026 * (1.813)−0.045 *** (−2.683)−0.007 (−0.470)
Econdeve0.063 *** (4.386)−0.060 *** (−4.055)0.068 *** (3.917)0.162 *** (10.845)
Econstru0.072 *** (4.896)−0.078 *** (−5.192)0.061 *** (3.429)0.248 *** (16.336)
Econvita0.053 *** (3.968)0.014 (0.996)0.071 *** (4.423)−0.034 ** (−2.454)
Denspopu0.122 *** (8.915)−0.012 (−0.890)0.043 *** (2.637)0.325 *** (23.088)
Propnon-farm0.047 *** (3.229)−0.033 ** (−2.220)0.072 *** (4.143)0.039 ** (2.587)
Proplabo−0.006 (−0.436)−0.038 *** (−2.804)0.028 * (1.768)−0.014 (−1.032)
Polibasi−0.195 *** (−12.378)−0.137 *** (−8.491)−0.059 *** (−3.104)−0.224 *** (−13.743)
R20.4340.4090.1830.397
F186.627168.55955.291160.439
N3392339233923392
Note: Standardized coefficients (beta) in the cells and t statistics in parentheses. *, **, and *** indicate significance at the 0.1, 0.05, and 0.01 levels, respectively.
Disclaimer/Publisher’s Note: The statements, opinions and data contained in all publications are solely those of the individual author(s) and contributor(s) and not of MDPI and/or the editor(s). MDPI and/or the editor(s) disclaim responsibility for any injury to people or property resulting from any ideas, methods, instructions or products referred to in the content.

