1. Introduction
1.1. Definition and Evolution of Resilience
The term “resilience” is currently (2022) widely used in many fields and adopted by several sciences. It is a complex but attractive term that reflects interesting perspectives in any field that is affected by it. From its original meaning, “resilience” in the physical field, as described in the Dictionary of the Royal Spanish Academy, means the ability of an elastic material to withstand an impact without breaking and then recover its original structure and shape. For Cyrulnik [
1], resilience as physical phenomenon refers to buoyancy and expresses the ability of a body to regain its original state or position once the forces that seek to deform, displace or immerse it ceases to act.
The concept of resilience has spread to many fields and disciplines and has expanded to different perspectives, for example:
In psychology, the term reached a broad development in the 1980s, when Smith RSW [
2] introduced the concept of “resilience” in the context of studies and analyzes of vulnerabilities related to children and adolescents. However, in the social sciences the term was used as early as the 1960s to describe the ability of people to develop psychologically, healthily and successfully despite living in high-risk contexts (poverty, stress, social risks, etc.) [
3].
Holling [
4], recognized for his pioneering work in disseminating and developing the concept of resilience in ecology, emphasizes the ability of natural systems and organisms to withstand and respond to certain adverse conditions.
Folke [
5] disseminates the concept of resilience in the analysis of socio-ecological systems and introduces the definition of “social resilience” previously defined by [
6] as the ability of communities to withstand external shocks to their social infrastructure.
As for the countless definitions of “resilience,” the following are worth highlighting:
Grotberg [
7] defines it as the universal human capacity to face, overcome, or even be changed by life’s adversities.
Vanistendael S. [
8] defines resilience as the ability of a person or a social system to face difficulties in a socially acceptable way. In the same way, Grotberg E. [
7] believes that resilience refers to a combination of factors that enable a person to cope with and overcome life’s problems. Additionally, in the field of biological sciences the term resilience is defined as the adaptive capacity of individuals or groups to meet challenges and threats (stress or adversity).
P. A. Suris JC and VRM [
9] describe that resilience in the macro-social, historical, or public sphere refers to survival in situations of natural disasters, wars, terrorism, deportations, and socio-economic dynamics.
In territorial domains such as cities, the term resilience is also commonly used. For Méndez [
10], the concept of resilience in the territorial field is multidisciplinary and transdisciplinary, which opens the space to consider new perspectives for the analysis of cities. Although the success of the term in extrapolation is great in disciplines that are moving further and further away from the origin of this word, it sometimes leads to a misuse that loses precision and even questions the resulting scientific value [
11]. A clear example is the definition of “economic resilience”, a widely used concept but one that is not fully defined [
12].
1.2. Urban Resilience—Regional Resilience
Without losing sight of the ambiguities associated with the term resilience, the underlying analogies have applied the concept of resilience to territorial studies (cities and regions). The expansion of the terms “urban resilience” and “regional resilience” can be found in the bibliographies of all regions. Organizations such as the Resilience Alliance, the Community and Regional Resilience Institute (Resilient City), and the Network on Building Resilient Regions are officially disseminating the term resilience.
One of the first relevant regional studies to reach an important development on urban resilience defines it as “the ability of local economies to transform themselves in the face of technological shocks that undermine their economic base, essentially asking themselves how they can reinvent their economies” [
13]. However, this is a purely economic approach. A broader approach must take into account the adaptive capacity that cities show in the face of shrinking processes, which implies increasing their competitive advantages, but also their internal social cohesion, local governance processes, quality of life, and sustainability, as well as increasing opportunities to attract population, investment, and businesses that can generate new dynamics [
14].
In this sense, Vale LJ and TJC [
15] add that if the conditions that enabled urban development prior to change or transformation are maintained after a significant period of redevelopment or recovery, such a city will exhibit urban resilience and is very likely to recover and even surpass previous dynamics in terms of population, economy, and development in general.
These perspectives of “urban resilience” are reinforced by the concepts and actions of the
United Nations International Strategy for Disaster Reduction (UNISDR) under the Developing Resilient Cities program to increase sustainability and reduce risk. Similarly, the United Nations [
16] defines the concept of resilience in cities as the ability of an urban system to maintain continuity after impacts or disasters while contributing positively to adaptation and transformation; that is, a resilient city is one that prepares to act and respond to any type of obstacle (unexpected or not).
To integrate the uncertain and particular scenarios that arise in territorial dynamics, several complements to the previous definitions should be considered, including:
Yánez-Contreras, Martelo-Amaya and Rodríguez-Páez [
17] understand resilience as the ability of a society exposed to a risk or threat to cope with and absorb disruptions without significantly changing its characteristics, and then adapt, recover and restore its original state;
For Méndez [
10], urban resilience represents an “emerging metaphor” that describes and interprets a city’s ability to face adversity, recover, and continue its development process while implementing strategies that include economic, technological, social, and urban management innovations [
18];
For B. Mueller and MCW [
19], urban resilience must be considered as a dynamic process rather than a final state. Therefore, the “resilient city” is not coherent if it is understood in a static sense but must be understood and developed from the local level itself. Foster and CMP [
20] add to this perspective by pointing out that the support of higher-level policies by medium- and long-term processes is essential to evaluate the various specific responses.
In this context, the study of Alemana [
21] on “Strengthening the resilience of cities and their associated territories in the context of climate change agreements and the New Urban Agenda,” which focuses on achieving inclusive, safe, resilient, and sustainable cities and settlements, highlights the need for new approaches and tools that ensure the security of human, economic, and natural resources for the entire population.
For the United Nations [
22] some of the descriptions used by the main international organizations to define urban resilience are:
- –
The ability of individuals, communities, institutions, businesses, and systems within a city to survive, adapt, and thrive regardless of what kind of chronic stress or severe crisis they have experienced;
- –
The ability of an urban system to quickly absorb and recover from the effects of stress or crisis and maintain continuity of services.
1.3. Resilience in Cities, Urban and Rural Areas (Urban Expansion and Population Growth)
According to United Nations [
16], the cost of natural disasters in the last 10 years was USD 100 billion and affected more than 220 million people. Unless significant investments are made in improving urban resilience in the coming years, natural disasters could cost more than USD 300 billion per year, and combined with climate change (CC) effects push 77 million more urban residents into poverty.
The World Bank [
23] estimates that more than 50% of the world’s population lives in urban areas and that urban populations will increase 1.5-fold (600 million people) by 2045; similarly, the greatest challenges lie in addressing unsustainable land expansion and consumption. According to the calculations of this panel, urban land consumption exceeds population growth by up to 50% (1.2 million km
2 of new urban land).
According to United Nations [
24], the world’s cities occupy only 3% of the Earth’s surface, but represent between 60% to 80% of energy consumption, generate 75% of carbon emissions, and about 95% of urban growth in the coming decades will occur in developing countries
All indications are that the number of vulnerable people is rapidly increasing, mainly due to uncontrolled urbanization, which gives rise to informal settlements and consequently creates vulnerable areas with poor infrastructure [
25]. Urban expansion not only puts pressure on land, but also has unfavorable effects on natural resources [
26].
In this sense, Alemana [
21]; United Nations [
23] announce that the number of natural disasters has doubled worldwide in the last decade, affecting more people each time. They also emphasize that cities are the scenario for the consequences of the exploitation of resources, the accumulation of gasses in the atmosphere and other countless factors that cause changes in the climate. Given that risks are increasingly unpredictable due to the complexity of urban systems and the uncertainty associated with many hazards emanating from cities, especially CC. Resilience in cities becomes conceptually relevant when chronic and unpredictable factors threaten the collapse of the development of physical or social systems [
27].
At the global level all cities are vulnerable to various impacts, whether natural in origin or caused by society itself (due to the effects of massive urbanization, CC, and political instability), so a resilient city must consider possible negative scenarios and increase the ability to reduce damage and manage acceptable recovery times in the face of disaster or catastrophe, while promoting, adapting, and transforming toward a more resilient and smart city with effective solutions [
28].
Strengthening resilience in the city allows societies to prepare for, adapt to, and recover quickly from impacts (disasters) so that negative impacts can be overcome by the urban space. Resilient management requires the development of new qualities and attitudes, such as organizational capacity, assertiveness, initiative, and creativity in the face of environmental protection needs, in order to transform risks into opportunities [
29]. Therefore, a resilient city is closely linked to a smart city model that moves towards digitalization and new technologies. Resilience must be seen as an interactive and dynamic process based on the relationship between people and their environment [
30].
It should be noted that resilient cities have areas of influence around consolidated urban areas as well as in the nearest rural environment [
31,
32]. In this way, urban and rural areas that interact in a sustainable manner enhance local capacity to address vulnerabilities in the face of climate phenomena and risk scenarios. Therefore, to determine a general level of resilience a comprehensive approach is needed that takes into account the natural (ecosystems) and socioeconomic (communities) components of both rural and urban areas, as well as the transitions between them (semi-urban and semi-rural areas). In this sense, to achieve urban–rural resilience from a purely urban perspective it is necessary to strengthen the structural, institutional and regulatory capacity to provide infrastructure and basic services in an efficient and inclusive manner, while from a rural perspective it is necessary to promote a fair participation of small producers in the market through the articulation of production chains and a significant improvement in rural living conditions with technological and commercial options, so that residents want to stay on their land [
33]. Thus, it is necessary to strengthen the spatial and sociological links of urban and rural interaction that are necessary to ensure the process of urban and rural resilience.
Similarly, adaptation to CC is achieved through proactive measures with long-term strategies that enable the development of resilient management to combat the challenges of CC and other risks [
34]. Resilient cities need to experiment with new skills and competencies, and promote proactive responses from within a flexible legal system that enables lasting adaptation and incorporates the idea of resilience as a cross-cutting factor to provide specific responses to different risk scenarios [
30].
Two of the benchmarks for assessing a city’s resilience by measuring its ability to recover from a disaster are:
The “Ten Basic Principles” developed by the United Nations Office for Disaster Risk Reduction (UNISDR) and the related global campaign, “Making Cities Resilient”, which targets local governments to engage them and provide them with tools to reduce disaster losses;
The Resilient Cities Profiles Program (CRPP), launched by UN-HABITAT to help local governments increase their capacity to improve resilience through the development of comprehensive and integrated urban planning.
1.4. Resilience in Quito Ecuador
Latin America and the Caribbean (LAC) is a region with vulnerable populations and areas susceptible to the effects of CC and disasters. Therefore, its cities are in urgent need of planning and management with a sustainable and resilient vision [
35].
Ocha [
36] The most complex challenges in the region have to do with land use planning in rural areas, water and sanitation, solid waste, rainfall and flooding, mobility, and energy. One of the factors that hits LAC the hardest is the accelerated urban expansion process (urban explosion) as a result of which it is currently the most urbanized developing region in the world [
37].
At LAC, 80% of the total damage caused by disasters is in urban areas. Moreover, cities face the greatest inequality in terms of economic income in the world. This reality requires new solutions for LAC cities [
38]. In this sense, some organizations such as the International Monetary Fund (IMF) are supporting the region through the creation of the “Resilience and Sustainability Fund”, which aims to support low- and middle-income countries in the face of long-term adversities such as the effects of CC and pandemics [
39], and which in turn is aligned with the United Nations 2030 Agenda and the ODS.
Despite the LAC actions to build sustainability and resilience in the region, inadequate land management at the general level, and weak strategies to mitigate risks and improve disaster response, LAC remains a region that lags behind in planning and managing sustainable and resilient cities. However, there are many opportunities if cities in the region act accordingly.
In the case of the City of Quito, the complex location of the Metropolitan District of Quito (DMQ) in the Andes Mountains makes it a dynamic and complex territory threatened by natural, economic, and social challenges that the DMQ continually faces; these motivate the management of ongoing sustainability and resilience strategies. It is important to note that the study area (rural parishes of the DMQ) includes areas classified as urban and areas classified as rural, which are in constant social, economic, commercial and environmental interaction with the consolidated city of Quito. The rural parishes of the DMQ are areas that have a certain administrative autonomy that makes it necessary to assess resilience in accordance and harmony with the city of Quito and the entire DMQ.
The resilience strategies that the DMQ maintains are modulated according to preparation for, and response to, the major acute impacts and chronic stresses that occur in the area. The key tools that help strengthen urban resilience in the area are: (1) the Sustainable Development Goals (ODS); (2) the New Urban Agenda (NAU) adopted in Quito during the Habitat Conference III; and (3) the Plan for Urban Development and Spatial Planning (PMDOT) as a governance tool of the city government. In addition, the strategic contribution that the 100 Resilient Cities initiative makes to the DMQ, since it is a part of it, is to help build urban resilience, but also to iterate the exercise in its planning [
40].
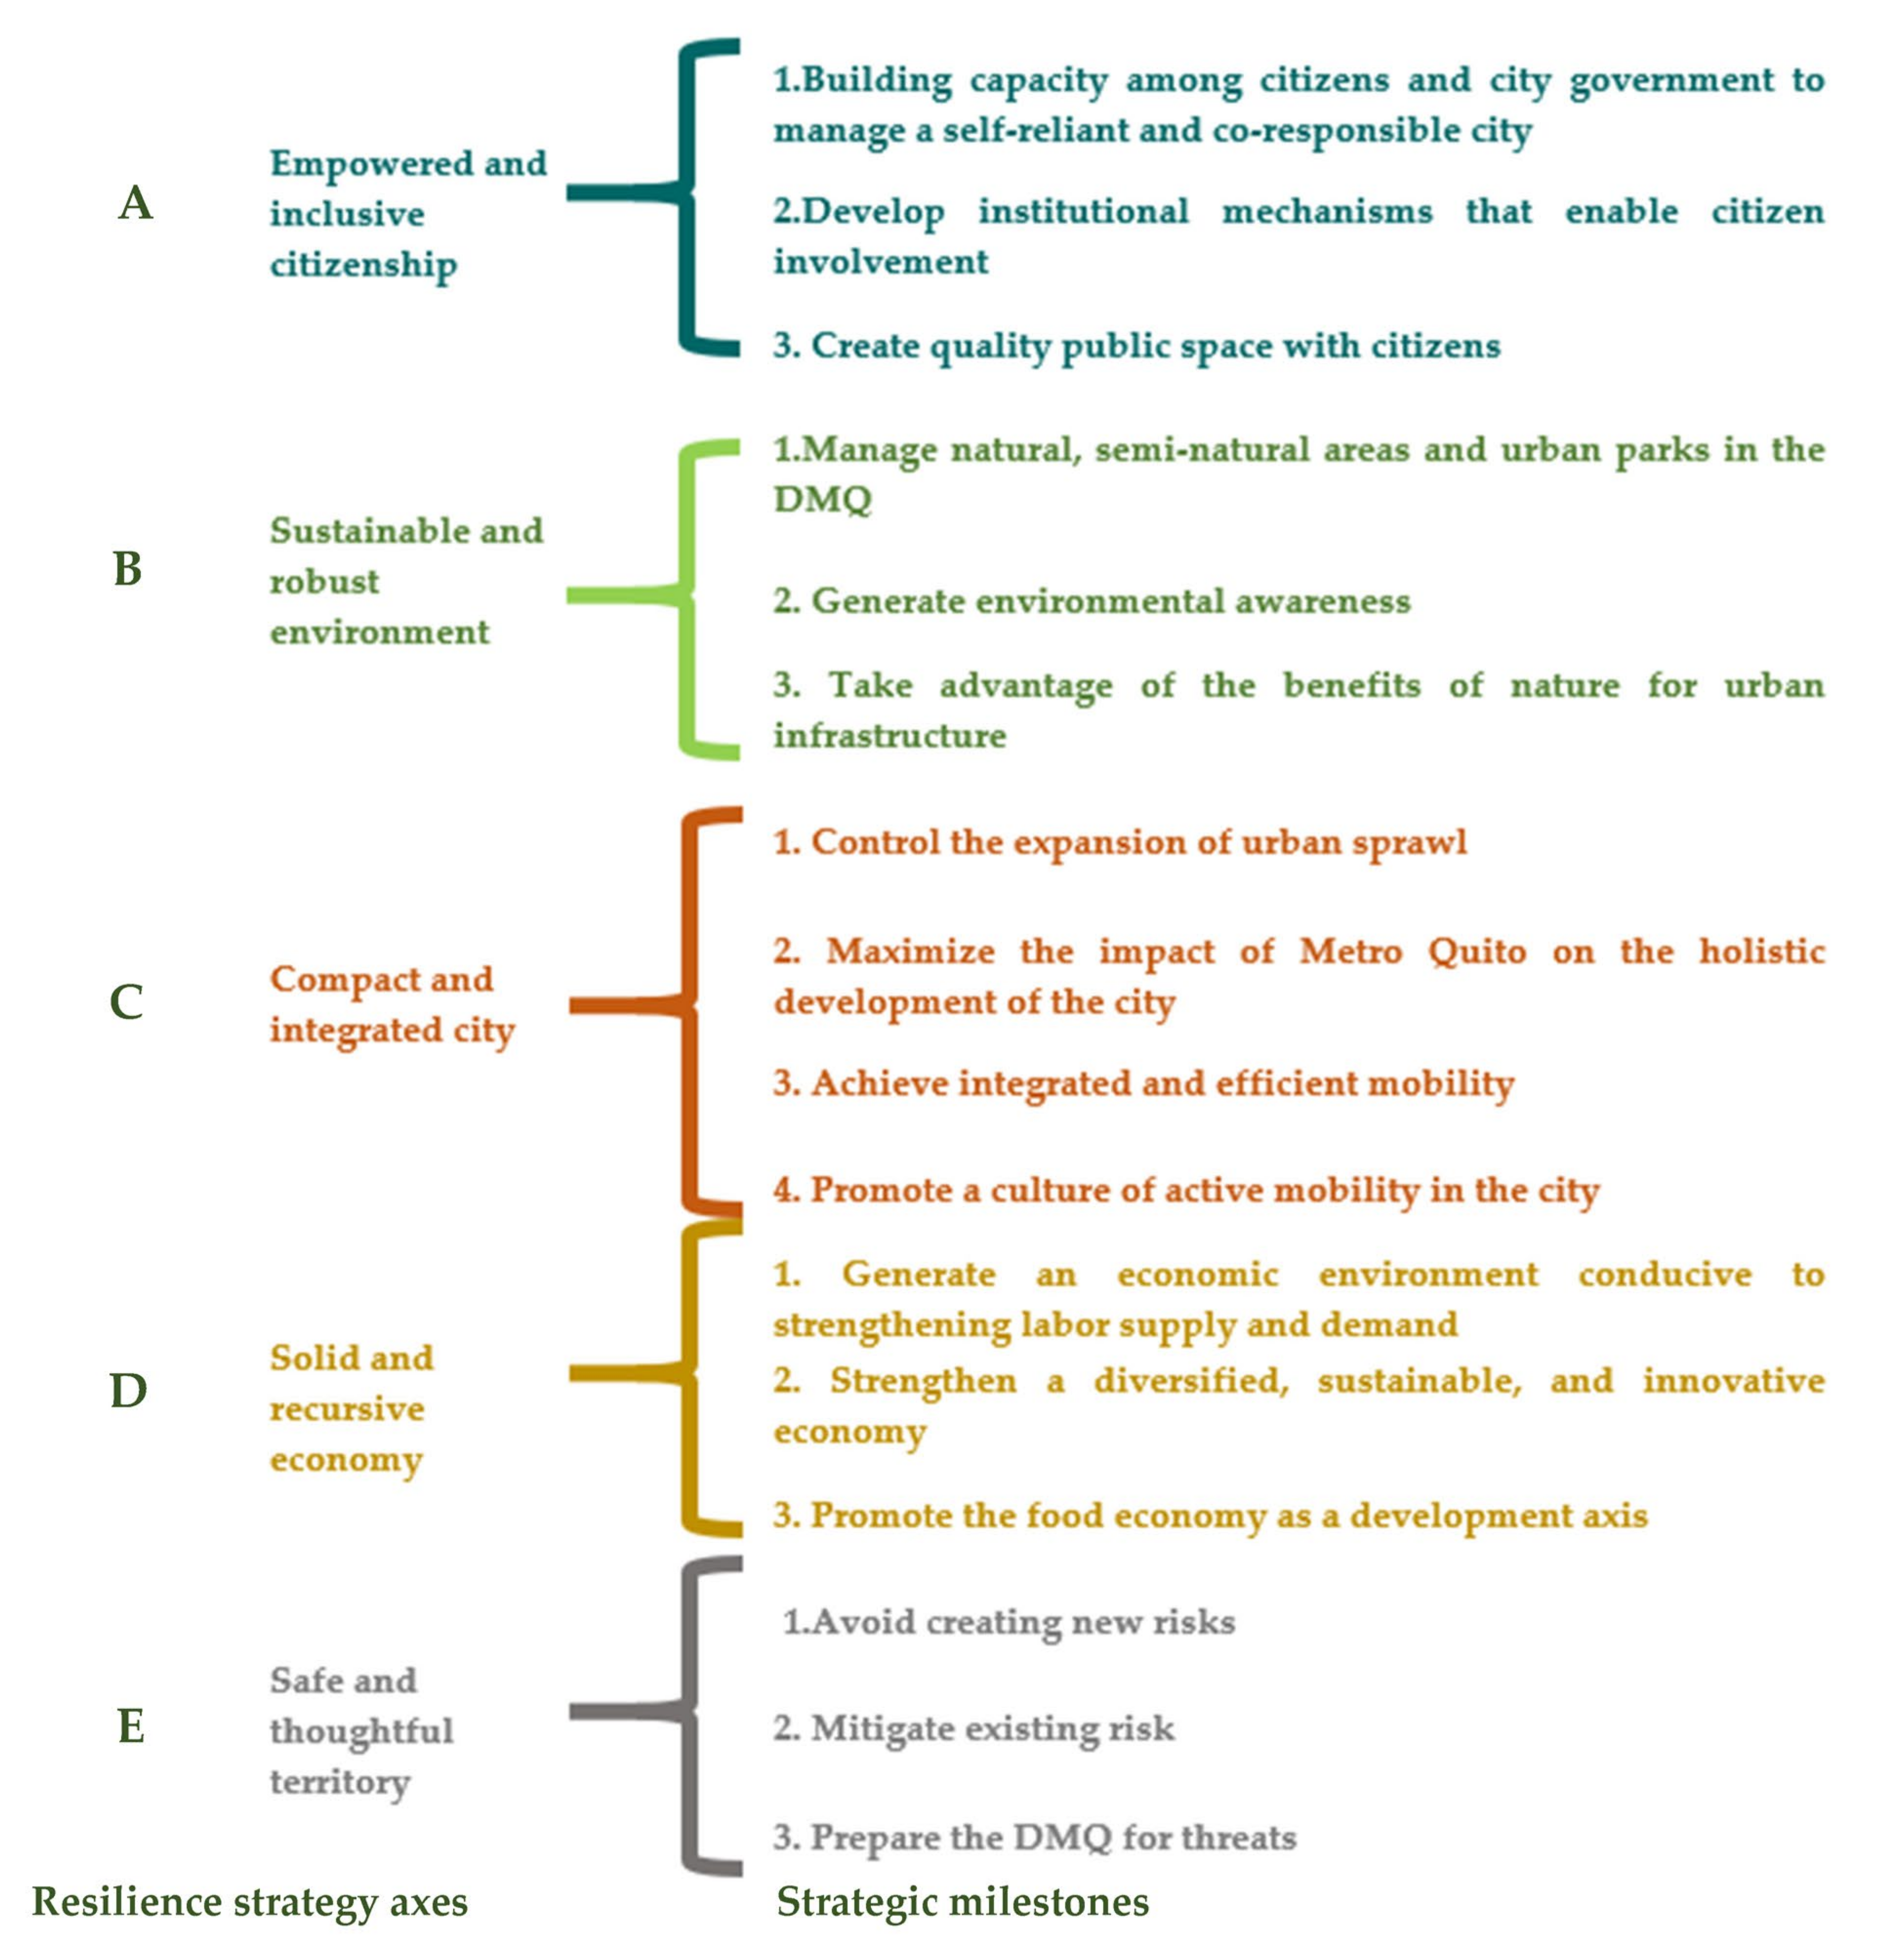
In this sense, the DMQ considers axes, strategic milestones, and actions for building resilient territory.
The study of this manuscript focuses on axis C “compact and integrated city” (
Figure 1), which refers to the trend of dispersed and uncontrolled growth of urban sprawl. This axis manages the problems that make the DMQ a segregated and inefficient place. The central goal of this axis is to control the expansion of sprawl and create an integrated and efficient mobility system that promotes active mobility. Activities resulting from the Axis C strategic milestones include: (1) program of municipal territorial control in hillside areas; (2) study of urban and peri-urban economic dynamics of land; (3) technological tool for environmental monitoring; (4) plan to capture land value from the construction of the first line of the Quito Metro; and (5) building codes with low environmental impact, to name a few.
Therefore, the objective of this manuscript is to assess the impact of spatial urban expansion and population growth in the rural parishes of the DMQ on the resilience of the territory, using a composite resilience index (CIR). In this way, the manuscript focuses on analyzing rural resilience as urban expansion continues to increase and threaten local community sustainability.
2. Materials and Methods
Three phases determine the methodology of this study:
Calculation of the projections of spatial urban expansion of the DMQ rural parishes for the next 50 years;
Calculation of the composite resilience index of each of the 33 rural parishes based on five dimensions and ecological footprint;
Evaluation of the composite resilience index with spatial urban expansion and population growth over the next 50 years.
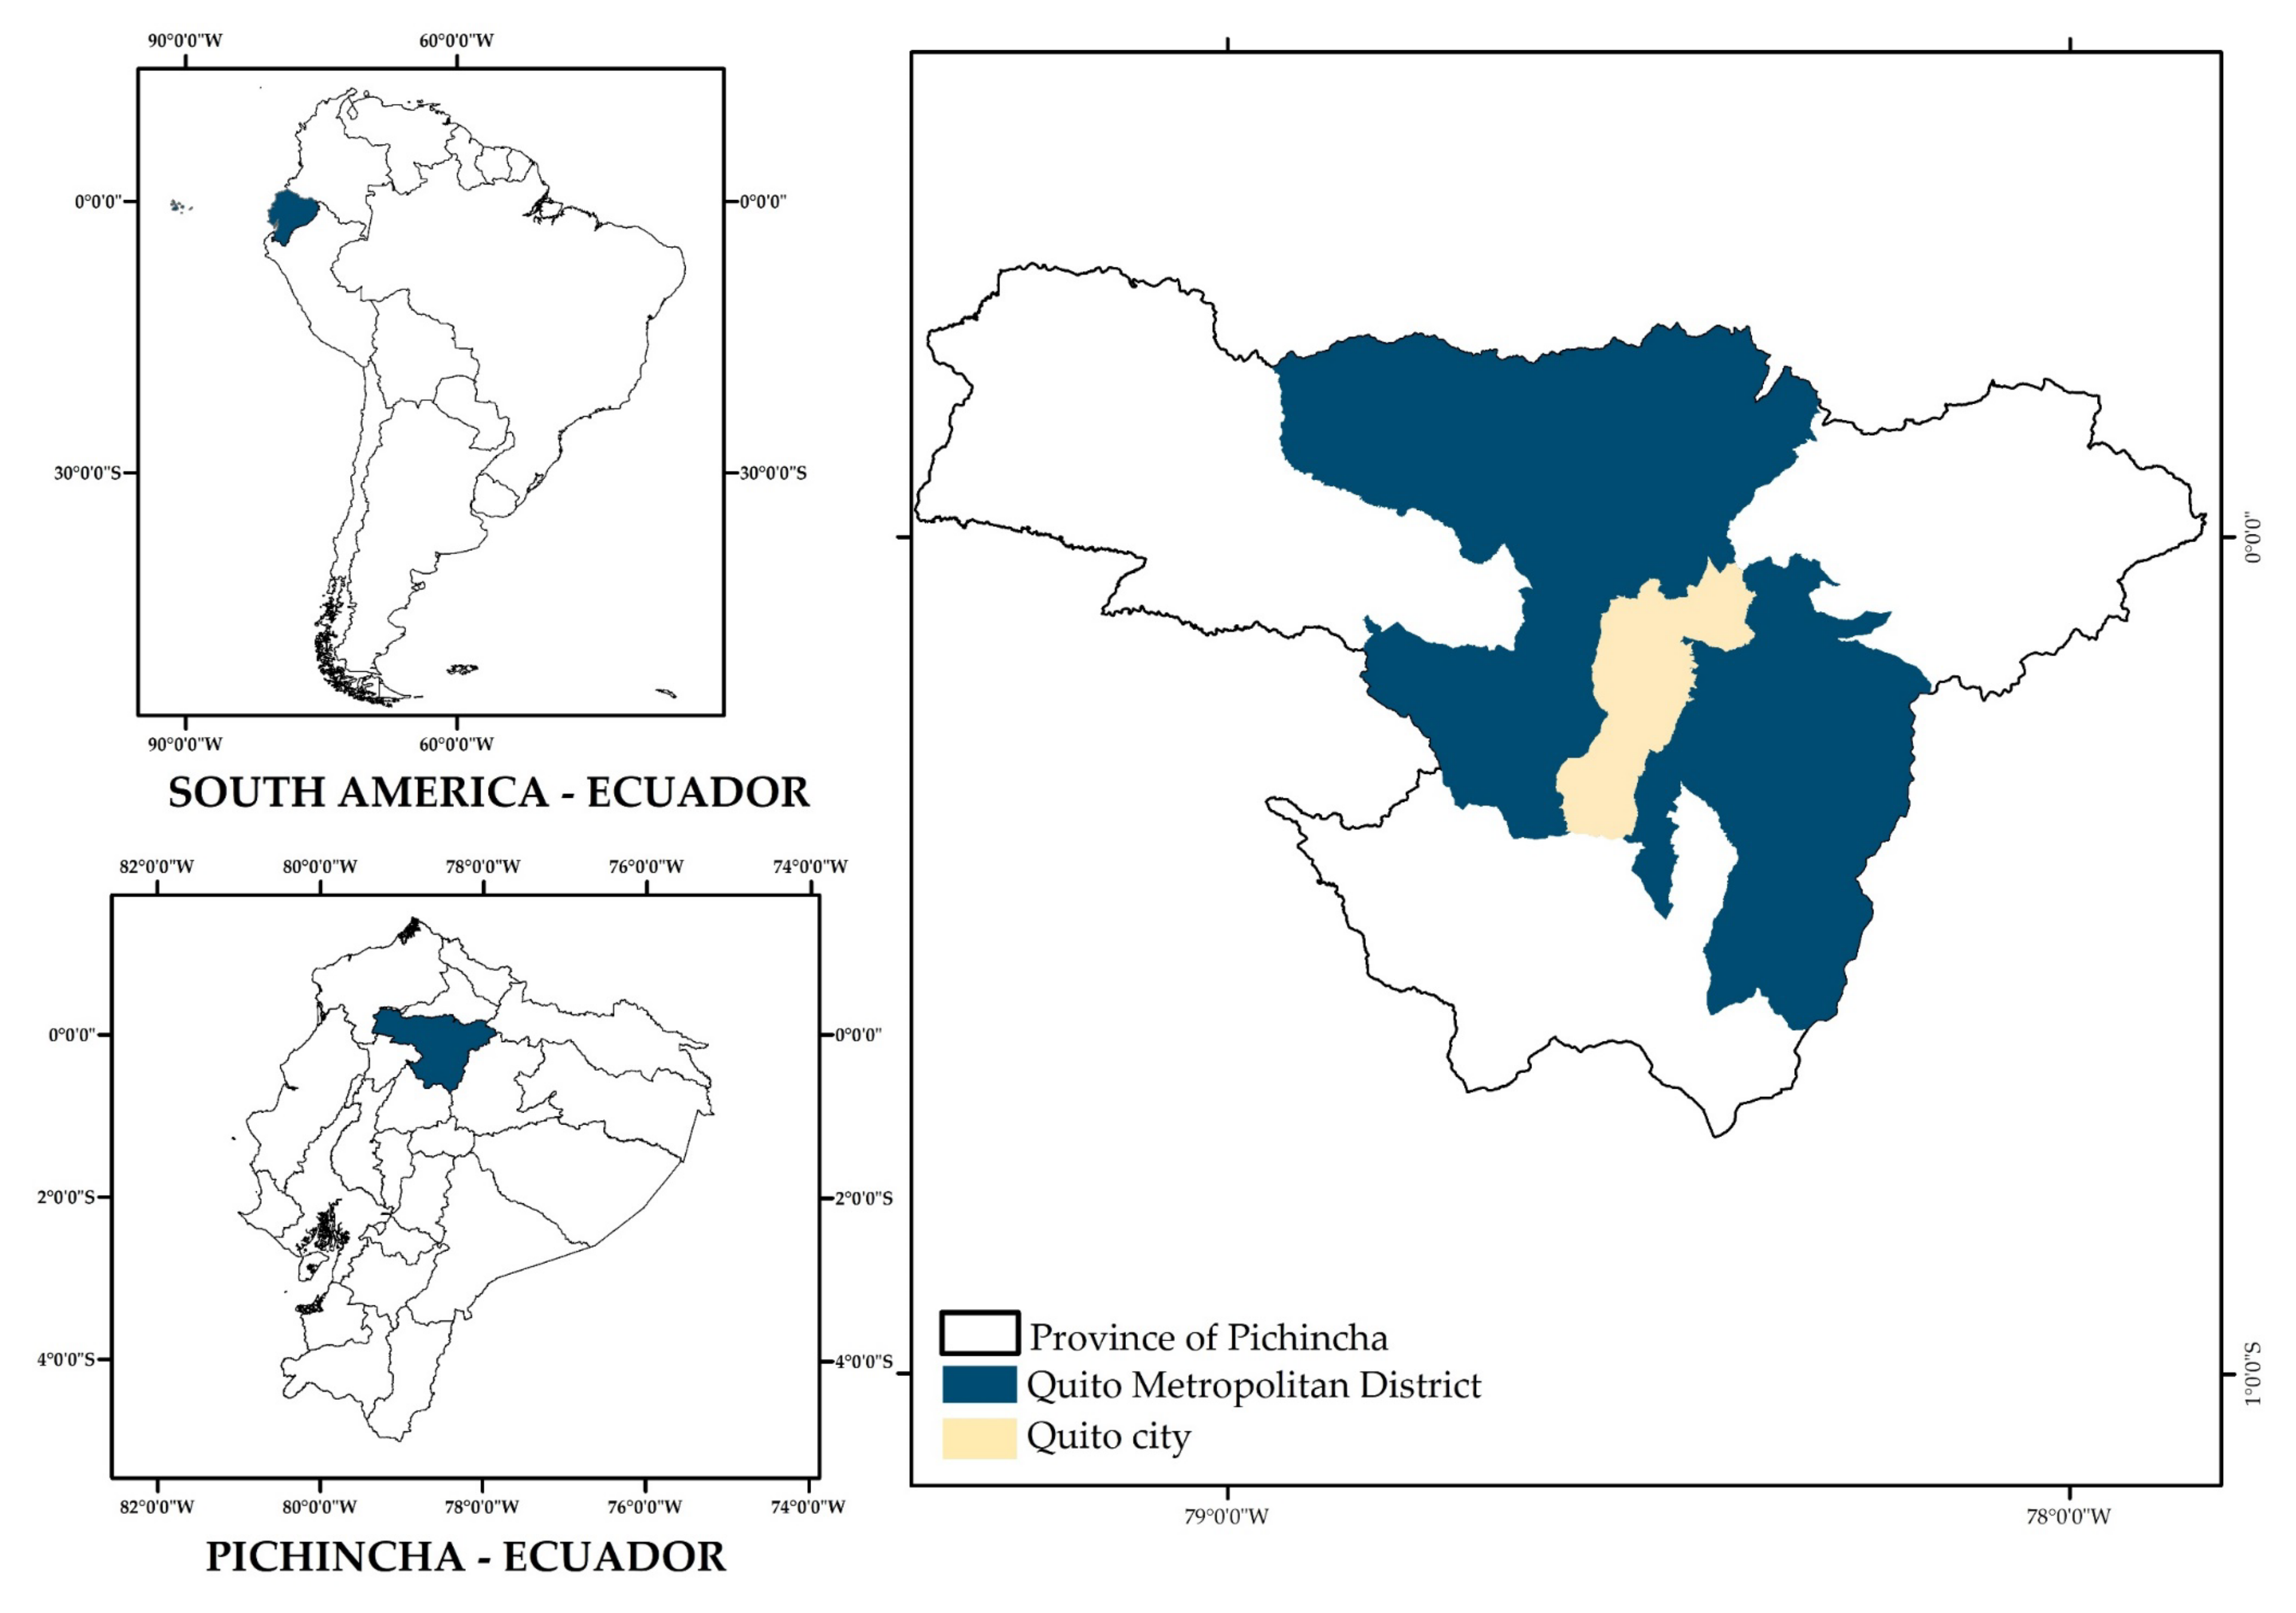
2.1. Study Area
This research is conducted in the DMQ area in the province of Pichincha in Ecuador. This area consists of 32 urban parishes and 33 rural parishes (
Figure 2). The DMQ is located in the eastern Andes, on the slopes of the active Pichincha volcano, and forms a closed landscape. The average elevation is 2850 m above sea level. Quito is the capital of Ecuador. The city is bounded on the north by the Casitagua volcano, on the east by the geological fault “Falla de Quito”, on the west by the eastern slopes of Pichincha, and on the south by the Atacazo volcano. The city is 50 km long (south–north) and 4 km wide (east–west).
The study focuses on the rural area of the DMQ, on the 33 parishes that make it up (
Figure 3): Lloa, Nayón, Zámbiza, Llano Chico, Calderón, Guayllabamba, Puéllaro, Perucho, Chavezpamba, Atahualpa, San José de Minas, Pomasquí, San Antonio de Pichincha, Nono, Calacalí, Nanegalito, Nanegal, Pacto, Gualea, La Merced, Alangasí, Guangopolo, Conocoto, Píntag, Amaguaña, Cumbayá, Tumbaco, Puembo, Pifo, Yaruquí, Tababela, Checa y El Quinche.
2.2. Information Resources and Preprocessing
Table 1 shows the initial information and the process undertaken to prepare the spatial projections of urban expansion and to calculate the
CIR.
2.3. Calculation of the Spatial Urban Expansion Scenarios for the DMQ’s Rural Parishes of the Next 50 Years
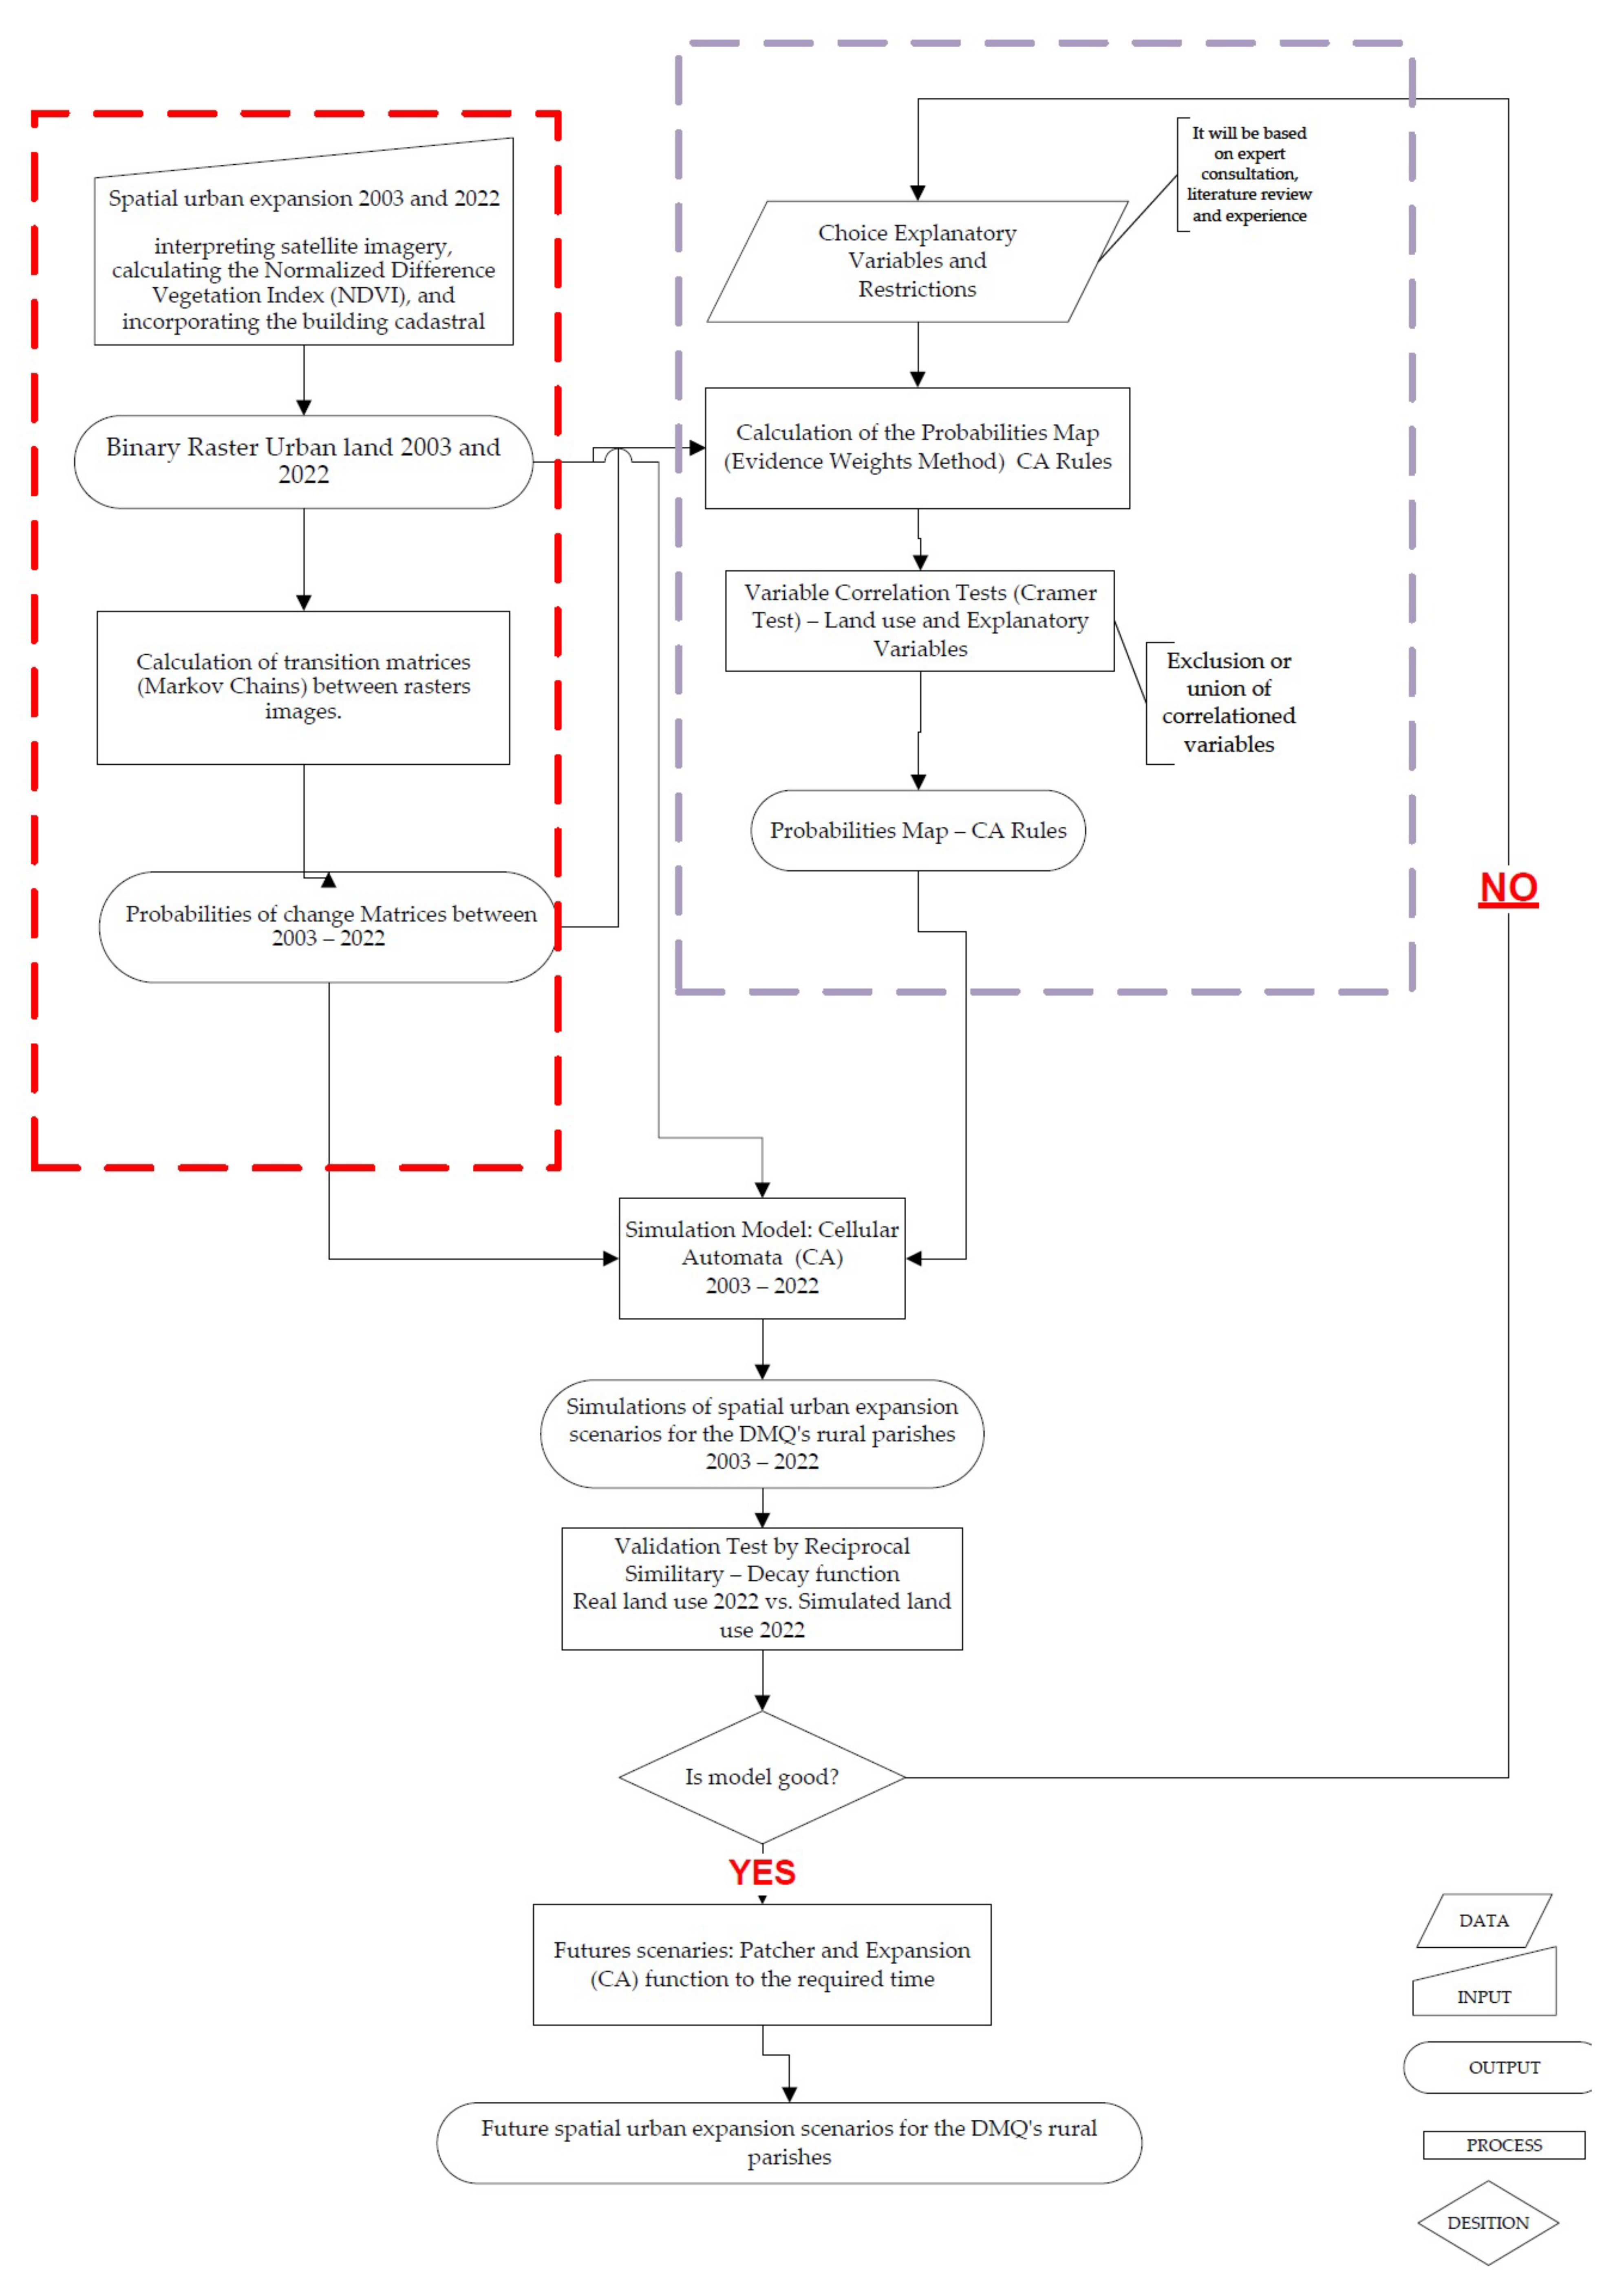
2.3.1. Stage 1: Data Preparation and Change Probability Matrix
In this phase, future urban expansion scenarios are modeled within a Geographic Information Systems (GIS) approach using the geostatistical methods of evidence weights (WoE) and cellular automata (CA). A geostatistical model is created that allows predicting the possible future settlement of the localities of urban and rural parishes. For this purpose, the following processes were carried out:
First, the spatial transition rates are calculated; in this work, the transition refers to the construction process (urbanization and settlement), which is calculated by a transition matrix (change probability matrix–Markov Matrix) that reflects the percentage of the area that changed its status between the years 2003 and 2022 (from land without construction to land with construction). This procedure uses information from binary raster geographic coverages that represents construction land or urbanization and settlements. This procedure is based on the representation of changes that occurred in discrete periods of time, which results in the value of the studied variable at a given time being the sum of the previous percentages of the variable [
41]. That is, the number of changes from one state to another is determined: in this case, from the state “land without buildings = (0)” to the state “land with buildings = (1)”.
This process results from combining and interpreting satellite imagery (Google Earth 2003 and 2022), calculating the Normalized Difference Vegetation Index (NDVI) (Sentinel-2 2022), and incorporating the building cadastral in the study area from 2003 and 2021.
The image of the Sentinel-2 satellite was downloaded from the EO Browser platform (
https://apps.sentinel-hub.com/eo-browser/, accessed on 12 August 2022. Bands 8 (near infrared,
VNIR) and 4 (red,
R) of the images allowed the calculation of the Normalized Difference Vegetation Index (
NDVI) using the Equation (1). This index normalizes green leaf scattering in Near Infra-red wavelengths with chlorophyll absorption in red wavelengths. In this way, the vegetation in the study area was quantified [
42,
43]:
Then, the values above −0.1 to 0.1 of the index corresponding to rock, construction sand or snow from the resulting coverage (NDVI). They are then vectorized into polygons in “shape” format.
Later, the two coverages (construction land or urbanization and settlements 2003 and 2022) are compared to determine the replacement values; thus, the proportions of each state that changed over the 18 years are obtained. The method is based on a probability matrix T calculated for “m” years and used to calculate the projection of
xt+m based on Equation (1):
where
xt is a row matrix that multiplies the
T matrix and represents the proportion of each state at time
t [
44].
The information is obtained from the analysis and interpretation of spatial urban expansion covers (variable 1.1 of
Table 1) of the study area in 2003 and 2022.
2.3.2. Stage 2: Model Calibration
The cellular automata (CA) logic needs rules to change from a cell-specific land use to another under special conditions, the information to define these CA rules comes from the probability maps built by combining the historical transition matrices with driving factors. In this study, the information on the driving factors (predictor variables) of urban growth that control the spread of new urban settlements come from bibliographic reviews, expert criteria, observation, and interpretation of the study area. The predictor variables are processed within the WoE method to obtain, as a result, a geographical coverage of transition probabilities that show the areas where urban expansion has a greater chance of occurring. The WoE are based on the calculation of variables that are spatially independent (independent variables—predictors) on a transition of another spatial variable (dependent variable) [
45]. This method is based on Bayesian probability through a bivariate model [
46], which takes the form of Equations (3) and (4):
where
A represents the event or phenomenon (land use) influenced by a factor or predictor
B, and
W is the weight of the evidence of occurrence of event
A, given a spatial factor
B.
For several predictive factors this is expressed as follows:
where
M, V, U, P…N are the values of the spatial variables evaluated at a geographic location. In this case, they are represented by variables of
Table 1 (1.2, 1.3, 1.4, 1.5, 1.6, 1.7, 1.8 and 1.9).
The predictor variables selected for modeling are listed in
Table 1. This combination of variables is supported by previous studies with promising results [
47].
Then, the two previously generated resources (spatial transition rates and probability maps) are processed using the CA methodology in the different iterations, covering the transition probabilities generated by the WoE [
48].
2.3.3. Stage 3: Simulation of Urbanization and New Housing Scenarios, Change Maps and Validation
As part of modeling, correlation analysis of variables and model validation are performed. Since the main assumption of the method WoE is that the analyzed coverages must be spatially independent, the model performs paired tests between the categorical maps; in this case the analysis focuses on the Cramer test and on the coverages of the predictor variables [
49], and the expression of the Cramer test is as follows:
where
χ2 is the chi-square test of independence statistic,
n is the sample size,
r is the number of rows in the contingency table, and
c the number of columns.
If the value of the coefficient
V is greater than 0.6 there is a strong association between the variables and one of the factors would be eliminated or combined with others [
47].
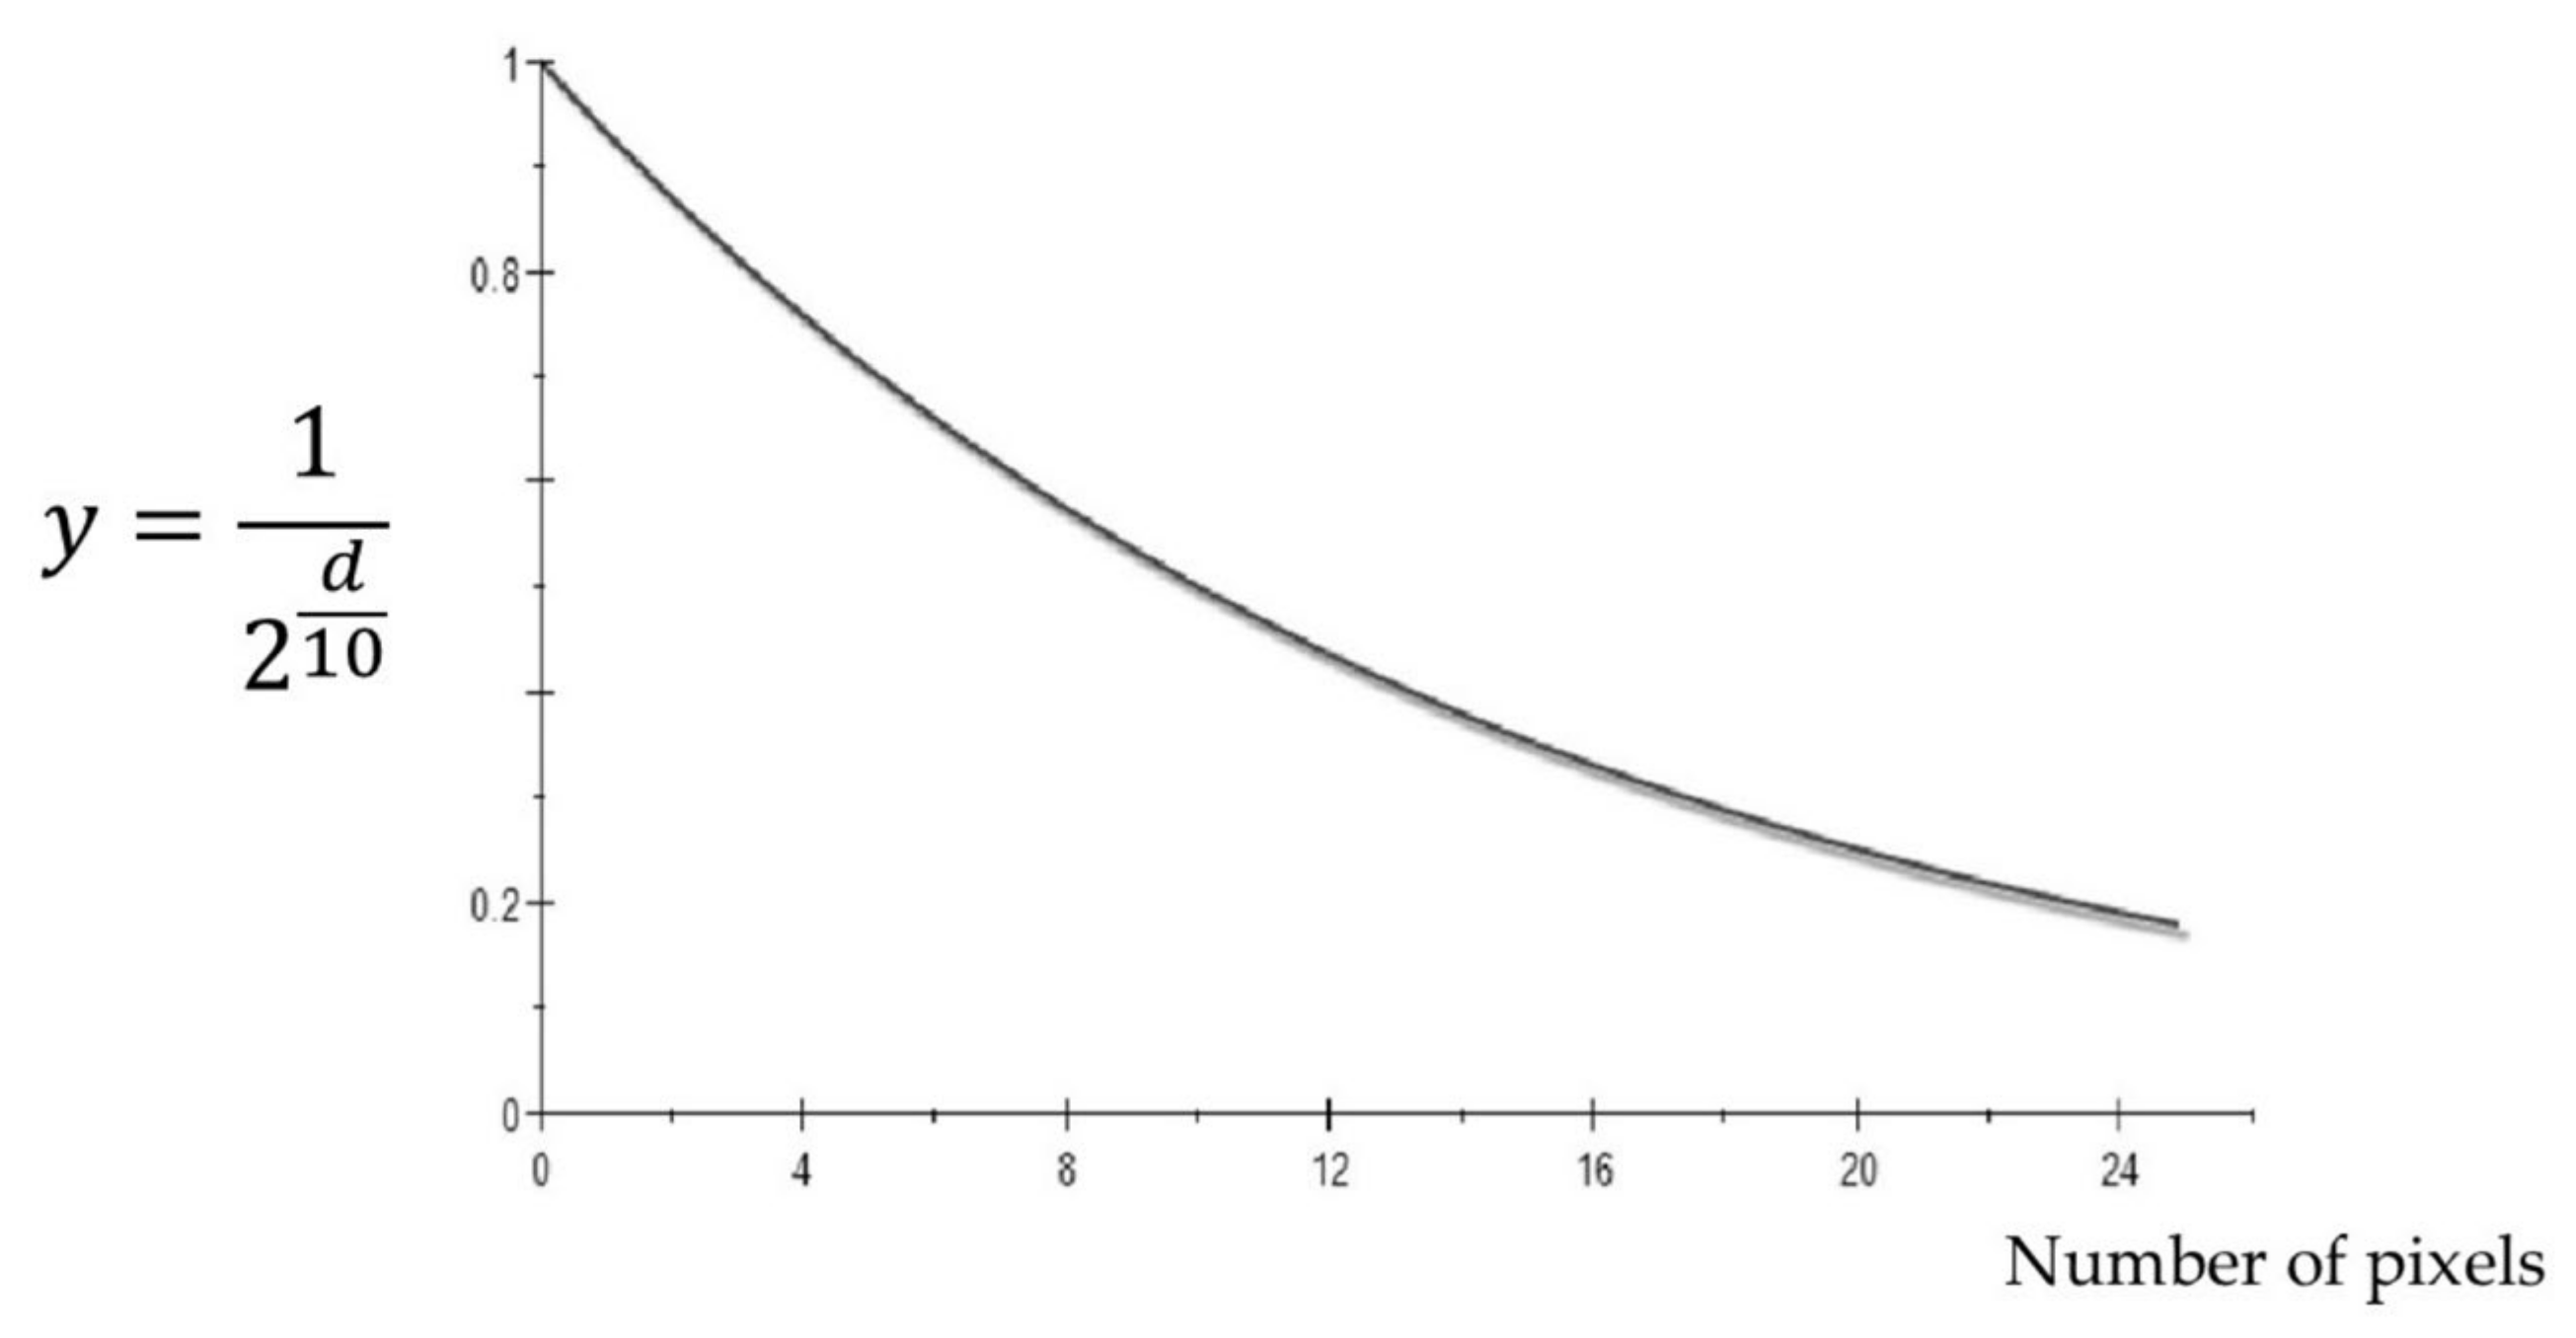
For the validation of the model, a constant decay exponential function is used, applied in windows of different sizes using the central cell as a reference and considering the neighborhood contained in each of these windows in the context of a reciprocal difference calculation [
46,
50]. The exponential decay function that calculates the probability of similarity is expressed by Equation (7):
where
d is the distance from the center of the window and
A is the attenuation factor that controls the speed of the decrease in the function values inside the kernel. In this study
A was 10 (
Figure 4).
2.3.4. Stage 4: Future Scenarios
After the calibration and validation of the model, the urbanization and new housing scenarios for the year 2072 are generated. These scenarios are the input for the calculation of the integral resilience index, which determines the percentage of urbanized areas and settlements in each rural parish.
Figure 5 shows the general flow of all phases of the calculation of spatial urban expansion scenarios for the rural parishes of the DMQ.
2.4. Calculation of the Composite Resilience Index of Each of the 33 Rural Parishes Based on Five Dimensions and the Ecological Footprint Per Capita
In this phase the Composite Resilience Index (
CIR) is produced, which is an adaptation of the work of [
17,
51]. The variables listed in
Table 1 (product: Composite Resilience Index) were prepared for the case of the DMQ. The variables were obtained from the Quality-of-Life Index (ICV) of the Institute of the City of Quito (ICQ) (ICQ, 2021). For the ecological footprint the published national value was taken since there is no specific value for each parish.
The variables were classified into five dimensions (
Table 2): (1) The social dimension includes social conditions related to resilience and living conditions (safety, basic services, health, education, social inclusion, subjective well-being, and leisure); (2) ecological dimension refers to the ability of ecosystems to cope with disturbances and allows measuring the functionality and recovery capacity of the environment [
52]; (3) economic dimension, which includes economic activities within the city (economic security) [
53]; (4) physical/infrastructure dimension, refers to the quality and condition of the structural systems necessary for residents to carry out activities in the area (land and housing, green areas, public space, and mobility) [
54]; (5) institutional/Governance dimension, this dimension deals with the interaction between the population and the institutions (public and private organizations) [
55]. It is important to mention that the indicators for each variable of the different dimensions were calculated on a scale from 0 to 100, where 0 means zero well-being and 100 means total well-being.
The weighting of the five dimensions is the same for calculating the CIR, because it was assumed that to create adequate resilience there must be a balance between them.
To calculate the
CIR we also consider the per capita ecological footprint, which measures the amount of biologically productive land and water that an individual, a region, all of humanity, or a particular human activity requires to produce the resources it consumes and absorb the wastes it generates. These data come from the Ministry of Environment, Water and Ecological Transition of Ecuador [
56]. The variable total area corresponds to the total area of each rural parish.
In this way, the
CIR calculation is performed using Equation (8):
where
SD social dimension corresponds to the average of the variables: Security, basic services, health, education, social inclusion, subjective well-being, and leisure time.
EVD environmental dimension, average of variables: Noise, exposure to odors, recycling, concern for the environment, and sustainable water consumption.
ECD economic dimension, economic security indicator.
IFD Physical dimension/infrastructure, represents the average of the variables: land use (number of land uses), urban spatial expansion, housing, green areas, public space, and mobility.
GVD institutional/governance dimension includes the social cohesion variable.
EF corresponds to the ecological footprint per capita.
EFP refers to the multiplication of the per capita ecological footprint by the number of inhabitants of each rural parish in the DMQ.
Finally, the CIR for each rural parish in the DMQ is calculated in two time periods with a specific variant: spatial urban expansion and population growth in 2022 and spatial urban expansion projected and population growth projected in 50 years; with the goal of evaluating the impact on the CIR of each rural parish.
3. Results
Table 3 shows the highest Cramer values obtained. No correlation exceeded 0.6, so no relationship between variables was strong.
The prediction degree of the obtained model was 76%.
Table 4 shows the results of the validation process under the different sizes of the analysis windows.
From the spatial processing to generate the future scenarios of urban expansion and settlements of the DMQ, based on WoE and CA, the following projections are obtained,
Figure 6.
It can be demonstrated that the increase in human settlements in the long term occurs in the different peripheral areas of rural localities, generally in locations that are not suitable for settlement, which directly affects the level of resilience of rural parishes.
Table 5 shows the area and percentage of urbanized land and settlements by parish in both the 2022 and 2072 time points.
Table 6 shows the values of the components of the
CIR calculation for 2022, calculated using Equation (3).
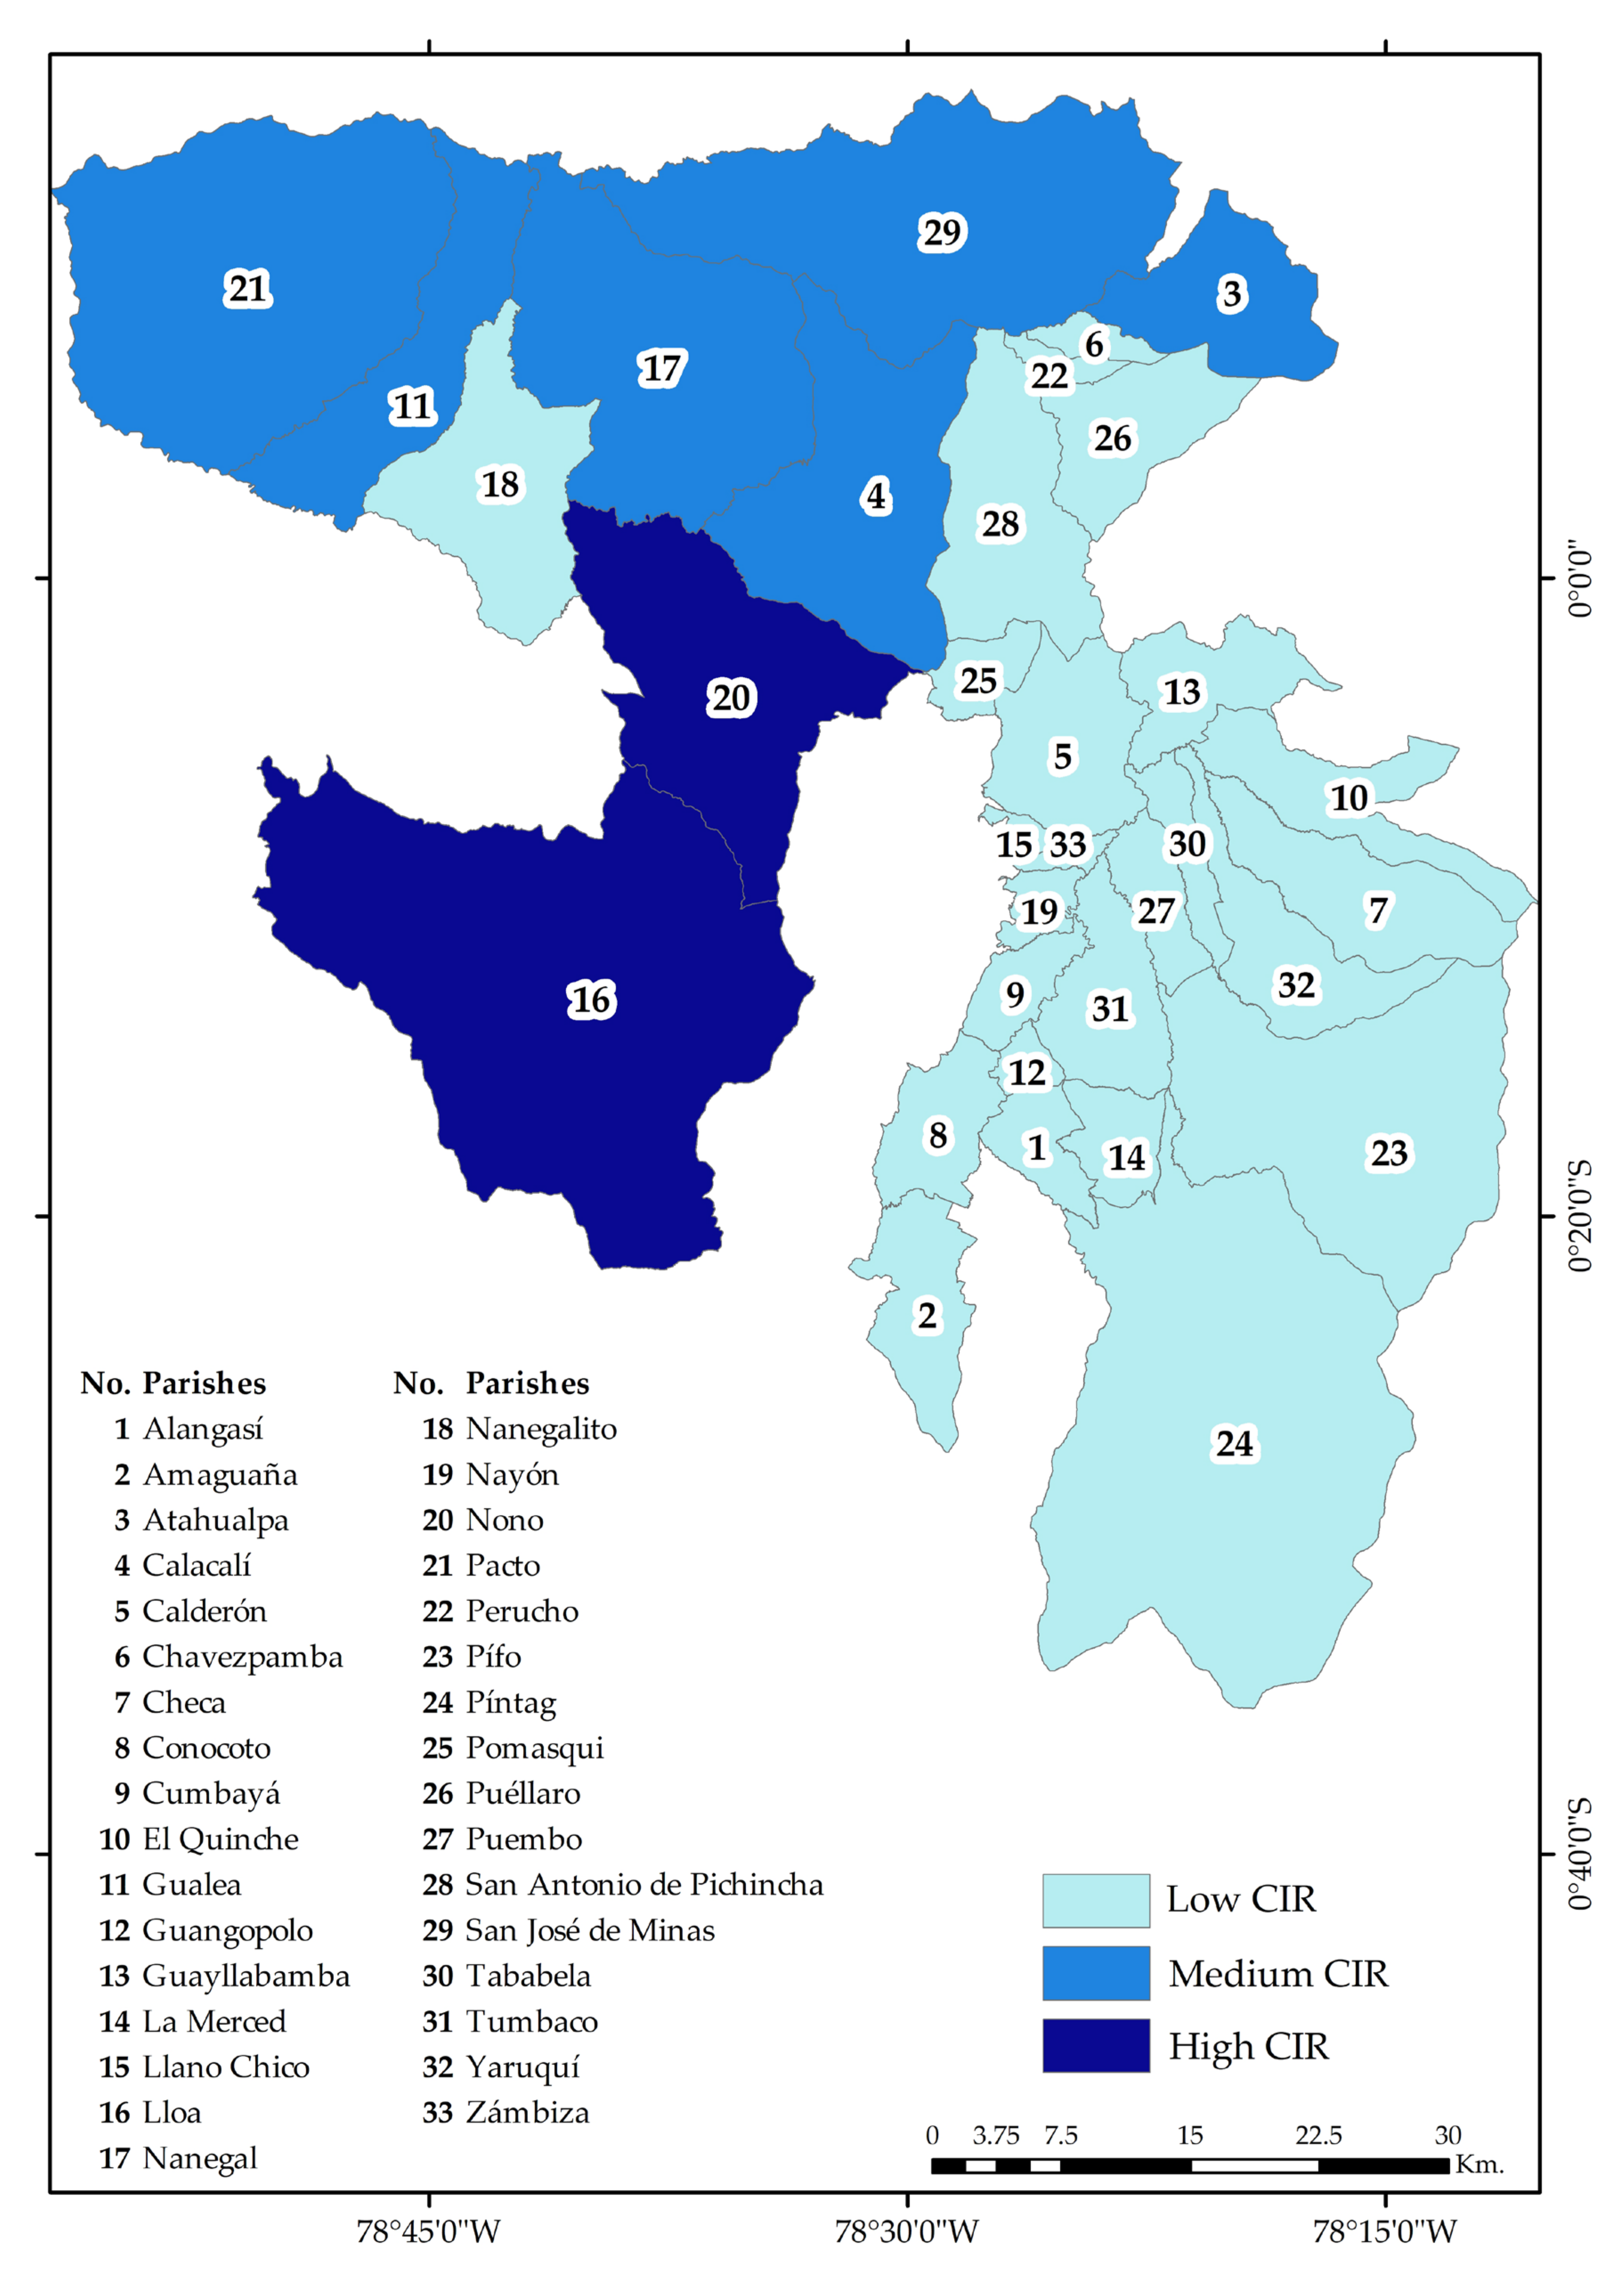
Figure 7 shows the
CIR levels of the rural parishes of DMQ (2022).
Table 7 shows the values of the components of the
CIR calculation for 2072, calculated with Equation (3).
Figure 8 shows the
CIR levels of the rural parishes of DMQ (2072).
Table 8 shows the comparison of
CIRs in the two time periods for each rural parish of the DMQ. It also describes the impacts that the parishes will experience over the next 50 years due to spatial urban expansion, settlements and population growth.
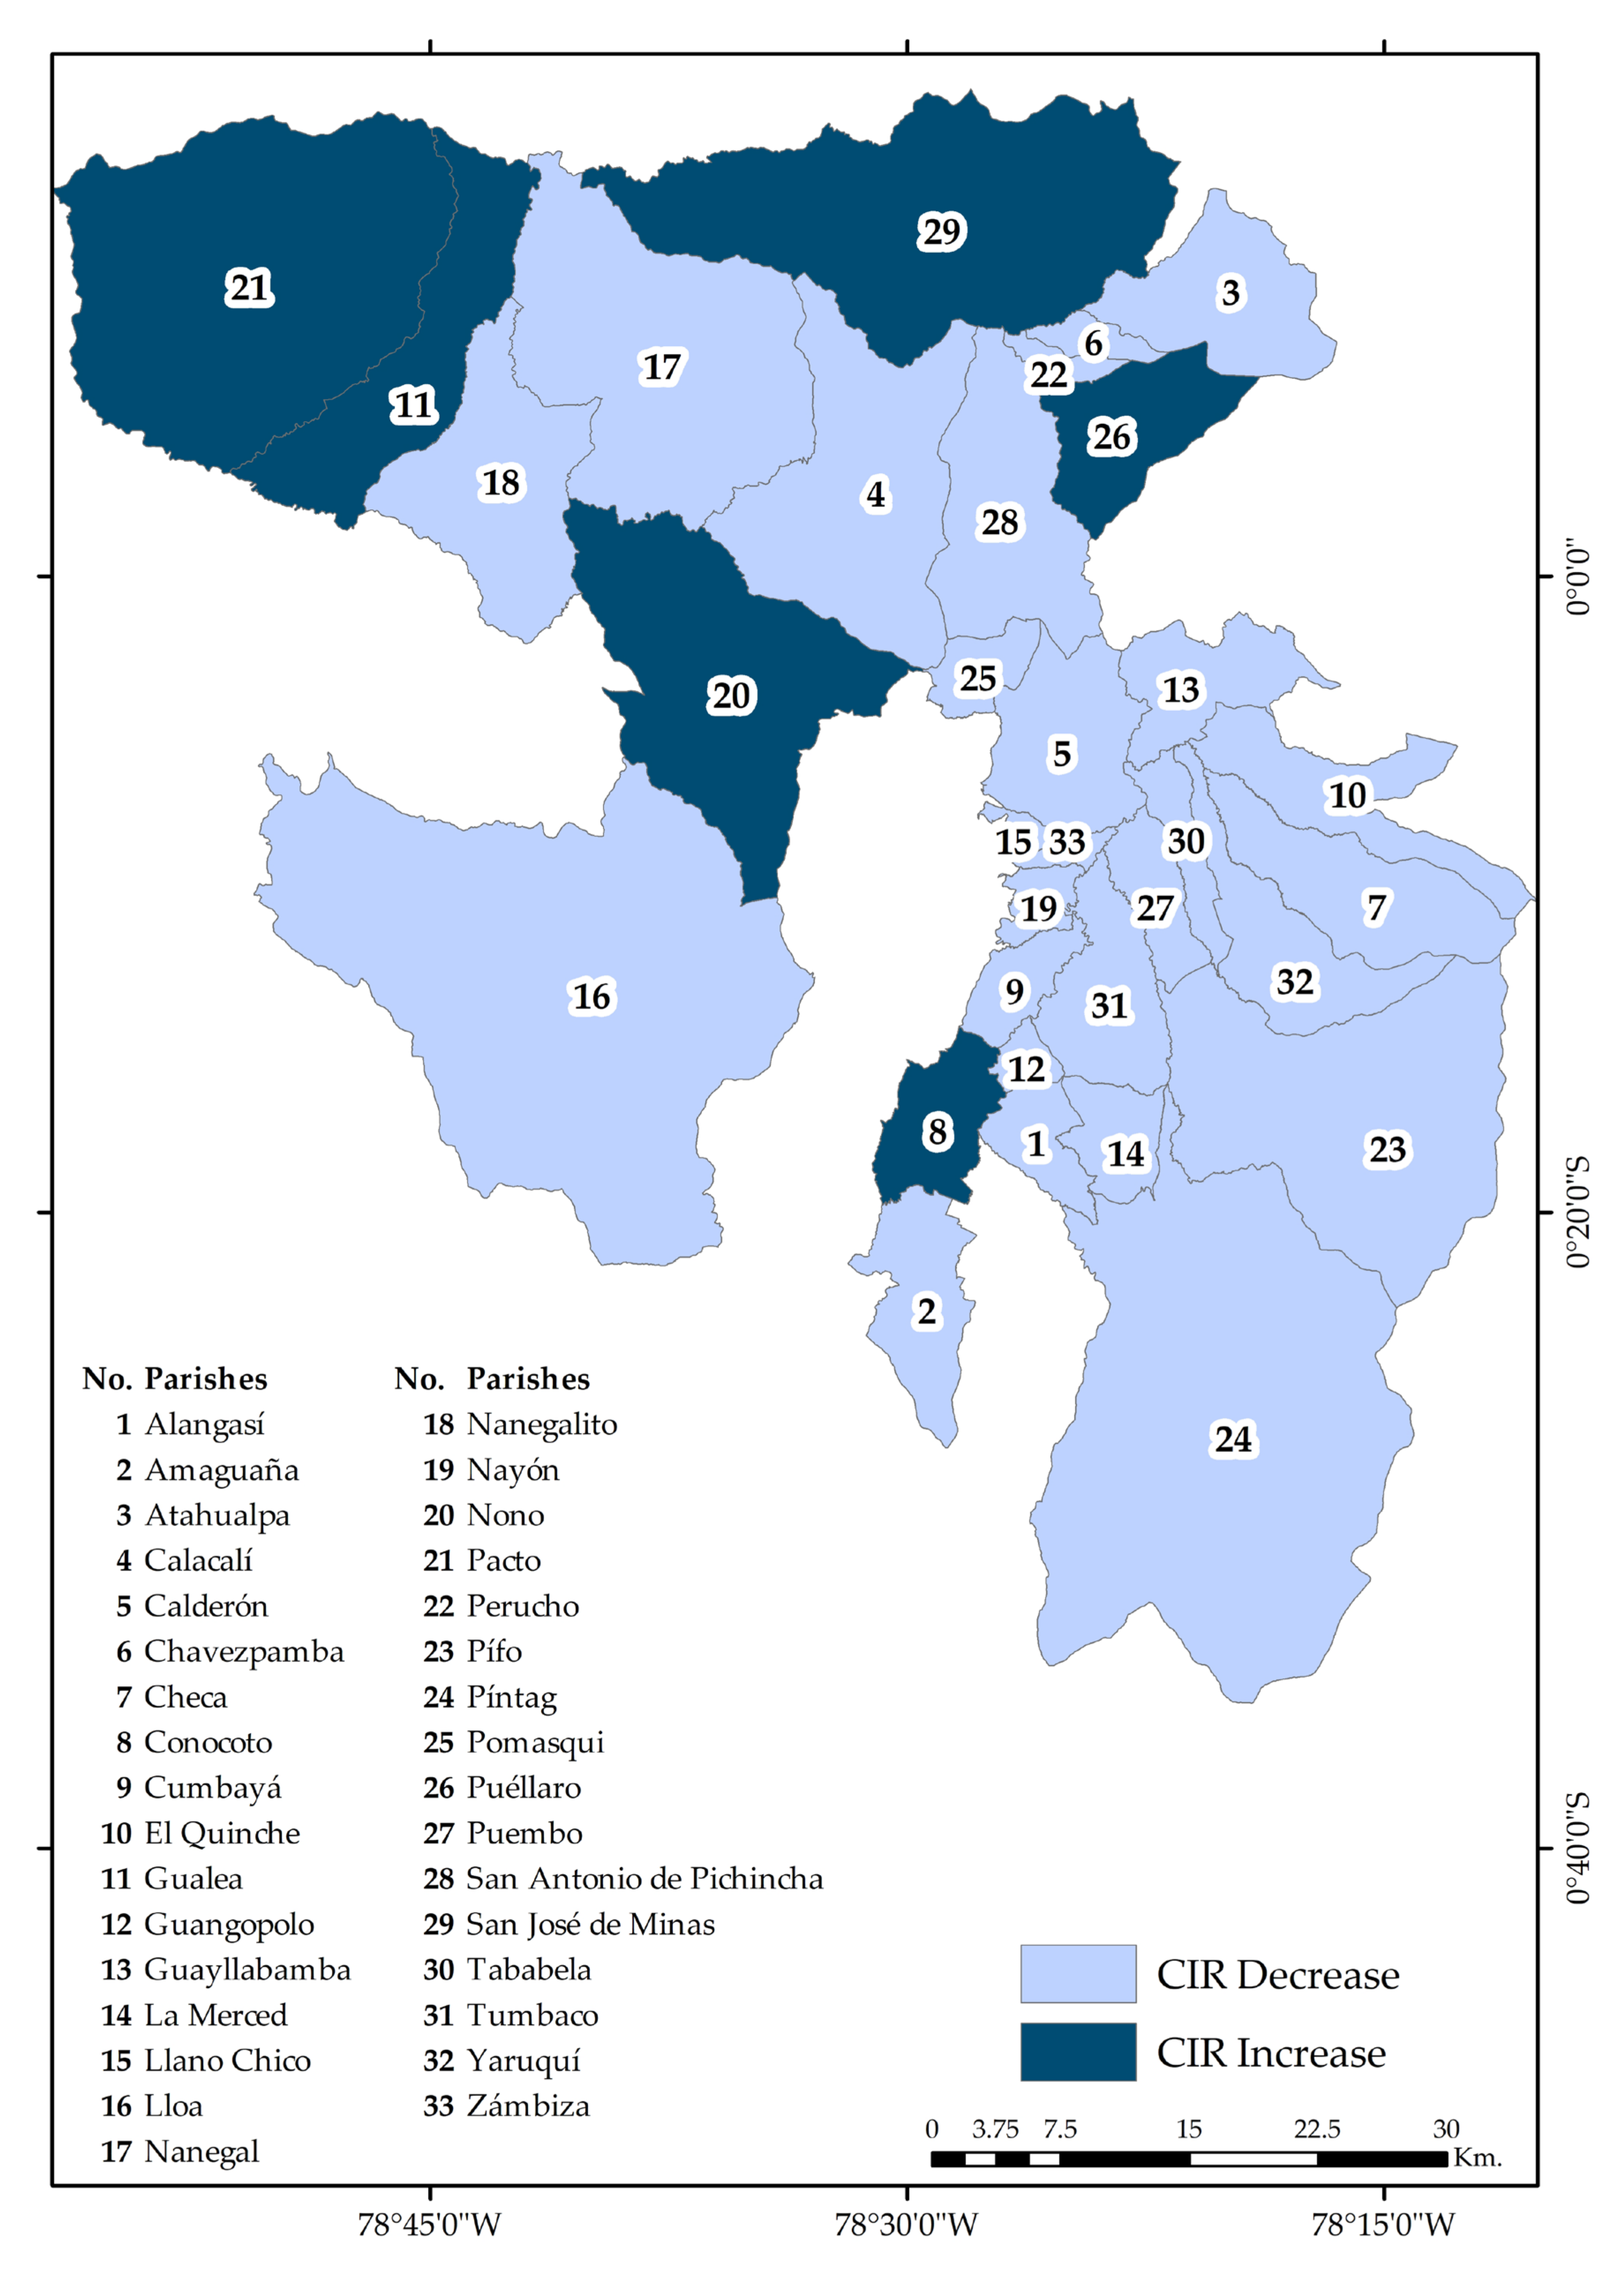
Figure 9 shows
CIR changes (2022–2072).
Due to the urban spatial expansion and population growth of localities in the DMQ’s rural parishes, 27 of the 33 parishes are negatively impacted in the
CIR; that is, meaning they will be less resilient in 2072 under the current circumstances of the other variables. However, 6 parishes register a positive impact on the
CIR, i.e., they increase their resilience, mainly because they tend to decrease (depopulate) according to the projections of population growth by 2072, although they record an increase in the spatial urban expansion of their localities. It has also highlighted the particularity that in the 6 parishes that increase their resilience, the percentage of urbanized land and settlements is low in relation to the total area, and they also have a variety of land uses.
Figure 10 shows the impact of
CIR between 2022 and 2072.
4. Discussion
This study incorporates several considerations for measuring
CIR, i.e., a multidimensional measurement that ensures a balanced and comprehensive approach to resilience. In addition, this manuscript highlights population growth and the projected spatial urban expansion for the next 50 years, considering the analysis in the context of CC and the staggering rate of population growth [
34]. These considerations were obtained from a comparison with some articles that assess the level of resilience in territorial systems in the context of this study. For example, Walker and Salt [
57] who suggest that diversity in socio-ecological systems increases the resilience of the system and homogeneous territories are therefore more vulnerable to environmental stress. Similarly, Tumini [
58] highlights the relationship between resilience and sustainability, stating that a territory is only sustainable if it is also resilient. Rizzi [
59] concludes in his study in Europe that the most resilient areas are those that have high indicators in the economic, social and environmental dimensions, and he also notes that these dimensions are the better resilience factors. Finally, Vincent [
60] Brooks, Adger y Kelly [
61] found that the most vulnerable countries are those that have low scores in the economic, social, environmental and technological dimensions.
Tumini [
59] and Méndez [
10] propose a change in approach to resilience in urban environments that adapts to planning and sustainable CC using sustainability indicators. Similarly, Milanés and Estrada [
62] and Ordóñez-León [
63] analyze urban resilience through poverty indicators. These works determine the level of resilience in a heuristic and theoretical way. While the works of Cuadrado-Roura and Maroto [
64], Villada Estrada [
65], Yanez Contreras [
17], Sánchez Zamora [
66], and Suarez Pardo [
67] propose multidimensional mathematical models (social, environmental, economic, housing, physical, governance, among others) to determine the resilience index, with the difference that they use weighting techniques between the dimensions considered, mostly multicriteria techniques. This study also uses a multidimensional mathematical model, the
CIR, which considers five dimensions and weights the dimensions equally. This highlights that the balance between the acting factors is essential and innate to the systems that want to be resilient. Finally, this research analyzes the factors that determine territorial diversity, which at the same time determine the quality of life of rural communities in the DMQ. This allowed us to determine comprehensive indicators that are the starting point for other studies related to rurality, climate change, natural disasters, sustainable planning and others.
Finally, this study focuses on measuring the impact of the change in IFD (Spatial urban expansion and population growth) on the CIR. However, all other dimensions and variables will certainly change and have impacts on the CIR that need to be considered.
5. Conclusions
The concept of “resilience” is very well positioned among development initiatives and programs worldwide and is key to international agendas. All local and globally recognized initiatives addressing resilience in the region are confronted with the relationship between risks and growing populations. Thus, promoting resilience must mean reducing risk by increasing capacity and reducing fragility in order to implement effective solutions. Efforts must be made to prioritize the most vulnerable social groups, i.e., those who are at risk and lack the necessary conditions to face and recover from unexpected events. A resilient territory must address chronic and recurring disasters at their root and not rely solely on managing the consequences.
Population growth and spatial urban expansion are the factors that most affect a resilient system, as the causes and impacts usually originate from and rebound on the population. In this way, if rapid urbanization is not adequately planned it will put pressure on basic services, living conditions, and public health. However, the same population density can also bring improvements in efficiency and technological innovation, while reducing the consumption of resources and energy. To develop a resilient territory, local governments must prioritize disaster risk assessment and planning, since the phenomenon of massive urbanization turns cities into sources of vulnerability (floods, earthquakes, droughts, air pollution, extreme weather events).
The analysis of this study contributes to Sustainable Development Goal #11: “Make cities and human settlements inclusive, safe, resilient, and sustainable.” To achieve this, the lagging and most vulnerable must be part of urban planning and urban territorial policies, to later have tools to manage problems, adaptability or resilience of an integral system.
Although the DMQ presents a strategic plan to become a resilient city, it focuses on and gives priority to the city of Quito while continuing to treat the localities of the rural parishes in a general way. However, these must be treated independently and according to their own reality. For this reason, geostatistical models (AC and PE) and traditional multivariable and multidimensional mathematical models (social, environmental, physical, governance and economic) were considered to calculate the rural CIR of the DMQ, which proves to be a comprehensive and efficient method to assess rural resilience and contributes to territorial sustainability.
It is confirmed by the results of this analysis that the factors of population growth (population density) and spatial urban expansion (urban density) are the most important factors in the development, management and creation of resilience in a territory, because these factors are the ones that cause, and at the same time those who suffer the consequences of, their own actions in all the dimensions analyzed. Similarly, the diversity of factors that determine each variable has a positive effect on the level of resilience. For example, a more diverse land use and companies from different industrial sectors increase the resilience of the territory. Finally, weighting all the dimensions considered with the same value reflects one of the conceptual principles of the concept of resilience: term BALANCE, because all the dimensions of the system must be taken into account so that the resilience of the territory is sustainable.
Author Contributions
Conceptualization, R.U.-E. and E.L.-N.; methodology, R.U.-E., E.L.-N. and J.C.-C.; software, R.U.-E., E.L.-N. and J.C.-C.; formal analysis, R.U.-E., E.L.-N. and J.C.-C.; investigation, R.U.-E.; data curation, R.U.-E., E.L.-N. and J.C.-C.; writing—original draft preparation, R.U.-E. and E.L.-N.; writing—review and editing, R.U.-E. and E.L.-N.; project administration, R.U.-E. All authors have read and agreed to the published version of the manuscript.
Funding
This research received no external funding.
Data Availability Statement
Not applicable.
Acknowledgments
Authors are grateful to EPMAPS Agua de Quito and anonymous reviewers, whose comments greatly improved the readability and the scientific rigor of the manuscript.
Conflicts of Interest
The authors declare no conflict of interest.
References
- Cyrulnik, B. Resilience: How to Gain Strength from Childhood Adversity; Jeremy P. Tarcher/Penguin: Los Angeles, CA, USA, 2009. [Google Scholar]
- Warner, E.E.; Smith, R.S. Vulnerable but Invincible: A Study of Resilient Children; McGraw-Hill: New York, NY, USA, 1982. [Google Scholar]
- Humphreys, J. Resilience in sheltered battered women. Issues Ment. Health Nurs. 2003, 24, 137–152. Available online: http://www.tandfonline.com/doi/full/10.1080/01612840305293 (accessed on 8 June 2022). [CrossRef]
- Holling, C.S. Resilience and stability of ecological systems. Annu. Rev. Ecol. Syst. 1973, 4, 1–23. Available online: https://pure.iiasa.ac.at/id/eprint/26/1/RP-73-003.pdf (accessed on 9 October 2022). [CrossRef] [Green Version]
- Folke, C. Resilience: The emergence of a perspective for social–ecological systems analyses. Glob. Environ. Chang. 2006, 16, 253–267. [Google Scholar] [CrossRef]
- Adger, W.N. Social and ecological resilience: Are they related? Prog. Hum. Geogr. 2000, 24, 347–364. [Google Scholar] [CrossRef]
- Grotberg, E. The Internacional Resilience Project: Promoting Resilience in Children; University of Wisconsin–Madison: Madison, WI, USA, 1995. Available online: https://files.eric.ed.gov/fulltext/ED383424.pdf (accessed on 23 July 2022).
- Vanistendael, S. Resilience: A Few Key Issues; International Catholic Child Bureau: Valletta, Malta, 1994; Available online: https://scholar.google.com/scholar_lookup?title=+Resilience:+a+few+key+issues&author=Vanistendael+S.&publication_year=1994 (accessed on 3 March 2022).
- Michaud, P.A.; Suris, J.C.; Viner, R. The Adolescent with a Chronic Condition: Epidemiology, Developmental Issues and Health Care Provisio; World Health Organization: Geneva, Switzerland, 2007; Available online: https://apps.who.int/iris/bitstream/handle/10665/43775/9789241595704_eng.pdf (accessed on 3 September 2022).
- Méndez, R. Ciudades y Metáforas: Sobre el Concepto de Resiliencia Urbana; Gobierno de España: Madrid, Spain, 2012; p. 44. [Google Scholar]
- Luthar, S.S.; Cicchetti, D.; Becker, B. The Construct of Resilience: A Critical Evaluation and Guidelines for Future Work. Child. Dev. 2000, 71, 543–562. [Google Scholar] [CrossRef] [PubMed]
- Hill, E.; Clair, T.S.; Wial, H.; Wolman, H.; Atkins, P.; Blumenthal, P.; Ficenec, S.; Friedhoff, A. Economic shocks and regional economic resilience. In Urban and Regional Policy and Its Effects: Building Resilient Regions; Brookings Institution Press: Washington, DC, USA, 2012; pp. 193–274. [Google Scholar]
- Polèse, M. The Resilient City: On the Determinants of Successful Urban Economies; National Institute for Scientific Research: Montreal, QC, Canada, 2010. [Google Scholar]
- Langner, M. Shrinking Cities: Effects on Urban Ecology and Challenges for Urban Development; Endlicher, W., Ed.; W. Endlicher: Berlin, Germany, 2014. [Google Scholar]
- Vale, L.J. The Resilient City: How Modern Cities Recover from Disaster; Oxford University Press: Oxford, UK, 2005. [Google Scholar]
- United Nations. Propuesta de Plataforma Urbana y de Ciudades de América Latina y el Caribe. 2018. Available online: www.cepal.org/es/suscripciones (accessed on 6 June 2021).
- Yanez Contreras, M.; Martelo, J.; Rodríguez, H.Y. Cálculo y análisis de la resiliencia de los departamentos de Colombia. Soc. Econ. 2020, 41, 64–87. Available online: http://www.scielo.org.co/pdf/soec/n41/2389-9050-soec-41-00064.pdf (accessed on 18 May 2022). [CrossRef]
- Del Valle, R.M.G. Conocimiento e Innovación Para el Desarrollo de Ciudades Intermedias. In Ciudades, Culturas y Fronteras en un Mundo en Cambio; Consejería de Obras Públicas y Transportes: Madrid, Spain, 2009; pp. 20–43. Available online: https://www.juntadeandalucia.es/medioambiente/portal_web/servicios_generales/doc_tecnicos/2009/ciudades_culturas_y_fronteras/ciudades_culturas_y_fronteras.pdf (accessed on 9 November 2022).
- Wallisser, B.; Mueller, B.; McLean, C. The World Urban Forum Vancouver Working Group Discussion Paper—The Resilient City; Her Majesty the Queen in Right of Canada and the Ministry of Community Aboriginal and Women’s Services, University of British Columbia: Vancouver, BC, Canada, 2006. [Google Scholar]
- Pendall, R.; Foster, K.A.; Cowell, M. Resilience Andregions: Building understanding of the metaphor. Camb. J. Reg. Econ. Soc. 2007, 3, 71–84. [Google Scholar] [CrossRef] [Green Version]
- Alemana. UNCC. Desarrollo Sostenible, Urbanización y Desigualdad en América Latina y el Caribe Dinámicas y Desafíos para el Cambio Estructural. 2017. Available online: https://repositorio.cepal.org/bitstream/handle/11362/42141/1/S1700701_es.pdf (accessed on 9 September 2022).
- United Nations. Guía de Resiliencia Urbana. Human Settlements. 2016. Available online: https://onuhabitat-org-mx.translate.goog/index.php/guia-de-resiliencia-urbana?_x_tr_sl=es&_x_tr_tl=en&_x_tr_hl=en&_x_tr_pto=sc (accessed on 4 July 2022).
- Banco Mundial; Desarrollo Urbano. Entendiendo a la Pobreza. 2020. Available online: https://www.bancomundial.org/es/topic/urbandevelopment/overview#2 (accessed on 15 June 2022).
- Naciones Unidas. Actividades del Programa de las Naciones Unidas para los Asentamientos Humanos. 2015. Available online: https://unhabitat.org/sites/default/files/2015/01/Spanish-HSP.GC25.2.Add_.2-Activities-of-the-United-Nations-Human-Settlements-Programme.pdf (accessed on 24 May 2022).
- Clos, J. Hábitat III: La Conferencia de las Naciones Unidas centrada en los Ciudadanos. 2015. Available online: https://www.un.org/es/chronicle/article/habitat-iii-la-conferencia-de-las-naciones-unidas-centrada-en-los-ciudadanos (accessed on 18 May 2022).
- UNESCO. Agua Para Todos Agua Para la Vida. In Informe de las Naciones Unidas sobre el Desarrollo de los Recursos Hídricos en el Mundo; UNESCO: Madrid, Spain; OMS: Rome, Italy, 2007; p. 604. [Google Scholar]
- Rockefeller, F. City Resilience-Index. 2013. Available online: https://www.arup.com/perspectives/publications/research/section/city-resilience-index (accessed on 29 June 2022).
- United Nations. Temas Urbanos: Resiliencia. Programa de las Naciones Unidas para los Asentamientos Humanos. 2017. Available online: https://unhabitat.org/es/node/3774 (accessed on 12 February 2022).
- Irassar, E. Rol del Cemento en la Construcción de Ciudades Sostenibles y Resilientes. El Desafío Latinoamericano. 2020. Available online: https://www.researchgate.net/publication/351117019_Rol_del_cemento_en_la_construccion_de_ciudades_sostenibles_y_resilientes_el_desafio_latinoamericano (accessed on 7 March 2022).
- Gifreu, J. Ciudades Adaptativas y Resilientes ante el cambio climático: Estrategias locales para contribuir a la sostenibilidad urbana. Dialnet Métricas 2018, 52, 102–158. [Google Scholar]
- Sandoval, V.; Sarmiento, J.P. Una mirada desde la gobernanza del riesgo y la resiliencia urbana en América Latina y el Caribe: Los asentamientos informales en la Nueva Agenda Urbana. Rev. Estud. Latinoam. Sobre Reducción del Riesgo Desastr. 2018, 2, 38–52. [Google Scholar] [CrossRef]
- Rioja, L.C. Cambios en las Estructuras de los hogares rurales Formas de adaptación y resiliencia. Rev. Int. Sociol. 2014, 72, 377–401. [Google Scholar] [CrossRef] [Green Version]
- Molina-Murillo, S.A. Eco territorios: Espacios resilientes de interacción rural y urbana. Res. Archit. 2018, 3, 61–65. [Google Scholar]
- Corfee-Morlot, J.; Kamal-Chaoui, L.; Donovan, M.G.; Cochran, I.; Robert, A.; Teasdale, P.J. Cities, Climate Change and Multilevel Governance; OECD: Paris, France, 2009. [Google Scholar]
- Bárcena, A.; Samaniego, J.; Galindo, L.M.; Ferrer, J.; Alatorre, J.E.; Stockins, P.; Reyes, O.; Sánchez, L.; Mostacedo, J. Economics of Climate Change in Latin America and the Caribbean: A Graphic View (United Nations). 2018. Available online: https://repositorio.cepal.org/bitstream/handle/11362/43889/1/S1800475_en.pdf (accessed on 14 January 2022).
- OCHA. Natural Disasters in Latin America and the Caribbean, 2000–2019. 2020. Available online: https://reliefweb.int/report/world/natural-disasters-latin-america-and-caribbean-2000-2019 (accessed on 28 February 2022).
- Montero, J.G.L. Panorama Multidimensional del Desarrollo Urbano en América Latina y el Caribe. Comisión Económica para América Latina y el Caribe (CEPAL). 2017. Available online: https://repositorio.cepal.org/bitstream/handle/11362/41974/1/S1700257_es.pdf (accessed on 1 May 2022).
- Banco de Desarrollo de América Latina (CAF). La Resiliencia Urbana se Expandirá en América Latina a Través de la Asociación Entre CAF y la Red de Ciudades Resiliente. 2021. Available online: https://www.caf.com/es/actualidad/noticias/2021/05/la-resiliencia-urbana-se-expandira-en-america-latina-a-traves-de-la-asociacion-entre-caf-y-la-red-de-ciudades-resiliente/ (accessed on 17 January 2022).
- FMI. Fondo del FMI para la Resiliencia y la Sostenibilidad para Ayudar a Países Vulnerables. Cambio Climático, Economía. 2022. Available online: https://sostenibles.org/2022/04/18/fondo-de-resiliencia-y-sostenibilidad/ (accessed on 31 August 2022).
- Alcalde de Quito. Estrategia de Resiliencia: Distrito Metropolitano de Quito; Alcalde de Quito: Quito, Ecuador, 2017. [Google Scholar]
- JRC—Joint Research Centre EC for RSA. Modelling Deforestation Processes—A Review; Research Report No. 1; ECSC/EC/EAEC: Luxembourg; European Space Agency: Luxembourg, 1994. [Google Scholar]
- Rouse, J.W.; Hass, R.H.; Schell, J.A.; Deering, D.W. Monitoring Vegetation Systems in the Great Plains with ERTS. Nasa ERTS Symp., pp. 309–313. 1973. Available online: https://books.google.com.br/books?hl=pt-BR&lr=&id=e00CAAAAIAAJ&oi=fnd&pg=PA309&dq=related:7O0hXbvln8cJ:scholar.google.com/&ots=JTOBiUzm-9&sig=LGzI8o8qfg0E5N4vmIbQpDWyHF4#v=onepage&q&f=false (accessed on 3 August 2022).
- Kundu, A.; Denis, D.M.; Patel, N.R.; Dutta, D. A Geo-spatial study for analysing temporal responses of NDVI to rainfall. Singap. J. Trop. Geogr. 2018, 39, 107–116. [Google Scholar] [CrossRef]
- Hasegawa, S.F.; Takada, T. Probability of deriving a yearly transition probability matrix for land-use dynamics. Sustainability 2019, 11, 6355. [Google Scholar] [CrossRef] [Green Version]
- Soares-Filho, B.S.; Rodrigues, H.O.; Costa, W.L. Modeling Environmental Dynamics with Dinamica EGO. Inst Geociências–Cent Sensoriamento Remoto. (October). 2009. Available online: https://www.researchgate.net/profile/Tao_Guo28/publication/282782423_Dinamica_EGO_guidebookpdf/links/561c711108aea80367243fdc.pdf (accessed on 15 January 2022).
- Goodacre, A.; Bonham-Carter, G.; Agterberg, F.; Wright, D. A statistical analysis of the spatial association of seismicity with drainage patterns and magnetic anomalies in western Quebec. Tectonophysics 1993, 217, 285–305. [Google Scholar] [CrossRef]
- Ulloa-Espíndola, R.; Martín-Fernández, S. Simulation and analysis of land use changes applying cellular automata in the south of Quito and the Machachi valley, Province of Pichincha, Ecuador. Sustainability 2021, 13, 9525. [Google Scholar] [CrossRef]
- Toffoli, T.; Margolus, N. Cellular Automata Machines: A New Environment for Modeling; MIT Press: Cambridge, MA, USA, 1987. [Google Scholar]
- Bonham-Carter, G. Geographic Information Systems for Geoscientists; Pergamon: New York, NY, USA, 2016. [Google Scholar]
- Ulloa-Espíndola, R.; Pérez-Albert, Y. Validación de un Modelo de Predicción del Crecimiento Urbano en Quito (Ecuador) Construido Mediante Pesos de Evidencia y Autómatas Celulares; EURE: Madrid, Spain, 2022; p. 48. [Google Scholar]
- Suarez-Casado, M. La Resiliencia de los Ecosistemas Urbanos: Una Propuesta de Evaluación para la Sostenibilidad; Universidades Autónoma y Complutense: Madrid, Spain; Universidad de Alcalá: Madrid, Spain, 2012. [Google Scholar]
- Carpenter, S.; Walker, B.; Anderies, J.M.; Abel, N. From metaphor to measurement: Resilience of what to what? Ecosystems 2001, 4, 765–781. Available online: http://link.springer.com/10.1007/s10021-001-0045-9 (accessed on 26 March 2022). [CrossRef]
- Olóriz-Sanjuan, C.; García-Becerra, F.; Villada-Canela, M.; Ramírez-Galindo, J.A.; Aguilar-Benítez, I.; Barkwith, A. Assessing Socio-hydrological Resilience in Urban Metropolitan Environments: A Mexican Perspective. In Water Availability and Management in Mexico; Springer: Berlin/Heidelberg, Germany, 2020; pp. 413–442. Available online: http://link.springer.com/10.1007/978-3-030-24962-5_20 (accessed on 2 February 2022).
- Renschler, C.S.; Frazier, A.E.; Arendt, L.A.; Cimellaro, G.P.; Reinhorn, A.M.; Bruneau, M. A Framework for Defining and Measuring Resilience at the Community Scale: The PEOPLES Resilience Framework; MCEER: Buffalo, NY, USA, 2010; p. 10-0006. [Google Scholar]
- Adger, W.N.; Brooks, N.; Bentham, G.; Agnew, M.; Eriksen, S.; Adger, W.N.; Bentham, G. New Indicators of Vulnerability and Adaptive Capacity; Tyndall Centre for Climate Change Research: Norwich, UK, 2004. [Google Scholar]
- MAATE. La Deforestación en el Ecuador, 1990–2018. 1–216. 2021. Available online: https://www.proamazonia.org/wp-content/uploads/2021/06/Deforestación_Ecuador_com2.pdf (accessed on 14 March 2022).
- Walker, B.; Salt, D. Resilience Thinking: Sustaining Ecosystems and People in a Changing World; Island Press: Beijing, China, 2006. [Google Scholar]
- Tumini, I. Acercamiento teórico para la integración de los conceptos de Resiliencia en los indicadores de Sostenibilidad Urbana. Rev. Urban. 2016, 34, 4–19. Available online: https://semanariorepublicano.uchile.cl/index.php/RU/article/view/40056 (accessed on 14 January 2022). [CrossRef] [Green Version]
- Rizzi, P.; Graziano, P.; Dallara, A. A capacity approach to territorial resilience: The case of European regions. Ann. Reg. Sci. 2018, 60, 285–328. [Google Scholar] [CrossRef]
- Vincent, K. Uncertainty in adaptive capacity and the importance of scale. Glob. Environ. Change 2007, 17, 12–24. [Google Scholar] [CrossRef]
- Brooks, N.; Adger, W.N.; Kelly, P.M. The determinants of vulnerability and adaptive capacity at the national level and the implications for adaptation. Glob. Environ. Change 2005, 15, 151–163. [Google Scholar] [CrossRef]
- Milanés Batista, C.; Estrada Rosales, O. Indicadores de Gobernanza para Evaluar los Impactos de Pobreza, Desigualdad, Prosperidad y Resiliencia Urbana en el Distrito de Barranquilla, Colombia; Universidad de la Costa: Barranquilla, Colombia, 2020; Available online: https://repositorio.cuc.edu.co/bitstream/handle/11323/7095/Indicadores%20de%20gobernanza%20para%20evaluar%20los%20impactos%20de%20pobreza%2C%20desigualdad%2C%20prosperidad%20y%20resiliencia%20urbana%20en%20el%20Distrito%20de%20Barranquilla%2C%20Colombia.pdf?sequence (accessed on 18 September 2022).
- Ordóñez-León, A. Resiliencia Urbana y COVID-19: El caso Loja—Ecuador. CienciAmérica Rev. Divulg. Cient. Univ. Tecnol. Indoamérica 2021, 10, 66–88. Available online: https://www.researchgate.net/publication/353466791_RESILIENCIA_URBANA_Y_COVID19_El_caso_de_Loja_-Ecuador_Urban_resilience_and_COVID19_The_case_of_Loja_-Ecuador_Resiliencia_urbana_e_COVID19_O_caso_de_Loja_-Equador (accessed on 18 July 2022).
- Cuadrado-Roura, J.R.; Maroto, A. Unbalanced regional resilience to the economic crisis in Spain: A tale of specialisation and productivity. Camb. J. Reg. Econ. Soc. 2016, 9, 153–178. [Google Scholar] [CrossRef]
- Villada Estrada, P.A. Construcción de un Índice de Resiliencia Urbana frente a la Variabilidad y el Cambio Climático. Master’s Thesis, Universidad Nacional de Colombia, Bogotá, Colombia, 2020. [Google Scholar]
- Sánchez Zamora, P. Crisis y Ruralidad: Un Análisis de los Factores de Resiliencia en los Territorios Rurales de Andalucía. Ph.D. Thesis, Universidad de Córdoba, Córdoba, Colombia, 2015. [Google Scholar]
- Suarez Pardo, A. Resiliencia en Agroecosistemas: Un Índice bajo el Enfoque de Sistemas Socio-Ecológicos. Master’s Thesis, Universidad Nacional de Colombia, Bogotá, Colombia, 2020. [Google Scholar]
Figure 1.
DMQ actions for building resilient territory.
Figure 1.
DMQ actions for building resilient territory.
Figure 2.
Metropolitan District of Quito (DMQ).
Figure 2.
Metropolitan District of Quito (DMQ).
Figure 3.
DMQ rural parishes.
Figure 3.
DMQ rural parishes.
Figure 4.
Decay function for an attenuation factor of 10.
Figure 4.
Decay function for an attenuation factor of 10.
Figure 5.
Methodology workflow. Red, stage 1. Purple, stage 2.
Figure 5.
Methodology workflow. Red, stage 1. Purple, stage 2.
Figure 6.
Projections of the spatial urban expansion of the DMQ (urbanization/settlements), (a) 2022, (b) 2047 (next 25 years), (c) 2072 (next 50 years).
Figure 6.
Projections of the spatial urban expansion of the DMQ (urbanization/settlements), (a) 2022, (b) 2047 (next 25 years), (c) 2072 (next 50 years).
Figure 7.
CIR levels 2022. Values were computed using the Natural Breaks (Jenks) method to classify three levels: low, medium and high.
Figure 7.
CIR levels 2022. Values were computed using the Natural Breaks (Jenks) method to classify three levels: low, medium and high.
Figure 8.
CIR levels 2072. Values were computed using the Natural Breaks (Jenks) method to classify three levels: low, medium and high.
Figure 8.
CIR levels 2072. Values were computed using the Natural Breaks (Jenks) method to classify three levels: low, medium and high.
Figure 9.
CIR changes (2022–2072).
Figure 9.
CIR changes (2022–2072).
Figure 10.
CIR impact of each parish 2022–2072.
Figure 10.
CIR impact of each parish 2022–2072.
Table 1.
Resources and information.
Table 1.
Resources and information.
| Product | Variable | Format—Scale | Agency | Date | Pre-Processing |
|---|
| 1. Spatial projections urban expansion | 1.1. Spatial urban expansion | Raster geographical coverage, spatial resolution 10 m | Sentinel, Google Earth | 2003/2022 | Digitalization and calculation of Difference Vegetation Index (NDVI) |
| 1.2. Distance to Road Network and Streets | Geographical coverage (SHP), scale 1:5000 | Municipality of Quito | 2016 | Geoprocess, Euclidean distance |
| 1.3. Distance to Water and Sanitation Networks | Geographical coverage (SHP), scale 1:10,000 | Drinking Water and Sanitation Company | 2018 | Geoprocess, Euclidean distance |
| 1.4. Distance to power lines | Geographical coverage (SHP), scale 1:5000 | Quito Electric Company | 2018 | Geoprocess, Euclidean distance |
| 1.5. Slope of the Land | Geographical coverage (SHP), scale 1:10,000 | Municipality of Quito | 2010 | Geoprocess, slope |
| 1.6. Land Use Rating | Geographical coverage (SHP), scale 1:5000 | Municipality of Quito | 2016 | Geoprocessing, reclassification |
| 1.7. Distance to Education Institutions | Geographical coverage (SHP), scale 1:5000 | Municipality of Quito | 2014 | Geoprocess, Euclidean distance |
| 1.8. Distance to Health Institutions | Geographical coverage (SHP), scale 1:5000 | Municipality of Quito | 2014 | Geoprocess, Euclidean distance |
| 1.9. Distance to existing settlements | Geographical coverage (SHP), scale 1:15,000 | Google Earth images | 2018 | Geoprocess, buffer |
| 2. Composite Resilience Index | 2.1. Safety | Indicator, value between 0 to 100, 0 null well-being, 100 total well-being. | Institute of the city of Quito, Quality of Life Index | 2016 | None |
| 2.2. Basic services |
| 2.3. Health |
| 2.4. Education |
| 2.5. Social inclusion |
| 2.6. Subjective well-being |
| 2.7. Environment |
| 2.8. Economic security |
| 2.9. Mobility |
| 2.10. Land and housing |
| 2.11. Green areas and public space |
| 2.12. Land Use (# land uses) |
| 2.13. Urban spatial expansion 2022 |
| 2.14. Social cohesion |
| 2.15. Ecological footprint per capita | National indicator, value in global hectares (hag) | Ministry of Environment, Water and Ecological Transition | 2021 |
Table 2.
Variables and dimensions used to calculate the CIR.
Table 2.
Variables and dimensions used to calculate the CIR.
| | Variables | Information Considered for the Construction of the Variable |
|---|
| Social dimension | Safety | Household victimization and victimization of household members. |
| Basic services | Proper excreta disposal, access to drinking water, access to electricity, access to internet, access to garbage collection, and adequate access to housing |
| Health | Good nutrition, proper care, health insurance coverage, and frequency of physical activity. |
| Education | School lag, educational attainment, and qualified personnel |
| Social inclusion | Attendance at children’s programs or centers, distance to the middle class, and home maintenance. |
| Subjective well-being | Level of satisfaction with education, level of satisfaction with health, level of satisfaction with financial situation, level of satisfaction with their housing, level of satisfaction with their participation in the community, level of satisfaction with life, and decisional autonomy. |
| Leisure time | Spacing time, time spent on family activities, and time spent sleeping. |
| Environmental Dimension | Environment | Noise exposure, odor exposure, recycling, concern for the environment, and sustainable water consumption |
| Economic Dimension | Economic security | Poverty gap by consumption, sufficient hours worked, and employed persons affiliated to social security. |
Physical Dimension/
Infrastructure | Land Use (# land uses) | Diversity of land use that each parish possesses |
| Urban spatial expansion | % of land consumption in urban areas and settlements |
| Housing (land and housing) | Overcrowding, material housing deficits, and population density |
| Green areas and public space | Access to public spaces and green areas, distance to public spaces and green areas. |
| Mobility | Travel time to health facilities, travel time to educational facilities, commute time, and use of public transportation |
| Institutional Dimension/Governance | Social cohesion | Perception of poverty with respect to the environment, neighborhood action, good neighborhood relations, situation of neighborhood belonging and good treatment. |
Table 3.
Highest Cramer values.
Table 3.
Highest Cramer values.
| First_Variable | Second_Variable | Cramer |
|---|
| Distance to Water and Sanitation Networks | Distance to Road Network and Streets | 0.45 |
| Distance to Road Network and Streets | Distance to existing settlements | 0.38 |
Table 4.
Prediction degree obtained.
Table 4.
Prediction degree obtained.
| Window Size (# of Pixels) | Similarity (%) | Real Evaluation Distance Map (Pixel Size 10 m) |
|---|
| 1 | 39% | 10 m |
| 11 | 62% | 110 m |
| 21 | 71% | 210 m |
| 31 | 75% | 310 m |
| 41 | 76% | 410 m |
| 51 | 76% | 510 m |
| 61 | 76% | 610 m |
| 71 | 76% | 710 m |
Table 5.
Area of urbanized land and settlements in each rural parish.
Table 5.
Area of urbanized land and settlements in each rural parish.
| Parishes | Total Area (Hectares) | 2022 | 2072 |
|---|
| Urban Land and Settlements (Hectares) | % | Urban Land and Settlements (Hectares) | % |
|---|
| 1 | Alangasí | 2943.78 | 1253.81 | 42.59 | 1471.92 | 50.00 |
| 2 | Amaguania | 6034.23 | 1169.17 | 19.38 | 1907.98 | 31.62 |
| 3 | Atahualpa | 8634.05 | 76.22 | 0.88 | 81.99 | 0.95 |
| 4 | Calacali | 18,330.00 | 294.34 | 1.61 | 400.36 | 2.18 |
| 5 | Calderon | 7920.20 | 3838.01 | 48.46 | 4437.72 | 56.03 |
| 6 | Chavezpamba | 1228.66 | 14.31 | 1.17 | 20.72 | 1.69 |
| 7 | Checa | 8840.51 | 230.81 | 2.61 | 393.88 | 4.46 |
| 8 | Conocoto | 4807.69 | 3597.40 | 74.83 | 3671.06 | 76.36 |
| 9 | Cumbaya | 2645.92 | 1711.73 | 64.69 | 1839.71 | 69.53 |
| 10 | El quinche | 7317.63 | 827.10 | 11.30 | 912.42 | 12.47 |
| 11 | Gualea | 12,089.70 | 16.44 | 0.14 | 63.74 | 0.53 |
| 12 | Guangopolo | 1000.58 | 56.50 | 5.65 | 57.80 | 5.78 |
| 13 | Guayllabamba | 5545.12 | 577.95 | 10.42 | 928.93 | 16.75 |
| 14 | La merced | 3164.20 | 894.04 | 28.26 | 1038.84 | 32.83 |
| 15 | Llano chico | 727.82 | 549.40 | 75.49 | 556.17 | 76.42 |
| 16 | Lloa | 54,382.40 | 19.66 | 0.04 | 52.89 | 0.10 |
| 17 | Nanegal | 24,546.40 | 22.83 | 0.09 | 22.83 | 0.09 |
| 18 | Nanegalito | 12,512.70 | 32.19 | 0.26 | 171.45 | 1.37 |
| 19 | Nayon | 1576.65 | 803.07 | 50.94 | 845.63 | 53.64 |
| 20 | Nono | 21,399.90 | 34.54 | 0.16 | 99.35 | 0.46 |
| 21 | Pacto | 34,734.10 | 53.53 | 0.15 | 124.22 | 0.36 |
| 22 | Perucho | 973.37 | 60.70 | 6.24 | 61.01 | 6.27 |
| 23 | Pifo | 25,598.40 | 1211.13 | 4.73 | 1496.12 | 5.85 |
| 24 | Pintag | 48,859.90 | 611.30 | 1.25 | 1177.35 | 2.41 |
| 25 | Pomasqui | 2324.68 | 888.94 | 38.24 | 951.26 | 40.92 |
| 26 | Puellaro | 7240.59 | 89.69 | 1.24 | 137.26 | 1.90 |
| 27 | Puembo | 3176.22 | 659.21 | 20.75 | 980.10 | 30.86 |
| 28 | San José de minas | 30,851.60 | 169.41 | 0.55 | 277.64 | 0.90 |
| 29 | San Antonio | 11,644.40 | 1441.80 | 12.38 | 2578.81 | 22.15 |
| 30 | Tababela | 2533.67 | 578.75 | 22.84 | 725.24 | 28.62 |
| 31 | Tumbaco | 6567.04 | 2107.66 | 32.10 | 2546.24 | 38.77 |
| 32 | Yaruquí | 7225.19 | 766.19 | 10.60 | 995.88 | 13.78 |
| 33 | Zambiza | 766.37 | 103.14 | 13.46 | 116.39 | 15.19 |
Table 6.
CIR of each parish in 2022.
Table 6.
CIR of each parish in 2022.
| N° | Parish | SD | EVD | ECD | IFD | GVD | EF | N° Inhabitants | EFP | Total Area (ha) | CIR 2022 |
|---|
| 1 | Alangasi | 69.68 | 64.05 | 50.03 | 44.44 | 67.33 | 1.86 | 33,809 | 62,884.74 | 2943.80 | 2.80 |
| 2 | Amaguania | 67.72 | 63.99 | 45.36 | 40.18 | 66.78 | 1.86 | 40,885 | 76,046.10 | 6034.20 | 4.50 |
| 3 | Atahualpa | 65.31 | 71.15 | 38.72 | 33.59 | 72.33 | 1.86 | 1937 | 3602.82 | 8634.00 | 134.70 |
| 4 | Calacali | 65.32 | 68.85 | 39.61 | 31.22 | 71.67 | 1.86 | 4179 | 7772.94 | 18,330.00 | 130.50 |
| 5 | Calderon | 69.39 | 65.07 | 46.98 | 49.00 | 66.31 | 1.86 | 271,169 | 504,374.34 | 7920.20 | 0.90 |
| 6 | Conocoto | 71.11 | 63.93 | 51.19 | 55.52 | 62.64 | 1.86 | 126,075 | 234,499.50 | 4807.70 | 1.20 |
| 7 | Cumbaya | 72.29 | 67.52 | 57.63 | 51.58 | 70.84 | 1.86 | 46,730 | 86,917.80 | 2645.90 | 1.90 |
| 8 | Chavezpamba | 65.08 | 71.61 | 40.60 | 32.68 | 74.88 | 1.86 | 730 | 1357.80 | 1228.70 | 51.60 |
| 9 | Checa | 64.61 | 70.25 | 39.14 | 34.55 | 67.72 | 1.86 | 10,969 | 20,402.34 | 8840.50 | 23.90 |
| 10 | El Quinche | 65.25 | 69.39 | 39.60 | 36.84 | 66.90 | 1.86 | 19,976 | 37,155.36 | 7317.60 | 10.90 |
| 11 | Gualea | 63.36 | 71.35 | 36.56 | 29.03 | 73.37 | 1.86 | 1911 | 3554.46 | 12,089.70 | 186.20 |
| 12 | Guangopolo | 64.23 | 64.14 | 40.04 | 36.01 | 67.10 | 1.86 | 4346 | 8083.56 | 1000.60 | 6.70 |
| 13 | Guayllabamba | 65.43 | 67.83 | 40.26 | 36.78 | 71.43 | 1.86 | 21,421 | 39,843.06 | 5545.10 | 7.80 |
| 14 | La Merced | 64.22 | 66.84 | 39.44 | 40.46 | 68.12 | 1.86 | 13,142 | 24,444.12 | 3164.20 | 7.20 |
| 15 | Llano Chico | 66.30 | 65.63 | 43.18 | 53.98 | 70.43 | 1.86 | 18,439 | 34,296.54 | 727.80 | 1.30 |
| 16 | Lloa | 64.13 | 71.46 | 38.33 | 27.81 | 63.79 | 1.86 | 1560 | 2901.60 | 54,382.40 | 995.30 |
| 17 | Nanegal | 64.16 | 70.81 | 37.36 | 29.14 | 75.85 | 1.86 | 2714 | 5048.04 | 24,546.40 | 269.70 |
| 18 | Nanegalito | 63.90 | 68.76 | 37.88 | 32.38 | 61.22 | 1.86 | 3693 | 6868.98 | 12,512.70 | 96.20 |
| 19 | Nayon | 69.48 | 66.89 | 52.56 | 47.28 | 72.75 | 1.86 | 25,067 | 46,624.62 | 1576.70 | 2.10 |
| 20 | Nono | 63.13 | 69.76 | 34.23 | 30.37 | 69.67 | 1.86 | 1706 | 3173.16 | 21,399.90 | 360.40 |
| 21 | Pacto | 64.11 | 69.88 | 35.48 | 28.44 | 74.08 | 1.86 | 4772 | 8875.92 | 34,734.10 | 212.90 |
| 22 | Perucho | 64.71 | 70.34 | 37.89 | 35.21 | 78.24 | 1.86 | 792 | 1473.12 | 973.40 | 37.80 |
| 23 | Pifo | 65.08 | 67.67 | 41.56 | 33.62 | 67.00 | 1.86 | 22,377 | 41,621.22 | 25,598.40 | 33.80 |
| 24 | Pintag | 63.21 | 67.73 | 37.37 | 31.08 | 70.03 | 1.86 | 22,129 | 41,159.94 | 48,859.90 | 64.00 |
| 25 | Pomasqui | 71.15 | 63.89 | 51.86 | 46.33 | 68.89 | 1.86 | 42,004 | 78,127.44 | 2324.70 | 1.80 |
| 26 | Puellaro | 64.37 | 69.01 | 38.58 | 33.20 | 74.41 | 1.86 | 5215 | 9699.90 | 7240.60 | 41.70 |
| 27 | Puembo | 65.73 | 68.71 | 44.71 | 37.69 | 73.80 | 1.86 | 16,815 | 31,275.90 | 3176.20 | 5.90 |
| 28 | San Antonio | 68.37 | 65.91 | 44.93 | 35.93 | 67.65 | 1.86 | 52,512 | 97,672.32 | 11,644.40 | 6.70 |
| 29 | San José de Minas | 62.79 | 71.13 | 36.11 | 28.63 | 73.98 | 1.86 | 6957 | 12,940.02 | 30,851.60 | 130.00 |
| 30 | Tababela | 66.18 | 67.57 | 42.94 | 38.04 | 73.68 | 1.86 | 3799 | 7066.14 | 2533.70 | 20.70 |
| 31 | Tumbaco | 67.35 | 66.85 | 46.64 | 41.68 | 65.49 | 1.86 | 64,581 | 120,120.66 | 6567.00 | 3.10 |
| 32 | Yaruqui | 65.34 | 68.83 | 41.71 | 39.21 | 59.16 | 1.86 | 23,036 | 42,846.96 | 7225.20 | 9.20 |
| 33 | Zambiza | 66.57 | 63.53 | 44.76 | 38.63 | 73.58 | 1.86 | 5526 | 10,278.36 | 766.40 | 4.30 |
Table 7.
CIR of each parish in 2072.
Table 7.
CIR of each parish in 2072.
| N° | Parish | SD | EVD | ECD | IFD | GVD | EF | N° Inhabitants | EFP | Total Area (ha) | CIR 2072 |
|---|
| 1 | Alangasi | 69.68 | 64.05 | 50.03 | 45.92 | 67.33 | 1.86 | 68,260 | 126,963.16 | 2943.80 | 1.40 |
| 2 | Amaguania | 67.72 | 63.99 | 45.36 | 42.63 | 66.78 | 1.86 | 72,888 | 135,572.27 | 6034.20 | 2.60 |
| 3 | Atahualpa | 65.31 | 71.15 | 38.72 | 33.61 | 72.33 | 1.86 | 2006 | 3732.07 | 8634.00 | 130.10 |
| 4 | Calacali | 65.32 | 68.85 | 39.61 | 31.34 | 71.67 | 1.86 | 4847 | 9015.06 | 18,330.00 | 112.60 |
| 5 | Calderon | 69.39 | 65.07 | 46.98 | 50.52 | 66.31 | 1.86 | 919,306 | 1709,909.29 | 7920.20 | 0.30 |
| 6 | Conocoto | 71.11 | 63.93 | 51.19 | 55.82 | 62.64 | 1.86 | 312,529 | 581,304.39 | 4807.70 | 0.50 |
| 7 | Cumbaya | 72.29 | 67.52 | 57.63 | 52.55 | 70.84 | 1.86 | 107,879 | 200,654.62 | 2645.90 | 0.80 |
| 8 | Chavezpamba | 65.08 | 71.61 | 40.60 | 32.78 | 74.88 | 1.86 | 576 | 1071.46 | 1228.70 | 65.40 |
| 9 | Checa | 64.61 | 70.25 | 39.14 | 34.92 | 67.72 | 1.86 | 16,745 | 31,146.39 | 8840.50 | 15.70 |
| 10 | El Quinche | 65.25 | 69.39 | 39.60 | 37.07 | 66.90 | 1.86 | 31,701 | 58,963.92 | 7317.60 | 6.90 |
| 11 | Gualea | 63.36 | 71.35 | 36.56 | 29.10 | 73.37 | 1.86 | 1655 | 3078.81 | 12,089.70 | 215.00 |
| 12 | Guangopolo | 64.23 | 64.14 | 40.04 | 36.03 | 67.10 | 1.86 | 11,647 | 21,663.23 | 1000.60 | 2.50 |
| 13 | Guayllabamba | 65.43 | 67.83 | 40.26 | 38.05 | 71.43 | 1.86 | 38,622 | 71,836.55 | 5545.10 | 4.40 |
| 14 | La Merced | 64.22 | 66.84 | 39.44 | 41.37 | 68.12 | 1.86 | 43,206 | 80,363.24 | 3164.20 | 2.20 |
| 15 | Llano Chico | 66.30 | 65.63 | 43.18 | 54.17 | 70.43 | 1.86 | 58,591 | 108,980.17 | 727.80 | 0.40 |
| 16 | Lloa | 64.13 | 71.46 | 38.33 | 27.82 | 63.79 | 1.86 | 1707 | 3174.78 | 54,382.40 | 909.70 |
| 17 | Nanegal | 64.16 | 70.81 | 37.36 | 29.14 | 75.85 | 1.86 | 2883 | 5362.56 | 24,546.40 | 253.90 |
| 18 | Nanegalito | 63.90 | 68.76 | 37.88 | 32.60 | 61.22 | 1.86 | 5629 | 10,470.60 | 12,512.70 | 63.20 |
| 19 | Nayon | 69.48 | 66.89 | 52.56 | 47.82 | 72.75 | 1.86 | 68,046 | 126,566.49 | 1576.70 | 0.80 |
| 20 | Nono | 63.13 | 69.76 | 34.23 | 30.43 | 69.67 | 1.86 | 1645 | 3059.00 | 21,399.90 | 373.90 |
| 21 | Pacto | 64.11 | 69.88 | 35.48 | 28.48 | 74.08 | 1.86 | 4697 | 8736.49 | 34,734.10 | 216.30 |
| 22 | Perucho | 64.71 | 70.34 | 37.89 | 35.21 | 78.24 | 1.86 | 800 | 1488.81 | 973.40 | 37.40 |
| 23 | Pifo | 65.08 | 67.67 | 41.56 | 33.84 | 67.00 | 1.86 | 41,852 | 77,844.60 | 25,598.40 | 18.10 |
| 24 | Pintag | 63.21 | 67.73 | 37.37 | 31.31 | 70.03 | 1.86 | 34,552 | 64,266.69 | 48,859.90 | 41.00 |
| 25 | Pomasqui | 71.15 | 63.89 | 51.86 | 46.86 | 68.89 | 1.86 | 92,566 | 172,173.39 | 2324.70 | 0.80 |
| 26 | Puellaro | 64.37 | 69.01 | 38.58 | 33.33 | 74.41 | 1.86 | 4559 | 8479.92 | 7240.60 | 47.80 |
| 27 | Puembo | 65.73 | 68.71 | 44.71 | 39.71 | 73.80 | 1.86 | 26,373 | 49,054.27 | 3176.20 | 3.80 |
| 28 | San Antonio | 68.37 | 65.91 | 44.93 | 37.89 | 67.65 | 1.86 | 146,208 | 271,947.02 | 11,644.40 | 2.40 |
| 29 | San José de Minas | 62.79 | 71.13 | 36.11 | 28.70 | 73.98 | 1.86 | 6269 | 11,660.92 | 30,851.60 | 144.30 |
| 30 | Tababela | 66.18 | 67.57 | 42.94 | 39.20 | 73.68 | 1.86 | 9070 | 16,869.32 | 2533.70 | 8.70 |
| 31 | Tumbaco | 67.35 | 66.85 | 46.64 | 43.01 | 65.49 | 1.86 | 111,218 | 206,864.93 | 6567.00 | 1.80 |
| 32 | Yaruqui | 65.34 | 68.83 | 41.71 | 39.84 | 59.16 | 1.86 | 39,489 | 73,449.93 | 7225.20 | 5.40 |
| 33 | Zambiza | 66.57 | 63.53 | 44.76 | 38.98 | 73.58 | 1.86 | 11,128 | 20,698.79 | 766.40 | 2.10 |
Table 8.
Impacts of CIR on each parish 2022–2072.
Table 8.
Impacts of CIR on each parish 2022–2072.
| No. | Parish | CIR 2022 | CIR 2072 | Impact |
|---|
| 1 | Alangasi | 2.8 | 1.4 | - |
| 2 | Amaguania | 4.5 | 2.6 | - |
| 3 | Atahualpa | 134.7 | 130.1 | - |
| 4 | Calacali | 130.5 | 112.6 | - |
| 5 | Calderon | 0.9 | 0.3 | - |
| 6 | Conocoto | 1.2 | 0.5 | - |
| 7 | Cumbaya | 1.9 | 0.8 | - |
| 8 | Chavezpamba | 51.6 | 65.4 | + |
| 9 | Checa | 23.9 | 15.7 | - |
| 10 | El Quinche | 10.9 | 6.9 | - |
| 11 | Gualea | 186.2 | 215.0 | + |
| 12 | Guangopolo | 6.7 | 2.5 | - |
| 13 | Guayllabamba | 7.8 | 4.4 | - |
| 14 | La Merced | 7.2 | 2.2 | - |
| 15 | Llano Chico | 1.3 | 0.4 | - |
| 16 | Lloa | 995.3 | 909.7 | - |
| 17 | Nanegal | 269.7 | 253.9 | - |
| 18 | Nanegalito | 96.2 | 63.2 | - |
| 19 | Nayon | 2.1 | 0.8 | - |
| 20 | Nono | 360.4 | 373.9 | + |
| 21 | Pacto | 212.9 | 216.3 | + |
| 22 | Perucho | 37.8 | 37.4 | - |
| 23 | Pifo | 33.8 | 18.1 | - |
| 24 | Pintag | 64.0 | 41.0 | - |
| 25 | Pomasqui | 1.8 | 0.8 | - |
| 26 | Puellaro | 41.7 | 47.8 | + |
| 27 | Puembo | 5.9 | 3.8 | - |
| 28 | San Antonio | 6.7 | 2.4 | - |
| 29 | San José de Minas | 130.0 | 144.3 | + |
| 30 | Tababela | 20.7 | 8.7 | - |
| 31 | Tumbaco | 3.1 | 1.8 | - |
| 32 | Yaruquí | 9.2 | 5.4 | - |
| 33 | Zambiza | 4.3 | 2.1 | - |
| Disclaimer/Publisher’s Note: The statements, opinions and data contained in all publications are solely those of the individual author(s) and contributor(s) and not of MDPI and/or the editor(s). MDPI and/or the editor(s) disclaim responsibility for any injury to people or property resulting from any ideas, methods, instructions or products referred to in the content. |
© 2023 by the authors. Licensee MDPI, Basel, Switzerland. This article is an open access article distributed under the terms and conditions of the Creative Commons Attribution (CC BY) license (https://creativecommons.org/licenses/by/4.0/).


