Article

Analysis of the Evolution of Land-Use Types in the Qilian Mountains from 1980 to 2020

1
State Key Laboratory of Cryospheric Science, Northwest Institute of Eco-Environment and Resources, Chinese Academy of Sciences, Lanzhou 730000, China
2
The School of Resources and Environment, University of Chinese Academy of Sciences, Beijing 100049, China
*
Author to whom correspondence should be addressed.
Land 2023, 12(2), 287; https://doi.org/10.3390/land12020287
Submission received: 17 November 2022 / Revised: 11 January 2023 / Accepted: 16 January 2023 / Published: 19 January 2023

Abstract

:
The Qilian Mountains (QMs), located in the northeast part of the Qinghai–Tibetan Plateau in China, have a fragile ecological environment, complex and sensitive climate, and diverse land-cover types. It plays an important role in the “Qinghai–Tibetan Plateau Ecological Barrier” and “Northern Sand Control Belt” in China’s “two screens and three belts” ecological security strategy. Based on land use data of 1980, 1990, 1995, 2000, 2005, 2010, 2015, and 2020, we utilized GIS technology, land use dynamic degree, and land use transition matrixes to analyze the spatial and temporal evolution of land use in the QMs from 1980 to 2020. The results showed the following: (1) From 1980 to 2020, grassland, forest land, and unused land were the main land-use types in the QMs, and the proportion of construction land accounted for only 0.31% of all land-use types. (2) The single land use dynamic degree showed that the dynamic degree of construction land was the highest and the fastest change rate from 2010 to 2015. The comprehensive land use dynamic degree showed that the intensity of land-use change was relatively drastic in the three time periods of 1990–1995, 1995–2000, and 2015–2020. (3) The land-use types in the study area switched infrequently during 2000–2005, 2005–2010, and 2010–2015. (4) The main transition directions of land-use types were grassland and unused land to other land-use types. These changes altered the spatial distributions of different land-use types. The study is critical for understanding the spatial and temporal change patterns of land-use change in the QMs and providing guidance for the optimization of land use in the study area and the improvement of regional eco-environmental protection.

1. Introduction

Land is an important link between humans and nature [1,2,3], and it is the basis for human survival and development. In recent years, with the acceleration of global climate change, the increase in the frequency and expansion of the scope of human activities, such as the growing population and rapid urbanization, have led to great changes in land-use types [4,5,6]. Land use/cover change (LUCC) is an important component in the study of global climate and environmental changes [7,8,9] and has an important role in the Earth’s system [10]. It is also the most direct expression of the interaction between human activities and the natural environment [9] and can directly reflect the way to make use of land resources in a region [4,11]. LUCC is caused by land use, which is the result of a combination of multiple driving forces in the human–land relationship [5,12,13,14]. Human activities, such as overgrazing, deforestation, grassland reclamation, indiscriminate misuse of mineral resources and other irrational land use practices, have significantly altered the surface environment [15,16] impacting food production, freshwater resources, forest resources, regional climate, and air quality [7]; human-induced LUCC is the most direct human disturbance to terrestrial ecosystems [12,17,18].
LUCC is considered to be one of the most paramount environmental issues in the world [19,20]. The Land Use and Land Cover Change (LUCC) core research program were jointly launched in 1995 by the International Geosphere-Biosphere Program (IGBP) [21,22] of the International Council for Science (ICSU) and the International Human Dimensions Program (IHDP) [23] of the International Social Science Council (ISSC). Two programmatic documents, titled “the LUCC Research Program” [24] and “the LUCC Implementation Strategy” [25], were also published. LUCC has become one of the world’s research hot spots and is becoming a focus of attention for the public and management decision-makers [26,27,28,29]. It has also triggered a wave of research on LUCC by scholars at home and abroad [6,19,30].
The Qilian Mountains (QMs) rise along the northeastern rim of the Qinghai–Tibetan Plateau, in the northwestern arid zone of China, which is a climatically sensitive and ecologically fragile area in China [31]. With the increase in human activities, land-use types have changed accordingly in the QMs. Land-use change is an important factor reflecting the degree of human activities, and analyzing the spatial and temporal land-use-change pattern is an effective way to reveal the degree of human activities [32]. Previous studies on LUCC in the QMs have focused on the analysis of individual areas within the QMs, especially for the Qilian Mountains National Nature Reserve [33,34]. In addition, studies have also analyzed land-use change and its driving force on the southern slope of the QMs [35] and the Shiyang River Basin of the QMs [9]. Studies on the QMs as a whole region are lacking, and it is unable to reflect the overall LUCC characteristics of the QMs in a comprehensive manner. Therefore, based on the ArcGIS spatial analysis technology, this study analyzed the structural characteristics, spatial distribution patterns, change characteristics, change rates, and their transfer directions of land-use types in the QMs for a long time series from 1980 to 2020 by using a series of indicators of the comprehensive land use dynamic degree (CLUDD), the single land use dynamic degree (SLUDD) and land use transfer matrix to provide direction for the optimization of land-use patterns and regional eco-environmental conservation and improvement in the research area, as well as to better understand the patterns of spatial and temporal land-use changes in the QMs.

2. Materials and Methods
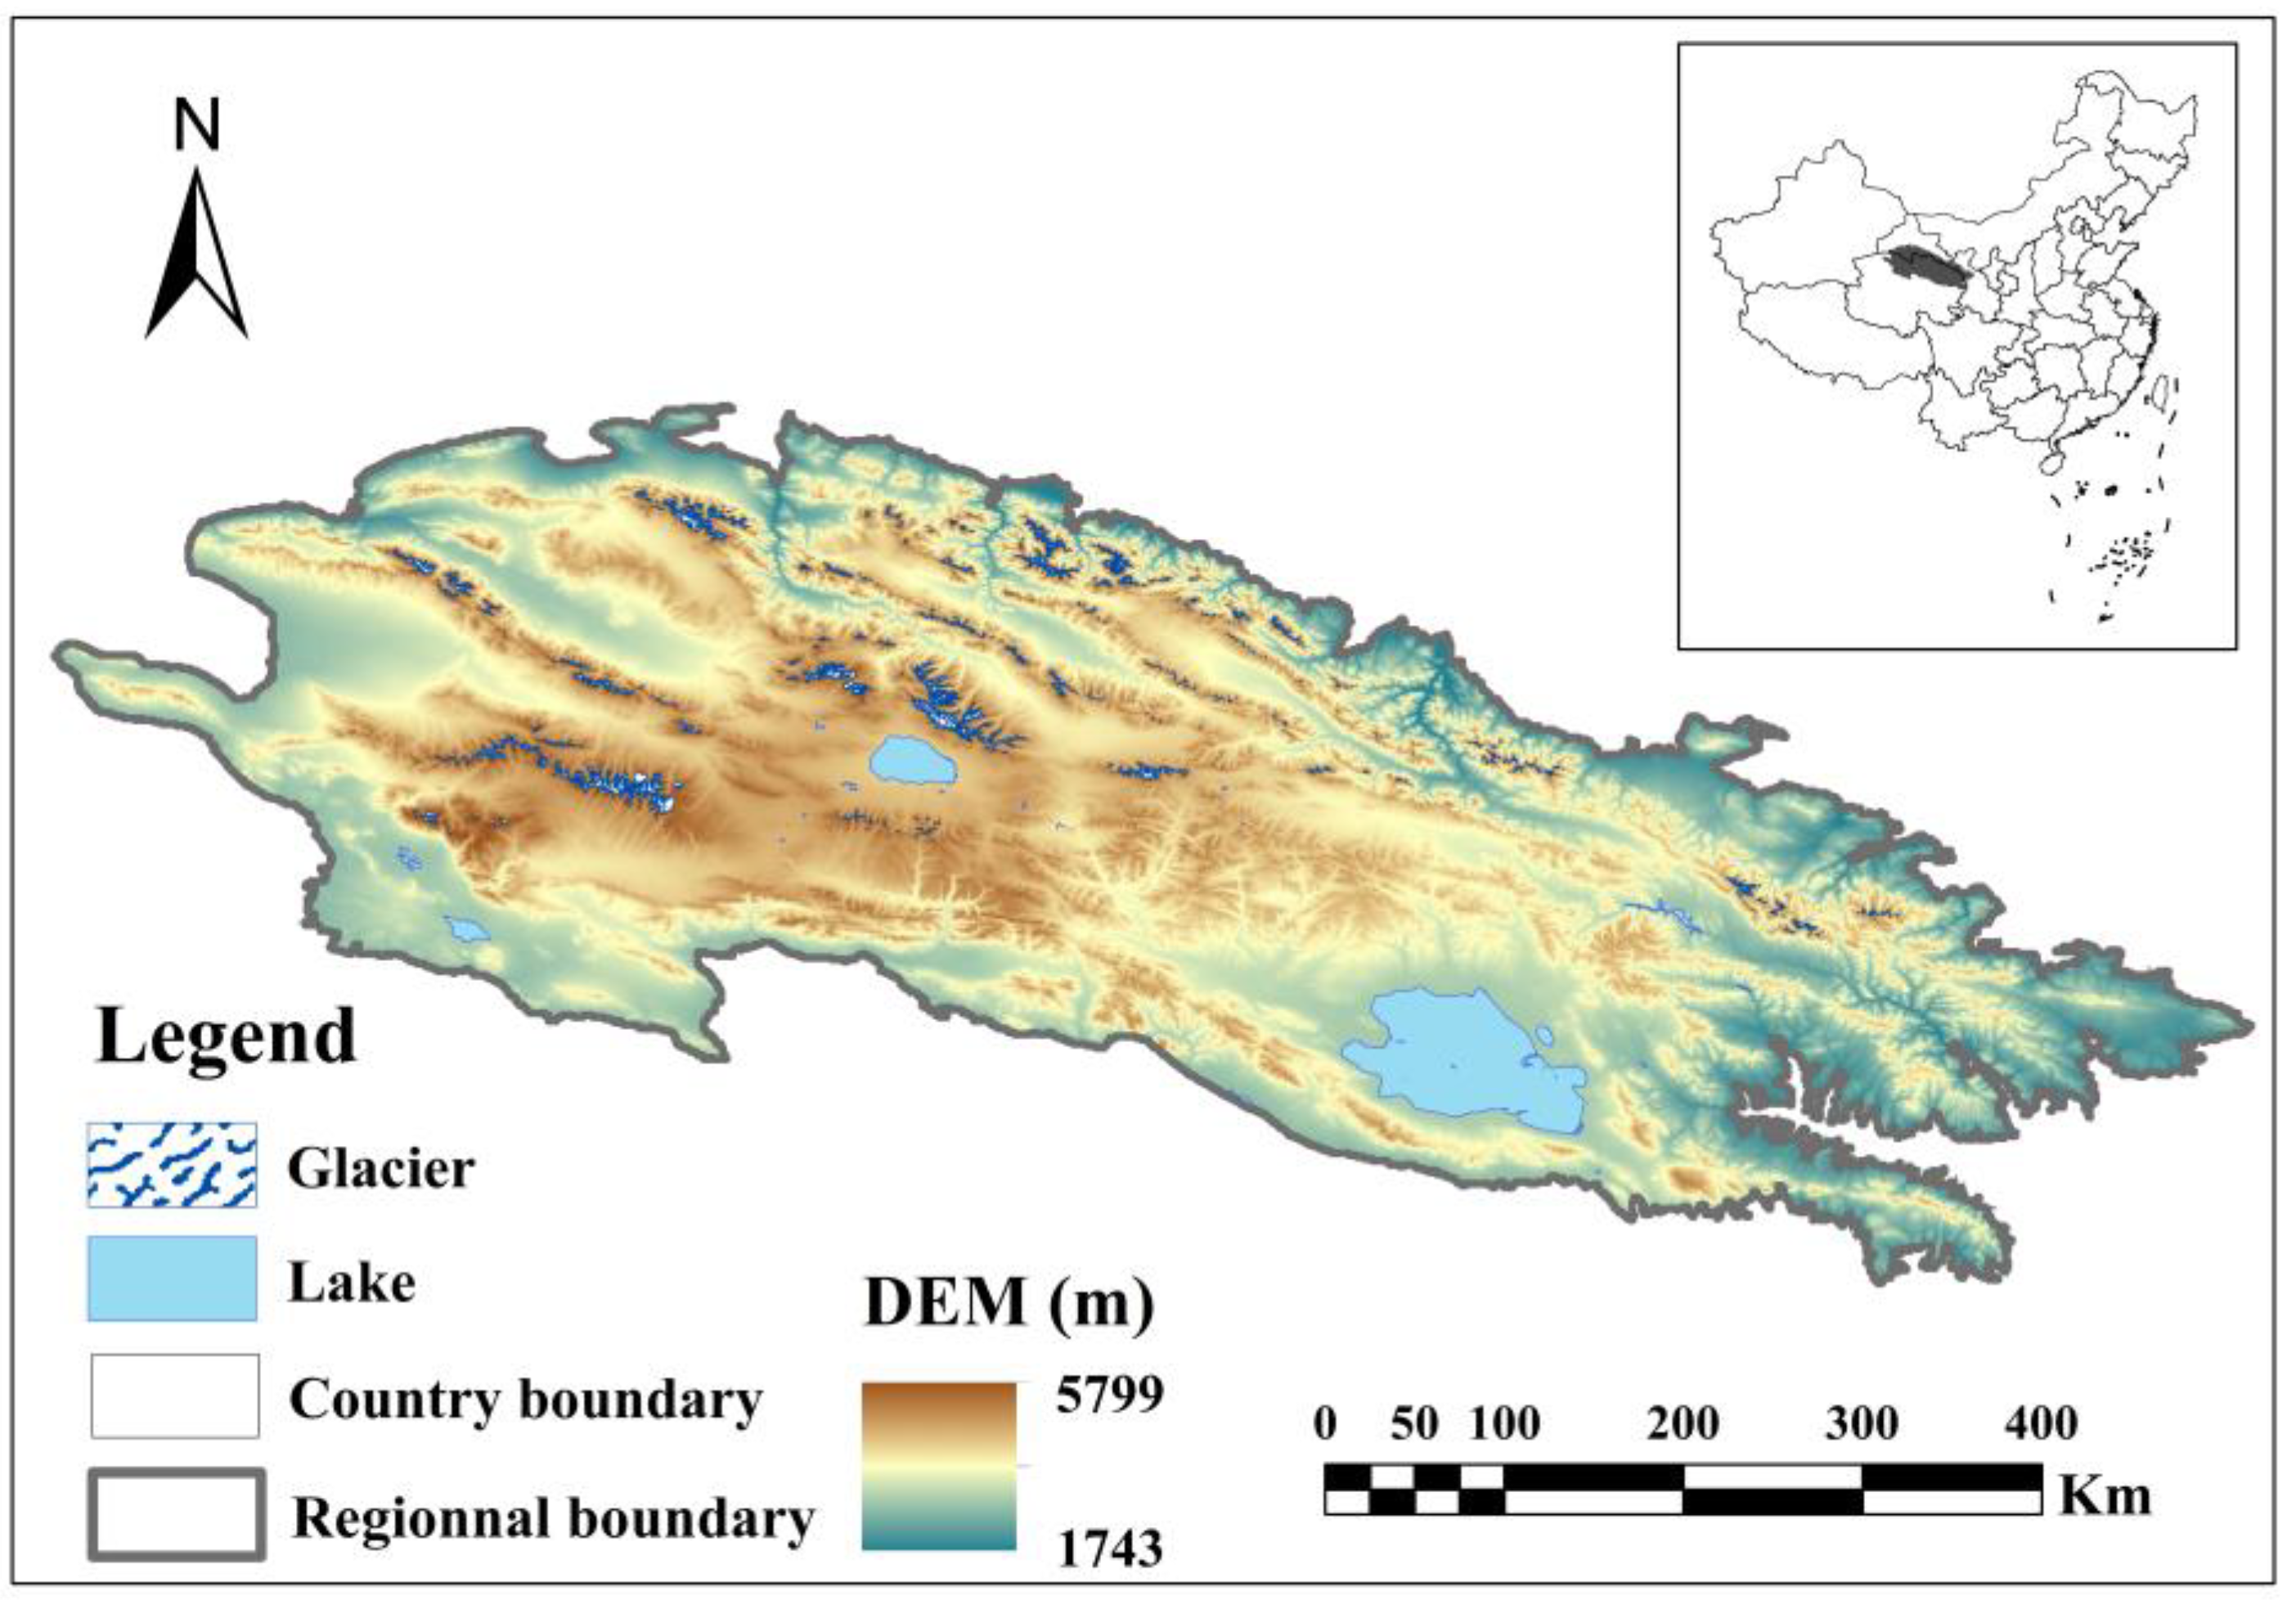
2.1. Study Area

The QMs (35~40° N, 93~104° E) is located on the northeastern edge of the Qinghai-Tibetan Plateau in China, which spans Gansu and Qinghai provinces. The length is about 1000 km from east to west, and it is about 300 km wide from north to south (Figure 1). It is made up of parallel mountains that are part of the northwest-to-southeast-oriented Qilian fold belt [36]. The mountain is higher in the northwest and lower in the southeast and the average elevation is 3523 m [37]. One-third of the mountain range is higher than 4000 m. The highest peak is Unity Peak at 5828.6 m [38]. The QMs belongs to a typical plateau continental climate [39], and the regional ecological environment is fragile, climatically complex, and sensitive. It is important to the “Qinghai–Tibet Plateau Ecological Barrier” and “Northern Sand Control Belt” in China’s “two screens and three belts” ecological security strategy [40]. The east is influenced by the southeast and southwest monsoons and has a relatively humid climate [37], the west is controlled by the westerly circulation [41], and the central part is at the intersection of the two circulation systems [42]. Different circulation systems cause regional differences in climate, especially precipitation [43], and the annual average precipitation in the region is about 301.9 mm; precipitation is mainly concentrated in May–September [44].

2.2. Data Sources and Processing

The LUCC data were obtained from the Resource and Environment Science Data Registration and Publication System. Led by the Institute of Geographic Sciences and Natural Resources Research, Chinese Academy of Sciences, in collaboration with the Institute of Remote Sensing Applications, the Northeast Institute of Geography and Agroecology, the Institute of Geodesy and Geophysics, the Xinjiang Institute of Ecology and Geography, the Northwest Institute of Eco-Environmental and Resources, the Institute of Mountain Hazards and Environment, and so on, jointly completed the “Multi-period Land Use Land Cover Change Monitoring Dataset in China” [45]. The spatial resolution of the data was 30 m and contains 11 periods: 1980, 1990, 1995, 2000, 2005, 2008, 2010, 2013, 2015, 2018, and 2020. The dataset is a 1:10 scale multi-period land use/cover thematic database of China built by using Landsat remote sensing images of the United States as the main information source, through pre-processing processes, such as band extraction, false color synthesis, geometric refinement, and sub-county image stitching, mosaic, and human–computer interactive visual interpretation. The remote sensing interpretation of the data is based on 1980 Landsat MSS remote sensing images, 1990, 1995, 2000, 2005, 2010 Landsat TM/ETM remote sensing images, and 2020 Landsat 8 remote sensing images, respectively. Landsat data is also often used as a data source in the production of other LUCC datasets. Landsat data are publicly available through USGS Earth Explorer (https://gisgeography.com/usgs-earth-explorer-download-free-landsat-imagery/, accessed on May 26, 2022). The data are classified using a two-level classification system, with the first level divided into 6 types, including arable land, forest land, grassland, waters, construction land, and unused land. The second level is further divided into 25 types based on the first level types [45]. The decoded classification dataset has been tested for accuracy and has been widely used in the study of spatial and temporal patterns related to land use cover [46], and the comprehensive evaluation accuracy of the primary type of land use in China reached more than 94.3%, and the comprehensive accuracy of the secondary-type classification reached more than 91.2% [47].
In this study, a total of eight periods of data from 1980, 1990, 1995, 2000, 2005, 2010, 2015, and 2020 were selected to process and analyze the QMs with ArcGIS. By using Raster to Polygon in the Conversion Tools, Extract by Mask and Reclassify in the Spatial Analyst Tools, Dissolve in the Data Management tools and Intersect in the Analysis tools under ArcToolbox. The land-use types number six class I types and 23 class II types in the QMs (Table 1) [45]. This is because the QMs is deeply inland and does not include paddy fields and oceans in this classification system. Additionally, Excel was employed in this study to calculate the dynamic attitude degree, and Origin was used for the cartographic analysis.

2.3. Research Methodology

The research methodology involved a land resource quantity change model (the single land use dynamic degree and the comprehensive land use dynamic degree) and a land use transfer matrix.

2.3.1. Dynamic Degree

The land use dynamic degree can be divided into single land use dynamic degree and comprehensive land use dynamic degree. The model can quantitatively describe the dynamic changes of land-use types, and then truly reflect the rate and extent of land-use type changes in the study area [48,49].
(1)
Single land use type dynamic degree.
The single land use type dynamic degree reflects the change in the quantity of a certain land-use type in a study area within a certain time frame [48]. The formula is as follows:
K = ( U b U a ) U a × ( 1 T ) × 100 %
In this formula, K is the dynamic degree of a certain land-use type during the study period, Ua is the number of land-use types at the beginning of the study period, Ub is the number of land-use types at the ending of the study period, T is the length of the study period, and K is the annual rate of change of a certain land-use type in the study area.
(2)
Comprehensive land use dynamic degree
The comprehensive land use dynamic degree reflects the overall degree of change in land-use types in the study area throughout the study period [49]. Its expression is [50]:
L C = [ i = 1 n Δ L U i j 2 i = 1 n L U i ] × 1 T × 100 %
In the formula, LUi is the area of class-i land use at the beginning of monitoring; ΔLUi-j is the absolute value of the area converted from type-i land use to non-type-i land use in the monitoring period; and T is the length of the study period. The value of LC is the annual rate of land-use change in the study area.

2.3.2. Transfer Matrix

The land-use type transfer matrix can comprehensively and specifically explain the quantitative structural characteristics of land-use type changes and the direction of each land type change in each region in any time period, as well as reflecting the interconversion relationship between each category [2,51,52]. Its mathematical expression is:
S i j = [ S 11   S 12     S 1 n S 21   S 22     S 2 n             S n 1   S n 2     S n n ]
In the formula, Sij is the area transformed from the i-th land type to the j-th land type during the study period; n is the total number of land types of land use in the study area; and i and j are the land-use types at the beginning and end of the study period, respectively.

3. Results and Analysis

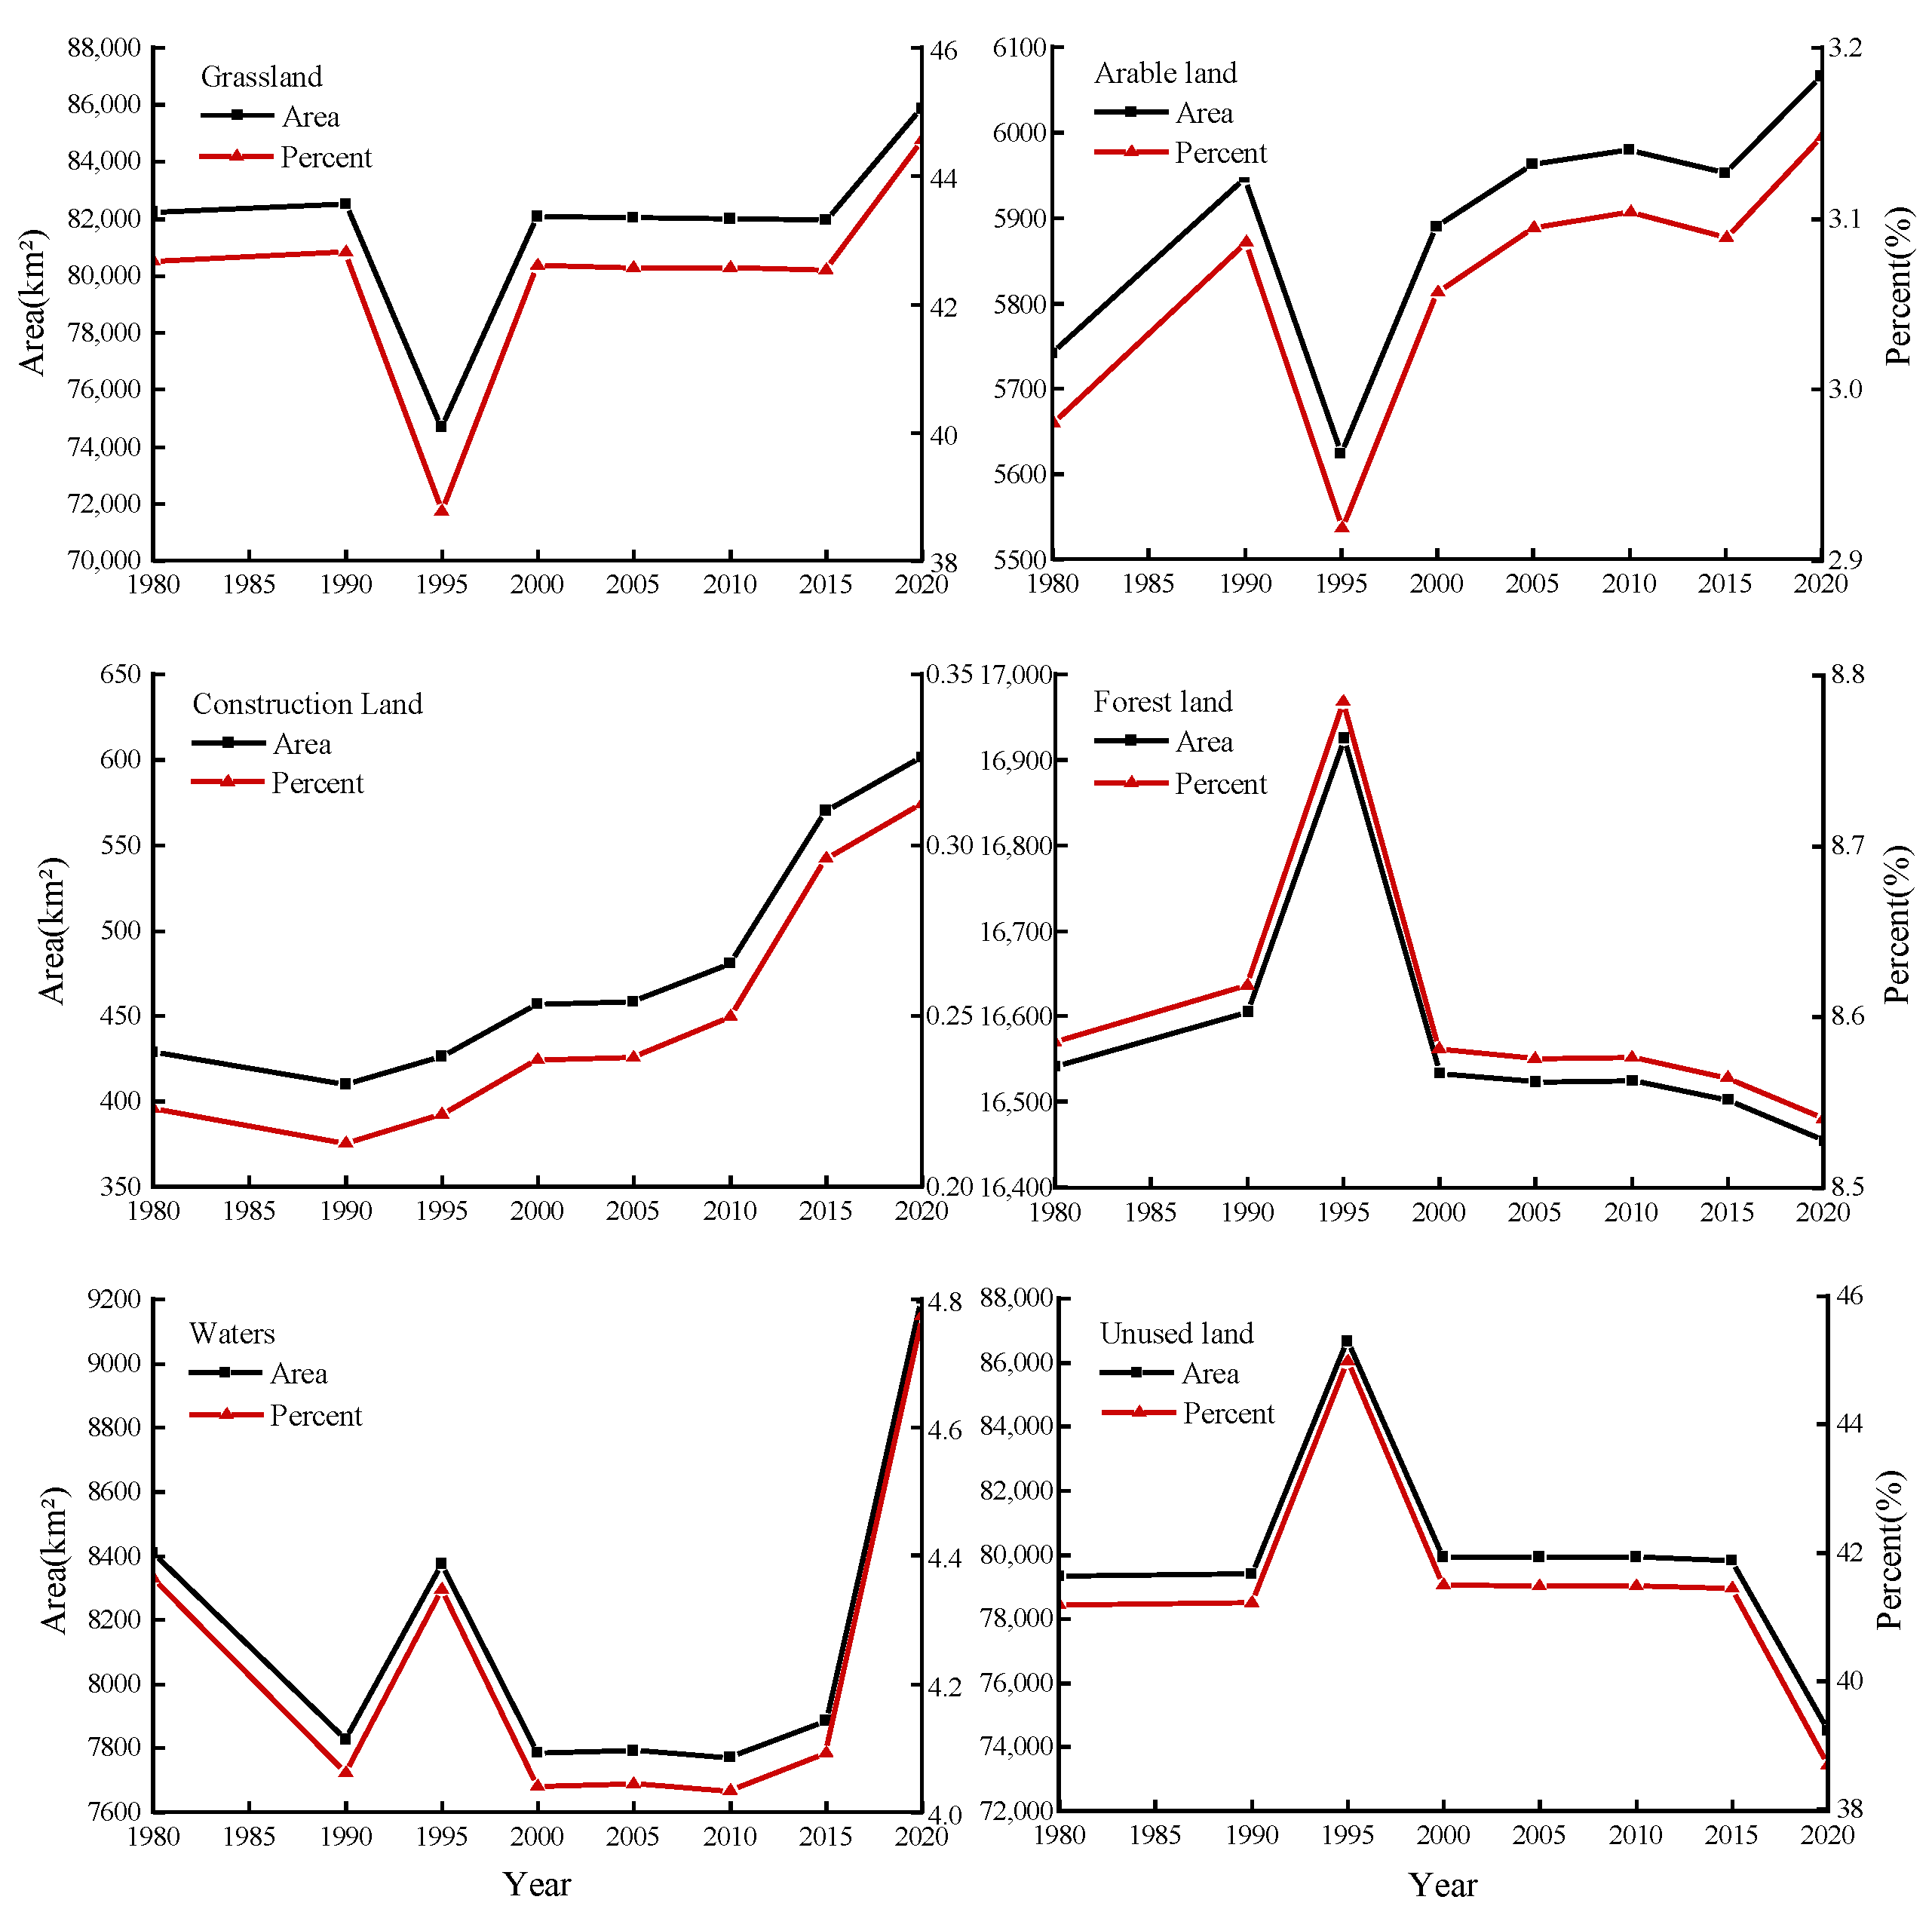
3.1. Land Use Structure Characteristics

The spatial patterns of the distribution of land-use types in the QMs in 1980, 1990, 1995, 2000, 2005, 2010, 2015, and 2020 are shown in Figure 2.
The top three land-use types in the study area from 1980 to 2020 were grassland, unused land, and forest land (Figure 3 and Figure 4). Table 2 shows the structural characteristics of land-use types in the QMs from 1980 to 2020. Compared with 1980, the dominant increase was grassland, by 3621 km2 by 2020, mainly located in the central-eastern part of the study area. The area of unused land decreased by 4820 km2, mainly in the central and western parts of the study area. Despite the decrease in the area of unused land, the area of unused land was still dominant in 2020, accounting for 38.67% of the total area of the QMs. The area of forest land decreased by 87 km2, mainly in the northeastern part of the study area. In addition, a small amount of arable land was distributed at the eastern boundary of the QMs, and the waters were dominated by Qinghai Lake and Hala Lake (Figure 2).
The changes in land use area in the QMs from 1980 to 2020 (Table 3) showed that the change in grassland area experienced an increase from 1980 to 1990, a decrease from 1990 to 1995, an increase from 1995 to 2000, and then a continuous decrease until the increase in grassland area from 2015 to 2020. Overall, the grassland increased the most during 1980–2020, at 3621 km2 (4.40% increase), followed by the waters increased with 790 km2 (9.39% increase); arable land and construction land increased with 324 km2 (5.64% increase) and 172 km2 (40.09% increase), respectively. Unused land and forest land decreased by 4820 km2 (6.08% decrease) and 87 km2 (0.53% decrease), respectively. The changes in each type of land use were 40.09% (construction land), 9.39% (waters), −6.08% (unused land), 5.64% (arable land), 4.40% (grassland), and −0.53% (forest land). It can be seen that among the increased land-use type areas, the largest increase was in construction land; among the decreased land-use type areas, the largest decrease was the unused land.
Figure 5 intuitively shows the rates of area change of land-use types in the QMs. It can be seen that during the period of 1980–1990, arable land increased the most (3.57%) and waters decreased the most (−6.94%); during the period of 1990–1995, unused land increased the most (9.12%) and grassland decreased the most (−9.47%); during the period of 1995–2000, grassland increased the most (9.92%) and unused land decreased the most (−7.76%); arable land increased the most (1.24%) and forest land decreased the most (−0.07%) between 2000 and 2005; construction land increased the most (5.02%) and waters decreased the most (−0.25%) between 2005 and 2010; between 2010 and 2015, the largest increase was in construction land (18.50%) and the largest decrease was in arable land (−0.47%); and between 2015 and 2020, the largest increase was in waters (16.68%) and the largest decrease was in unused land (−6.65%).

3.2. Land Use Dynamic Degree

In terms of the single land use dynamic degree (Table 4), different land-use types saw varying rates of change throughout the course of the 40-year period. In 1980–1990, the dynamic degrees of waters, construction land, and arable land in the study area changed faster; the rates of change of other land types were relatively slow. In 1990–1995 and 1995–2000, except for forest land, the rates of change of the dynamic degrees of grassland, arable land, construction land, waters, and unused land in the study area were faster than those in 1980–1990. In 2000–2005, 2005–2010, and 2010–2015, the rate of change of the dynamic degree of each land type in the study area was slower than the same in 1980–1990, but the dynamic degree of construction land showed an increasing trend. The rates of change of the dynamic degrees of land use in the study area from 2015 to 2020 increased, among which the dynamic degrees of waters, construction land, and grassland ranked in the top three. From the changes in each land-use type, reflected by the comprehensive land use dynamic degree (Table 4), the comprehensive land use dynamic degree of the study area in 1980–1990, 1990–1995, 1995–2000, 2000–2005, 2005–2010, 2010–2015, and 2015–2020 was 0.03%, 0.84%, 0.80%, 0.008%, 0.004%, 0.02%, and 0.56%, respectively.

3.3. Land Use Transfer Matrix

According to the land use transfer matrix of the QMs in 1980–1990, 1990–1995, and 1995–2000 (Table 5), it can be seen that all land-use types in the study area have undergone different degrees of interconversion.
From 1980 to 1990, 57,438 km2 of land-use types were transformed. Grassland was converted into other land-use types in the largest amount, 25,437 km2, of which 64.80% was converted into unused land (16,482 km2). 23.52% and 8.04% of grassland were converted into forest land and arable land, respectively. The conversion of unused land to other land-use types was the second largest, 18,916 km2, with 88.49% converted to grassland (16,739 km2). The final area of grassland increased by 263 km2 and the area of unused land increased by 72 km2. Overall, the area of grassland, arable land, forest land, and unused land increased, and the area of construction land and waters decreased in 1980–1990.
In 1990–1995, 62,270 km2 of land-use types were transformed, of which the area of construction land, forest land, waters, and unused land increased, and the area of grassland and arable land decreased. Compared with 1980–1990, the transfer of land-use types is still dominated by the interconversion of unused land and grassland. The area of grassland converted to other land-use types was 31,842 km2, of which 71.83% was converted to unused land, and the transferred area amounted to 22,872 km2. The area of unused land converted to other land-use types was 18,916 km2, and the largest transfer out was 16,739 km2 of grassland, with a contribution rate of 88.49%. The largest increase in the area of unused land ended up being 7247 km2. Grassland decreased the most with 7810 km2.
In 1995–2000, 56,130 km2 of land-use types were converted. Compared with the conversion of land-use types in 1980–1990 and 1990–1995, the interconversion of unused land and grassland is still dominant. The conversion of unused land to other land-use types was the largest, with 22,770 km2, and the largest conversions were 20,985 km2 of grassland (92.16%), 885 km2 of forest land (3.89%), and 827 km2 of waters (3.63%), respectively. The conversion of grassland to other land-use types was in the next largest area at 21,528 km2. Of this, 63.20% was converted to unused land at 13,606 km2, 24.23% to forest land, and 9.12% to grassland. The final area of grassland increased by 7405 km2 and the area of unused land decreased by 6721 km2. Overall, the area of grassland, arable land, and construction land increased, and the area of forest land, waters and unused land decreased from 1995 to 2000.
The land-use types in the study area were infrequently converted in 2000–2005, 2005–2010, and 2010–2015 (Table 6).
In 2000–2005, 135 km2 of land-use types were transformed. Grassland was converted into other land-use types in the largest amount, 89 km2, of which 94.38% was converted into arable land, 84 km2. There was a 62 km2 drop in grassland, a 73 km2 gain in arable land, a 1 km2 increase in construction land, an 11 km2 decrease in forest land, a 6 km2 increase in waters, and a 7 km2 loss in unused land. From 2005 to 2010, 167 km2 of land-use types were transformed. Grassland was converted into other land-use types in the largest amount, 65 km2, of which 53.85% was converted into arable land, 35 km2. There was an 18 km2 drop in grassland, a 17 km2 increase in arable land, a 23 km2 gain in construction land, a 1 km2 increase in forest land, a 20 km2 decrease in waters, and a 3 km2 decrease in unused land. From 2010 to 2015, the largest amount of unused land was converted to other land-use types at 151 km2, of which 58.28% was converted to waters at 88 km2. 31.13% and 10.60% of unused land were converted to grassland and construction land with 47 km2 and 16 km2 transferred out, respectively. Grassland was converted to other land-use types in the next largest area, 110 km2. Of these, 42.73% was converted to construction land with a transfer out area of 47 km2 and 37.27% was converted to waters with a transfer out area of 41 km2. The area of grassland dropped by 55 km2, the amount of arable land dropped by 28 km2, the area of construction land increased by 89 km2, the area of forest land dropped by 22 km2, the area of waters increased by 113 km2, and the area of unused land reduced by 97 km2. It can be seen that the areas of arable land, waters, and construction land increased, and the areas of unused land, forest land, and grassland decreased from 2000 to 2005. The areas of construction land, arable land, and forest land increased, and the areas of unused land, grassland, and waters decreased from 2005 to 2010. The areas of construction land and waters increased, and the areas of forest land, arable land, grassland, and unused land decreased from 2010 to 2015.
The conversion of each land-use type in the study area during 2015–2020 was as follows (Table 7).
In 2015–2020, 57,247 km2 of land-use types were converted. The largest area of grassland was converted to other land-use types with 23,528 km2. Of this amount, 61.60% was converted to unused land at 14,493 km2, 24.49% to forest land, and 8.70% to arable land, with 5763 km2 and 2046 km2 transferred out, respectively. The area of unused land converted to other land-use types was in the second place with 21,571 km2, and the largest transfer out was 18,621 km2 of grassland, 1841 km2 of waters, and 1015 km2 of forest land, with a contribution of 86.32%, 8.53%, and 4.71% respectively. The final area of grassland increased by 3898 km2, and the area of unused land decreased by 5311 km2. Overall, the area of grassland, arable land, construction land, and waters increased, and the area of forest land and unused land decreased from 2015 to 2020.
Overall, the conversion of each land use type in the study area during the period 1980–2020 was as follows (Table 8).
(1)
Grassland
From 1980 to 2020, 58,451 km2 of grassland remained unchanged, and 27,388 km2 was converted from other land-use types to grassland, of which 18,489 km2 of unused land, 5948 km2 of forest land, and 1936 km2 of arable land made the largest contributions, accounting for 67.51%, 21.72%, and 7.07%, respectively. The area of grassland converted to other land-use types was 23,767 km2, and the largest amount was transferred from unused land, with an area of 14,481 km2 and a contribution of 60.93%, followed by forest land and arable land, with an area of 5774 km2 and 2241 km2, contributing 24.29% and 9.43%, respectively. The final grassland area increased by 3621 km2.
(2)
Arable land
From 1980 to 2020, 3185 km2 of arable land remained unchanged, and the area converted from other land-use types to arable land was 2880 km2, of which 2241 km2 of grassland made the largest contribution, accounting for 77.81%. The area of arable land converted to other land-use types was 2556 km2, and the largest transfer was from grassland at 1936 km2, with a contribution of 75.74%. The final arable land area increased by 324 km2.
(3)
Construction land
From 1980 to 2020, 78 km2 of construction land remained unchanged, and 523 km2 was converted from other land-use types to construction land, of which 254 km2 of grassland was the main amount transferred in, accounting for 48.57%, followed by 193 km2 of arable land, accounting for 36.90%. The area of construction land converted to other land-use types was 351 km2, with 174 km2 of arable land and 141 km2 of grassland being the main amounts transferred out, with contributions of 49.57% and 40.17%, respectively. The final construction land area increased by 172 km2.
(4)
Forest land
From 1980 to 2020, 9171 km2 of forest land remained unchanged and 7283 km2 was converted from other land-use types to forest land, of which 5774 km2 of grassland and 1014 km2 of unused land made the largest contributions, accounting for 79.28% and 13.92%, respectively. The area of forest land converted to other land-use types was 7370 km2, with the largest transfer being 5948 km2 of grassland and 872 km2 of unused land, with contributions of 80.71% and 11.83%, respectively. The final forest land area decreased by 87 km2.
(5)
Waters
From 1980 to 2020, 6127 km2 of waters remained unchanged, and the area converted from other land-use types to waters was 3072 km2, of which 1813 km2 of unused land and 1017 km2 of grassland made the largest contributions, accounting for 59.02% and 33.11%, respectively. The area of waters converted to other land-use types was 2282 km2, with the largest transfer out of 1187 km2 of unused land and 874 km2 of grassland, with contributions of 52.02% and 38.30%, respectively. The final waters area increased by 790 km2.
(6)
Unused land
From 1980 to 2020, there was 57,913 km2 of unused land without change, and the area converted from other land-use types to unused land was 16,591 km2, among which 14,481 km2 of grassland, 1187 km2 of waters, and 872 km2 of forest land made the largest contributions, accounting for 87.28%, 7.15%, and 5.26% respectively. The area of unused land converted to other land-use types was 21,411 km2, with the largest transfer out of 18,489 km2 of grassland, 1813 km2 of waters, and 1014 km2 of forest land, with contributions of 86.35%, 8.47%, and 4.74% respectively. The final unused land area decreased by 4820 km2.
It can be seen that the area of grassland, arable land, construction land, and waters increased, and the area of forest land and unused land decreased from 1980 to 2020.

4. Discussion and Conclusions

4.1. Discussion

It is a more scientific means to conduce the comprehensive analysis of the structural characteristics of land use, dynamic degree and transfer matrix in the QMs combined with spatial information to reflect the response of human activities to land use change. From 1980 to 2020, various land-use types in the study area changed to different degrees (Table 9). The area of the QMs LUCC changed dramatically before 2000, and the change from 2000 to 2015 was small. In 2000–2015, the area of arable land decreased, the area of grassland and forest land decreased significantly compared with that before 2000, which may be related to the implementation of the “Returning Cultivated Land to Forests and Grasses Project” in 1999. From 2015 to 2020, the area of grassland increased significantly, and the areas of arable land and forest land changed slightly, which may be related to the “14th Five-Year Plan” for Ecological Protection.
From the structural characteristics of land use, the proportions of grassland, unused land, and forest land in the QMs are large; the proportions of arable land and construction land are small, especially the proportion of construction land, which may be related to the sparse population and slow economic development in the QMs. The increases in construction land and arable land and the decreases in unused land and forest land between 1980 and 2020 show that human activities have affected the ecological environment of the region during the study period. On the one hand, the increases in construction land and arable land and the decreases in unused land are closely related to the rapid development and construction of the QMs and economic development [53], which have a positive impact on the economy of the region, but the decrease in forest land will have a negative impact on the ecological and environmental security of the region. Moreover, the ecological environment in the QMs is sensitive and fragile, and slight changes in land use can have a significant impact on the region. Unreasonable development and utilization could lead to serious deterioration of the ecological environment in the QMs [54]. For example, there will be a significant impact on the physical and chemical properties of the soil: unreasonable land use can cause damage to the soil ecosystem and make it difficult to recover under natural conditions [55].
In terms of land use dynamic degree, land use dynamic degree can intuitively reflect the magnitude of change and rate of a certain LUCC [56] and is a scientific tool to reveal the response of land-use change to human activities [57]. The single land use dynamic degree showed that the share of the construction land area was the smallest, but the dynamic degree was the largest, at 3.70%, indicating that the construction land was disturbed by human activities with the greatest intensity from 2010 to 2015. The comprehensive land use dynamic degree showed that the intensity of overall land-use change in the study’s time period was not significant, except for the time periods 1990–1995 (0.84%), 1995–2000 (0.80%), and 2015–2020 (0.56%), where the intensity of overall land-use change was relatively drastic, i.e., the degree of human activities influence on land use is weak. Land transfer is infrequent, and the intensity of land-use change is relatively stable.
From the land use transfer matrix, the conversion of various land-use types in the study area was infrequent during 2000–2005, 2005–2010, and 2010–2015. Overall, from 1980 to 2020, the largest increase in construction land, greater human activity was responsible for the 40.09% growth in construction land. The area of unused land decreased the most, at 4820 km2, and was mostly converted to grassland, waters, and forest land; the area of grassland increased the most, 3621 km2; and unused land, forest land, and arable land contributed most to the growth of grassland. The direct conversion of grassland and unused land to other land-use types was the main reason for the changes in spatial distribution for different land-use types.
The innovation of this study is that previous studies on LUCC in the northwest region have mostly focused on the Qinghai–Tibetan Plateau or small watersheds in the QMs, and the knowledge of LUCC in the QMs as a whole region is insufficient. And the time series of previous studies are short, which makes it difficult to analyze the long time series. However, this study focuses on the QMs, which are not widely noticed but ecologically fragile, and uses data from up to 40 years and 8 periods for analysis as well as discussing the driving forces of LUCC in the QMs from a qualitative perspective, which can better complement basic research. However, there are still some shortcomings. Firstly, in terms of research methods, this paper mainly adopts classical research methods, and some innovative research methods to study LUCC in the QMs could be considered in the future. Secondly, in terms of spatio-temporal analysis, this paper mainly focuses on the temporal analysis and spatial distribution of LUCC in the QMs. More detailed regionalization of the LUCC characteristics in the QMs could be analyzed according to different geographical units. Finally, the analysis of driving forces of LUCC in the QMs is discussed mainly from a qualitative perspective in this paper, but the quantitative results are more convincing and will be supplemented in the subsequent studies.
Based on the findings of the study and combined with the actual situation of the region, it is suggested that in the process of future land use and management, while ensuring regional economic development, the relationship between economic development and land use should also be managed in terms of the main drivers of changes in various land-use types so as to ensure the rational development and utilization of land resources.

4.2. Conclusions

(1)
From 1980 to 2020, grassland, forest land, and unused land were the mainstay of land use in the QMs, construction land accounted for the smallest proportion. Grassland was mainly distributed in the central-eastern part of the study area, unused land in the central-western part of the study area, and forest land in the northeastern part of the study area. A small amount of arable land was distributed at the eastern boundary of the QMs, and the waters were dominated by Qinghai Lake and Hala Lake.
(2)
The single land use dynamic degree showed that the dynamic degree of construction land was the highest and the fastest change rate from 2010 to 2015, at 3.70%, followed by the dynamic degree of waters from 2015 to 2020, at 3.34%. The comprehensive land use dynamic degree showed that the intensity of the overall land use change is relatively drastic in the three time periods 1990–1995 (0.84%), 1995–2000 (0.80%), and 2015–2020 (0.56%).
(3)
The land use transfer matrix showed that the land-use types in the QMs shifted infrequently during 2000–2005, 2005–2010, and 2010–2015.
(4)
The interconversion of grassland and unused land and direct conversion with other land-use types were the main reasons for the changes in the spatial distribution of different land-use types.
(5)
The area of grassland (4.40%), arable land (5.64%), construction land (40.09%), and waters (9.39%) increased, and the area of forest land (−0.53%) and unused land (−6.08%) decreased from 1980 to 2020.

Author Contributions

Conceptualization and methodology, M.Y. and M.W.; data resources and curation, M.W.; analysis, M.Y., M.W.; writing—original draft preparation, M.W.; writing—review and editing, M.Y.; funding acquisition, M.Y. All authors have read and agreed to the published version of the manuscript.

Funding

This research was supported by the National Natural Science Foundation of China (Grant Nos. U21A2006 and 41771068).

Institutional Review Board Statement

Not applicable.

Informed Consent Statement

Not applicable.

Data Availability Statement

The data presented in this study are available upon request from the corresponding author.

Acknowledgments

The authors would like to thank the Data Center for Resources and Environmental Sciences, Chinese Academy of Sciences (RESDS, http://www.resdc.cn, accessed on 16 November 2022) and Xu, X.L. for providing the land use dataset.

Conflicts of Interest

The authors declare no conflict of interest.

References

  1. Ellis, E.C. Sharing the land between nature and people. Science 2019, 364, 1226–1228. [Google Scholar] [CrossRef] [Green Version]
  2. Zhu, X.Y.; Wang, Z.M.; Xu, D.W.; Shen, B.B.; Ding, L.; Shao, C.L.; Wang, X.; Chen, B.R.; Xin, X.P. Analysis of land use change and driving forces in ecological functional area of hulunber grassland. Chin. J. Agri. Res. Reg. Plan. 2020, 41, 74–82. [Google Scholar]
  3. Xu, L.T. Natural Factors of Land Use Change in Wujiang River Basin. J. Soil Water Conserv. 2022, 29, 319–326. [Google Scholar]
  4. Hu, X.Q.; Jin, Y.Z.; Ji, L.H.; Zeng, J.J.; Cui, Y.Q.; Song, Z.F.; Sun, D.Y.; Cheng, Y.F. Land use/cover change and ITS eco-environment effect in Shiyang River Basin. IOP Conf. Ser. Earth Environ. Sci. 2018, 191, 012016. [Google Scholar] [CrossRef]
  5. IPCC, Summary for Policymakers-Special Report on Climate Change and Land. Available online: https://ipcc.ch/srccl/chapter/summary-for-policymakers/ (accessed on 16 November 2022).
  6. Zalles, V.; Hansen, M.C.; Potapov, P.V.; Parker, D.; Stehman, S.V.; Pickens, A.H.; Parente, L.L.; Ferreira, L.G.; Song, X.P.; Serna, A.H.; et al. Rapid expansion of human impact on natural land in South America since 1985. Sci. Adv. 2021, 7, eabg1620. [Google Scholar] [CrossRef] [PubMed]
  7. Foley, J.A.; Defries, R.; Asner, G.P.; Barford, C.; Bonan, G.; Carpenter, S.R.; Stuart, C.F.; Coe, M.T.; Daily, G.C.; Gibbs, H.K.; et al. Global consequences of land use. Science 2005, 309, 570–574. [Google Scholar] [CrossRef] [Green Version]
  8. Lawler, J.J.; Lewis, D.J.; Nelson, E.; Plantinga, A.J.; Polasky, S.; Withey, J.C.; Helmers, D.P.; Martinuzzi, S.; Pennington, D.; Radeloff, V.C. Projected land-use change impacts on ecosystem services in the United States. Proc. Natl. Acad. Sci. USA 2014, 111, 7492–7497. [Google Scholar] [CrossRef] [Green Version]
  9. Jiang, Y.Y.; Han, T.; Wang, D.W. Analysis of land cover change in Shiyang River Basin of Qilian Mountains. Proc. SPIE 2019, 11432, 15–22. [Google Scholar]
  10. Sterling, S.M.; Ducharne, A.; Polcher, J. The impact of global land-cover change on the terrestrial water cycle. Nat. Clim. Chang. 2012, 3, 385–390. [Google Scholar] [CrossRef]
  11. Halmy, M.W.A.; Gessler, P.E.; Hicke, J.A.; Salem, B.B. Land use/land cover change detection and prediction in the north-western coastal desert of Egypt using Markov-CA. Appl. Geogr. 2015, 63, 101–112. [Google Scholar] [CrossRef]
  12. Vitousek, P.M.; Mooney, H.A.; Lubchenco, J.; Melillo, J.M. Human domination of Earth’s ecosystems. Science 1997, 277, 494–499. [Google Scholar] [CrossRef] [Green Version]
  13. Cai, Y.L. A study on land use/cover change: The need for a new integrated approach. Geo. Res. 2001, 20, 645–652. [Google Scholar]
  14. Meyfroidt, P.; Lambin, E.F.; Erb, K.H.; Hertel, T.W. Globalization of land use: Distant drivers of land change and geographic displacement of land use. Curr. Opin. Environ. Sust. 2013, 5, 438–444. [Google Scholar] [CrossRef]
  15. Li, A.N.; Deng, W.; Zhao, W. Land Cover Change and Its Eco-Environmental Responses in Nepal; Springer: Singapore, 2017; pp. 1–465. [Google Scholar]
  16. Li, S.C.; Zhang, X.Z. Land use-based human activity intensity along the Yangtze River Economic Belt, China (1970s–2015). Chin. Sci. Data 2018, 3, 1–13. [Google Scholar]
  17. Song, X.P.; Hansen, M.C.; Stehman, S.V.; Potapov, P.V.; Tyukavina, A.; Vermote, E.F.; Townshend, J.R. Global land change from 1982 to 2016. Nature 2018, 560, 639–643. [Google Scholar] [CrossRef] [PubMed]
  18. Li, S.C.; Su, S.; Liu, Y.X.; Zhou, X.W.; Luo, Q.X.; Paudel, B. Effectiveness of the Qilian Mountain Nature Reserve of China in Reducing Human Impacts. Land 2022, 11, 1071. [Google Scholar] [CrossRef]
  19. Veldkamp, A.; Lambin, E.F. Predicting land-use change. Agric. Ecosyst. Environ. 2001, 85, 1–6. [Google Scholar] [CrossRef]
  20. Guan, D.J.; Li, H.F.; Inohae, T.; Su, W.C.; Nagaie, T.; Hokao, K. Modeling urban land use change by the integration of cellular automaton and Markov model. Ecol. Modell. 2011, 222, 3761–3772. [Google Scholar] [CrossRef]
  21. Leemans, R.; Asrar, G.; Busalacchi, A.; Canadell, J.; Ingram, J.; Larigauderie, A.; Mooney, H.; Nobre, C.; Patwardhan, A.; Rice, M.; et al. Developing a common strategy for integrative global change research and outreach: The Earth System Science Partnership (ESSP). Curr. Opin. Environ. Sust. 2009, 1, 4–13. [Google Scholar] [CrossRef]
  22. Mauser, W.; Klepper, G.; Rice, M.; Schmalzbauer, B.S.; Hackmann, H.; Leemans, R.; Moore, H. Transdisciplinary global change research: The co-creation of knowledge for sustainability. Curr. Opin. Environ. Sust. 2013, 5, 420–431. [Google Scholar] [CrossRef] [Green Version]
  23. Jäger, J. The International Human Dimensions Programme on global environmental change (IHDP). Global. Environ. Chang. 2003, 13, 69–73. [Google Scholar] [CrossRef]
  24. Turner, B.L.; Skole, D.L.; Sanderson, S.; Fischer, G.; Fresco, L.; Leemans, R. Land-Use and Land-Cover Change: Science/research plan. Glob. Chang. Rep. 1995, 43, 669–679. [Google Scholar]
  25. Scientific Steering Committee and International Project Office of LUCC. Land-Use and Land-Cover Change (LUCC): Implementation Strategy; UNT Digital library: Stockholm, Sweden, 1999. [Google Scholar]
  26. Nel, V. Can the South African Land use management system be an effective tool in creating lower carbon cities? In Proceedings of the 45th ISOCARP Congress, Porto, Portugal, 18–22 October 2009. [Google Scholar]
  27. Cheng, L.; Brown, G.; Liu, Y.; Searle, G. An evaluation of contemporary China’s land use policy—The Link Policy: A case study from Ezhou, Hubei Province. Land Use Policy 2020, 91, 104423. [Google Scholar] [CrossRef]
  28. Franco, L.; Magalhães, M.R. Assessing the ecological suitability of land-use change. Lessons learned from a rural marginal area in southeast Portugal. Land Use Policy 2022, 122, 106381. [Google Scholar] [CrossRef]
  29. Lidzhegu, Z.; Kabanda, T. Declining land for subsistence and small-scale farming in South Africa: A case study of Thulamela local municipality. Land Use Policy 2022, 119, 106170. [Google Scholar] [CrossRef]
  30. Liu, J.Y.; Liu, M.L.; Zhuang, D.F.; Zhang, Z.X.; Deng, X.Z. Study on spatial pattern of land-use change in China during 1995–2000. Sci. China Ser. D. Earth Sci. 2003, 46, 373–384. [Google Scholar]
  31. Zhang, Q.; Zhang, J.; Sun, G.W.; Di, X.H. Research on atmospheric water-vapor distribution over Qilianshan Mountains. Acta Meteorol. Sin. 2007, 65, 633–643. [Google Scholar]
  32. Wu, L.N.; Yang, S.T.; Liu, X.Y.; Lou, Y.; Zhou, X.; Zhao, H.G. Response analysis of land use change to the degree of human activities in Beiluo River basin since 1976. Acta Geogr. Sin. 2014, 69, 54–63. [Google Scholar]
  33. Xiao, Y.F.; Chen, W.Y.; Wang, B.J.; Tan, Y.R.; Bing, D.H.; Zhu, L.; Liu, H.Y. Study On Temporal and Spatial Change of Land Use and Its Relationship with Climate Factors in Qilian Mountain National Nature Reserve. Acta Agrestia sin. 2021, 29, 2049–2057. [Google Scholar]
  34. Qian, D.W.; Cao, G.M.; Du, Y.G.; Li, Q.; Guo, X.W. Impacts of climate change and human factors on land cover change in inland mountain protected areas: A case study of the Qilian Mountain National Nature Reserve in China. Environ. Monit. Assess. 2019, 191, 486. [Google Scholar] [CrossRef]
  35. Fu, J.X.; Cao, G.C.; Guo, W.J. Land use change and its driving force on the southern slope of Qilian Mountains from 1980 to 2018. Chin. J. Appl. Ecol. 2020, 31, 2699–2709. [Google Scholar]
  36. Li, Z.X.; Feng, Q.; Li, Z.J.; Wang, X.F.; Gui, J.; Zhang, B.J.; Li, Y.C.; Deng, X.H.; Xue, J.; Gao, W.D.; et al. Reversing conflict between humans and the environment—The experience in the Qilian Mountains. Renew. Sustain. Energy Rev. 2021, 148, 111333. [Google Scholar]
  37. Li, C.; Zou, Y.; He, J.F.; Zhang, W.; Gao, L.L.; Zhuang, D.F. Response of Vegetation Phenology to the Interaction of Temperature and Precipitation Changes in Qilian Mountains. Remote Sens. 2022, 14, 1248. [Google Scholar] [CrossRef]
  38. Jia, W.X.; Li, Z.X. Hydrochemical Characteristics and Sources of Ions in Precipitation at the East Qilian Mountains. Environ. Sci. 2016, 37, 3322–3332. [Google Scholar]
  39. Wang, Y.H.; Li, D.H.; Lu, G.Y.; Jiang, Y.Y.; Huang, P.C. Characteristics of climate change and its impacts on water resources in Qilian Mountains, China. Chin. J. Appl. Ecol. 2022, 33, 2805–2812. [Google Scholar]
  40. Li, X.; Gou, X.H.; Wang, N.L.; Sheng, Y.; Jin, H.J.; Qi, Y.; Song, X.Y.; Hou, F.J.; Li, Y.; Zhao, C.M.; et al. Tightening ecological management facilitates green development in the Qilian Mountains. Chin. Sci. Bull. 2019, 64, 2928–2937. [Google Scholar]
  41. Liu, H.B.; Li, Y.; Zhang, X.Z.; Xu, L.M. Climate differences in different time scales in the east and west sections of the Qilian Mountains. J. Lanchow Univ. Nat. Sci. 2020, 56, 724–732. [Google Scholar]
  42. Song, L.L.; Tian, Q.; Li, Z.J.; Lv, Y.M.; Gui, J.; Zhang, B.J.; Cui, Q. Changes in characteristics of climate extremes from 1961 to 2017 in Qilian Mountain area, northwestern China. Environ. Earth Sci. 2022, 81, 177. [Google Scholar] [CrossRef]
  43. Jia, W.X.; He, Y.Q.; Li, Z.X.; Pang, H.X.; Yuan, L.L.; Ning, B.Y.; Song, B.; Zhang, N.N. Regional Characteristics of Climatic Change Trend and Break During Last 50 Years in Hexi Corridor. Sci. Geogr. Sin. 2008, 28, 525–531. [Google Scholar]
  44. Wang, L.; Chen, R.S.; Han, C.T.; Wang, X.Q.; Liu, G.H.; Song, Y.X.; Yang, Y.; Liu, J.F.; Liu, Z.W.; Liu, X.J.; et al. Change characteristics of precipitation and temperature in the Qilian Mountains and Hexi Oasis, Northwestern China. Environ. Earth Sci. 2019, 78, 789–802. [Google Scholar] [CrossRef]
  45. Xu, X.L.; Liu, J.Y.; Zhang, S.W.; Li, R.D.; Yan, C.Z.; Wu, S.X. Multi-Period Land Use Land Cover Remote Sensing Monitoring Dataset in China (CNLUCC). Resource and Environmental Science Data Registration and Publication System. Available online: http://www.resdc.cn/DOI (accessed on 16 November 2022).
  46. Liu, J.Y.; Ning, J.; Kuang, W.H.; Xu, X.L.; Zhang, S.W.; Yan, C.Z.; Li, R.D.; Wu, S.X.; Hu, Y.F.; Du, G.M.; et al. Spatio-temporal patterns and characteristics of land-use change in China during 2010–2015. Acta Geogr. Sin. 2018, 73, 54–63. [Google Scholar]
  47. Xu, X.L.; Liu, J.Y.; Zhang, Z.X.; Zhou, W.C.; Zhang, S.W.; Li, R.D.; Yan, C.Z.; Wu, S.X.; Shi, X.Z. A Time Series Land Ecosystem Classification Dataset of China in Five-Year Increments (1990–2010). J. Glob. Chang. Data Discov. 2017, 1, 52–59. [Google Scholar]
  48. Wang, X.L.; Bao, Y.H. Study on the methods of land use dynamic change research. Prog. Geogr. 1999, 18, 83–89. [Google Scholar]
  49. Wei, J.H.; Wen, Y.L.; Gong, Z.J.; Wang, X.L.; Cai, Y.J. Land use changes and ecosystem service value in the buffer zone of Poyang Lake in recent 30 years. Acta Ecol. Sin. 2022, 42, 1–13. [Google Scholar]
  50. Chen, S.P. Remote Sensing Information Mechanism Research; Science Press: Beijing, China, 1998; pp. 1–415. [Google Scholar]
  51. Xu, L.; Zhao, Y. Forecast of land use pattern change in Dongling District of Shenyang: An application of Markov process. Chin. J. Appl. Ecol. 1993, 4, 272–277. [Google Scholar]
  52. Zhu, H.Y.; Li, X.B. Discussion on the index method of regional land use change. Acta Geogr. Sin. 2003, 58, 643–650. [Google Scholar]
  53. Xue, X.Y.; Wang, X.Y.; Duan, H.M.; Yang, L.; Xie, Y.W. Analysis on Spatio-temporal Evolution of Habitat Quality in Qilian Mountains Based on Land Use Change. Bull. Soil Water Conserv. 2020, 40, 278–284. [Google Scholar]
  54. Liu, J.R.; Zhao, J.; Shen, S.M.; Zhao, Y.J. Ecological vulnerability assessment of Qilian Mountains region based on SRP conceptual model. Arid Land Geogr. 2020, 43, 1573–1582. [Google Scholar]
  55. Zhao, J.M.; Zhang, D.G.; Liu, C.Z.; Xu, C.L. The effect of different land use patterns on soil properties in alpine areas of eastern Qilian Mountains. Acta Ecol. Sin. 2012, 32, 548–556. [Google Scholar] [CrossRef]
  56. Malika, A.; Mansur, S.; Zhang, X.Q. Spatial-Temporal Dynamic Evolution Characteristics of Land Use/Cover in the Middle and Lower Reaches of Yarkant River Basin in Recent 35 Years. J. Ecol. Rural Environ. 2019, 35, 1118–1126. [Google Scholar]
  57. Zhang, J.M.; Zang, C.F. Spatial and temporal variability characteristics and driving mechanisms of land use in the Southeastern River Basin from 1990 to 2015. Acta Ecol. Sin. 2019, 39, 9339–9350. [Google Scholar]
Figure 1. The location of the study area.
Land 12 00287 g001
Figure 2. Spatial pattern of land use in the Qilian Mountains.
Land 12 00287 g002
Figure 3. Area of land-use types in the Qilian Mountains.
Land 12 00287 g003
Figure 4. Characteristics of land use structure in the Qilian Mountains.
Land 12 00287 g004
Figure 5. Area change rates of land-use types in the Qilian Mountains.
Land 12 00287 g005
Table 1. Classification systems of LUCC in the Qilian Mountains [45].
Class I TypeClass II Type
NumberNameNumberNameDefinition
1Arable land
(6065 km2)
Refers to land planted with crops, including ripe cultivated land, newly opened land, recreational land, rotational rest land, grass field rotation cropland; land planted mainly with crops, agricultural fruit, agricultural mulberry, agricultural forestry; cultivated for more than three years of the beach and sea shoals.
12DrylandRefers to arable land without irrigation water source and facilities, growing crops by natural will water; dry crop arable land with water source and water facilities, which can be irrigated normally in normal years; arable land mainly for growing vegetables; recreational land and rotational rest land with normal crop rotation.
2Forest land
(16,454 km2)
Refers to forestry land for growing trees, shrubs, bamboos, and coastal mangrove land.
21With forest landRefers to natural forests and plantations with a denseness of >30%. Including timber forests, economic forests, protective forests, and other mature forest lands.
22ShrublandRefers to short forest land and scrub sparse forest land with densities >40% and heights below 2 m.
23Sparse forest landRefers to forest land with 10–30% tree densities.
24Other forest landsRefers to unestablished afforestation land, trails, nurseries, and various types of gardens (orchards, mulberry gardens, tea gardens, hot crop forestry gardens, etc.).
3Grassland
(85,839 km2)
Refers to all kinds of grasslands with herbaceous plants growing mainly and covering more than 5%, including scrub grasslands with mainly grazing and open forest grasslands with less than 10% depression.
31High cover
Grassland
Refers to natural grassland, improved grassland, and mowed grassland with >50% cover. Such grasslands generally have good moisture conditions and dense grass cover growth.
32Medium Cover
Grassland
Refers to natural and improved grasslands with >20–50% cover, which generally has insufficient moisture and sparse grass cover.
33Low cover
Grassland
Refers to natural grasslands with a cover of 5–20%. This type of grassland is moisture deficient, with sparse grass cover and poor conditions for grazing use.
4Waters
(9199 km2)
Refers to the land of natural land waters and water facilities.
41Rivers and canalsRefers to naturally formed or artificially excavated rivers and the land below the perennial water level of the main stem. Artificial canals include embankments.
42LakesRefers to the land below the perennial water level in naturally occurring waterlogged areas.
43Reservoir pondsRefers to the land below the perennial water level in the artificially constructed water storage area.
44Permanent
Glacial Snow
Refers to land covered by glaciers and snow all year round.
46Beach landRefers to the land between the level of the river and lake waters during the flat water period and the level of the flood period.
5Construction Land
(601 km2)
Refers to urban and rural settlements and the land for industry, mining, and transportation beyond them.
51Urban landRefers to the land in large, medium, and small cities and built-up areas above the county town.
52Rural settlementsRefers to rural settlements that are independent of towns.
53Other
Construction Land
Refers to land for factories and mines, large industrial areas, oil fields, salt fields, quarries, etc., and transportation roads, airports, and special land.
6Unused land
(74,504 km2)
Land that is currently unused, including hard-to-use land.
61SandyRefers to the land with the surface covered by sand and the vegetation cover of less than 5%, including desert, excluding the desert in the water system.
62GobiRefers to the land where the surface is dominated by gravel and the vegetation cover is less than 5%.
63Saline landRefers to land where salinity collects on the surface and vegetation is sparse, and only strong salinity-tolerant plants can grow.
64MarshlandRefers to land that is flat and low-lying, poorly drained, chronically wet, seasonally waterlogged or perennially waterlogged, and with wet growing plants on the surface.
65Bare landRefers to land with surface soil cover and vegetation cover is less than 5%.
66Bare rock textureRefers to land with a rocky or gravelly surface that covers >5% of the area.
67OthersRefers to other unused lands, including the alpine desert steppe, tundra, etc.
Table 2. Structural characteristics of land use in the Qilian Mountains from 1980 to 2020.
YearLand-Use TypesGrasslandArable LandConstruction LandForest LandWatersUnused Land
1980Area/km282,218574142916,541840979,324
Percent/%42.672.980.228.594.3641.17
1990Area/km282,481594641016,604782579,396
Percent/%42.813.090.218.624.0641.21
1995Area/km274,671562442616,924837486,643
Percent/%38.762.920.228.784.3544.97
2000Area/km282,076588945716,533778579,922
Percent/%42.603.060.248.584.0441.48
2005Area/km282,014596245816,522779179,915
Percent/%42.573.090.248.584.0441.48
2010Area/km281,996597948116,523777179,912
Percent/%42.563.100.258.584.0341.48
2015Area/km281,941595157016,501788479,815
Percent/%42.533.090.308.564.0941.43
2020Area/km285,839606560116,454919974,504
Percent/%44.553.150.318.544.7738.67
Table 3. Land use area changes in the Qilian Mountains from 1980 to 2020.
Year and Land TypeGrasslandArable LandConstruction LandForest LandWatersUnused Land
1980–1990Area change/km2263205−1963−58472
Range of change/%0.323.57−4.430.38−6.940.09
1990–1995Area change/km2−7810−322163205497247
Range of change/%−9.47−5.423.901.937.029.13
1995–2000Area change/km2740526531−391−589−6721
Range of change/%9.924.717.28−2.31−7.03−7.76
2000–2005Area change/km2−62731−116−7
Range of change/%−0.081.240.22−0.070.08−0.008
2005–2010Area change/km2−1817231−20−3
Range of change/%−0.020.295.020.006−0.26−0.003
2010–2015Area change/km2−55−2889−22113−97
Range of change/%−0.07−0.4718.50−0.131.45−0.12
2015–2020Area change/km2389811431−471315−5311
Range of change/%4.761.925.44−0.2816.68−6.65
1980–2020Area change/km23621324172−87790−4820
Range of change/%4.405.6440.09−0.539.39−6.08
Table 4. Dynamic degrees of land-use types moving in the Qilian Mountains at different times (%).
YearSingle Land Use Dynamic DegreeComprehensive Land Use Dynamic Degree
GrasslandArable LandConstruction LandForest LandWatersUnused Land
1980–19900.030.36−0.440.040.690.010.03
1990–1995−1.89−1.080.780.391.401.830.84
1995–20001.980.941.46−0.461.41−1.550.80
2000–2005−0.020.250.04−0.010.020.000.008
2005–20100.000.061.000.00−0.050.000.004
2010–2015−0.01−0.093.70−0.030.29−0.020.02
2015–20200.950.381.09−0.063.34−1.330.56
Table 5. Land use transfer matrix in the Qilian Mountains in 1980–1990, 1990–1995, 1995–2000 (km2).
YearLand TypesGrasslandArable LandConstruction LandForest LandWatersUnused LandSum
1990
1980Grassland56,7812045159598276916,48282,218
Arable land1936318115334867565741
Construction land1521804918822429
Forest land606242820892416794016,541
Waters8116214153588114888409
Unused land16,7395015117993360,40879,324
Sum82,481594641016,604782579,396192,662
1995
1990Grassland50,6391942141619269522,87282,481
Arable land2190309317837950565946
Construction land14715559161023410
Forest land5829337279095225109116,604
Waters72553614858999947825
Unused land15,14144151094149561,60779,396
Sum74,671562442616,924837486,643192,662
2000
1995Grassland53,1431964119521762213,60674,671
Arable land1655338419330757285624
Construction land137163951849426
Forest land553028220992816699816,924
Waters6264310178610914088374
Unused land20,985532088582763,87386,643
Sum82,076588945716,533778579,922192,662
Table 6. Land use transfer matrix in the Qilian Mountains in 2000–2005, 2005–2010, 2010–2015 (km2).
YearLand TypesGrasslandArable LandConstruction LandForest LandWatersUnused LandSum
2005
2000Grassland81,98784 21282,076
Arable land1458701 4 5889
Construction land 457 457
Forest land66 16,5201 16,533
Waters12 778117785
Unused land6 479,91279,922
Sum82,014596245816,522779179,915192,662
2010
2005Grassland81,949355541682,014
Arable land15593871 15962
Construction land 458 458
Forest land14 16,517 16,522
Waters 7 7761237791
Unused land3124 679,87279,915
Sum81,996597948116,523777179,912192,662
2015
2010Grassland81,8867471411481,996
Arable land659422713 5979
Construction land 1480 481
Forest land21 16,49921 16,523
Waters 7731407771
Unused land47 16 8879,76179,912
Sum81,941595157016,501788479,815192,662
Table 7. Land use transfer matrix in the Qilian Mountains from 2015 to 2020 (km2).
Year2020
Land TypesGrasslandArable LandConstruction LandForest LandWatersUnused LandSum
2015Grassland58,4132046234576399214,49381,941
Arable land1985335618433154415951
Construction land176201108223231570
Forest land593334523917516186416,501
Waters711631214861198317884
Unused land18,62154401015184158,24479,815
Sum85,839606560116,454919974,504192,662
Table 8. Land use transfer matrix in the Qilian Mountains from 1980 to 2020 (km2).
Year2020
Land TypesGrasslandArable LandConstruction LandForest LandWatersUnused LandSum
1980Grassland58,45122412545774101714,48182,218
Arable land1936318519332762385741
Construction land1411747818513429
Forest land594835223917117587216,541
Waters8746011150612711878409
Unused land18,48953421014181357,91379,324
Sum85,839606560116,454919974,504192,662
Table 9. The changes in the area of various land types in the Qilian Mountains from 1980 to 2020 (km2).
YearGrasslandArable LandConstruction LandForest LandWatersUnused Land
1980–1990263205−1963−58472
1990–1995−7810−322163205497247
1995–2000740526531−391−589−6721
2000–2005−62731−116−7
2005–2010−1817231−20−3
2010–2015−55−2889−22113−97
2015–2020389811431−471315−5311
1980–20203621324172−87790−4820
Disclaimer/Publisher’s Note: The statements, opinions and data contained in all publications are solely those of the individual author(s) and contributor(s) and not of MDPI and/or the editor(s). MDPI and/or the editor(s) disclaim responsibility for any injury to people or property resulting from any ideas, methods, instructions or products referred to in the content.

