Article

Assessing the Resilience of Stream Ecosystems to Rainfall Impact

1
Department of Forestry and Landscape Architecture, Konkuk University, Seoul 05029, Republic of Korea
2
Division of Environmental Science & Ecological Engineering, Korea University, Seoul 02841, Republic of Korea
*
Author to whom correspondence should be addressed.
Land 2023, 12(11), 2072; https://doi.org/10.3390/land12112072
Submission received: 27 September 2023 / Revised: 14 November 2023 / Accepted: 16 November 2023 / Published: 17 November 2023
(This article belongs to the Special Issue Feature Papers for Land Systems and Global Change Section)

Abstract

:
In Republic of Korea, pronounced seasonal precipitation variability poses substantial challenges for stream water quality management and the effective utilization of water resources. Ecologically degraded streams are particularly vulnerable to these fluctuations, which can exacerbate their already fragile condition. We assessed the resilience of reference and impaired streams in response to rainfall through water quality system performance (WQSP). The WQSP is quantified as the concentration of BOD, T-N, and T-P, which represent streams’ eutrophication and anaerobic conditions and respond quickly to disturbances. Reference and impaired streams are classified according to the biological condition and habitat environment of the streams in the Han River watershed of Republic of Korea. The resilience of the stream ecosystem was estimated using WQSP, the linear multiple regression model, and the generalized additive model for rainfall and WQSP. The WQSP reference streams have a lower sensitivity to disturbance and recover more quickly from the influence of rainfall; therefore, they have higher resilience than impaired streams to rainfall events. This study facilitates understanding changes in stream ecosystems of varying conditions in response to rainfall for ensuring long-term stability and adaptability.

1. Introduction

In Republic of Korea, seasonal precipitation patterns are predominantly shaped by heavy rainfall during summer months and arid winters, influenced by monsoonal activities [1]. Streams within this region, characterized by their limited extent and steep gradients, are particularly sensitive to these seasonal precipitations, which is evident from their high riverbed coefficients [2]. These seasonal fluctuations directly and indirectly affect water quality and stream life by lowering the flow rate of streams and increasing the load of pollutants when rainfall is low [3,4,5]. In contrast, periods of intense rainfall can lead to the dilution of pollutants yet also risk the introduction of land-sourced contaminants into streams, thus degrading water quality and disrupting habitats [6,7]. Streams already impaired by poor water quality, habitat conditions, or ecological disturbances are especially susceptible to the adverse effects of rainfall variability, often facing challenges in restoring their pre-disturbance state [8]. Therefore, it is necessary to understand streams’ resilience and rainfall’s impact on stream resilience.
Resilience is the capacity of a system to return to its state before a disturbance. In stream ecosystems, resilience can be considered the ability to maintain the stream ecosystem by quickly restoring a degraded system’s performance, such as its water quality and living organisms, even when disturbances and disasters occur [9,10,11]. Resilience can be characterized by four “Rs”, namely, robustness (minimum value of the remaining system performance after the disturbance), rapidity (ability to restore original function within a short time), redundancy (ability to replace system function), and resourcefulness (ability to recover after a disaster). The four Rs constituting resilience help identify vulnerabilities in the stream ecosystem and set up disaster prevention measures according to the characteristics of the stream [12,13].
However, as it is difficult to measure resilience quantitatively, resilience can be delineated by estimating changes in system performance in response to various disasters [14]. Particularly, resilience can be estimated in stream ecosystems through an index of water quality system performance (WQSP), which provides a time-varying measure of how well stream ecosystems achieve a desired water quality criterion at a given time (t) [15]. Water quality in the stream ecosystem plays a pivotal role in determining the condition of the stream environment and the habitat for organisms, as well as having an important effect on humans’ healthy use of water [16]. In addition, stream water quality responds more quickly and sensitively to the watershed environment and meteorological dynamics than biological indicators, facilitating an understanding of the effects of various watershed factors on the stream [17]. The resilience of stream ecosystems through WQSP can differ depending on the condition of the ecosystem. Accordingly, it is necessary to understand the relationship between rainfall and stream resilience to respond to rainfall variability and manage water quality appropriately according to stream conditions.
Therefore, this study aimed to examine the resilience of reference and impaired streams to rainfall through the performance of water quality systems. The overall objectives of this study were as follows: (a) to quantify the WQSP of reference and impaired streams for the water quality indicators, and (b) to estimate the sensitivity and stability of the stream ecosystem by identifying the robustness and rapidity of resilience through the WQSP values of the reference and impaired streams and the relationship between rainfall and WQSP. The findings of this study can provide profound insights into stream ecosystem resilience for stream management.

2. Materials and Methods

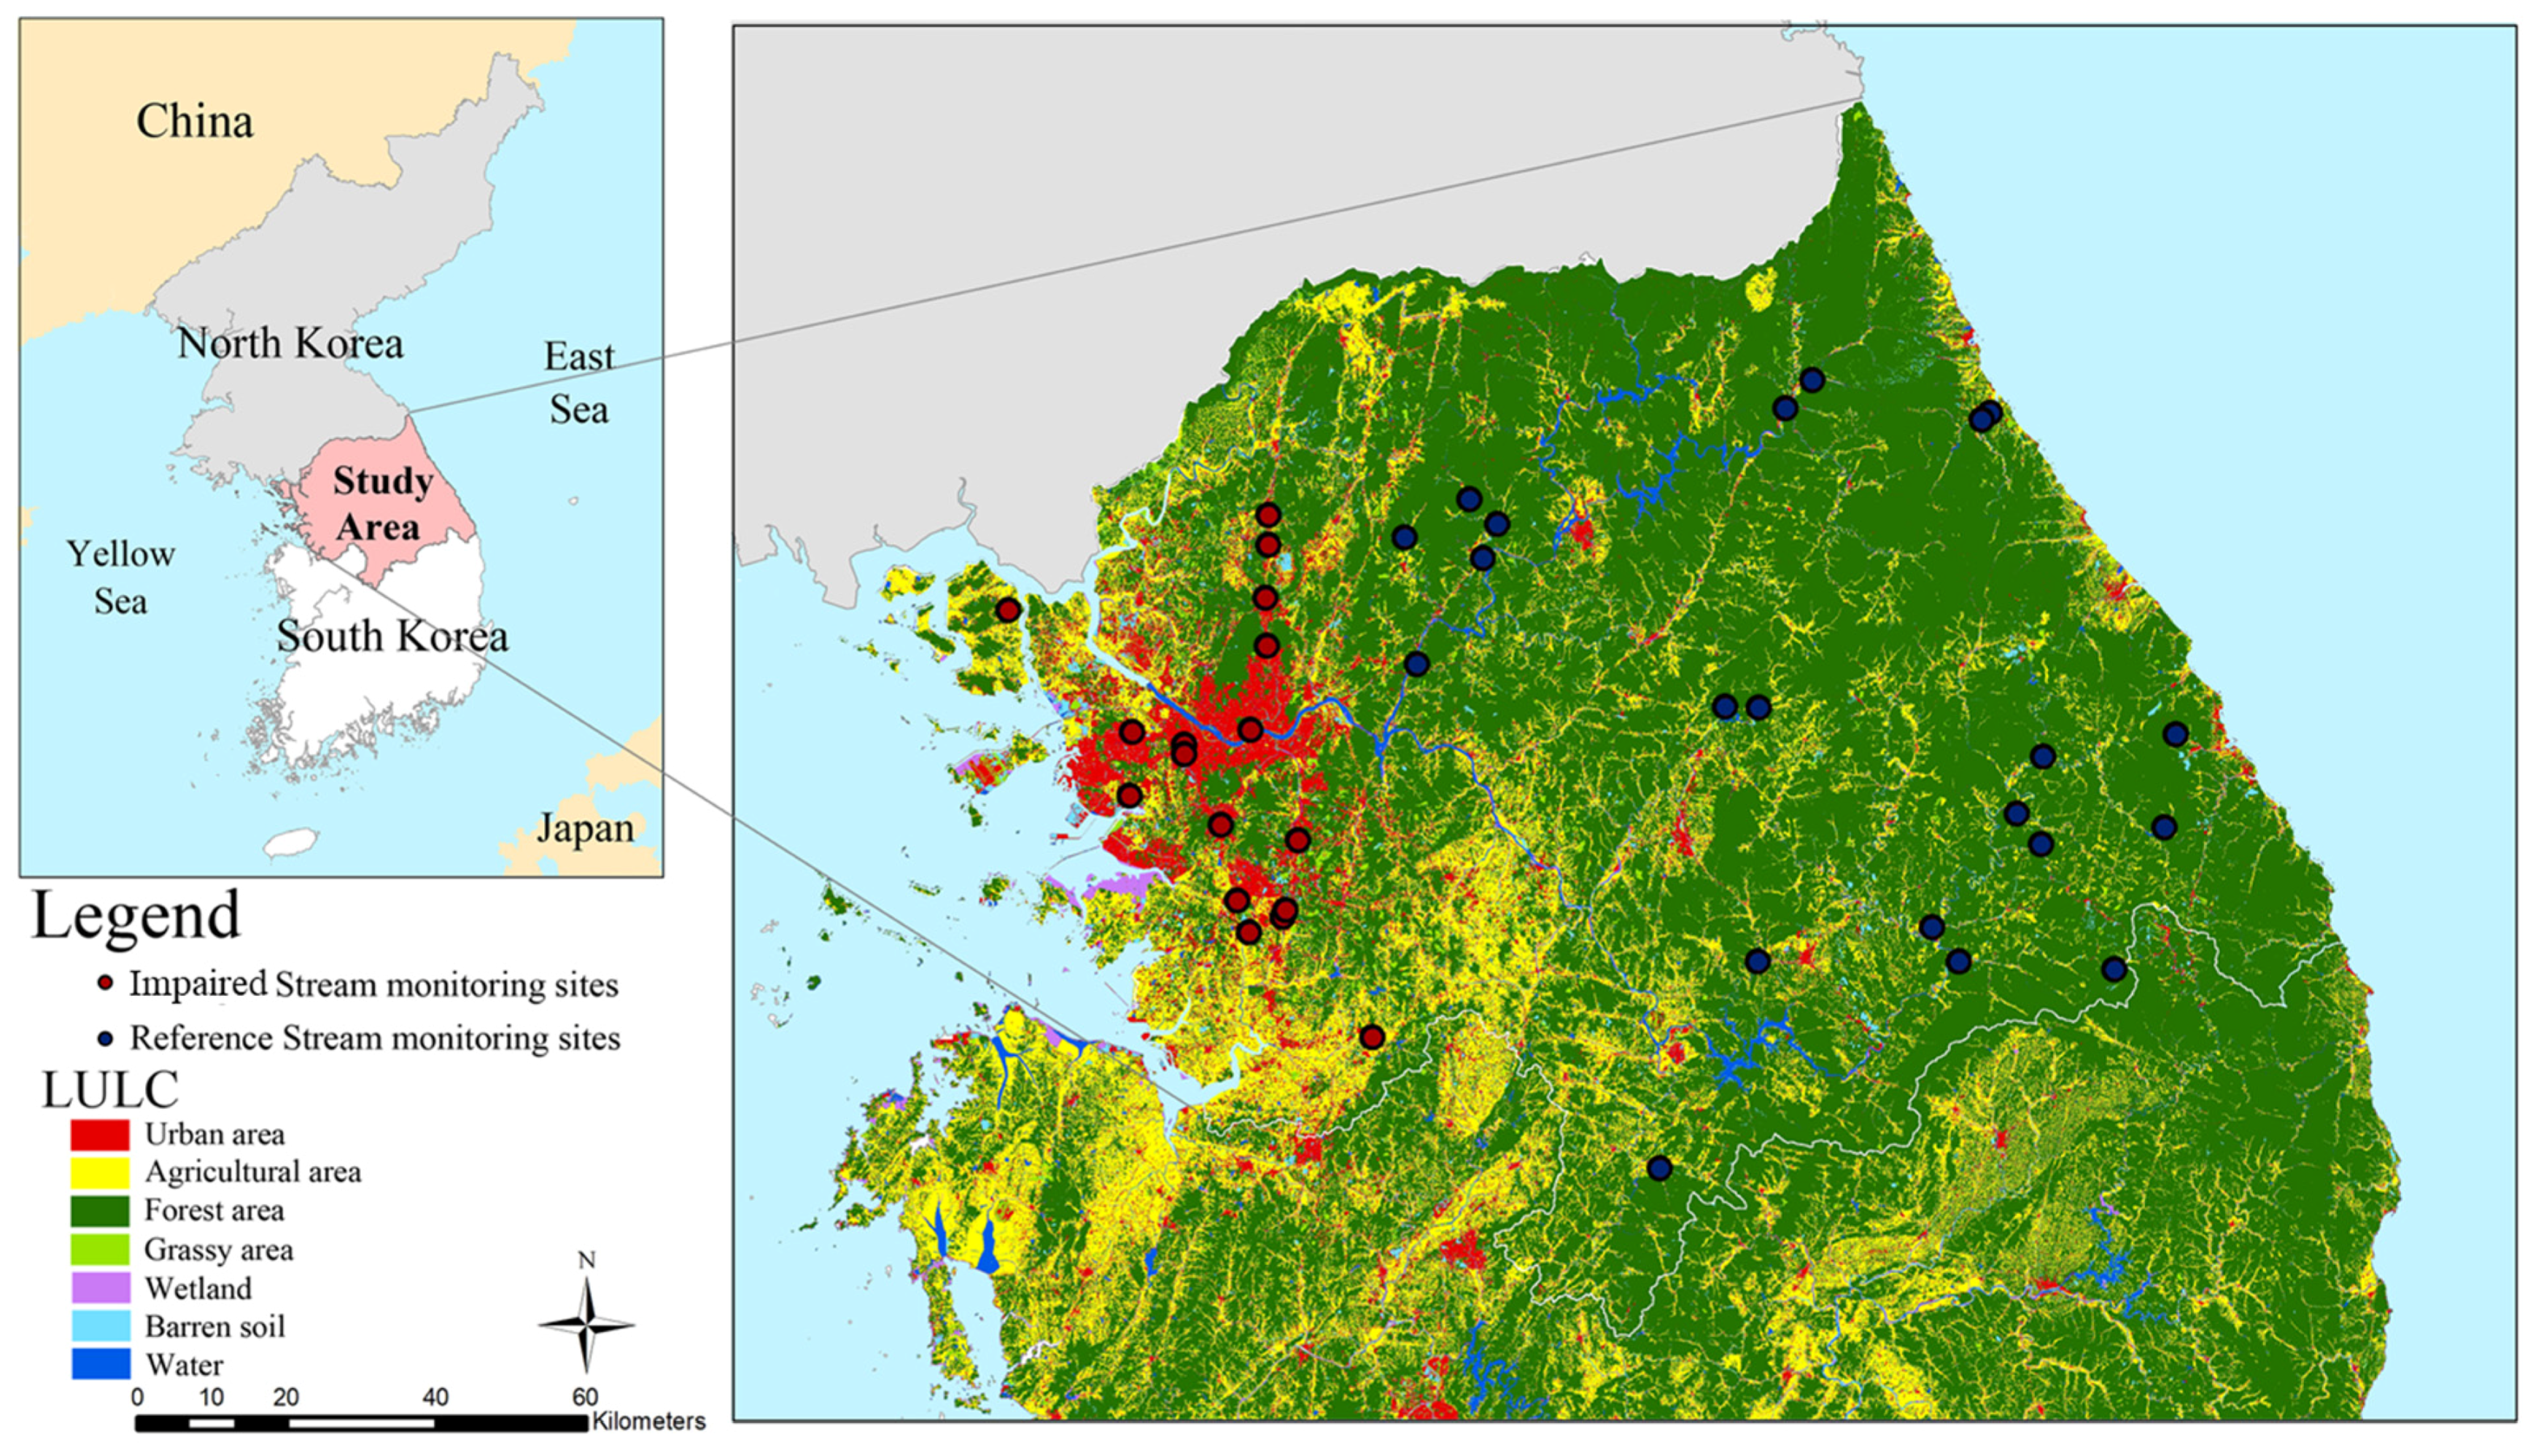
2.1. Study Area and Selecting Reference and Impaired Streams

The Han River watershed, the focus of this study, is the largest in Republic of Korea, contains the largest river, and is home to more than half of the country’s population. It is concentrated in land development pressure and population growth [18]. The Han River watershed consists of 913 streams, including 907 sampling sites from the National Aquatic Ecological Monitoring Program (NAEMP). Through the National Aquatic Ecological Monitoring Program (NAEMP), the Ministry of Environment (MOE) [19] is evaluating the condition of stream ecosystems using biological indicators, such as tropic diatom communities (TDI), benthic macroinvertebrate (BMI), the fish assessment index (FAI), and habitat condition. The NAMEP conducts biannual assessments of biological indices at a nationwide scale. These biological indices are quantified on a scale from 0 to 100 and categorized into five classes, ranging from class A (“very good”) to class E (“very poor”), to assess their ecological condition. Biological-grade results for each stream are obtained from the Water Environment Information System (http://211.114.21.27/web, accessed on 16 November 2023).
In this study, reference streams were defined as those with measured values exceeding 80, while impaired streams were identified by values falling below 35. Of the 907 sampling sites, 158 monitoring sites maintained continuous data records from 2013 to 2019. Reference and impaired stream classifications were determined using data from these 158 monitoring sites. Within these monitoring sites, 22 monitoring sites were designated as reference streams, while 17 were classified as impaired streams (Figure 1).

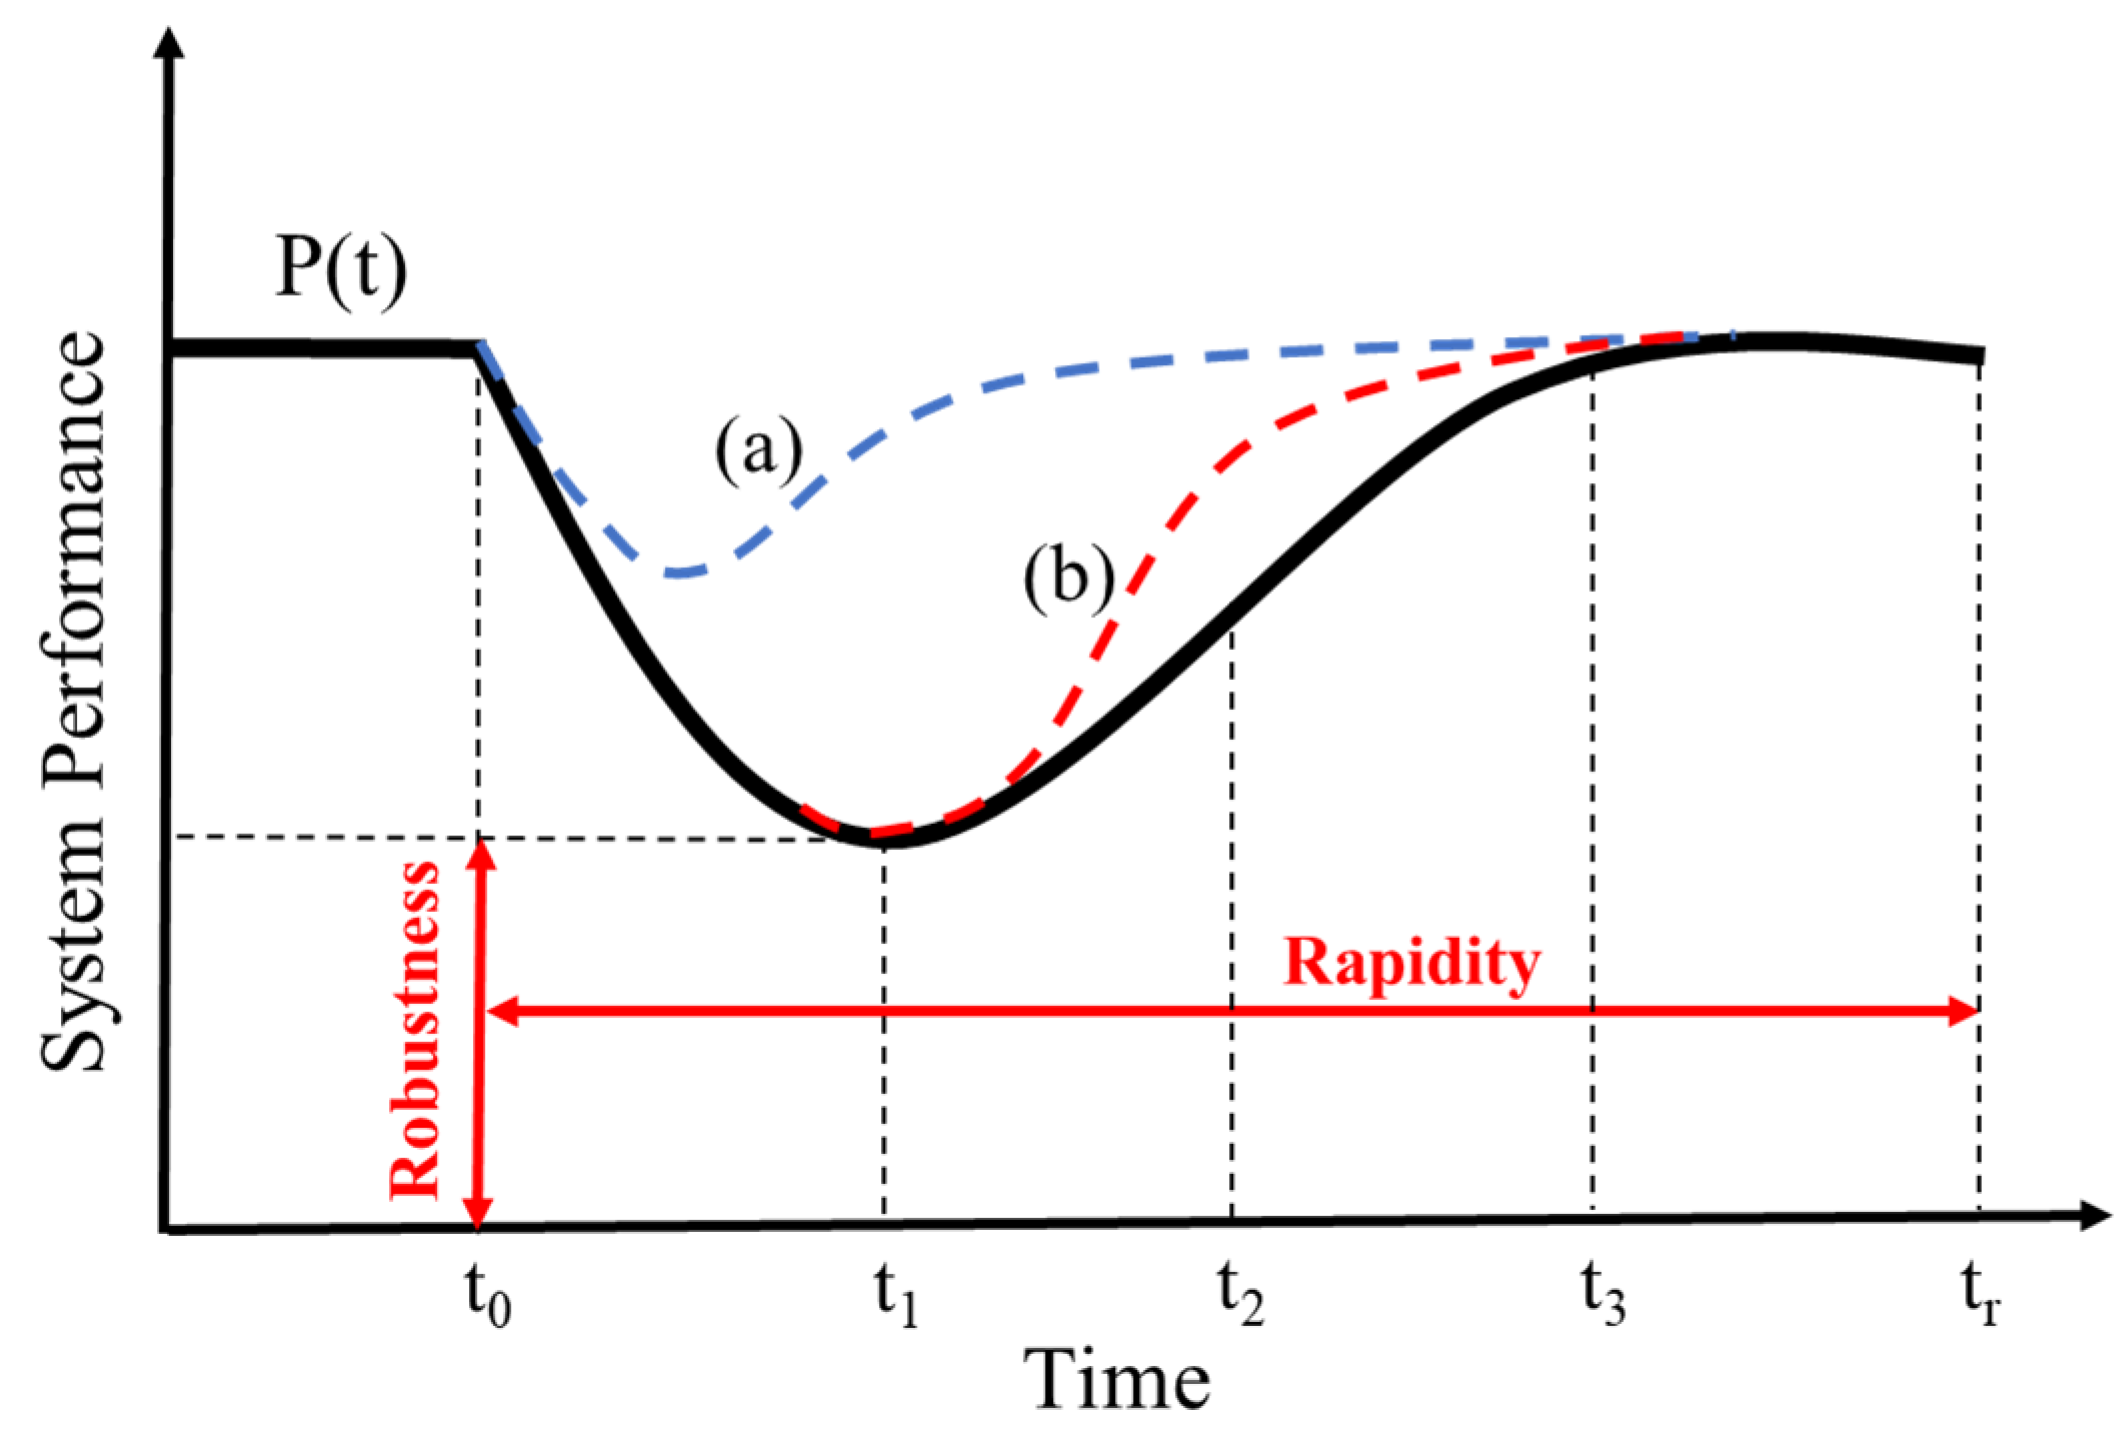
2.2. System Performance as a Concept of Quantifying Resilience

Resilience is widely used to evaluate a system’s performance and condition. In the field of aquatic ecology, it has started to be quantified through system performance in water resources [20]. Simonovic and Peck [21] developed a system performance framework to measure and quantify changes in the dynamic resilience of a system after disturbances due to climate change (Figure 2).
Figure 2 shows the system’s performance change after a disturbance. Line P(t) indicates the loss of system performance, t0 signifies when the disturbance occurs, t1 indicates when the disturbance is finished, and tr signifies when recovery from the disturbance is complete. The system performance response to disturbance can be divided into three categories: a blue line (a), a black line (P(t)), and a red line (b). If P(t) represents the general system performance degradation and recovery, (a) has higher robustness, so the degradation of system performance with disturbance is not severe, and the performance recovery rapidity is short, resulting in high resilience. (b) shows a large drop in system performance with disturbance due to low robustness, and the recovery rapidity of system performance is longer, resulting in low resilience.
p t = t 0 t P 0 P t d t   w e r e   t   [ t 0 ,   t r ]
System performance can be obtained through the cumulative value of the loss value compared to the cumulative values of the system’s optimal value. System performance loss and optimal values can be calculated through Equation (1). To obtain the optimal and loss values of water quality system performance, 2013–2019 monthly average values of Biochemical Oxygen Demand (BOD), Total Nitrogen (T-N), and Total Phosphors (T-P) for the reference and impaired streams were used.

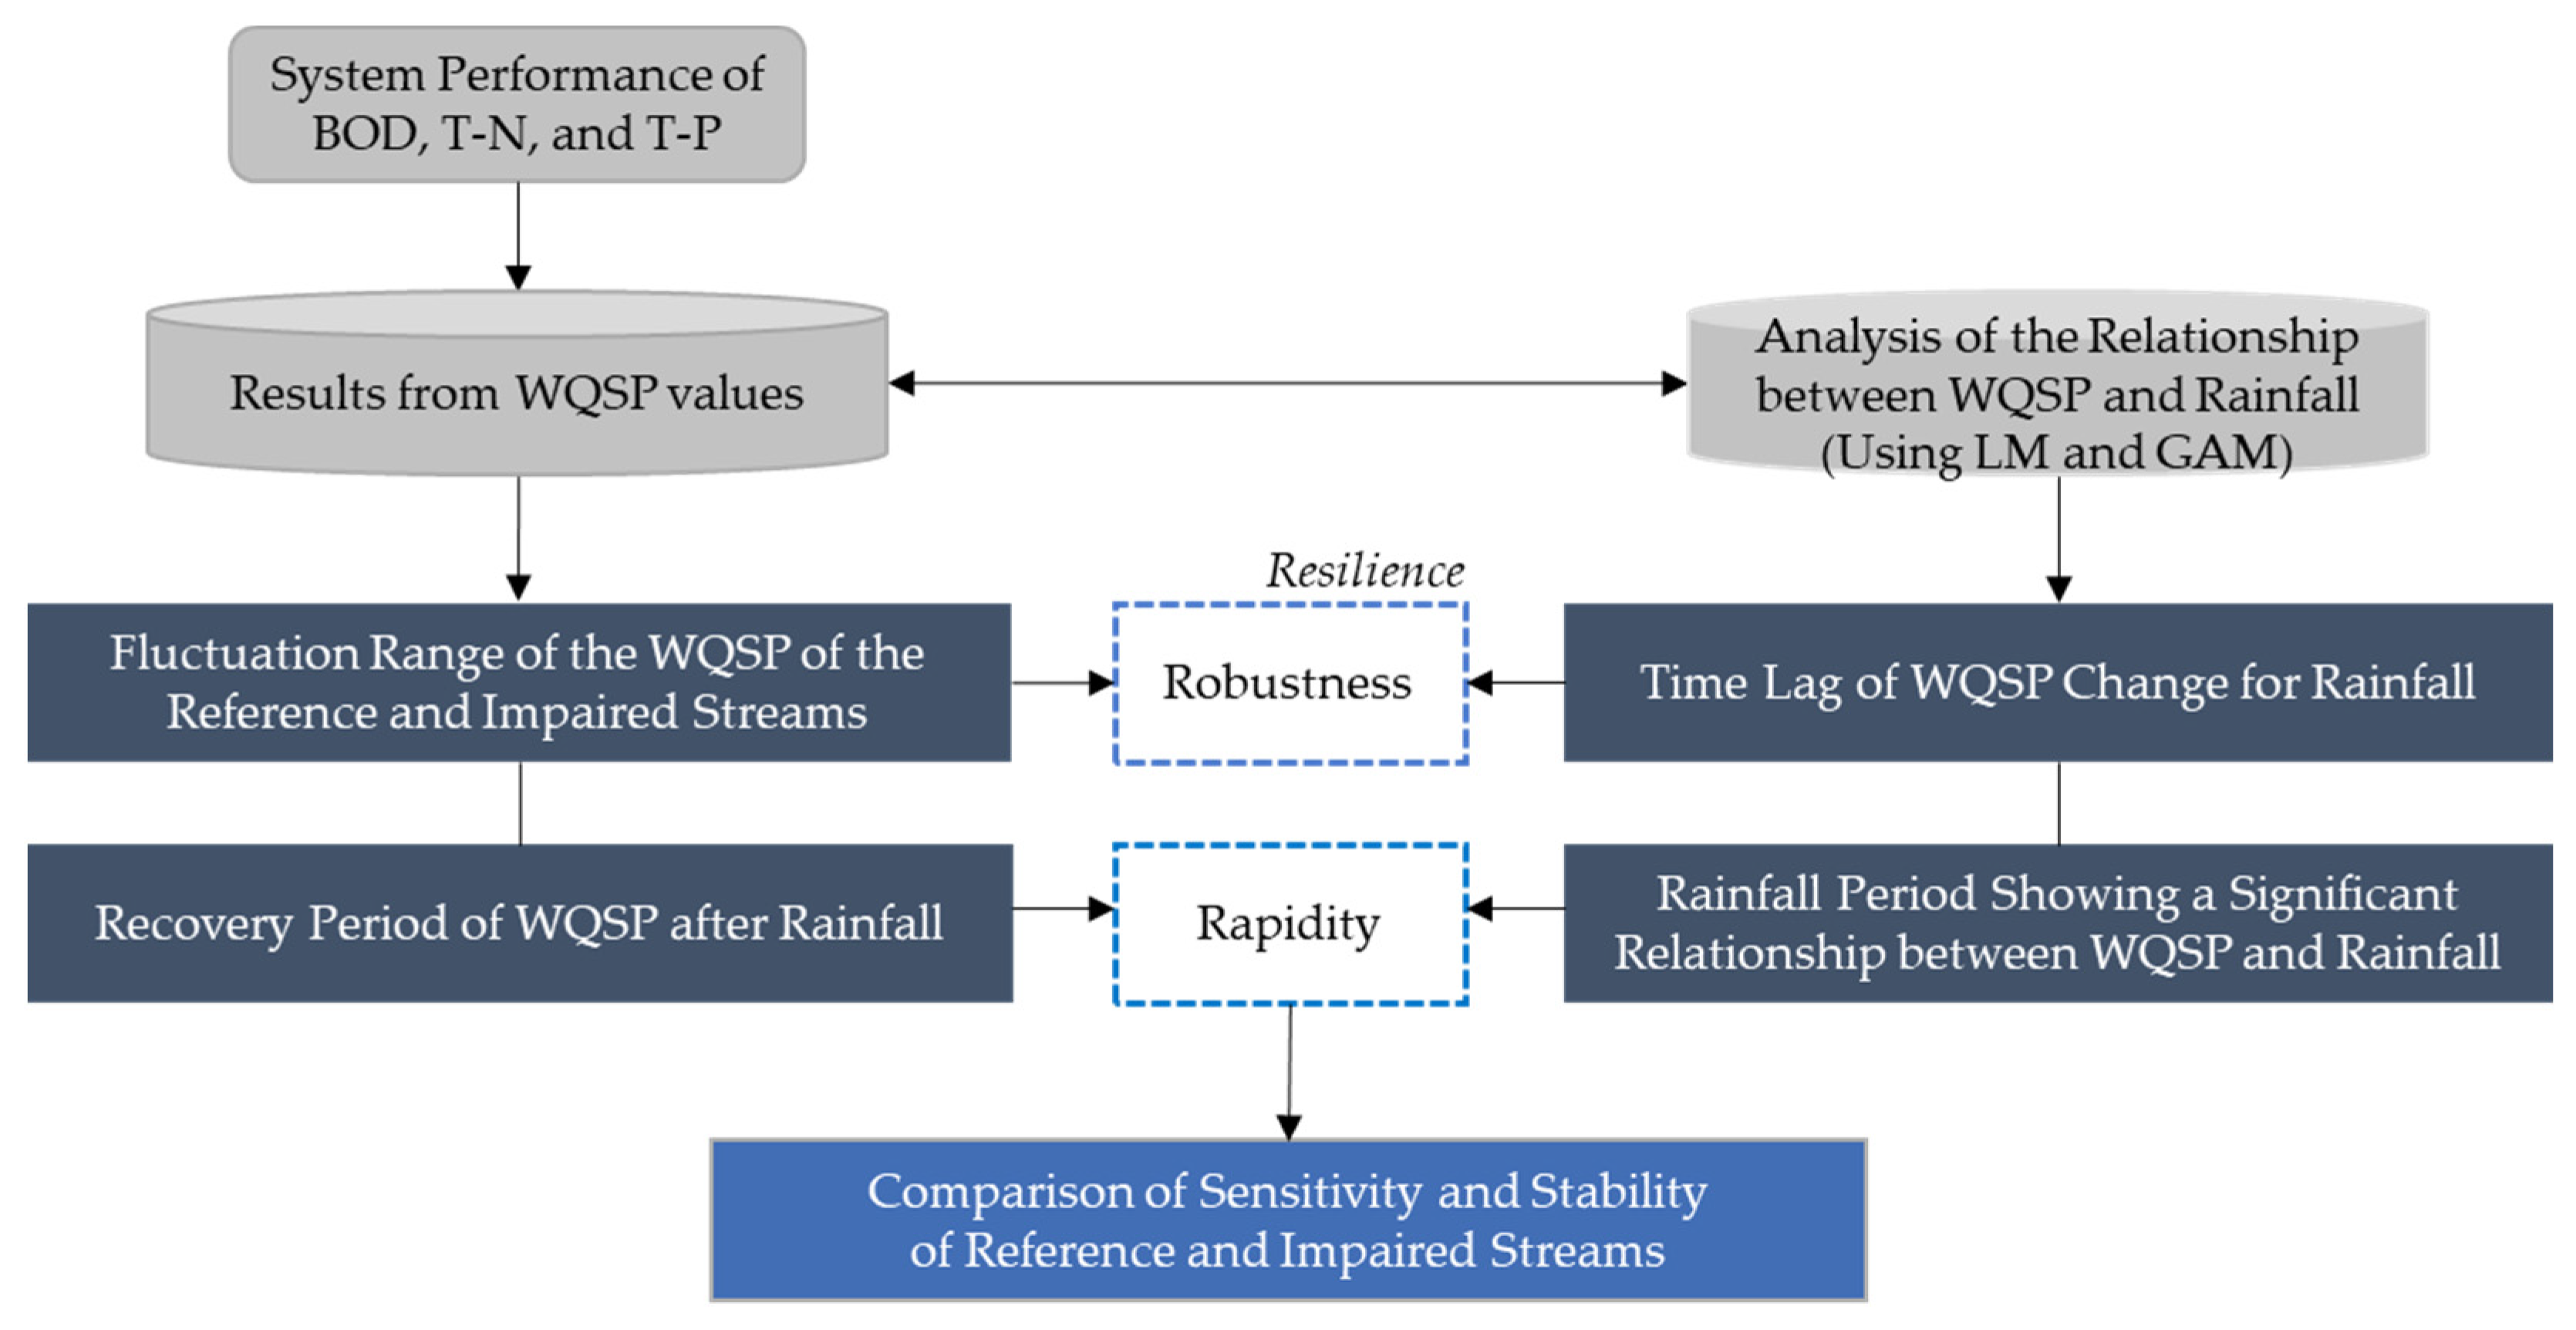
2.3. Analytic Framework

The analytical framework employed to assess the resilience of both reference and impaired streams is systematically presented in Figure 3. The determination of resilience robustness was based on assessing WQSP fluctuation ranges, utilizing WQSP values, and the time lag of WQSP changes associated with rainfall, which were derived through LM and GAM analyses. Resilience rapidity was quantified through the evaluation of the recovery period of WQSP after rainfall, also using WQSP values, and the rainfall period showed a significant relationship between WQSP and rainfall, determined through LM and GAM analyses. Evaluating the stream ecosystem’s stability and sensitivity was founded upon the results obtained from robustness and rapidity assessments. The rainfall used in the analysis was averaged as the sum of monthly precipitation values in the sub-watershed containing each stream. Additionally, the following rainfall used to analyze the relationship between WQSP and rainfall was obtained by moving the sum of the previously calculated monthly precipitation to 1 to 5 months later.

2.4. Statistical Approach

A common approach to investigate the relationships between rainfall and water quality indices in streams is to use linear regression analyses. The linear multiple regression model (LM) is an analysis method that explains the contributions of several causes to a result through several independent variables (x1, x2, …, xn) that explain the dependent variable (y):
L M w q s p = α + B 1 x 1 + B 2 x 2 + + B n x n + ε
Both linear correlation and regression analyses are useful for quantifying the direction, magnitude, and significance of the relationship between variables, but if the two variables are not linear, the relationship between the variables may not be accurately identified. To consider the nonlinear relationship between variables, in this study, a flexible regression model, the generalized additive model (GAM), was used along with linear correlation and regression analyses. The GAM can express a nonlinear relationship between the dependent variable and the independent variable while maintaining additivity and can be expressed as Equation (3):
g ( G A M w q s p ) = α + f 1 x 1 + f 2 x 2 + + f n x n + ε
We performed LM and GAM analyses to investigate the rapidity and robustness between streams through the relationship between rainfall and streams. LM and GAM analyses were performed using the R package, and Akaike’s information criterion (AIC), Bayesian information criterion (BIC), coefficient of determination (R2), and expected default frequency (EDF) of the LM and GAM analysis results were compared. The AIC and BIC are criteria for comparing the model’s suitability; the smaller the AIC and BIC values are, the better the model. R2 is a statistic representing the model’s explanatory power; the closer it is to 1, the higher the explanatory power. EDF is a value that indicates whether the relationship between the explanatory variable and the independent variables is linear or nonlinear. The closer it is to 1, the closer the relationship is to a linear one.

3. Results

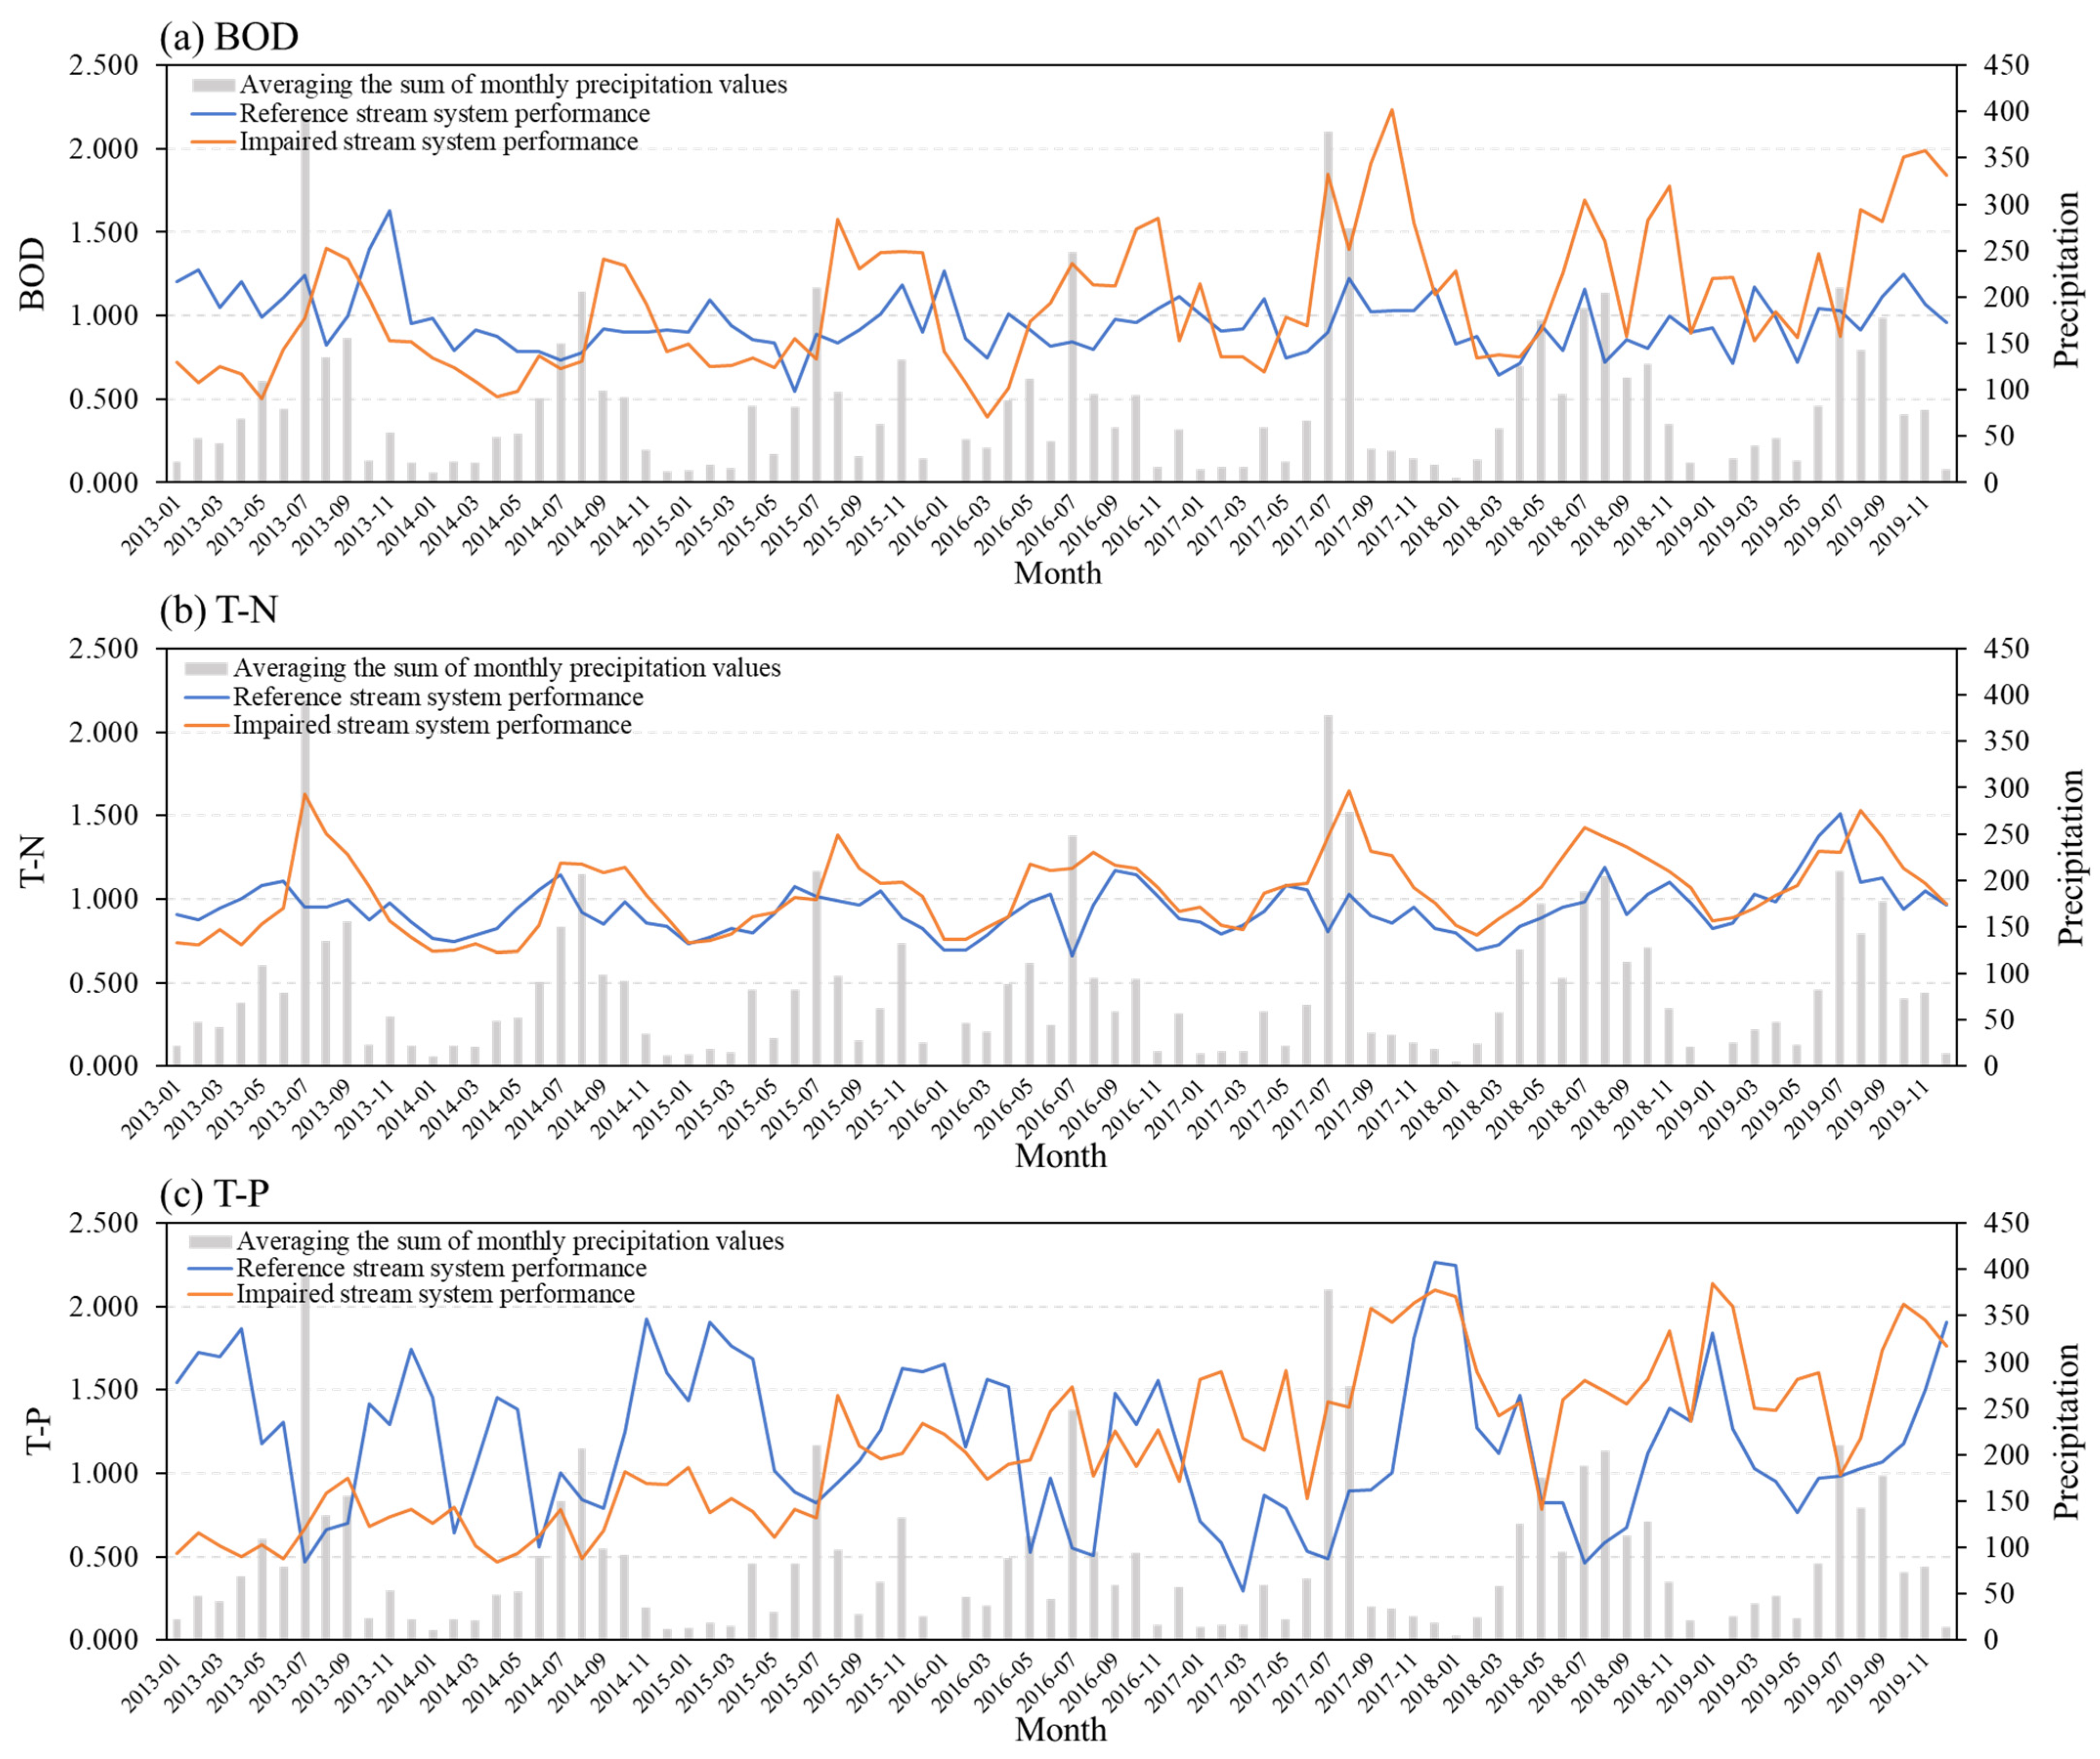
3.1. WQSP Variability Recovery Period of Reference and Impaired Streams

As shown in Figure 4, the range of fluctuations in WQSP and the recovery period of WQSP from rainfall were identified through the BOD, T-N, and T-P changes in the WQSP of the reference and impaired streams. The most precipitation occurred in July and August, and the least occurred in October, March, and January. The fluctuation ranges of the WQSP of the reference and impaired streams for BOD were 0.473 and 1.046, respectively. For T-N, the WQSP fluctuation ranges of the reference and impaired streams were 0.391 and 0.676, respectively, and similar to the BOD, the impaired streams showed a higher fluctuation range. However, the fluctuation range of WQSP for T-P was 1.223 for the reference stream and 0.842 for the impaired stream, indicating higher variability in the reference stream.
The recovery period of the WQSP of BOD and T-N took 11.14 months and 11.43 months on average, respectively, in the reference streams and 13.5 and 13.17 months, respectively, in the impaired streams. The recovery period of the reference and impaired streams differed by about 1–2 months but did not appear to be a significant difference. For T-P, the reference and impaired streams showed a rapidity of 11 and 11.43 months, respectively, indicating similar recovery periods.

3.2. Analysis of the Impact of Rainfall on WQSP

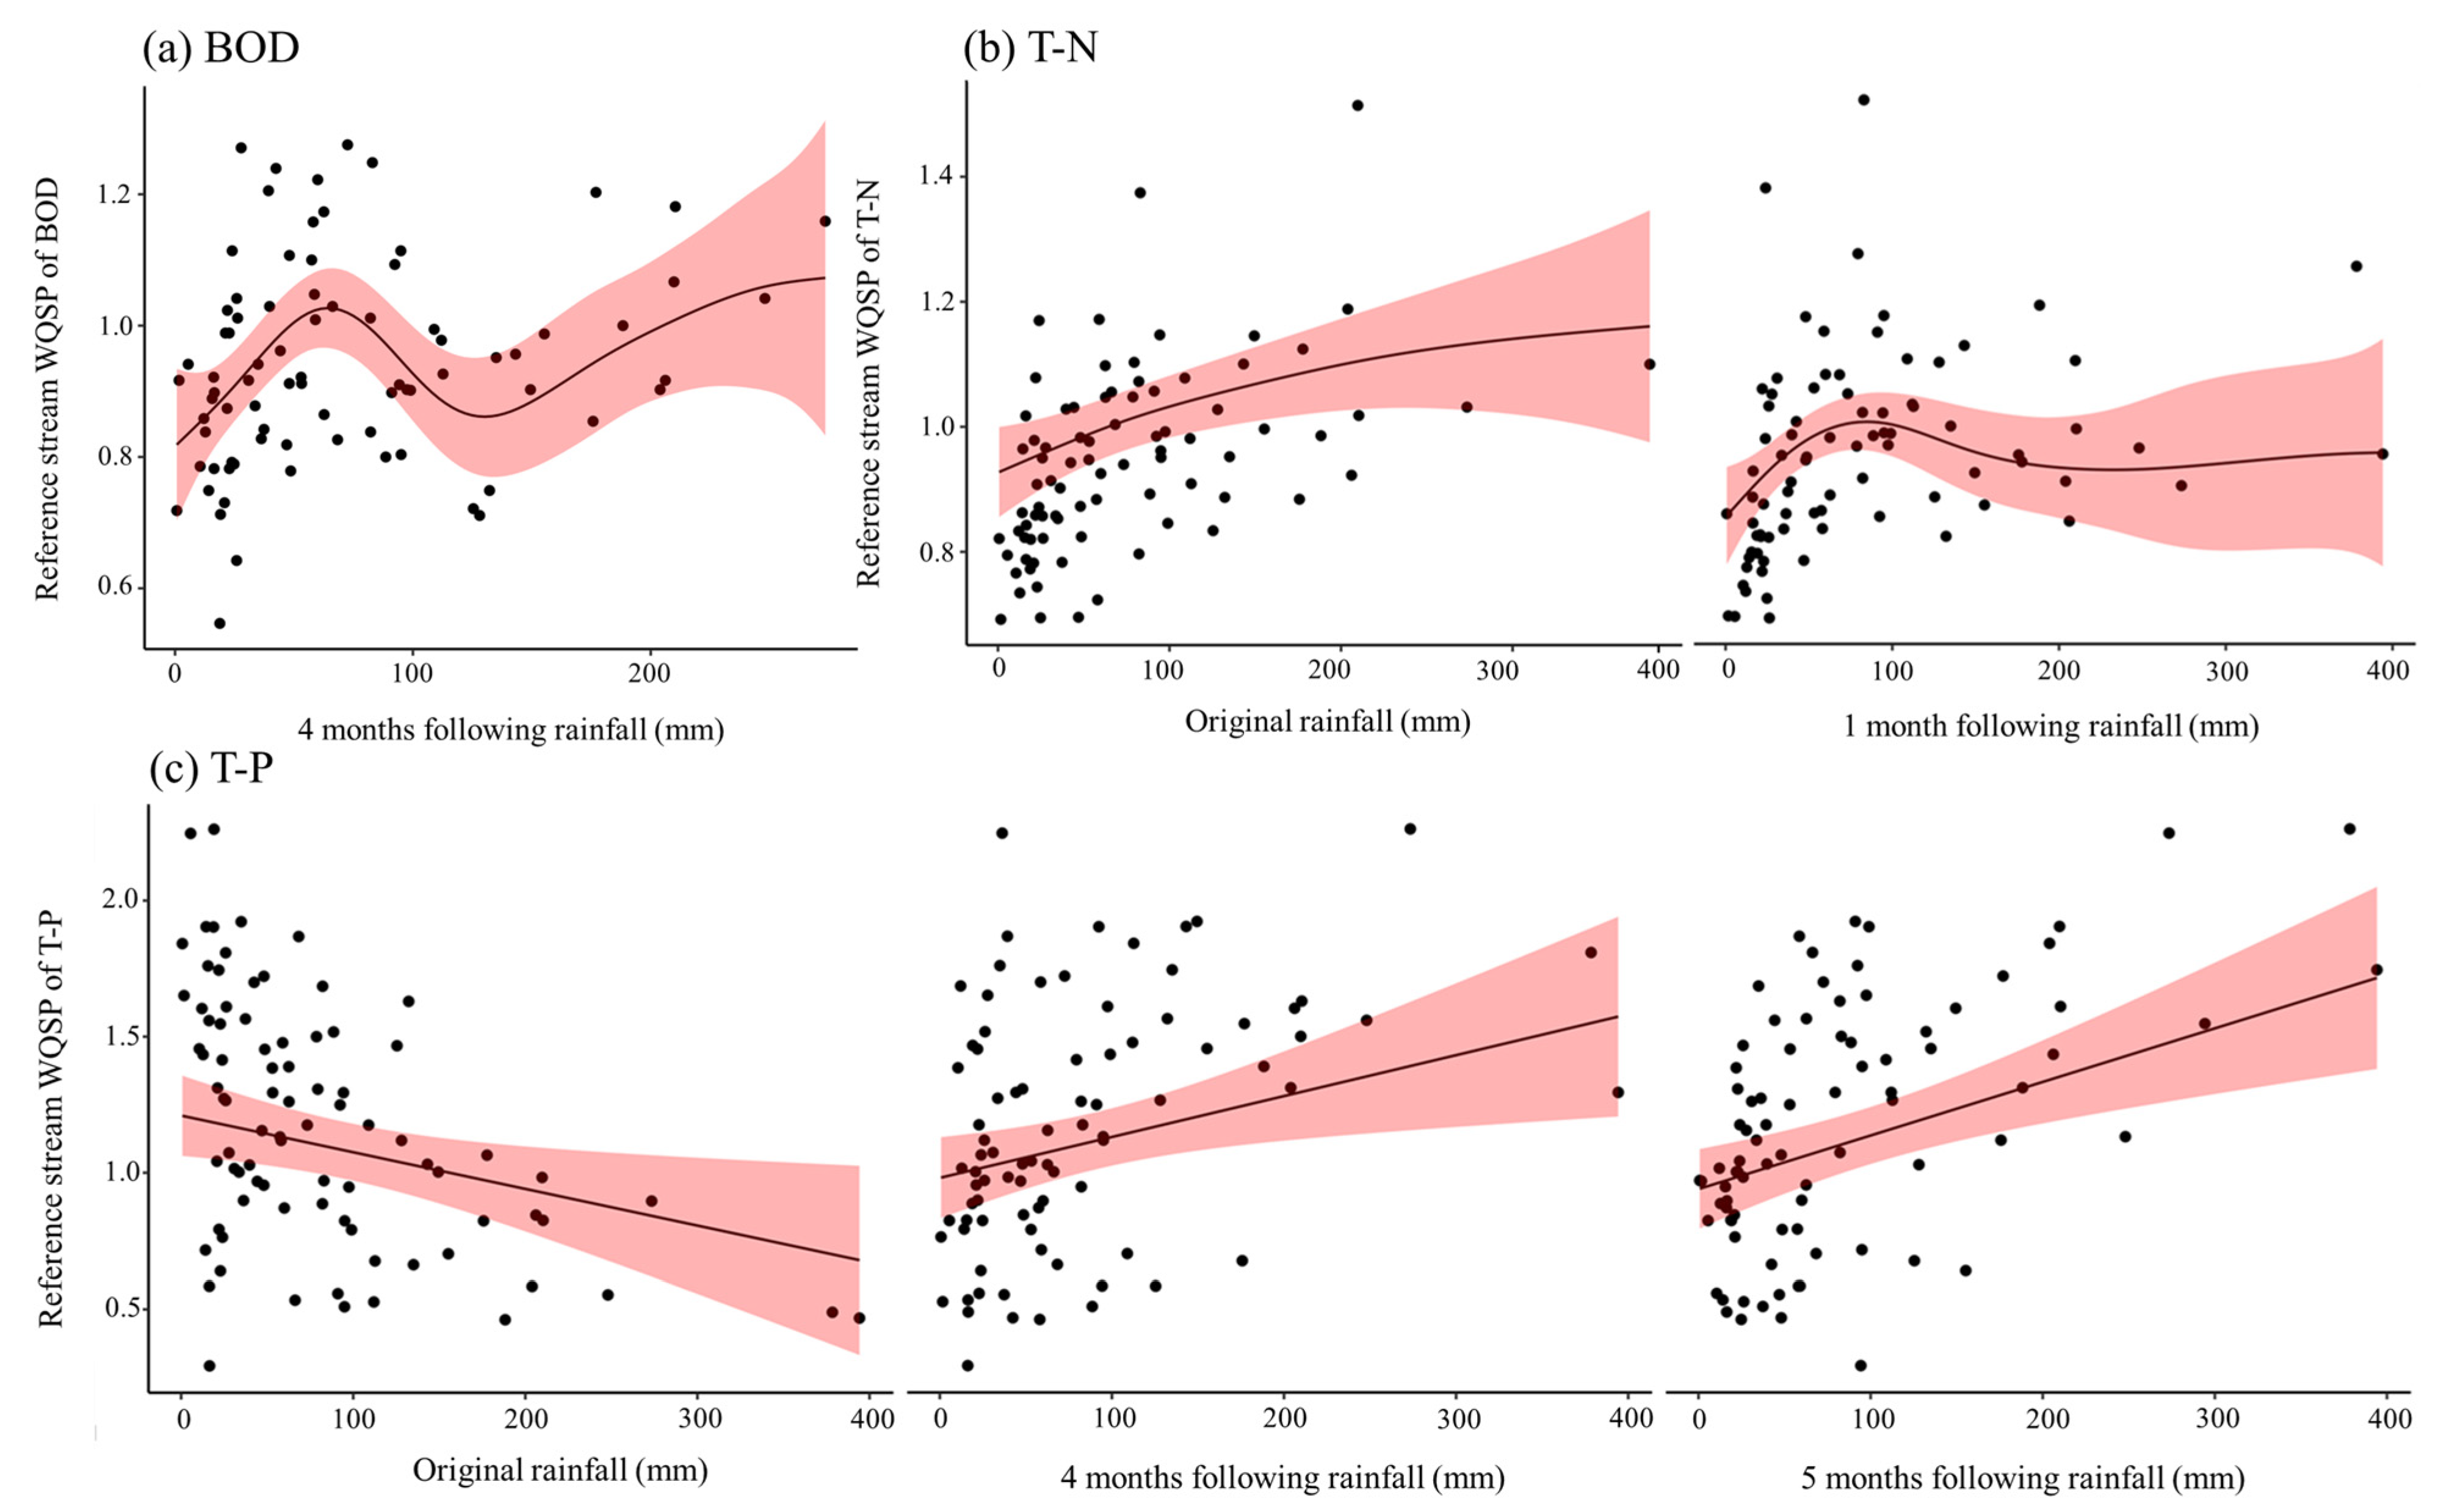
3.2.1. LM and GAM Analyses of Reference Streams for BOD, T-N, and T-P

To examine the relationship between the various rainfall values and WQSP of reference streams, LM and GAM were determined for all rainfall events (Table 1 and Figure 5). In LM, no rainfall variable was significantly associated with WQSP for BOD. The GAM analysis revealed a significant relationship between the four months following rainfall and WQSP. The EDF value was 4.69, which indicated a nonlinear relationship. The GAM better explained the relationship between rainfall and the WQSP of BOD. The findings indicate a four-month delay in the reference streams’ BOD levels. Additionally, the GAM revealed that the rainfall period that showed a significant difference was limited to one month.
A significant relationship was found in LM between the original rainfall and WQSP for T-N. In the GAM, the original rainfall and the one month following the rainfall had a significant relationship. The EDF values were 2.45 and 3.47, respectively, indicating that the relationship between rainfall and WQSP of T-N was nonlinear. Based on these results, the reference streams of T-N showed no time lag in either LM or GAM, and the significant rainfall period was one month in LM and two months in GAM.
In the reference stream of T-P, a significant relationship was found between the original rainfall and four to five months following the rainfall in both LM and GAM, and both EDF values were 1, indicating a linear relationship. Excluding the original rainfall, which has a low continuity with other significant rainfall events, the reference streams of T-P showed a time lag of four months, and the rainfall period with a significant relationship was two months in both LM and GAM.

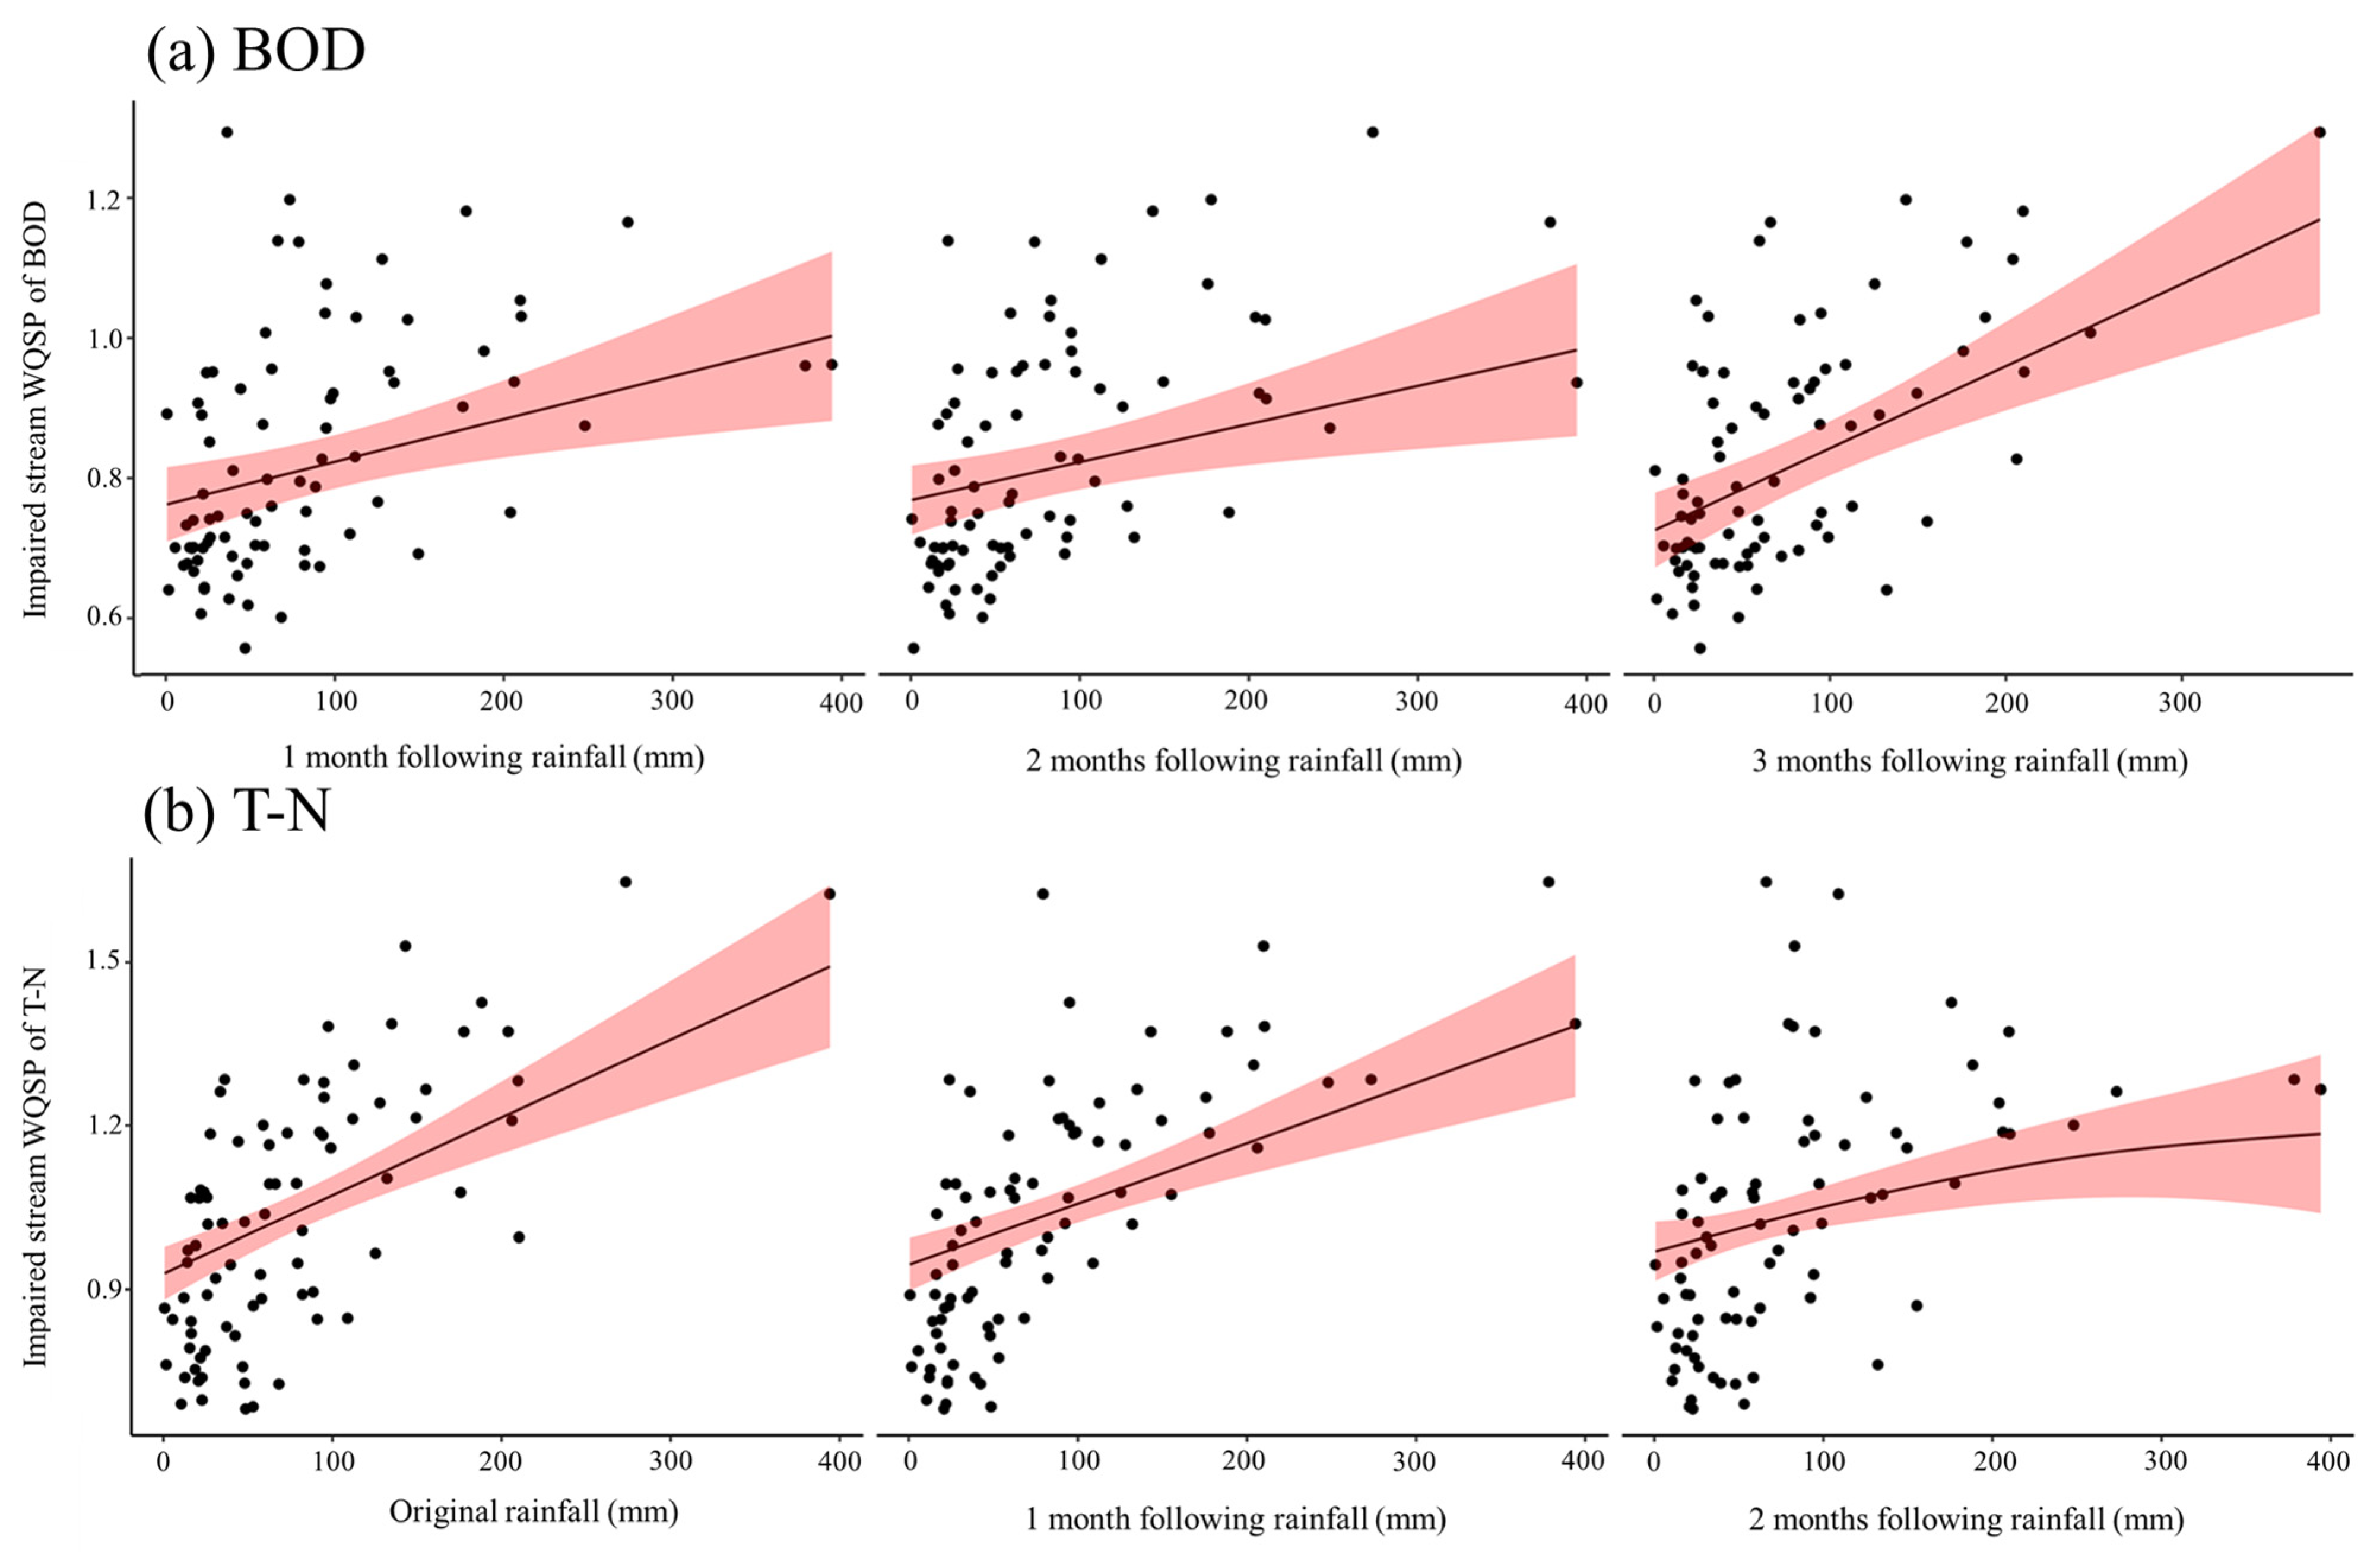
3.2.2. LM and GAM Analyses of Impaired Streams for BOD, T-N, and T-P

To examine the relationship between the various rainfall values and WQSP of impaired streams, LM and GAM were determined for all rainfall events (Table 2 and Figure 6). In WQSP for BOD, a significant relationship was found between one and three months following rainfall in both LM and GAM, and both EDF values were 1, indicating a linear relationship. The impaired streams of BOD showed a time lag of one month, and the rainfall period with a significant relationship was three months for both LM and GAM.
In WQSP for T-N, a significant relationship was established between the original rainfall and one to two months following rainfall in both LM and GAM, while the three to five months following rainfall did not significantly contribute to the WQSP of T-N. Based on these results, the impaired streams of T-N showed no time lag and a significant rainfall period of three months in both LM and GAM. GAM and LM had similar explanatory power in the WQSP of BOD and T-N.
In WQSP for T-P, no rainfall had a significant relationship with WQSP in either the LM or GAM, so both models lacked explanatory power for the relationship between WQSP and rainfall.

3.3. Comparison of Sensitivity and Stability of Resilience

3.3.1. Comparison of Sensitivity through Robustness

To understand the sensitivity of stream ecosystem resilience, the fluctuation range of WQSP and the time lag of WQSP change with rainfall were compared (Table 3). The range of WQSP fluctuation for the reference streams for BOD and T-N was not larger than that of the impaired streams. The low fluctuation of the reference streams indicated no abrupt change in the WQSP due to rainfall. Therefore, it was concluded that the reference streams had a stream environment that responded less sensitively to rainfall and had higher robustness than the impaired streams. However, in the case of T-P, the range of the WQSP fluctuation for the reference streams was larger than that of the impaired streams, but the range of the fluctuations in impaired streams has been increasing since 2017, as shown in Figure 4. Therefore, T-P management must provide a stable habitat for the reference and impaired streams.
The time lag values derived through the LM and GAM indicated a one-month delay in the change in WQSP for BOD in impaired streams following rainfall. For T-N, the WQSP changed with the original rainfall event and reacted quite quickly to the rainfall. On the other hand, in the reference stream, the BOD and T-P showed a change in WQSP after three to four months, indicating that the time lag effect of rainfall was relatively long. The reference streams were considered to have a longer time lag since their tolerance to external environmental changes was not significant compared to that of the impaired streams, so it was concluded that the reference streams had higher robustness and lower sensitivity than the impaired streams. In the case of T-N, unlike other water quality indicators, the reference and impaired streams responded quickly to rainfall because the time lag was short. Unlike BOD, which is indirectly measured through dissolved oxygen and changes its concentration in decomposing organic matter that flows into the stream by microorganisms, T-N does not have a large time lag since the nitrogen component is flowed into and the concentration changes [22]. Furthermore, given that nitrogen readily dissolves in water, this phenomenon is attributed to the swift fluctuations in nitrogen concentration resulting from shifts in precipitation patterns [23,24].

3.3.2. Comparison of Stability through Rapidity

To understand the stability of stream ecosystem resilience, the recovery period of the WQSP according to rainfall and the rainfall period that showed a continuous significant relationship with rainfall were compared (Table 4).
The period between WQSP degradation and recovery was approximately two months faster in the reference streams for BOD and T-N, confirming that the reference stream has better rapidity. However, for T-P, the recovery periods of the reference and impaired streams were similar, so it was concluded that management of the T-P is important.
The rainfall period that showed a significant relationship in LM and GAM in the reference streams was one to two months, and that in the impaired streams was three to four months. Therefore, the reference streams were affected by rainfall for a shorter period than the impaired streams, which indicated that the reference streams recovered more quickly from the effects of rainfall than the impaired streams and provided a more stable stream environment. Therefore, the reference streams have higher stability.

4. Discussion

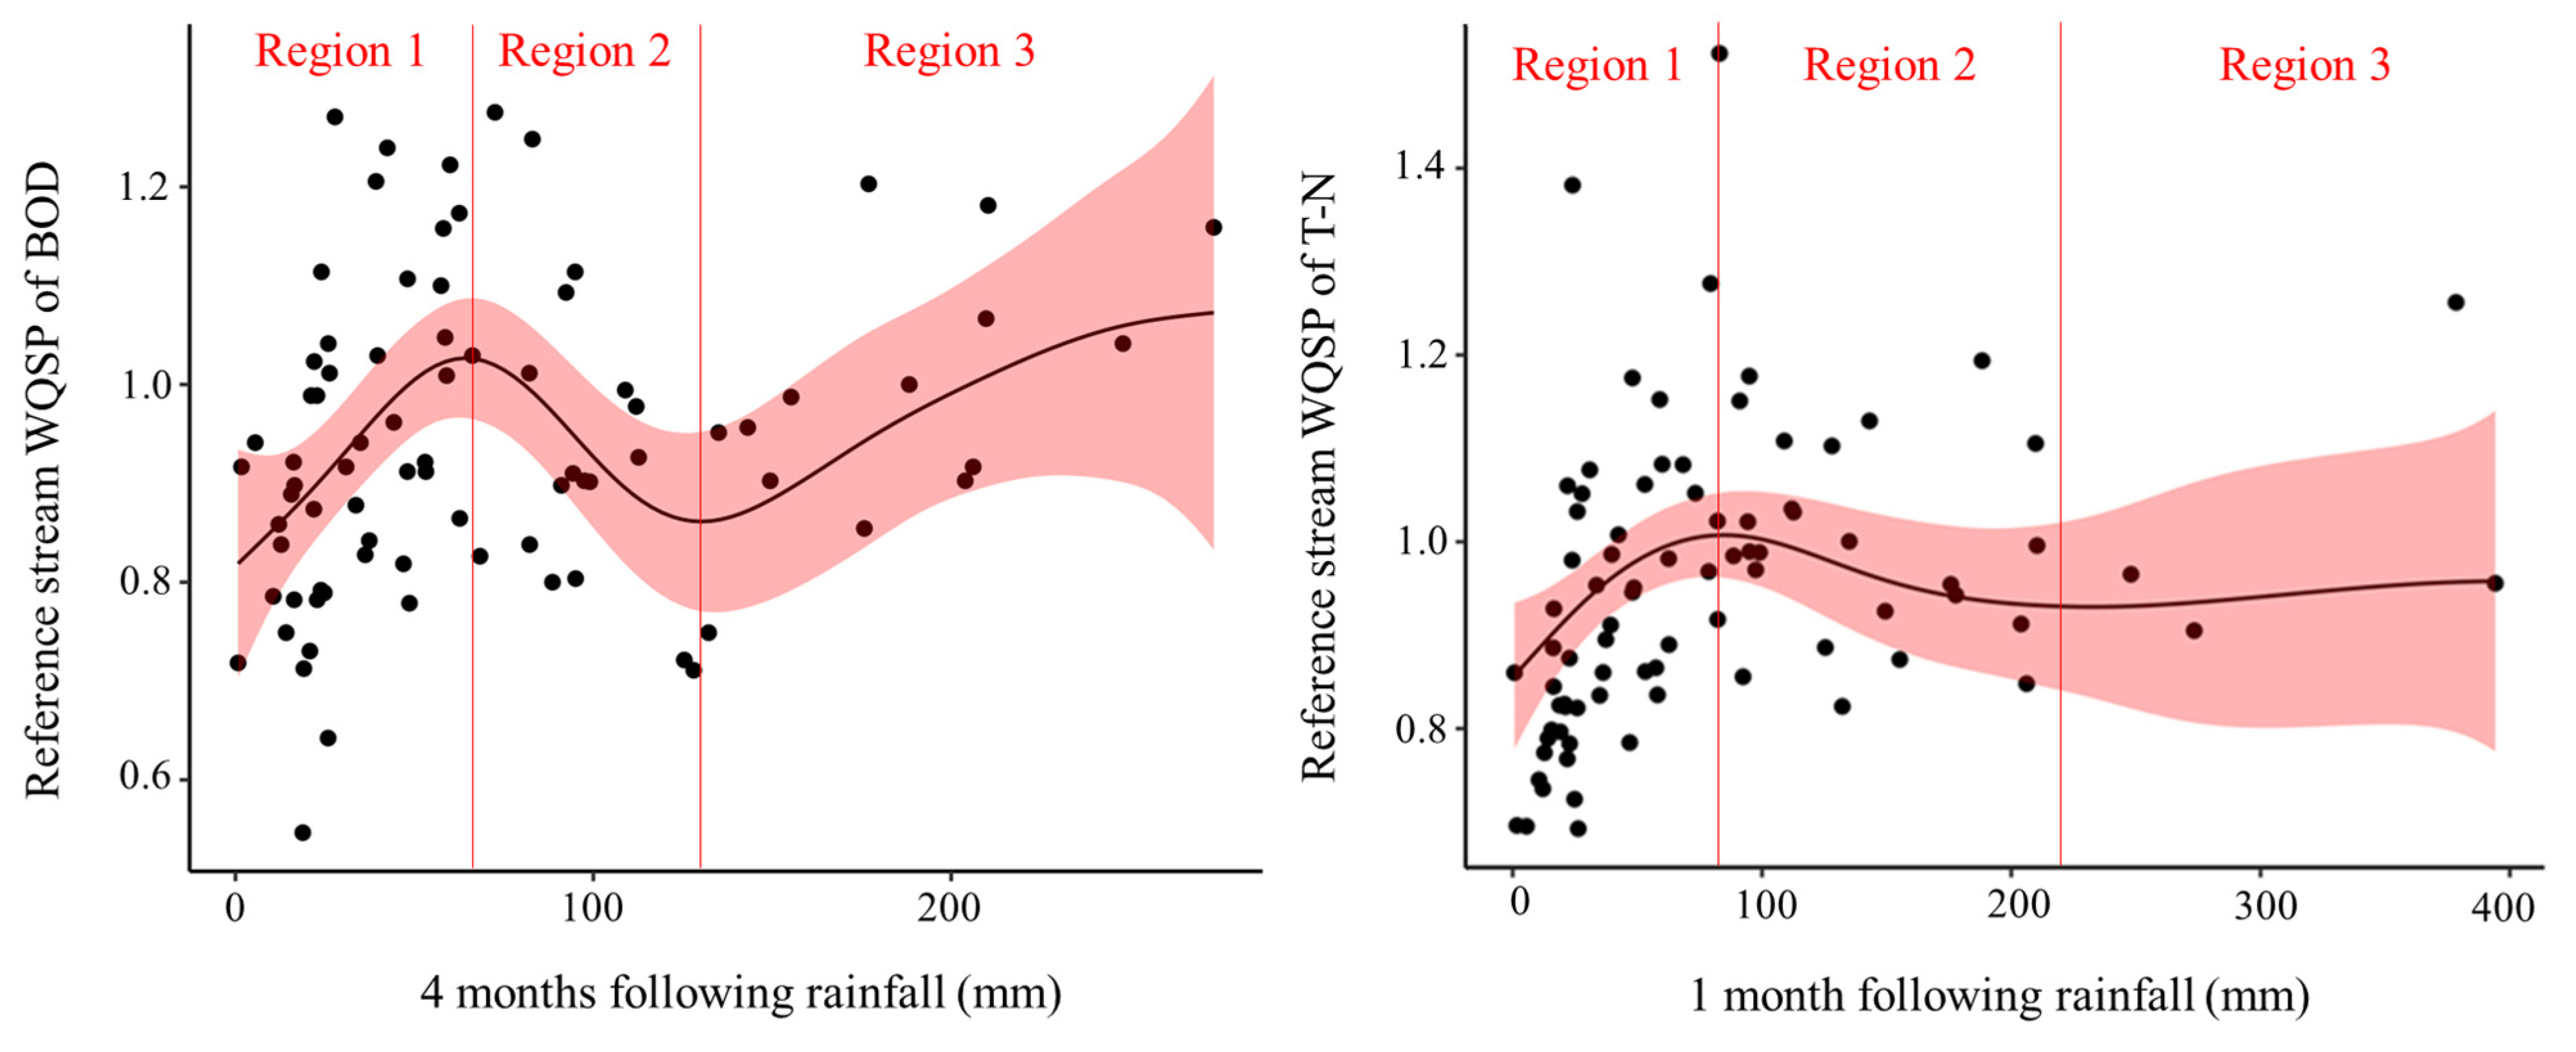
4.1. Nonlinearity of WQSP for Reference and Impaired Streams

In the BOD and T-N of the reference streams and the T-N of the impaired streams, the relationship between the following rainfall and WQSP is generally nonlinear, and the smooth function for nonlinearity can be divided into three regions (Figure 7). Regions 1 and 3 showed a positive relationship with rainfall in this study, and Region 2 showed a negative relationship. The positive relationship between rainfall and WQSP in Region 1 seemed to be because the concentrations of BOD and T-N in the dry season remained high, but the effect of pollutant dilution due to rainfall was shown [25]. Kang et al. [26] showed similar results: the high water quality during the dry season decreased due to precipitation and runoff. However, for the BOD and T-N of the streams in Region 2, rainfall and WQSP showed a negative relationship, which is thought to be because nonpoint pollution from the watershed flows into the stream along with runoff due to the increased rainfall. According to Won et al. [27], since forests have a high soil penetration ability, runoff does not occur with low rainfall levels, and rainfall runoff increases as precipitation increases. Lee and Lee [28] also confirmed that T-N can be absorbed into the soil; thus, runoff containing T-N does not occur until a rainfall of 50 mm is reached. Therefore, in Region 2, where rainfall increased due to the absorption characteristics of T-N and the permeability of the forest area of the reference streams, the inflow of nonpoint pollution increased, showing a negative relationship.

4.2. Robustness Comparison of Reference and Impaired Streams

To compare the robustness and rapidity of the reference and impaired streams, the relationships between rainfall and WQSP, variability, and recovery period were examined, and it was determined that the impaired streams had lower resilience. The difference in resilience between the reference and impaired streams concerning rainfall was considered to be due to the permeability and runoff of the watershed, according to its land cover. To identify the difference in the land cover between the reference and impaired streams, a t-test was conducted on the land cover proportions within a 1 km buffer of the reference and impaired streams (Table 5). The reference streams had the highest proportion of forest area, and the impaired streams had the most urban area. As a result of the t-test, a difference in land cover was found for urban, forest, and grassy areas for the reference and impaired streams.
This difference in land cover affects the permeability of the soil and the rainfall–runoff and runoff rate [29,30,31,32]. Urban areas are highly impermeable and respond more quickly to rainfall due to the low penetration of rainfall, resulting in massive amounts of runoff into streams [33,34,35]. By modeling watershed imperviousness, runoff, and peak discharge, Huang et al. [36] and Braud et al. [37] confirmed that the higher the impermeability is, the faster the peak discharge is reached and the greater the amount of runoff. In addition, it was confirmed that a large amount of runoff from rainfall dilutes the T-N, T-P, BOD, and COD concentrations of streams that maintain high levels during the dry season [26]. Therefore, the impaired streams have a high land cover in the urban area, so there is a large outflow at once during rainfall, and this outflow water quickly dilutes the stream concentration, which is judged to have a large and steep increase in the WQSP of the impaired streams.
However, in the dry season after rainfall, the water quality is polluted due to nonpoint pollution continuously flowing out from the urban and agricultural areas around the streams, and the WQSP of the impaired streams, which increased during rainfall, drops sharply and is judged to have a high fluctuation range [33,38]. Additionally, impaired streams have a short time lag for rainfall because they are near highly impermeable urban areas, and it takes very little time for runoff to reach these streams [31,32]. On the other hand, in the case of the reference streams, the water permeability and penetration rate are high due to the forest cover that is dominant in the area, so the peak flow is alleviated such that the increase in WQSP for rainfall is relatively low and the time lag is longer than that for the impaired streams [39,40]. Additionally, since the proportions of urban and agricultural areas are small, the inflow of nonpoint pollution in the dry season is less than that of impaired streams, so the fluctuation range of WQSP is not large [41,42].

5. Conclusions

To compare the sensitivity and stability of resilience according to the aquatic ecological condition of the stream ecosystem in the Han River watershed, this study identified the rapidity and robustness of the BOD, T-N, and T-P WQSP of reference and impaired streams. The rapidity and robustness of the reference and impaired streams were derived from the time lag for rainfall and the rainfall period, showing a significant relationship between WQSP variability and the recovery period. The findings of this study suggested that the reference streams were less sensitive to rainfall than the impaired streams and provided a more stable ecosystem and, thus, had better resilience. Our research has elucidated that reference streams exhibit markedly lower sensitivity to rainfall variability when compared to their impaired counterparts, resulting in enhanced ecosystem stability and resilience. The diminished resilience of impaired streams calls for strategic management interventions to mitigate their heightened vulnerability to precipitation and reinforce their structural and ecological integrity. Particularly, impaired streams exhibit heightened fluctuations in resilience attributed to urban runoff, displaying swift responses to rainfall; this necessitates measures to mitigate rapid runoff and nonpoint pollution inflow into streams. Proactive strategies, including the establishment of robust waterside vegetation, the creation of small-scale wetlands, and the integration of retention ponds, are recommended to bolster the resilience of these streams. The findings of this study furnish foundational insights for the formulation of comprehensive management plans. However, there is a limitation in that flow data and soil permeability data that can confirm the dilution effect by rainfall are lacking, so further analysis of changes in WQSP considering the flow rate and geological effect is required.

Author Contributions

Conceptualization: Y.P., J.L. and S.-W.L. Data curation and software: Y.P. Formal analysis and writing—original draft: Y.P. Writing—review and editing: Y.P., J.L., S.-R.P. and S.-W.L. All authors have read and agreed to the published version of the manuscript.

Funding

This study received no external funding.

Data Availability Statement

Data will be made available on request.

Acknowledgments

This study was supported by Konkuk University in 2022.

Conflicts of Interest

The authors declare no conflict of interest.

References

  1. An, Z.; Wu, G.; Li, J.; Sun, Y.; Liu, Y.; Zhou, W.; Cai, Y.; Duan, A.; Li, L.; Mao, J. Global monsoon dynamics and climate change. Annu. Rev. Earth Planet. Sci. 2015, 43, 29–77. [Google Scholar] [CrossRef]
  2. Lee, J.J.; Kim, Y.J. Analysis of flow duration characteristics due to environmental change in Korea river basin. J. Korean Soc. Hazard. Mitig. 2011, 11, 67–75. [Google Scholar] [CrossRef]
  3. Kim, J.S.; Park, S.Y.; Hong, H.P.; Chen, J.; Choi, S.J.; Kim, T.W.; Lee, J.H. Drought risk assessment for future climate projections in the Nakdong River Basin, Korea. Int. J. Climatol. 2020, 40, 4528–4540. [Google Scholar] [CrossRef]
  4. Matthews, W.J.; Marsh-Matthews, E. Effects of drought on fish across axes of space, time and ecological complexity. Freshw. Biol. 2003, 48, 1232–1253. [Google Scholar] [CrossRef]
  5. Wilkinson, C.L.; Yeo, D.C.; Tan, H.H.; Hadi Fikri, A.; Ewers, R.M. Resilience of tropical, freshwater fish (Nematabramis everetti) populations to severe drought over a land-use gradient in Borneo. Environ. Res. Lett. 2019, 14, 045008. [Google Scholar] [CrossRef]
  6. Ching, Y.C.; Lee, Y.H.; Toriman, M.E.; Abdullah, M.; Yatim, B.B. Effect of the big flood events on the water quality of the Muar River, Malaysia. Sustain. Water Resour. Manag. 2015, 1, 97–110. [Google Scholar] [CrossRef]
  7. Son, M.W. Influences of An Extreme Flood on Habitual Environment of Aquatic Ecosystem of Urban Stream. J. Korean Assoc. Reg. Geogr. 2008, 14, 105–113. [Google Scholar]
  8. Ministry of Environment (MOE). Aquatic Ecosystem Reference Stream Suitability Assurance and Utilization Research; Korean Literature; Ministry of Environment: Incheon, Republic of Korea, 2016.
  9. Folke, C. Resilience: The emergence of a perspective for social-ecological systems analyses. Glob. Environ. Chang. 2006, 16, 253–267. [Google Scholar] [CrossRef]
  10. Holling, C.S. Resilience and stability of ecological systems. Annu. Rev. Ecol. Evol. Syst. 1973, 4, 1–23. [Google Scholar] [CrossRef]
  11. Timmerman, P. Vulnerability, Resilience, and the Collapse of Society. In Environmental Monograph 1; Institute for Environmental Studies, Toronto University: Toronto, ON, Canada, 1981. [Google Scholar]
  12. Korea Research Institute for Human Settlements (KRIHS). Research on Regional Resilience Improvement Coping with Flooding Disaster by Climate Change Effect (I) -Development and Application of Resilience Assessment Methods-; Korean Literature; Korea Research Institute for Human Settlements: Seojong, Republic of Korea, 2016.
  13. Korea Land and Housing Corporation (LH). A Research on Urban Resilience for Urbam Regeneration; Korean Literature; Land and Housing Institute: Jinju, Republic of Korea, 2015.
  14. Kang, S.J.; Jo, S.H.; Hong, S.Y. A Policy Implication for Community Resilience from Natural Disasters; Gyeonggi Research Institute: Suwon, Republic of Korea, 2013. [Google Scholar]
  15. Tran, H.T.; Balchanos, M.; Domerçant, J.C.; Mavris, D.N. A framework for the quantitative assessment of performance-based system resilience. Reliab. Eng. Syst. Saf. 2017, 158, 73–84. [Google Scholar] [CrossRef]
  16. Vasistha, P.; Ganguly, R. Water quality assessment of natural lakes and its importance: An overview. Mater. Today Proc. 2020, 32, 544–552. [Google Scholar] [CrossRef]
  17. Wang, F.; Wang, Y.; Zhang, K.; Hu, M.; Weng, Q.; Zhang, H. Spatial heterogeneity modeling of water quality based on random forest regression and model interpretation. Environ. Res. 2021, 202, 111660. [Google Scholar] [CrossRef] [PubMed]
  18. Ministry of Environment (MOE); National Institute of Environmental Research (NIER). Waterwide Aquatic Ecological Monitoring Program (V); Korean Literature; Ministry of Environment and National Institute of Environmental Research: Incheon, Republic of Korea, 2012.
  19. National Institute of Environment Research (NIER). A Study on Reference Stream Criteria Enhancing the Applicability of River Ecosystem Health Assessment; Korean Literature; National Institute of Environmental Research: Incheon, Republic of Korea, 2015.
  20. Hashimoto, T.; Stedinger, J.R.; Loucks, D.P. Reliability, resiliency, and vulnerability criteria for water resource system performance evaluation. Water Resour. Res. 1982, 18, 14–20. [Google Scholar] [CrossRef]
  21. Simonovic, S.P.; Peck, A. Dynamic resilience to climate change caused natural disasters in coastal megacities quantification framework. Int. J. Environ. Clim. Chang. 2013, 3, 378–401. [Google Scholar] [CrossRef] [PubMed]
  22. Lee, J.H. Stream Engineering; Korean Literature; Goomiseokwan: Seoul, Republic of Korea, 2018. [Google Scholar]
  23. Choi, Y.; Kim, Y.; Kim, S.; Kim, M. Management of Ponding Depth and Discharge Filtration from Paddy Fields for Controlling Nonpoint Source Pollution. J. Korean Soc. Agric. Eng. 2015, 57, 125–130. [Google Scholar]
  24. Park, S.M.; Shin, Y.K. The Impact of Monsoon Rainfall on the Water Quality in the Upstream Watershed of Southern Han River. Korean J. Ecol. Environ. 2011, 44, 373–384. [Google Scholar]
  25. Song, I.-H.; Kang, M.-S.; Hwang, S.-H.; Song, J.-H. Characteristics and EMCs of NPS pollutants runoff from a forest-paddy composite watershed. J. Korean Soc. Agric. Eng. 2012, 54, 9–17. [Google Scholar] [CrossRef]
  26. Kang, S.; An, K. Spatio-temporal variation analysis of physico-chemical water quality in the Yeongsan-river watershed. J. Ecol. Environ. 2006, 39, 73–84. [Google Scholar]
  27. Won, C.; Choi, Y.; Seo, J.; Kim, K.; Shin, M.; Choi, J. Determination of EMC and unit loading of rainfall runoff from forestry-crops field. J. Korean Soc. Water Environ. 2009, 25, 615–623. Available online: https://www.koreascience.or.kr/article/JAKO200910103491724.page (accessed on 13 November 2023).
  28. Lee, M.; Young-shin, L. A study on runoff characteristics of nonpoint pollutant with rainfall intensity—A case of fowls manure. J. Wetl. Res. 2009, 11, 91–97. [Google Scholar]
  29. Liu, L.; You, X. Water quality assessment and contribution rates of main pollution sources in Baiyangdian Lake, northern China. Environ. Impact Assess. Rev. 2023, 98, 106965. [Google Scholar] [CrossRef]
  30. Sun, D.; Wang, X.; Yu, M.; Ouyang, Z.; Liu, G. Dynamic evolution and decoupling analysis of agricultural nonpoint source pollution in Taihu Lake Basin during the urbanization process. Environ. Impact Assess. Rev. 2023, 100, 107048. [Google Scholar] [CrossRef]
  31. Ten Veldhuis, J.A.E.; Skovgard Olsen, A. Hydrological response times in lowland urban catchments characterised by looped drainage systems. In Proceedings of the 9th International Workshop on Precipitation in Urban Areas: Urban Challenges in Rainfall Analysis, UrbanRain 2012, St Moritz, Switzerland, 6–9 December 2012. [Google Scholar]
  32. Walsh, C.J.; Roy, A.H.; Feminella, J.W.; Cottingham, P.D.; Groffman, P.M.; Morgan, R.P. The urban stream syndrome: Current knowledge and the search for a cure. J. N. Am. Benthol. Soc. 2005, 24, 706–723. [Google Scholar] [CrossRef]
  33. Miller, J.D.; Kim, H.; Kjeldsen, T.R.; Packman, J.; Grebby, S.; Dearden, R. Assessing the impact of urbanization on storm runoff in a peri-urban catchment using historical change in impervious cover. J. Hydrol. 2014, 515, 59–70. [Google Scholar] [CrossRef]
  34. McGrane, S.J. Impacts of urbanisation on hydrological and water quality dynamics, and urban water management: A review. Hydrol. Sci. J. 2016, 61, 2295–2311. [Google Scholar] [CrossRef]
  35. Orta-Ortiz, M.S.; Geneletti, D. What variables matter when designing nature-based solutions for stormwater management? A review of impacts on ecosystem services. Environ. Impact Assess. Rev. 2022, 95, 106802. [Google Scholar] [CrossRef]
  36. Huang, H.; Cheng, S.; Wen, J.; Lee, J. Effect of growing watershed imperviousness on hydrograph parameters and peak discharge. Hydrol. Process. 2008, 22, 2075–2085. [Google Scholar] [CrossRef]
  37. Braud, I.; Breil, P.; Thollet, F.; Lagouy, M.; Branger, F.; Jacqueminet, C.; Kermadi, S.; Michel, K. Evidence of the impact of urbanization on the hydrological regime of a medium-sized periurban catchment in France. J. Hydrol. 2013, 485, 5–23. [Google Scholar] [CrossRef]
  38. Lee, S.-H.; Bae, S.-K. Long-term trend of groundwater recharge according to urbanization. J. Environ. Sci. 2010, 19, 779–785. [Google Scholar] [CrossRef]
  39. Burges, S.J.; Wigmosta, M.S.; Meena, J.M. Hydrological effects of land-use change in a zero-order catchment. J. Hydrol. Eng. 1998, 3, 86–97. [Google Scholar] [CrossRef]
  40. Hümann, M.; Schüler, G.; Müller, C.; Schneider, R.; Johst, M.; Caspari, T. Identification of runoff processes—The impact of different forest types and soil properties on runoff formation and floods. J. Hydrol. 2011, 409, 637–649. [Google Scholar] [CrossRef]
  41. Gang, D.H.; Na, J.H.; Park, I.H.; Kim, J.H.; Gwon, O.S.; Lee, S.J. Ecosystem service valuation of forests using sewage reservoir calculation equation. In Proceedings of the Korean Institute of Landscape Architecture Conference, Mokpo, Korea, 12–14 October 2016. [Google Scholar]
  42. Neary, D.G.; Ice, G.G.; Jackson, C.R. Linkages between forest soils and water quality and quantity. For. Ecol. Manag. 2009, 258, 2269–2281. [Google Scholar] [CrossRef]
Figure 1. Han River watershed, land use classification, monitoring sites of reference, and impaired streams of the National Aquatic Ecological Monitoring Program in Republic of Korea.
Land 12 02072 g001
Figure 2. Change in the system performance after a disturbance. (a), the blue line represents a system performance with high robustness, characterized by a short recovery period and high resilience; (b), the red line represents a system performance with low robustness, featuring a long recovery period and low resilience.
Land 12 02072 g002
Figure 3. Flow diagram of the analytic framework.
Land 12 02072 g003
Figure 4. Graphs averaging the sum of monthly precipitation value and the WQSP change for reference and impaired streams. (a) BOD; (b) T-N; and (c) T-P.
Land 12 02072 g004
Figure 5. Smooth functions of the relationship between WQSP of reference streams and rainfalls which have a significant relationship: (a) WQSP of reference streams for BOD in relation to four months following rainfall; (b) WQSP of reference streams for T-N in relation to original rainfall and one month following rainfall; and (c) WQSP of reference streams for T-P in relation to original rainfall and four to five months following rainfall. The dot represents the water quality system performance value, and the red area represents the confidence interval.
Land 12 02072 g005
Figure 6. Smooth functions of the relationship between WQSP of impaired streams and rainfalls which have a significant relationship: (a) WQSP of impaired streams for BOD in relation to one to three months following rainfall; and (b) WQSP of reference streams for T-N in relation to original rainfall and one to two months following rainfall. The dot represents the water quality system performance value, and the red area represents the confidence interval.
Land 12 02072 g006
Figure 7. Smooth functions and classification regions by smooth function patterns. Smooth functions of the relationship between the WQSP of reference streams for BOD and four months following rainfall (left); smooth functions of the relationship between the WQSP of reference streams for T-N and one month following rainfall (right). The dot represents the system performance value, and the red area represents the confidence interval.
Land 12 02072 g007
Table 1. LM and GAM analysis results of the WQSP for BOD, T-N, and T-P in the reference streams. The independent variables satisfied LM’s low variance inflation factor (VIF) condition.
Analysis Results of
Reference Streams
VariablesPerformance
PP1P2P3P4P5ConstantR2AICBIC
BODLM Coefficientsb0.0003−0.00020.0003−0.00010.00040.00030.8410.12−67.1−47.9
β0.19−0.090.16−0.010.170.19-
T-value1.52−0.71.2−0.041.211.3920.39 **
GAMF-value2.511.472.810.233.18 **3.50.94 **0.23−78.3−47.1
EDF1.181114.691
T-NLM Coefficientsb0.00070.000030.00010.00010.0001−0.00030.8930.12−67.1−47.9
β0.340.020.070.350.06−0.21-
T-value2.82 **0.140.590.290.49−1.7524.62 **
GAMF-value3.05 *2.59 *0.10.0010.291.570.94 **0.23−78.3−47.1
EDF2.453.471111
T-PLM Coefficientsb−0.001−0.001−0.0010.00010.0010.0021.130.4167.987.3
β−0.27−0.09−0.110.030.230.32-
T-value−2.79 **−0.94−1.140.282.26 *3.27 **12.10 **
GAMF-value5.72 *0.70.611.126.43 *13.12 **1.17 **0.4466.691.1
EDF1112.4811
* p < 0.05, ** p < 0.01. AIC, Akaike’s information criterion; BIC, Bayesian information criterion; EDF, expected default frequency. P means original rainfall, and P1 to P5 means 1 to 5 months following rainfall.
Table 2. LM and GAM analysis results of the WQSP for BOD, T-N, and T-P in the impaired streams. The independent variables satisfied LM’s low variance inflation factor (VIF) condition.
Analysis Results of
Impaired Streams
VariablesPerformance
PP1P2P3P4P5ConstantR2AICBIC
BODLMCoefficientsb0.00050.0010.0010.0030.0005−0.00010.8410.5335.454.5
β0.090.250.250.440.08−0.04-
T-value1.521.052.69 **2.67 **4.87 **0.85−0.37
GAMF-value2.511.169.65 **8.07 **27.23 **0.840.210.5634.560.5
EDF1.181.811112.051
T-NLMCoefficientsb0.0010.0010.00050.00030.0001−0.00020.8930.74−10.49−85.4
β0.440.390.20.110.05−0.1-
T-value2.82 **6.30 **5.41 **2.94 **1.660.67−1.48
GAMF-value3.05 *37.15 **28.40 **5.01 **2.130.421.230.73−104.3−80.9
EDF2.45111.59111.45
T-PLMCoefficientsb−0.00040.00020.0010.0010.0010.00041.130.04113.4132.9
β−0.080.040.170.120.10.07-
T-value−2.79 **−0.630.331.320.970.820.57
GAMF-value5.72 *0.430.21.940.890.660.170.05113.7135.4
EDF11.5511111
* p < 0.05, ** p < 0.01. AIC, Akaike’s information criterion; BIC, Bayesian information criterion; EDF, expected default frequency. P means original rainfall, and P1 to P5 means 1 to 5 months following rainfall.
Table 3. Robustness results include the WQSP fluctuation range and time lag for sensitivity comparison.
WQSP ClassificationFluctuation RangeTime Lag Results
LMGAM
BODReference0.473-4 months
Impaired1.0461 month1 month
T-NReference0.391No time lagNo time lag
Impaired0.676No time lagNo time lag
T-PReference1.2234 months4 months
Impaired0.842--
Table 4. Rapidity results include the recovery period and results of the rainfall period, which show a significant relationship for stability comparison.
WQSP ClassificationRecovery PeriodRainfall Period Showing a Significant
Relationship in Succession
LMGAM
BODReference11.14-1 month
Impaired13.53 months3 months
T-NReference11.431 month2 months
Impaired13.173 months3 months
T-PReference11.02 months2 months
Impaired11.43--
Table 5. t-test results for land cover of reference and impaired streams.
ClassificationAverageStandard Deviationt-Value
ReferenceImpairedReferenceImpaired
Urban area8.1449.378.2222.127.306 **
Agricultural area19.0220.1010.9520.780.195
Forest area55.3011.8519.0811.92−8.219 **
Grassy area3.256.933.433.533.278 **
Wetland3.651.164.861.70−2.013
Bare soil4.673.433.793.16−1.091
Water5.977.164.839.500.510
** p < 0.01.
Disclaimer/Publisher’s Note: The statements, opinions and data contained in all publications are solely those of the individual author(s) and contributor(s) and not of MDPI and/or the editor(s). MDPI and/or the editor(s) disclaim responsibility for any injury to people or property resulting from any ideas, methods, instructions or products referred to in the content.

