
Exploring the Spatial Heterogeneity of Rural Development in Laos Based on Rural Building Spatial Database

Abstract
:1. Introduction
2. Methodology
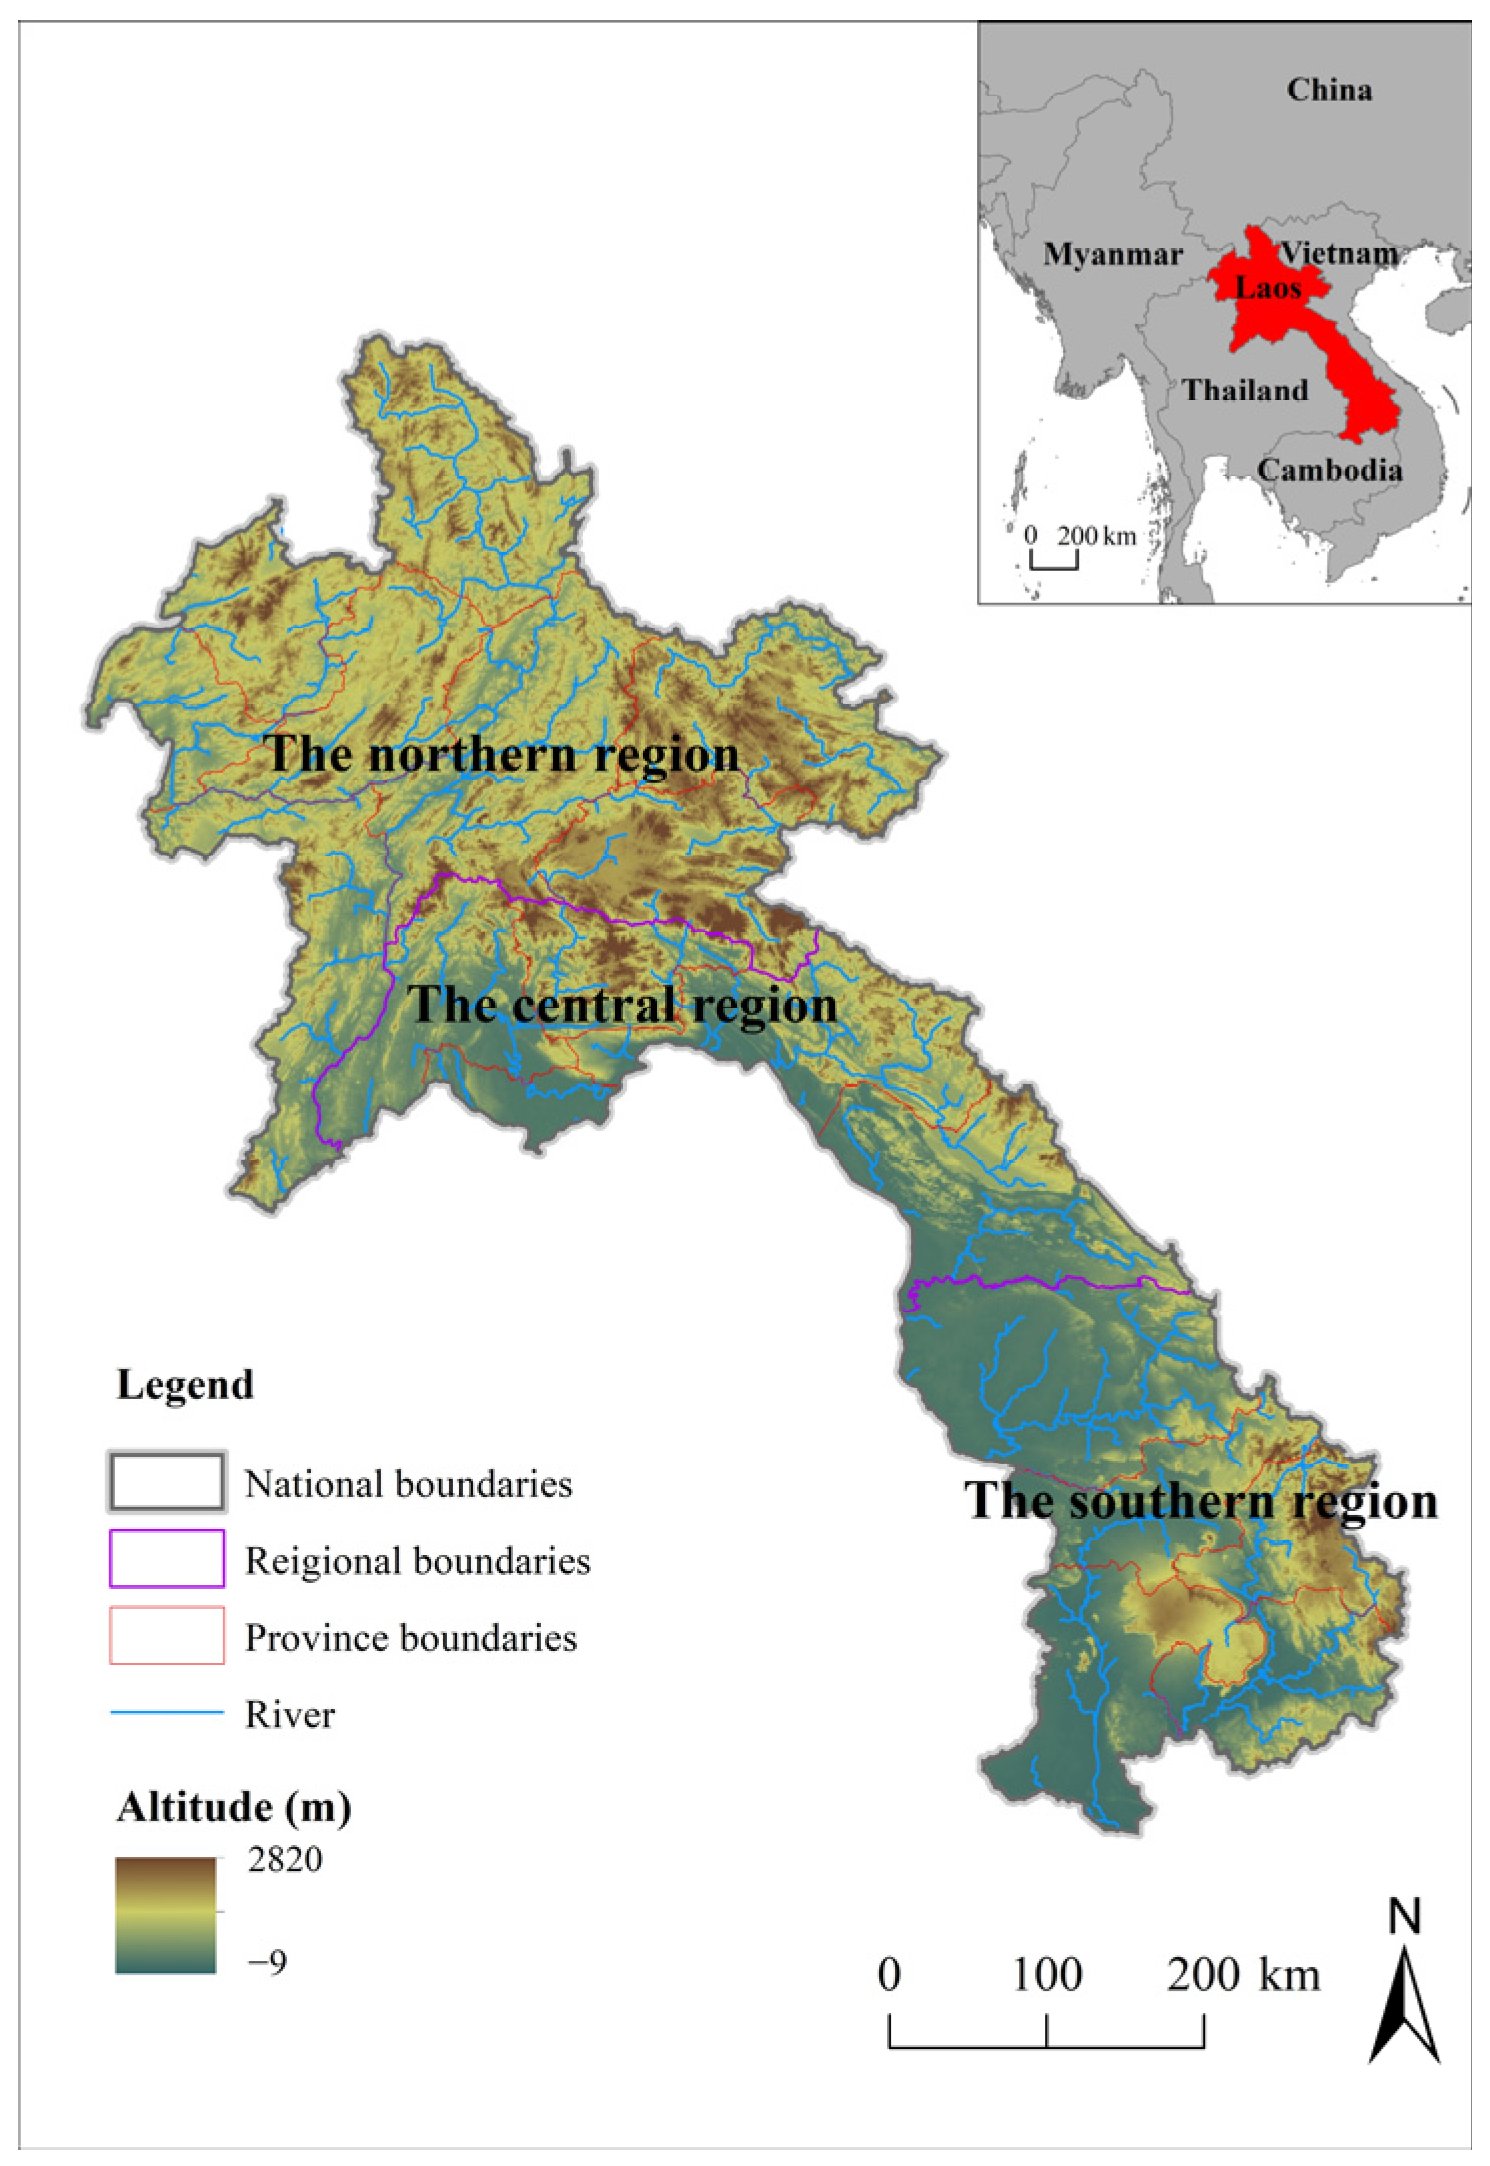
2.1. Study Data
2.2. Variables
2.3. Method
2.3.1. Getis-Ord Gi*
2.3.2. Geodetector
3. Results
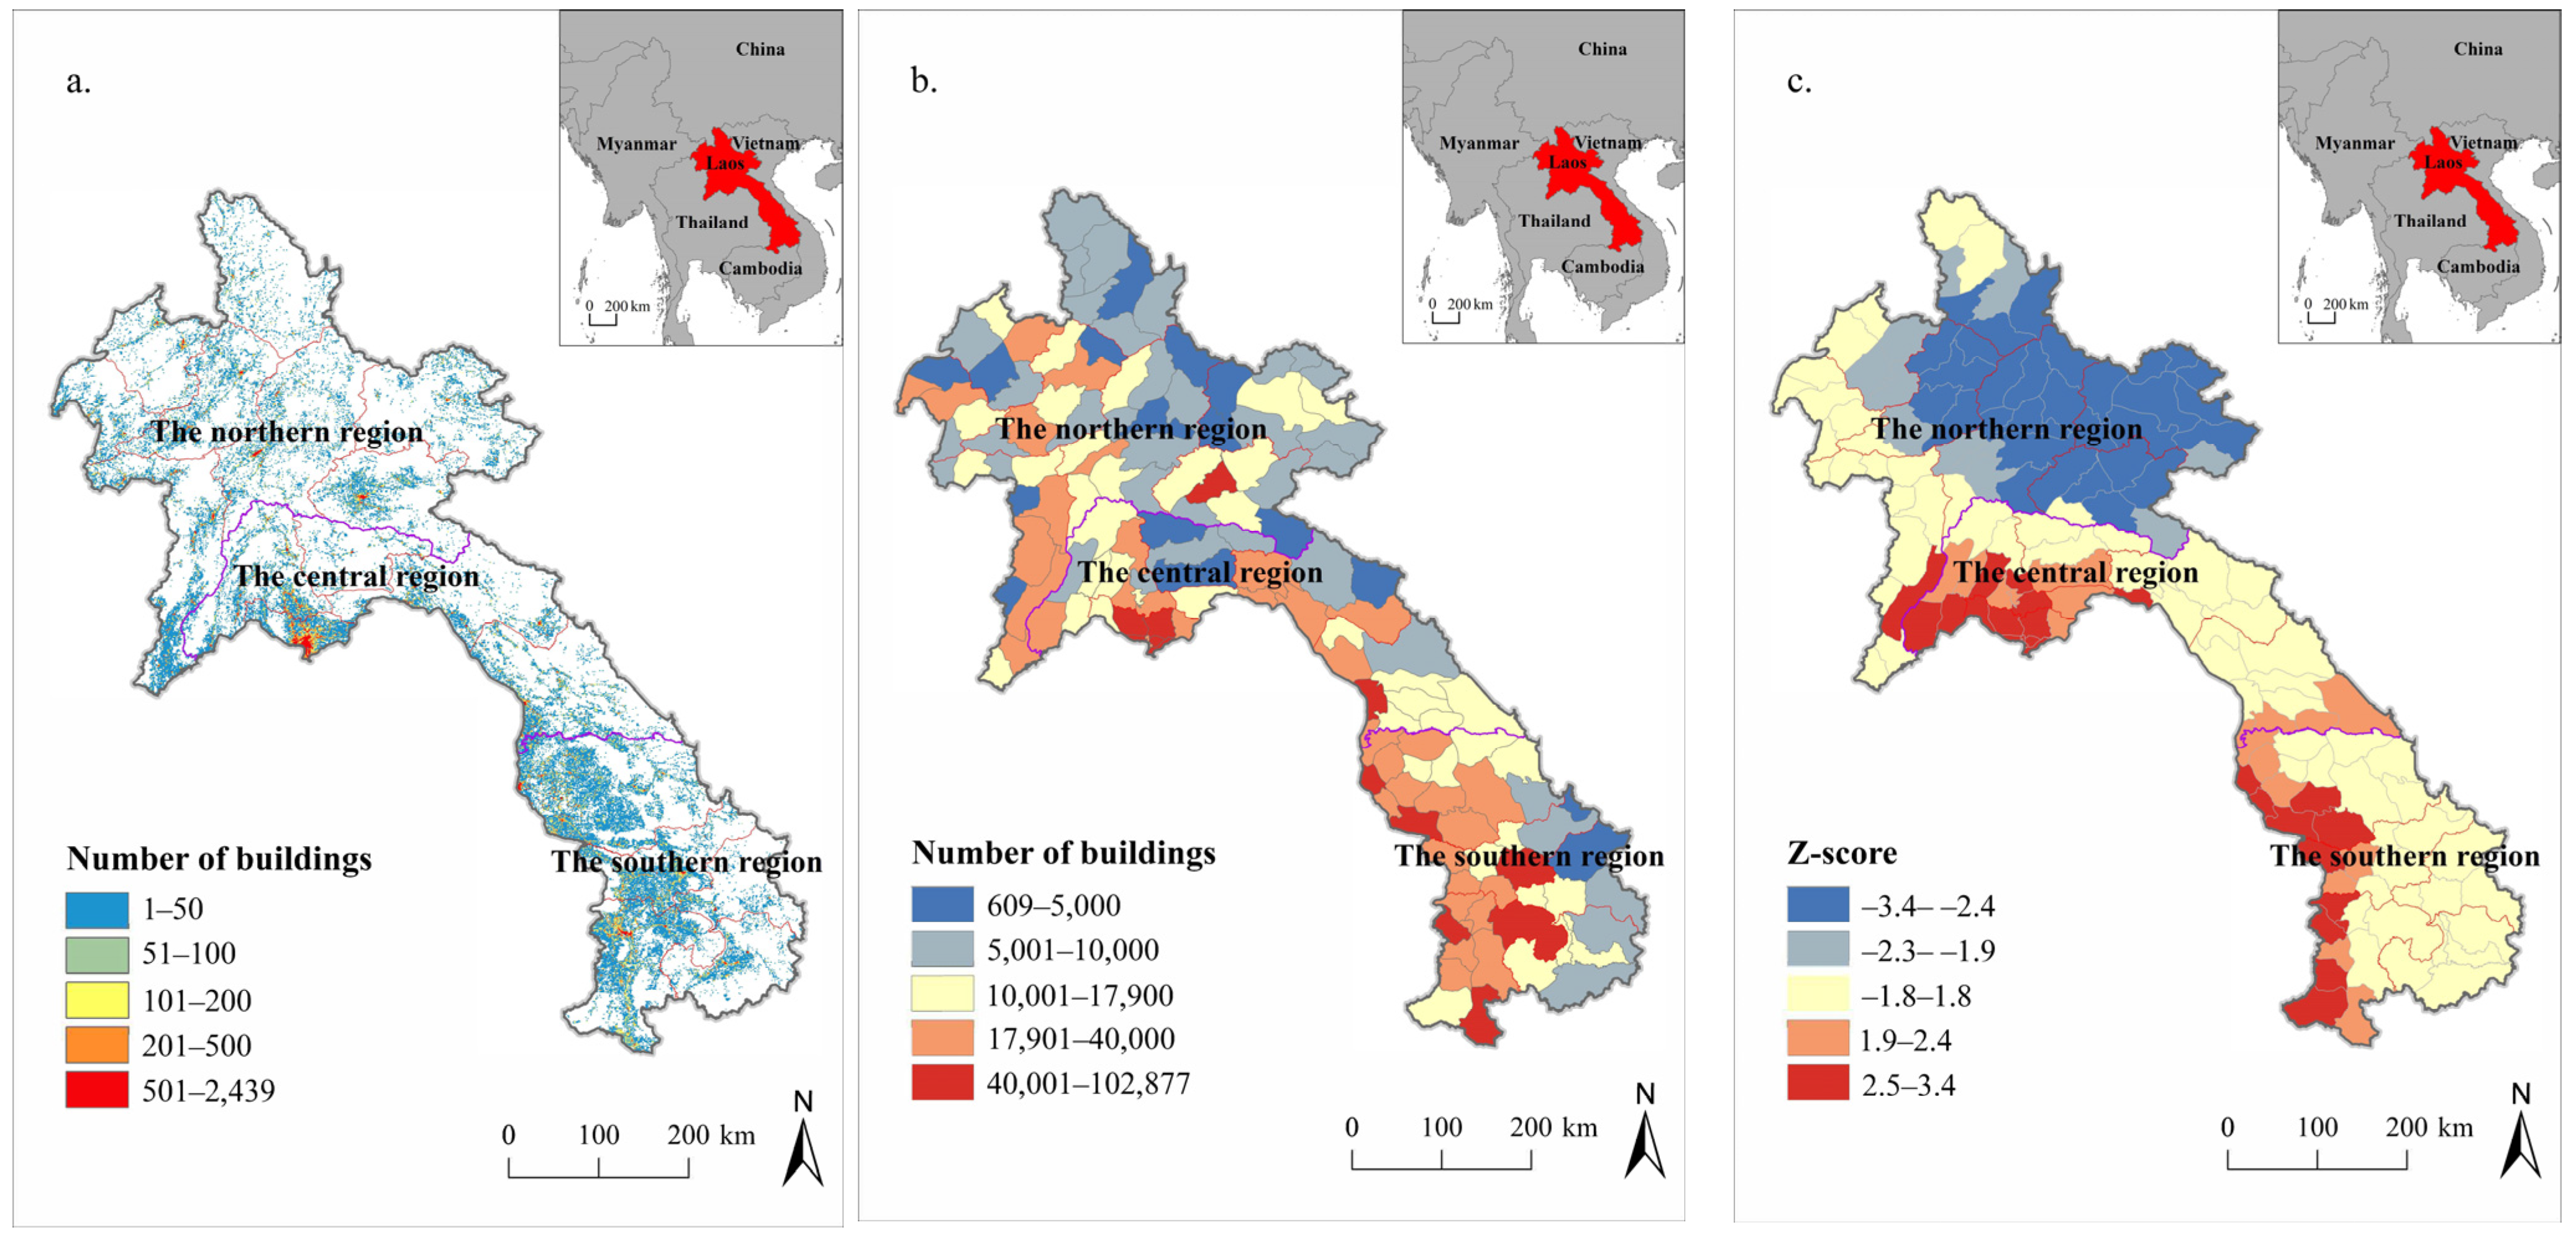
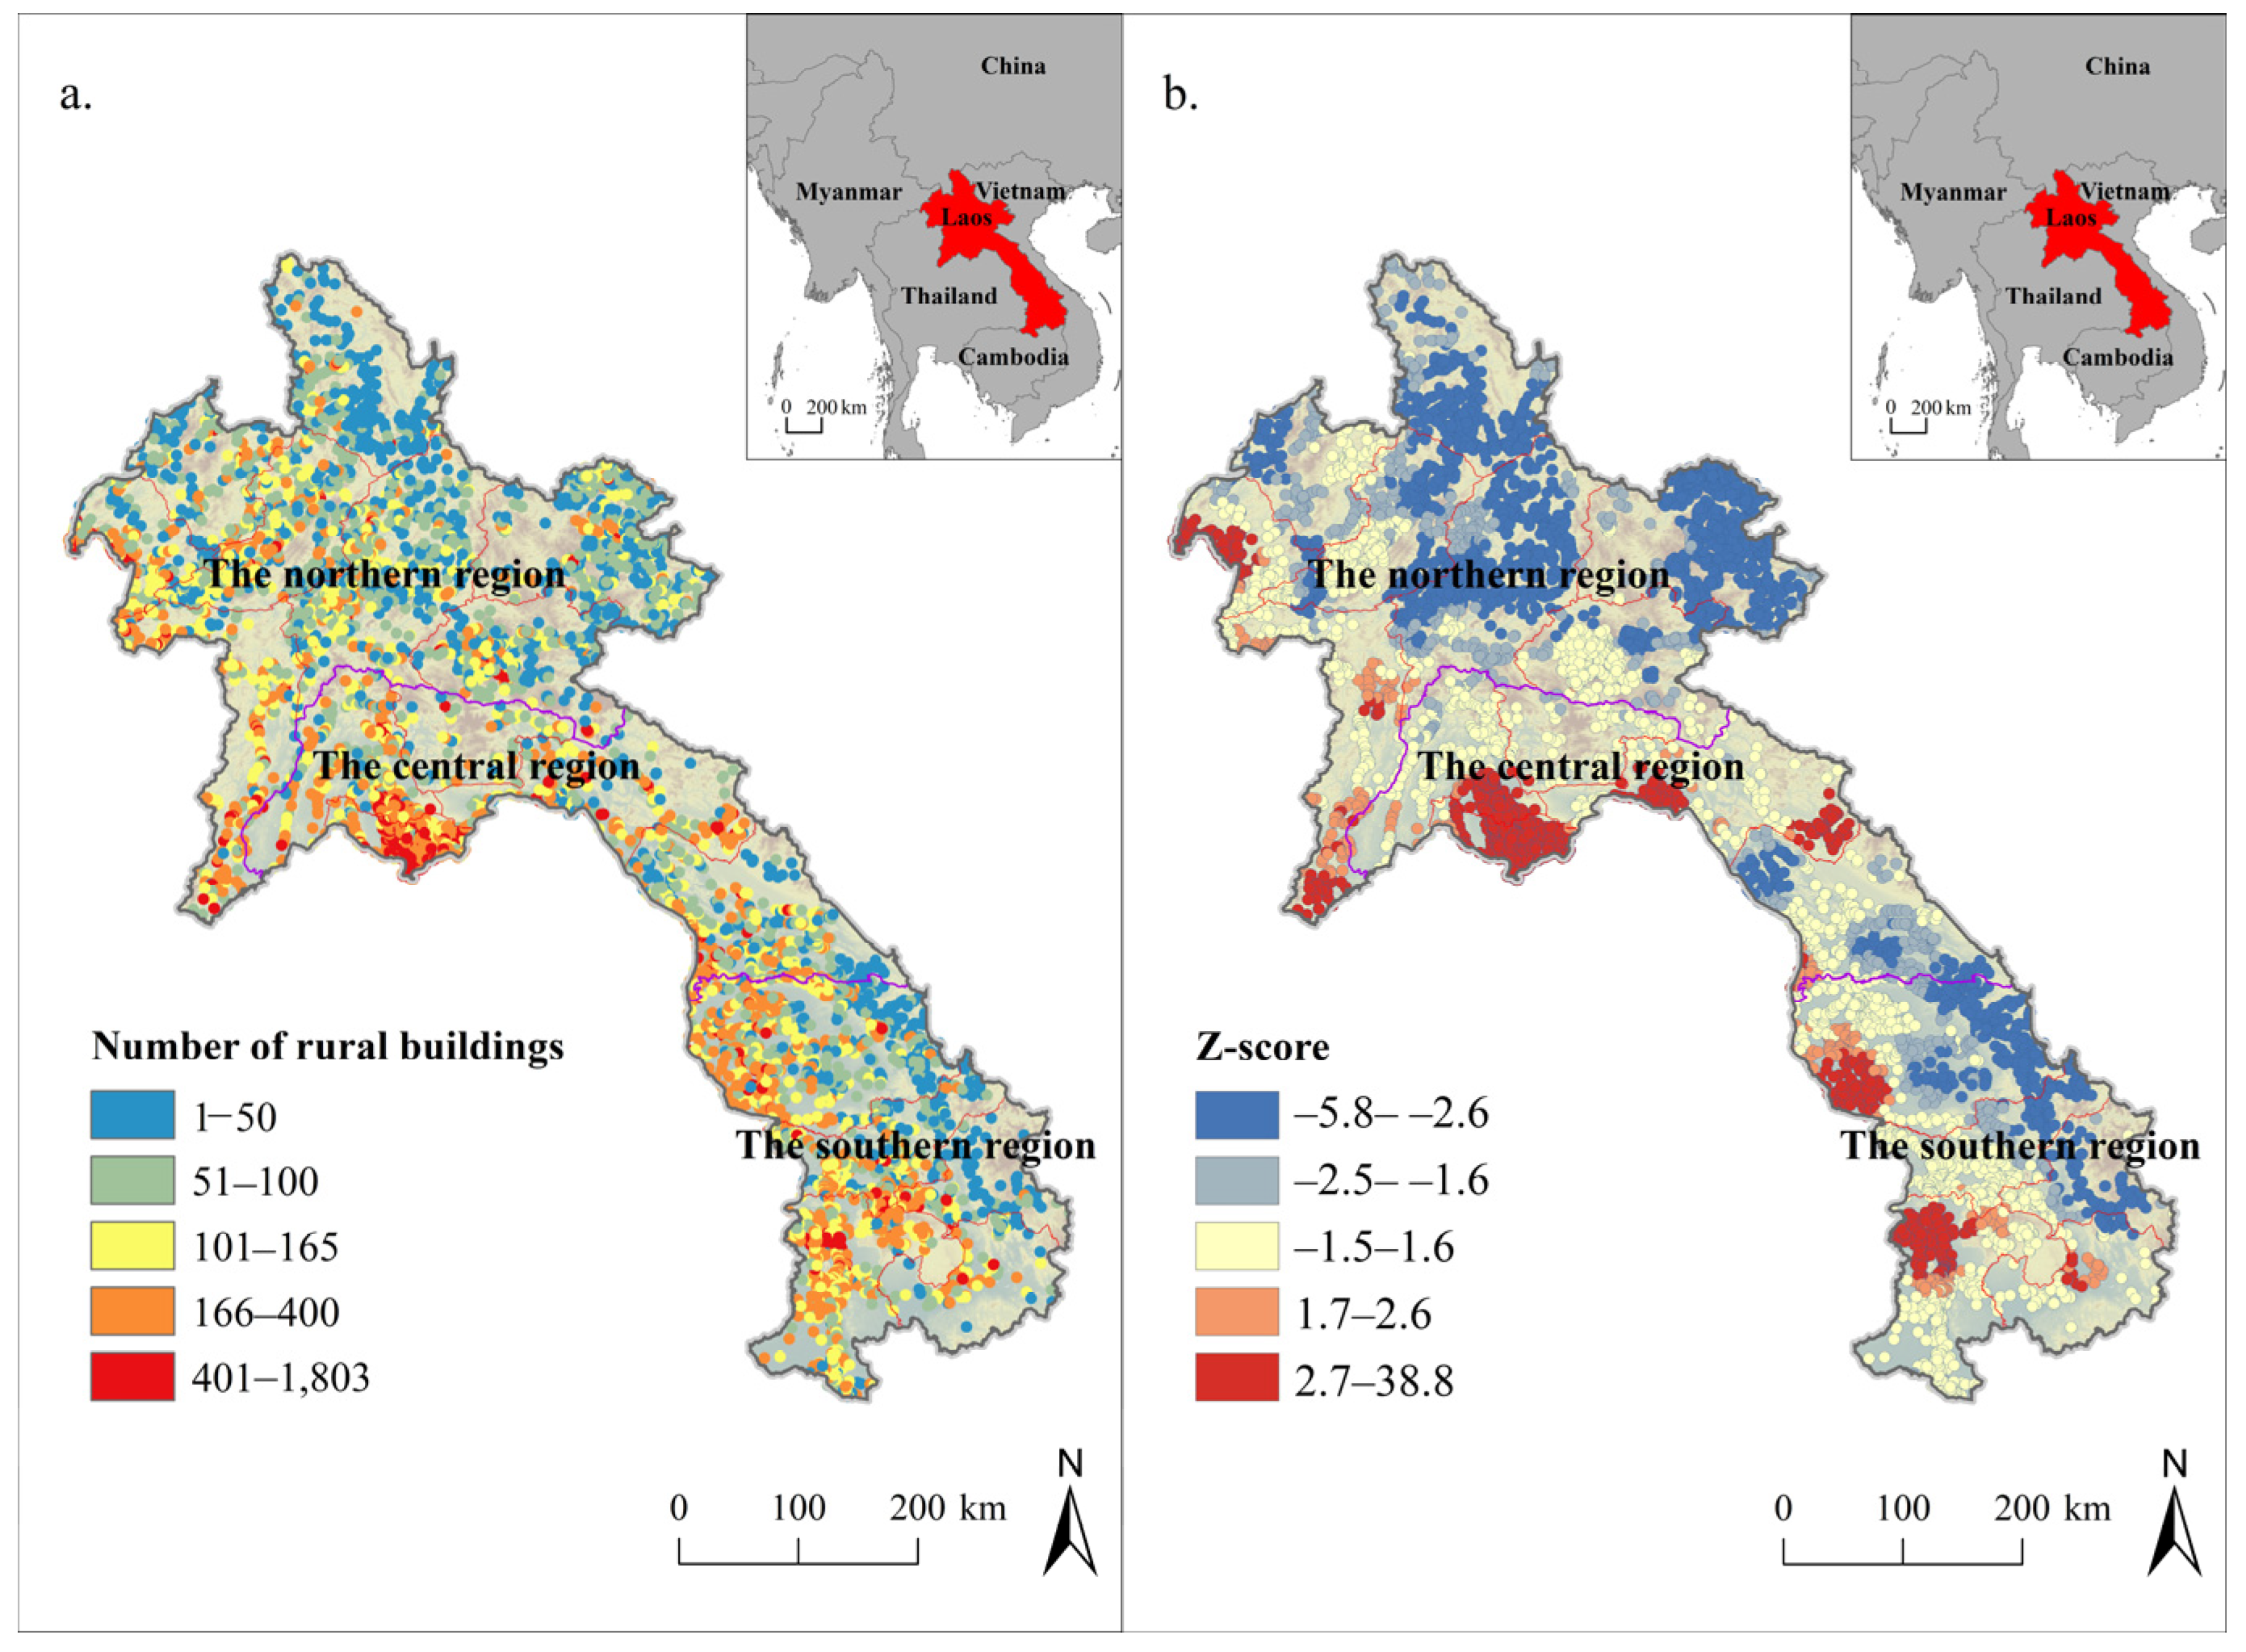
3.1. Results of Rural Buildings
3.2. Results of the Model
3.2.1. Results of the Factors
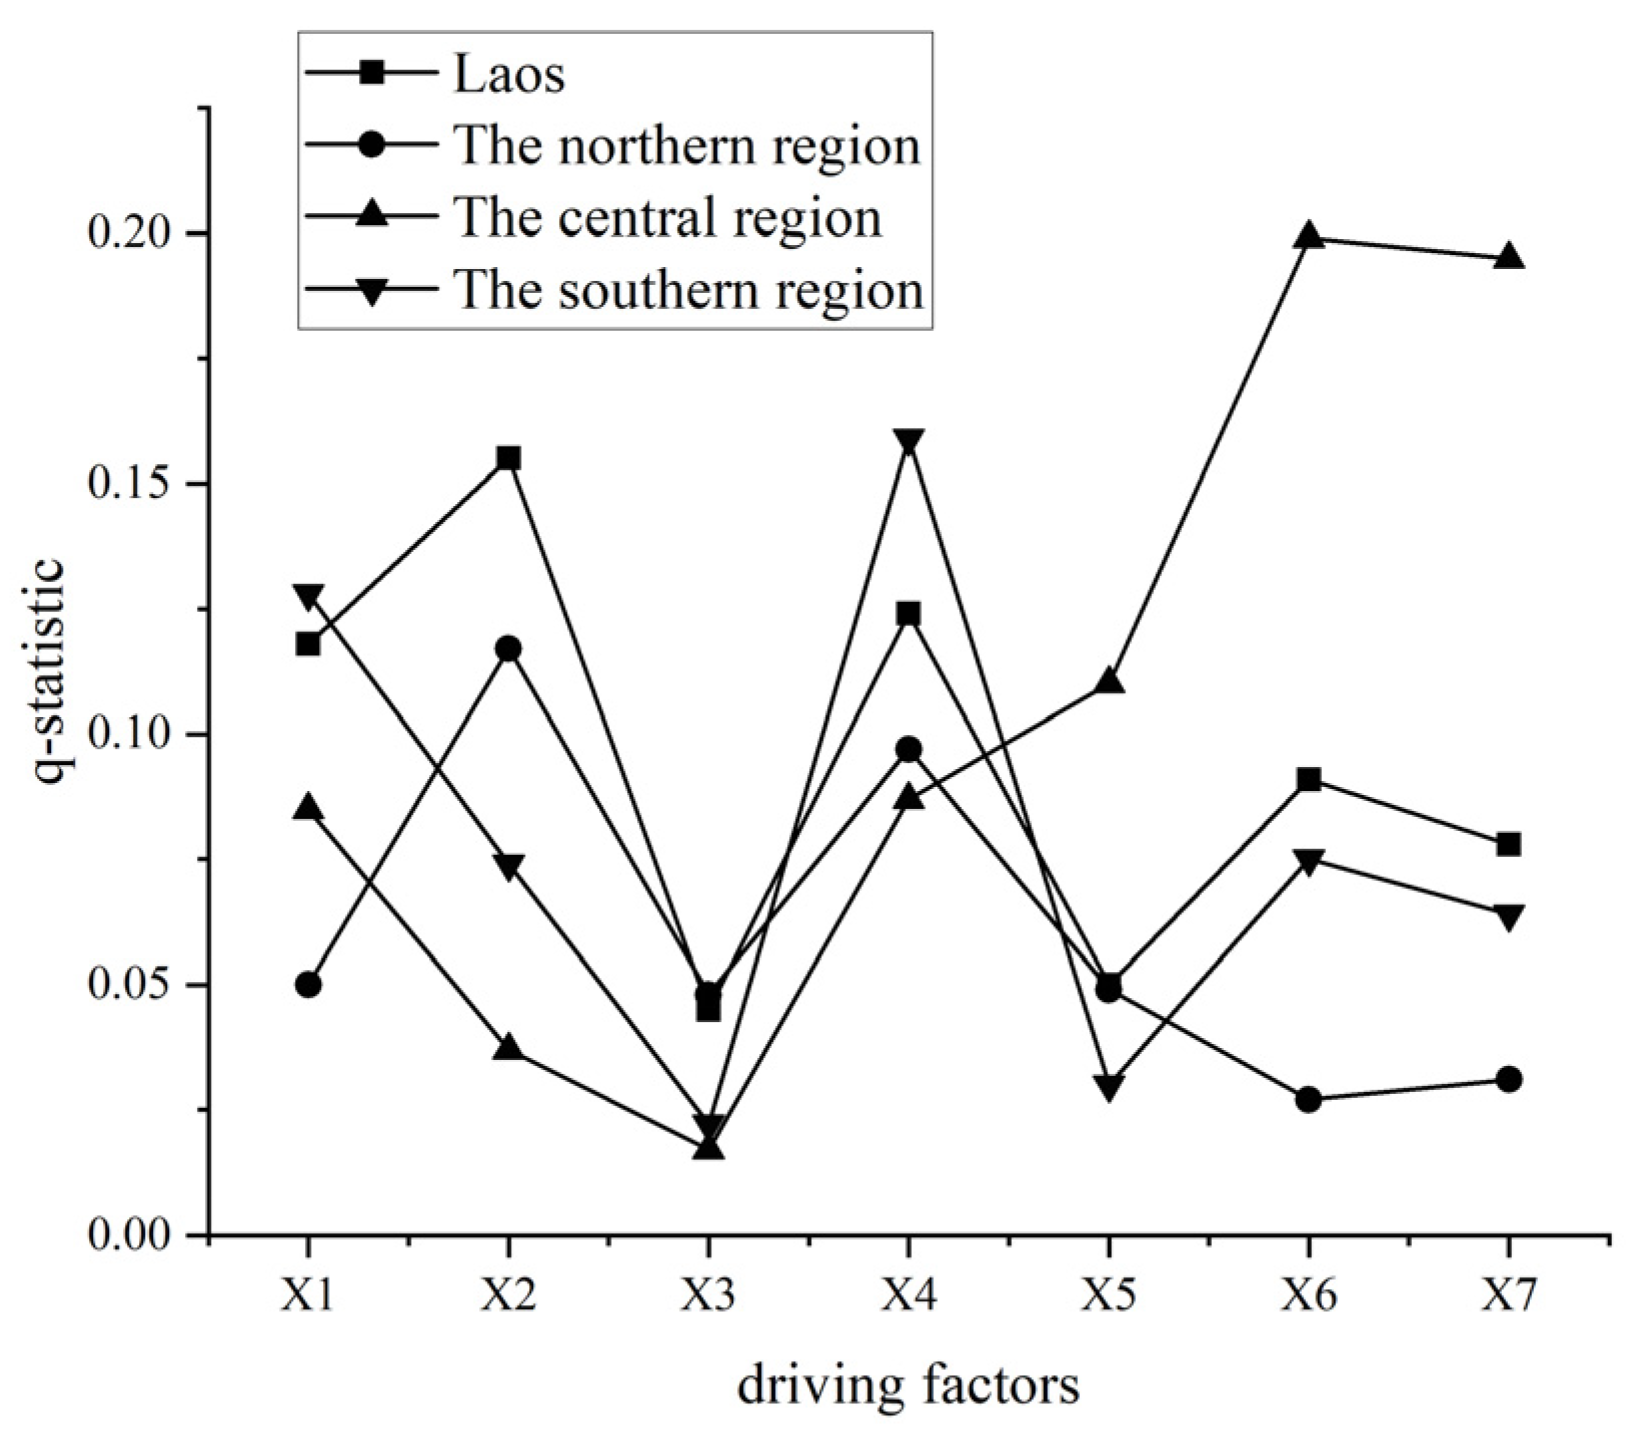
3.2.2. Results of the Driving Factors in Different Regions
3.2.3. Results of the Interaction
4. Discussion
5. Conclusions
Author Contributions
Funding
Data Availability Statement
Conflicts of Interest
| 1 | Data Sources: https://data.worldbank.org/indicator/SP.RUR.TOTL (accessed on 25 March 2023). |
| 2 | Data Sources: https://data.worldbank.org/ (accessed on 25 March 2023). |
| 3 | Data Sources: https://laos.opendevelopmentmekong.net/ (accessed on 6 March 2023). |
| 4 | Data Sources: https://www.openstreetmap.org/ (accessed on 18 March 2023). |
| 5 | Data Sources: https://srtm.csi.cgiar.org/srtmdata/ (accessed on 22 October 2022). |
| 6 | Data Sources: http://www.globallandcover.com/ (accessed on 17 October 2022). |
References
- Castañeda, A.; Doan, D.; Newhouse, D.; Nguyen, M.C.; Uematsu, H.; Azevedo, J.P. A new profile of the global poor. World Dev. 2018, 101, 250–267. [Google Scholar] [CrossRef]
- United Nations. Transforming Our World: The 2030 Agenda for Sustainable Development; United Nations: New York, NY, USA, 2014; pp. 1–41. [Google Scholar]
- Hatthachan, P. Economic reform and regional development of Laos. Mod. Econ. 2012, 3, 18138. [Google Scholar]
- Fujita, Y. Understanding the history of change in Laos. Mt. Res. Dev. 2006, 26, 197–199. [Google Scholar] [CrossRef]
- Rigg, J. A particular place? Laos and its incorporation into the development mainstream. Environ. Plan A 2009, 41, 703–721. [Google Scholar] [CrossRef]
- Anderson, A. Lao PDR and WTO Accession: Implications for Agriculture and Rural Development; School of Economics and Centre of International Economic Studies, University of Adelaide: Adelaide, Australia, 1998; pp. 28–39. [Google Scholar]
- Millar, J.; Connell, J. Strategies for scaling out impacts from agricultural systems change: The case of forages and livestock production in Laos. Agric. Hum. Values 2010, 27, 213–225. [Google Scholar] [CrossRef]
- Kimijima, S.; Nagai, M. Role and Opportunities for Foreign Investment and Its Risks for Rural Development in Laos. Int. J. Environ. Rural Dev. 2012, 3, 150–155. [Google Scholar]
- Sivongxay, A.; Greiner, R.; Garnett, S.T. Livelihood impacts of hydropower projects on downstream communities in central Laos and mitigation measures. Water Resour. Rural Dev. 2017, 9, 46–55. [Google Scholar] [CrossRef]
- McKinley, T.; Wang, L.N. Housing and wealth in rural China. China Econ. Rev. 1992, 3, 195–211. [Google Scholar] [CrossRef]
- Lichter, D.T.; Johnson, K.M. Emerging rural settlement patterns and the geographic redistribution of America’s new immigrants. Rural Sociol. 2006, 71, 109–131. [Google Scholar] [CrossRef]
- Hosseini, S.B.; Faizi, M.; Norouzian-Maleki, S.; Karimi Azari, A.R. Impact evaluation of rural development plans for renovating and retrofitting of rural settlements: Case Study: Rural Districts of Tafresh in Iran. Environ. Earth Sci. 2015, 73, 3033–3042. [Google Scholar] [CrossRef]
- Dao, M.Q. Rural poverty in developing countries: An empirical analysis. J. Econ. Stud. 2004, 31, 500–508. [Google Scholar]
- Zhou, Y.; Liu, Y. Solar power brings money to rural areas. Nature 2018, 560, 29–30. [Google Scholar] [CrossRef] [PubMed]
- Linard, C.; Gilbert, M.; Snow, R.W.; Noor, A.M.; Tatem, A.J. Population distribution, settlement patterns and accessibility across Africa in 2010. PLoS ONE 2012, 7, e31743. [Google Scholar] [CrossRef] [PubMed]
- Qu, Y.; Jiang, G.; Zhao, Q.; Ma, W.; Zhang, R.; Yang, Y. Geographic identification, spatial differentiation, and formation mechanism of multifunction of rural settlements: A case study of 804 typical villages in Shandong Province, China. J. Clean. Prod. 2017, 166, 1202–1215. [Google Scholar] [CrossRef]
- Tu, S.S.; Long, H.L. The theoretical cognition of rural settlements spatial restructuring. Sci. Geol. Sin. 2020, 40, 509–517. [Google Scholar]
- Zhang, Y.; Zhan, C.; Wang, H.; Gao, Y. Evolution and reconstruction of settlement space in tourist islands: A case study of Dachangshan Island, Changhai County. Environ. Dev. Sustain. 2021, 24, 9777–9808. [Google Scholar] [CrossRef]
- Zhou, G.; He, Y.; Tang, C.; Yu, T.; Xiao, G.; Zhong, T. Dynamic mechanism and present situation of rural settlement evolution in China. J. Geogr. Sci. 2013, 23, 513–524. [Google Scholar] [CrossRef]
- Li, G.; Jiang, C.; Du, J.; Jia, Y.; Bai, J. Spatial differentiation characteristics of internal ecological land structure in rural settlements and its response to natural and socio-economic conditions in the Central Plains, China. Sci. Total Environ. 2020, 709, 135932. [Google Scholar] [CrossRef]
- Roberts, B.K. Rural Settlement. In Historical Geography: Progress and Prospect; Routledge: Oxford, UK, 2013; pp. 277–302. [Google Scholar]
- Chen, Z.; Liu, Y.; Feng, W.; Li, Y.; Li, L. Study on spatial tropism distribution of rural settlements in the Loess Hilly and Gully Region based on natural factors and traffic accessibility. J. Rural Stud. 2022, 93, 441–448. [Google Scholar] [CrossRef]
- Yang, R.; Xu, Q.; Xu, X.; Chen, Y. Rural settlement spatial patterns and effects: Road traffic accessibility and geographic factors in Guangdong Province, China. J. Geogr. Sci. 2019, 29, 213–230. [Google Scholar] [CrossRef]
- Tian, G.; Qiao, Z.; Zhang, Y. The investigation of relationship between rural settlement density, size, spatial distribution and its geophysical parameters of China using Landsat TM images. Ecol. Modell. 2012, 231, 25–36. [Google Scholar] [CrossRef]
- Bański, J.; Wesołowska, M. Transformations in housing construction in rural areas of Poland’s Lublin region—Influence on the spatial settlement structure and landscape aesthetics. Landsc. Urban Plan. 2010, 94, 116–126. [Google Scholar] [CrossRef]
- Filani, M.O. Transport and rural development in Nigeria. J. Transp. Geogr. 1993, 1, 248–254. [Google Scholar] [CrossRef]
- Tang, C.; He, Y.; Zhou, G.; Zeng, S.; Xiao, L. Optimizing the spatial organization of rural settlements based on life quality. J. Geogr. Sci. 2018, 28, 685–704. [Google Scholar] [CrossRef]
- Cyriac, S. Dichotomous classification and implications in spatial planning: A case of the Rural-Urban Continuum settlements of Kerala, India. Land Use Policy 2022, 114, 105992. [Google Scholar] [CrossRef]
- Barrios, E.B. Infrastructure and rural development: Household perceptions on rural development. Prog. Plan. 2008, 70, 1–44. [Google Scholar] [CrossRef]
- Andreasen, M.H.; Møller-Jensen, L. Access to the city: Mobility patterns, transport and accessibility in peripheral settlements of Dar es Salaam. J. Transp. Geogr. 2017, 62, 20–29. [Google Scholar] [CrossRef]
- Liu, M.; Dai, Z.; Qiu, D.; Liu, J.; Hao, W. Influencing factors analysis and rational distribution on rural settlements in mountains region. Econ. Geogr. 2011, 31, 476–482. [Google Scholar]
- Luo, G.; Wang, B.; Luo, D.; Wei, C. Spatial agglomeration characteristics of rural settlements in poor mountainous areas of Southwest China. Sustainability 2020, 12, 1818. [Google Scholar] [CrossRef]
- Wang, C.; Huang, B.; Deng, C.; Wan, Q.; Zhang, L.; Fei, Z.; Li, H. Rural settlement restructuring based on analysis of the peasant household symbiotic system at village level: A case study of Fengsi Village in Chongqing, China. J. Rural Stud. 2016, 47, 485–495. [Google Scholar] [CrossRef]
- Zondag, B.; Pieters, M. Influence of accessibility on residential location choice. Transp. Res. Rec. 2005, 1902, 63–70. [Google Scholar] [CrossRef]
- Larsson, A.; Elldér, E.; Vafeiadis, E.; Curtis, C.; Steiner, A. Exploring the potential for sustainable accessibility across settlement types. A Swedish case. Transp. Res. D Transp. Environ. 2022, 107, 103297. [Google Scholar] [CrossRef]
- Neumeier, S.; Pollermann, K. Rural tourism as promoter of rural development–prospects and limitations: Case study findings from a pilot projectpromoting village tourism. Eur. Ctry. 2014, 6, 270–296. [Google Scholar] [CrossRef]
- Manggat, I.; Zain, R.; Jamaluddin, Z. The impact of infrastructure development on rural communities: A literature review. Int. J. Acad. Res. Bus. Soc. Sci. 2018, 8, 637–648. [Google Scholar] [CrossRef] [PubMed]
- Ma, L.; Liu, S.; Tao, T.; Gong, M.; Bai, J. Spatial reconstruction of rural settlements based on livability and population flow. Habitat Int. 2022, 126, 102614. [Google Scholar] [CrossRef]
- Huang, A.; Liu, B.; Zhang, A.; Zhan, J. Coordinated development of rural habitat in China: A study of measurement, spatio-temporal evolution and convergence. J. Clean. Prod. 2023, 398, 136651. [Google Scholar] [CrossRef]
- Li, X.; Yang, H. The change of rural settlements and their future development patterns. Econ. Geogr. 2017, 37, 1–8. [Google Scholar]
- Tian, Y.; Liu, Y.; Liu, X.; Kong, X.; Liu, G. Restructuring rural settlements based on subjective well-being (SWB): A case study in Hubei province, central China. Land Use Policy 2017, 63, 255–265. [Google Scholar] [CrossRef]
- Kim, H.; Woosnam, K.M.; Marcouiller, D.W.; Aleshinloye, K.D.; Choi, Y. Residential mobility, urban preference, and human settlement: A South Korean case study. Habitat Int. 2015, 49, 497–507. [Google Scholar] [CrossRef]
- Berbecar, V.T.; Cocheci, R.M.; Acasandre, A.; Ismail, G.; Mircescu, G. Quality of living assessment in rural Romania. An analysis of settlements with low accessibility to medical services. J. Urban Reg. Anal. 2020, 12, 165–180. [Google Scholar] [CrossRef]
- Andre-Bechely, L. Finding space and managing distance: Public school choice in an urban California district. Urban Stud. 2007, 44, 1355–1376. [Google Scholar] [CrossRef]
- Wiggins, S.; Proctor, S. How special are rural areas? The economic implications of location for rural development. Dev. Policy Rev. 2001, 19, 427–436. [Google Scholar] [CrossRef]
- Ke, S.; Feser, E. Count on the growth Pole strategy for regional economic growth? Spread–backwash effects in greater Central China. Reg. Stud. 2010, 44, 1131–1147. [Google Scholar] [CrossRef]
- Hanson, G.H. Market potential, increasing returns and geographic concentration. J. Int. Econ. 2005, 67, 1–24. [Google Scholar] [CrossRef]
- Harris, C.D. The, market as a factor in the localization of industry in the United States. Ann. Assoc. Am. Geogr. 1954, 44, 315–348. [Google Scholar]
- Bradstock, A. Changing livelihoods and land reform: Evidence from the Northern Cape province of South Africa. World Dev. 2005, 33, 1979–1992. [Google Scholar] [CrossRef]
- Fujita, M.; Thisse, J.F.; Zenou, Y. On the endogeneous formation of secondary employment centers in a city. J. Urban Econ. 1997, 41, 337–357. [Google Scholar] [CrossRef]
- Kilkenny, M. Urban/regional economics and rural development. J. Reg. Sci. 2010, 50, 449–470. [Google Scholar] [CrossRef]
- Östberg, W.; Howland, O.; Mduma, J.; Brockington, D. Tracing improving livelihoods in rural Africa using local measures of wealth: A case study from central Tanzania, 1991–2016. Land 2018, 7, 44. [Google Scholar] [CrossRef]
- Knight, J.B.; Li, S.; Wan, H. The Increasing Inequality of Wealth in China, 2002–2013; CHCP Working Paper No. 2017-15; The University of Western Ontario, Centre for Human Capital and Productivity (CHCP): London, ON, Canada, 2017; pp. 14–15. [Google Scholar]
- Yang, R.; Liu, Y.; Long, H.; Qiao, L. Spatio-temporal characteristics of rural settlements and land use in the Bohai Rim of China. J. Geogr. Sci. 2015, 25, 559–572. [Google Scholar] [CrossRef]
- Patowary, S.; Sarma, A.K. Model-based analysis of urban settlement process in eco-sensitive area of developing country: A study with special reference to hills of an Indian city. Environ. Dev. Sustain. 2018, 20, 1777–1795. [Google Scholar] [CrossRef]
- Li, X.; Xu, W.; Huang, Y.; Chen, H.; Qin, X.; Li, Y.; Deng, M.; Jiang, J.; Qin, Y. Spatial distribution of rural building in China: Remote sensing interpretation and density analysis. Acta Geogr. Sin. 2022, 77, 835–851. [Google Scholar]
- Liang, Y.; Li, S.; Zeng, J.; Wu, T. Examining the impact of multidimensional accessibility on regional poverty in Laos. Appl. Geogr. 2022, 148, 102789. [Google Scholar] [CrossRef]
- Cao, X.; Li, G.; Feng, Y.; Hu, J.; Wang, J. Present situation and industrial development suggestions of agricultural in Laos. Chin. J. Trop. Agric. 2022, 42, 122–129. [Google Scholar]
- Martin, S.M.; Lorenzen, K.A.I. Livelihood diversification in rural Laos. World Dev. 2016, 83, 231–243. [Google Scholar] [CrossRef]
- Zhang, Y.; Niu, X.; Hu, Y.; Yan, H.; Zhen, L. Temporal and spatial evolution characteristics and its driving mechanism of land use/land cover change in Laos from 2000 to 2020. Land 2022, 11, 1188. [Google Scholar] [CrossRef]
- He, K.; Gkioxari, G.; Dollár, P.; Girshick, R. Mask r-cnn. In Proceedings of the IEEE International Conference on Computer Vision, Venice, Italy, 22–29 October 2017; pp. 2961–2969. [Google Scholar]
- Manepalli, U.R.; Bham, G.H.; Kandada, S. Evaluation of hotspots identification using kernel density estimation (K) and Getis-Ord (Gi*) on I-630. In Proceedings of the 3rd International Conference on Road Safety and Simulation, Indianapolis, IN, USA, 14–16 September 2011; pp. 14–16. [Google Scholar]
- Wang, J.F.; Xu, C.D. Geodetector: Principle and prospective. Acta Geogr. Sin. 2017, 72, 116–134. [Google Scholar]
- Wang, J.F.; Li, X.H.; Christakos, G.; Liao, Y.L.; Zhang, T.; Gu, X.; Zheng, X.Y. Geographical detectors-based health risk assessment and its application in the neural tube defects study of the Heshun Region, China. Int. J. Geogr. Inf. Sci. 2010, 24, 107–127. [Google Scholar] [CrossRef]
- Zhou, X.; Yeh, A.G. Understanding the modifiable areal unit problem and identifying appropriate spatial unit in jobs-housing balance and employment self-containment using big data. Transportation 2021, 48, 1267–1283. [Google Scholar] [CrossRef]
- Gao, F.; Li, S.; Tan, Z.; Wu, Z.; Zhang, X.; Huang, G.; Huang, Z. Understanding the modifiable areal unit problem in dockless bike sharing usage and exploring the interactive effects of built environment factors. Int. J. Geogr. Inf. Sci. 2021, 35, 1905–1925. [Google Scholar] [CrossRef]
- Jeong, J.S.; García-Moruno, L.; Hernández-Blanco, J. A site planning approach for rural buildings into a landscape using a spatial multi-criteria decision analysis methodology. Land Use Policy 2013, 32, 108–118. [Google Scholar] [CrossRef]
- Zhang, L.; Guo, S.; Wu, Z.; Alsaedi, A.; Hayat, T. SWOT analysis for the promotion of energy efficiency in rural buildings: A case study of China. Energies 2018, 11, 851. [Google Scholar] [CrossRef]
- Wang, J.; Sui, L.; Yang, X.; Wang, Z.; Ge, D.; Kang, J.; Yang, F.; Liu, Y.; Liu, B. Economic globalization impacts on the ecological environment of inland developing countries: A case study of Laos from the perspective of the land use/cover change. Sustainability 2019, 11, 3940. [Google Scholar] [CrossRef]
- Zhao, F.; Zhang, S.; Du, Q.; Ding, J.; Luan, G.; Xie, Z. Assessment of the sustainable development of rural minority settlements based on multidimensional data and geographical detector method: A case study in Dehong, China. Socio-Econ. Plan. Sci. 2021, 78, 101066. [Google Scholar] [CrossRef]
- Ji, Z.; Xu, Y.; Sun, M.; Liu, C.; Lu, L.; Huang, A.; Duan, Y.; Liu, L. Spatiotemporal characteristics and dynamic mechanism of rural settlements based on typical transects: A case study of Zhangjiakou City, China. Habitat Int. 2022, 123, 102545. [Google Scholar] [CrossRef]
- Wan, A.; Liu, Y.; Xie, X.; Tu, R.; Qi, X. Study on spatial layout optimization of Linpan settlements based on point pattern analysis. Environ. Dev. Sustain. 2021, 23, 9974–9992. [Google Scholar] [CrossRef]
- Sharifi, A.; Chiba, Y.; Okamoto, K.; Yokoyama, S.; Murayama, A. Can master planning control and regulate urban growth in Vientiane, Laos? Landsc. Urban Plan. 2014, 131, 1–13. [Google Scholar] [CrossRef]
- Warr, P. Roads and poverty in rural Laos: An econometric analysis. Pac. Econ. Rev. 2010, 15, 152–169. [Google Scholar] [CrossRef]
- Castella, J.C.; Phaipasith, S. Rural roads are paving the way for land-use intensification in the uplands of Laos. Land 2021, 10, 330. [Google Scholar] [CrossRef]
- Warr, P.; Menon, J.; Rasphone, S. Public services and the poor in Laos. World Dev. 2015, 66, 371–382. [Google Scholar] [CrossRef]
- Lin, L.Y.; Zhu, Y.; Ke, W.Q.; Wang, J.S. The impact of migrants’ access to urban public services on their urban settlement intentions: A study from the perspective of different-sized cities. Acta Geogr. Sin. 2019, 74, 737–752. [Google Scholar]
- Li, D.; Wang, X. Land-use change and efficiency in Laos’ Special Economic Zones. Land 2021, 10, 1012. [Google Scholar] [CrossRef]
- Huang, J.L.; Wu, M.; Bao, Q. Special economic zones, contract systems and comparative advantages. Manag. World 2013, 11, 28–38. [Google Scholar]
- Liu, Y.; Ke, X.; Wu, W.; Zhang, M.; Fu, X.; Li, J.; Jiang, J.; He, Y.; Zhou, C.; Li, W.; et al. Geospatial characterization of rural settlements and potential targets for revitalization by geoinformation technology. Sci. Rep. 2022, 12, 8399. [Google Scholar] [CrossRef]
- Minot, N.; Baulch, B.; Epperecht, M. Poverty and inequality in Vietnam: Spatial patterns and geographic determinants. Res. Rep. 2006, 54, 153–154. [Google Scholar]


| Variable | Definition | Mean | SD |
|---|---|---|---|
| Market access | Distance to the nearest provincial capital and special economic zone (km) | 44.42 | 28.33 |
| Transport infrastructure | Distance to the nearest road (km) | 3.08 | 4.48 |
| Public services | Distance to the nearest hospital (km) | 22.04 | 15.65 |
| Distance to the nearest school (km) | 20.95 | 16.38 | |
| Natural factors | Distance to the nearest river (km) | 1.61 | 2.09 |
| Slope (°) | 4.16 | 4.54 | |
| Average altitude (m) | 458.06 | 345.20 |
| X1 | X2 | X3 | X4 | X5 | X6 | X7 | |
|---|---|---|---|---|---|---|---|
| NBM | 0.023 *** | 0.033 *** | 0.005 *** | 0.053 *** | 0.008 *** | 0.024 *** | 0.017 *** |
| QM | 0.118 *** | 0.155 *** | 0.045 *** | 0.124 *** | 0.050 *** | 0.091 *** | 0.078 *** |
| EIM | 0.001 *** | 0.009 *** | 0.002 *** | 0.008 *** | 0.001 *** | 0.006 *** | 0.002 *** |
| North | Central | South | |||||||
|---|---|---|---|---|---|---|---|---|---|
| NB | QU | EI | NB | QU | EI | NB | QU | EI | |
| X1 | 0.008 *** | 0.050 *** | 0.001 | 0.017 | 0.085 *** | 0.005 | 0.078 *** | 0.128 *** | 0.015 |
| X2 | 0.022 *** | 0.117 *** | 0.002 | 0.072 ** | 0.037 *** | 0.123 | 0.065 *** | 0.074 *** | 0.175 *** |
| X3 | 0.008 ** | 0.048 *** | 0.004 | 0.002 | 0.017 *** | 0.002 | 0.002 | 0.022 *** | 0.001 |
| X4 | 0.032 *** | 0.097 *** | 0.010 | 0.040 *** | 0.087 *** | 0.003 | 0.100 *** | 0.159 *** | 0.019 |
| X5 | 0.003 | 0.049 *** | 0.001 | 0.034 *** | 0.110 *** | 0.009 | 0.007 | 0.030 *** | 0.005 |
| X6 | 0.007 *** | 0.027 *** | 0.003 | 0.063 *** | 0.199 *** | 0.022 * | 0.040 *** | 0.075 *** | 0.009 |
| X7 | 0.009 *** | 0.031 *** | 0.003 | 0.045 *** | 0.195 *** | 0.023 | 0.020 *** | 0.064 *** | 0.004 |
| Laos | North | Central | South | |
|---|---|---|---|---|
| X1∩X2 | 0.177 (BE) | 0.149 (BE) | 0.103 (BE) | 0.178 (BE) |
| X1∩X3 | 0.140 (BE) | 0.105 (NE) | 0.114 (NE) | 0.161 (NE) |
| X1∩X4 | 0.220 (BE) | 0.136 (BE) | 0.163 (BE) | 0.274 (BE) |
| X1∩X5 | 0.167 (BE) | 0.102 (NE) | 0.176 (BE) | 0.184 (NE) |
| X1∩X6 | 0.197 (BE) | 0.089 (NE) | 0.259 (BE) | 0.167 (BE) |
| X1∩X7 | 0.184 (BE) | 0.095 (NE) | 0.237 (BE) | 0.213 (NE) |
| X2∩X3 | 0.177 (BE) | 0.155 (BE) | 0. 074 (NE) | 0.101 (NE) |
| X2∩X4 | 0.245 (BE) | 0.190 (BE) | 0.127 (NE) | 0.219 (BE) |
| X2∩X5 | 0.194 (BE) | 0.149 (BE) | 0.146 (BE) | 0.105 (NE) |
| X2∩X6 | 0.220 (BE) | 0.141 (BE) | 0.229 (BE) | 0.151 (NE) |
| X2∩X7 | 0.204 (BE) | 0.141 (BE) | 0.216 (BE) | 0.139 (NE) |
| X3∩X4 | 0.154 (BE) | 0.132 (BE) | 0.114 (NE) | 0.182 (NE) |
| X3∩X5 | 0.095 (BE) | 0.098 (NE) | 0.134 (NE) | 0.065 (NE) |
| X3∩X6 | 0.128 (BE) | 0.084 (NE) | 0.216 (BE) | 0.107 (NE) |
| X3∩X7 | 0.116 (BE) | 0.083 (NE) | 0.242 (NE) | 0.098 (NE) |
| X4∩X5 | 0.157 (BE) | 0.135 (BE) | 0.158 (BE) | 0.186 (BE) |
| X4∩X6 | 0.185 (BE) | 0.124 (NE) | 0.236 (BE) | 0.211 (BE) |
| X4∩X7 | 0.179 (BE) | 0.132 (NE) | 0.233 (BE) | 0.190 (BE) |
| X5∩X6 | 0.120 (BE) | 0.075 (BE) | 0.228 (BE) | 0.113 (NE) |
| X5∩X7 | 0.110 (BE) | 0.083 (NE) | 0.224 (BE) | 0.106 (NE) |
| X6∩X7 | 0.137 (BE) | 0.059 (NE) | 0.258 (BE) | 0.141 (NE) |
Disclaimer/Publisher’s Note: The statements, opinions and data contained in all publications are solely those of the individual author(s) and contributor(s) and not of MDPI and/or the editor(s). MDPI and/or the editor(s) disclaim responsibility for any injury to people or property resulting from any ideas, methods, instructions or products referred to in the content. |
© 2023 by the authors. Licensee MDPI, Basel, Switzerland. This article is an open access article distributed under the terms and conditions of the Creative Commons Attribution (CC BY) license (https://creativecommons.org/licenses/by/4.0/).
Share and Cite
Li, S.; Liang, Y.; Deng, X.; Xu, W.; Li, X. Exploring the Spatial Heterogeneity of Rural Development in Laos Based on Rural Building Spatial Database. Land 2023, 12, 2008. https://doi.org/10.3390/land12112008
Li S, Liang Y, Deng X, Xu W, Li X. Exploring the Spatial Heterogeneity of Rural Development in Laos Based on Rural Building Spatial Database. Land. 2023; 12(11):2008. https://doi.org/10.3390/land12112008
Chicago/Turabian StyleLi, Shangqian, Yutian Liang, Xin Deng, Weipan Xu, and Xun Li. 2023. "Exploring the Spatial Heterogeneity of Rural Development in Laos Based on Rural Building Spatial Database" Land 12, no. 11: 2008. https://doi.org/10.3390/land12112008