1. Introduction
In this paper, we aim to study the micro-segregation of ethnic minorities in Rome, namely, high residential concentration at the micro-area level within neighbourhoods with a low concentration of these minorities. We focus on specific situations of ethnic spatial inequality often overlooked in the debate that are useful in highlighting the different ways in which residential segregation is manifested according to the spatial scale used. This approach also makes it possible to highlight ’settlement exceptions’ that can represent an interesting evolution in the usual settlement pattern of the ethnic groups.
The distribution in the urban space of ethnic minorities with different origins has been the subject of much research on issues such as integration, discrimination and social inequality [
1,
2,
3,
4,
5].
Urban residential segregation has been analysed according to different explanatory perspectives: within micro-level approaches, as in the case of the spatial assimilation model and the ethnic enclave model [
6,
7]; and within macro-level approaches, as in the place stratification model [
8,
9]. Place-specific explanations have been highlighted [
10], and research on urban segregation at the micro-area level underlined the great heterogeneity of cases at the local level [
11]. The studies of Maloutas and Karadimitriou defined the concept of urban micro-segregation in a vertical perspective [
12,
13], which recalls the ethnic and economic inequality between groups living in apartments located on different floors of the same building, and allows cases of strong residential segregation to emerge, even within socially mixed neighbourhoods. Examining micro-segregation from a horizontal perspective [
11,
14], the ‘modifiable areal unit problem’ (MAUP), that is, the risk of having inconsistent values of segregation indices based on the type of spatial units used, arises. The use of highly disaggregated data makes it possible to overcome the MAUP by adopting a multiscale approach [
15].
As will be better explained later, this paper uses a multiscale approach to study micro-residential segregation in Rome. The city has always played a pivotal role in the Italian migratory landscape, being the municipality with the highest number of foreign residents (361,000 in 2020, corresponding to 13% of the total residents). After being a country of emigration for over a century, in the 1980s Italy began to attract the first substantial migratory flows, and during the 2000s, it has become one of the main immigration areas in Europe [
16]. Studies on the residential segregation and spatial settlement patterns of foreigners gained momentum, as did the public debate on the integration of immigrants [
17,
18,
19,
20,
21,
22,
23]. The Italian capital is a multi-ethnic southern European metropolis with relatively low levels of segregation [
18,
24,
25], but it presents persistent social and spatial ethnic marginalisation [
26]. Despite being one of the five most populous cities in the European Union (EU), with 2.8 million inhabitants, it is an urban context that has been little studied, in part because of the lack of reliable and granular data.
In order to study the micro-segregation of ethnic minorities, we use original and unpublished individual data from the 2020 population register of the municipality of Rome, disaggregated into 155 neighbourhoods and 13,656 census tracts, the latter being micro-areas with an average of about 200 inhabitants and equal in most cases to blocks. The five minority groups considered—Romanians, Filipinos, Bangladeshis, Chinese, and developed economy countries (DECs) citizens—total 55% of all foreign residents and show different settlement patterns: Bangladeshis and Chinese are clustered in central areas and the poor eastern urban periphery, Filipinos are more likely to live in the well-off neighbourhoods along the north–south axis, and Romanians are mainly settled in peri-urban districts with lower real estate values. Migrants from DECs are more likely to reside in the city centre and the more affluent districts.
The analysis of micro-segregation is performed at both territorial scales of census tracts and neighbourhoods. A micro-segregated area (MSA) is a census tract that shows a very high over-representation of an ethnic group being located within a neighbourhood where that group is under-represented. Examining MSAs allows us to address the main objective of the paper, which is to highlight how residential segregation can hide in the cracks, even in districts characterised by a social mix, especially in a Mediterranean urban context such as Rome where socioeconomic hardship is often sparsely distributed with varying intensity.
Operationally, in this paper, we carry out a descriptive analysis mapping of a local measure, such as the location quotient (LQ) [
27,
28], to reveal the spatial units in which there is over- and under-representation and identify MSAs, characterising them with respect to the centre–periphery spatial location and socioeconomic status. Bivariate logistic models are also developed to highlight how the characteristics of immigrants residing in micro-areas with very high over-representation differ depending on their location within a neighbourhood with over- or under-representation.
This approach offers the opportunity to answer the following research questions:
- RQ1.
What differences exist in the settlement patterns of selected minority ethnic groups?
- RQ2.
What differences exist in the micro-segregation of minority ethnic groups in terms of socio-demographic characteristics, the settlement location (centre vs. periphery) of the residents, and the socioeconomic status of the micro-areas where they live?
- RQ3.
What peculiar characteristics of minority ethnic groups underlie these differences?
The remainder of this contribution is structured as follows. The next two sections offer a review of the literature and describe the data and methods. The fourth section focuses on socioeconomic and migration aspects in the context of Rome. In the fifth part, the analysis of LQs by census tracts highlights differences in the five ethnic groups’ settlement patterns. In the sixth section, we define and map the MSAs of the ethnic groups, and then we use a multivariate approach to explore the relationship between micro-segregation and individual and contextual socioeconomic factors. In the last section, we discuss the key findings and provide directions for future work.
The findings indicate that differences in settlement patterns are related to the interplay between real estate constraints and labour market specialisation. National specificities in micro-segregation are also linked to length of stay, but the models of the Asian groups do not offer any empirical support for the spatial assimilation hypothesis, unlike those of Romanians and DECs citizens.
2. Literature Review
The concept of ethnic residential segregation refers to the spatial separation of two or more population groups characterised by different countries of origin or citizenship [
1]. Depending on their migration history, different cities have attracted people from different countries, and different groups of immigrants with different origins can consequently be identified [
2]. International migrations play a very relevant role in the socioeconomic and demographic transformation of the urban space, fuelling the debate on issues such as integration and discrimination [
3,
4]. For this reason, the territorial distribution of ethnic minorities has been the subject of much research with the aim of highlighting the risks of negative impacts, for instance, in terms of social inequality [
5].
In the literature, urban residential segregation is analysed according to different explanatory perspectives that focus on different dimensions [
29,
30]. Behavioural theories focus on the individual’s attitude by centring choices, preferences, and constraints [
6]. Included in these micro-level approaches are the spatial assimilation model and ethnic enclave model. According to the spatial assimilation model, newly arrived immigrants prefer to live in an ethnic enclave, but over time, the level of acculturation increases, and their settlement pattern assimilates with that of the natives [
7]. The ethnic enclave model calls into question the occurrence of gradual spatial assimilation, as living in a neighbourhood with a high concentration of co-ethnics facilitates participation in a set of ethnic networks and socioeconomic resources [
6,
31]. Among the macro-level perspectives, the place stratification model highlights the relevance of structural constraints placed on minority groups in neighbourhood choice, emphasizing discrimination practices within the housing market [
8,
9,
32]. Other studies highlight place-specific explanations, also from a historical perspective [
6,
10], for example, highlighting how residing in an economically strong area with high human capital can provide greater employment opportunities and integration [
33]. It is also relevant to know the spatial scale at which segregation processes occur. In particular, the study of urban segregation at the micro-area level highlights the great heterogeneity of cases that deserves to be investigated for reasons including assessment of the need for ad hoc policy strategies at the local level [
11].
According to Maloutas and Karadimitriou [
12], it can be said that urban micro-segregation exists in contexts below the neighbourhood level when a proportion of the residents are in a state of socioeconomic or ethnic inequality. The concept of micro-segregation is relevant as it brings out the existence of socio-spatial hierarchies created at the micro-area level, even in neighbourhoods characterised by a social mix [
13]. The concept has been developed in vertical and horizontal perspectives. Vertical micro-segregation refers to the unequal positioning of social or ethnic groups living in apartments on different floors of the same building [
11,
12,
13,
34]. Investigating the horizontal dimension of micro-segregation reveals that the choice of spatial scale is a key aspect, and the MAUP arises [
11,
14]. In fact, territorial studies based on segregation indexes can provide different and inconsistent results depending on the territorial scale used: in most cases the smaller the spatial units used to indicate the neighbourhood, the higher the value of the segregation index will be [
1]. Overall, it is not easy to understand which spatial scale is most appropriate for the phenomenon under study [
35]. The issue of scale has been addressed by many authors, and the block has been seen as a level of micro-‘proximity’ spatial detail that is also of interest in qualitative sociological studies [
36]. In recent years, many studies have been able to overcome the MAUP thanks to the availability of granular statistical data that make possible a multiscale analysis through the definition of ‘egocentric neighbourhoods’ [
15,
37].
3. Data and Methods
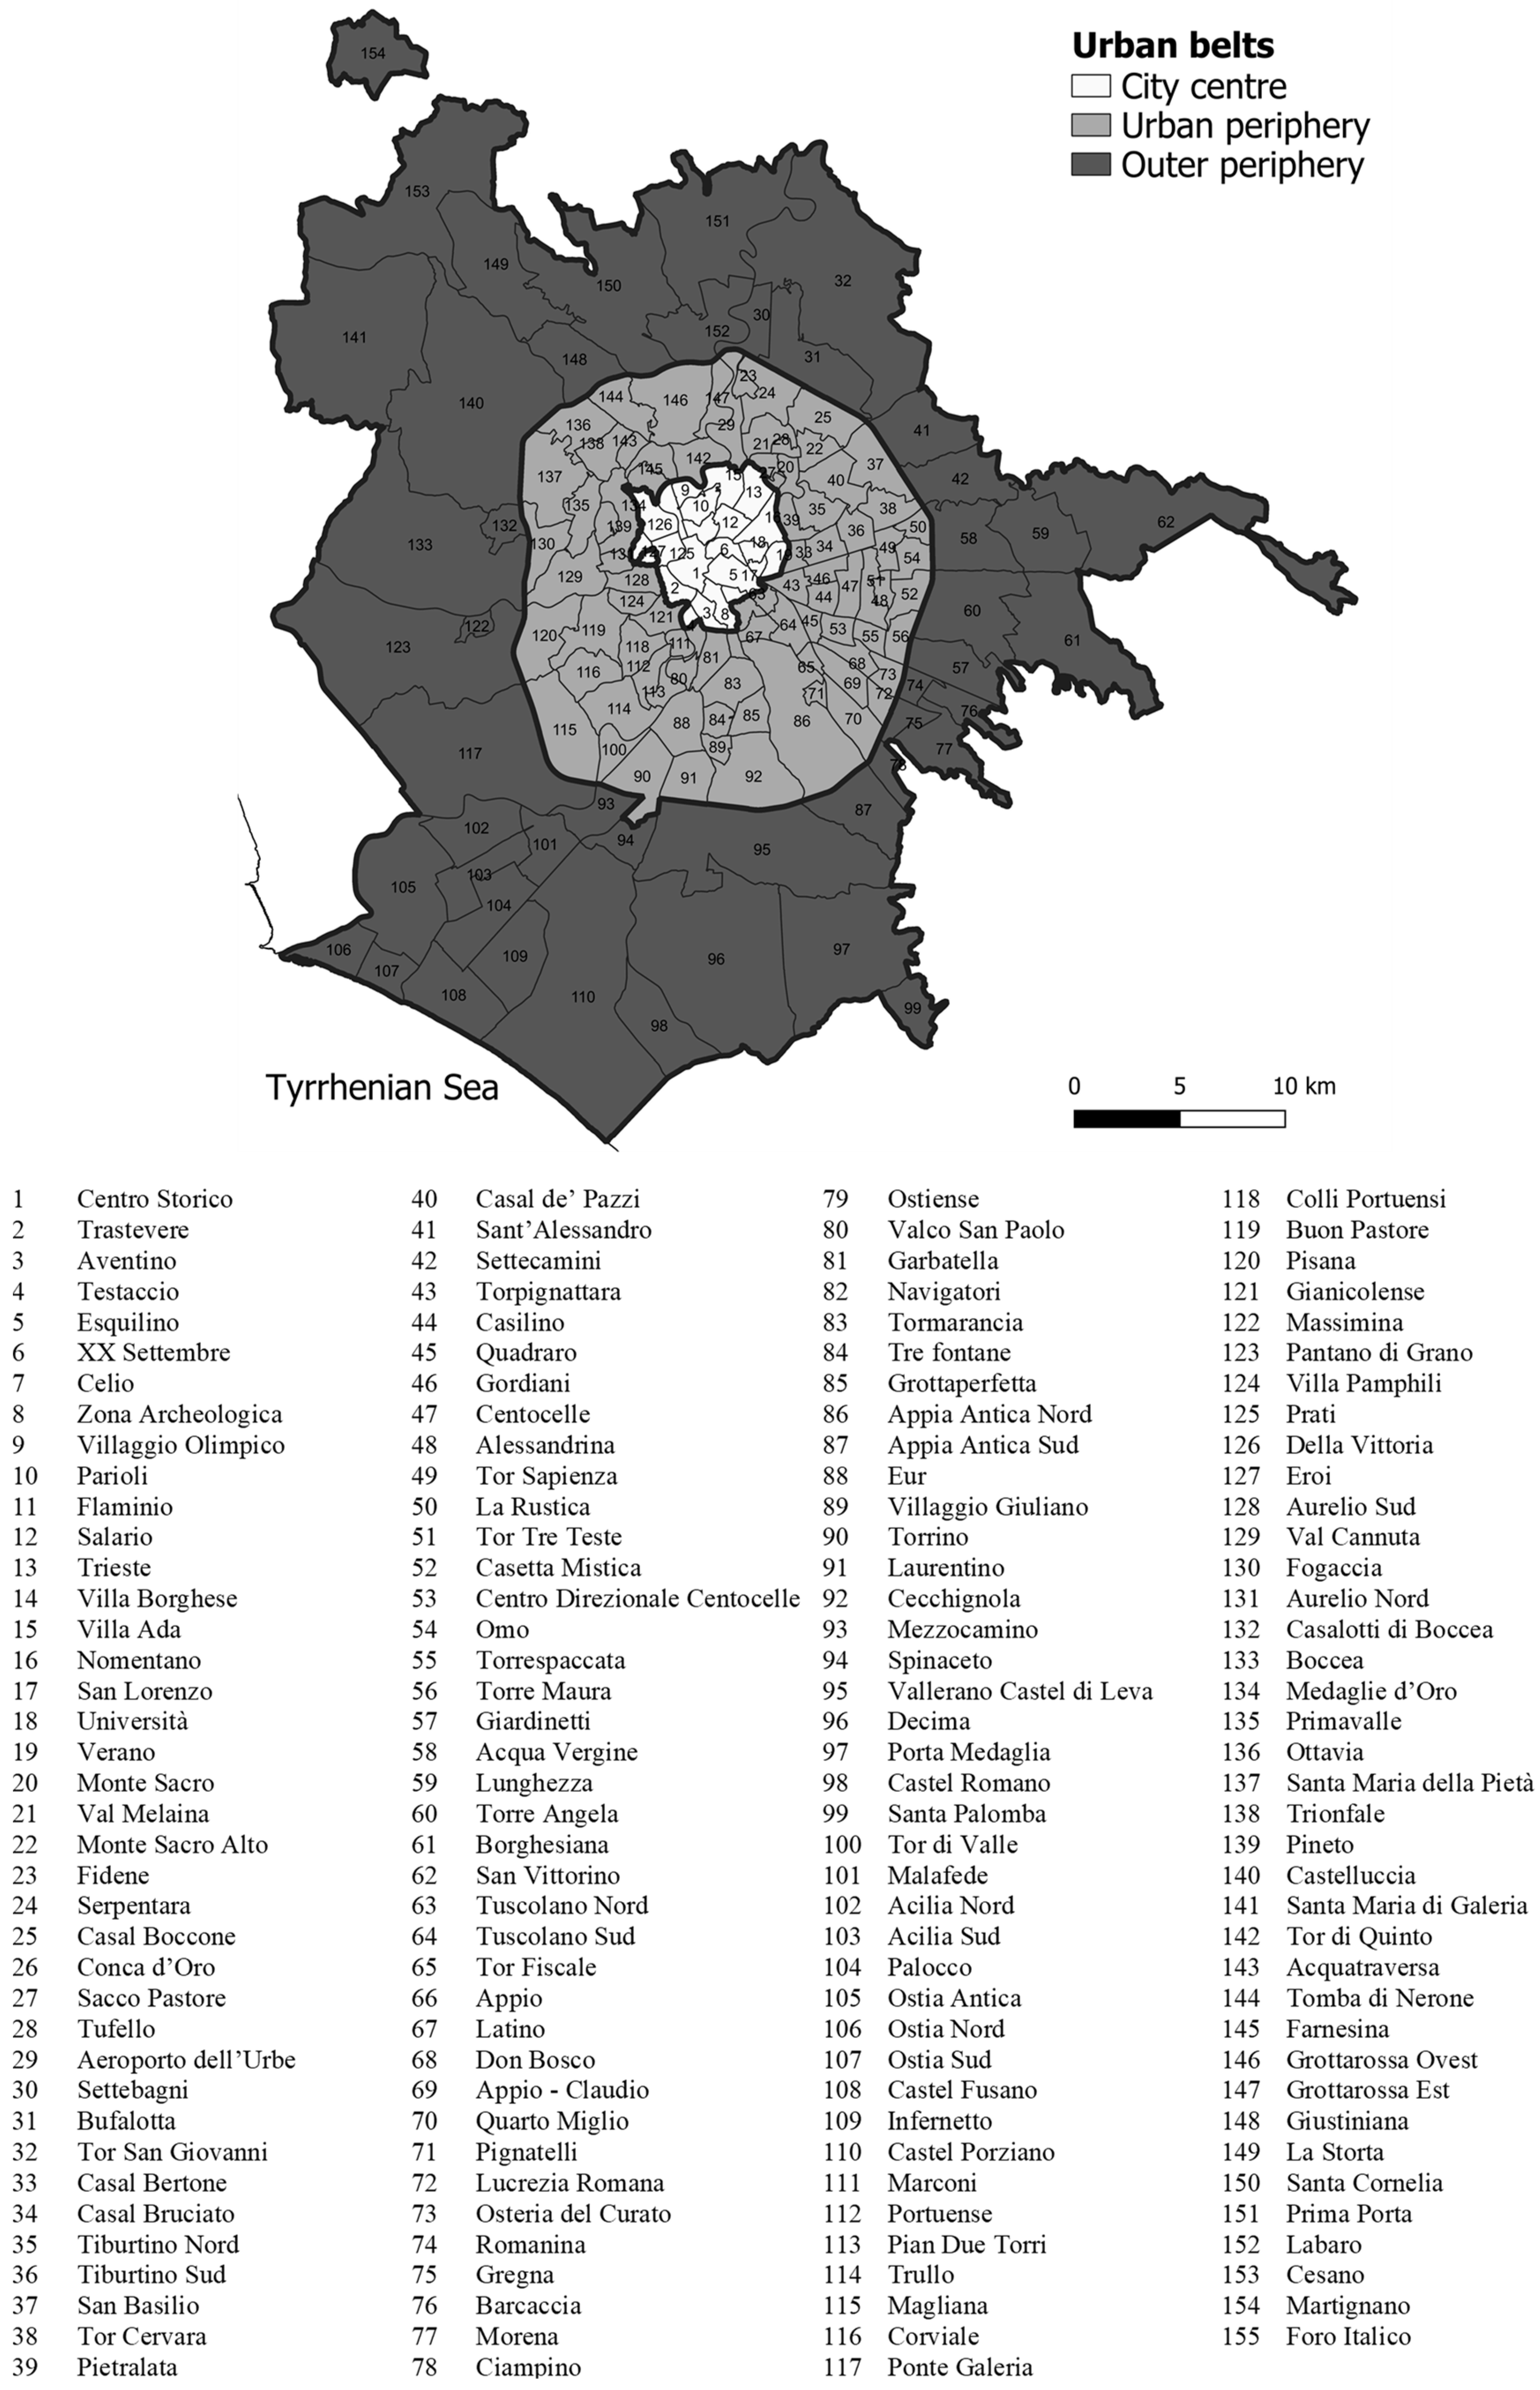
This article is based on original and unpublished individual data from the population register of 2020 (on 1st January), disaggregated into 155 neighbourhoods (zone urbanistiche) (
Figure A1) and 13,656 census tracts. The census tracts are micro-areas which, in Rome, are mostly equivalent to a single block or a portion thereof and have an average population of about 200 residents. Census tracts have very diverse characteristics depending on their spatial location: they are large and of low density in suburban areas and small and dense in the compact city centre. The neighbourhood corresponds to a territory with a larger surface and has an average population of around 18,000 inhabitants. Neighbourhoods closer to the city centre have high residential density, smaller size, and delineate territories with a distinctive identity for residents. The more suburban neighbourhoods often have a very large area (see ahead, the ‘outer periphery’ in
Figure 1), include dispersed urbanisations typical of urban sprawl, and only rarely can be considered walkable environments.
Five minority groups are considered in this paper: the four most numerous nationalities of the city (Romanians, Filipinos, Bangladeshis, Chinese), and the group of migrants from DECs. The latter group includes many European and non-European nationalities with different ethnic characteristics and migration histories in several cases
1, but it is interesting to consider in comparison to the other four groups because it has a rather homogeneous cultural and socioeconomic profile, similar to that of the upper-middle-class Italian population. These five groups add up to 54.6% of the heterogeneous foreign population and show different settlement patterns. Minority groups were identified on the basis of country of citizenship, which is used as a proxy for ethnicity. We are aware of the limitations of this criterion, but it was the only one possible and is commonly adopted within similar Italian studies [
20,
22].
A large number of indicators has been developed to measure different dimensions of spatial inequality [
38,
39]. We used a global measure, the dissimilarity index (DI), and a local measure, the location quotient (LQ).
The DI measures the evenness of the spatial distribution of two groups across areal units and can vary from 0 to 1 [
38,
40]. Essentially, it gives the proportion of minority members that would have to change their census tract of residence in order to achieve an even distribution (in other words, no segregation). We calculate it using Formula (1), which was proposed by Duncan and Duncan [
40]:
where
i is the census tract of the examined area,
k the number of tracts,
a the overall area,
m the minority group,
r the rest of the population,
Nim the population of group
m in tract
i,
Nam the population of group
m in the overall area
a,
Nir the rest of the population in tract
i, and
Nar the rest of the population in the overall area
a2. LQ is particularly useful when applied to the study of a city since it identifies sub-areas in which a population group is under-represented (LQ < 1) or, conversely, over-represented (LQ > 1). LQ varies from 0 to infinity and measures how concentrated a particular group is in a certain spatial unit compared with its concentration in the area as a whole.
We compute LQs with reference to Formula (2) proposed by Apparicio et al. [
41]:
where
i is the census tract of the examined area,
a the overall area,
m the minority group,
t the total population,
Nim the population of group
m in tract
i,
Nit the total population in tract
i,
Nam the population of group
m in the overall area
a, and
Nat the total population in the overall area
a.
We map LQs to bring out MSAs and characterising them with respect to centre–periphery spatial location and socioeconomic status.
The micro-segregation perspective allows for the identification of specific features of the settlement pattern of ethnic groups that do not always emerge through aggregate or non-targeted approaches in micro-contexts [
12]. In this paper, the analysis of micro-segregation is applied at the double territorial scale of census tract and neighbourhood. An MSA is a census tract that shows a strong over-representation of a specific ethnic group despite being located within a neighbourhood where that group is under-represented. Operationally, an MSA is a census tract where an ethnic group has an LQ equal to or greater than 4 and is located in a neighbourhood with an LQ less than 1. This allows us to highlight inconspicuous situations of high ethnic segregation ‘hidden’ within mixed neighbourhoods connoted by low levels of concentration. In fact, MSA can be considered, in a certain sense, ‘interstitial’ micro-areas embedded in ethnically differently connoted neighbourhoods.
For this reason, census tracts with LQ levels below 4 are not considered in the bivariate logistic models that are also developed to highlight how the socio-demographic characteristics of immigrants residing in micro-areas with very high over-representation (LQ ≥ 4) differ depending on their location within a neighbourhood with over- (LQ ≥ 2) or under-representation (LQ < 1) (see
Table 1). In other words, the logistic models measure the propensity of the selected ethnic groups to reside in an MSA, rather than in a very high-concentration census tract (LQ ≥ 4) inside a very high-concentration neighbourhood (LQ ≥ 2). Given the large difference in spatial scale and average population between the two area types, it was chosen to set the threshold of over-representation in census tracts at twice the LQ value compared with neighbourhoods. This made it possible to limit the bias produced by the MAUP, as a result of which smaller spatial units tend to have higher values of segregation indices. To better highlight these situations of exception, we let emerge only micro-areas where the group appears remarkably over-represented, not considering census tracts with significant under-representation (LQ < 1) or less micro-segregated (LQ ranging between 1 and 4).
In detail, within the logistic models we use the independent variables of sex, age, civil status, and years of stay as individual characteristics and the social disadvantage index (SDI) and residential crowding index (RCI) as context characteristics.
The SDI was defined in the ‘National plan for social and cultural redevelopment of deprived urban areas’ (Piano nazionale per la riqualificazione sociale e culturale delle aree urbane degradate), launched by the Italian government in 2015 to identify the most deprived neighbourhoods nationwide. The index comprises four socioeconomic sub-indexes from 2011 Istat Census data: unemployment rate, employment rate, youth concentration rate, and education rate. The unemployment rate expresses the resident population aged 15 and over without a job, actively seeking employment and immediately available to start work as a percentage of the total labour force. The employment rate is measured as the share of the resident working-age population declaring having a job in relation to the comparable total population. The youth concentration rate refers to the ratio of the resident population aged less than 25 to the number of people living in the area. Finally, the education rate relates the resident population having attained at least upper secondary education to the total over-25 population. Using these sub-indexes, the SDI is computed as the weighted average of deviations of the indicators’ values of the single tract from the municipal average values, according to Formula (3) (in the original expression, deviations are calculated from the respective national averages)
where
i is the census tract of the examined area,
a is the overall area, UNEM is the unemployment rate, EMPL is the employment rate, YOUT is the youth concentration rate, and EDUC is the education rate.
The RCI results from the crude ratio of the total surface of residential buildings present in a census tract to the corresponding number of inhabitants, according to Formula (4):
where
i is the census tract of the examined area,
t the total population,
Si the total surface of residential buildings in tract
i, and
Nit the total population in tract
i.
In the following elaborations, the classes of the two hardship indexes are defined using population-weighted quintiles.
4. Research Area: Socioeconomic and Migration Context
Rome has the largest surface of any municipality in Italy (1285 km
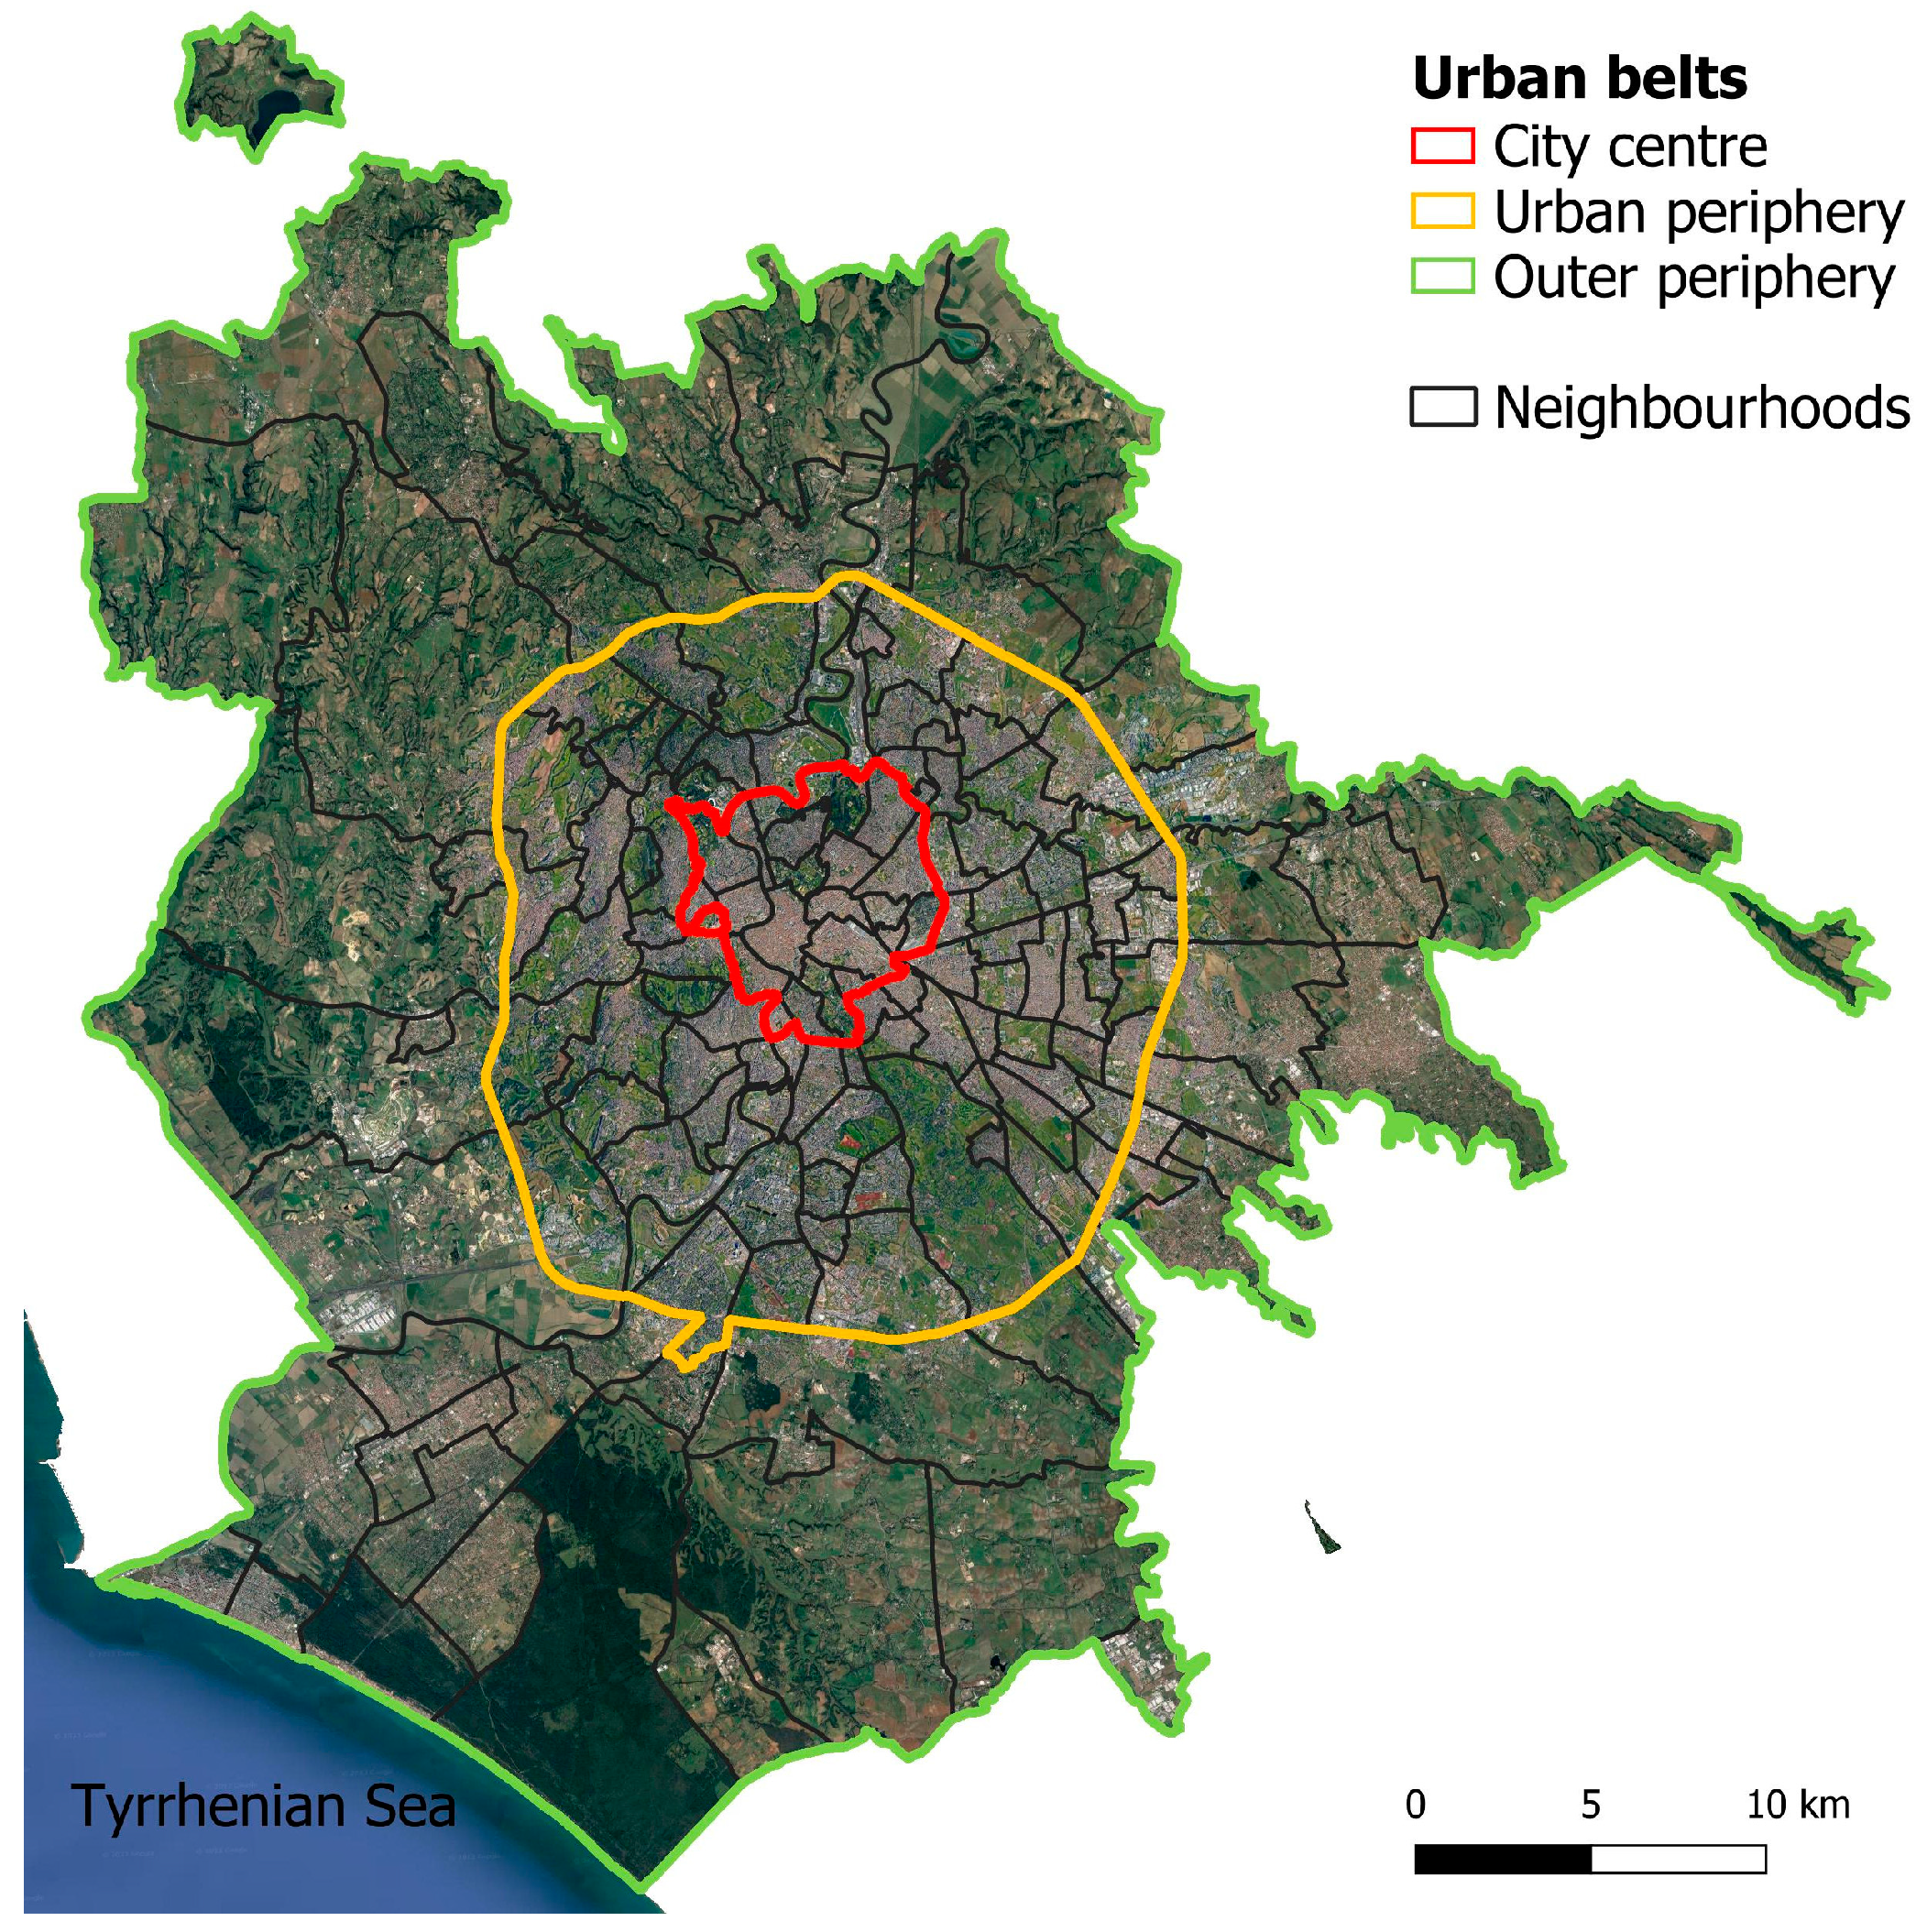
2) and one of the largest in the EU. In order to characterise the territory of the city, it is useful to refer to three sub-areas determined on the basis of the aggregation of the 155 neighbourhoods: city centre, urban periphery, and outer periphery (
Figure A1). The city centre and the urban periphery represent the ‘urban core’ of Rome, the most densely populated area located within the Great Ring Road (the Grande Raccordo Anulare (GRA)), the large freeway that surrounds the city, and include the districts of the ‘consolidated’ city built in the twentieth century (
Figure 1). The city centre includes the historic centre within the ancient Aurelian walls, and has a very high concentration of managerial services, public administration offices, and tourist accommodation. In the urban periphery, the neighbourhoods furthest from the city centre are mainly residential but also include wide areas of public housing. The outer periphery includes vast portions of farmland (the Agro romano) and sparsely inhabited districts located outside the GRA that often lack services and public infrastructure. It contains the more recently built districts that were populated, particularly from the 1970s onwards, as a result of the urban sprawl from inner city neighbourhoods [
42]. In the outer periphery, only some smaller neighbourhoods can be seen as walkable environments, also because these are often areas where residents live in detached houses and use cars to travel to stores and other services.
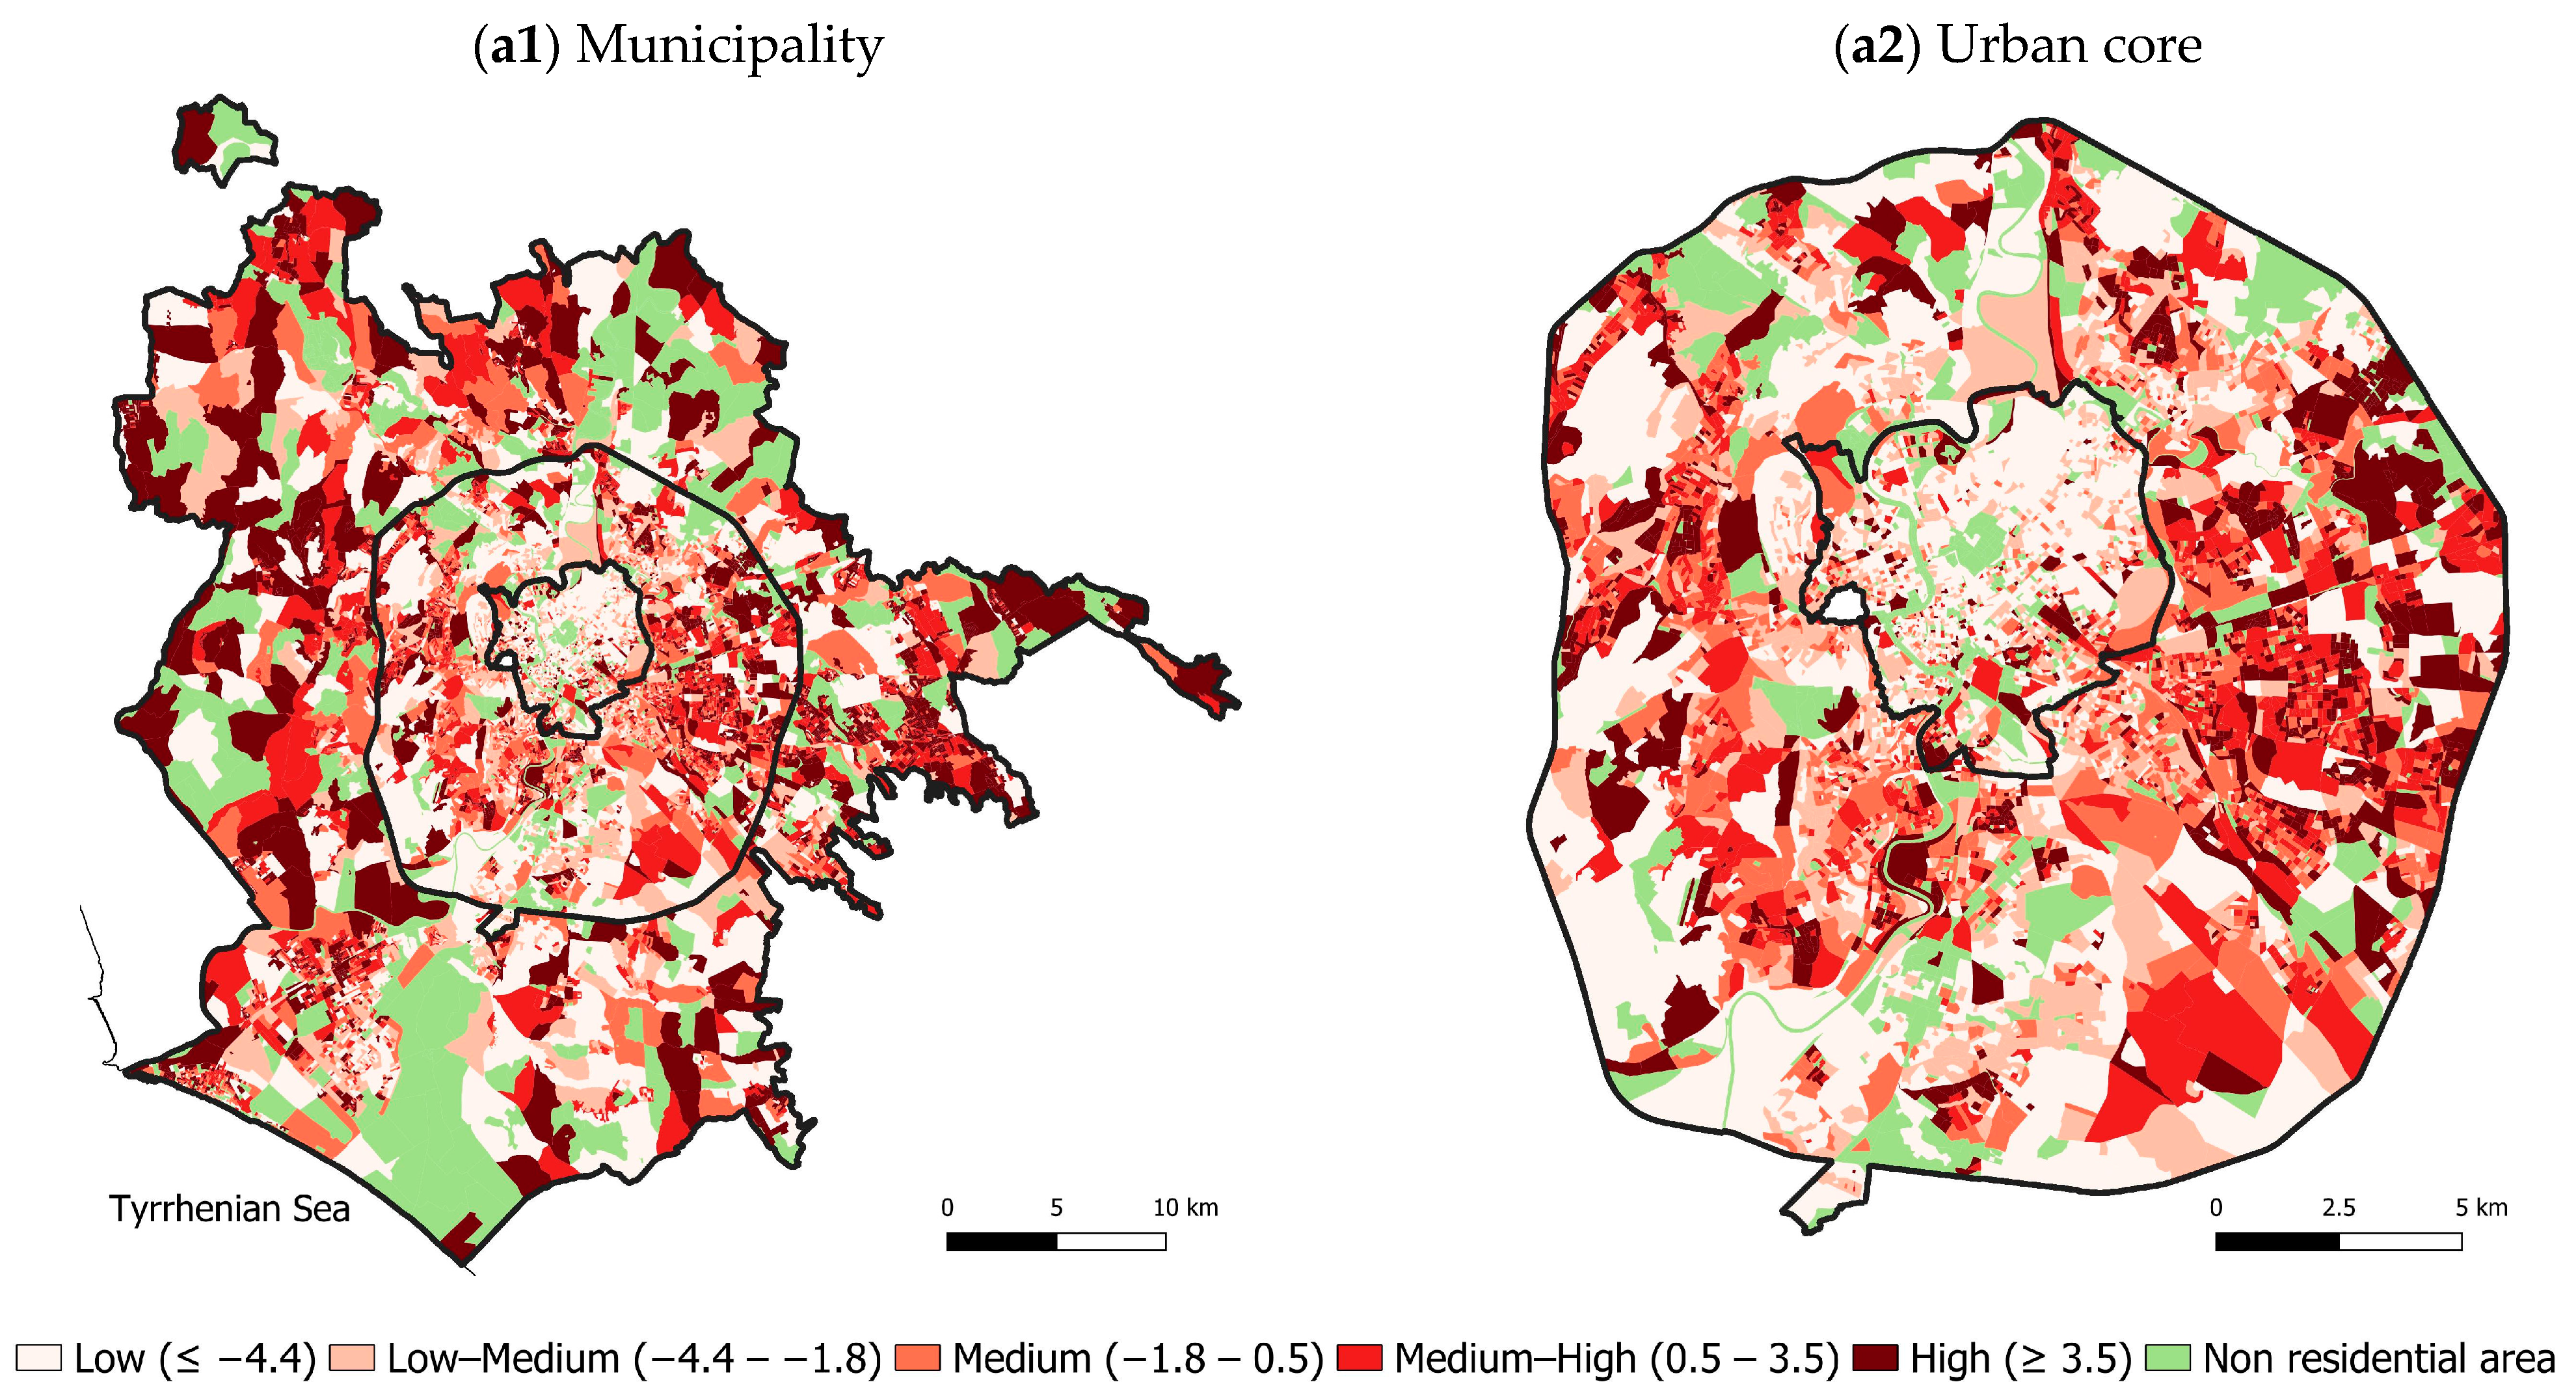
Indicators of social disadvantage and housing crowding by census tract provide a clear and detailed picture of the socioeconomic status of Roman neighbourhoods (
Figure 2 and
Figure 3). The wealthiest neighbourhoods, which have low values on the disadvantage indexes, are mostly found along a north-west/south-east line including the city centre, the northern districts close to the centre, the north-western districts along the via Cassia, and the southern neighbourhoods of the EUR and along the via Appia Antica. The less affluent neighbourhoods are concentrated in the eastern quadrant, where there are many degraded public housing units, and in the western periphery, both inside and outside the GRA. In these areas, both the SDI and the level of crowding of homes are particularly high.
Real estate and rental prices reflect this picture and differ greatly between central and peripheral districts, even after the sharp decline experienced since 2013. Apartment prices are also affected by the high concentration of peer-to-peer accommodation and short-term rentals in the areas closest to the main tourist attractions [
43]. The highest real estate values are in the historic centre (up to 8000 EUR/m
2 in the area of via del Corso) and in some other neighbourhoods of the city centre (up to 5400 EUR/m
2 in the neighbourhood of Parioli). In the urban periphery, the prices are highly differentiated and range from 4300 EUR/m
2 in the district along the via Cassia to around 2000 EUR/m
2 in some neighbourhoods of the eastern periphery close to the GRA, while in the outer periphery, the average prices drop to around 1800 EUR/m
2, but values are very heterogeneous.
Between the 1970s and the early 2000s, the urban core of Rome was strongly depopulated, in part due to peri-urbanisation. The urban sprawl was mainly driven by the cost of housing and was selective, mostly involving native and foreign young adults and families with children. After the 2008 and 2011 financial crises, the first signs of re-urbanisation emerged in the urban core, thanks to the sharp decrease in real estate prices that allowed many families to find a home much closer to the centre [
44].
Rome is at the centre of a long-lasting and heterogeneous migratory dynamic: as of 2020, 186 different nationalities were represented. The city is an important destination for immigrants due to its double role as Italy’s capital and the seat of the Catholic Church, the promoter and coordinator of a wide territorial network of assistance and support for migrants. The majority of immigrants are concentrated in precarious and low-paid jobs. Occupational specialisations emerge based on gender and country of origin, with women very often engaged in domestic work and men in the construction business and the retail and restaurant sectors.
Between the 1970s and 1980s, Italy completed the transition from a country of emigration to one of immigration [
16], and Rome was among the Italian cities absorbing the largest flows of economic migrants from non-DECs. In 1991, there were still only 48,000 foreign residents in Rome (
Figure 4), but after the fall of the Berlin Wall, there was rapid growth, and in 2001, there were 98,000 foreigners, corresponding to 3.9% of the total residents [
45]. In the 2000s, the foreign population grew rapidly, and in 2015 it exceeded 300,000. This increase was linked to the regularisation of many migrant workers following the ‘Bossi–Fini’ law (Law n. 189 of 30 July 2002) [
46] and Romania’s entry into the EU in 2007. The 2008 and 2011 financial crises did not initially slow immigration, and migrants continued to enter sectors of the labour market of Rome that were not directly affected, such as tourism and domestic work. After 2015, restrictive national migration policies helped to slow the increase in the foreign population, which numbered 361,000 in 2020.
5. Descriptive Results: The Settlement Patterns of the Selected Ethnic Groups
In the municipality of Rome, the highest concentration of foreign minorities is seen in the eastern urban periphery, where rental and real estate values are lower (Torpignattara and Centocelle) (
Figure A1). Other neighbourhoods with important levels of concentration are in the western (Primavalle), northern (Tomba di Nerone), and southern (Marconi and Pian Due Torri) urban periphery. In some cases, the concentration also reflects the presence of intensively built-up neighbourhoods with buildings of eight or more floors (Marconi and Don Bosco). In fact, the most widespread types of residential buildings in Rome are the four- or five-storey palazzina in the urban core and the one- or two-storey villas in the outer periphery [
47].
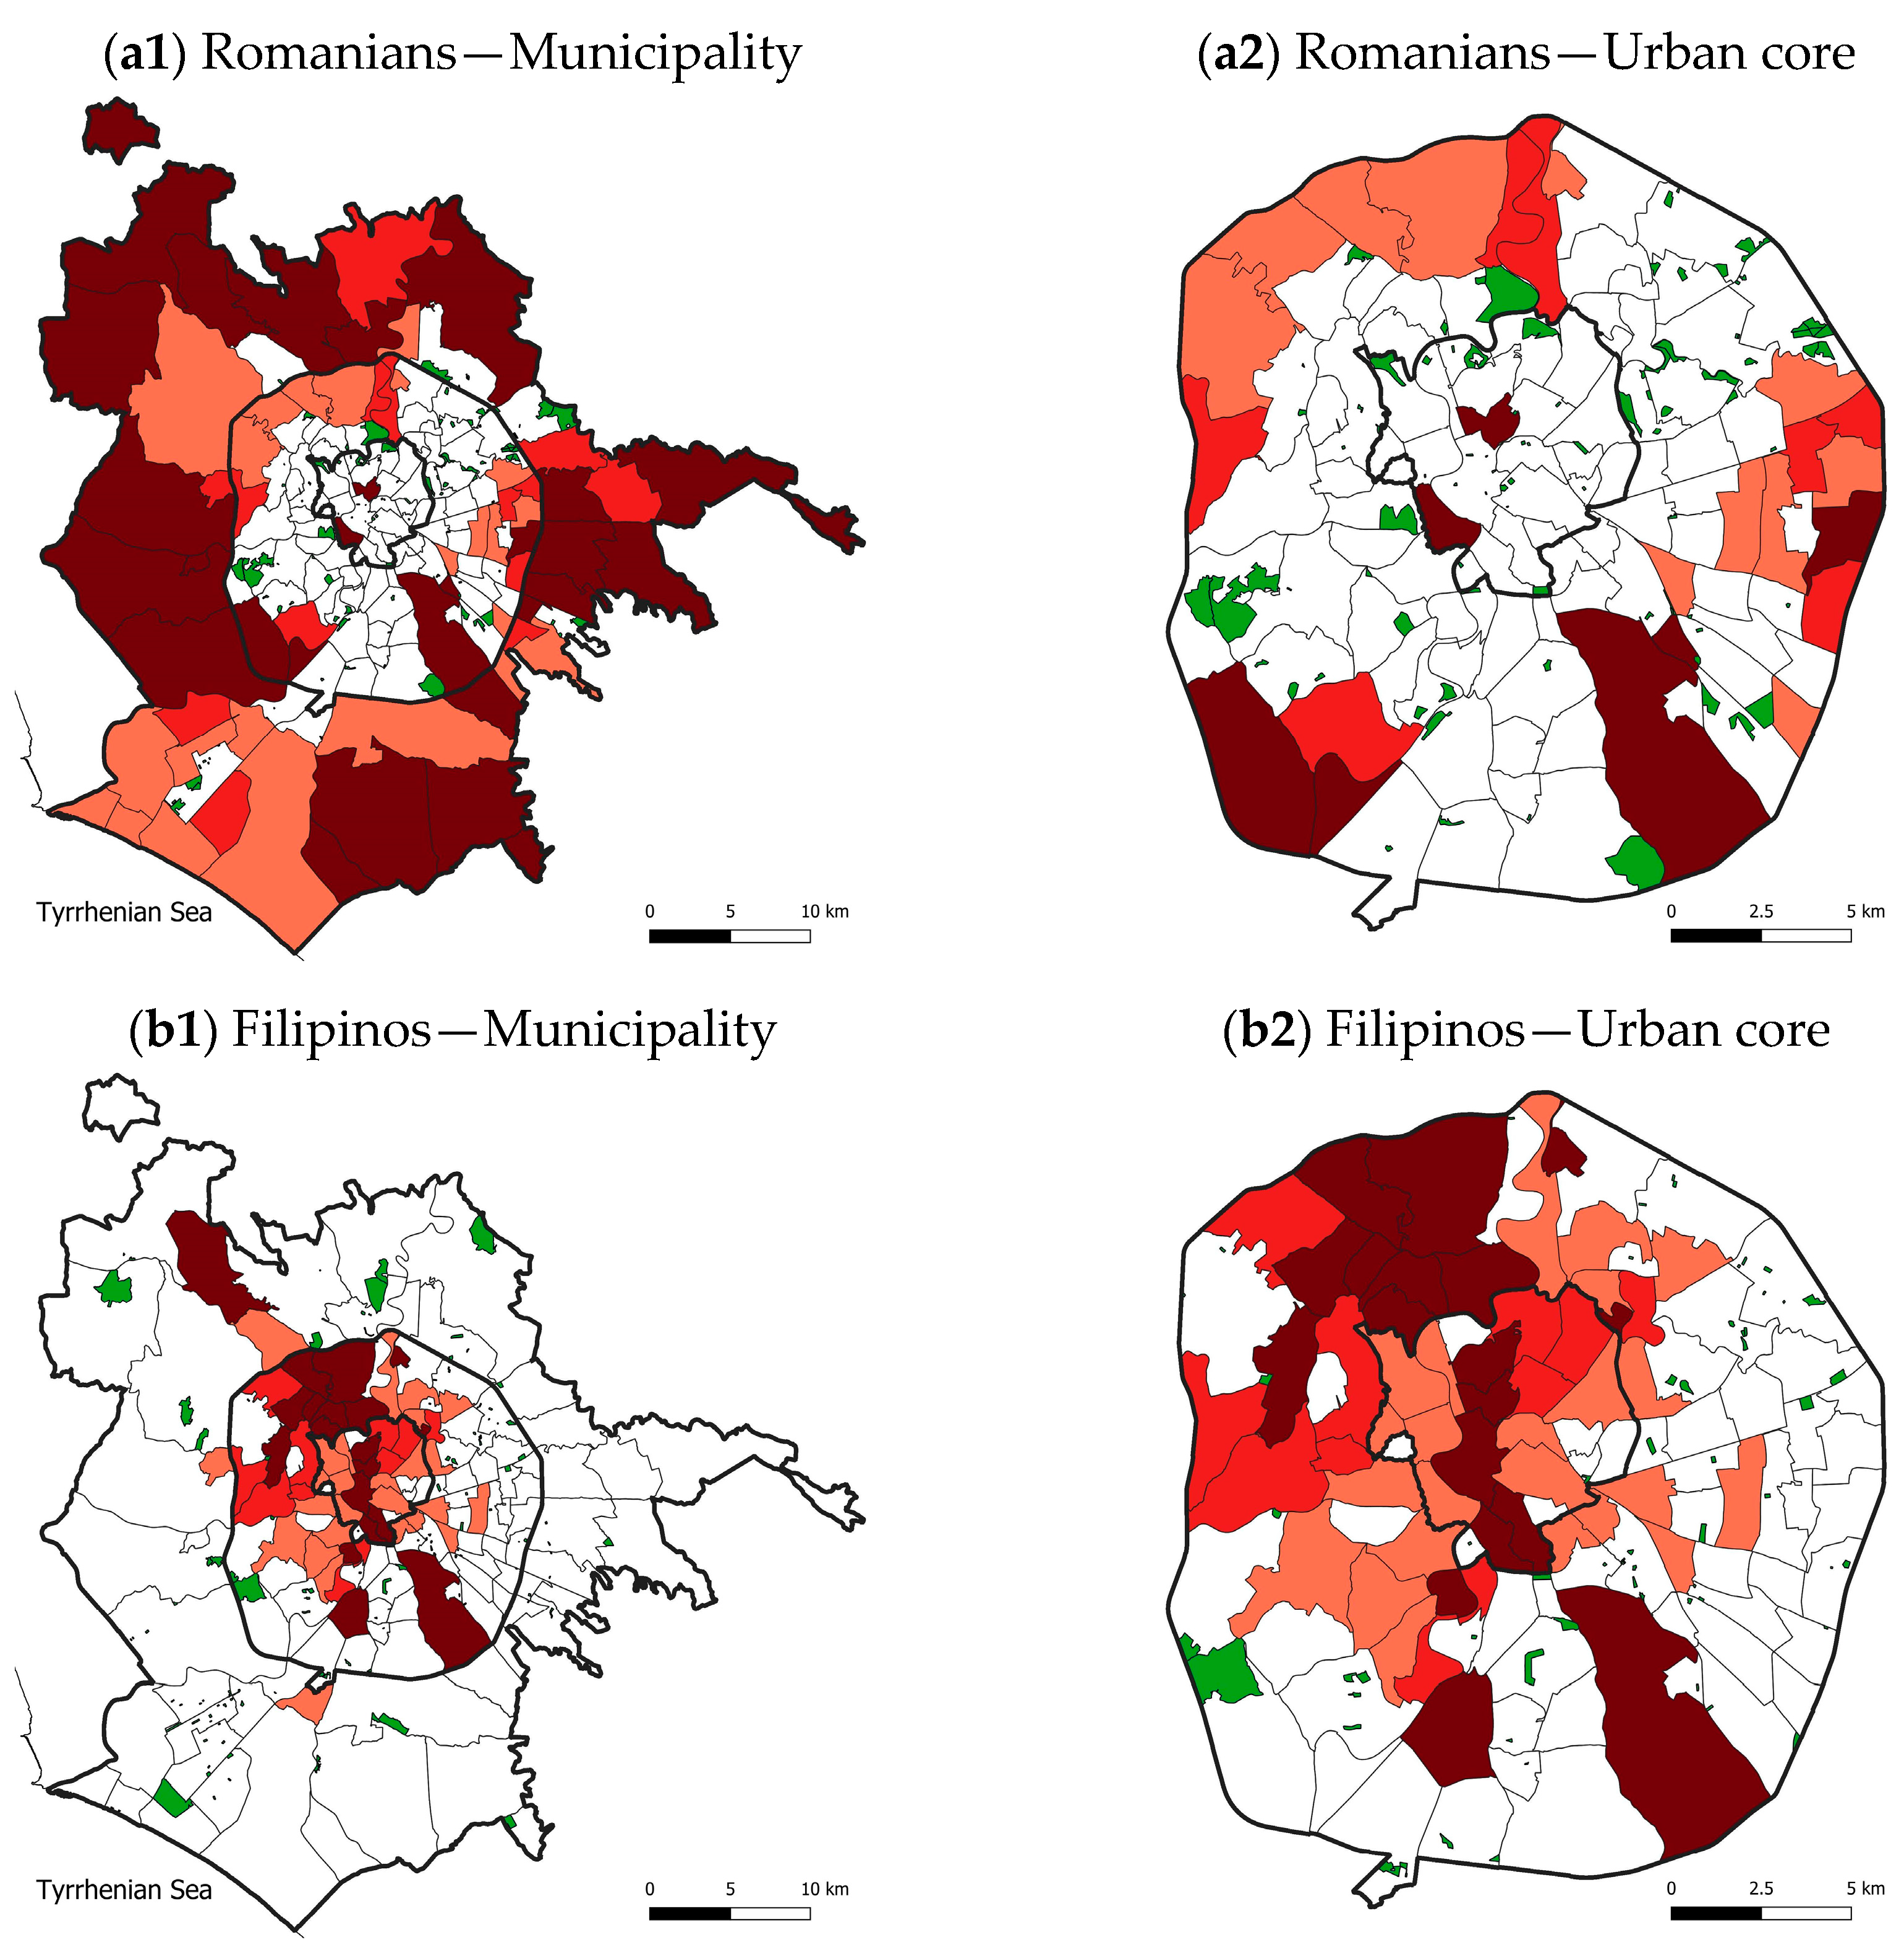
Romanians are the largest national group in Rome. Over the last 20 years, they have experienced very strong growth, from 9000 to 91,000 residents, a majority of whom are women (58.2%). Compared with other groups, they have the lowest DI (0.452) and have a marked peri-urban settlement pattern (
Figure 5a and
Table 2). Romanians are mainly concentrated in the less affluent eastern neighbourhoods and in the areas outside the GRA, principally along the via Casilina and the via Prenestina, where many lower-middle-class Italians moved to before the 2008 financial crisis [
44]. Their more flexible residential localisation between the urban core and outer periphery is also due to widespread car ownership, which is essential for commuting towards the rest of the huge territory of the city and maintaining transnational ties with the country of origin [
18,
21]. Romanian women are often in domestic work, and the men work mainly in construction. The average individual annual income of Romanians living in Rome (EUR 15,400) is slightly higher than the average for foreign nationals (EUR 14,900).
Filipino migration to Rome started in the 1970s, and Filipinos are the second largest group (42,000 residents), a majority of whom are women (58.3%). They are traditionally concentrated in household and family care services [
48] and live mainly in the most affluent neighbourhoods of the city centre (Parioli and the historic centre) and the north-western urban periphery (along the via Cassia), where they often live with their employers’ families [
49] (
Figure 5b). In recent decades, they have spread across many lower-middle-class districts in the urban periphery (Marconi and Primavalle), often close to the areas where their domestic work activities are concentrated, as part of a process of housing upgrading. The high level of integration of the Filipino community in Rome is also confirmed by the fact that a quarter of Filipino residents are over 55 years old, and more than a fifth have been in the city for more than 20 years. The average annual income of Filipinos in Rome is slightly lower (EUR 13,900) than the average for foreign nationals.
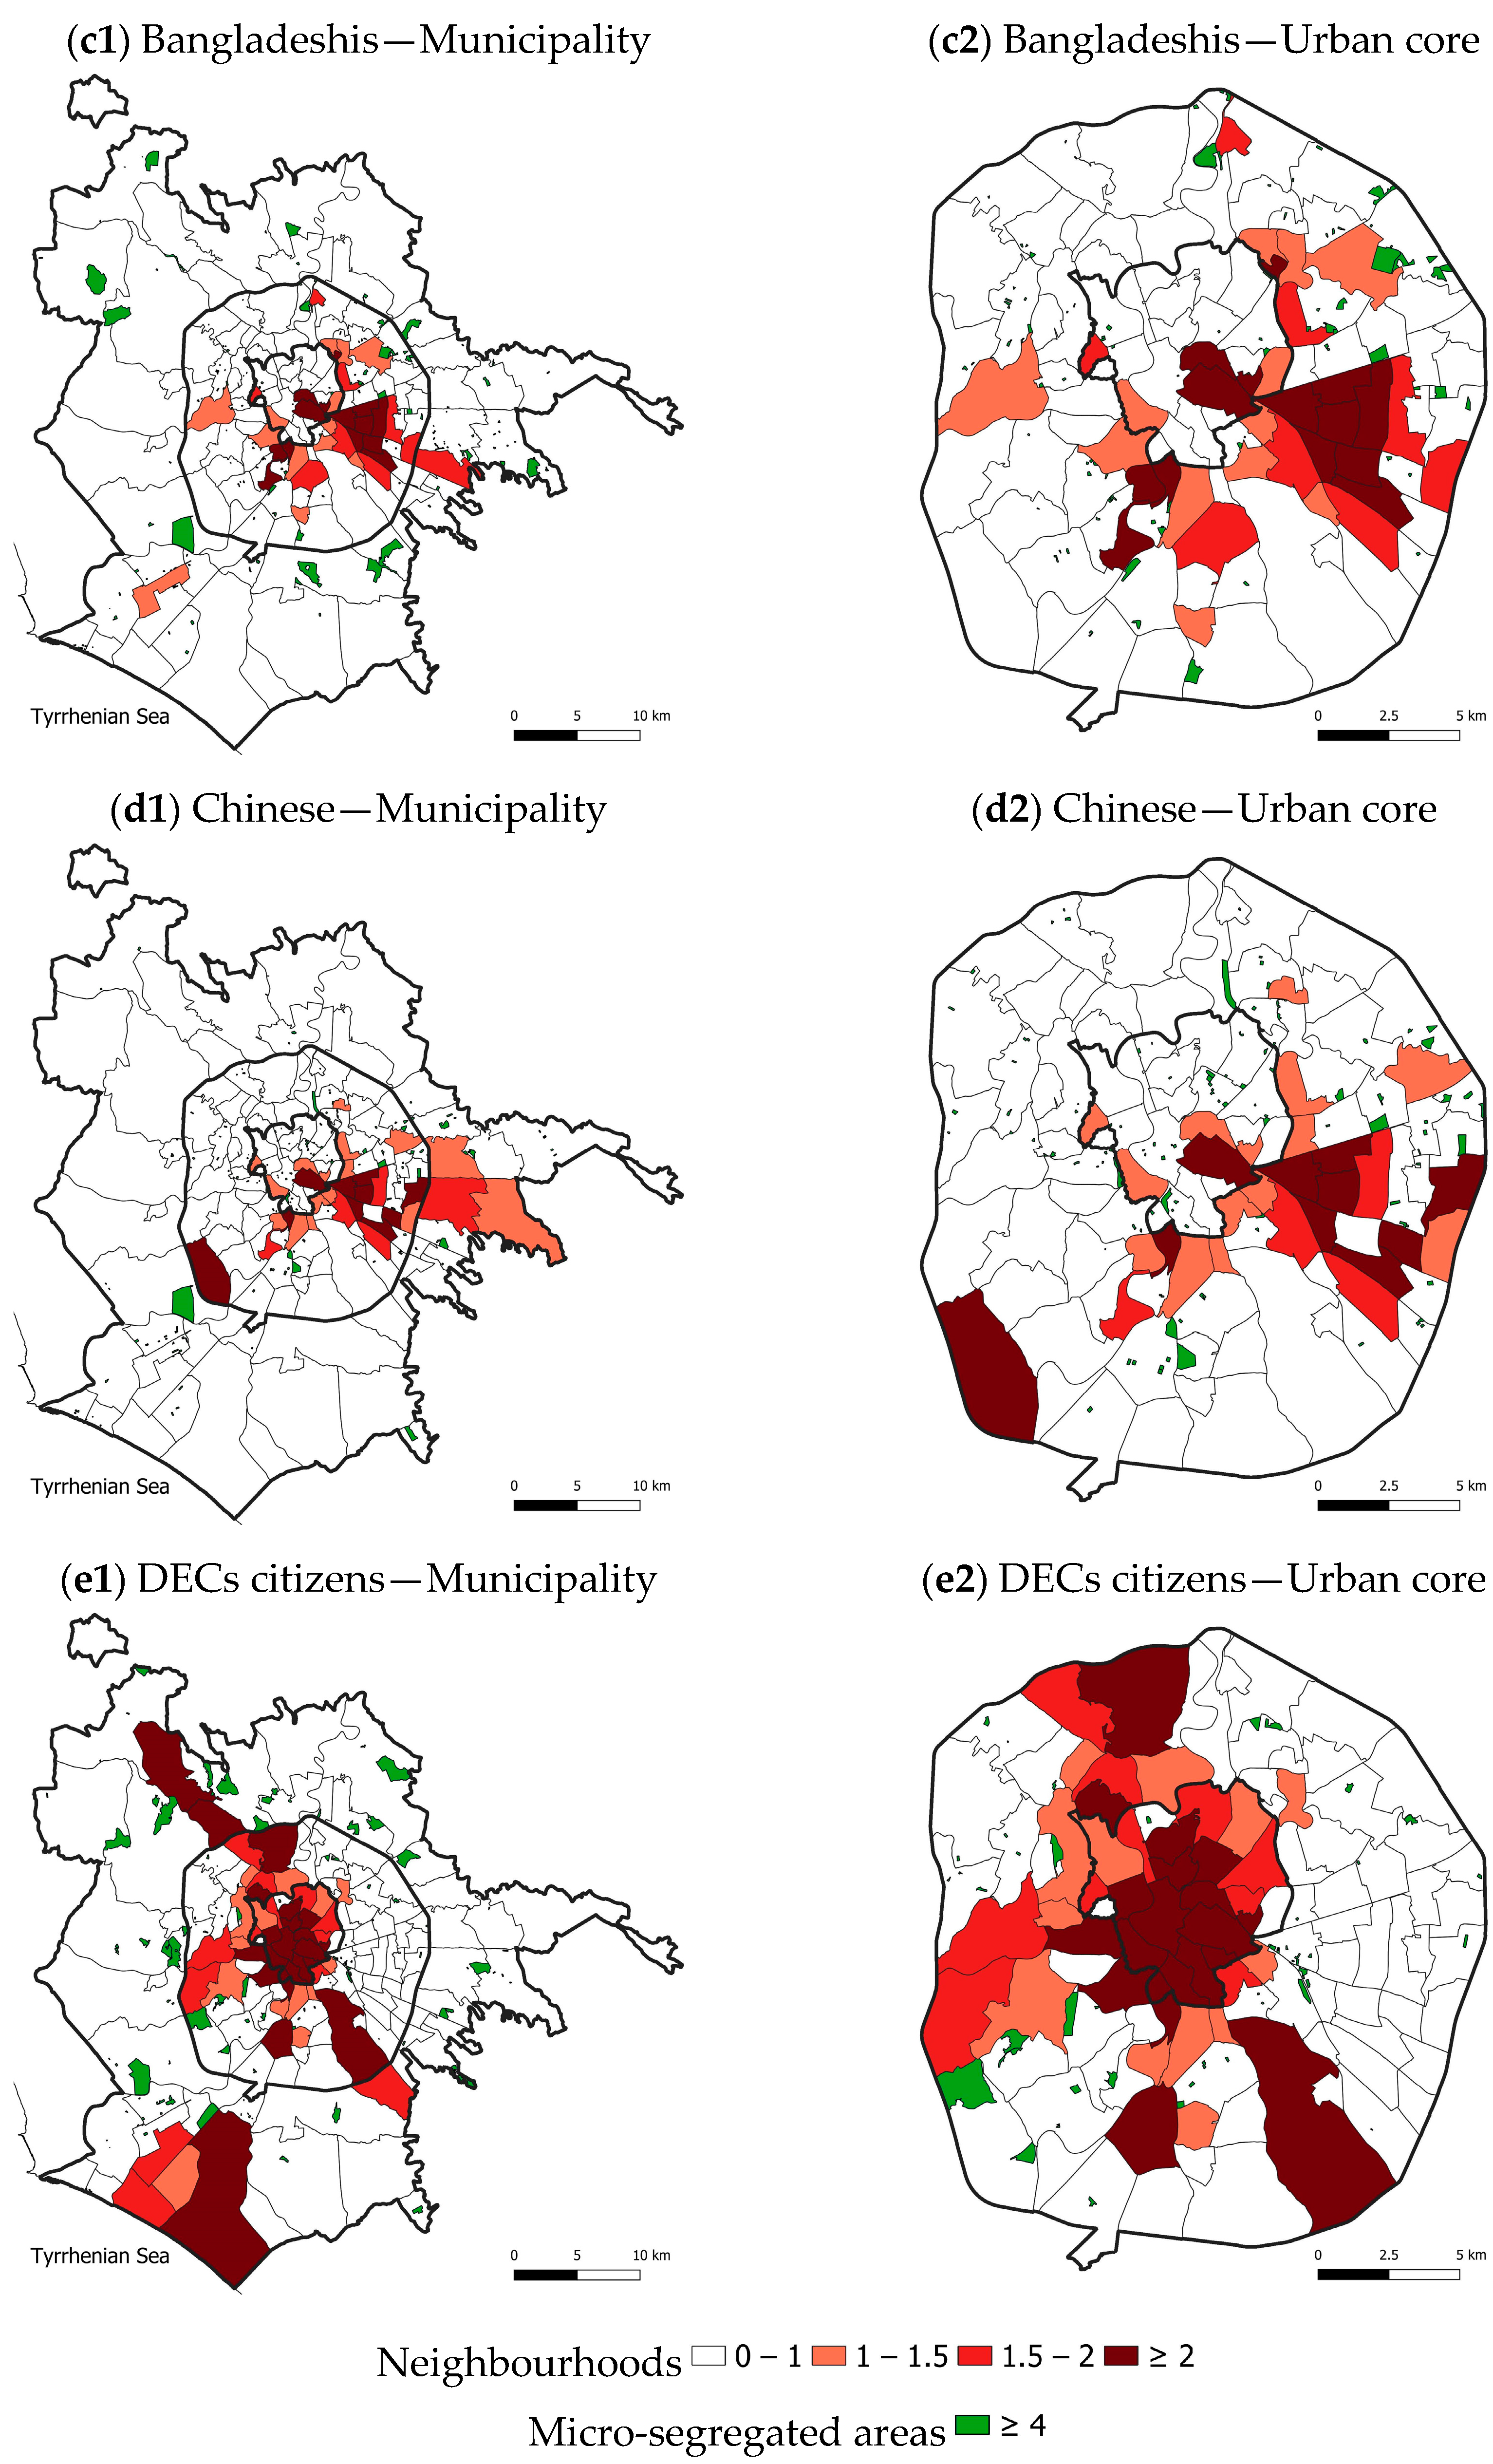
Bangladeshis are the third largest ethnic group in Rome (32,900 residents), and a large majority is male (only 28% are women) and young, with only 2% of Bangladeshi residents being over 55 years old. In fact, only one in 50 Bangladeshis has been a resident of Rome for more than 20 years. They have increased in number more than tenfold in the last 20 years (3000 residents in 2001), with men initially arriving alone and, in some cases, being joined by women later [
50,
51]. Bangladeshis traditionally prefer a central location in the less affluent eastern quadrant of the urban periphery (
Figure 5c) and are concentrated in the neighbourhood of Torpignattara, consequently nicknamed ‘Bangla-town’ [
52]. In recent decades, they have also spread to other semi-central districts (Marconi), where they often work in small shops (i.e., mini-markets). Despite this, their DI is still high (0.655). Bangladeshis’ average income is much lower than the average for foreigners living in Rome (EUR 11,000).
Chinese are the fourth national group (19,500 residents) and have a balanced gender distribution that reveals the familial nature of their migration, although 56% of residents are reported to be single. They are involved in ethnic entrepreneurship activities, mainly restaurants, small stores, and wholesale clothing trade [
46,
53], and have an average income close to that of the Filipinos (EUR 14,000). Chinese have the highest level of residential segregation among the selected groups (DI = 0.693) and often show spatial concentration in overcrowded micro-areas. Their settlement pattern is similar to that of Bangladeshis, concentrated in the eastern part of the urban periphery in the Esquilino and Torpignattara neighbourhoods (
Figure 5d), where many of their businesses are also based [
17].
The group from DECs includes several culturally homogeneous nationalities. This group totals 23,500 residents, mainly women (60.3%), and has shown the least growth of all the groups considered over the last two decades. This group also has the oldest age structure, with more than one third of residents over the age of 55, and shows strong inclusion, with nearly one quarter having lived in Rome for more than 20 years. Among the most numerous nationalities in this group are migrants from France, Spain, and North America, who prefer to reside in the well-off neighbourhoods of the city centre or the adjacent districts (
Figure 5e). These are often the most valuable and tourist-oriented areas of the historic centre of Rome—such as Trastevere or the areas near the basilica of Saint Peter and the Colosseum—or where their workplaces in high-skill sectors are concentrated [
26]. The DECs group has socioeconomic characteristics similar to those of upper-middle-class Italians [
46] and provides an interesting comparison to the other minority groups.
Figure 6 visualises more directly the differences across ethnic groups and the classification of census tracts based on their degree of segregation. As is evident, the distribution of the five minority groups by level of concentration in the census tracts provides some remarkable information regarding settlement patterns. The LQ index values highlight that the Romanians have the most uniform distribution on the territory of Rome of all the groups considered, with the under-representation category being most frequent (28.5% of the Romanians live in a census tract with an LQ < 1) and over-representation the second most frequent category (25% where LQ ≥ 4). Chinese and Bangladeshis show a much higher percentage of residents in micro-areas with a very high concentration of compatriots (57.5% and 51.6%, respectively), while the share of those living in areas characterised by under-representation (LQ < 1) is much lower (8% and 9.3%, respectively). Filipinos and DECs citizens exhibit rather similar distributions, with a higher share of residents in the micro-areas where compatriots are concentrated (35.3% and 36.7%, respectively) and a still important share in the micro-areas where other national groups are more present.
6. Multivariate Results: Highlighting Specificities of Ethnic Groups in the MSAs
This section intends to answer the research questions about the micro-segregation of minority ethnic groups through a descriptive and multivariate approach, using an original 2020 population register dataset on the population residing in Rome. Studying micro-segregation patterns is important because it allows for the emergence of social and spatial hierarchies that are often not evident within socially or ethnically mixed neighbourhoods [
12,
13].
In this study, we define an MSA as a micro-area where there is a very high concentration of an ethnic group (LQ ≥ 4) located within a neighbourhood where that group is under-represented (LQ < 1). Through a descriptive analysis and a series of detailed maps of the Rome area, the spatial distribution of MSAs between the centre and urban periphery and the main sociodemographic characteristics of residents are presented for each of the five selected ethnic groups. Then, bivariate logistic models are developed to highlight how the characteristics of individuals residing in MSAs differ from the characteristics of those living in micro-areas with high concentrations of co-nationals located within neighbourhoods that also exhibit over-representation. This approach makes it possible to characterise MSAs for each minority group, interpreting them with a key based on the groups’ specific socioeconomic profiles.
The 723 MSAs that emerge based on our definition account for 5% of the census tracts in Rome, 35 of which are MSAs for two or more ethnic groups at the same time (
Table 3). Despite differences in the demographic size of the groups, the MSAs are fairly evenly distributed among them, with Chinese having the most MSAs (174) and Romanians having the fewest (120). Ninety percent of MSAs are distributed almost equally between the urban periphery and the outer periphery, and fewer than 10% are in the city centre. Romanians and Chinese have a higher share of the MSAs in the city centre (18%) and, in general, have the largest share of MSAs in the urban core. Migrants from DECs, Filipinos, and Bangladeshis, on the other hand, have a high share of MSAs in the outer periphery, ranging from 48% to 57%.
The distribution of MSAs in each group is obviously conditioned by the spatial location of the neighbourhoods with over-representation (
Figure 7), which explains the low percentage of Romanian MSAs in the outer periphery and Filipinos and DECs MSAs in the city centre. Observing the maps in
Figure 7, one can see a strong heterogeneity in the area width of MSAs. The smallest MSAs correspond to a block, or even a portion of a block, and are concentrated in the areas of Rome where housing density is highest, especially in the urban core but also in the eastern (along the via Casilina) and southern (along the via del Mare) quadrants of the outer periphery. The MSAs with the largest area are mainly found in the outer periphery, and sometimes in the urban periphery close to the GRA, and correspond to very small urbanisations or scattered houses with large portions of agricultural land attached.
We employ binary logistic models to control the specific role played by individual and context characteristics with regard to the likelihood of living in an MSA. As individual covariates, we use sex, age, civil status, and length of stay in Rome (in years), while as context factors, we use the SDI and RCI. In all the models, the dependent variable is the same, that is, whether an individual lives in an MSA or in a micro-area inside a neighbourhood with over-representation of their own ethnic group. If the results point in the same direction, we may argue that these models, considered together, are a fairly strong argument for the existence of cross-national settlement and integration patterns; otherwise, we should consider different models valid for different ethnic groups. The models, therefore, allow us to examine whether the hypotheses are valid with respect to the assumed patterns of integration of the ethnic groups, such as the spatial assimilation and ethnic enclave theories. In particular, we explore whether the situation of micro-segregation of immigrants belonging to different ethnic minorities and having different duration of residence, changes independently of the cultural proximity to the native population and the socioeconomic status of the neighbourhood.
The spatial distribution of MSAs influences some of the results of the Romanians’ model (Model 1). As we have seen (
Figure 7a), the MSAs of the Romanians are mainly located in the central and semi-central areas of Rome, whereas the neighbourhoods with an over-representation of this ethnic group are in the suburbs farthest from the city centre. We could say that the Romanians’ MSAs allow us to highlight some interesting exceptions to their well-known peri-urban settlement pattern [
21]. The greater propensity of women to reside in an MSA (+14%) seems to be linked to the gender differences in market sectors and occupations, that is, to the fact that women are more constrained than men, living near the historic districts where there are more employment opportunities in domestic work and commercial activities. From this perspective, the spatial assimilation pattern seems to hold true for Romanians, in contrast to the other groups. In fact, the probability of living in an MSA increases with increasing age and when residence in Rome extends beyond 20 years (+75%). The socioeconomic characteristics of the micro-area of residence also yield some interesting results. The probability that Romanians reside in an MSA increases very significantly when the socioeconomic and housing status in the micro-area of residence is high.
Filipinos have the least-defined profile of all the national groups in regard to individual variables, although they are characterised by some interesting features (Model 2). With regard to age, only the 40–54 age group shows a significant odds ratio, with individuals in this age group being 20% more likely than the reference group (20–39 years) to reside in an MSA. As for marital status, single or divorced Filipinos are more likely to reside in an MSA. Moreover, Filipinos who have been residing in Rome for more than 20 years have a 25% lower probability of living in an MSA than those who have been there for under three years. There is no clear influence of the socioeconomic status of the micro-areas of residence, partly as a consequence of the rather varied spatial distribution of Filipinos’ MSAs (
Figure 7b), with some MSAs located within wealthy neighbourhoods in the southern quadrant and others belonging to the less affluent eastern periphery. High levels of housing crowding are associated with a greater propensity of Filipinos to reside in an MSA, probably because they tend to be concentrated in the wealthier neighbourhoods of Rome, which are characterised by larger flats and lower housing density.
Bangladeshis residing in Rome display a marked gender imbalance, with men accounting for approximately three quarters of the total population. Consequently, Bangladeshi men are most likely to live in an MSA (Model 3), either alone or in cohabitation with male compatriots; moreover, Bangladeshi women usually live in couples with or without children [
51]. Considering the other individual covariates, young adults (20–39 years old) and those who have been in Rome for less than three years are most likely to settle in MSAs. In particular, as the length of residence increases, the probability of being in an MSA decreases, reaching its minimum for those who have been in Rome for over twenty years. This supports the hypothesis that Bangladeshis have a propensity to live in neighbourhoods with a high concentration of compatriots, benefiting from the support of ethnic social networks, according to the ethnic enclave model [
51]. In regard to context variables, when the level of socioeconomic disadvantage in the micro-area is low, Bangladeshis are more than twice as likely to be in an MSA than in a neighbourhood with a high concentration of compatriots. The RCI shows a less linear trend. Overall, the results of this model confirm the over-representation of Bangladeshis in some semi-central but poorer areas of the eastern quadrant of the urban core (
Figure 5c). For Bangladeshis, residing in an MSA seems to correspond to a move outside the city centre, on the one hand (
Figure 7c), and an improvement in the socioeconomic status of their neighbourhood, on the other. In this respect, our findings show that the Bangladeshis settling in Rome have not rigidly followed the usual ethnic enclave pattern observed in other European cities [
50,
51], and their MSAs are present almost all over the city.
For the Chinese (Model 4), as age and length of stay increase, the probability of residing in an MSA, rather than in a neighbourhood with an over-representation of compatriots, decreases. More precisely, the probability of residing in an MSA decreases by 25% from the 20–39 age group to older age groups and by 35% when the duration of residence extends beyond 10 years. Being married is undoubtedly associated with the propensity to live in an MSA (+25% compared to those who are single or unmarried). Looking at the contextual characteristics, the settlement of Chinese in an MSA is more than five times more likely when the social status of the area is higher, although sometimes these tracts are also characterised by a high level of housing crowding. Indeed, as we have shown (
Figure 7d), the MSAs of Chinese are more often located in central or semi-central districts than those of other ethnic groups, so this migrant group often lives in conditions of overcrowded cohabitation with co-ethnics [
46]. Here we have an indication that the MSAs of Chinese, even more than neighbourhoods with a high concentration of co-ethnics, tend to be within the urban core. This result suggests the influence of the relational and economic characteristics of the Chinese community on its settlement patterns and the lack of heterolocalism, a pattern consisting of operating businesses in the centre city and residing in the suburbs [
21,
49].
Finally, in the DECs group (Model 5), women show a much higher propensity than men to reside in an MSA (+43%). It should be recalled that most MSAs of DECs migrants are located in peripheral areas far from the city centre and the well-off neighbourhoods where they are over-represented (
Figure 7e). Furthermore, as highlighted by other studies [
45], the prevalent motivation for moving to Rome for men in this group is employment in high-skilled activities, while for women it is family. This may explain the greater propensity of men to settle in micro-areas located in central districts where the city’s most valuable functions are concentrated. Family-related motivations may also explain why the probability of residing in an MSA is higher for young people still in school and pre-school (+60%) and for married individuals (+39%). When the length of stay exceeds ten years, the probability of living in an MSA increases by 30%, in line with the spatial assimilation hypothesis [
54]. With regard to the context variables, the MSAs of DECs migrants are essentially confirmed as micro-areas of significantly lower socioeconomic status than neighbourhoods where they are over-represented. The settlement pattern of the DECs group seems to be very close to that of Italian nationals. Considering the MSAs, we could assume that they first settled in the central areas of the city and then moved towards the outskirts after starting a family [
27].
In short, the results presented in
Table 4 confirm that individual and socioeconomic characteristics of minority ethnic groups do indeed matter for residential choice and show the existence of different trends across the different national groups. The coefficients obtained for age groups and length of stay, as well as for the socioeconomic level of the neighbourhood, in the case of Romanians and the DECs group (Models 1 and 5), provide empirical support for the spatial assimilation model, whereas for Filipinos, Bangladeshis, and Chinese (Models 2–4), they seem to support the ethnic enclave model.
7. Discussion and Conclusions
In this paper, we studied the micro-segregation of selected ethnic minority groups in Rome. We defined MSAs as very small portions of territory, equal in most cases to a single block or a portion thereof, showing a strong over-representation of a specific ethnic group despite being located within a neighbourhood where that group is under-represented. This approach highlights how segregation can take on different connotations depending on the spatial scale used and allowed us to highlight interstitial micro-areas embedded in ethnically differently connoted neighbourhoods that can be considered inconspicuous and ‘hidden’ situations of high ethnic segregation. With this perspective in mind, it is possible to interpret ethnic groups’ areas of micro-segregation as ‘settlement exceptions’, which may represent an evolutionary and innovative element with respect to their usual patterns of integration.
The consideration of five ethnic minority groups—from Romania, the Philippines, Bangladesh, China, and DECs—with heterogeneous characteristics in terms of socioeconomic status and migration history was helpful in bringing out the interplay between diversity of place of origin, social class, settlement patterns, and forms of residential segregation. In fact, the large cities of southern Europe are a mosaic of social zones which are socially, ethnically, culturally, and economically differentiated, and the spatial distribution of the ethnic groups reflects the interaction between labour and housing markets, which act as filters for the selection of activities and social groups [
55].
In Italy the public housing sector is very limited, and social housing is residual and stigmatised [
32]. Among Italian families, there is a large predominance of owner occupation, which, in Rome, reaches 70%. Housing opportunities in the private market for poorer migrants are scarce and of low quality, and local housing policies are often non-inclusive [
56]. These are all issues that limit immigrants’ range of housing opportunities and contribute to slowing the process of spatial assimilation [
57]. As a consequence, many differences in settlement patterns of the selected ethnic groups appear related to the interplay between real estate constraints and labour market specialisation. Romanians are mainly settled in suburban areas where real estate values are more affordable and where many lower-middle-class Italians moved before the fall in housing prices following the 2008 financial crisis [
44]. Filipinos reside mostly in affluent downtown neighbourhoods where the families for whom they perform domestic work live. Bangladeshis and Chinese are clustered in the poor eastern urban periphery, where many of their businesses are also based. DECs citizens are more likely to reside in the affluent districts of the city centre, not far from their workplaces in high-skill sectors. Interestingly, in another south European capital, Athens, the same national groups show similar settlement patterns, conditioned by employment activities and real estate values, with the difference being that in the Greek metropolis, the most affordable apartments are found mainly in the urban core and much less in the first ring of the periphery [
58].
The residents in MSAs, depending on the minority group to which they belong, have specific and different characteristics in relation to individual sociodemographic and migration profiles, spatial location between city centre and outer periphery, and socioeconomic status in the micro-area. The analysis showed a greater propensity for Romanian women to live in an MSA in the urban core than men, who are more suburban. This result may be explained by the high involvement in domestic work that constrains Romanian women to a residential location in well-off areas close to the centre where there are more job opportunities, including cohabitation with the employer’s family. In contrast, Filipinos, who are usually concentrated in well-off areas where they perform domestic work, reside in MSAs that often have disadvantaged social and housing conditions. It is known that the organisation of the welfare and housing system in southern European countries assumes a major role in influencing the residential choices of ethnic groups and the marginalising of individuals with limited financial resources [
59]. The Italian welfare state regime attributes a central role to the family in providing basic assistance, relying heavily on the commitment of women to work and care within the family. This model is under increasing pressure due to the growing involvement of women in the labour market and population ageing [
60]. As a result, there is a strong demand for domestic work and care services, which is often met by immigrant women, especially in large urban areas such as Rome and Milan [
61].
In order to offer a more in-depth interpretation of the settlement behaviour of the ethnic groups in the MSAs, the length of residence in Rome was considered to be positively correlated with higher levels of acculturation. In fact, the spatial assimilation model assumes that the years since migration have an effect on the level of spatial concentration and the chances of integration into the host society, corresponding to the length of exposure to the local community [
62]. Consequently, the longer an immigrant lives in the host society, the greater their orientation towards this country, and thus, the lower the propensity to live in an ethnic enclave. In the specific range of models used in this work, the variable of years of stay reveals different propensities toward a gradual dynamic of spatial assimilation by ethnic groups. More specifically, on the one hand, Romanians and DECs citizens exhibit a strongly increasing propensity in the long term (10–20 years) to reside in an MSA rather than in a neighbourhood with a high concentration of co-ethnics. On the other hand, as far as Bangladeshis, Chinese, and Filipinos are concerned, the model does not offer any empirical support for the spatial assimilation hypothesis. The settlement in MSAs of these three groups is much more likely to occur in the early years of residence in Rome, and with the passage of time, there is an increasing propensity to live in a neighbourhood where their ethnic group is over-represented rather than in an MSA. These findings are in line with the ethnic enclave perspective which argues that migrants’ residential segregation tends to increase, rather than decrease with the time spent in the host country. More generally, the longer a person has resided in a certain place, the more likely they are to develop location-specific insider advantages [
63,
64], such as work and family ties, or place attachment [
65], which constitute disincentives to move. Turning back to our case, newly arrived migrants from Bangladesh, China, and the Philippines may not yet have developed such attachments, and this would explain their greater propensity to settle in an MSA than their co-ethnics who have lived in Rome for a longer time.
In this paper, an attempt is made to determine the reasons for the settlement choices of ethnic groups based on the observation of demographic, socioeconomic, and housing characteristics and using an original and granular dataset from the population register of Rome. However, it should be pointed out that, compared with many other studies with similar aims carried out mainly in northern European countries [
54], several limitations had to be faced, such as the availability of only a small number of individual and contextual variables and the absence of longitudinal data. More generally, the limitations of an approach based only on information from administrative records on population and housing should be highlighted. The use of a qualitative–quantitative mixed-method approach would allow for a more in-depth delineation of individual attitudes and preferences relevant to the decision-making process of migrants in the MSAs, bringing out additional explanatory elements that could also relate to place stratification theory [
66].
The different settlement and integration patterns of the immigrant groups in Rome is a result of multiple socio-spatial micro-processes. Among these, the outcomes of this paper show the importance of the socioeconomic status of the micro-area of residence, which through its specific location in the wider city space, offers important information on the settlement behaviour of national groups. However, many other factors only hinted at in this work—demographic diversity, differential integration in the labour and housing markets, unequal integration prospects—might help to illuminate the multifaceted mosaic of immigration in the urban area of Rome.
The concern that a high spatial concentration of poor households with an ethnic background may have negative implications for social cohesion has led to the diffusion of mixed neighbourhood policies in a number of European countries [
67,
68]. The literature dealing with the social consequences of residential segregation and policies aimed at creating ‘balanced communities’ has generated several doubts about the actual usefulness of creating ethnically mixed spaces while also highlighting the potential social, cultural, and economic benefits for immigrants of living in an ethnic enclave [
5,
69].
Within this framework, micro-segregation studies allow us to examine residential segregation from a different perspective, one that highlights social and ethnic spatial differentiations, even in neighbourhoods characterised by a social mix. This perspective can help uncover situations of exception within specific ethnic groups that will be interesting to keep under observation and investigate. In particular, a future direction for this research will be to explore, through a survey and in-depth interviews within a mixed method approach
3, residential segregation patterns and reasons for moving or staying within a micro-urban context.


