Article

Urban Green Innovation Efficiency in China: Spatiotemporal Evolution and Influencing Factors

1
College of Geography and Environment, Shandong Normal University, Jinan 250358, China
2
Collaborative Innovation Center of Human–Nature and Green Development in Universities of Shandong, Shandong Normal University, Jinan 250358, China
*
Author to whom correspondence should be addressed.
Land 2023, 12(1), 75; https://doi.org/10.3390/land12010075
Submission received: 23 November 2022 / Revised: 17 December 2022 / Accepted: 23 December 2022 / Published: 26 December 2022

Abstract

:
Investigating urban green innovation efficiency (UGIE) is imperative because it is correlated with the development of an ecological civilization and an innovative country. Spatiotemporal evolution and influencing factors of UGIE are two important scientific problems that are worth exploring. This study presents an indicator system for UGIE that includes input, expected output, and unexpected output, and employs a super-efficiency slacks-based measure (super-SBM) to calculate UGIE in 284 cities at or above the prefecture level in China from 2005 to 2020. Then, we adopted spatial auto-correlation to identify its spatial differences among these cities and Geodetector to evaluate its influencing factors. The results are as follows: (1) The overall UGIE tended to rise, except in northeastern China, megacities, and super large-sized cities. (2) The UGIE of Chinese cities exhibited remarkable spatial differences and auto-correlation, and the “low-low” type enjoyed the most local spatial auto-correlations. (3) Sociocultural factors represented by the number of collections in public libraries became the most important factors affecting the UGIE in China.

1. Introduction

Economic downturn and environmental pollution are two problems facing the world today [1,2,3,4,5]. The fundamental way to actualize economic recovery and promote high-quality economic development lies in innovation [6,7,8]. In an effort to cope with environmental problems and maintain harmony between humans and nature, green development concepts must be implemented [9,10,11]. Hence, green innovation, which blends two critical concepts, green and innovation, is considered an ideal solution to the current pressures [12,13,14]. Along this line, a multitude of international organizations and governments, such as World Intellectual Property Organization, International Union for Conservation of Nature and Natural Resources, the United States, China, and EU states, attach great importance to green innovation [15,16,17]. Outside the international organizations and governments, green innovation has become a hot topic in academia concerning economics, management, geography, and environmental science [18].
Above all, the literature has paid attention to the influencing factors of green innovation. One of the influencing factors is environmental regulation, which has drawn extensive scholarly attention [19]. By a difference-in-difference analysis on the basis of propensity score matching (PSM-DID) model, Zhong and Peng [20] concluded that green innovation was positively impacted by environmental regulations. Zhao et al. [21], Guo et al. [22], and Nie et al. [23] reached the same conclusion after probing into dissimilar enterprises. On the contrary, some studies revealed that environmental regulation was not conducive to corporate green innovation. In their empirical study, Li and Li [24] demonstrated that environmental regulation negatively impacts corporate green innovation by reducing executive compensation. Other than this factor, other scholars have also looked at infrastructure construction [25], low-carbon city construction [26], enterprise nature [27], characteristics of enterprise managers [28], and credit financing [29].
Aside from that, the literature has also deeply probed into spillover effects of green innovation. Urban green innovation can have an impact on sustainable urban development from two aspects, namely, green infrastructure and environment public policy. Referring to green infrastructure, the improvement of urban green infrastructure can reduce the intensity of urban heat island effect [30] and heighten urban resilience [31], so as to slow down environmental pollution, balance the correlations between nature and human, and promote the balanced and stable development of urban society [32,33]. Regarding environmental public policy, green innovation can provide new ideas for the introduction of relevant public health policies. This can provide new development goals for urban governance and urban planning [34], thereby promoting the development of urban green economy, which facilitates the social sustainable development, and realizes sustainable development goals [35,36,37]. Apart from sustainable urban development, green innovation also has spillover effects on environment and economy [38]. Some studies have exhibited the positive environmental effects of green innovation. For instance, Wang et al. [39] employed a time-varying difference model and found that enterprises could suppress air pollution and bring environmental benefits by utilizing green technology innovations. Nonetheless, green innovation also has threshold and rebound effects [40]. When environmental regulations, R&D investment, and marketization levels are high, green technology innovation has a more remarkable and positive environmental impact [41], which may be offset by its rebound effect [42]. Singh et al. [43] and Chen et al. [44] argued that green innovation could elevate enterprises’ economic performance by lessening corporate environmental governance costs, producing new sales revenue from the energy conservation and environmental protection market, and attaining differentiated competitive edges.
As indicated by systematic literature review, there has been fruitful research on green innovation which plays an indispensable role in theorizing green innovation and making relevant policies. Nevertheless, most research is dedicated to enterprises [45], and little attention has been paid to urban green innovation. Since cities are the basic administrative units for implementing national policies [46,47], exploring urban green innovation will enrich the research in this field and provide more valuable references for urban policy-making and planning. Previous researchers have chiefly employed green patents to indicate green innovation [48], which effectively reflects the level of green innovation. However, little is known about green innovation efficiency [49], a concept that integrates multiple factors, leaving urban green innovation efficiency (UGIE) a topic meriting further exploration. Last but not least, existing studies have been primarily dedicated to the influencing factors and spillover effects of green innovation, paying scant attention to its spatiotemporal evolution at a macro scale.
To sum up, assessing UGIE and exploring its spatiotemporal evolution and influencing factors are valuable scientific problems to be solved. This paper established three research objectives: (1) assessing UGIE, (2) exploring UGIE’s spatiotemporal evolution, and (3) studying UGIE’s influencing factors. To effectuate these three objectives, our study measured the UGIE among 284 Chinese cities at or above the prefecture level between 2005 and 2020 using a super-efficiency slacks-based measure (super-SBM), explored its spatial and temporal evolution using spatial auto-correlation, and evaluated the influencing factors with Geodetector. This study is innovative and outstanding to UGIE, in that we constructed an indicator system for UGIE, including expected output (green innovation represented by green patents), unexpected output (industrial sulfur dioxide emissions), and input (expenditures for urban science & technology, full-time equivalents of urban R&D personnel, and telecommunications business volume in urban areas). The reasons that the range of time studied was chosen from 2005 to 2020 are as follows: (1) It takes a certain time span to explore the spatial and temporal pattern of UGIE. The time span from 2005 to 2020 is as long as 16 years, which meets the needs of studying the spatial and temporal pattern, avoids the contingency of research results, and makes the research findings more credible. (2) This paper takes China's prefecture-level cities and above as the research object, with a multitude of samples, and the problem of data comprehensiveness needs to be considered. The data required in this paper covers all the research objects from 2005, so 2005 was chosen as the starting point of the study.
There are several aspects of this study that contribute to the knowledge base. In the first place, by using cities as the research object, the research field, together with corporate green innovation, is enriched. Aside from that, it further evaluates UGIE, thereby expanding the research in this field compared with the studies on its influencing factors and spillover effects. Furthermore, studying the spatiotemporal evolution and influencing factors of UGIE may shed light on its spatial patterns at a macro level.
The following is the organization of the remainder of this paper: Section 2 introduces the methods such as super-SBM, spatial auto-correlation, and Geodetector, as well as green patents, geographic information, and the data were employed to measure UGIE and its influencing factors; in Section 3, the results of the study are presented, including time series evolution characteristics, spatial differences, and influencing factors for China’s UGIE; as part of Section 4, we present the research conclusions of this paper on the basis of the research findings and provide policy implications derived from the research conclusions.

2. Methods and Data

2.1. Methods

2.1.1. Super-SBM

Super-SBM is a method combining a super-efficiency model with a SBM model. It originated from the data envelopment analysis (DEA) model and was first proposed by Tone [50]. This paper chooses this method to measure UGIE for the following reasons: First and foremost, the data measured by this method can be greater than 1, which will effectively deal with the sequencing problem of relatively effective units. Apart from that, the measurement of green innovation efficiency involves the emission of environmental pollutants, which are undesirable outputs; this method can cope with the problem of undesirable output. In addition, all periods can be treated as reference, which can effectively cope with the problem of inter-period comparison [51,52]. The equation is as follows:
min ρ * = 1 m i = 1 m x x i k 1 r + p s = 1 r 1 y d y s k d + q = 1 r 2 y u y q k u s . t . x j = 1 , k n x i j λ j ; y d j = 1 , k n y s j d λ j ; y d j = 1 , k n y q j d λ j x x k ; y d y d k ; y u y k u λ j 0 , i = 1 , 2 , , m ; j = 1 , 2 , , n , j 0 s = 1 , 2 , , r ; q = 1 , 2 , , p
In Equation (1), ρ * is the UGIE value; x, y d , and y u stand for the necessary factors in the input matrix, expected output matrix, and unexpected output matrix; n represents the number of decision-making units, each with m kinds of inputs, r kinds of outputs and p kinds of unexpected outputs; λ refers to the weight vector.
As part of this paper, we reviewed the literature on the efficiency of green development and innovation [53,54] and used scientific & technological expenditure, urban R&D personnel equivalents, and the volume of telecommunications business as inputs, green patents as expected outputs, and industrial sulfur dioxide emissions as unexpected outputs to measure the UGIE.

2.1.2. Spatial Auto-Correlation

Spatial auto-correlation is a paramount index that reflects the correlation between a certain geographical phenomenon or an attribute value in a regional unit and the same phenomenon or attribute value in a neighboring regional unit. It is a measure of the degree of value aggregation in a spatial domain. A common method to test spatial auto-correlation is to use the Moran’s I to measure this clustering property, which can be divided into global Moran’s I and local Moran’s I [55,56]. Moran’s I can be expressed as follows:
I = i = 1 n j = 1 n W i j x i x ¯ x j x ¯ S 2 i = 1 n j = 1 n W i j
S 2 = 1 n i = 1 n x i x ¯ 2  
where I represents the global Moran’s I, I ∈ [-1, 1]. Chinese cities have a striking positive spatial correlation if I > 0. The greater the value, the stronger the regional agglomeration; otherwise, there is a noticeable negative spatial correlation, and the smaller the value, the greater the regional dispersion [57]. There are n research units; x i and x   j denote the UGIE of units i and j; x ¯ stands for the mean of all units. The spatial weight matrix for units i and j is designated as W i j . If spatial units i and j share a common boundary,   W i j = 1; otherwise,   W i j   = 0.
Z I = 1 E I V a r I  
In Equation (4), Z(I) represents the significance level of the global Moran’s I; E(I) is the mathematical expectation of the global Moran’s I; Var(I) represents its variance.
UGIE’s local Moran’s I is adopted to identify regional agglomeration and dispersion by analyzing local spatial auto-correlation. In the case of the i t h unit, the local Moran index’s I is expressed as follows:
I i = i = 1 n j = 1 n W i j x i x ¯ x j x ¯ S 2
In Equation (5), the significance level of the local Moran’s I can be determined by Z(I) using the equation above. A spatial auto-correlation can be classified into four types on the basis of the significance level and the symbol of Z(I): in the case of noticeably positive I i and Z(I) > 0, the type is considered “high-high”, which displays a high UGIE of the study area and its adjacent areas; in the case where I i is statistically significant and Z(I) < 0, then the type is “low-low”, which exhibits a low UGIE of the study area and its adjacent areas; When I i is remarkably negative and Z(I) > 0, we have a “high-low” type, indicating a high UGIE of the study area but a low UGIE of its adjacent areas; a “low-high” type is defined as I i > 0 and Z(I) < 0, indicating a low UGIE of the study area but a high UGIE of its adjacent areas [58].

2.1.3. Geodetector

Geodetector predominantly analyzes the association between geographical research objects from the perspective of spatial differentiation, including the four parts of risk detection, factor detection, ecological detection, and interaction detection. In this study, the factor detection part is selected to detect the factors that may affect the efficiency of urban green innovation in China. In a Geodetector analysis, causal correlations between variables are detected by examining their spatial heterogeneity [59]. The reason behind this is that when a dependent variable is influenced by an independent variable, their spatial distributions should be similar [60]. The equation is as follows:
q = 1 1 n σ 2 i = 1 m n i σ x ,   i 2  
In Equation (6), q is the extent to which an influencing factor explains one of the driving factors of UGIE, and its value range is [0, 1]. Increasing the value of this influencing factor will have a more noticeable impact on green innovation; when it is equal to 0, the factor has no effect on UGIE; i = 1, 2, 3, ... m corresponds to the layers of the factor x; σ 2 and σ x ,   i 2 describe the variance of the research object and layer i.

2.2. Data

This study drew its data from three diverse sources.
Geographic information: A vector administrative boundary map of Chinese cities is based upon the 1:4 million Chinese geospatial data provided by the National Geomatics Center of China (http://www.ngcc.cn/ngcc/, accessed on: 23 November 2022).
Green patents and environmental regulation: Crawlers were employed to obtain the green patent data from Chinese cities (including all cities at a prefecture level and above, leagues, autonomous prefectures, regions, and some provincial counties) during the period between 2005 and 2020 using the Patent Retrieval and Analysis System of the China National Intellectual Property Administration (pss-system.cnipa.gov.cn, accessed on: 23 November 2022) [61,62]. Environmental regulation is one of the influencing factors of UGIE adopted in this study. Crawlers were adopted to retrieve the terms “environmental protection” and “ecological civilization” from the work reports of each city government, with the word frequency ratio adopted to indicate this factor [63].
Other data: Indicators other than green patent data employed to calculate UGIE and other than environmental regulation adopted to analyze the influencing factors of UGIE were from the “Statistical Yearbook of Chinese Cities” on a big data platform (https://data.cnki.net/, accessed on: 23 November 2022).
In Table 1, we present a summary of the descriptive statistics used in this study.

3. Results

Figure 1 is the spatial expression of the UGIE of Chinese cities from 2005 to 2020. On the basis of this result, we analyzed its spatiotemporal evolution.

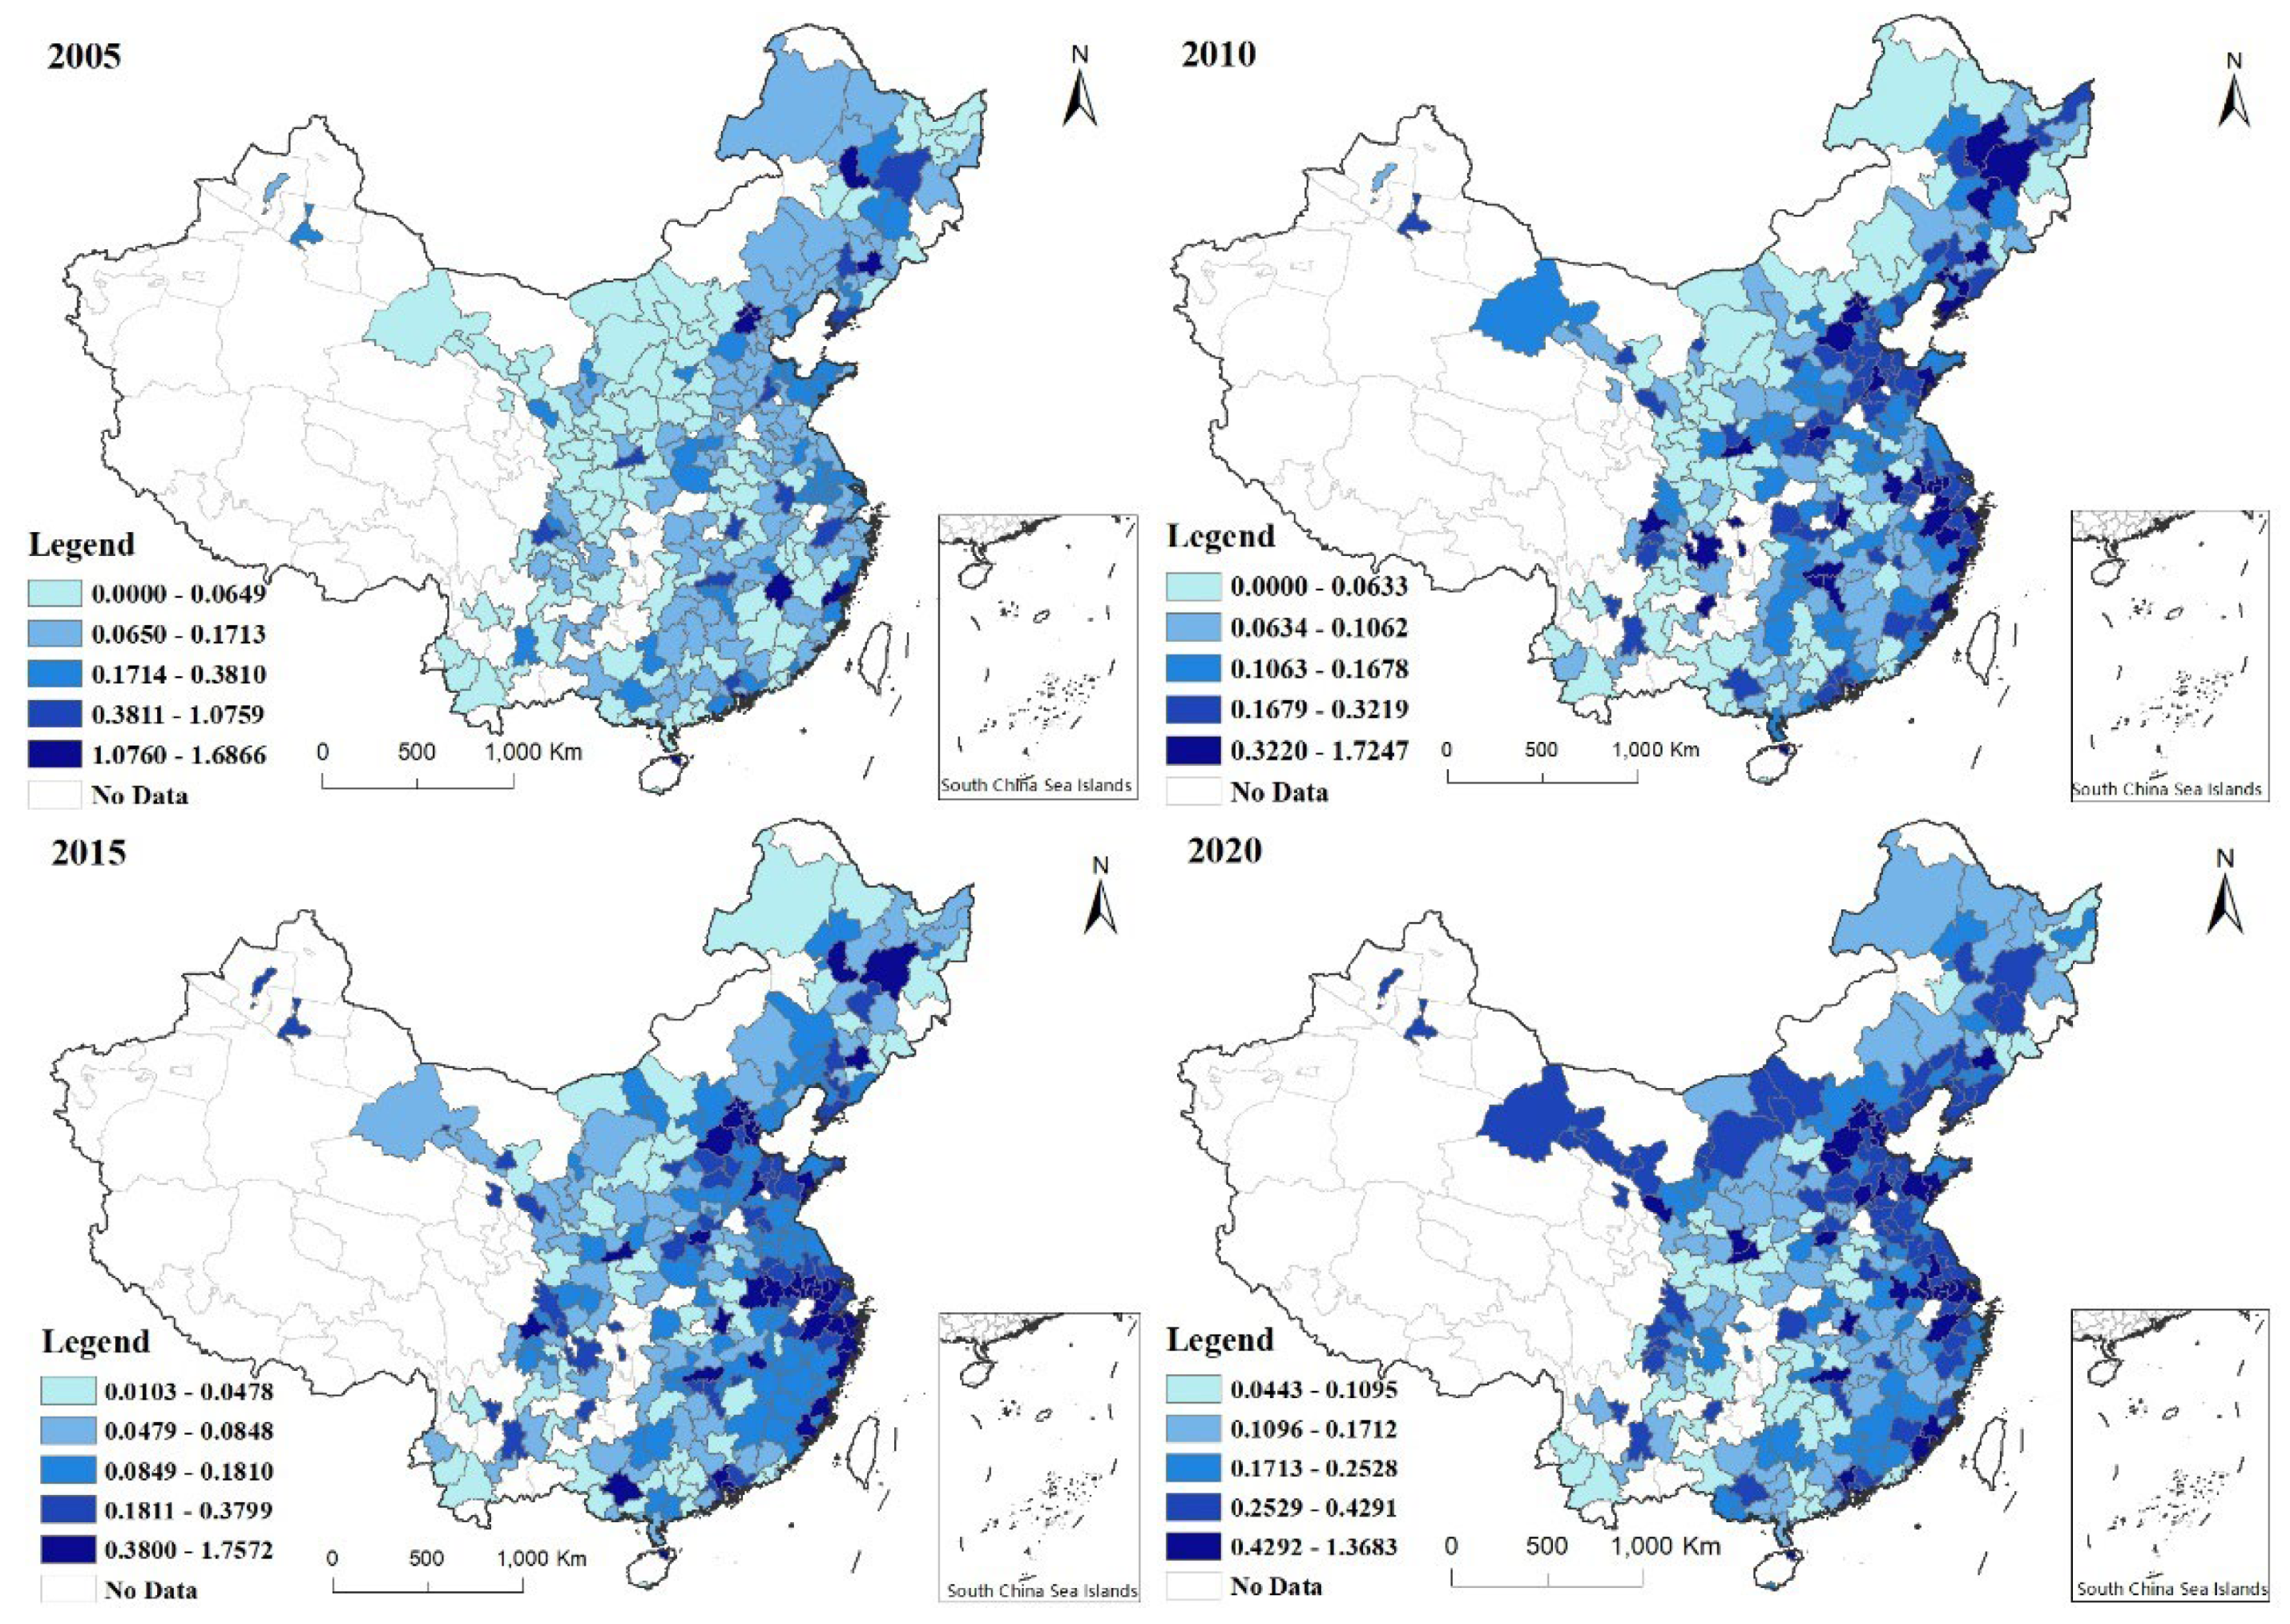
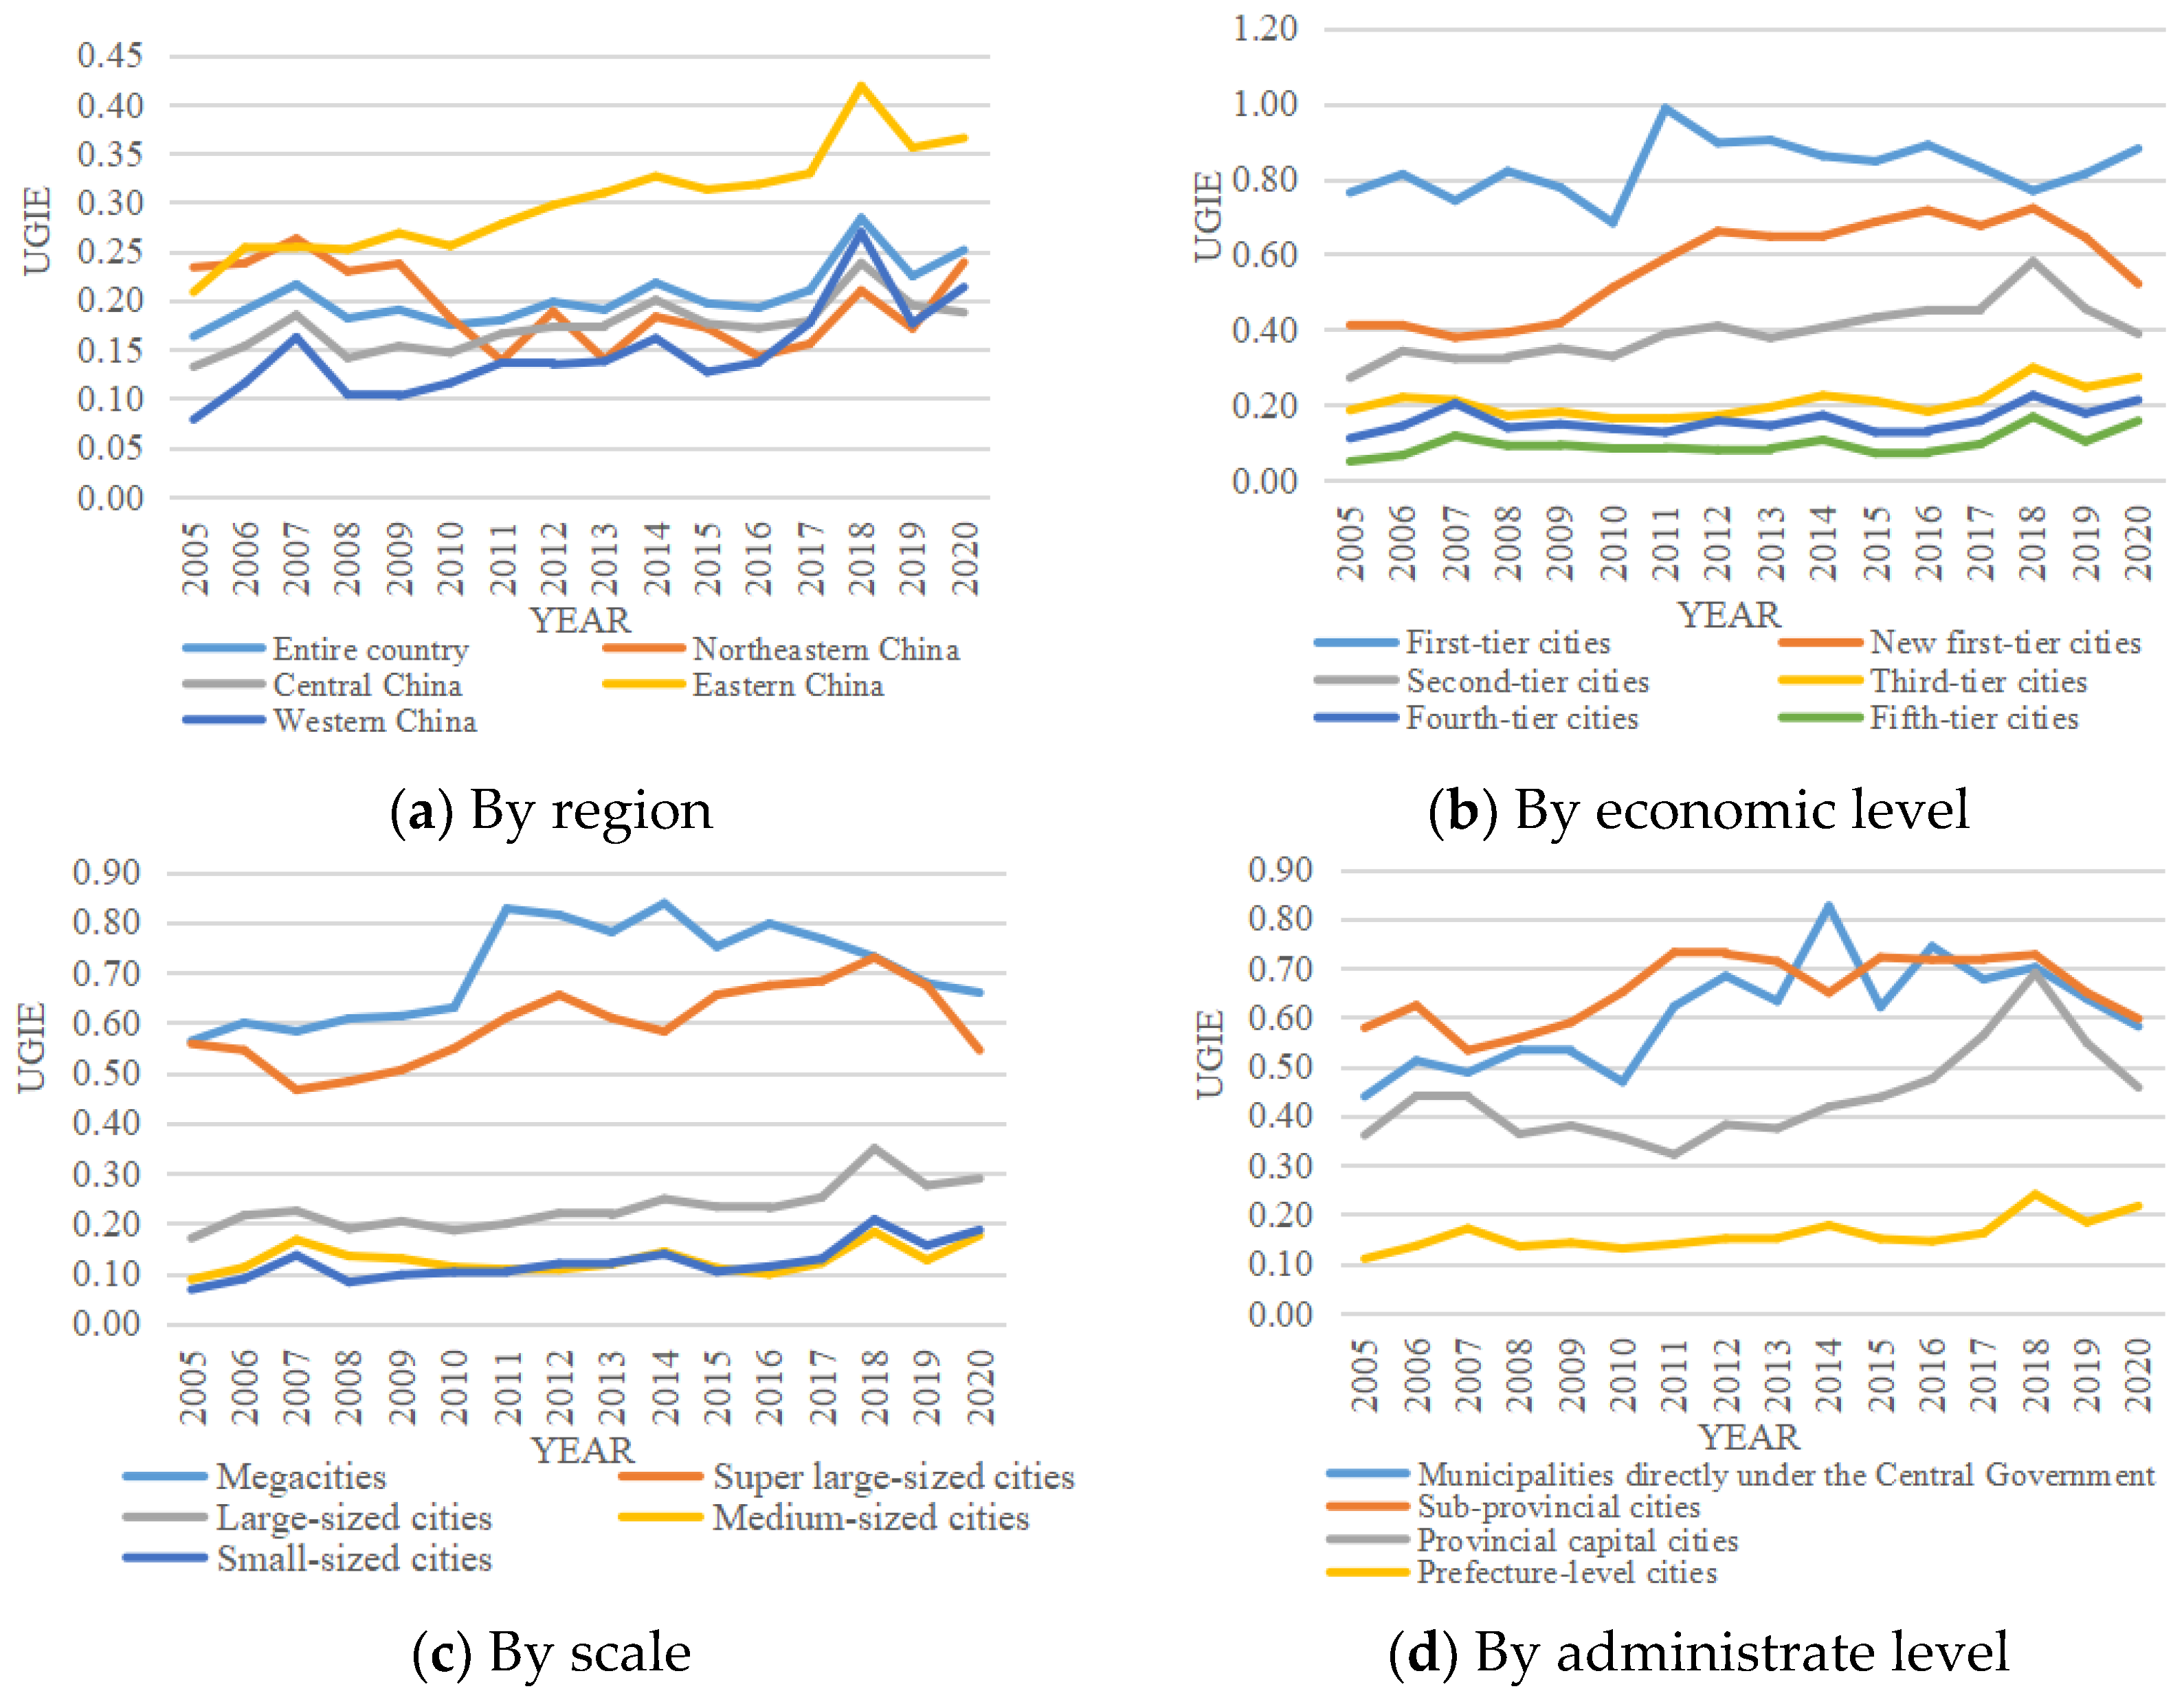
3.1. Spatiotemporal Analysis of UGIE

We divided the cities by regions, economic levels, scales, and administrative levels, and conducted a spatiotemporal analysis of UGI for each type of city. The Figure 2 below illustrates how UGIE evolved over time in diverse types of cities.
There are four regions in China: eastern China, central China, western China, and northeastern China (Figure 2a). The national UGIE and that of the other three regions than the northeastern China tended to rise with fluctuations. From 2005 to 2020, the national average UGIE augmented from 0.16 to 0.25, the eastern China from 0.21 to 0.37, the central China from 0.13 to 0.19, and the western China from 0.08 to 0.21. The level of the northeastern China first dropped from 0.23 in 2005 to 0.14 in 2011 and then rose to 0.24 in 2020.
As exhibited in Figure 2b, cities in China can be classified as first-tier (T1), new first-tier (NT1), second-tier (T2), third-tier (T3), fourth-tier (T4), and fifth-tier (T5) cities on the basis of their economic standing [64]. From 2005 to 2020, the UGIE in various cities was on the rise as a whole, with T1 cities from 0.76 to 0.88, NT1 cities from 0.41 to 0.52, T2 cities from 0.27 to 0.39, T3 cities from 0.19 to 0.27, T4 cities from 0.11 to 0.21, and T5 cities from 0.05 to 0.16. The UGIE of various cities over the years remained “T1 > NT1 > T2 > T3 > T4 > T5”. To put it simply, cities with higher economic levels had higher UGIE.
As illustrated in Figure 2c, in accordance with size, Chinese cities can be categorized as megacities, super large-sized cities, large-sized cities, medium-sized cities, and small-sized cities [65,66]. From 2005 to 2020, the overall UGIE of large-sized cities, medium-sized cities, and small-sized cities displayed an upward trend, with large-sized cities increasing from 0.17 to 0.29, medium-sized cities from 0.09 to 0.18, and small-sized cities from 0.07 to 0.19. The UGIE of mega cities first rose from 0.56 in 2005 to 0.83 in 2011 and then dropped to 0.66 in 2020, and super large-sized cities declined with fluctuations.
By administrative level, Chinese cities are divided into municipalities directly under the central government, sub-provincial cities, provincial capital cities, and prefecture-level cities (Figure 2d). From 2005 to 2020, the UGIE of the four types was all on the rise, municipalities from 0.44 to 0.58, sub-provincial cities from 0.58 to 0.60, provincial capitals from 0.36 to 0.46, and prefecture-level cities from 0.11 to 0.22.
The overall UGIE of Chinese cities tended to rise, except for cities in the northeastern China, megacities, and super large-sized cities. Northeastern China may be suffering from a serious deficiency of innovation power, population loss, and economic recession owing to the large number of resource-based cities in the region. For megacities and super large-sized cities, the possible reason is that after a long period of speedy growth in the UGIE, the input factors have continued to rise at a high level in recent years. Nevertheless, the growth rate of green patent output is much lower than that of input factors, which will give rise to a decline in their UGIE.

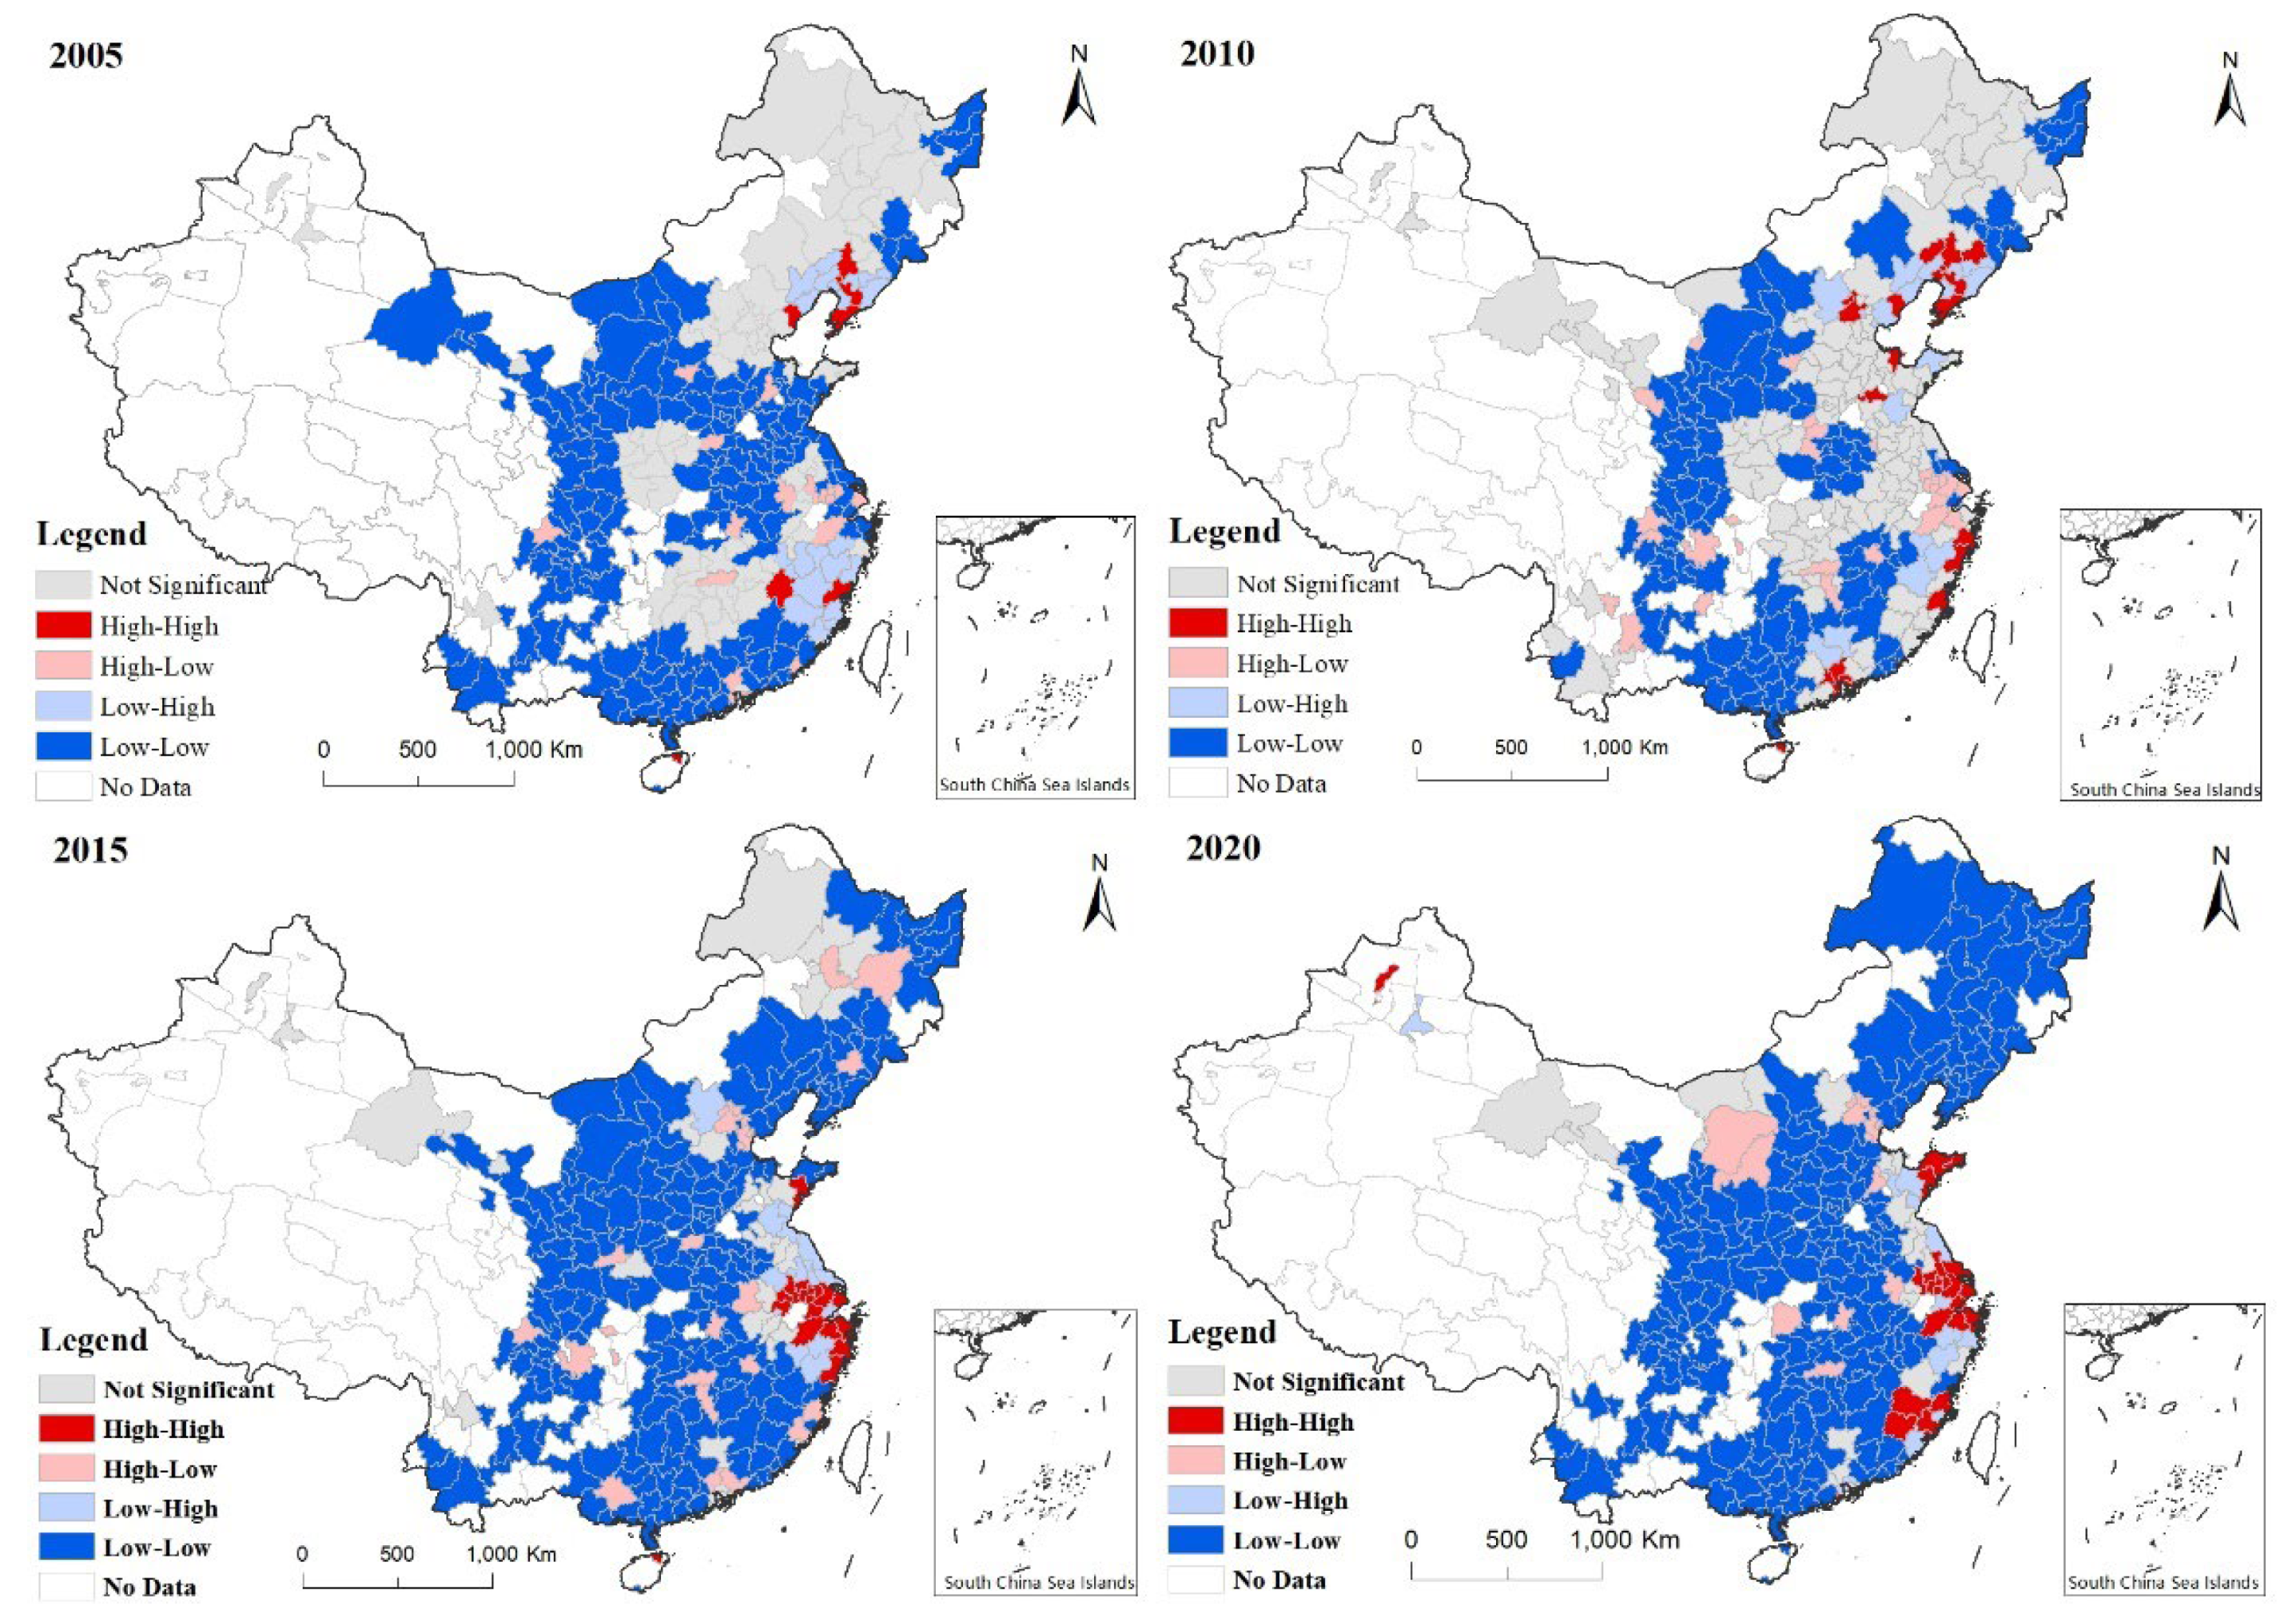
3.2. Spatial Differences of UGIE Methods

Table 2 presents the global spatial auto-correlation analysis of UGIE from 2005 to 2020 using ArcGIS. The global Moran’s I was positive each year, which exhibits an obvious positive spatial correlation in the UGIE of Chinese cities. The UGIE between adjacent cities exhibited obvious mutual influence. This is because the development of a city’s economy, politics, and culture not only affects, but also is affected by, the development of surrounding areas. The global Moran’s I exhibited an overall downward trend, which adequately demonstrates that the mutual influence between cities was gradually weakening.
We probed deep into the local spatial auto-correlation of UGIE from 2005 to 2020 using ArcGIS. Figure 3 is the local auto-correlation LISA graphs for the years 2005, 2010, 2015, and 2020. There appeared to be four types of UGIE: “high-high”, “high-low”, “low-low”, and “low-high”. The “high-high” type, which indicates a high UGIE of the city and its adjacent areas, thereby forming high-value agglomerations, was few but tended to increase gradually, especially in the Shandong Peninsula, Yangtze River Delta, and Fujian Province. The “low-low” type, which indicates a low UGIE of the city and its adjacent areas, thereby forming low-value agglomerations, was widespread and continued to increase. The “high-low” type, which means a high UGIE of the city but a low GIE of its adjacent areas, was scattered, showing a trend of rising first and declining later. Cities of this type were chiefly distributed around “low-low” cities and regions, especially in Sichuan province, Hubei province, Hunan province, and Chongqing city. The “low-high” type, which means a low UGIE of the city but a high UGIE of its adjacent areas, tended to decrease gradually. Cities of this type were primarily situated around “high-high” cities and regions, moving from the northeastern region to provinces such as Shandong, Jiangsu, Zhejiang, Guangdong, and other eastern coastal areas. The “low-low” cities were the most prevalent and widest, have the largest number and the widest distribution, which suggests that there are remarkable spatial differences and that Chinese cities need to ameliorate their UGIE.

3.3. Factors Influencing UGIE

Green innovation activities are susceptible to dissimilar factors, such as the economy, social culture, and the environment [67]. In the present study, we referred to the human-environment system theory [68] and examined the impact of six indicators on UGIE from economy, social culture, and the environment, including GDP per capita, the percentage of tertiary industries, the average salary of employees, the number of collections in public libraries, green coverage in urban areas, and environmental regulation. To be more specific, GDP per capita and the percentage of tertiary industries represent economic factors [69]; the average salary of employees and the number of collections in public libraries stand for sociocultural factors [70]; green coverage in urban areas and environmental regulation denote environmental factors [71]. The q values of the six indicators accounting for the impact on UGIE are displayed in Table 3.
The number of collections in public libraries exerted the uppermost impact on UGIE. Since it represents a typical sociocultural factor, it is thereby safe to conclude that sociocultural factor is the primary influencing factor of UGIE. The possible reason is that green innovation primarily comes from universities, enterprises, and research institutions, which promote and are promoted by social culture and the input of factors affecting green innovation, thereby directly ameliorating the UGIE. Aside from that, since the 1980s, economic activities have exhibited a cultural turn [72]. The role of culture in economic growth has gradually become apparent. In addition, the economic process has become a sociocultural process as well. As a consequence, aside from traditional factors, sociocultural factors have an increasing impact on innovation [73]. GDP per capita and the percentage of tertiary industries, which represent economic factors, also imposed a substantial influence on the UGIE and remained stable over the years, illustrating that economic growth is fundamental to the UGIE. The influence of the two indicators representing environmental factors is less noticeable than other factors, which means that the UGIE is less affected by the environment.

4. Conclusions and Implications for Policy

4.1. Conclusions

Using a super-SBM model, we evaluated the UGIE of 284 cities at or above the prefecture level in China for the period from 2005 to 2020. On this basis, we explored its spatiotemporal evolution and influencing factors using spatial auto-correlation and Geodetector, respectively. The conclusions are as follows:
Temporal evolution: The overall UGIE of Chinese cities tended to rise from 2005 to 2020, except for cities in the northeastern China, megacities, and super large-sized cities.
Spatial differences: There were significant spatial differences and auto-correlation in China’s UGIE from 2005 to 2020. Among the “high-high”, “high-low”, “low-low”, and “low-high” types in local auto-correlation, “high-high” cities were few but tended to increase gradually, especially in Shandong Peninsula, Yangtze River Delta, and Fujian Province. The “low-low” type was the most frequent, which demonstrates that the UGIE of Chinese cities needs to be improved.
Geodetector: The number of collections in public libraries, which represents sociocultural factors, made more remarkable contributions than other factors, hence the most important factor affecting the UGIE of Chinese cities.

4.2. Policy Implications

The UGIE pursues both economic and environmental benefits [74,75,76]. As such, it shall be a consideration for governments in urban planning and construction.
To begin to fill the gap in UGIE between cities of dissimilar types, each city is advised to choose a suitable development path to ameliorate its UGIE and promote high-quality economic development in line with its actualities, regional conditions, economic conditions, population size, and administrative levels. Since the UGIE of megacities, and due to declining super large-sized cities, large-sized and medium-sized cities warrant substantial support from the government to give full play to their role in driving the UGIE across the country. It is imperative for cities in the northeastern region to cultivate innovation factors, optimize and upgrade industries, and inject endogenous power into their UGIE.
Apart from that, in view of the obvious auto-correlation of China’s UGIE, all regions are advised to strengthen cooperation by breaking the geographical constraints. Cities with high UGIE should give full play to their demonstration effect, expand their radiation and driving force, facilitate the flow of green innovation factors, and push the development of surrounding cities and regions ahead. It is essential for cities with low UGIE to fit into the larger economic and geographical pattern and absorb and undertake the resources and factors flowing out of advanced areas to promote their development.
Last but not least, as sociocultural factors have become a primary factor in UGIE, cities should not only concentrate more on developing social and cultural undertakings, but also attract labor forces and human resources. It is imperative for the city authority to ensure the supply of cultural products, create a distinctive urban culture, and develop economic, social, and cultural undertakings. Aside from that, it is essential for the city authority to optimize the talent team, make proper policies to introduce talent and attract them to settle down, thereby providing human resources to ameliorate the UGIE.

4.3. Limitations and Prospects

In this study, we exhibited the temporal evolution of UGIE by diverse types of cities during the research period. Although this result is policy enlightening, the limitation is that the UGIE has not been predicted. As a result, a Markov model and grey relational analysis model can be further used to make up for this limitation. We investigated the spatial differences in China’s UGIE using a spatial auto-correlation model. In the future, efforts may be made to analyze the spatial evolution of UGIE using the Dagum Gini coefficient and kernel density estimation from a dynamic perspective. Since UGIE is affected by various factors, and dissimilar regions may have diverse factors affecting UGIE as a consequence of their dissimilar background conditions, researchers may choose heterogeneous regions to examine the influencing factors of UGIE in the future.

Author Contributions

Conceptualization, K.L.; methodology, Y.X.; software, S.D. and Y.X.; validation, S.D, Y.X. and G.R.; formal analysis, G.R.; investigation, S.D.; resources, K.L.; data curation, S.D. and Y.X.; writing—original draft preparation, S.D.; writing—review and editing, K.L.; visualization, G.R.; supervision, K.L.; project administration, K.L.; funding acquisition, K.L. All authors have read and agreed to the published version of the manuscript.

Funding

This work was funded by the National Natural Science Foundation of China, grant number 72004124; Department of Science and Technology of Shandong Province, China, grant number 2022RKY04002; Humanities and Social Sciences Project of Shandong Province, China, grant number, 2022-YYJJ-32.

Data Availability Statement

The data presented in this study are available on request from the corresponding author. The data are not publicly available because research is ongoing.

Conflicts of Interest

The authors declare that they have no known competing financial interests or personal relationships that could have appeared to influence the work reported in this paper.

References

  1. Wu, J.; Huang, D.C.; Zhou, Z.X.; Zhu, Q.Y. The regional green growth and sustainable development of China in the presence of sustainable resources recovered from pollutions. Ann. Oper. Res. 2020, 290, 27–45. [Google Scholar] [CrossRef]
  2. Burgess, M.G.; Carrico, A.R.; Gaines, S.D.; Peri, A.; Vanderheiden, S. Prepare developed democracies for long-run economic slowdowns. Nat. Hum. Behav. 2021, 5, 1608–1621. [Google Scholar] [CrossRef] [PubMed]
  3. Wu, F.; Liu, G.J.; Guo, N.L.; Li, Z.H.; Deng, X.Z. The impact of COVID-19 on China's regional economies and industries. J. Geogr. Sci. 2021, 31, 565–583. [Google Scholar] [CrossRef]
  4. Cui, X.L.; Wu, J.; Li, Z.H.; Peng, L.; Shen, Z. An Integrated Assessment and Factor Analysis of Water Related Environmental Risk to Cities in the Yangtze River Economic Belt. Water 2021, 13, 2140. [Google Scholar] [CrossRef]
  5. Isiksal, A.Z.; Assi, A.F. Determinants of sustainable energy demand in the European economic area: Evidence from the PMG-ARDL model. Technol. Forecast. Soc. Chang. 2022, 183, 121901. [Google Scholar] [CrossRef]
  6. Wang, L.; Ye, W.Z.; Chen, L.M. Research on Green Innovation of the Great Changsha-Zhuzhou-Xiangtan City Group Based on Network. Land 2021, 10, 1198. [Google Scholar] [CrossRef]
  7. Adedoyina, F.F.; Erumb, N.; Ozturk, I. Does higher innovation intensity matter for abating the climate crisis in the presence of economic complexities? Evidence from a Global Panel Data. Technol. Forecast. Soc. Chang. 2022, 181, 121762. [Google Scholar] [CrossRef]
  8. Xiao, W.S.; Kong, H.J.; Shi, L.F.; Boamah, V.; Tang, D.C. The impact of innovation-driven strategy on high-quality economic development: Evidence from China. Sustainability 2022, 14, 4212. [Google Scholar] [CrossRef]
  9. Xu, G.Y.; Chang, H.Y.; Meng, L.Q.; Marma, K.J.S. Green development level, resource utilization, and ecological protection across China from 2006 to 2017: Based on the national standard indicator system. Environ. Dev. 2022, 44, 100776. [Google Scholar] [CrossRef]
  10. Fu, J.Y.; Geng, Y.Y. Public participation, regulatory compliance and green development in China based on provincial panel data. J. Clean. Prod. 2019, 230, 1344–1353. [Google Scholar] [CrossRef]
  11. Zhang, J.J.; Li, F.Q.; Ding, X.H. Will green finance promote green development: Based on the threshold effect of R&D investment. Environ. Sci. Pollut. Res. 2022, 29, 60232–60243. [Google Scholar]
  12. Song, W.H.; Yu, H.Y. Green innovation strategy and green innovation: The roles of green creativity and green organizational identity. Corp. Soc. Responsib. Environ. Manag. 2018, 25, 135–150. [Google Scholar] [CrossRef]
  13. Wang, J.R.; Xue, Y.J.; Sun, X.L.; Yang, J. Green learning orientation, green knowledge acquisition and ambidextrous green innovation. J. Clean. Prod. 2022, 250, 119475. [Google Scholar] [CrossRef]
  14. Nie, P.Y.; Wen, H.X.; Wang, C. Cooperative green innovation. Environ. Sci. Pollut. Res. 2022, 29, 30150–30158. [Google Scholar] [CrossRef]
  15. Nanath, K.; Pillai, R.R. The influence of green is practices on competitive advantage: Mediation role of green innovation performance. Inf. Syst. Manag. 2017, 34, 3–19. [Google Scholar] [CrossRef]
  16. Long, R.Y.; Li, H.F.; Wu, M.F.; Li, W.B. Dynamic evaluation of the green development level of China's coal-resource-based cities using the TOPSIS method. Resour. Policy 2021, 74, 102415. [Google Scholar] [CrossRef]
  17. Zhang, L.Y.; Ma, X.; Ock, Y.S.; Qing, L. Research on Regional Differences and Influencing Factors of Chinese Industrial Green Technology Innovation Efficiency Based on Dagum Gini Coefficient Decomposition. Land 2022, 11, 122. [Google Scholar] [CrossRef]
  18. Deng, X.Z.; Jin, G.; He, S.J.; Wang, C.X.; Li, Z.H.; Wang, Z.Q.; Song, M.L.; Yang, Q.Y.; Zhang, A.L.; Chen, J.C. Research progress and prospect on development geography. J. Geogr. 2021, 31, 437–455. [Google Scholar] [CrossRef]
  19. Shen, T.T.; Li, D.J.; Jin, Y.Y.; Li, J. Impact of environmental regulation on efficiency of green innovation in China. Atmosphere 2022, 13, 767. [Google Scholar] [CrossRef]
  20. Zhong, Z.Q.; Peng, B.H. Can environmental regulation promote green innovation in heavily polluting enterprises? Empirical evidence from a quasi-natural experiment in China. Sustain. Prod. Consum. 2022, 30, 815–828. [Google Scholar] [CrossRef]
  21. Zhao, X.L.; Zhao, Y.; Zeng, S.X.; Zhang, S.F. Corporate behavior and competitiveness: Impact of environmental regulation on Chinese firms. J. Clean. Prod. 2015, 86, 311–322. [Google Scholar] [CrossRef]
  22. Guo, L.; Qu, Y.; Tseng, M. The interaction effects of environmental regulation and technological innovation on regional green growth performance. J. Clean. Prod. 2017, 162, 894–902. [Google Scholar] [CrossRef]
  23. Nie, G.Q.; Zhu, Y.F.; Wu, W.P.; Xie, W.H.; Wu, K.X. Impact of Voluntary Environmental Regulation on Green Technological Innovation: Evidence from Chinese Manufacturing Enterprises. Front. Energy Res. 2022, 10, 889037. [Google Scholar] [CrossRef]
  24. Li, X.F.; Li, Z.H. Does environmental regulation contribute to enterprise green innovation? Empirical data based on the mediation effect from the perspective of executive compensation. Technol. Anal. Strateg. Manag. 2022. [Google Scholar] [CrossRef]
  25. Jiao, J.L.; Zhang, X.L.; Tang, Y.S. What factors determine the survival of green innovative enterprises in China? A method based on fsQCA. Technol. Soc. 2020, 62, 101314. [Google Scholar] [CrossRef]
  26. Li, X.W.; Liu, X.; Huang, Y.C.; Li, J.R.; He, J.R.; Dai, J.C. Evolutionary mechanism of green innovation behavior in construction enterprises: Evidence from the construction industry. Eng. Constr. Archit. Manag. 2022; ahead-of-print. [Google Scholar] [CrossRef]
  27. Kobarg, S.; Stumpf-Wollersheim, J.; Schlgel, C.; Welpe, I.M. Green together? The effects of companies' innovation collaboration with different partner types on ecological process and product innovation. Ind. Innov. 2020, 27, 953–990. [Google Scholar] [CrossRef]
  28. Cao, C.Z.; Tong, X.J.; Chen, Y.Q.; Zhang, Y. How top management’s environmental awareness affect corporate green competitive advantage: Evidence from China. Kybernetes 2021, 51, 1250–1279. [Google Scholar] [CrossRef]
  29. Zhang, Z.F.; Duan, H.Y.; Shan, S.S.; Liu, Q.Z.; Geng, W.H. The impact of green credit on the green innovation level of heavy-polluting enterprises-evidence from China. Int. J. Environ. Res. Public Health 2022, 19, 650. [Google Scholar] [CrossRef]
  30. Marando, F.; Heris, M.P.; Zulian, G.; Udías, A.; Mentaschi, L.; Chrysoulakis, N.; Parastatidis, D.; Maes, J. Urban heat island mitigation by green infrastructure in European Functional Urban Areas. Sustain. Cities Soc. 2022, 77, 103564. [Google Scholar] [CrossRef]
  31. Donati, G.F.; Bolliger, J.; Psomas, A.; Maurer, M.; Bach, P.M. Reconciling cities with nature: Identifying local Blue-Green Infrastructure interventions for regional biodiversity enhancement. J. Environ. Manag. 2022, 316, 115254. [Google Scholar] [CrossRef] [PubMed]
  32. Chanchitpricha, C.; Fischer, T.B. The role of impact assessment in the development of urban green infrastructure: A review of EIA and SEA practices in Thailand. Impact Assess. Proj. Apprais. 2022, 40, 191–201. [Google Scholar] [CrossRef]
  33. Barbosa, V.; Pradilla, M.M.S.; Chica-Mejía, J.E.; Bonilla, J.E.G. Functionality and Value of Green Infrastructure in Metropolitan Sprawl: What Is the City’s Future? A Case Study of the Bogotá-Sabana Northern Region; IntechOpen: London, UK, 2022. [Google Scholar]
  34. Robinson, S.A.; Bouton, E.; Dolan, M.; Meakem, A.; Messer, A.; Lefond, I.; Roberts, J.T. A new framework for rapidly assessing national adaptation policies: An application to small island developing states in the Atlantic and Indian Oceans. Reg. Environ. Chang. 2022, 22, 1–15. [Google Scholar] [CrossRef]
  35. Lowe, M.; Adlakha, D.; Sallis, J.F.; Salvo, D.; Cerin, E.; Moudon, A.V.; Higgs, C.; Hinckson, E.; Arundel, J.; Giles-Corti, B.; et al. City planning policies to support health and sustainability: An international comparison of policy indicators for 25 cities. Lancet Glob. Health 2022, 10, e882–e894. [Google Scholar] [CrossRef]
  36. Wang, K.L.; Pang, S.Q.; Zhang, F.Q.; Miao, Z.; Sun, H.P. The impact assessment of smart city policy on urban green total-factor productivity: Evidence from China. Environ. Impact Assess Rev. 2022, 94, 106756. [Google Scholar] [CrossRef]
  37. Medeiros, E.; Valente, B.; Gonçalves, V.; Castro, P. How impactful are public policies on environmental sustainability? Debating the Portuguese case of PO SEUR 2014–2020. Sustainability 2022, 14, 7917. [Google Scholar] [CrossRef]
  38. Peng, W.B.; Yin, Y.; Kuang, C.G.; Wen, Z.Z.; Kuang, J.S. Spatial spillover effect of green innovation on economic development quality in China: Evidence from a panel data of 270 prefecture-level and above cities. Sustain. Cities Soc. 2021, 69, 102863. [Google Scholar] [CrossRef]
  39. Wang, X.H.; Wu, S.C.; Qin, X.J.; La, M.X.; Zuo, H.X. Informal environment regulation, green technology innovation and air pollution: Quasi-Natural experiments from prefectural cities in China. Sustainability 2022, 14, 6333. [Google Scholar] [CrossRef]
  40. Su, L.N. The impact of coordinated development of ecological environment and technological innovation on green economy: Evidence from China. Int. J. Environ. Res. Public Health 2022, 19, 6994. [Google Scholar] [CrossRef]
  41. Wang, Y.; Liang, Z.L.; Chen, H.C. Influence mechanism of technical innovation capability on green economic growth. J. Environ. Prot. Ecol. 2020, 21, 1972–1984. [Google Scholar]
  42. Zhang, K.Q.; Chen, H.H.; Tang, L.Z.; Qiao, S. Green finance, innovation and the energy-environment-climate nexus. Front. Environ. Sci. 2022, 10, 879681. [Google Scholar] [CrossRef]
  43. Singh, S.K.; Del Giudice, M.; Jabbour, C.J.C.; Latan, H.; Sohal, A.S. Stakeholder pressure, green innovation, and performance in small and medium-sized enterprises: The role of green dynamic capabilities. Bus. Strategy Environ. 2021, 31, 500–514. [Google Scholar] [CrossRef]
  44. Chen, Z.F.; Hao, X.Y.; Chen, F.L. Green innovation and enterprise reputation value. Bus. Strategy Environ. 2022. [Google Scholar] [CrossRef]
  45. Yang, X.H.; Zhang, H.R.; Li, Y. High-speed railway, factor flow and enterprise innovation efficiency: An empirical analysis on micro data. Socio-Econ. Plan. Sci. 2022, 82, 101305. [Google Scholar] [CrossRef]
  46. Liu, K.; Xue, M.Y.; Peng, M.J.; Wang, C.X. Impact of spatial structure of urban agglomeration on carbon emissions: An analysis of the Shandong Peninsula, China. Technol. Forecast. Soc. Chang. 2020, 161, 120313. [Google Scholar] [CrossRef]
  47. Yang, Y.; Deng, X.Z. The Spatio-temporal Evolutionary Characteristics and Regional Differences in Affecting Factors Analysis of China’s Urban Eco-efficiency. Sci. Geol. Sin. 2019, 39, 1111–1118. [Google Scholar]
  48. Liu, K.; Xue, Y.T.; Chen, Z.F.; Miao, Y. The spatiotemporal evolution and influencing factors of urban green innovation in China. Sci. Total Environ. 2023, 857, 159426. [Google Scholar] [CrossRef]
  49. Zhao, N.; Liu, X.J.; Pan, C.F.; Wang, C.Y. The performance of green innovation: From an efficiency perspective. Socio-Econ. Plan. Sci. 2021, 78, 101062. [Google Scholar] [CrossRef]
  50. Tone, K. A slacks-based measure of efficiency in data envelopment analysis. Eur. J. Oper. Res. 2001, 130, 498–509. [Google Scholar] [CrossRef] [Green Version]
  51. Chen, C.M. Super efficiencies or super inefficiencies? Insights from a joint computation model for slacks-based measures in DEA. Eur. J. Oper. Res. 2013, 226, 258–267. [Google Scholar] [CrossRef]
  52. Qu, J.J.; Wang, B.H.; Liu, X.H. A modified super-efficiency network data envelopment analysis: Assessing regional sustainability performance in China. Socio-Econ. Plan. Sci. 2022, 82, 101262. [Google Scholar] [CrossRef]
  53. Song, M.L.; Ai, H.S.; Li, X. Political connections, financing constraints, and the optimization of innovation efficiency among China's private enterprises. Technol. Forecast. Soc. Chang. 2015, 92, 290–299. [Google Scholar] [CrossRef]
  54. Yuan, H.X.; Zou, L.H.; Feng, Y.D.; Huang, L. Does manufacturing agglomeration promote or hinder green development efficiency? Evidence from Yangtze River Economic Belt, China. Environ. Sci. Pollut. Res. 2022; online ahead of print. [Google Scholar] [CrossRef] [PubMed]
  55. Wang, Z.Y.; Wang, Y.X.; Zhao, L.; Zhao, L. Spatio-temporal evolution and influencing factors of total factor productivity in China's manufacturing industry. Acta Geogr. Sin. 2021, 76, 3061–3075. [Google Scholar]
  56. Huang, C.H.; Liu, K.; Zhou, L. Spatio-temporal trends and influencing factors of PM2.5 concentrations in urban agglomerations in China between 2000 and 2016. Environ. Sci. Pollut. Res. 2021, 28, 10988–11000. [Google Scholar] [CrossRef]
  57. Jin, G.; Deng, X.Z.; Zhao, X.D.; Guo, B.S.; Yang, J. Spatio-temporal patterns of urban land use efficiency in the Yangtze River Economic Zone during 2005-2014. Acta Geogr. Sin. 2018, 73, 1242–1252. [Google Scholar]
  58. Chen, Y.G. An analytical process of spatial autocorrelation functions based on Moran's index. PLoS ONE 2021, 12, e0249589. [Google Scholar] [CrossRef]
  59. Zhou, L.; Zhou, C.H.; Yang, F.; Wang, B.; Sun, D.Q. Spatio-temporal evolution and the influencing factors of PM2.5 in China between 2000 and 2011. Acta Geogr. Sin. 2017, 72, 2079–2092. [Google Scholar]
  60. Wang, J.F.; Xu, C.D. Geodetector: Principle and prospective. Acta Geogr. Sin. 2017, 72, 116–134. [Google Scholar]
  61. Xie, Y. The relationship between firms’ corporate social performance and green technology innovation: The moderating role of slack resources. Front. Environ. Sci. 2022, 10, 949146. [Google Scholar] [CrossRef]
  62. Li, Q.Y.; Xiao, Z.H. Haze Governance, Local Competition and Industrial Green Transformation. Econ. Res. J. 2022, 55, 192–208. [Google Scholar]
  63. Deng, H.H.; Yang, L.X. Smog control, local competition and industrial green transformation. China Ind. Econ. 2019, 10, 118–136. [Google Scholar]
  64. Mu, X.Y.; Cui, C.; Cui, J.R.; Wang, J.J. Hierarchical migration patterns of China's floating population and their impact on the housing choices. Acta Geogr. Sin. 2022, 77, 395–410. [Google Scholar]
  65. Jiang, X.Y.; Wu, X.L.; Zhang, S.Z. Measuring the Coordinated Development Level and Analyzing the Driving Mechanism Between Population Urbanization and Insurance Industry in China. Econ. Geogr. 2022, 42, 22–32. [Google Scholar]
  66. Liu, K.; Liu, W.R.; Wu, J.L.; Chen, Z.F.; Zhang, W.; Liu, F. Spatial differences and influencing factors of urban water utilization efficiency in China. Front. Environ. Sci. 2022, 10, 890187. [Google Scholar] [CrossRef]
  67. Liao, B.; Li, L. Urban green innovation efficiency and its influential factors: The Chinese evidence. Dev. Sustain. 2022, 1–23. [Google Scholar] [CrossRef]
  68. Fan, J. A century of integrated research on the human-environment system in Chinese human geography. Prog. Hum. Geogr. 2022, 46, 988–1008. [Google Scholar] [CrossRef]
  69. Riehl, K.; Kiesel, F.; Schiereck, D. Political and socioeconomic factors that determine the financial outcome of successful green innovation. Sustainability 2022, 16, 3651. [Google Scholar] [CrossRef]
  70. Orlando, B.; Ballestra, L.V.; Scuotto, V.; Pironti, M.; Del Giudice, M. The impact of R & D investments on eco-innovation: A cross-cultural perspective of green technology management. IEEE Trans. Eng. Manag. 2022, 69, 2275–2284. [Google Scholar]
  71. Fan, M.; Yang, P.; Li, Q. Impact of environmental regulation on green total factor productivity: A new perspective of green technological innovation. Environ. Sci. Pollut. Res. 2022, 29, 53785–53800. [Google Scholar] [CrossRef]
  72. Shurmer-Smith, P. Cultural turns/geographical turns: Perspectives on cultural geography. Trans. Inst. Br. Geogr. 2000, 25, 524–526. [Google Scholar]
  73. Zhao, Z.L.; Lin, J.H. Marine Culture and Innovation: An Empirical Study Based on Three Merchant Groups on the Southeast Coast. Econ. Res. J. 2019, 54, 68–83. [Google Scholar]
  74. Cui, X.L.; Shen., Z.; Li, Z.H.; Wu, J. Spatiotemporal evolutions and driving factors of green development performance of cities in the Yangtze River Economic Belt. Ecol. Inform. 2021, 66, 101476. [Google Scholar] [CrossRef]
  75. Zhang, H.W.; Shao, Y.M.; Han, X.P.; Chang, H.L. A road towards ecological development in China: The nexus between green investment, natural resources, green technology innovation, and economic growth. Resour. Policy 2022, 77, 102746. [Google Scholar] [CrossRef]
  76. Sun, B.W.; Zhang, Y.G. A Research of the Distributional Dynamic Evolution and Regional Disparities of Green Innovation Index in China. J. Quant. Technol. Econ. 2022, 39, 51–72. [Google Scholar]
Figure 1. Spatial expression of the UGIE in Chinese cities from 2005 to 2020.
Land 12 00075 g001
Figure 2. UGIE evolution over time in different types of cities.
Land 12 00075 g002
Figure 3. The LISA cluster map shows the distribution of UGIE in China during the period 2005 to 2020.
Land 12 00075 g003
Table 1. Statistics describing the data.
VariableUnitsSample
Size
MeanStandard
Deviation
MaximumMinimum
InputScientific and technological expenditure10,000 yuan454481,460.51307,731.485,549,817.0034.00
Full-time equivalent of urban R&D personnelPerson/year454411,138.6822,886.45336,280.0099.58
Telecommunications business volume10,000 yuan4544382,710.04713,001.4413,964,015.003180.00
Expected outputGreen patentPCS4544346.981177.0224,435.000
Unexpected outputIndustrial sulfur dioxide emissionstons454447,212.1053,846.74683,162.0065.00
influencing factorsPer capita GDPyuan454442,560.8132,075.71256,877.002396.00
Proportion of tertiary industry%454439.9110.1783.878.58
Employees’ average salaryyuan454444,864.7723,771.06320,626.316409.73
Number of books in public libraries1000 books45442757.946460.9382,150.0039.00
Green coverage rate of built-up areas%454438.227.6082.320.38
Environmental regulation%45440.251.1535.100.0000005
Table 2. The global Moran’s I of the UGIE in China for the period 2005 to 2020.
YearMoran’s IZP
20050.839472194.8200240.000000
20060.39890892.7381790.000000
20070.38312389.1587480.000000
20080.34388579.9060000.000000
20090.439900102.2221390.000000
20100.434089100.9011740.000000
20110.474058110.0618650.000000
20120.41229495.6953460.000000
20130.583437135.3837520.000000
20140.505103117.2336270.000000
20150.558978129.6819910.000000
20160.39794892.3432420.000000
20170.27554663.9946390.000000
20180.41770696.9431500.000000
20190.32234874.8733750.000000
20200.29889369.5443540.000000
Table 3. The q values of the six indicators accounting for the impact on UGIE.
YearPer Capita GDPProportion of the Tertiary IndustryEmployees’
Average Salary
Number of Books in
Public Libraries
Green Coverage Rate of Built-Up
Areas
Environmental Regulation
20050.2342340.1430330.1296220.2764310.1174880.051209
20060.2493510.1482230.1497880.3713520.1560640.040549
20070.1108660.0741320.0435790.2102140.0813580.013898
20080.1517930.2280600.0679470.2641730.1137930.039646
20090.1407790.1691410.0575030.3060270.1558770.044165
20100.1986370.1664150.0896850.3678610.1617830.029893
20110.1252010.2602330.0577280.3890240.0996340.068049
20120.1014820.2662200.1350820.3954330.1655470.056643
20130.2329340.2362280.1579210.3587450.1399850.035539
20140.0999770.2247350.2374620.3539370.2095250.068190
20150.2557770.1704660.2077880.4192290.1384970.103801
20160.2388610.1803100.2560840.4633370.0789800.018999
20170.3155530.0444660.2824140.4914180.1266690.029775
20180.2307540.0961870.1749610.2814900.0632410.074646
20190.2551730.1406510.1828710.3380030.0818370.064565
20200.2860070.1546770.1456050.2353640.0837340.042640
Note: All results were significant at 1%.
Disclaimer/Publisher’s Note: The statements, opinions and data contained in all publications are solely those of the individual author(s) and contributor(s) and not of MDPI and/or the editor(s). MDPI and/or the editor(s) disclaim responsibility for any injury to people or property resulting from any ideas, methods, instructions or products referred to in the content.

