
Productivity and Efficiency of Community Gardens: Case Studies from the UK

Abstract
:1. Introduction
2. Literature Review
3. Materials and Methods
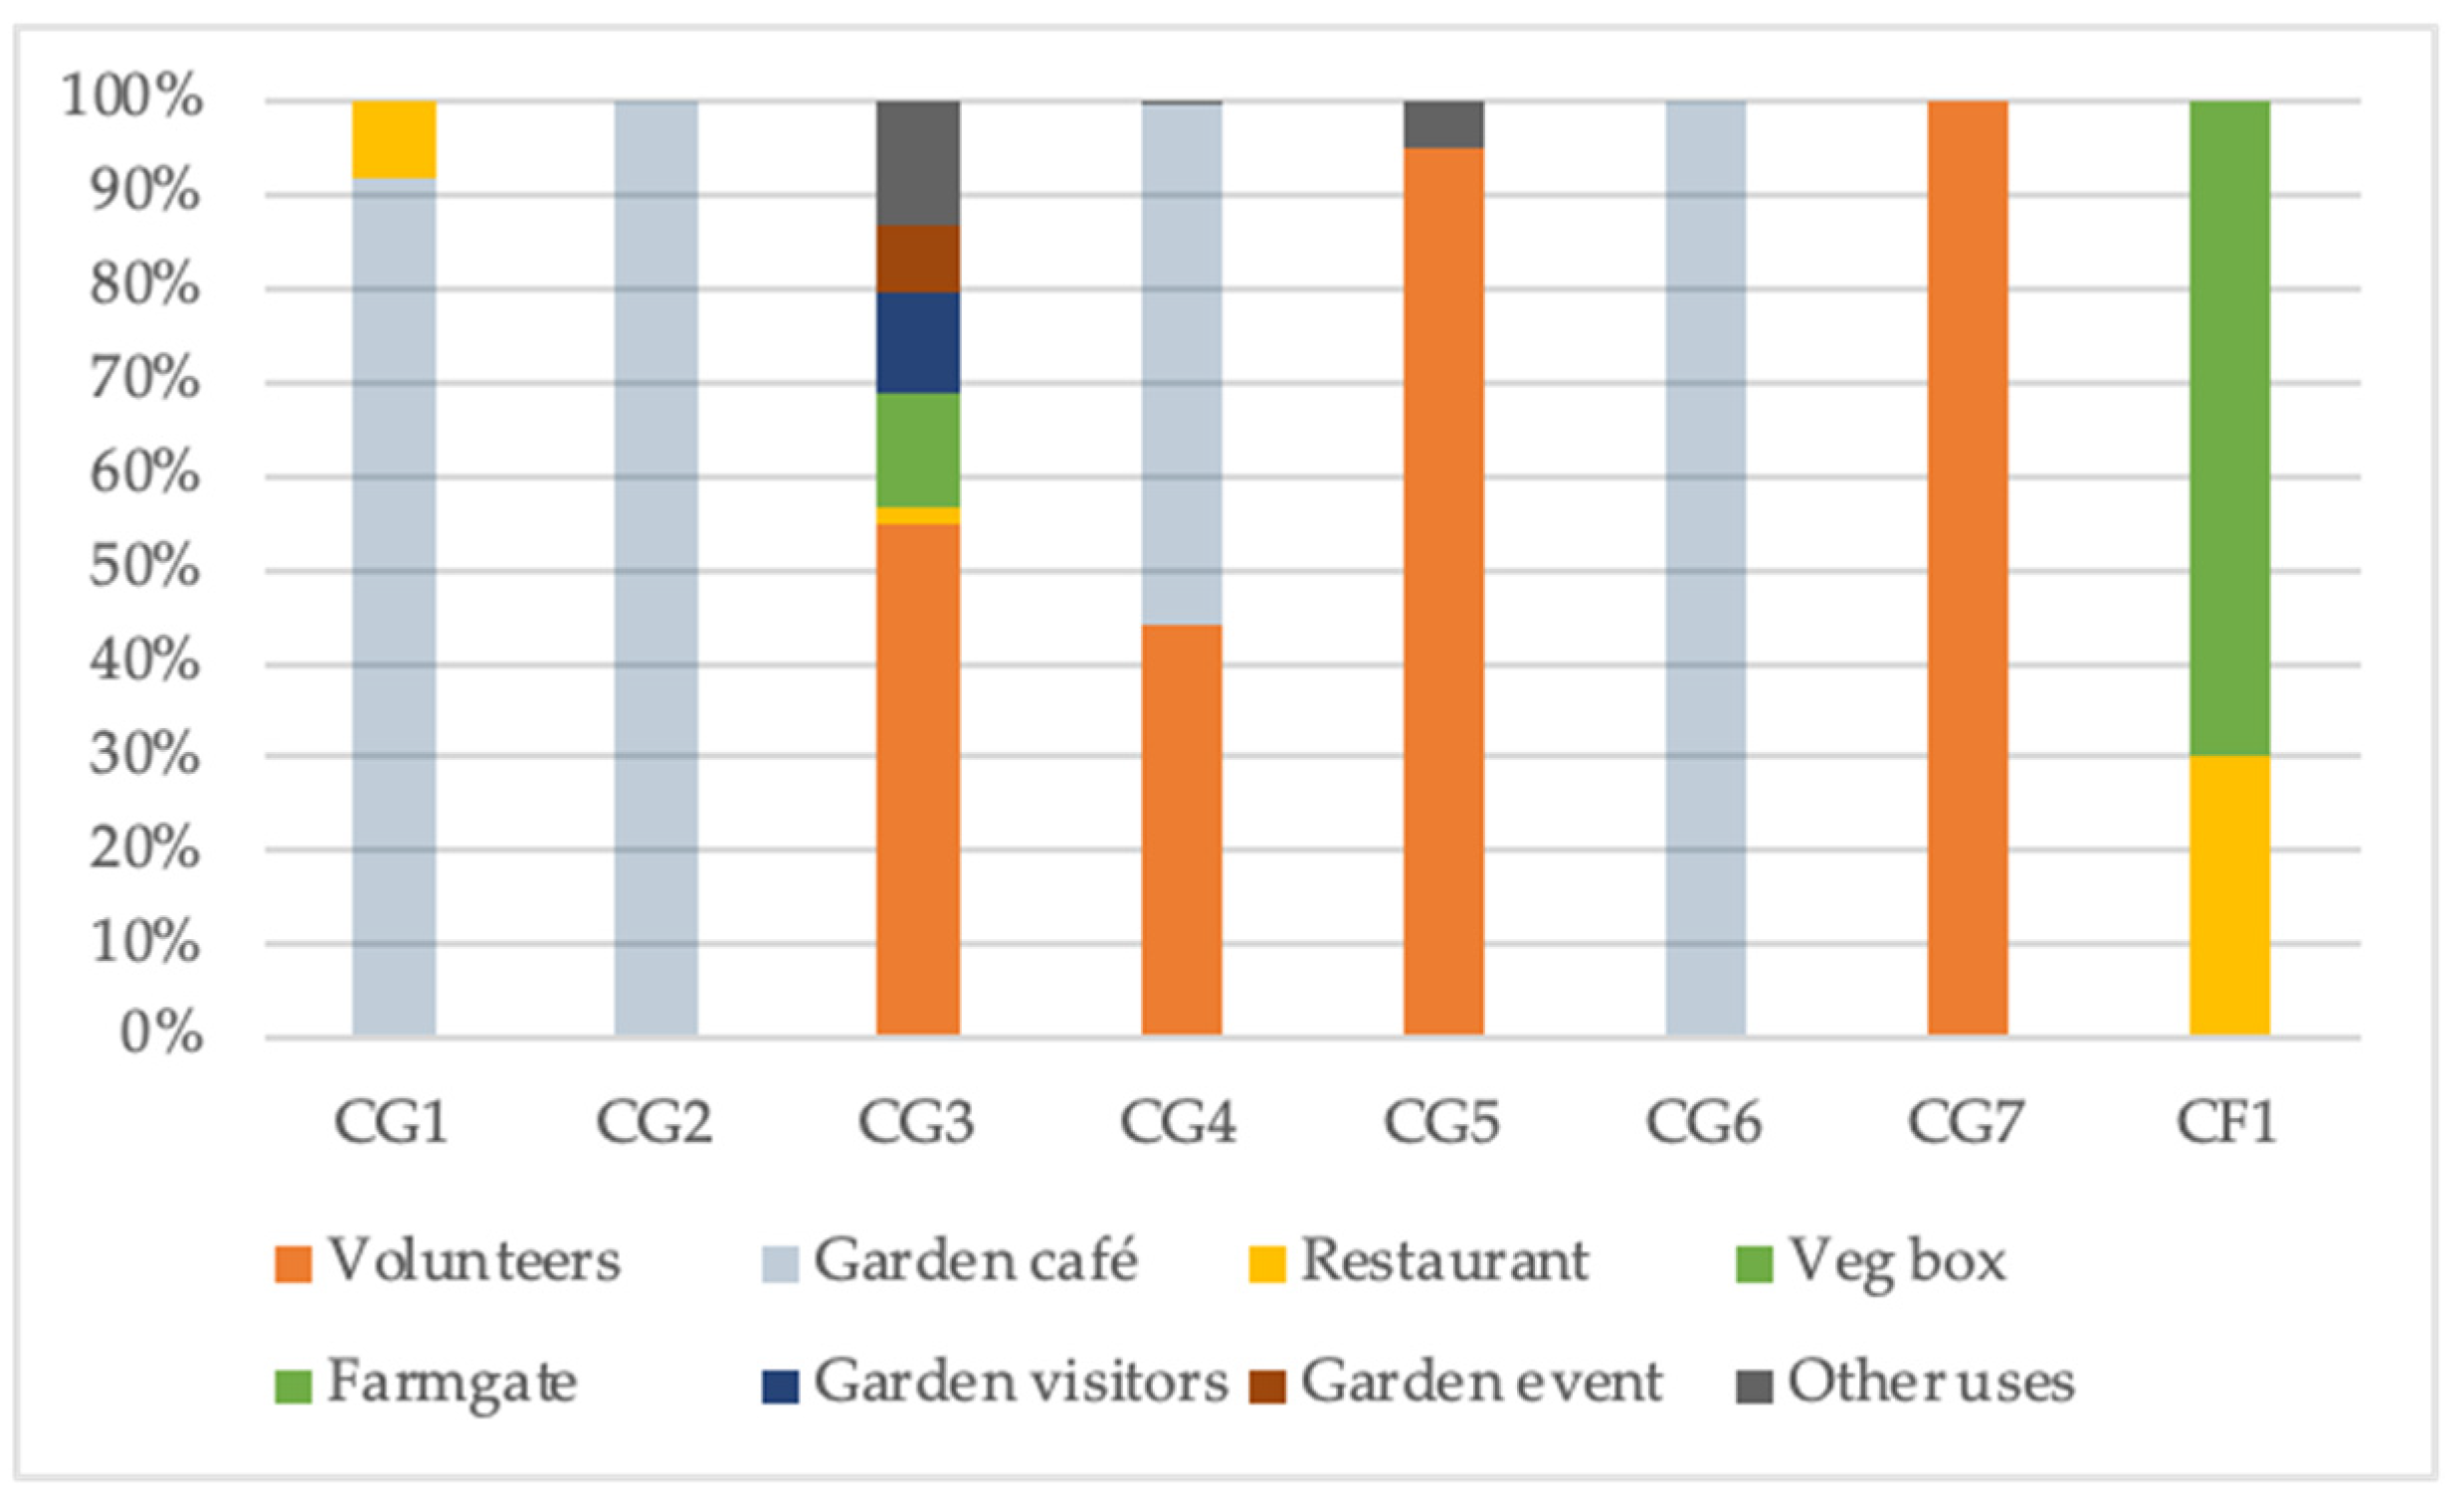
4. Results
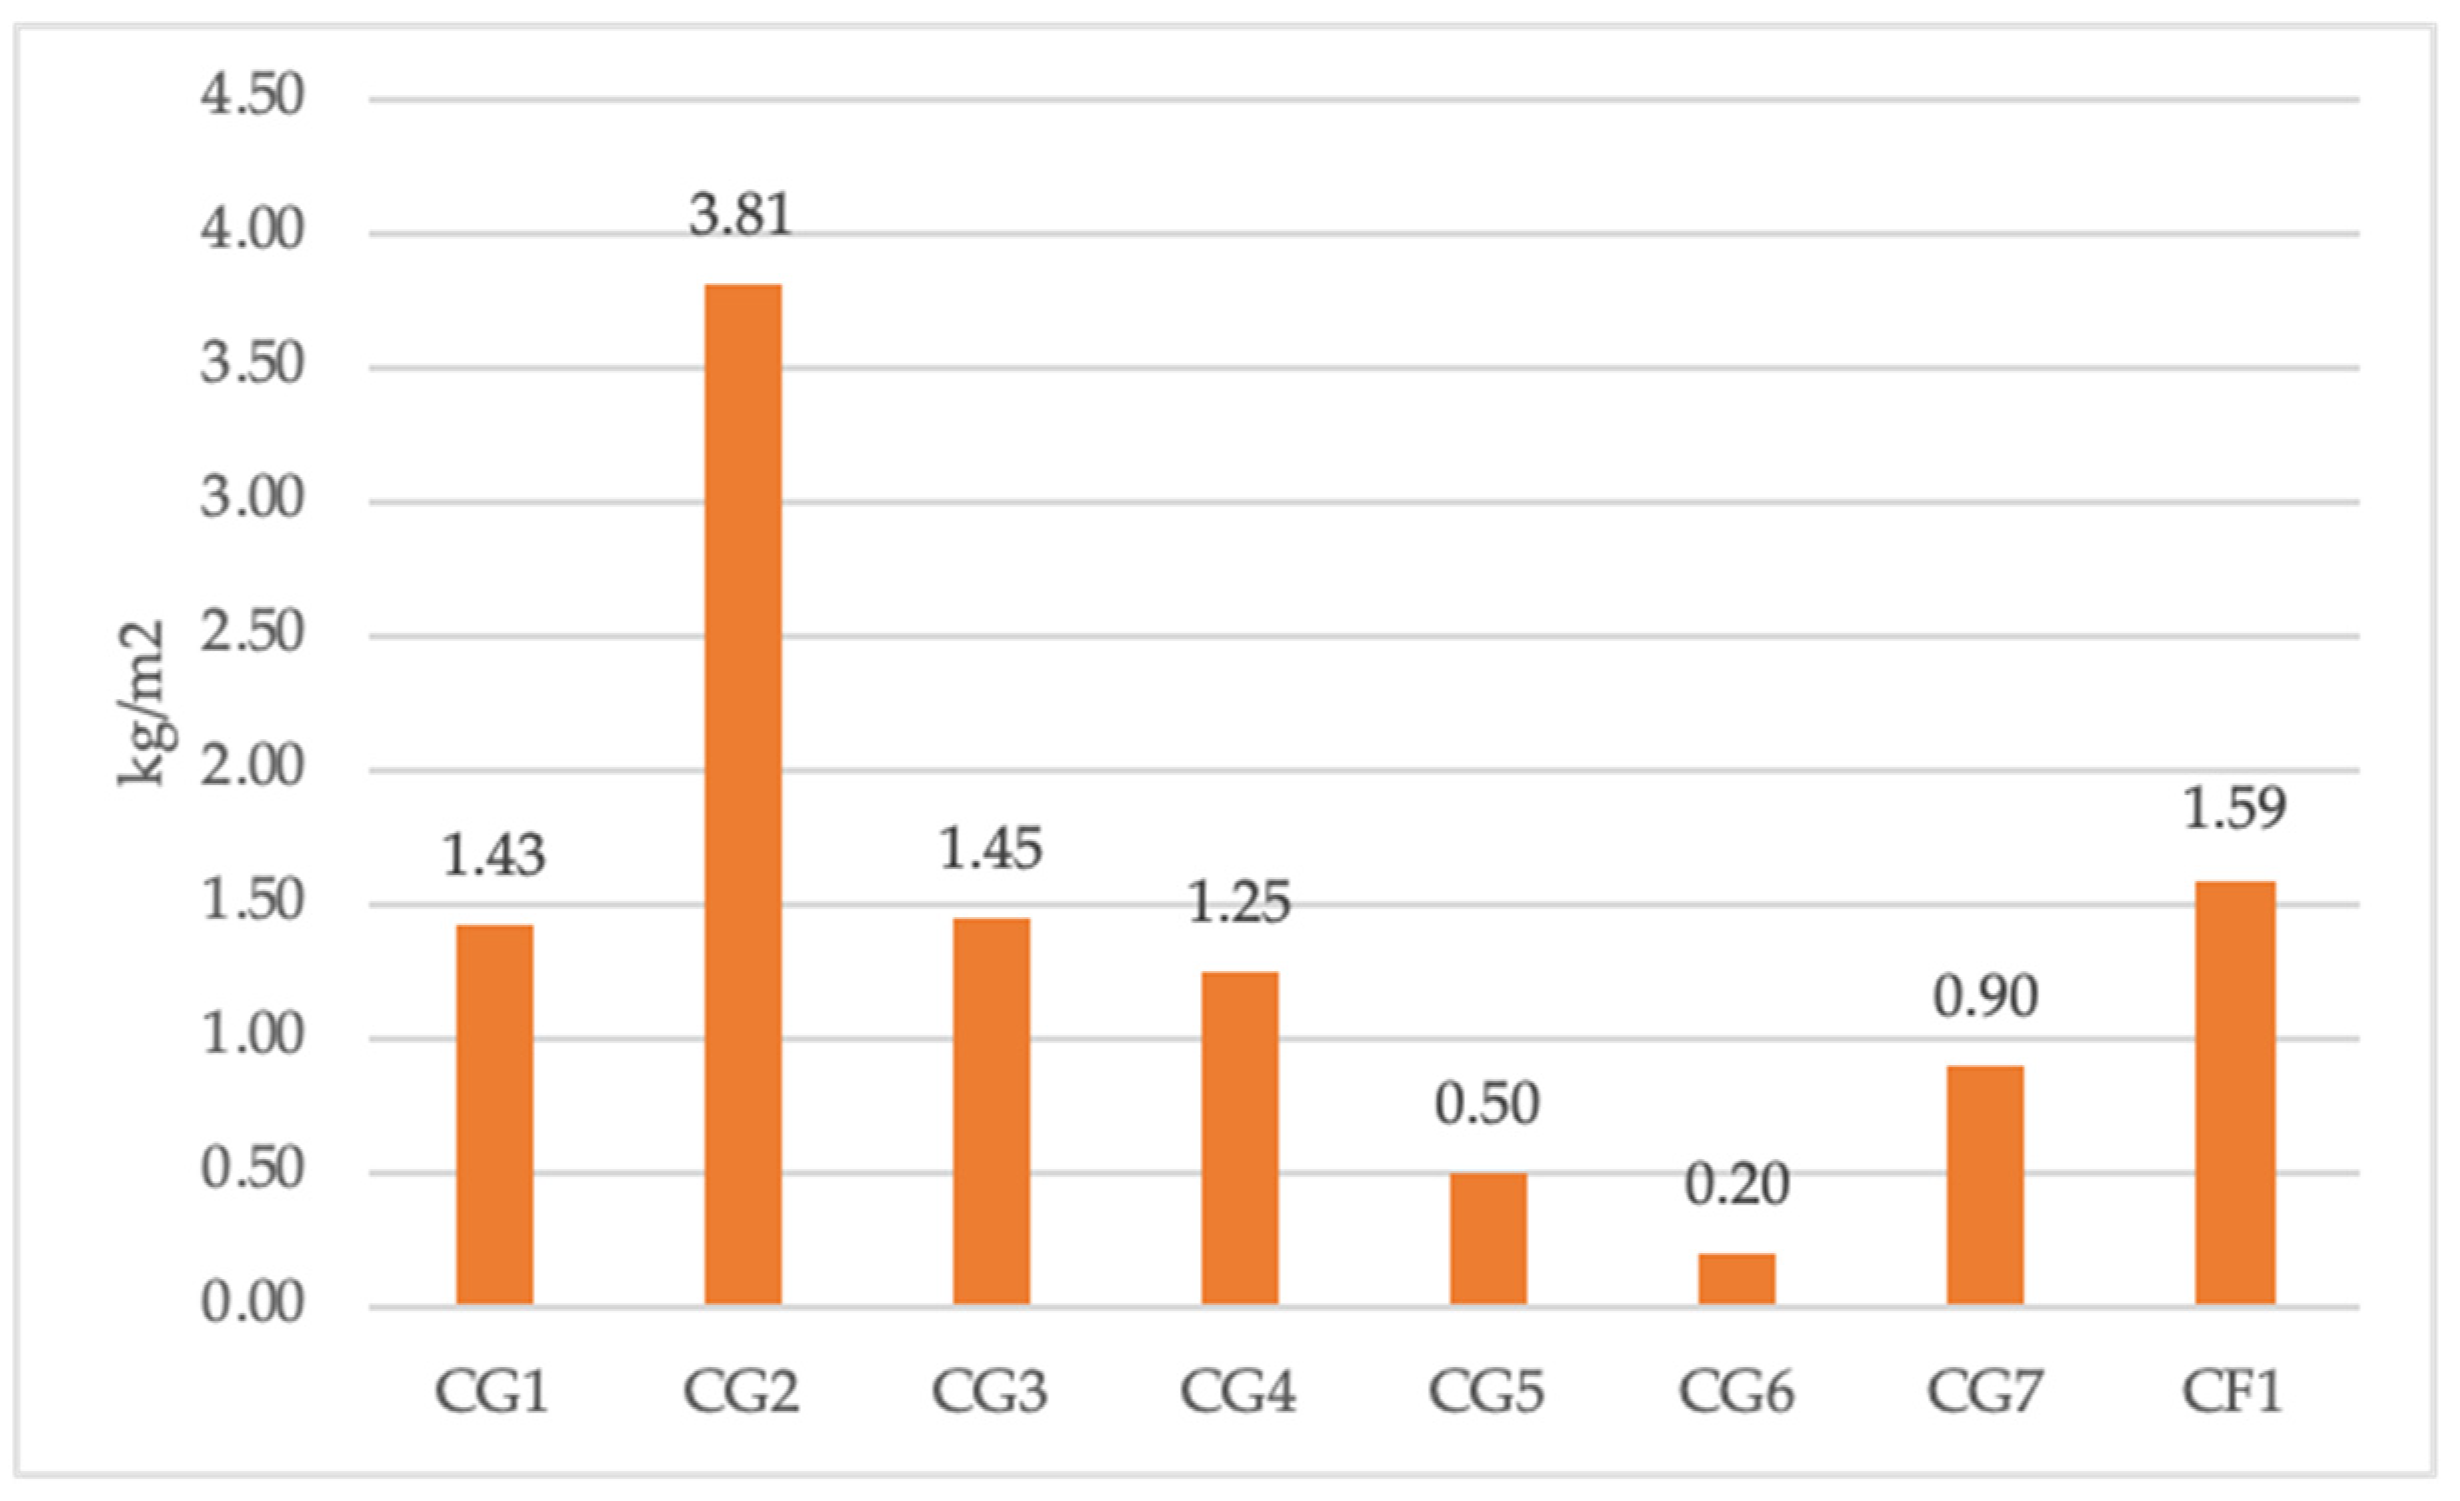
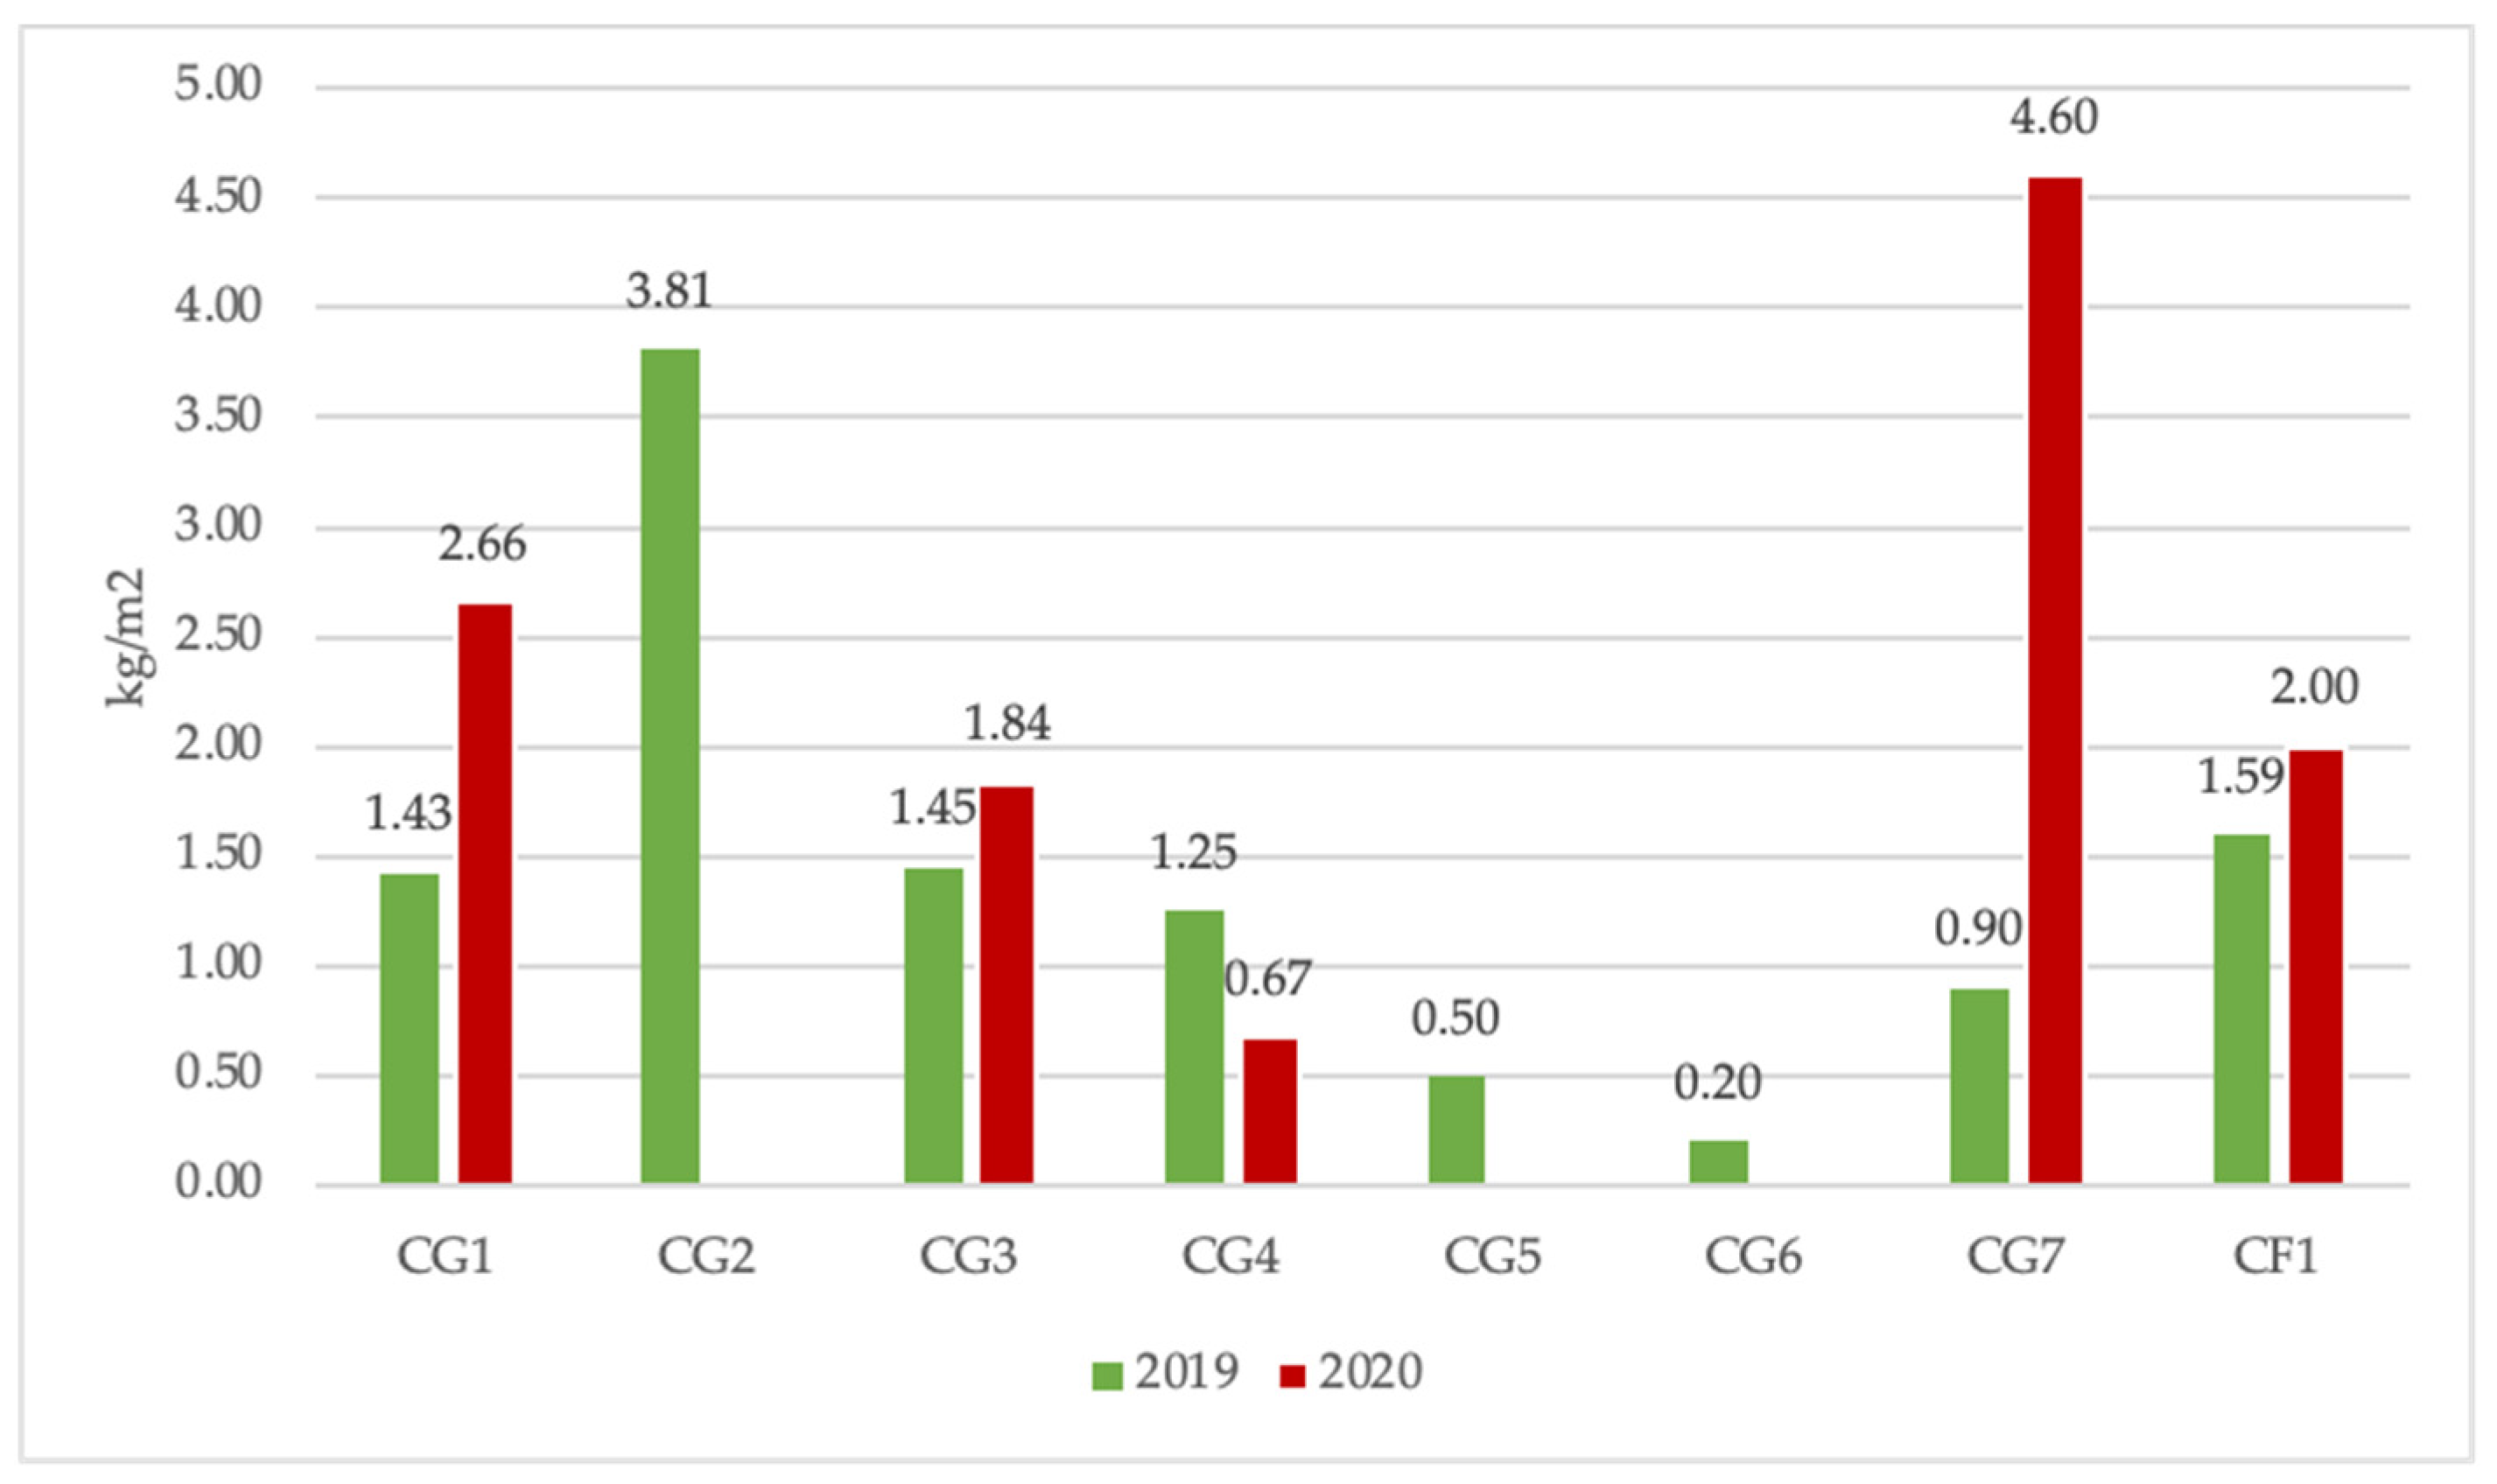
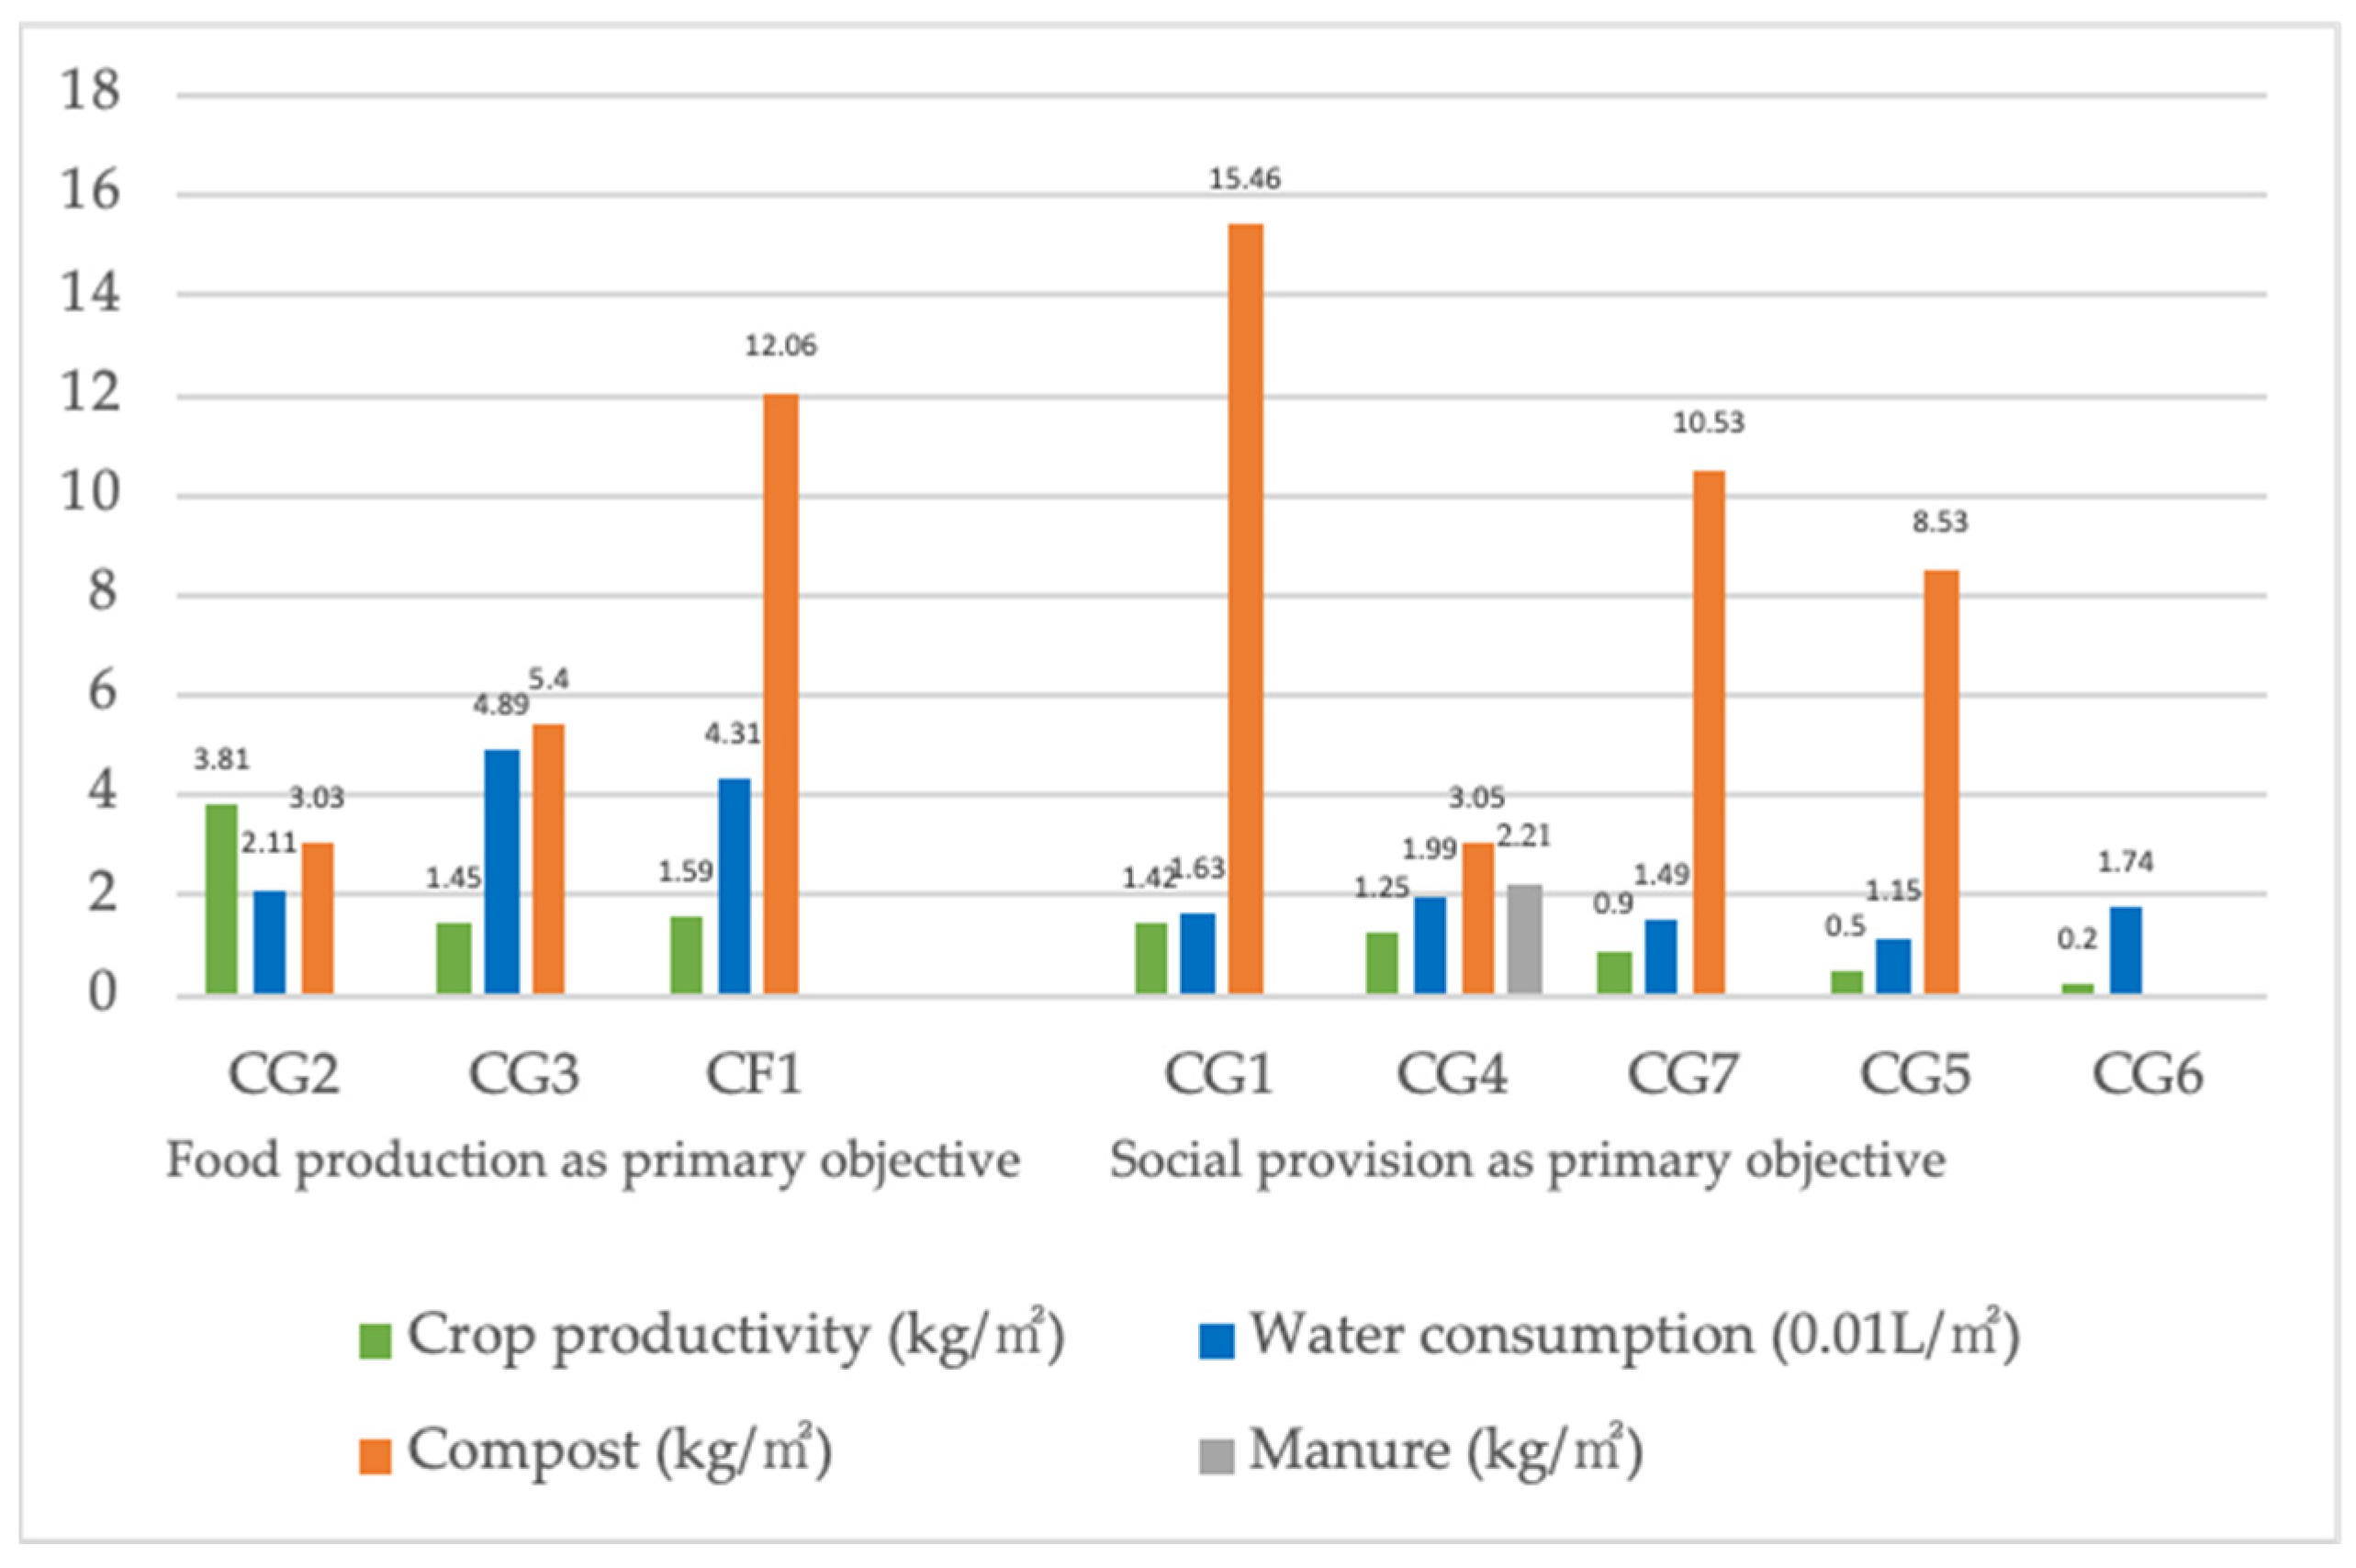
4.1. Crop Yields
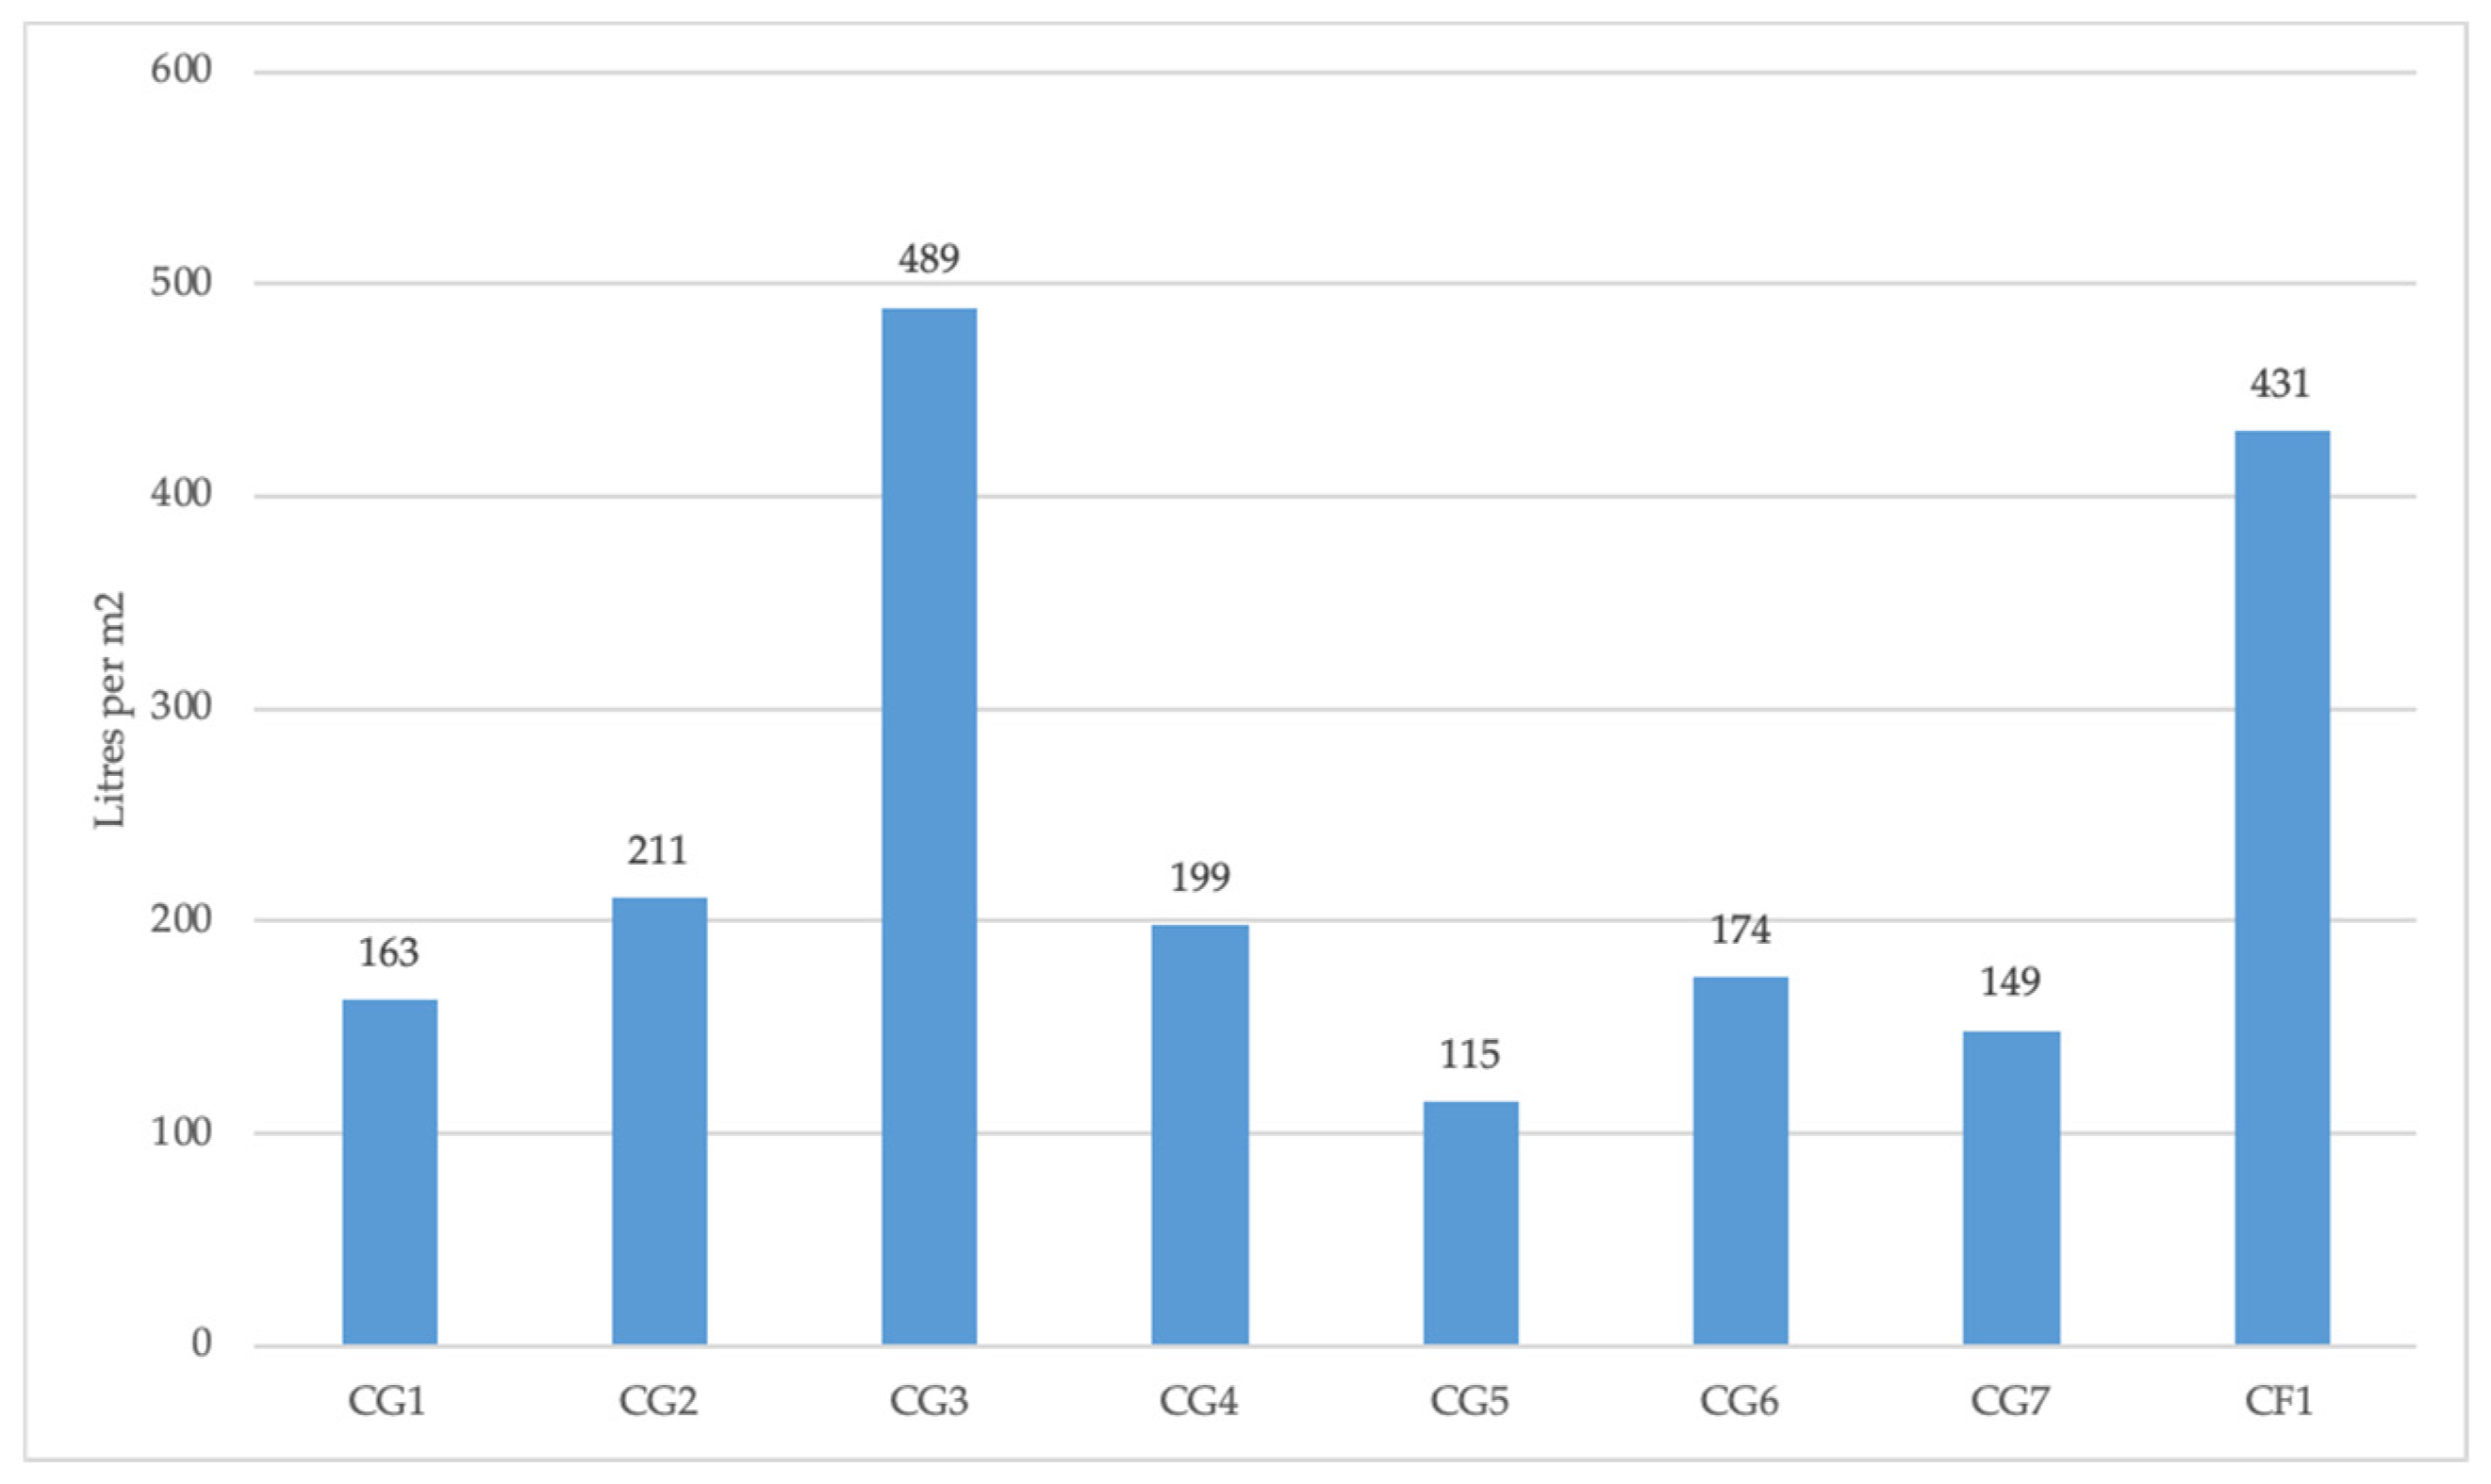
4.2. Water Use
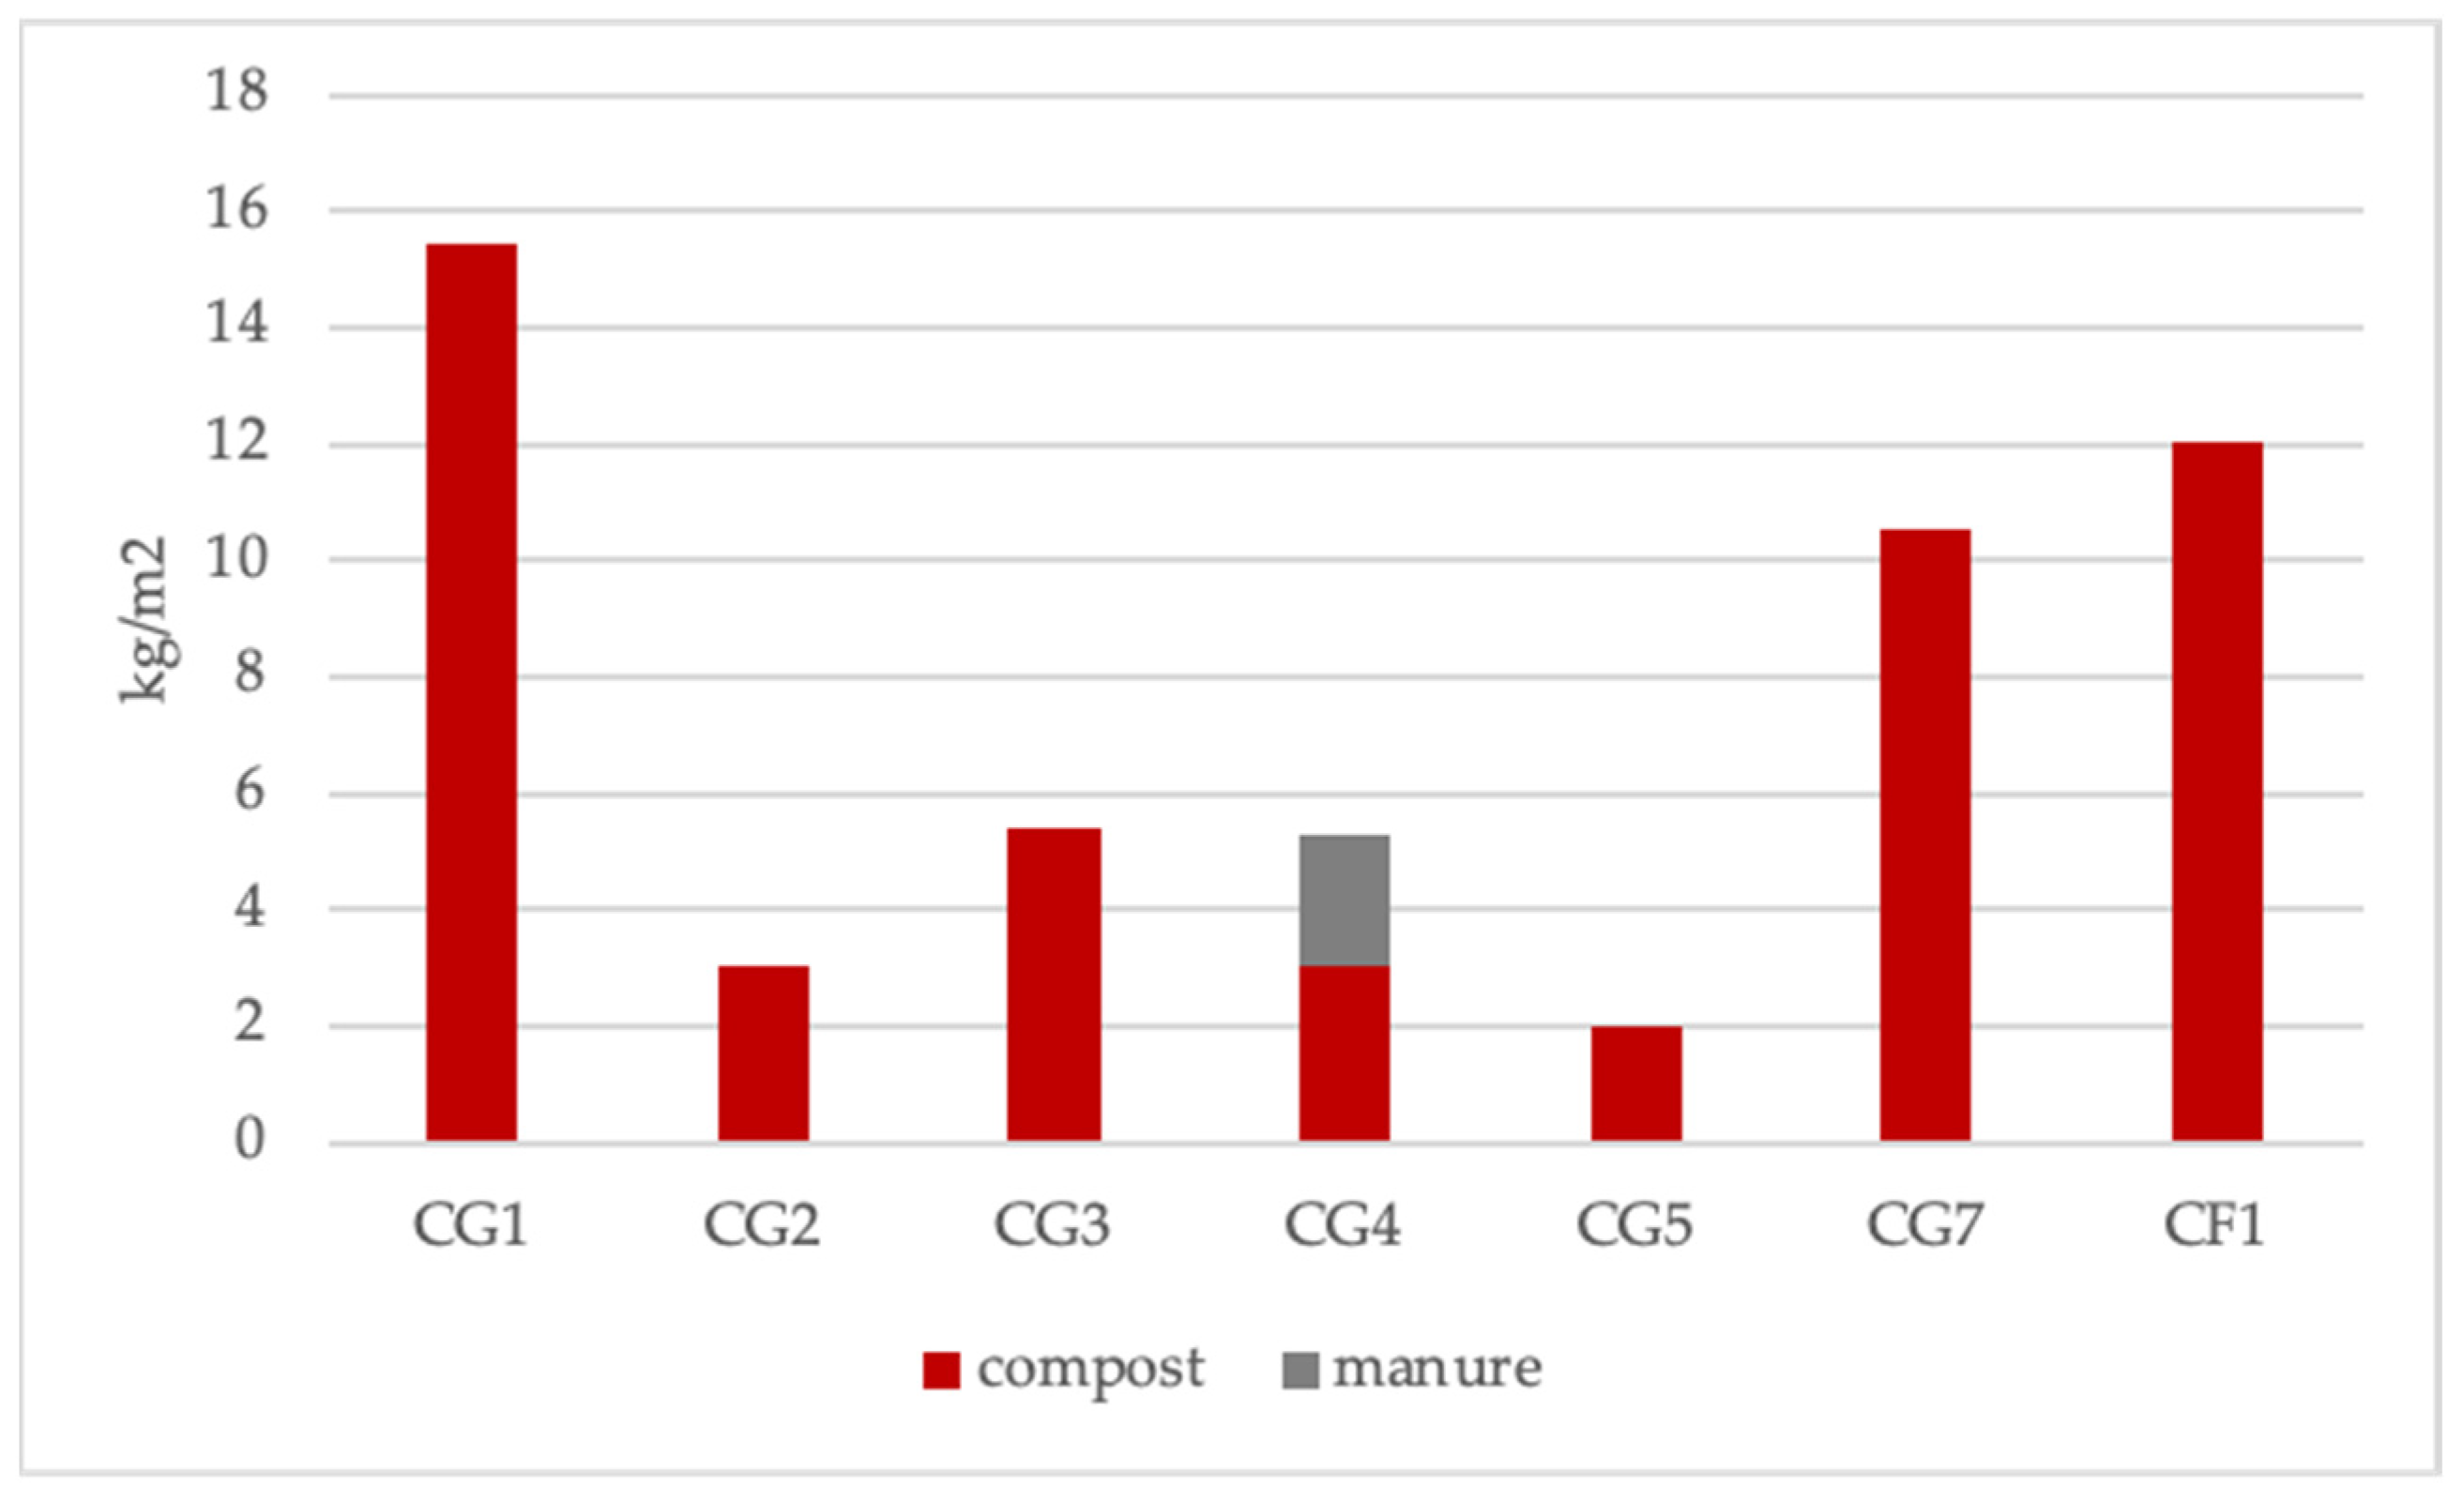
4.3. Fertilizer and Insecticide
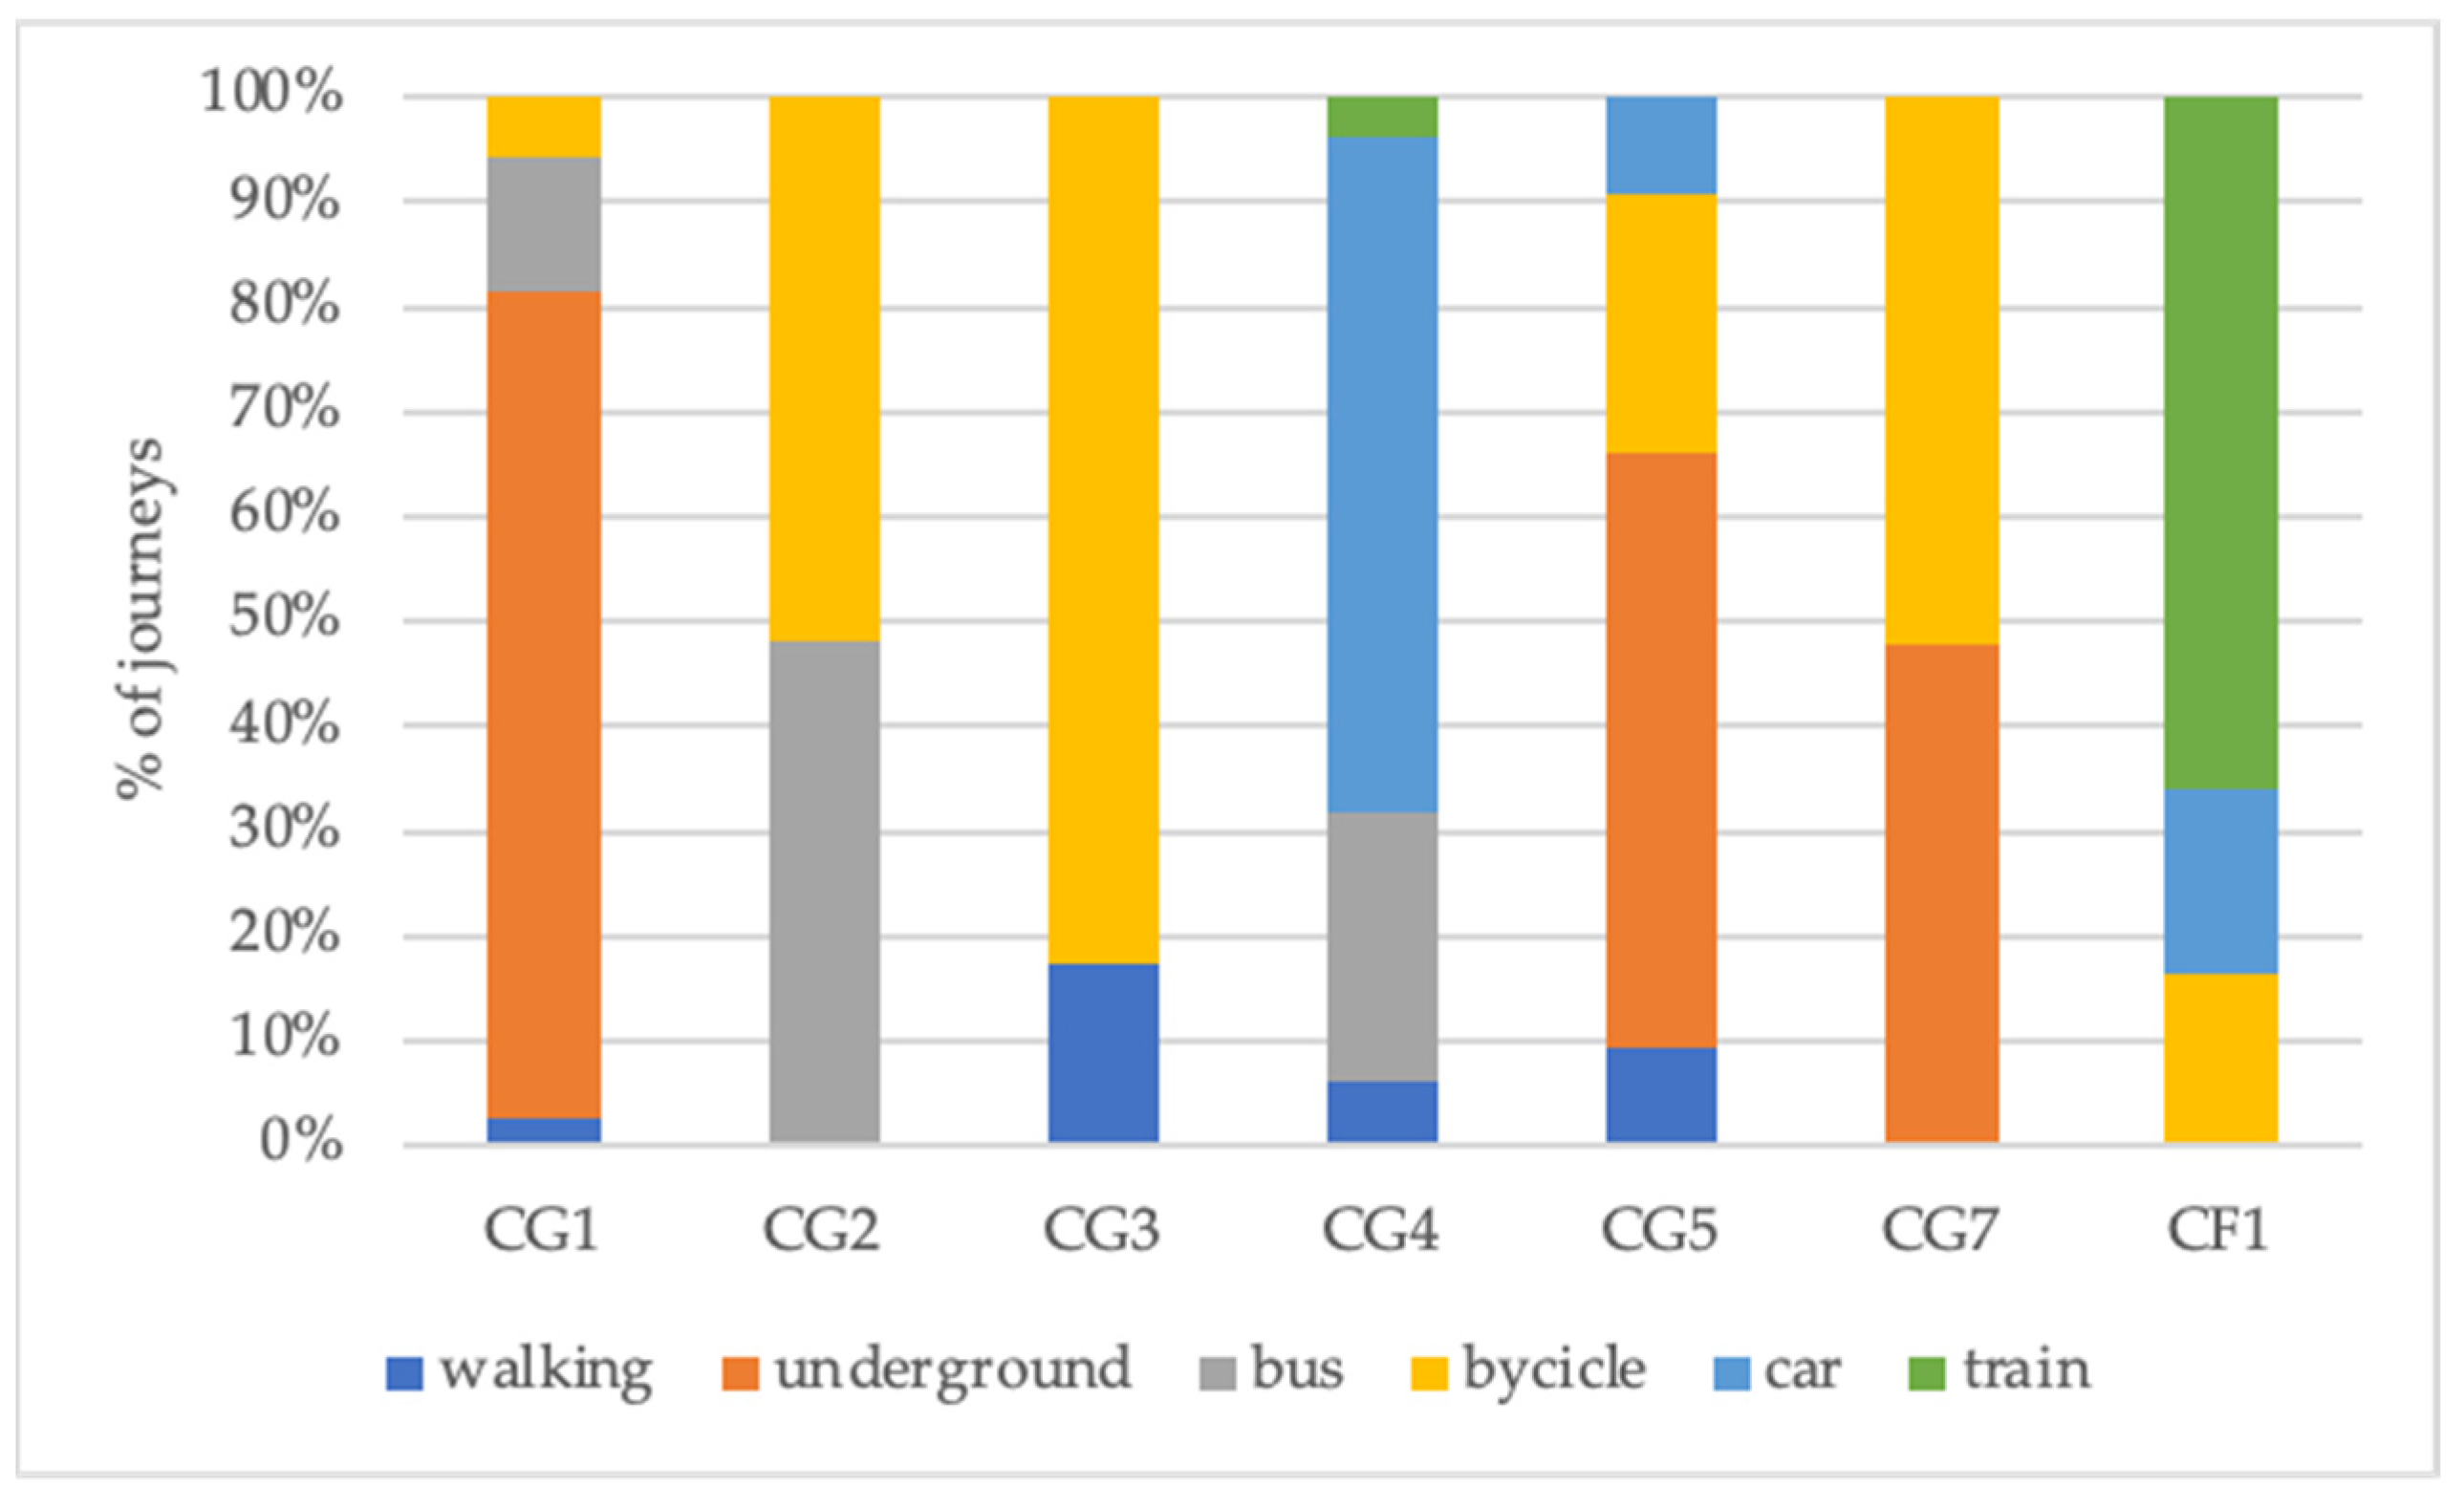
4.4. Energy and Trips to the Garden
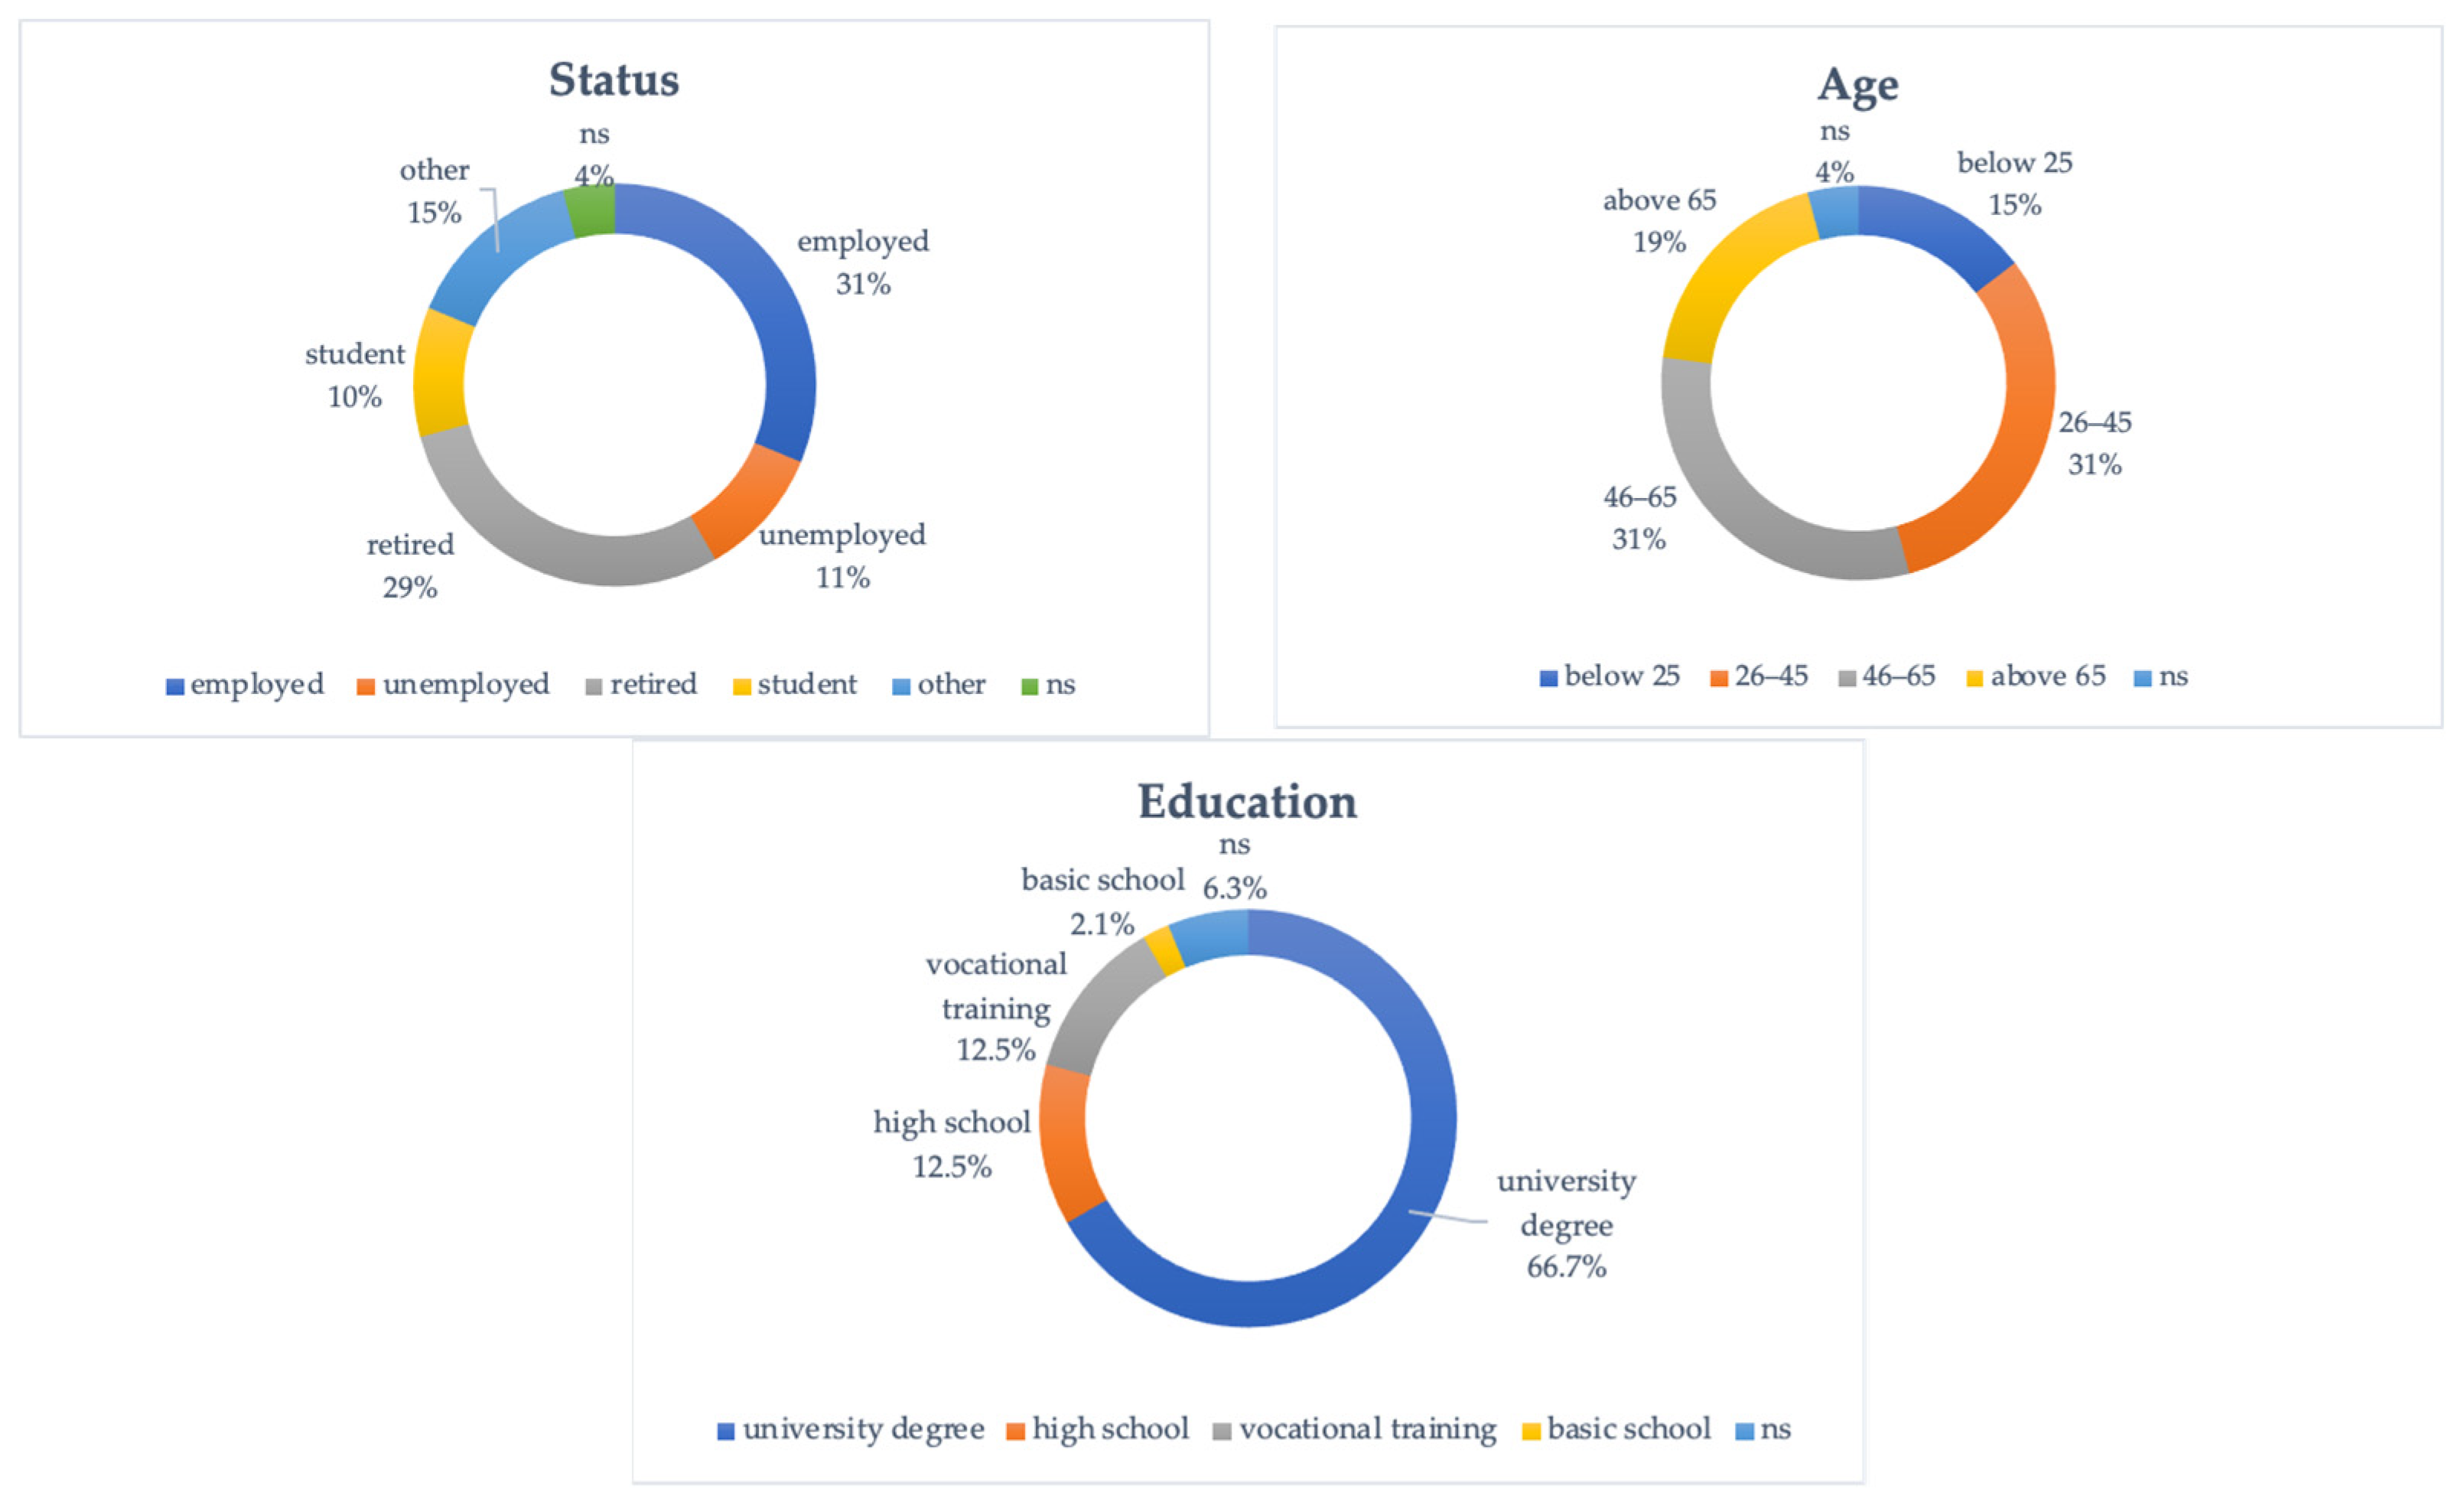
4.5. Social Impact
5. Discussion
6. Conclusions
Author Contributions
Funding
Data Availability Statement
Conflicts of Interest
References
- Sioen, G.B.; Sekiyama, M.; Terada, T.; Yokohari, M. Post-disaster food and nutrition from urban agriculture: A self-sufficiency analysis of Nerima Ward, Tokyo. Int. J. Environ. Res. Public Health 2017, 14, 748. [Google Scholar] [CrossRef] [PubMed] [Green Version]
- Wesener, A. Temporary urbanism and urban sustainability after a natural disaster: Transitional community-initiated open spaces in Christchurch, New Zealand. J. Urban. Int. Res. Placemaking Urban Sustain. 2015, 8, 406–422. [Google Scholar] [CrossRef]
- Schoen, V.; Blythe, C.; Caputo, S.; Fox-Kämper, R.; Specht, K.; Fargue-Lelièvre, A.; Cohen, N.; Ponizy, L.; Fedeńczak, K. “We Have Been Part of the Response”: The Effects of COVID-19 on Community and Allotment Gardens in the Global North. Front. Sustain. Food Syst. 2021, 5, 732641. [Google Scholar] [CrossRef]
- Yoshida, S.; Yagi, H. Long-term development of urban agriculture: Resilience and sustainability of farmers facing the Covid-19 pandemic in Japan. Sustainability 2021, 13, 4316. [Google Scholar] [CrossRef]
- McClintock, N. Why farm the city? Theorizing urban agriculture through a lens of metabolic rift. Camb. J. Reg. Econ. Soc. 2010, 3, 191–207. [Google Scholar] [CrossRef] [Green Version]
- Cohen, N. Urban Agriculture as a response to the great recession. In Integrated Urban Agriculture, Precedents, Practices, Prospects; France, R.L., Ed.; Green Frigate Books: Faringdon, UK, 2016; pp. 331–352. [Google Scholar]
- Lwasa, S.; Mugagga, F.; Wahab, B.; Simon, D.; Connors, J.; Griffith, C. Urban and peri-urban agriculture and forestry: Transcending poverty alleviation to climate change mitigation and adaptation. Urban Clim. 2014, 7, 92–106. [Google Scholar] [CrossRef]
- Pearson, L.J.; Pearson, L.; Pearson, C.J. Sustainable urban agriculture: Stocktake and opportunities. Int. J. Agric. Sustain. 2010, 8, 7–19. [Google Scholar] [CrossRef]
- Barthel, S.; Isendahl, C.; Vis, B.N.; Drescher, A.; Evans, D.L.; van Timmeren, A. Global urbanization and food production in direct competition for land: Leverage places to mitigate impacts on SDG2 and on the Earth System. Anthr. Rev. 2019, 6, 71–97. [Google Scholar] [CrossRef]
- Holland, L. Diversity and connections in community gardens: A contribution to local sustainability. Local Environ. 2004, 9, 285–305. [Google Scholar] [CrossRef]
- Lovell, S.T. Multifunctional urban agriculture for sustainable land use planning in the United States. Sustainability 2010, 2, 2499–2522. [Google Scholar] [CrossRef]
- Cohen, N.; Reynolds, K.; Sanghvi, R. Five Borough Farm: Seeding the Future of Urban Agriculture in New York City; Design Trust for Public Space: New York,, USA, 2012. [Google Scholar]
- Duchemin, E.; Wegmuller, F.; Legault, A.M. Urban agriculture: Multi-dimensional tools for social development in poor neighbourhoods. Field Actions Sci. Rep. J. Field Actions 2008, 1. [Google Scholar] [CrossRef]
- Artmann, M.; Sartison, K. The role of urban agriculture as a nature-based solution: A review for developing a systemic assessment framework. Sustainability 2018, 10, 1937. [Google Scholar] [CrossRef] [Green Version]
- Garnett, T. CityHarvest: The Feasibility of Growing More Food in London; Sustain: London, UK, 1999. [Google Scholar]
- Colasanti, K.J.A.; Hamm, M.W.; Litjens, C. The City as an “Agricultural Powerhouse”? Perspectives on Expanding Urban Agriculture from Detroit, Michigan. Urban Geogr. 2012, 33, 348–369. [Google Scholar]
- Ackerman, K.; Conard, M.; Culligan, P.; Plunz, R.; Sutto, M.P.; Whittinghill, L. Sustainable food systems for future cities: The potential of urban agriculture. Econ. Soc. Rev. 2014, 45, 189–206. [Google Scholar]
- Nadal, A.; Alamús, R.; Pipia, L.; Ruiz, A.; Corbera, J.; Cuerva, E.; Rieradevall, J.; Josa, A. Urban planning and agriculture. Methodology for assessing rooftop greenhouse potential of non-residential areas using airborne sensors. Sci. Total Environ. 2017, 601, 493–507. [Google Scholar] [CrossRef] [PubMed] [Green Version]
- Saha, M.; Eckelman, M.J. Growing fresh fruits and vegetables in an urban landscape: A geospatial assessment of ground level and rooftop urban agriculture potential in Boston, USA. Landsc. Urban Plan. 2017, 165, 130–141. [Google Scholar] [CrossRef]
- Hara, Y.; McPhearson, T.; Sampei, Y.; McGrath, B. Assessing urban agriculture potential: A comparative study of Osaka, Japan and New York city, United States. Sustain. Sci. 2018, 13, 937–952. [Google Scholar] [CrossRef]
- Pourias, J.; Duchemin, E.; Aubry, C. Products from urban collective gardens: Food for thought or for consumption? Insights from Paris and Montreal. J. Agric. Food Syst. Community Dev. 2015, 5, 175–199. [Google Scholar]
- McDougall, R.; Kristiansen, P.; Rader, R. Small-scale urban agriculture results in high yields but requires judicious management of inputs to achieve sustainability. Proc. Natl. Acad. Sci. USA 2019, 116, 129–134. [Google Scholar] [CrossRef] [Green Version]
- Ginn, F. Dig for Victory! New histories of wartime gardening in Britain. J. Hist. Geogr. 2012, 38, 294–305. [Google Scholar] [CrossRef]
- DEFRA. Family Food, 2015; Department for Environment & Rural Affairs: London, UK, 2017. [Google Scholar]
- Nicholls, E.; Ely, A.; Birkin, L.; Basu, P.; Goulson, D. The contribution of small-scale food production in urban areas to the sustainable development goals: A review and case study. Sustain. Sci. 2020, 15, 1585–1599. [Google Scholar] [CrossRef] [Green Version]
- Grafius, D.R.; Edmondson, J.L.; Norton, B.A.; Clark, R.; Mears, M.; Leake, J.R.; Corstanje, R.; Harris, J.A.; Warren, P.H. Estimating food production in the urban landscape. Nat. Sci. Rep. 2020, 10, 5141. [Google Scholar] [CrossRef] [PubMed] [Green Version]
- Walsh, L.E.; Mead, B.R.; Hardman, C.A.; Evans, D.; Liu, L.; Falagán, N.; Kourmpetli, S.; Davies, J. Potential of urban green spaces for supporting horticultural production: A national scale analysis. Environ. Res. Lett. 2022, 17, 014052. [Google Scholar] [CrossRef]
- Dobson, M.C.; Warren, P.H.; Edmondson, J.L. Assessing the direct resource requirements of urban horticulture in the United Kingdom: A citizen science approach. Sustainability 2021, 13, 2628. [Google Scholar] [CrossRef]
- Wright, H. Outside Time: A Personal History of Prison Farming and Gardening; Priory Ash Publishing: Cullompton, UK, 2017; p. 304. [Google Scholar]
- Sustain, the Alliance for Food and Farming. Reaping Rewards II—Measuring and Valuing Urban Food Growing; Report; Sustain: London, UK, 2016. [Google Scholar]
- Taylor, J. Modeling the Potential Productivity of Urban Agriculture and Its Impacts on Soil Quality Through Experimental Research on Scale-Appropriate Systems. Front. Sustain. Food Syst. 2020, 4, 89. [Google Scholar] [CrossRef]
- Ward, J.D.; Ward, P.J.; Mantzioris, E.; Saint, C. Optimising diet decisions and urban agriculture using linear programming. Food Secur. 2014, 6, 701–718. [Google Scholar] [CrossRef]
- Guitart, D.A.; Byrne, J.A.; Pickering, C.M. Greener growing: Assessing the influence of gardening practices on the ecological viability of community gardens in South East Queensland, Australia. J. Environ. Plan. Manag. 2015, 58, 189–212. [Google Scholar] [CrossRef] [Green Version]
- Newell, J.P.; Foster, A.; Borgman, M.; Meerow, S. Ecosystem services of urban agriculture and prospects for scaling up production: A study of Detroit. Cities 2022, 125, 103664. [Google Scholar] [CrossRef]
- Evans, D.L.; Falagan, N.; Hardman, C.A.; Kourmpetli, S.; Liu, L.; Mead, B.R.; Davies, J.A.C. Ecosystem service delivery by urban agriculture and green infrastructure—A systematic review. Ecosyst. Serv. 2022, 54, 2–12. [Google Scholar] [CrossRef]
- Kingsley, J.; Foenander, E.; Bailey, A. ‘’You feel like you’re part of something bigger’’: Exploring motivations for community garden participation in Melbourne, Australia. BMC Public Health 2019, 19, 745. [Google Scholar] [CrossRef] [Green Version]
- Kingsley, J.; Egerer, M.; Nuttman, S.; Keniger, L.; Pettitt, P.; Frantzeskaki, N.; Gray, T.; Ossola, A.; Lin, B.; Bailey, A.; et al. Urban agriculture as a nature based solution to address socio-ecological challenges in Australian cities. Urban For. Green. 2021, 60, 127059. [Google Scholar] [CrossRef]
- Kingsley, J.; Townsend, M. ‘Dig in’to social capital: Community gardens as mechanisms for growing urban social connectedness. Urban Policy Res. 2006, 24, 525–537. [Google Scholar] [CrossRef]
- Kirby, C.K.; Specht, K.; Fox-Kämper, R.; Hawes, J.K.; Cohen, N.; Caputo, S.; Ilieva, R.T.; Lelièvre, A.; Poniży, L.; Schoen, V.; et al. Differences in motivations and social impacts across urban agriculture types: Case studies in Europe and the US. Landsc. Urban Plan. 2021, 212, 104110. [Google Scholar] [CrossRef]
- Dorr, E.; Goldstein, B.P.; Horvath, A.; Aubry, C.; Gabrielle, B. Environmental impacts and resource use of urban agriculture: A systematic review and meta–analysis. Environ. Res. Lett. 2021, 16, 093002. [Google Scholar] [CrossRef]
- Varley-Winter, O. Roots to Work: Developing Employability through Community Food-Growing and Urban Agriculture Projects; City and Guilds and Capital Growth: London, UK, 2011. [Google Scholar]
- Bickerdike, L.; Booth, A.; Wilson, P.M.; Farley, K.; Wright, K. Social prescribing: Less rhetoric and more reality. A systematic review of the evidence. BMJ Open 2017, 7, e0133842017. [Google Scholar] [CrossRef] [Green Version]
- Fixsen, A.; Barrett, S. Challenges and Approaches to Green Social Prescribing During and in the Aftermath of COVID-19: A Qualitative Study. Front. Psychol. 2022, 13, 861107. [Google Scholar] [CrossRef] [PubMed]
- Howarth, M.; Griffiths, A.; da Silva, A.; Green, R. Social prescribing: A ‘natural’community-based solution. Br. J. Community Nurs. 2020, 25, 294–298. [Google Scholar] [CrossRef] [PubMed]
- Barry, V.; Blythe, C. Growing pathways to well-being through community gardens and green space. Case studies from Birmingham and the West Midlands, UK. In Pathways to Well-Being in Design Examples from the Arts, Humanities and the Built Environment; Coles, R., Costa, S., Watson, S., Eds.; Routledge: London, UK, 2019; pp. 76–96. [Google Scholar]
- Bragg, R.; Atkins, G.J. A review of nature-based interventions for mental health care. Nat. Engl. Comm. Rep. 2016, 204, 18. [Google Scholar]
- Goldstein, B.; Hauschild, M.; Fernandez, J.; Birkved, M. Testing the environmental performance of urban agriculture as a food supply in northern climates. J. Clean. Prod. 2016, 135, 984–994. [Google Scholar] [CrossRef] [Green Version]
- Goldstein, B.; Hauschild, M.; Fernandez, J.; Birkved, M. Urban versus conventional agriculture, taxonomy of resource profiles: A review. Agron. Sustain. Dev. 2016, 36, 9. [Google Scholar] [CrossRef] [Green Version]
- Caputo, S.; Schoen, V.; Specht, K.; Grard, B.; Blythe, C.; Cohen, N.; Fox-Kämper, R.; Hawes, J.; Newell, J.; Poniży, L. Applying the food-energy-water nexus approach to urban agriculture: From FEW to FEWP (Food-Energy-Water-People). Urban For. Urban Green. 2021, 58, 126934. [Google Scholar] [CrossRef]
- Pollard, G.; Roetman, P.; Ward, J. The case for citizen science in urban agriculture research. Future Food J. Food Agric. Soc. 2017, 5, 9–20. [Google Scholar]
- CoDyre, M.; Fraser, E.D.G.; Landman, K. How does your garden grow? An empirical evaluation of the costs and potential of urban gardening. Urban For. Urban Green. 2015, 14, 72–79. [Google Scholar] [CrossRef]
- Public Health England. A quick guide to the Government’s Healthy Eating Recommendations. 2018. Available online: https://assets.publishing.service.gov.uk/government/uploads/system/uploads/attachment_data/file/742746/A_quick_guide_to_govt_healthy_eating_update.pdf (accessed on 30 April 2022).
- De Gennaro, M.; Paffumi, E.; Martini, G. Big data for supporting low-carbon road transport policies in Europe: Applications, challenges and opportunities. Big Data Res. 2016, 6, 11–25. [Google Scholar] [CrossRef]
- Diekmann, L.O.; Gray, L.C.; Thai, C.L. More than food: The social benefits of localized urban food systems. Front. Sustain. Food Syst. 2020, 4, 534219. [Google Scholar] [CrossRef]
- Krikser, T.; Piorr, A.; Berges, R.; Opitz, I. Urban agriculture oriented towards self-supply, social and commercial purpose: A typology. Land 2016, 5, 28. [Google Scholar] [CrossRef]
- Dorr, E.; Hawes, J.K.; Goldstein, B.; Fargue-Lelièvre, A.; Fox Kämper, R.; Specht, K.; Fedeńczak, K.; Caputo, S.; Cohen, C.; Poniży, L.; et al. (forthcoming) Food production and resource use of urban farms and gardens: A five-country study. Agron. Sustain. Dev. accepted.


| Source | This Study | Dobson et al. [28] | Wright [29] | Sustain [30] | Taylor [31] | Nicholls et al. [25] |
|---|---|---|---|---|---|---|
| Location | London, UK (n = 8 community gardens and farms) | UK Wide Allotments (n = 163 allotments) | Kirkham Prison Farm | London (mainly) (n = 89 2014 + 160 in 2013) | Rhode Island (US) (n = 4 experimental plots at Rhode Island University) | Brighton & Hove (UK) (n = 185 allotment-holders and home-growers) |
| Metric | ||||||
| Kg/m2 | a | a | a | a | a | |
| Economic Value | a | a | a | |||
| Production Quantity (heads) | a | |||||
| Weight | a | a | ||||
| Number of Portions (80g) | a | a |
| Garden/Farm | Cultivated Area (m2) | Total Harvest 2019 (kg) | Primary (a), Secondary (b) and Tertiary (c) Objectives | Educational Activities (E) and Community Activities (C) | Food Destination/Sales Channel |
|---|---|---|---|---|---|
| CG1 is located in Central London and aims to improve the mental and physical well-being of residents and local groups. It offers sports facilities, a community hub, room hire for activities, a café and a food growing space. | 144 | 205 | (a) Community cohesion and development (b) Environmental remediation (c) Food production | (E) Gardening demonstration/training Environmental lessons Hydroponics workshops (C) Volunteer day Community meals | Sold Donated to food bank Used in own restaurant |
| CG2 is a community garden attached to a North London leisure center. It uses the space around the building for productive and educational purposes, strengthening the environmental and social sustainability of the center by increasing the local biodiversity and giving volunteers the opportunity to improve their well-being through gardening. The food grown is cooked in the local cafeteria. It uses permaculture methods. | 297 | 1132 | (a) Food production (b) Environmental remediation (c) Education | (E) School visits Environmental and food lessons Bee courses Woodcraft (C) Cultural events, garden/farm tours, festivals/parties Community meeting Community outreach—well-being day | Used in own restaurant |
| CG3 is a community garden within a large social housing estate in East London. It is located next to the community center and mainly attracts the estate’s residents, although it is open to volunteers from all over London. | 100 | 145 | (a) Food production (b) Community cohesion and development (c) Education | (E) N/A (C) Festival/party Open Squares Weekend | Distributed to volunteers, sold or donated Farm stand Restaurants |
| CG4 is a charity and a community garden within an allotment site in Hertford. It supports adults with learning disabilities and mental health issues through gardening. The produce is also used in the café, which employs some of the volunteers with disabilities | 452 | 566 | (a) Community cohesion and development (b) Public health (c) Food production | (E) Environmental lessons, other educational activities Willow weaving (C) Community meetings, volunteer days Open allotments | Distributed to volunteers Sold Used in own restaurant |
| CG5 is located within one of the most famous London parks. It aims to inspire people to grow food whilst providing advice on organic methods of cultivation. It is open to the public and the food is distributed to volunteers or donated. It runs several educational activities | 324 | 161 | (a) Public health (b) Environmental remediation (c) Education | (E) Volunteer day, festivals/parties Open day with book signing (C) N/A | Distributed to volunteers |
| CG6 has moved several times across the neighbourhood where is located. It is a moveable garden with the educational mission to connect people with nature. It offers a growing space and many other facilities for community activities, including workshops, room hire and a café. | 137 | 26 | (a) Education (b) Community cohesion and development (c) Food production | (E) Environmental lessons School visits Gardening and cooking training Talks Bee days (C) Community meals and meetings Family Saturday | Used in own restaurant |
| CG7 is in South London, within a local park which includes a playground and a community shed. It grows food for educational purposes and hosts workshops and training events, | 76 | 69 | (a) Environmental remediation (b) Education (c) Food production | (E) Environmental lessons Gardening demonstration/training School visits Sessions for elderly adults in care Summer holiday club (C) Festivals/parties Drop-in gardening sessions | Distributed to volunteersSold Farmgate sales |
| CF1 aims to grow food that is good for people and the planet. It is deeply connected with the local communities. In a few years, it has become a fully fledged farm selling the food produced while helping local people learn about food, promoting health and well-being, and increasing local food supply. | 9200 | 14,673 | (a) Food production (b) Community cohesion and development (c) Education | (E) School visits Cooking and food lessons Gardening training (C) Cultural events, festivals/parties Garden/farm tours Community meetings Games nights Annual members meeting Tree planting events | Produce boxes Restaurants |
| Garden/Farm | Total kg Produced 2019 | Total Growing Area m2 | Total kg/m2 | Total Number of 80 g Portions | Total Number of 80 g Portions per m2 |
|---|---|---|---|---|---|
| CG1 | 205 | 144 | 1.42 | 2562 | 17.75 |
| CG2 | 1132 | 297 | 3.81 | 14,150 | 47.63 |
| CG3 | 145 | 100 | 1.45 | 1812 | 18.13 |
| CG4 | 566 | 452 | 1.25 | 7075 | 15.63 |
| CG5 | 161 | 324 | 0.5 | 2012 | 6.25 |
| CG6 | 28 | 137 | 0.2 | 350 | 2.50 |
| CG7 | 69 | 76 | 0.91 | 862 | 11.38 |
| CF1 | 14,673 | 9200 | 1.59 | 183,412 | 19.88 |
| Total | 16,979 | 10,730 | 212,237 | ||
| Mean | 1.59 | 19.88 | |||
| SD | 1.09 | 13.66 |
Disclaimer/Publisher’s Note: The statements, opinions and data contained in all publications are solely those of the individual author(s) and contributor(s) and not of MDPI and/or the editor(s). MDPI and/or the editor(s) disclaim responsibility for any injury to people or property resulting from any ideas, methods, instructions or products referred to in the content. |
© 2023 by the authors. Licensee MDPI, Basel, Switzerland. This article is an open access article distributed under the terms and conditions of the Creative Commons Attribution (CC BY) license (https://creativecommons.org/licenses/by/4.0/).
Share and Cite
Caputo, S.; Schoen, V.; Blythe, C. Productivity and Efficiency of Community Gardens: Case Studies from the UK. Land 2023, 12, 238. https://doi.org/10.3390/land12010238
Caputo S, Schoen V, Blythe C. Productivity and Efficiency of Community Gardens: Case Studies from the UK. Land. 2023; 12(1):238. https://doi.org/10.3390/land12010238
Chicago/Turabian StyleCaputo, Silvio, Victoria Schoen, and Chris Blythe. 2023. "Productivity and Efficiency of Community Gardens: Case Studies from the UK" Land 12, no. 1: 238. https://doi.org/10.3390/land12010238