Article

Superabsorbent Polymer Use in Rangeland Restoration: Glasshouse Trials

1
Department of Plant and Wildlife Sciences (PWS), Brigham Young University, Provo, UT 84602, USA
2
Department of Statistics (STAT), Brigham Young University, Provo, UT 84602, USA
*
Author to whom correspondence should be addressed.
Land 2023, 12(1), 232; https://doi.org/10.3390/land12010232
Submission received: 30 November 2022 / Revised: 6 January 2023 / Accepted: 9 January 2023 / Published: 11 January 2023

Abstract

:
Post-disturbance rangeland restoration efforts are often thwarted due to soil moisture deficits. Superabsorbent polymers (SAPs) absorb hundreds of times their weight in water, increasing soil moisture when the SAP is mixed with soil. The objective of this study was to evaluate banded SAPs under the soil surface to increase plant available water and thus seedling establishment for perennial rangeland species during restoration efforts. Five glasshouse experiments with two rangeland perennial grass species, bottlebrush squirreltail (Elymus elymoides) or Siberian wheatgrass (Agropyron fragile), were conducted. Treatments varied, including SAP rates ranging from 11–3000 kg ha−1 with placement mostly banded at depths extending from the surface up to a 15 cm depth. Generally, SAPs increased soil moisture at all rates and depths for up to 49 days. However, rates ≥ 750 kg ha−1 caused the soil to swell and crack, potentially hastening soil drying later in the season. Seedling longevity was increased up to 12 days, especially at the high SAP band rate of 3000 kg ha−1 when the band was 8 or 15 cm deep. Further work is needed to verify banded SAP rates and placement depths in the field, ascertain conditions to reduce soil displacement, and evaluate benefits across species.

1. Introduction

Rangelands can be defined as “all lands, except for urban, agricultural, or densely forested lands, that support predominantly native or naturalized vegetation capable of sustaining native or domestic grazing and/or browsing ungulates, whether or not those animals are present” [1]. They provide economic benefits such as hunting, fishing, grazing, and mining as well as environmental and public service benefits such as recreation, habitat, water quality, and education [2]. In arid regions, the establishment of perennial species after a disturbance is key to restoration success and invasive species management [3,4,5]. Drought conditions make direct seeding efforts in rangelands notoriously challenging [6,7]. Seasonal and yearly variations in precipitation impact seedling emergence and establishment; exotic species add further stress to the system [8]. Their introduction and spread adversely affects landscapes [9,10] by changing the make-up of the local plant community [11,12,13,14]. This alters wildlife habitat and food supplies, increases erosion, and modifies wildfire characteristics [3,11].
Deep-rooted perennial grasses, forbs, and shrubs can reduce annual weed invasion, thereby minimizing erosion and fire danger while providing forage [9,15,16]. Utilizing water, nutrients, sunlight, space, and other resources, they inhibit the establishment of exotic species [17,18]. Fire, insects, disease, overgrazing, and other destructive forces that diminish these perennials free the resources that enable the establishment of invasive species [19,20,21]. Extensive root systems help surviving established plants to effectively compete for water and nutrients after a disturbance [16,22,23]. However, young perennial seedlings generally struggle to compete for water in arid and semi-arid systems where invasive plants use early season soil moisture [4,16,21,24,25,26].
Superabsorbent polymers (SAPs) may help tip the scales in favor of perennial species when banded directly below seedlings. This soil additive absorbs hundreds of times its weight in water and then releases it slowly for plant use [27]. The use of SAPs reduces soil compaction and water lost to deep percolation while increasing pore volume, water infiltration, and moisture retention [27,28,29,30,31].
In agriculture, SAPs have been shown to help increase the time between the need for irrigation, increase plant biomass, and improve fertilizer retention in the soil [32,33,34,35]. In the greenhouse industry, plant survival is increased when root plugs of plants grown for transplanting into areas with a water deficit are formed by mixing in SAPs [36]. When placed in a band under the soil surface, SAPs can act as a reservoir of water for young seedlings, which can help alleviate drought conditions with the onset of summer heat [34,35]. Though it diminishes over time, SAPs have the capacity to reabsorb water during precipitation events, increasing the duration of the soil water reservoir effect [37,38,39,40].
Although less commonly used than in crop production, SAPs have been used in native ecosystems to increase seedling longevity and control run-off and erosion [4,23,41,42,43]. El-Asmar et al. [35] showed increases in evapotranspiration, water use efficiency, and seedling growth parameters and survival time in irrigated agricultural conditions. However, to the best of our knowledge, the banding of SAPs under the soil surface has not been explored in native ecosystems. When facing competition for water from established invasive species, young seedlings of seeded species may not be able to persist until their root systems grow large enough to access moisture deeper in the soil profile. If banded SAPs can widen the window of persistence, seedlings may grow roots deep enough to access available water and increase the probability of survival until additional precipitation is received [24].
We hypothesize that dry SAPs placed in bands at or near seedling rooting depth will act as a localized soil water reservoir to increase soil moisture and seedling establishment. Five glasshouse studies, with bottlebrush squirreltail (Elymus elymoides (Raf.) Swezey) and/or Siberian wheatgrass (Agropyron fragile (Roth) Candargy), were conducted to serve as proof of concept and to evaluate various management strategies to best increase soil moisture and seedling establishment in preparation for field studies, with the following study objectives/justifications:
  • SAP Rate and Depth: Evaluate the effect of SAP rates (0, 1500, or 3000 kg ha−1) and placement depths (0, 3, 8, or 15 cm depth bands, or mixed) to explore optimum management strategies.
  • Reduced Seeding Rate: Assess the effect of seeding rates (2, 4, 8, or 16 kg ha−1) with SAP bands (0 or 3000 kg ha−1) at 8 cm depth to determine if excessive inter-species competition for soil moisture occurs as a function of increased germination with SAP.
  • Low SAP Rate: Evaluate the efficacy of SAP rates (0, 11, 47, 190, 750, or 1500 kg ha−1) at 8 cm depth to determine if relatively low rates of SAPs would sufficiently increase soil moisture to positively impact seedling health while keeping the soil surface intact, which was a problem observed at high rates in field conditions.
  • SAP Depth and Root Growth: Assess the effect of SAP rates (0 or 3000 kg ha−1) and placement depths (0, 3, or 8 cm, or mixed) to measure seedling root growth response to SAPs.
  • Fertilizer and SAP Interaction: Evaluate the impact of fertilizer (with and without) used in conjunction with SAPs (0 or 3000 kg ha−1) placed at 8 cm depth in addition to measuring SAPs’ ability to reabsorb water.

2. Materials and Methods

2.1. Treatments

Five glasshouse experiments were conducted at Brigham Young University (BYU), Provo, UT, USA (40.2454, −111.6415, elevation 1391 m). Various rates of SAP (11–3000 kg ha−1) were compared to an untreated control in a full factorial design with all combinations of various SAP placement depths, seeding rates, species, and/or fertilizer (Table 1) arranged in a randomized complete block design (RCBD). Generally, the SAP was applied in a concentrated band at or below the soil surface at various depths (Table 1). In Studies 1 and 4, there was a non-banded SAP treatment which consisted of mixing the SAP uniformly with the soil (“mixed”)to a depth of 15 cm (Study 1) or 8 cm (Study 4).
The SAP product used in these studies was Stockosorb® 660 micro (Evonik Industries AG; Essen, Germany). This polymer is made of crosslinked potassium (K+) polyacrylate, which produces an absorptive capacity of 260 l water (H2O) kg−1 [44]. It eventually, after 1–3 years in the soil, degrades to carbon dioxide (CO2), H2O, and K+ [28].
A potential unwanted effect of the degradation of Stockosorb® 660 is the release of the essential plant nutrient K into the soil solution. However, the soil used in this study has high K concentration (Table 2). As the K was not limiting for plant growth and high soil K is not generally a specific ion toxicity concern, the K was not balanced across treatments.
The Stockosorb® 660 manufacturer recommends blending the product into the top 10 cm of soil or placing it in a band below the soil surface at rates up to 11 kg ha−1 at the time of seeding in irrigated agricultural systems [45,46]. Higher rates are suggested when the product is used under conditions of low rainfall and high temperatures [46]. Our study treatments included SAP placed at depths extending from the surface to 15 cm deep at rates up to 272 times higher than the recommended agricultural rate to ensure observable treatment effects in a non-irrigated, xeric system [47].
Study 5 included a fertilization treatment in addition to SAP rates. The fertilizer was applied at 4 N, 17 P2O5, 17 K2O, 0.6 S, 0.6 Fe, 0.1 Zn, 0.1 Mn, 0.1 Cu, and 0.1 B (kg ha−1). The micronutrients were all applied as the chelated form with ethylene diamine tetracetic acid (EDTA) at a 1:1 ratio.

2.2. Soil and SAP Placement

The soil used in these studies was collected from the site for the eventual field testing of SAP at Murray’s Mesa on the Utah Test and Training Range (UTTR) located in the desert west of Salt Lake City, UT (41.040976, −112.982474; elevation 1392 m). The UTTR serves as a practice bombing and gunnery range for the United States Department of Defense by Hill Air Force Base, located in Layton, Utah, USA, and is an active revegetation research site. The soil in the area is generally classified as a Tooele Fine Sandy Loam soil [coarse-loamy, mixed (calcareous), mesic Typic Torriorthents] [48]. Although the specific soil collected for this study mostly fits this classification, its textural class is loam (Table 2). Soil analysis was performed at BYU’s Environmental Analytical Laboratory (BYU-EAL, https://pws.byu.edu/eal (accessed on 13 May 2022)) and Servi-Tech Laboratories (www.servitechlabs.com (accessed on 13 May 2022)) (Table 2).
Table 2. Soil properties [49]. Analysis performed at BYU’s Environmental Analytical Laboratory (BYU-EAL, https://pws.byu.edu/eal (accessed on 13 May 2022)) except where noted. Properties marked with “*” were analyzed at Servi-Tech Laboratories (www.servitechlabs.com (accessed on 24 May 2022)).
PropertiesNutrients, mg kg−1
pH *a7.8NO3-N d20
Salinity (dS m−1) a8.9P e12
Texture bLoamKe 1068
% Sand30Zn f 0.2
% Silt49Fe f 3.1
% Clay21Mn f2.1
% Organic Matter c1.3Cu f 0.5
SAR a2.6Ca *g3903
Mg *g345
Na *h2230
a Saturated Paste Analysis; b Hydrometer Method; c Loss-On-Ignition (LOI); d KCl extraction, analysis with RFA (rapid flow analysis), FIAlab Flow Injection Cadmium Reduction Nitrate (FIAlabs, Tacoma, WA); e Olsen bicarbonate, analysis with AAS (Atomic Absorption Spectroscopy), AAnalyst 200 Atomic Absorption Spectrometer (PerkinElmer, Seattle, WA); f DTPA (diethylenetriaminepentaacetic acid) with ICP-OES (Inductively Coupled Plasma-Optical Emission Spectrometry), iCAP 7400 ICP-OES Radial Analyzer (Thermo Scientific, Waltham, MA); g Ammonium Acetate Analysis; h Mehlich 3 ICP.
Containers for growing plants (Table 1) consisted of tall square plastic pots (Studies 1 and 2), short square plastic pots (Study 5), rectangular wooden boxes (Study 3; Figure 1), or round clear plastic canisters (Study 4; B076 80 oz Clear PET Canister 110–400, Industrial Container and Supply, Salt Lake City, UT, USA). The boxes in Study 3 allowed for a relatively large surface area for a simulation of the planting furrows used in field reclamation projects (Figure 1). All containers had holes in the bottom to enable the free flow of water into and out of the containers. The bottom of each was lined to prevent soil loss. A single layer of commercial grade laboratory paper towel was used in Studies 1, 2, and 5. A single layer of Vigoro Weed Control Fabric (Nex Matrix, Wilmington, DE, USA) was used in Studies 3 and 4.
For Study 4, holes were drilled in the sides of each canister at 3, 5, 8, and 10 cm below the soil surface for volumetric soil moisture content measurements during the trial. The holes for the 3 and 8 cm depths and the 5 and 10 cm depths were directly above/below each other. The two groupings were offset by 8 cm. These holes were covered on the outside of the canister with Parafilm “M” Laboratory Film (Pechiney Plastic Packaging, Chicago, IL, USA), except during soil moisture measurements, to prevent soil and moisture loss. The canisters were slipped into opaque sleeves of Prodex AD5 Insulation (Prodex, El Coyol de Alajuela, Costa Rica) to prevent light reaching the roots. The covered canisters were maintained at an approximate 30° tilt from horizontal with the seeded edge down to encourage root growth along the side of the canister for ease in monitoring root growth.
For banded treatments, the soil was added to the desired depth, the SAP added, and then additional soil added to within 5–6 cm of the top of the pots/canisters (Studies 1–2, 4–5) or 1 cm from the top of the wood box (Study 3). In Studies 1, 2, and 5, the SAP was placed in a band across the middle of the pot. In Study 3, the SAP band ran front to back in the middle of the box under the furrow. In Study 4, the banded SAP treatments were added within 1 cm of the edge around the circumference of the canisters. Two studies included treatments with the SAP mixed thoroughly into the top 15 (Study 1) or 8 cm (Study 4) of soil. Soil was added to the containers to the correct depth then filled with the soil/SAP mixture. The control treatments were added to the same depths without any layering.

2.3. Irrigation

The soil, with or without SAP, was saturated with deionized (DI) water for several days (Table 1) immediately after (Study 1) or before (Studies 2–5) planting. This was done by partially submerging the pots/canisters for all but Study 3, which was not submerged due to the large size of the connected wooden box containers holding the soil (Table 1; Figure 1). Rather, paper towels were temporarily laid on the soil to reduce soil erosion while 4 l of DI water was added, followed by 0.4 l added on each of the next two days, and then 0.2 l were added three times per week for 14 d.
In all but Study 1, weed seedlings had sufficient time to germinate and be removed, and the soil was covered with black plastic sheeting during this time to reduce evaporation and surface salt accumulation. In all studies, gravitational water was allowed to drain for 1 d to reach field capacity, followed by the initiation of Study 1 or planting for Studies 2–5. The plastic covered the soil until the desired seedlings began to emerge. For Studies 1–3, the goal was to drought-stress the plants; thus, no additional water was added after initial saturation. In Study 4, the soil was rewet at 28–29 days after planting (DAP), as the objective was to see if healthy plant roots avoid the SAP band. In Study 5, the soil was rewet at 77–90 DAP after all seedlings had died to measure the ability of the SAP bands to reabsorb water after complete dry down.

2.4. Species

Bottlebrush squirreltail was used in all studies, and Siberian wheatgrass was used in all but Study 1 as model species. In studies with both species, they were seeded in separate pots/canisters or in separate rows in Study 3 where they were randomly assigned to two of four evenly spaced rows in each box. The rows ran perpendicular to the valley from one peak to the other along the 30 cm width to create three seed positions relative to the band location (valley, slope, and peak) (Figure 1).
Seeds were planted in dry soil for Study 1 and in moist soil in Studies 2–5. Seeding rates ranged 2–24 kg ha−1 (Table 1), including variable seeding rate treatments in Study 2. Seedlings were thinned in Studies 1, 3, and 4 (Table 1) (note: the recommended seeding rates for these species are 7 and 6 kg ha−1, respectively [50,51]). Bottlebrush squirreltail is a native perennial rangeland grass in the Great Basin region. Siberian wheatgrass is an introduced perennial rangeland grass. Both species have been shown to compete well against cheatgrass (Bromus tectorum L.) and other invasive species in arid environments [48,49]. These were seeded at 1 cm depth immediately prior to saturation in Study 1 and 1 d after the saturation period ended, with the soil approximately at field capacity, for Studies 2–5.
Seedlings were grown without artificial lighting. Temperatures fluctuated from 13–28 °C, which is similar to the naturally occurring diurnal cycles for the region these soils were collected from.

2.5. Measurements

Soil moisture was measured gravimetrically (Studies 1, 2, and 5) or volumetrically (Studies 3 and 4) (Table 1). Gravimetric soil moisture was measured by weighing each container of soil to determine the added weight of water to soil. Volumetric water content was measured by an ML3 ThetaProbe Soil Moisture Sensor with HH2 Moisture Meter (Delta-T Devices; Cambridge, England). In Study 3, inserting the moisture probe into the soil created four openings in the soil (0.3 cm diameter × 6 cm deep and 2.5 cm apart in a triangular pattern with a fourth hole in the center of the pattern). The probe was inserted into the same locations each time to avoid excessive soil disturbance. It is logical that the soil would be slightly dryer near these holes due to aeration. This issue was reduced in Study 4 because the measurements were taken via holes drilled through the side of the canister. The holes were kept covered with Parafilm “M” Laboratory Film (Pechiney Plastic Packaging, Chicago, IL, USA) when measurements were not being taken.
For Study 3, the volumetric soil moisture was measured at the peak, slope, and valley for each row in each compartment. When seedlings were thinned, every attempt was made to leave them in locations that were not being used to measure soil moisture so as to minimize disturbance. At 78 DAP, after all seedlings had died, corresponding soil moisture measurements in undisturbed locations in each row were made to quantify the difference between disturbed and undisturbed locations.
Generally, seedling emergence, total seedlings alive (longevity), length, and blade count were measured (Table 1). In Study 2, the percent of planted seeds that emerged (persistence) was determined weekly. Root length and branching and root/shoot biomass were measured for Study 4 (Table 1). Seedling emergence is the number of seedlings alive on the day of measurement. Total seedlings alive is the cumulative seedlings that emerged during the study. Time to emergence was the amount of time it took for the seedlings to emerge. Longevity is the number of days a seedling lived (seedlings were considered dead if they snapped when the blade was bent and pinched at the base). Seedlings were thinned in studies 1, 3, and 4.

2.6. Statistical Analysis

The data from each trial were initially analyzed using a mixed model analysis in JMP (SAS Institute Inc., Cary, NC, USA). Across the studies, the fixed variables included SAP rate, SAP placement depth, seeding rate, date, species, and fertilizer depth. Random effects included block, pot or box, row, and seed number. Each effect was analyzed as appropriate for the given study. Random effects were removed when variance estimates were negative or not significant. As appropriate, post hoc mean separation by the Tukey–Kramer or Student’s t-tests was performed on seedling and soil moisture variables and their interactions. In some instances, we were only interested in treatments compared to the control, not to each other. In those cases, mean separation by the Student’s t-test with a pseudo-Bonferroni adjustment set at 0.005 was used to analyze the desired comparisons.

3. Results

3.1. SAP Rate and Depth

3.1.1. Soil Moisture

The three-way interaction of SAP Rate*Placement Depth*Time on soil moisture was not significant, but all other comparisons were highly significant (Table 3). The SAP increased soil moisture with an average of 7.9% compared to the untreated control at 6.9%. When averaged over the course the study, all SAP treatments but one had higher moisture than the control (Figure 2).

3.1.2. Seedling Growth Parameters

The two-way interaction of SAP Placement Depth*Rate on seedling longevity was significant (Table 2). The deepest placement depths, 8 and 15 cm, of 3000 kg ha−1 SAP bands resulted in increased seedling longevity of 21 and 18 d, respectively (Figure 3). There appears to be a trend toward increased seedling longevity for surface placement of both the 1500 and 3000 kg ha−1 SAP bands. It is noteworthy that there was no negative impact on seedling longevity at any depth or SAP rate.
As with longevity, the interaction SAP Rate*Placement Depth had a significant impact on seedling length (Table 2). Although differences were measured, there were no clear trends for shoot length. The 3000 kg SAP ha−1 rate at 8 cm depth increased seedling length, while 1500 kg SAP ha−1 decreased it (Table 4).
In contrast to longevity and shoot length, the only significant effect on the number of blades was SAP Rate (Table 2). Both SAP rates had positive impacts on the number of blades per seedling. The control averaged 1.7 blades per plant. The 1500 kg SAP ha−1 rate increased the blade count over the control by 0.5, and the 3000 kg ha−1 rate increased it by 1.1 more blades per seedling. These are increases of 131 and 166% for each rate, respectively. This response, at least in part, could be due to the increased longevity associated with SAP treatments.

3.2. Reduced Seeding Rate

Soil Moisture and Seedling Growth Parameters

The four-way interaction of Species*Seeding Rate*SAP Rate*Time as well as all but one of the interactions involving SAP were significant for soil moisture (Table 5). The overall pattern was similar for both species, with the greatest difference in gravimetric water content (GWC) occuring over the first ~20 d and then dropping approximately linearly (Table A1, Figure 4). However, the magnitude of the increase in soil moisture for most treatments was slightly greater for bottlebrush squirreltail (Table A1).
In contrast to soil moisture, the four-way interaction and most of the three-way interactions were not significant for seedling persistence (Table 5). The only three-way interaction that was significant for seedling persistence was Species*Seeding Rate*SAP Rate (Table 5). All Siberian wheatgrass treatments had an increase in the percent of seedlings alive. An increase for bottlebrush squirreltail was only seen at the 8 kg ha−1 seeding rate (Figure 5). Interestingly, the 8 kg ha−1 seeding rate for bottlebrush squirreltail was the only treatment that did not have an increase in soil moisture, although it trended similarly.
Though the three- and four-way interactions for soil moisture and the one three-way interaction for seedling persistence previously mentioned are statistically significant, the associated F-statistics are relatively low, indicating that they are significant but not practically important relative to other effects. Both soil moisture and persistence have multiple significant two-way interactions (Table 5). However, each has one with a relatively large F-statistic, indicating that this interaction is more likely to have mean differences representative of the population at large than the others or even than the three- or four-way interactions. As such, it is instructive and informative to analyze the effect of both the SAP*Date and the Species*SAP interactions.
For both soil moisture and persistence, the SAP*Time interaction is highly significant (Table 5). However, the F ratio for the impact of that interaction on soil moisture is an order of magnitude larger than all other interactions for that variable (Table 5). There was a difference in soil moisture between SAP treatments until day 44, remaining constant at about 3% greater for the first 19 d, then reducing steadily for the rest of the study (Figure 4). On average, the gravimetric water content (GWC) of 14.3% for SAP treatments throughout the study was higher than the control at 12.4% (Table A1). The GWC in SAP treatments ranged from 44.2% on the day of planting to 2.6% on the day that there were no more living seedlings. In contrast, the control ranged from 41.3% to 2.4% in the same period (Table A1).
The difference in the percent of viable seedlings (persistence) between SAP treatments was not significant but rose steadily for the first 14 d. It then stayed relatively constant at about 10%, until day 37 when it sharply increased (Figure 4). The 3000 kg ha−1 SAP band kept up to 30% more plants alive than the control for at least the last 7 d of increased soil moisture (day 37 to 44). By day 49, there was no longer a difference in soil moisture. By day 51, the difference in the relative percentage of viable seedlings disappeared. All seedlings had died by day 56 (Figure 4).
The interaction of Species*SAP is highly significant for persistence, with an F ratio an order of magnitude larger than all but one interaction (Table 5). This interaction was not significant for soil moisture. Treatment with SAP increased persistence of Siberian wheatgrass from 39 to 60% (Table A2, Figure 6). A trend in the same direction was observed for bottlebrush squirreltail, but the magnitude was much less, 29 to 32%, and it was not statistically significant.
Seeding Rate and SAP did not impact seedling time to emergence or emergence percentage (Table 6). However, there were differences across species for both (Table 6). Days to emergence were 9 and 8 d for bottlebrush squirreltail and Siberian wheatgrass, respectively. Percentage of seeds emerging were 50 and 80% for bottlebrush squirreltail and Siberian wheatgrass, respectively.

3.3. Low SAP Rate

3.3.1. Soil Moisture

Soil moisture in SAP treatments was nearly always numerically greater than the control regardless of SAP Rate or Time, although only significant for some rates and dates (Table 7, Figure 7). Regularly testing the soil with a probe affected soil moisture. Comparison on day 99 of the soil moisture of the regularly tested areas of each row with the comparable untested areas of the same row revealed measurements that were nearly double on the undisturbed side (p < 0.0001). The regularly tested areas had an average volumetric soil moisture of 0.8% on day 99, in contrast to previously undisturbed soil at 1.5% (data not shown).

3.3.2. Seedling Growth Parameters

There were no differences in seedling emergence (p = 0.539). The effects of Species and SAP rate on seedling longevity were highly significant (p = 0.008 and p = 0.002, respectively), while their interaction was not (p = 0.880) (Table 7). The 1500 kg SAP ha−1 rate had greater seedling longevity than the next two lower rates and trended towards having greater longevity than the control. However, seedling longevity was not statistically different than the control for any treatment (data not shown).

3.4. SAP Depth and Root Growth

3.4.1. Soil Moisture

The interaction of SAP Placement Depth*Measurement Depth*Time on soil moisture was highly significant (Table 8, Table A3), but only when the soil was saturated. On 0 DAP at 10 cm measurement depth, the treatments with SAP bands at 3 and 8 cm depths held less soil moisture than the control (p <0.001). This difference disappeared over time. (Appendix Table A3). The two-way interactions of SAP Placement Depth*Time and Moisture Measurement Depth*Time were also highly significant; however, there were no differences between SAP treatments and the control. (Table 8, Table A3).

3.4.2. Seedling Growth Parameters

The interaction of SAP Placement Depth*Species on the total number of seedlings emerged was significant (Table 9). The same was true when evaluating the effect of the presence or absence of SAP on the total number emerged (Table 9). However, the difference was only between the controls (no SAP) of both species, where two bottlebrush squirreltail seedlings emerged, compared to one Siberian wheatgrass seedling. Neither species had SAP treatments that were different than their respective species control. Seedlings in most pots began emerging by 20 DAP. The exception was one bottlebrush squirreltail control, which did not have a seedling emerge until 34 DAP. Excluding that pot from the analysis, the Species*SAP Placement Depth interaction was highly significant for days to emerge (Table 9). Seedlings emerged in the bottlebrush squirreltail treatment with SAP placed at a depth of 3 cm 2.3 d faster than the control. Bottlebrush squirreltail with SAP placed at a depth of 8 cm trended in the same direction, but the difference was not significant. No other bottlebrush squirreltail and none of the Siberian wheatgrass treatments were different from their respective controls.
A visual assessment suggests that root growth was not negatively impacted by SAP presence, as roots traveled into and through the SAP band with no signs of diversion in any of the pots (Figure 8). There were no impacts of SAP on shoot or root biomass, shoot:root ratio, time for roots to reach the bottom of the canister, or length of roots 21 DAP for either species (Table 9).

3.5. Fertilizer and SAP Interaction

3.5.1. Soil Moisture

Three of the four three-way interactions for soil moisture were significant (p < 0.0001): Species*Fertilizer Depth*SAP, Species*SAP*Time, and Fertilizer Depth*SAP*Time (Table 10). The SAP treatments with no fertilizer or fertilizer placed on the soil surface both held a similar amount of gravimetric water throughout the study (Figure 9A). Both of these treatments held more soil moisture than their control (the same fertilizer placement without SAP), for the first 35 d for fertilizer placed on the soil surface and 40 d for no fertilizer. The treatment of fertilizer placed directly into the SAP band 8 cm below the surface held relatively more water than treatments with no fertilizer or fertilizer placed on the soil surface throughout the study. That treatment also held more water than its control (fertilizer placed at 8 cm depth with no SAP) for 49 d. The difference disappeared towards the end of the study. The GWC was significantly higher for the fertilizer placed directly into the SAP band at 8 cm depth than SAP treatment with no fertilizer 21, 24, and 26 DAP (Figure 9A).
The two-way interaction of SAP*Time was also highly significant and had an F-value an order of magnitude larger than any of the three-way or other two-way interactions (Table 10). This indicates that that interaction held the bulk of the influence over the changes in soil moisture compared to the influence of species in the interaction. Both species behaved very similarly in that SAP treatments held more soil moisture for the first ~49 d of the study (Figure 9B).

3.5.2. Seedling Growth Parameters

The number of days to emergence was not impacted by fertilizer or SAP application, species, nor any of their interactions (p = 0.460). However, the number of seedlings emerged was significantly impacted by the Species*SAP interaction and Fertilizer Placement Depth (p = 0.011 and p = 0.013, respectively). Bottlebrush squirreltail emergence was not impacted by SAP, but Siberian wheatgrass increased 1.6 times that of the control (Figure 10). Treatments with fertilizer did not increase the number of emerged seedlings, and deeper fertilizer placement had a detrimental effect (Figure 11). The remaining two-way interactions, Species*Fertilizer Depth and SAP*Fertilizer Depth, and the three-way interaction did not have an impact (p = 0.720, p = 0.145, and p = 0.813, respectively).
Seedling longevity was impacted by Species, SAP Application, and Fertilizer Placement Depth (p = 0.008, p = 0.0002, and p = 0.058, respectively). No interactions were significant. Seedlings in treatments with SAP at a rate of 3000 kg ha−1 lived 38 d, which was 11 d longer than the control (Figure 12). The fertilizer used in this study did not favorably impact seedling longevity and had a negative impact when placed at the surface (Figure 13).

3.5.3. Soil Rewet

SAP application increased soil moisture content when rehydrated but with reduced effects after the initial saturation and dry down. An orthogonal comparison of gravimetric water content on day 0 and day 40 after initial saturation compared to the same days after rehydration as a result of SAP application was significant (p < 0.0001) (Figure 14). Treatments containing SAP held 11.2% more soil moisture on day 0 after their initial saturation in the fertilizer study compared to day 0 of their rehydration. At day 40 of the fertilizer study, treatments with SAP after the initial saturation held 4.3% more moisture compared to SAP treatments on day 40 after rehydration. Treatments with SAP held more moisture than the control at both day 0 and day 40 after initial saturation in the fertilizer study (p < 0.0001). That was also true for day 0 after rehydration. However, by day 40 after rehydration, there was no difference in soil moisture content between SAP treatment and the control (Figure 14).
Six bottlebrush squirreltail and eleven Siberian wheatgrass seedlings emerged after the soil was rehydrated. They were evenly spread across SAP and fertilizer treatments. As the number emerged represented only 4% (17/432) of the total number of seeds planted and only 7% (17/247) of the seeds that did not emerge after the initial saturation, no further analysis was done.

4. Discussion

4.1. Soil Moisture

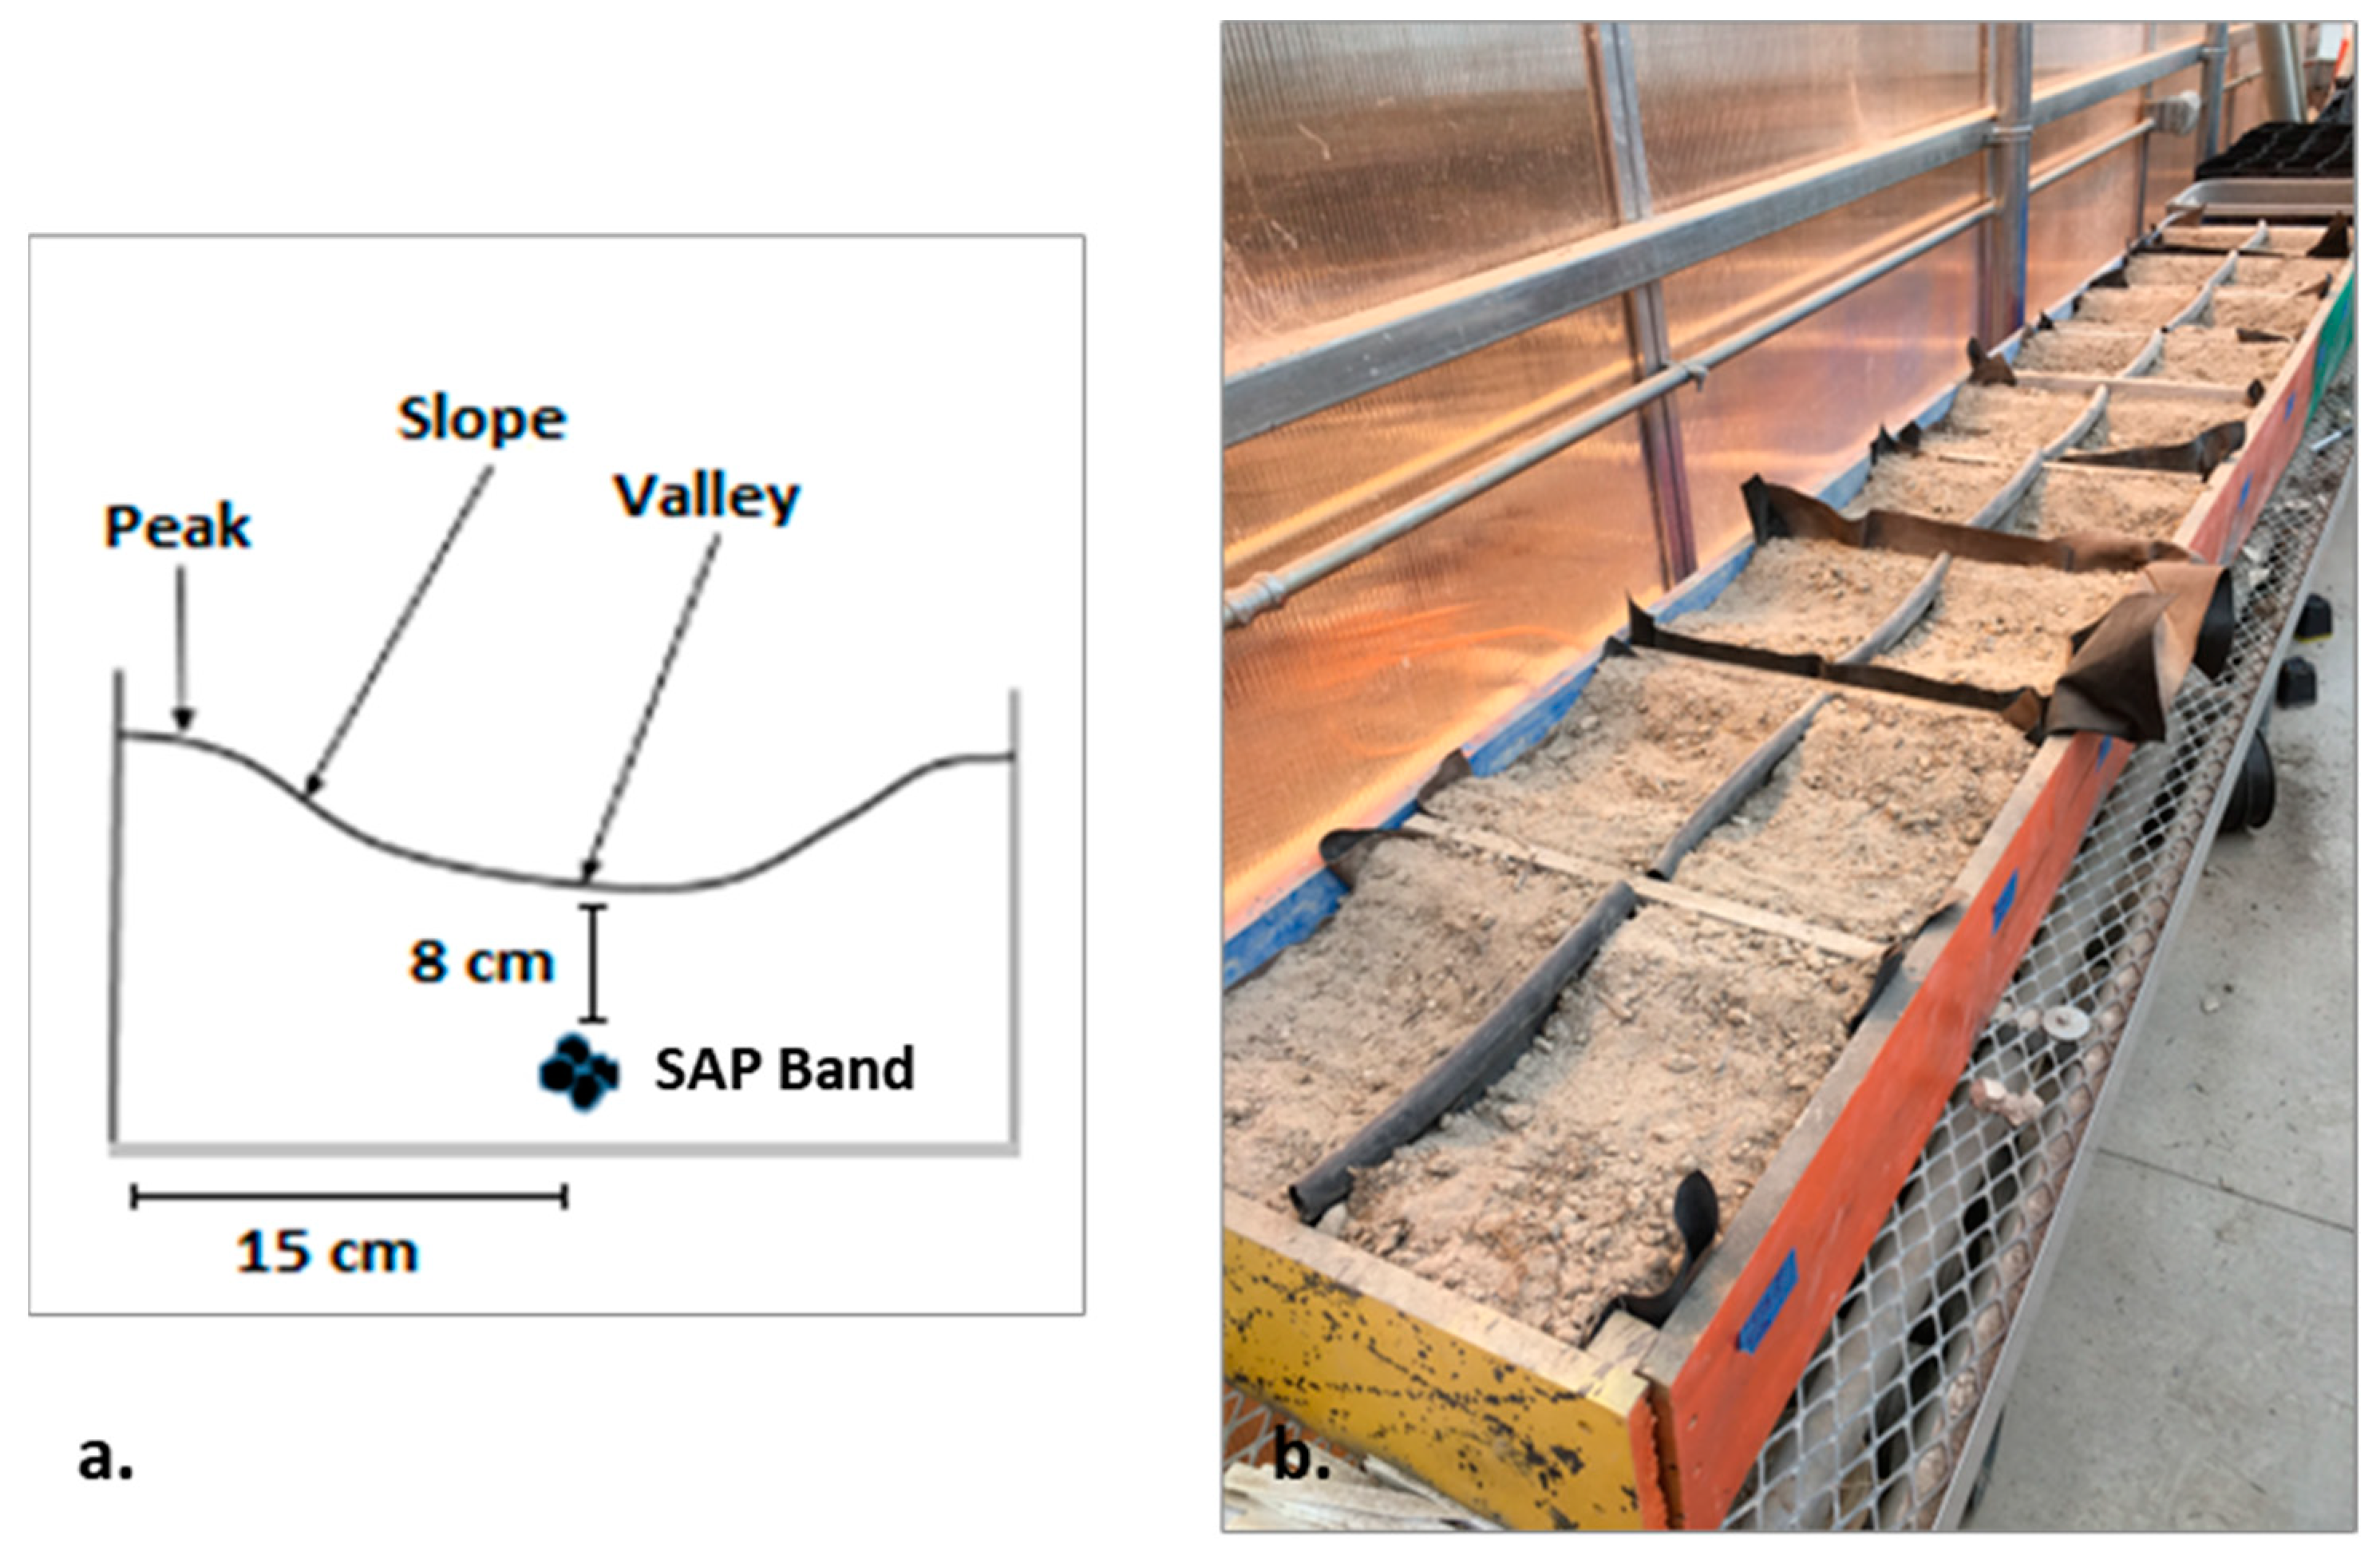
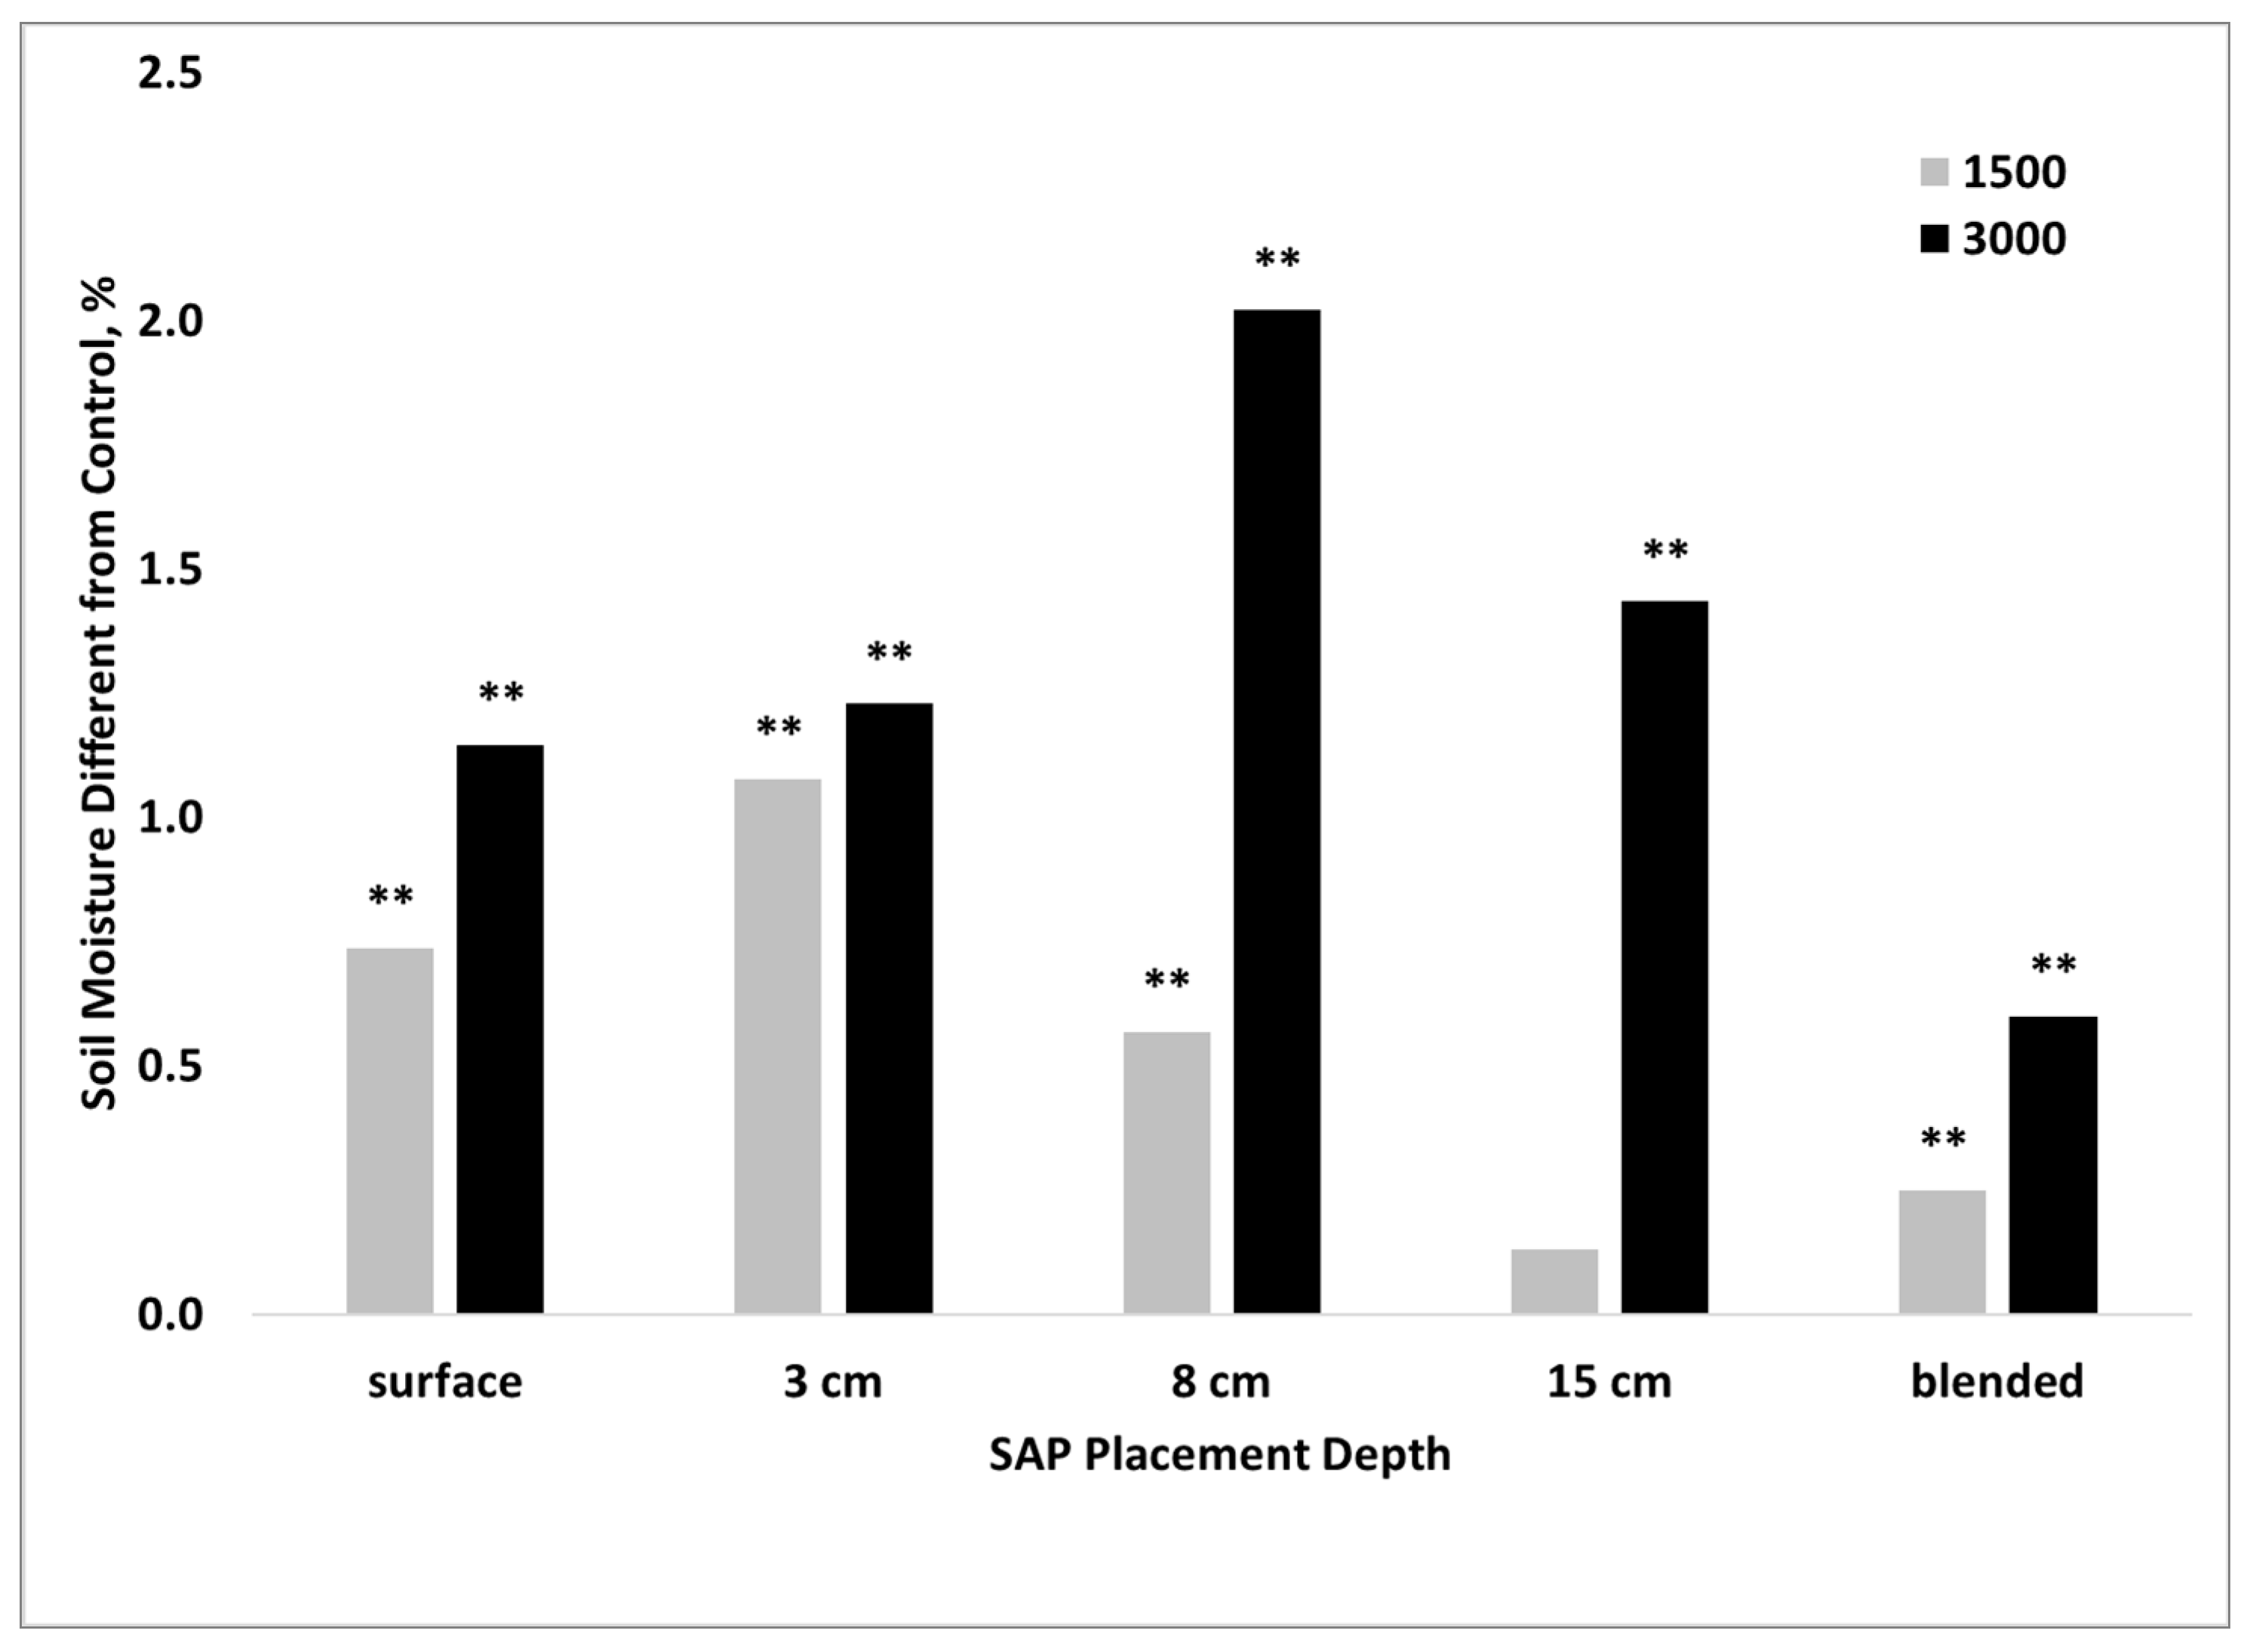
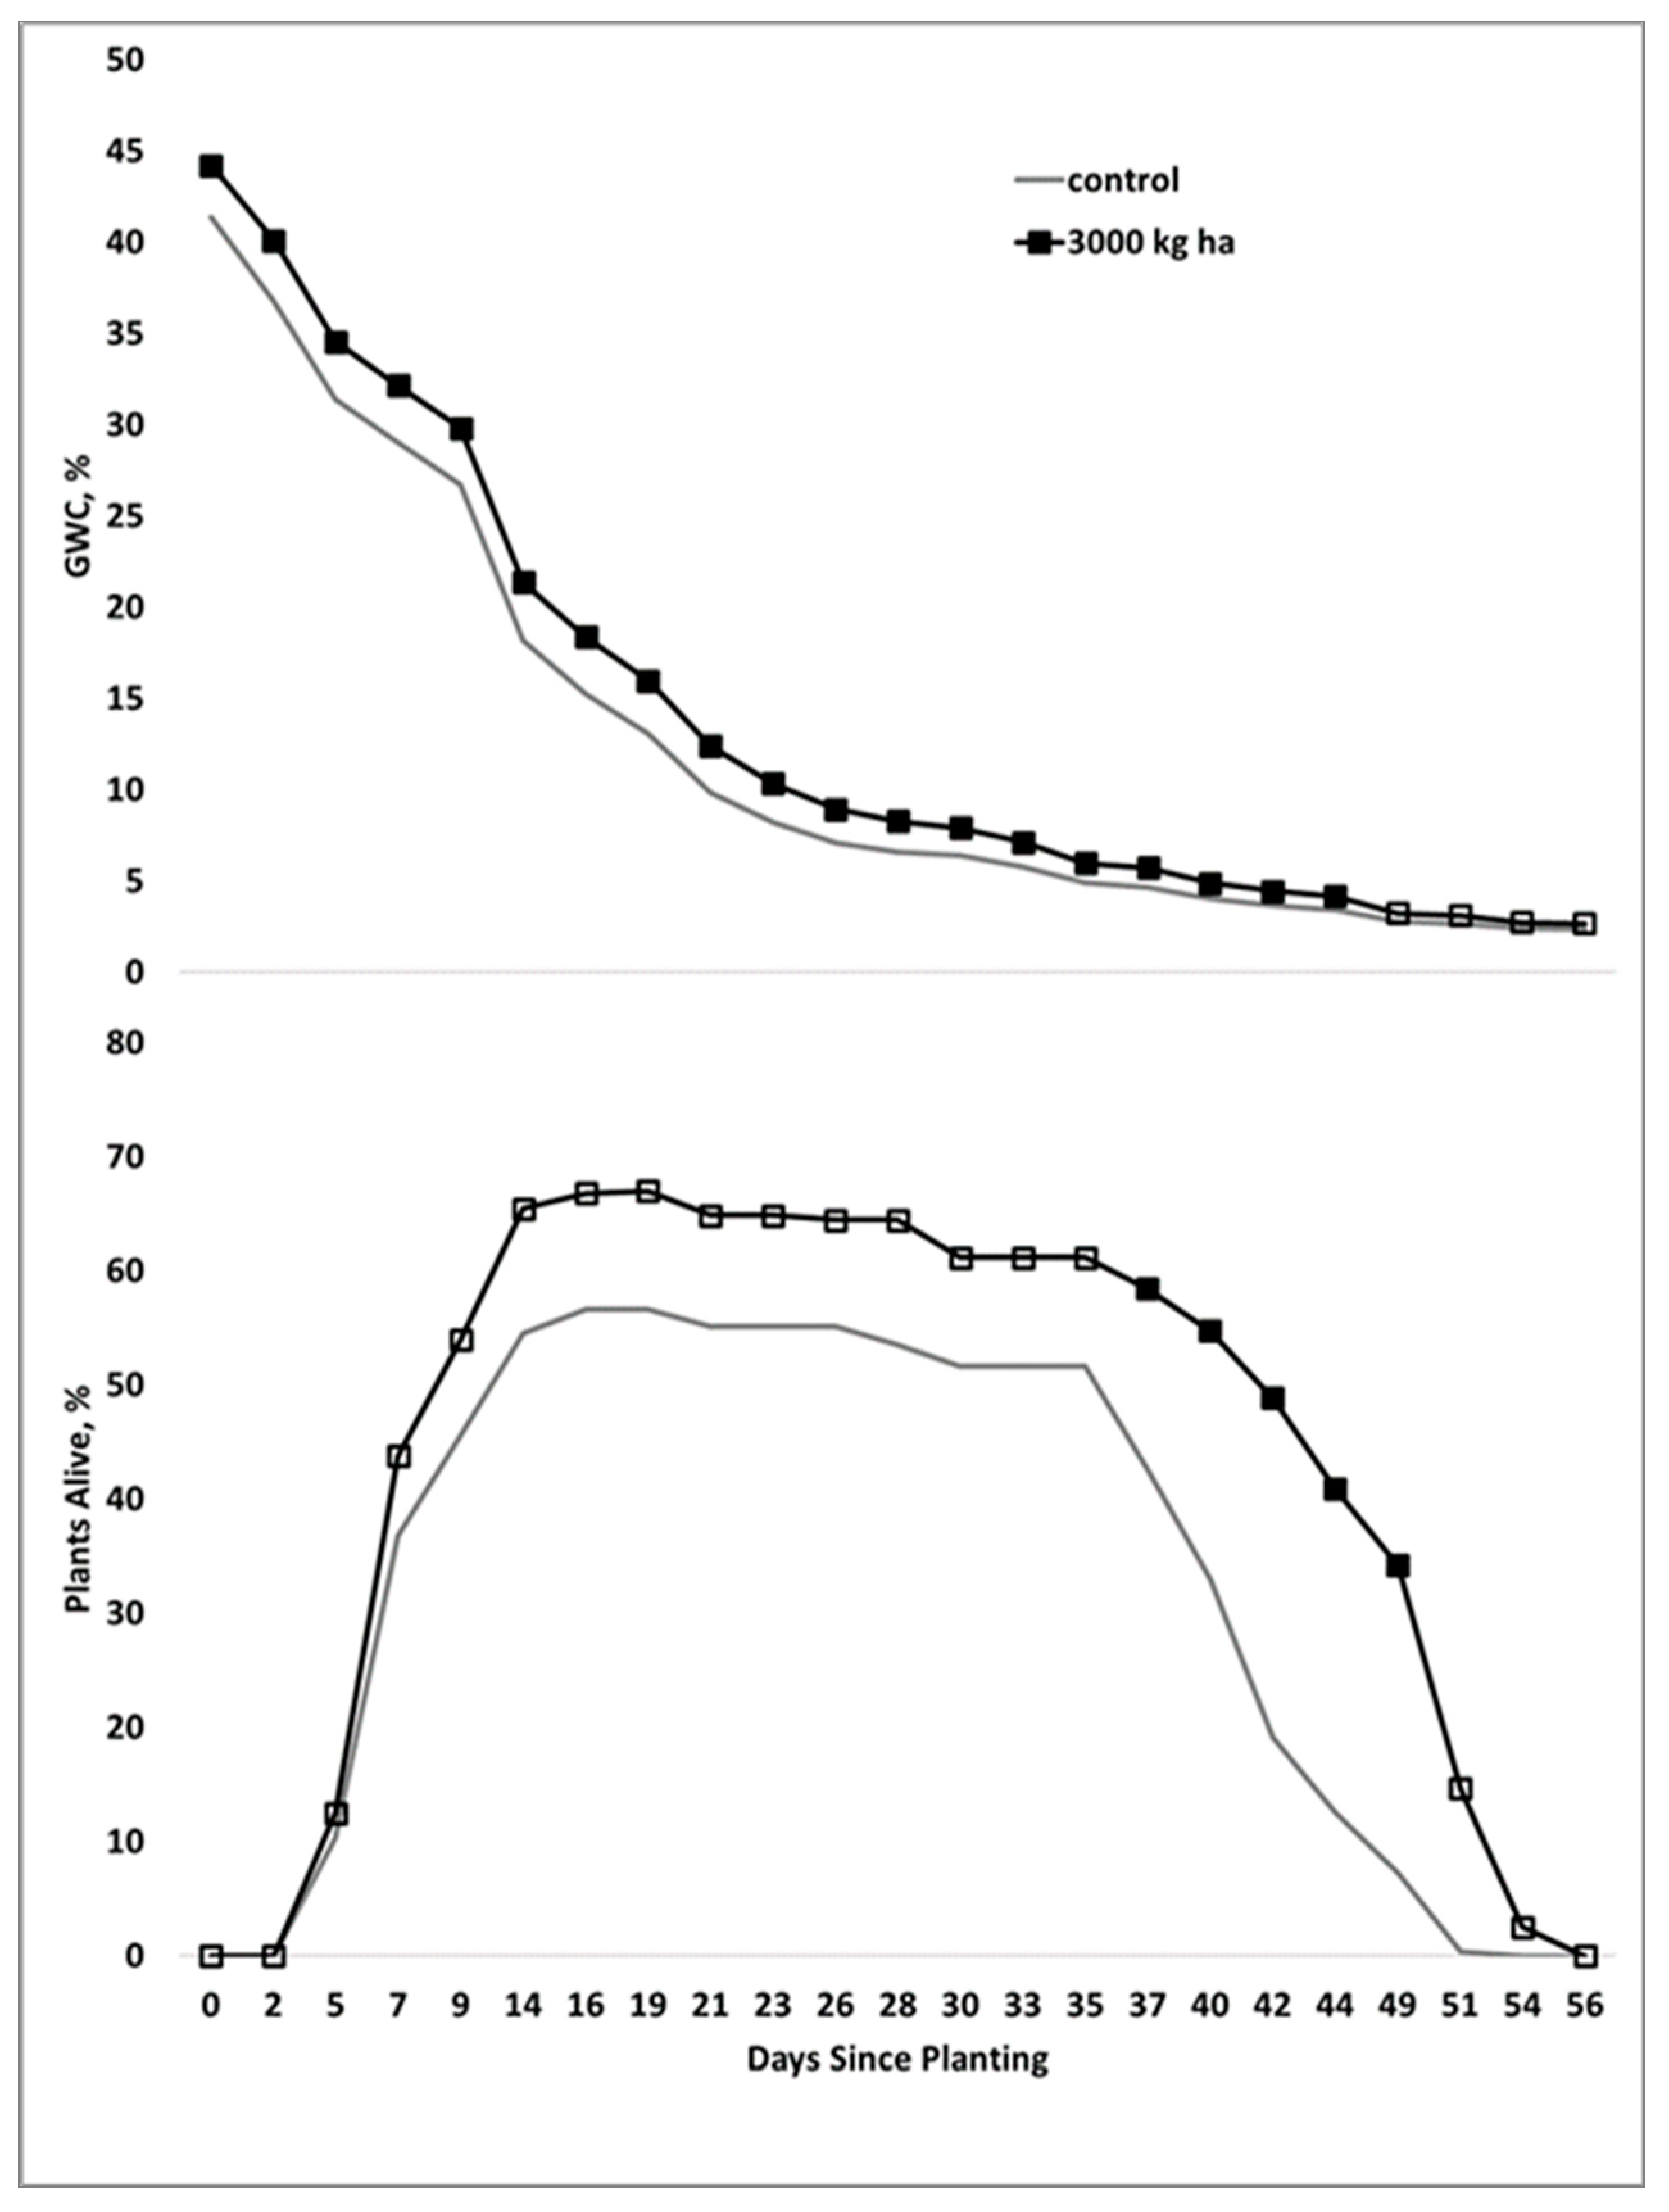
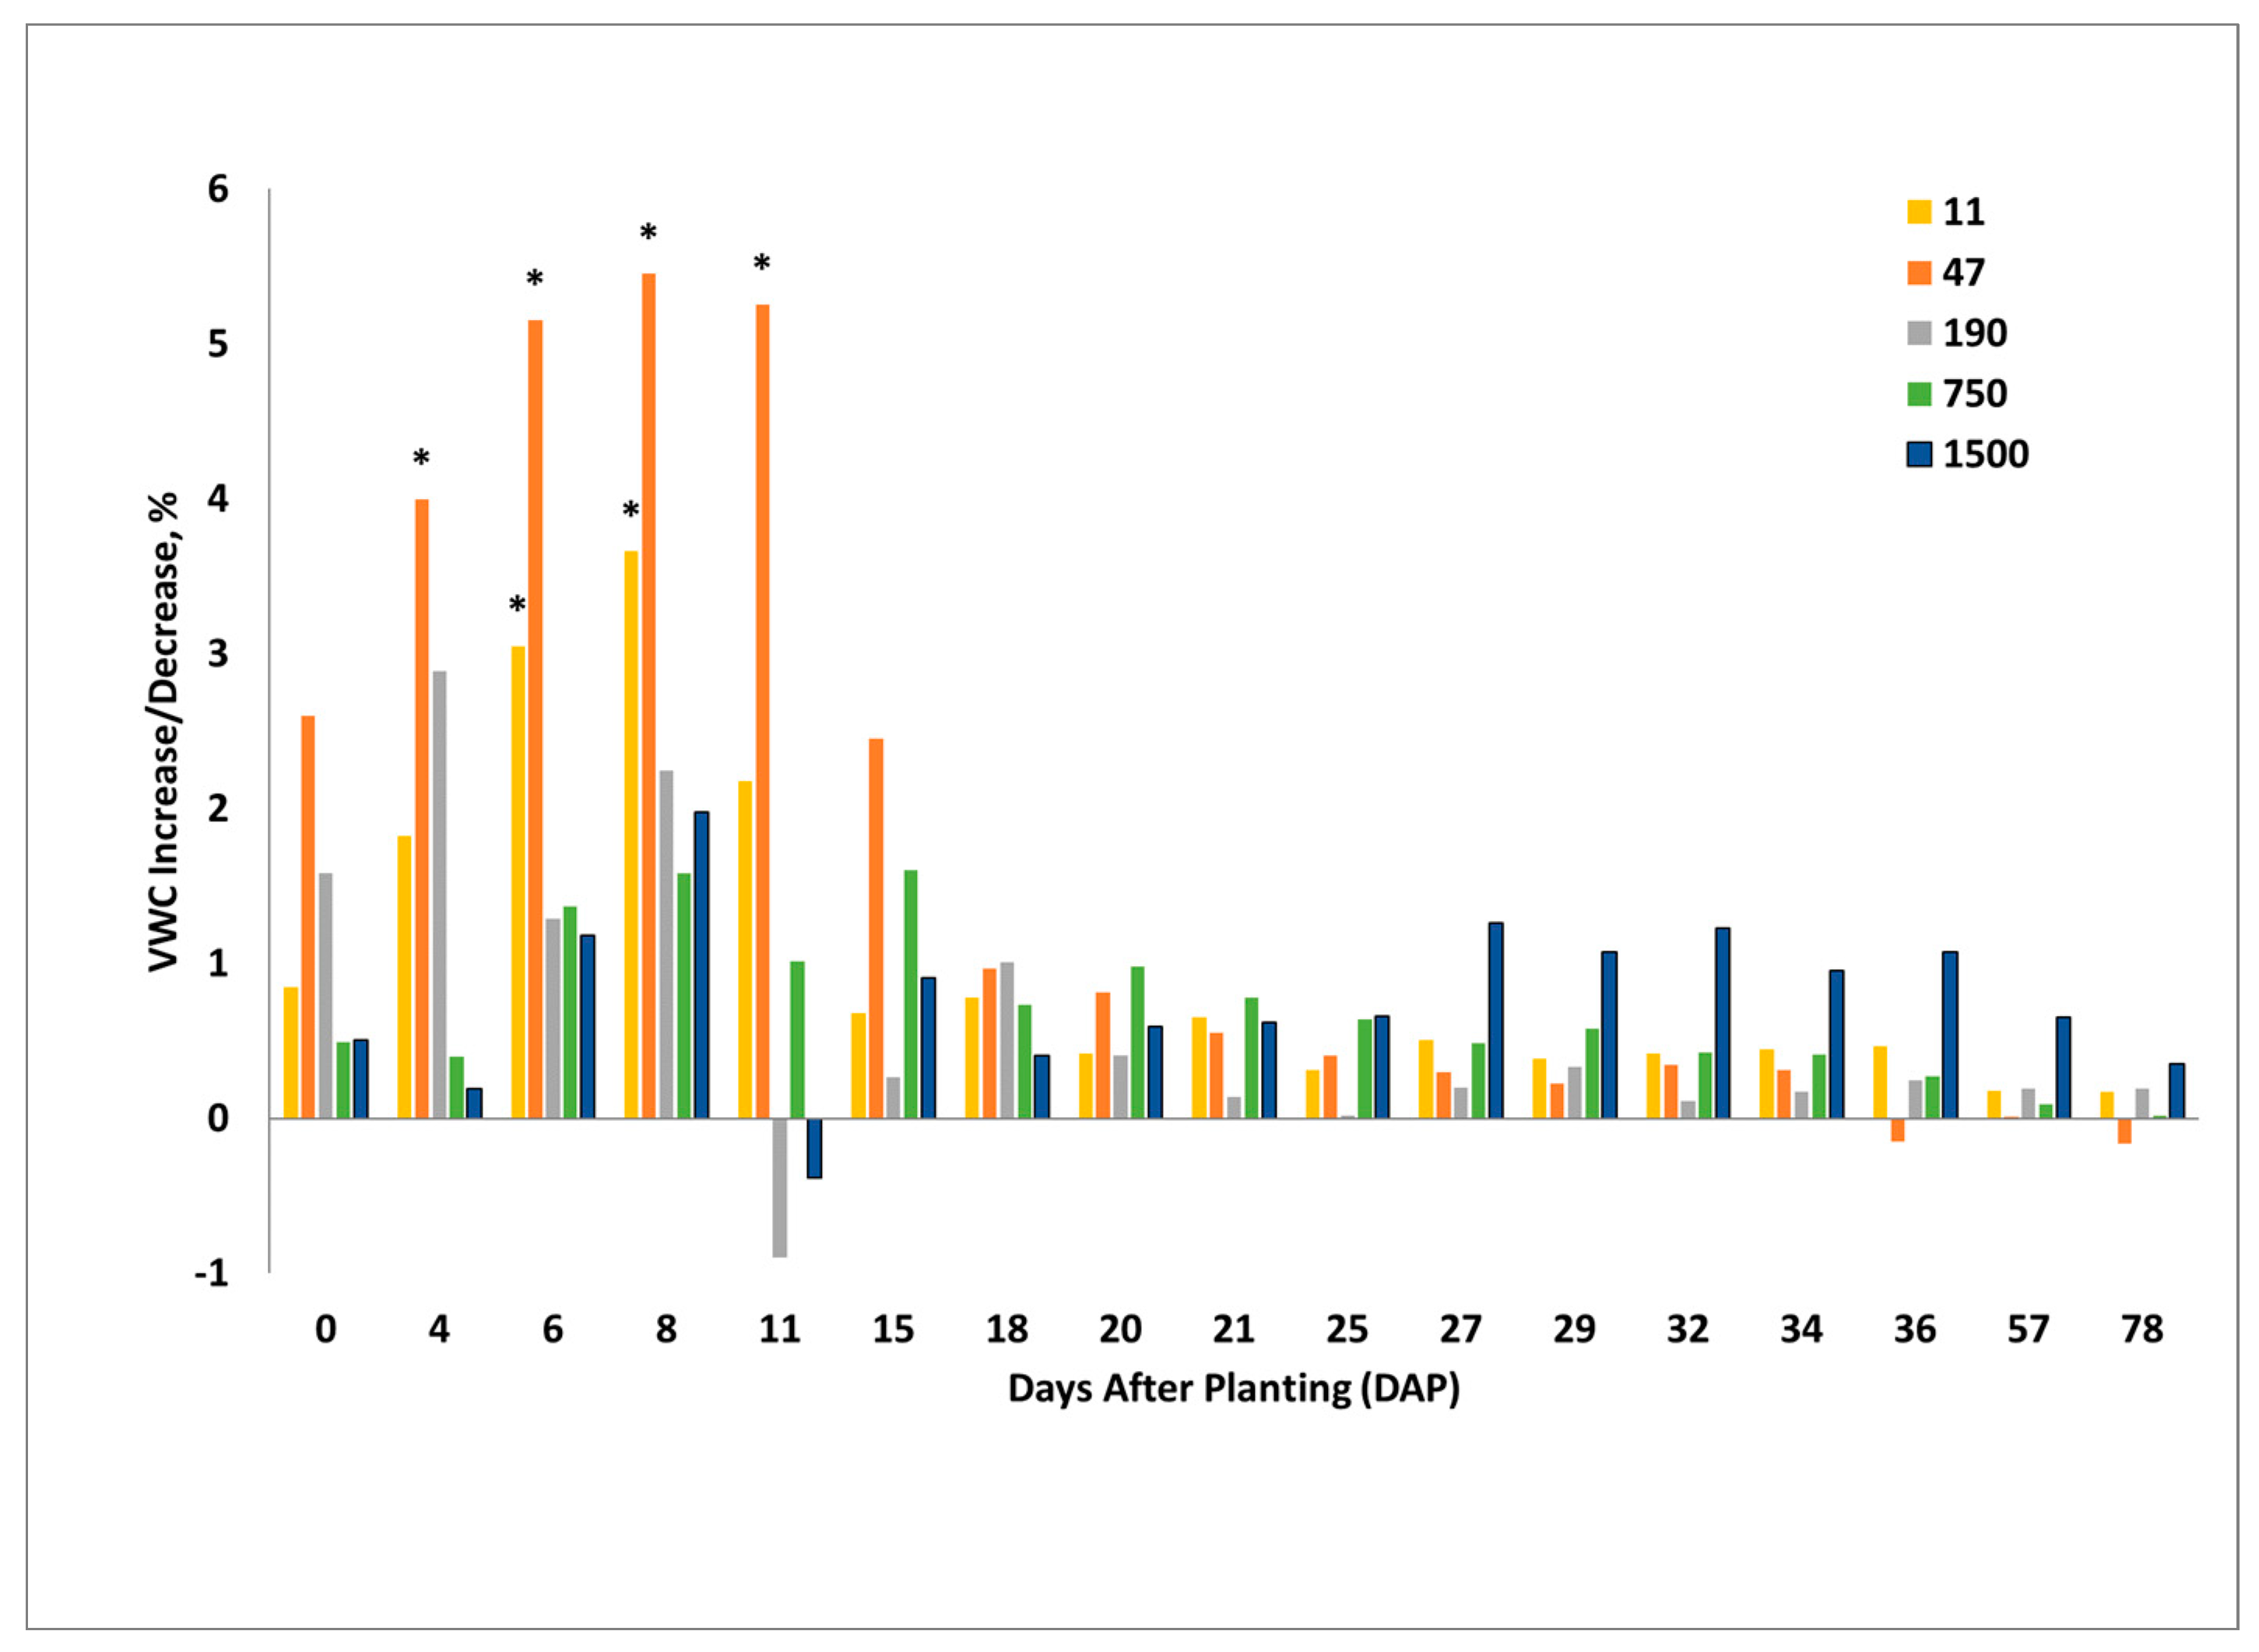
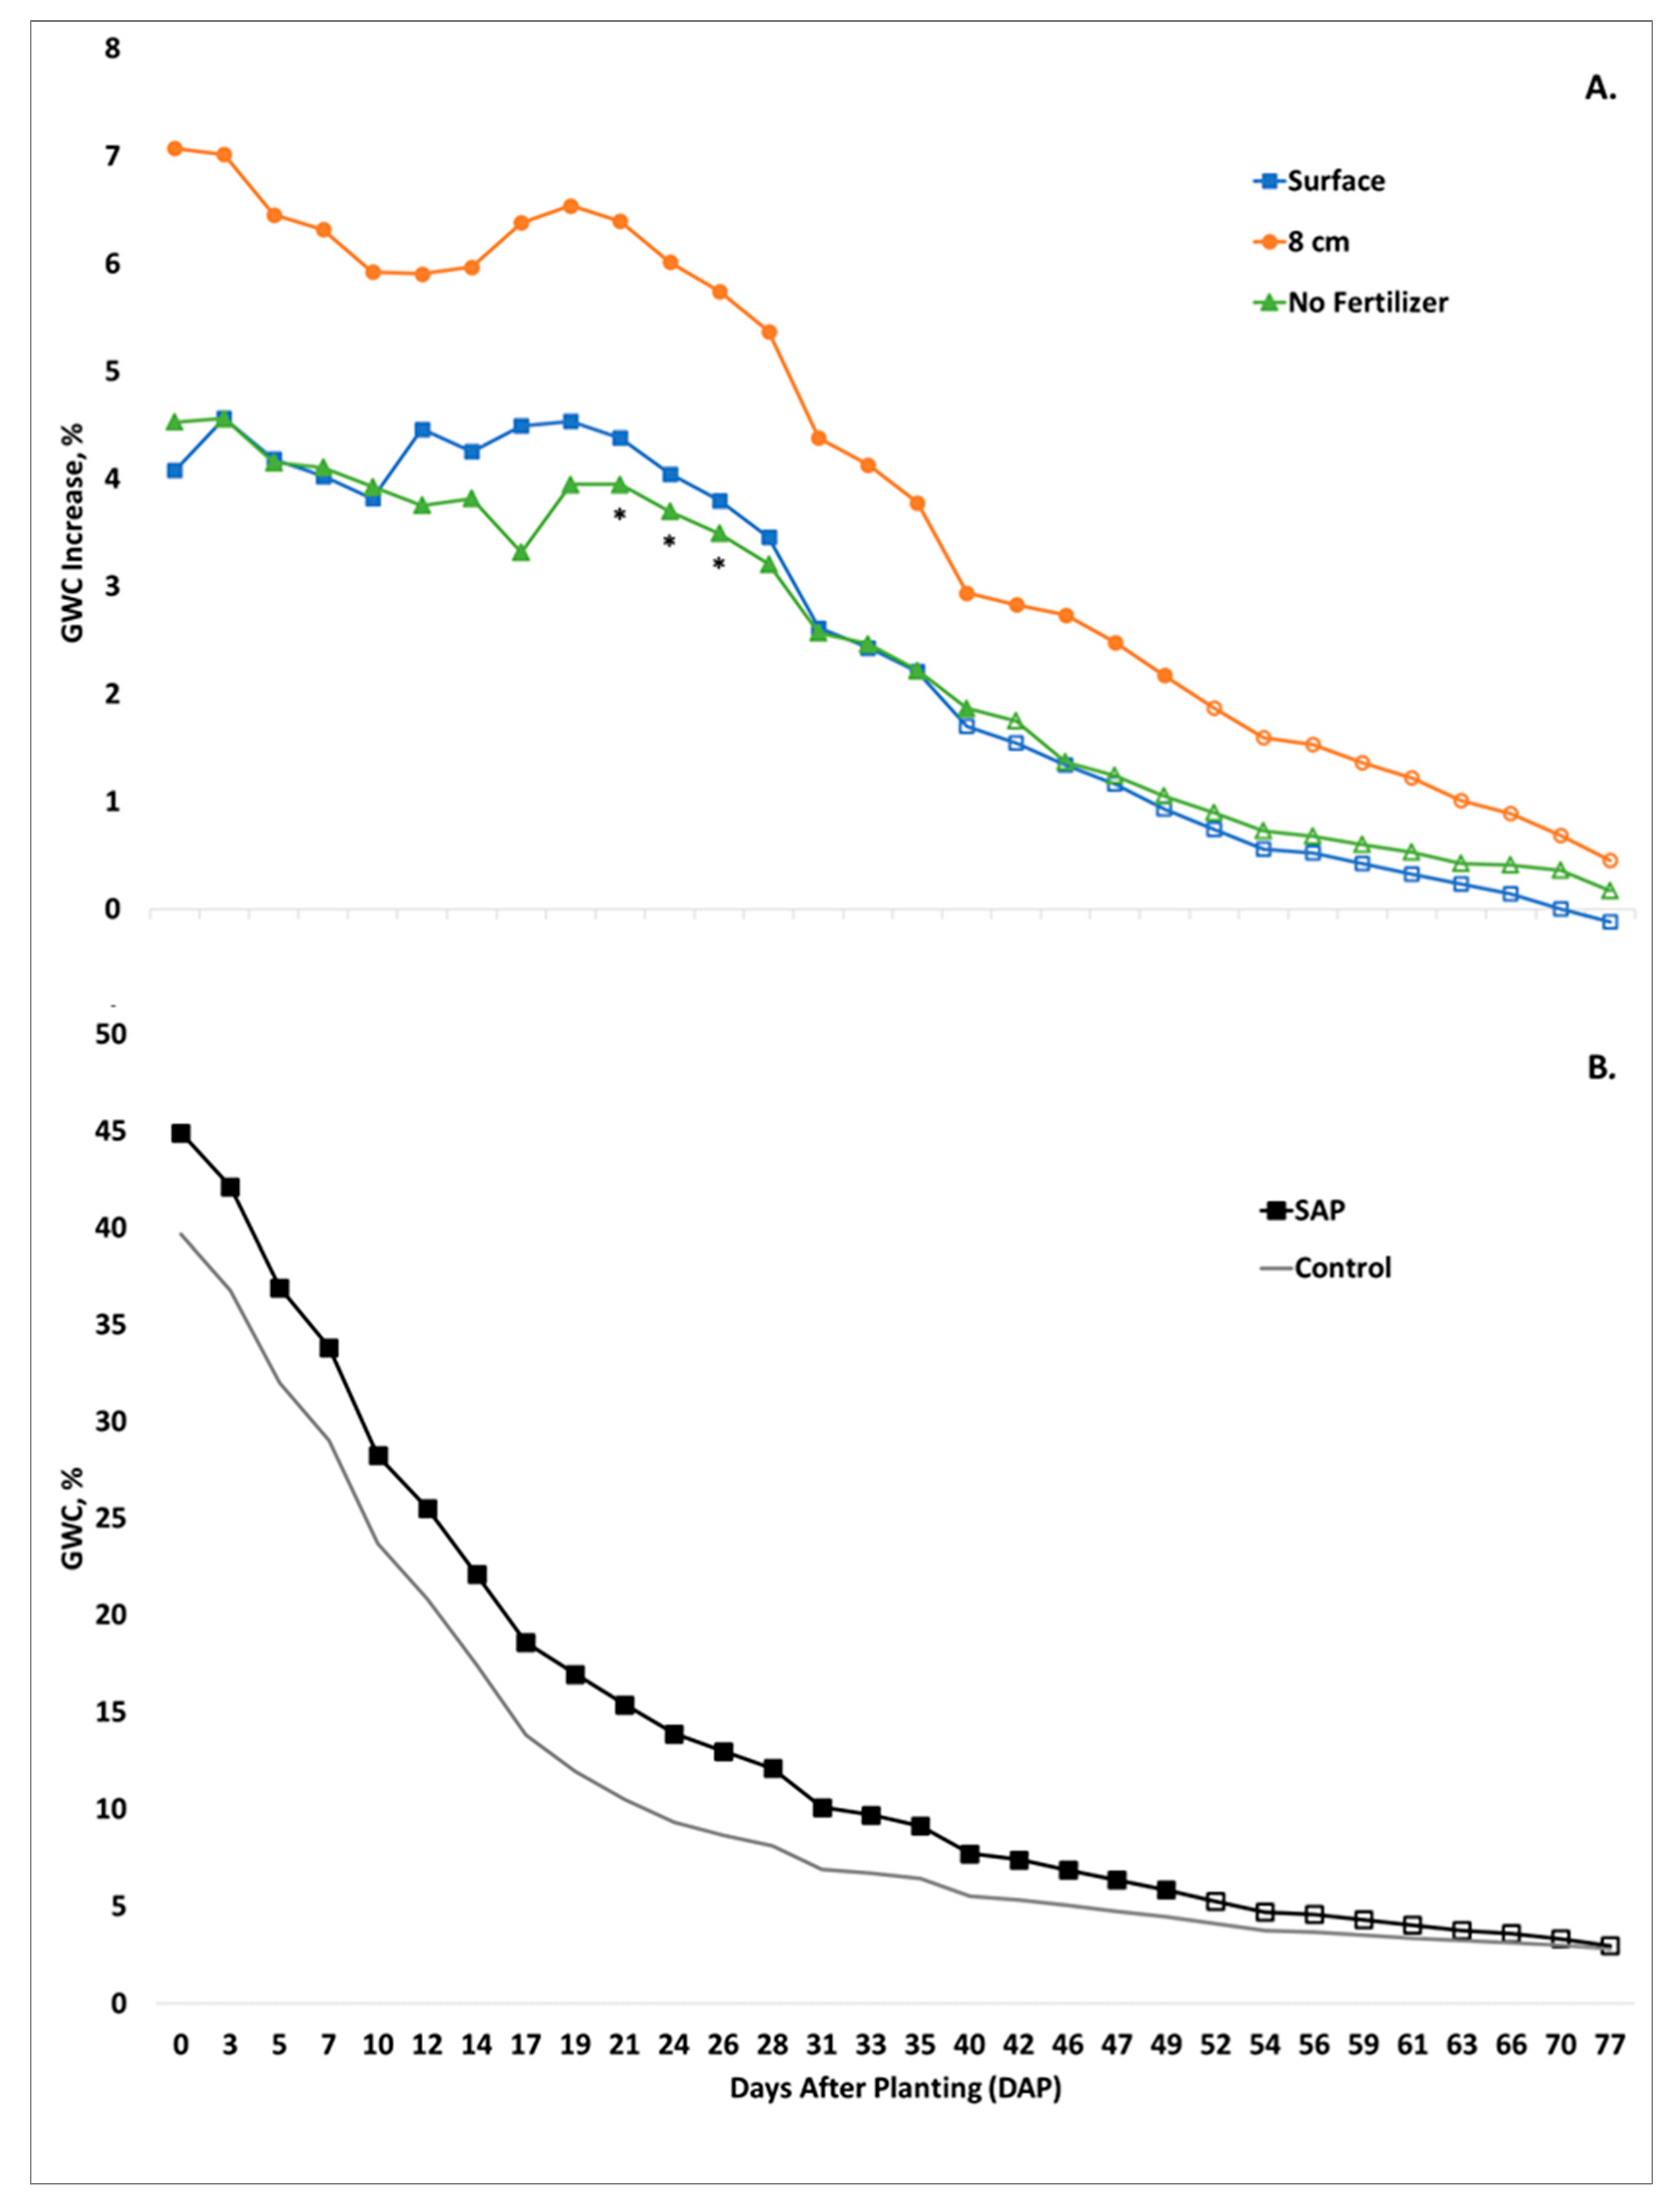
In our perennial grass studies, soil moisture in a loam soil was increased significantly with Stockosorb 660 micro bands applied at a depth of 8 cm below the soil surface at rates of 1500 and 3000 kg ha−1 (0.1 and 0.2%). Soil moisture was increased over the control for up to seven weeks, with the largest differences occurring at the time of saturation and diminishing over time. The largest impact of soil moisture on seedling longevity occurred during approximately the last 12 days, when there was a significant soil moisture difference, despite the difference in soil moisture being near its lowest point.
Higher levels of soil moisture observed in this study as a function of the band-applied SAP are similar to other container studies with a variety of soil types, plant species, and SAP particle sizes, sources, and rates when mixed into the soil [35,40,42,52,53,54,55,56]. In general, such studies found SAP to increase soil moisture in sandy-textured soils at application rates between 0.04 to 1.0% (approximately 600–15,000 kg ha−1). The effect decreased in finer-textured soils. In studies with both sandy and clayey soils, the sands had increased soil moisture, but the clays did not [35,52,54,55].
Our results were similar to El-Asmar et al. [35]. In a soil moisture characteristic study with clay (C) or sandy clay loam (SCL) soils, they found numerically increased water content with increasing SAP application rates of 0.1, 0.2, 0.3, and 0.4% (approximately 1700–7100 kg SAP ha−1) when Stockosorb 660 was blended into the full container of soil. However, water holding capacity was only increased significantly at the 0.4% rate at matric potentials of 30 and 200 kPa and the 0.3% rate at a matric potential of 100 kPa in SCL. In a further study growing maize (Zea mays L.) in the same soils with the same SAP rates, they reported increases in evapotranspiration (ET), which is indicative of increased soil moisture [57]. Banded SAP at rates of 0.2, 0.3, and 0.4% (approximately 3400–7100 kg ha−1) resulted in increased ET in SCL. Mixing the SAP with the soil resulted in increased ET only for the 0.3 and 0.4% SAP rates in SCL. There were no differences in water content or ET in their C soil. In our studies, when the SAP was mixed with the soil, we saw an increase in soil moisture at SAP rates of 1500 and 3000 kg SAP ha−1 (approximately the 0.1 and 0.2% rates used by El-Asmar et al. [35]). We did not test higher rates in our studies. This difference could be explained by the soil texture differences. Our loam soil had only 21% clay compared to 45% clay in the El-Asmar C soil and 37% clay in their SCL, giving us a much larger percentage of the soil particles in the larger sand and silt proportions. As discussed above, SAP effects on soil moisture decrease in finer-textured soils.
Additionally, our studies were conducted over a much wider range of matric potentials. El-Asmar et al. [35] measured water content at matric potentials no lower than 200 kPa with the lowest gravimetric water content (GWC) of 23%. A matric potential of 200 kPa is well within the range of plant available water, which is typically assumed to be between 30 kPa (field capacity) and 1500 kPa (permanent wilting point). We did not monitor matric potential in our studies. However, the soil in our studies was saturated and then allowed to dry down for 76–107 d—until all seedlings had wilted and died and GWC was measured as low as 2.2%. It may be that the SAP holds more water than the surrounding soil as the soil matric potential decreases, relatively increasing water content as the rest of the soil dries.
A third factor that may have increased soil moisture in our studies in treatments with the SAP mixed with the soil is the fact that the SAP was only blended into the top 8 or 15 cm of soil of 25 or 23 cm deep containers, respectively, not the full soil volume. When El-Asmar et al. [35] included treatments of SAP mixed into the soil, the SAP was blended into the full container of soil. They [35] suggest that banded SAP would allow water to diffuse into the soil below when it was saturated, but then act as a barrier to soil capillary rise as the soil dried. Concentrating the SAP into a portion of the container, even if not banded, could have a similar, though reduced, impact—slowing water movement from the soil below and increasing the overall moisture holding capacity.
Application of SAP increases plant available water not only by absorbing and holding water within the polymer, but it has also been shown to decrease bulk density and increase soil porosity [28,34,35,53,58,59]. Soil pores vary in size and shape and are categorized as macropores (>0.08 mm) and micropores (<0.08 mm). Macropores readily allow movement of air, water, and plant roots through the soil profile, while movement through micropores is more limited. Thus, an increase in soil macropore size can be beneficial. If, however, they are large enough to create large subsurface voids, moisture may be more easily lost due to drainage or evaporation [23]. This may result in a reduction in seedling longevity. Sarvaš et al. [60] found reduced transplant seedling survival with Stockosorb micro with Scotch pine (also known as “Scot’s pine”; Pinus sylvestris). This was attributed to the swelling of the SAP that “pushed up” the seedlings, resulting in their demise, likely due to loss of soil moisture from large subsurface voids. No information is given on the size of the planting hole, but we speculate that their application rate (7 g tree−1) was higher than ours. Depending on the transplant method, the planting holes could have ranged between approximately 8 and 25 cm in diameter. The applied rate of 7 g SAP mixed into each planting hole would be equivalent to approximately 1400 and 14,000 kg ha−1.
Similarly, we frequently observed raised or cracked soil in our studies with SAP bands at ≥750 kg ha−1. In general, the SAP broke through the soil surface, creating cracks, as it became saturated and swelled. Soil cracking did not occur with the deepest (15 cm) SAP placement. However, the entire soil surface in those pots was raised ~1 cm compared to the controls. Bakass et al. [61] found that SAPs dry out ahead of the surrounding soil. Since it is the absorption of water that causes the SAP to swell, it shrinks as it dries. It is plausible that as the banded SAP swelled, it also spread to form a layer. This could have resulted in a void below the surface as it dried, and the displaced soil retained its shape.
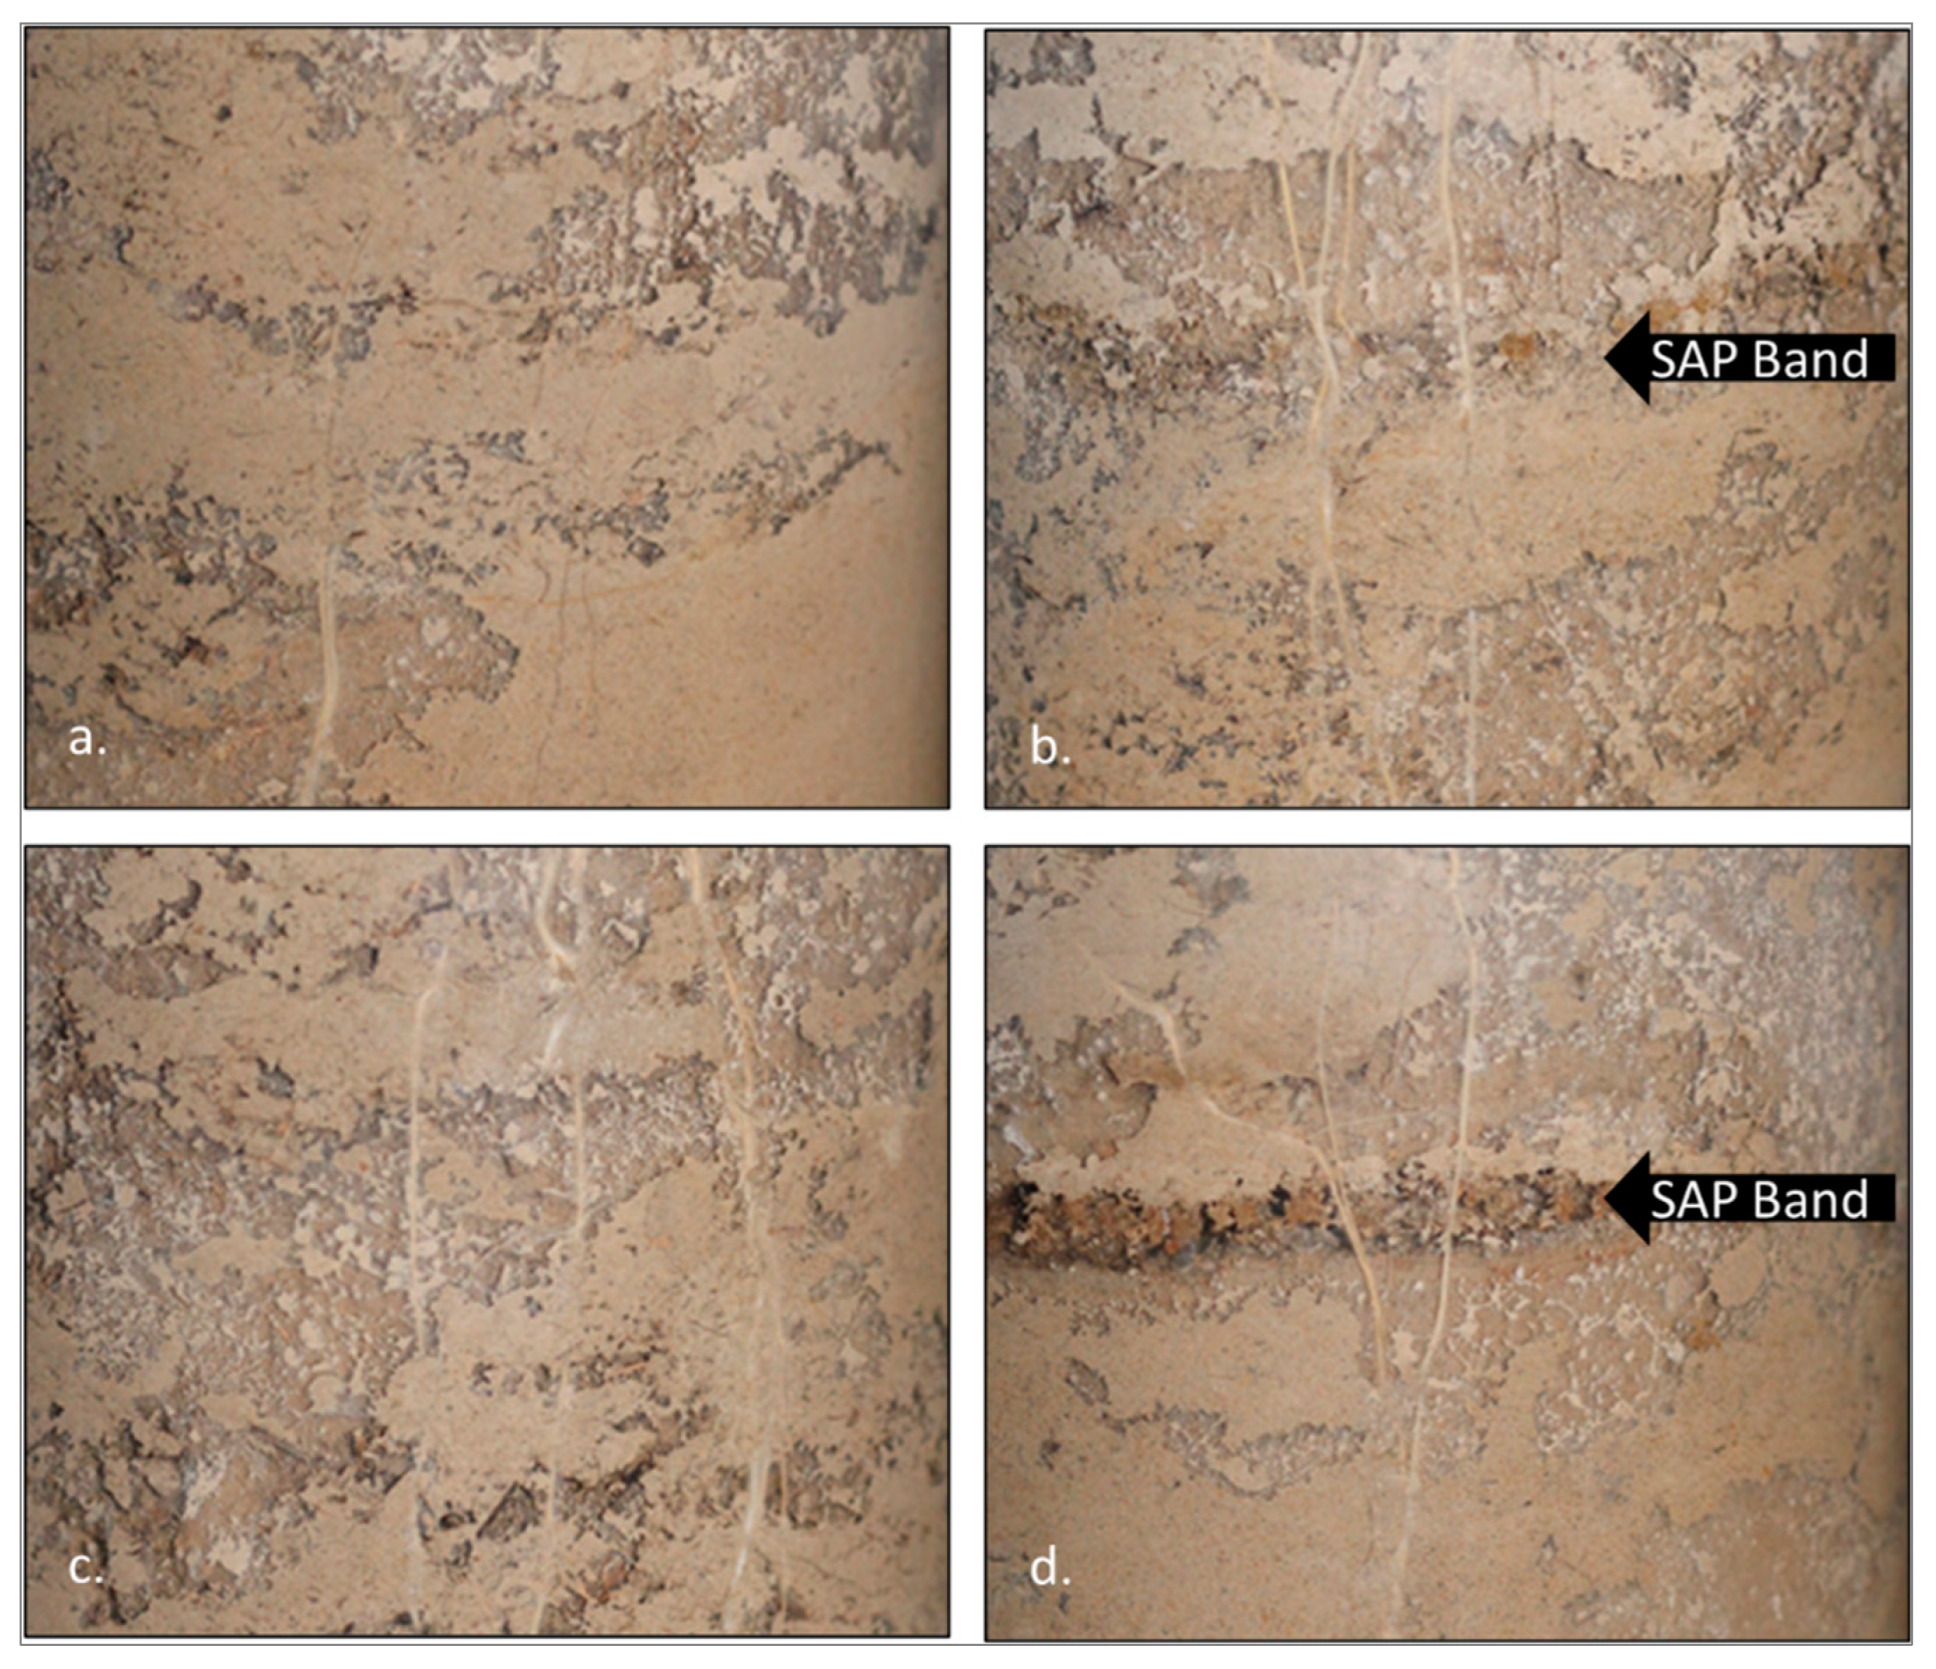
We found that the soil in the pots was divided into separate layers at the level of the dried SAP after complete dry-down. This was similar to El-Asmar et al. [35] who observed the formation of large air pores as individual SAP granules dried when mixed in the soil, as well as the formation of distinct soil layers after drying when SAP was applied as a band. The formation of large cracks and subsurface voids was likely exacerbated by both the placement in a concentrated band and the relatively high SAP rates in our studies. These cracks exposed the SAP and deeper layers of soil to air, light, and heat and could potentially lead to faster drying of the soil. However, this did not result in reduced soil moisture in these studies. As mentioned above, El-Asmar et al. [35] suggest that banded SAP, wet or dry, prevents evaporative loss of soil moisture from beneath it, even when exposed to the elements, thus maintaining higher soil moisture levels.
Reducing the SAP rates to reduce the threat of soil cracking always resulted in a reduced impact on soil moisture level and longevity, if any impact occurred at all. Similarly, Bandak et al. [62] found that the application of Super AB A-200 (Rahab Resin Co., Tehran, Iran or Iramont, Inc. Laval, Quebec, Canada) at rates of 1000 and 2000 kg ha−1 increased soil moisture. However, no effect was measured at the low rate of 500 kg ha−1. Hüttermann et al. [42] suggest that there may be a minimum SAP concentration required to see an increase in soil moisture. Curiously, in our reduced rate study, the two lowest rates, 11 and 47 kg ha−1, increased soil moisture for up to 11 d, but the 180 and 750 kg ha−1 rates did not, possibly due to drying due to greater soil swelling. The 1500 kg ha−1 rate also did not increase moisture in that study but did so in other studies. Increased soil moisture at the lowest rates could possibly be a result of the formation of relatively smaller air pockets created within the soil that still allowed for increased percolation and reduced evaporative loss without disturbing the soil surface.
The one exception to increased soil moisture with high-rate SAP bands was the SAP and Root Depth Study that showed no significant difference in soil moisture. Interestingly, unlike the other studies, there was no soil cracking, either. That study was conducted in round canisters with SAP placed in a band around the circumference of the canister, rather than square pots with the SAP band running across the middle. This may have been equivalent to reducing the amount of SAP at any one spot, thus reducing the soil cracking as the band swelled, but also reducing the positive impact on increased soil moisture.
Several other studies have also reported reduced SAP absorptive capacity when resaturated after complete dry-down of the soil [38,39,40,41,55,63,64,65,66,67]. Holliman et al. [39] reported that the largest decrease was observed in the first 18 months of use. Bai et al. [38] reported significant reductions of 73–99% in SAP water absorbency of four different SAPs after five rewet cycles over 5 months. Banedjschafie and Durner [40] found that water retention of Super AB A-200 at application rates of 0.3, 0.6, and 1.0% (approximately 3400–15,000 kg ha−1) thoroughly mixed into sandy soil reduced significantly after the first wetting/drying cycle but was significantly increased over soil alone. They also found plant available water decreased by about 50% compared to the initial saturation after six months of repeated wetting and drying. Zhang et al. [37] found that the superabsorbent resin AG101 (Formosa Plastic Corporation, Kaohsiung City, Taiwan) absorbed and reabsorbed water 30–50 times before degrading. The reduction in absorbency has been attributed to degradation due to weathering, microbial action, and exposure to salts [27,34,38,40,43,53,55,56,63,64,65,66].
The gradual replacement of the original structural SAP cations (usually sodium (Na+) or K+) with calcium (Ca2+) and/or magnesium (Mg2+) is one possible source of the reduced absorption efficiency of SAPs [38,40,55,56,67]. Banedjschafie and Durner [40] attributed the reduction in SAP absorption to specific salts, especially Ca2+, in the soil solution, while water-soluble phosphorus (P) and K had only a moderate effect on the reduction in water uptake. Yu et al. [56] attribute the reduction to the exchange in adsorbed cations within the SAP structure itself. They report that the strongest reduction is associated with bivalent cations, especially Ca2+ and Mg2+, compared to monovalent cations, especially Na+ and K
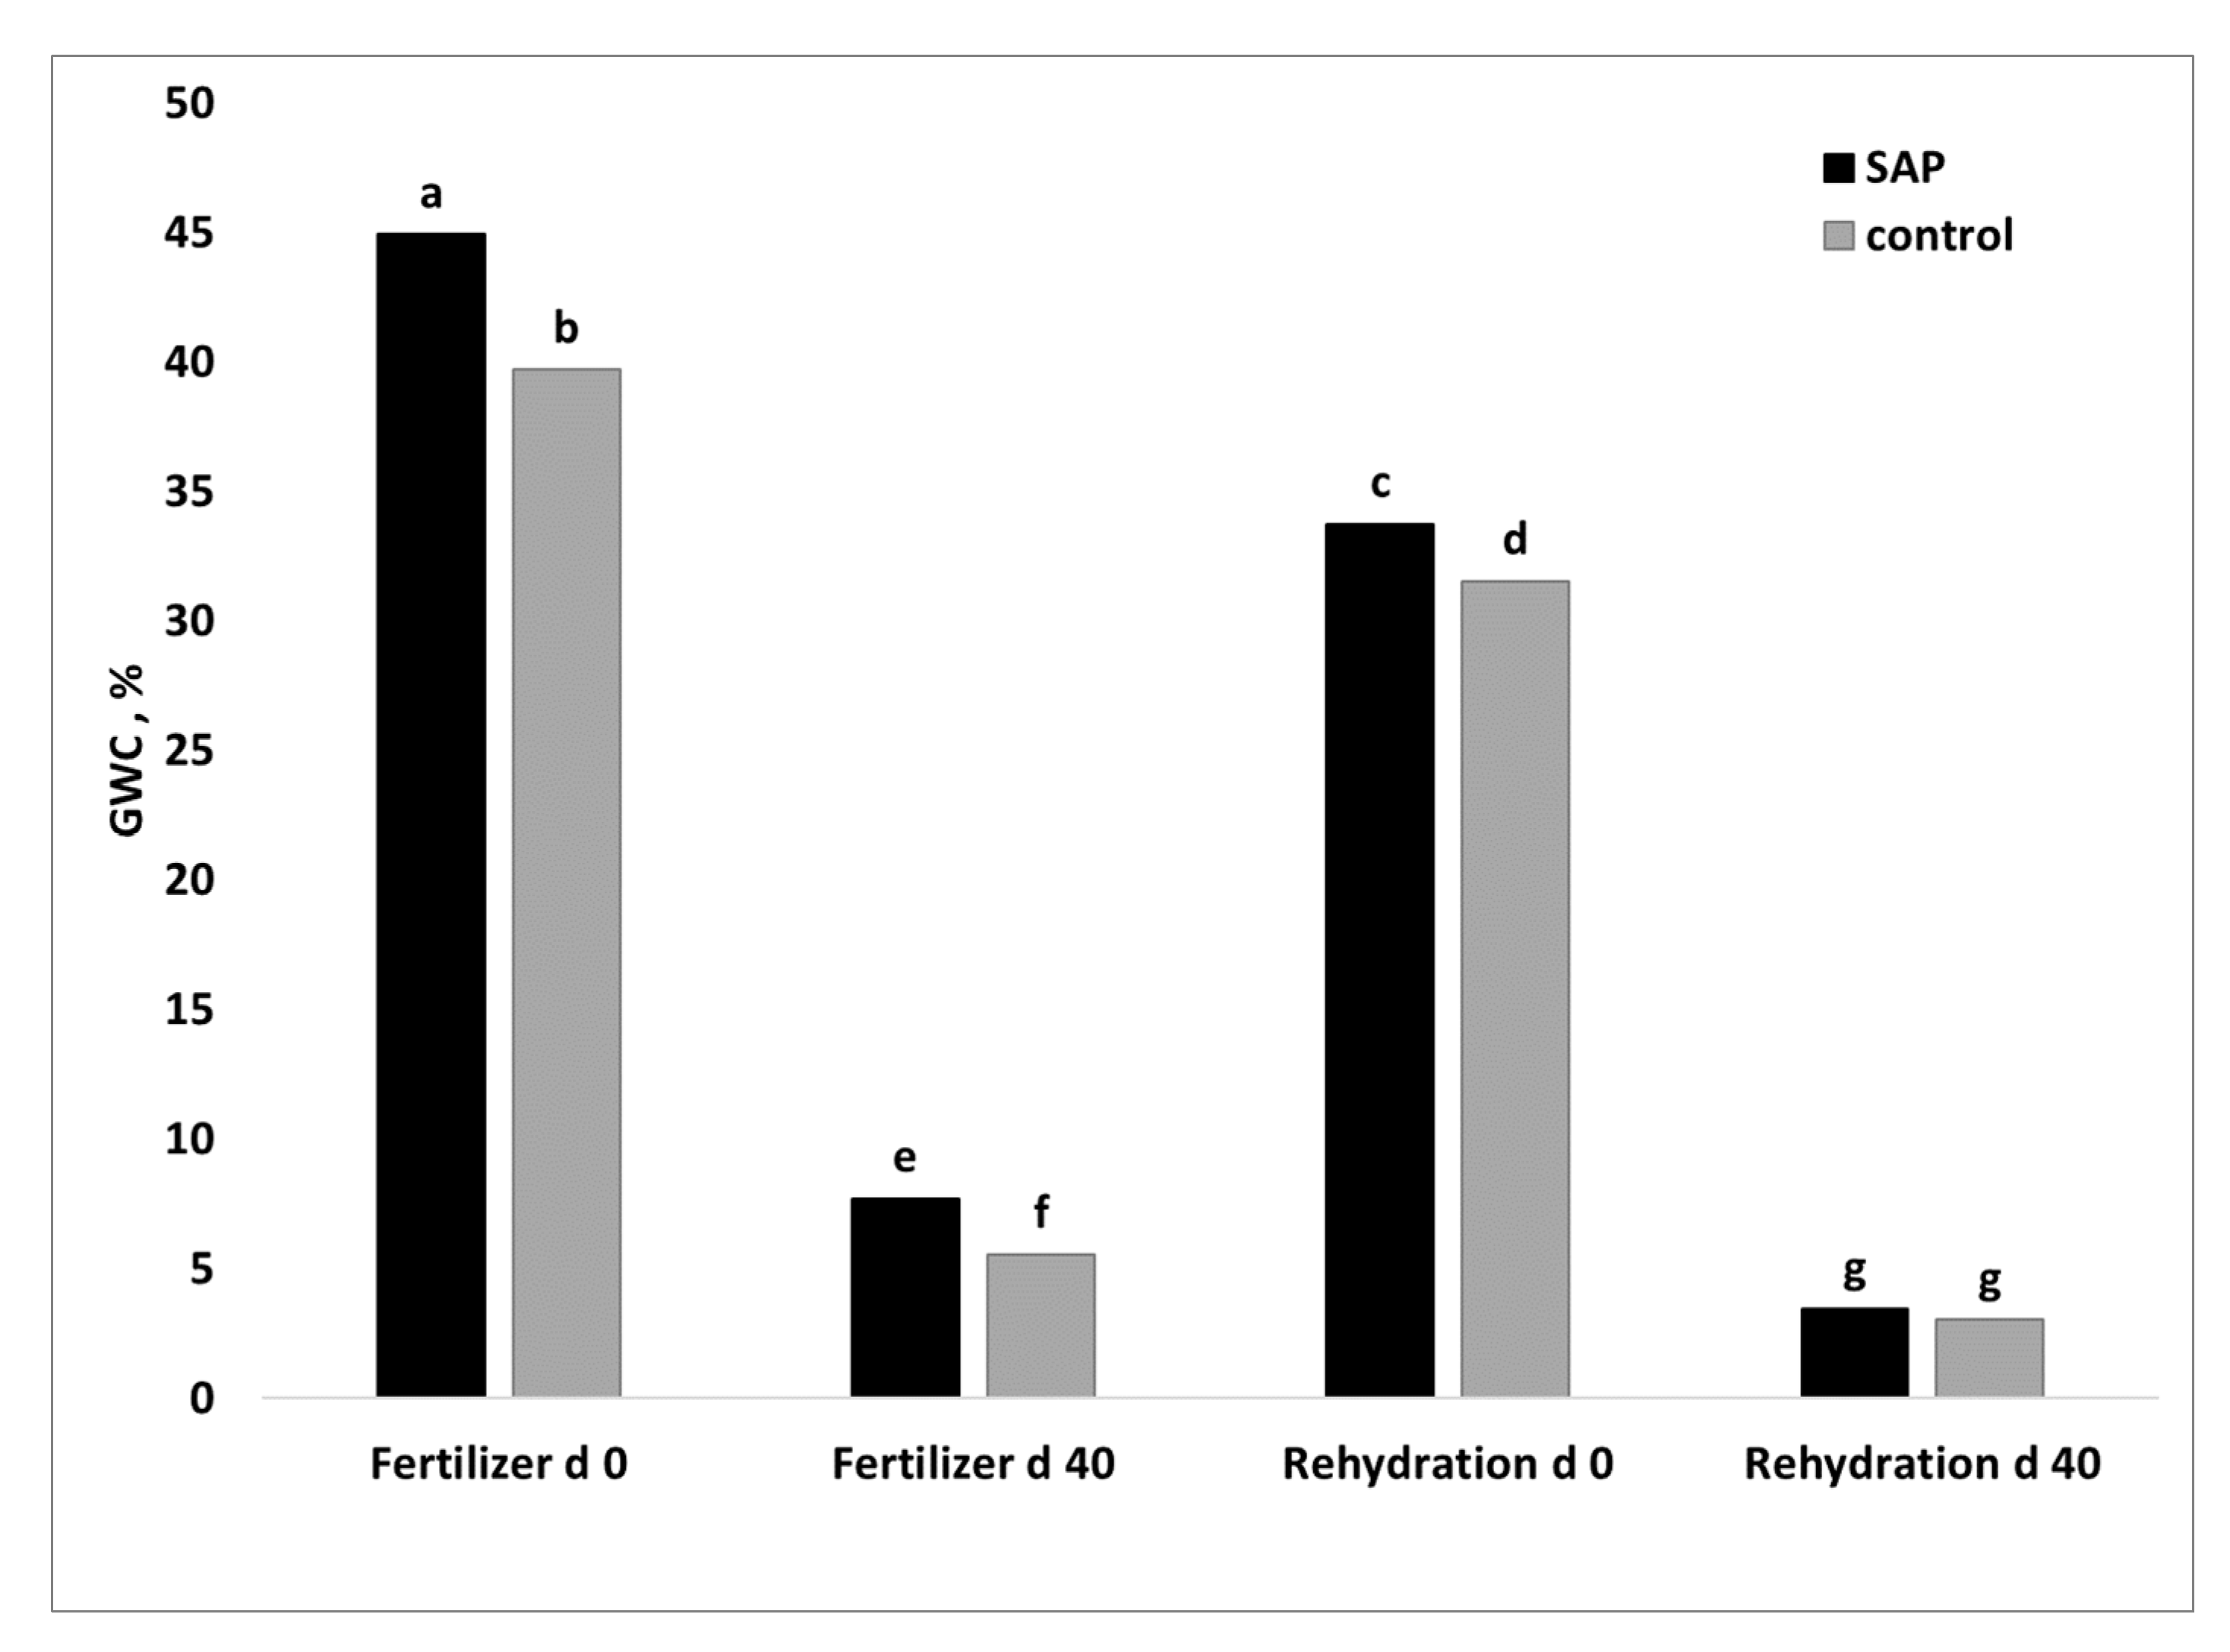
+. We saw indications of this effect in our studies (Figure 9). The UTTR soil used in this study was especially high in Ca2+ and Mg2+ (Table 2), but GWC was increased with the use of a fertilizer high in K+ applied to the band. If the application of monovalent cations in or near a subsurface SAP band would improve its absorptive capacity, lower SAP rates could provide desired establishment or soil moisture results while reducing soil disturbance.

4.2. Seedling Growth Parameters

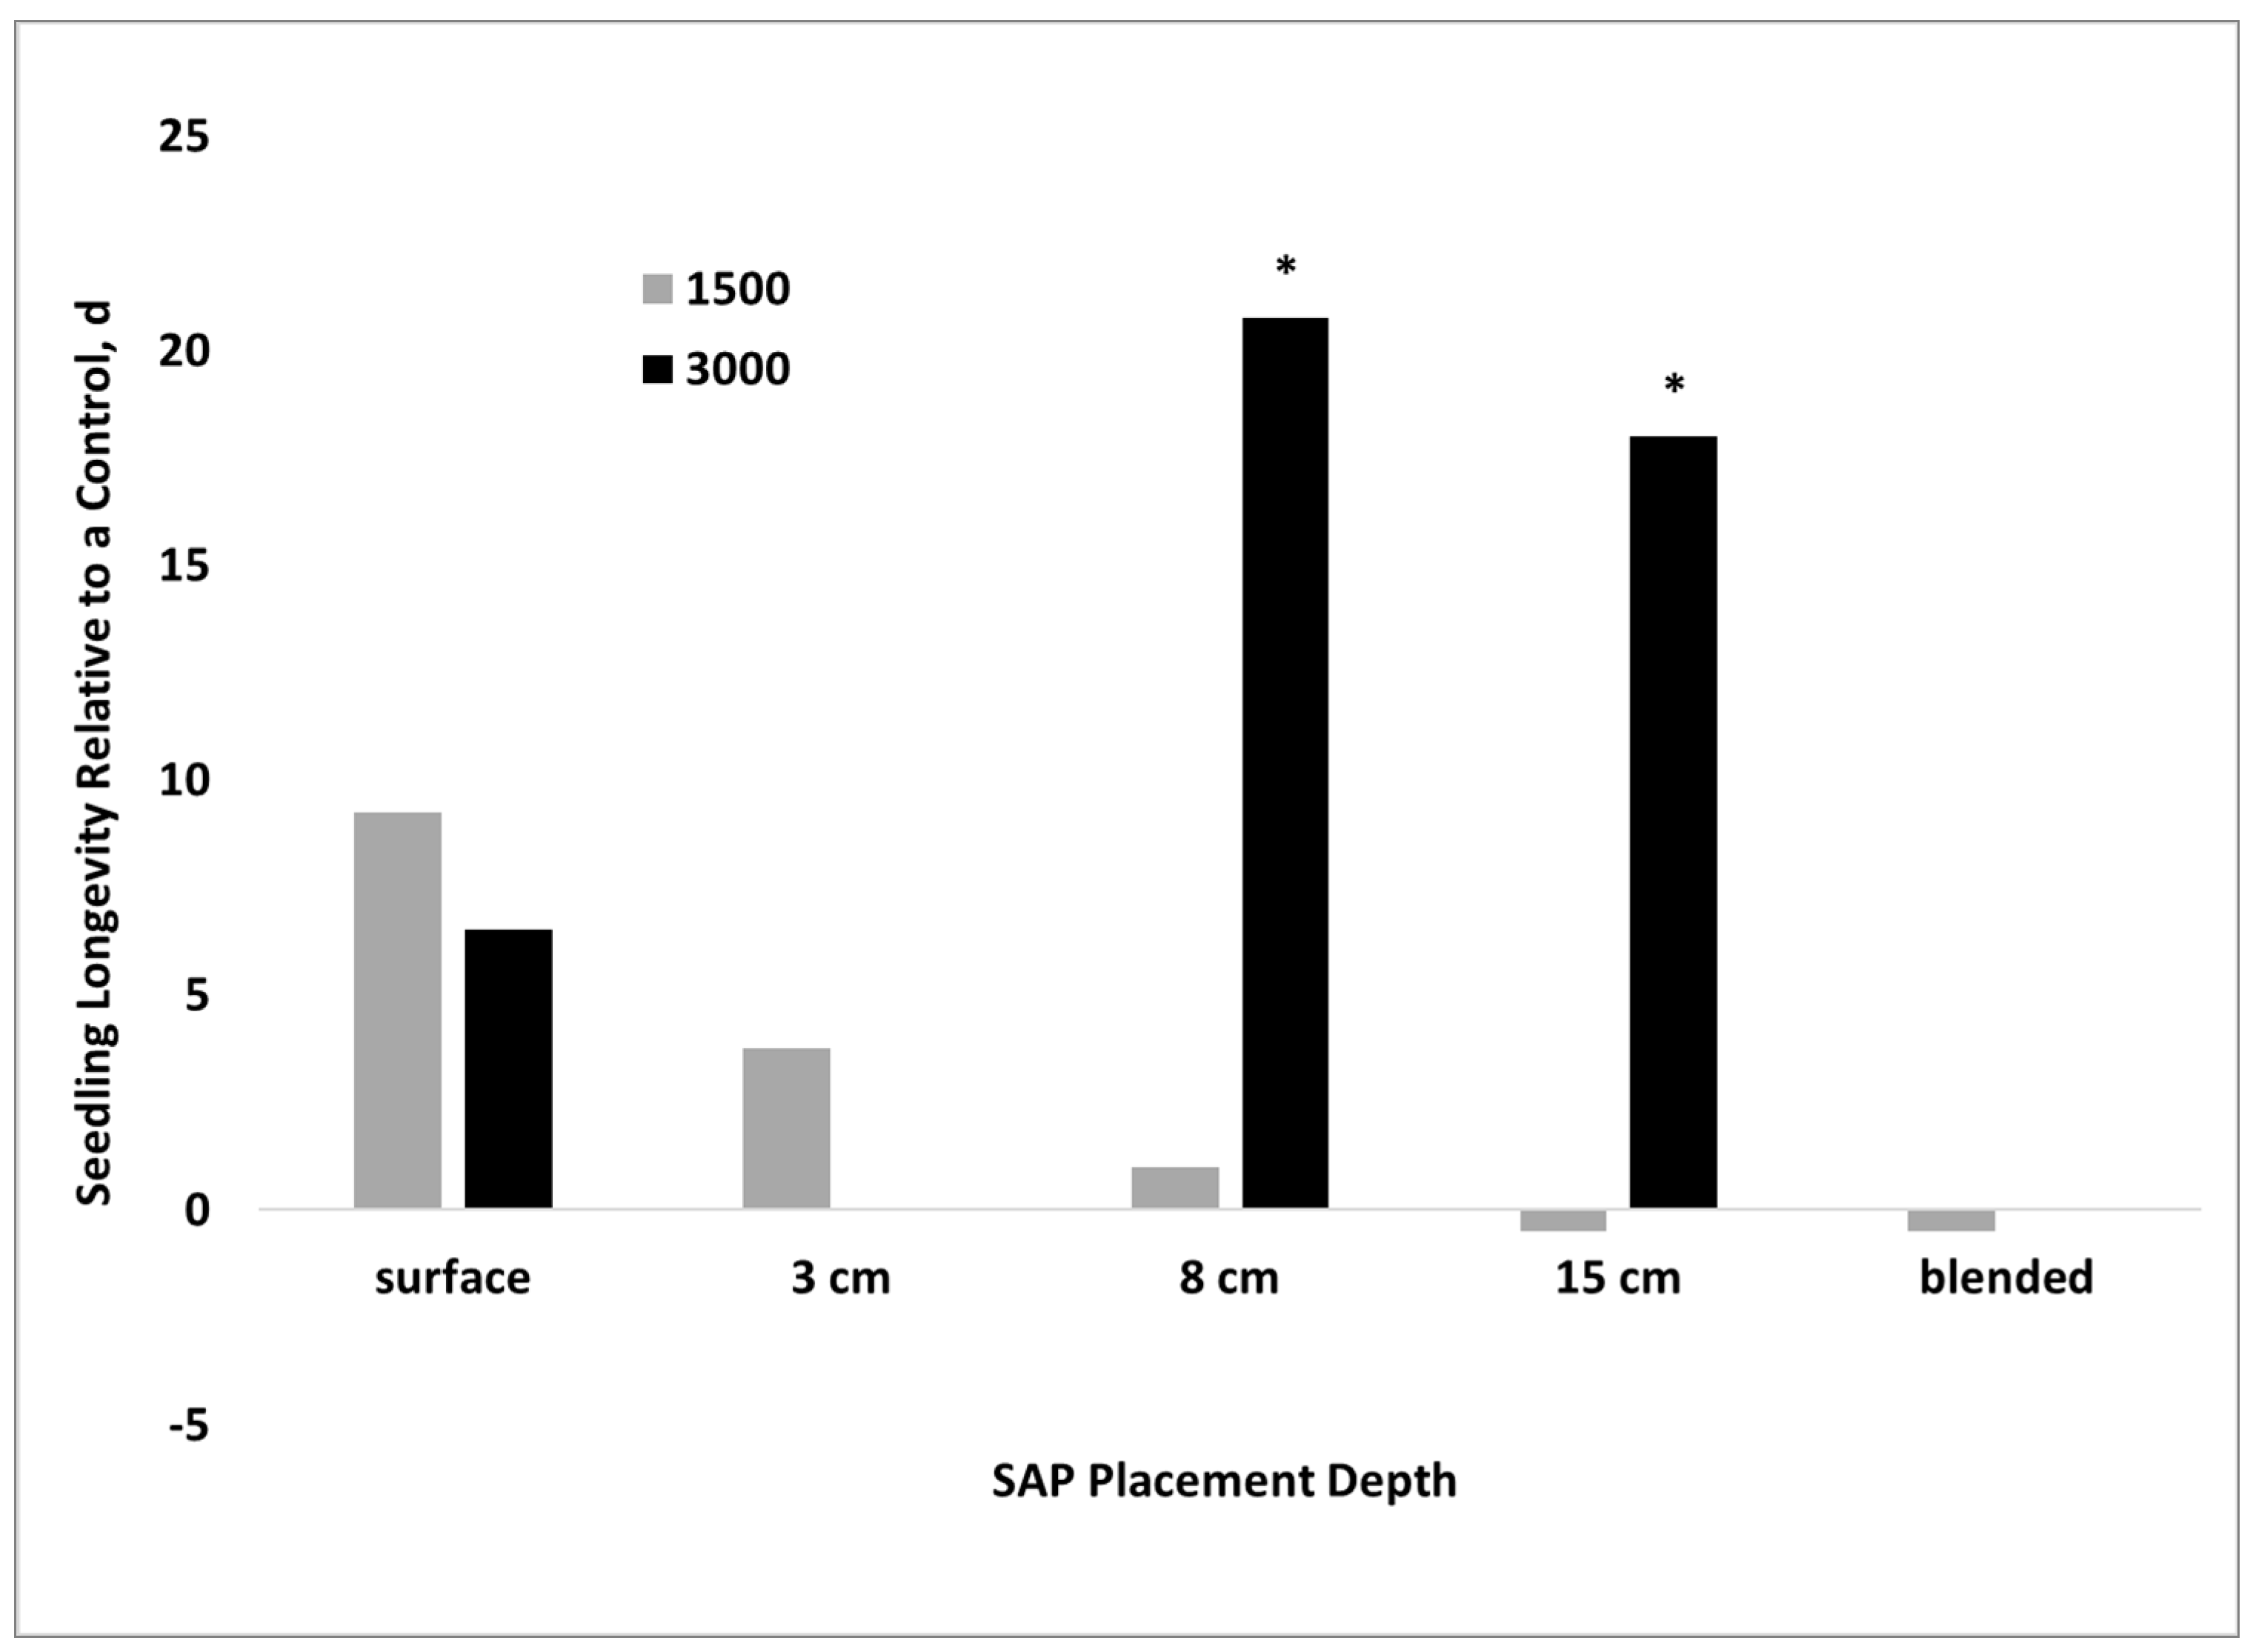
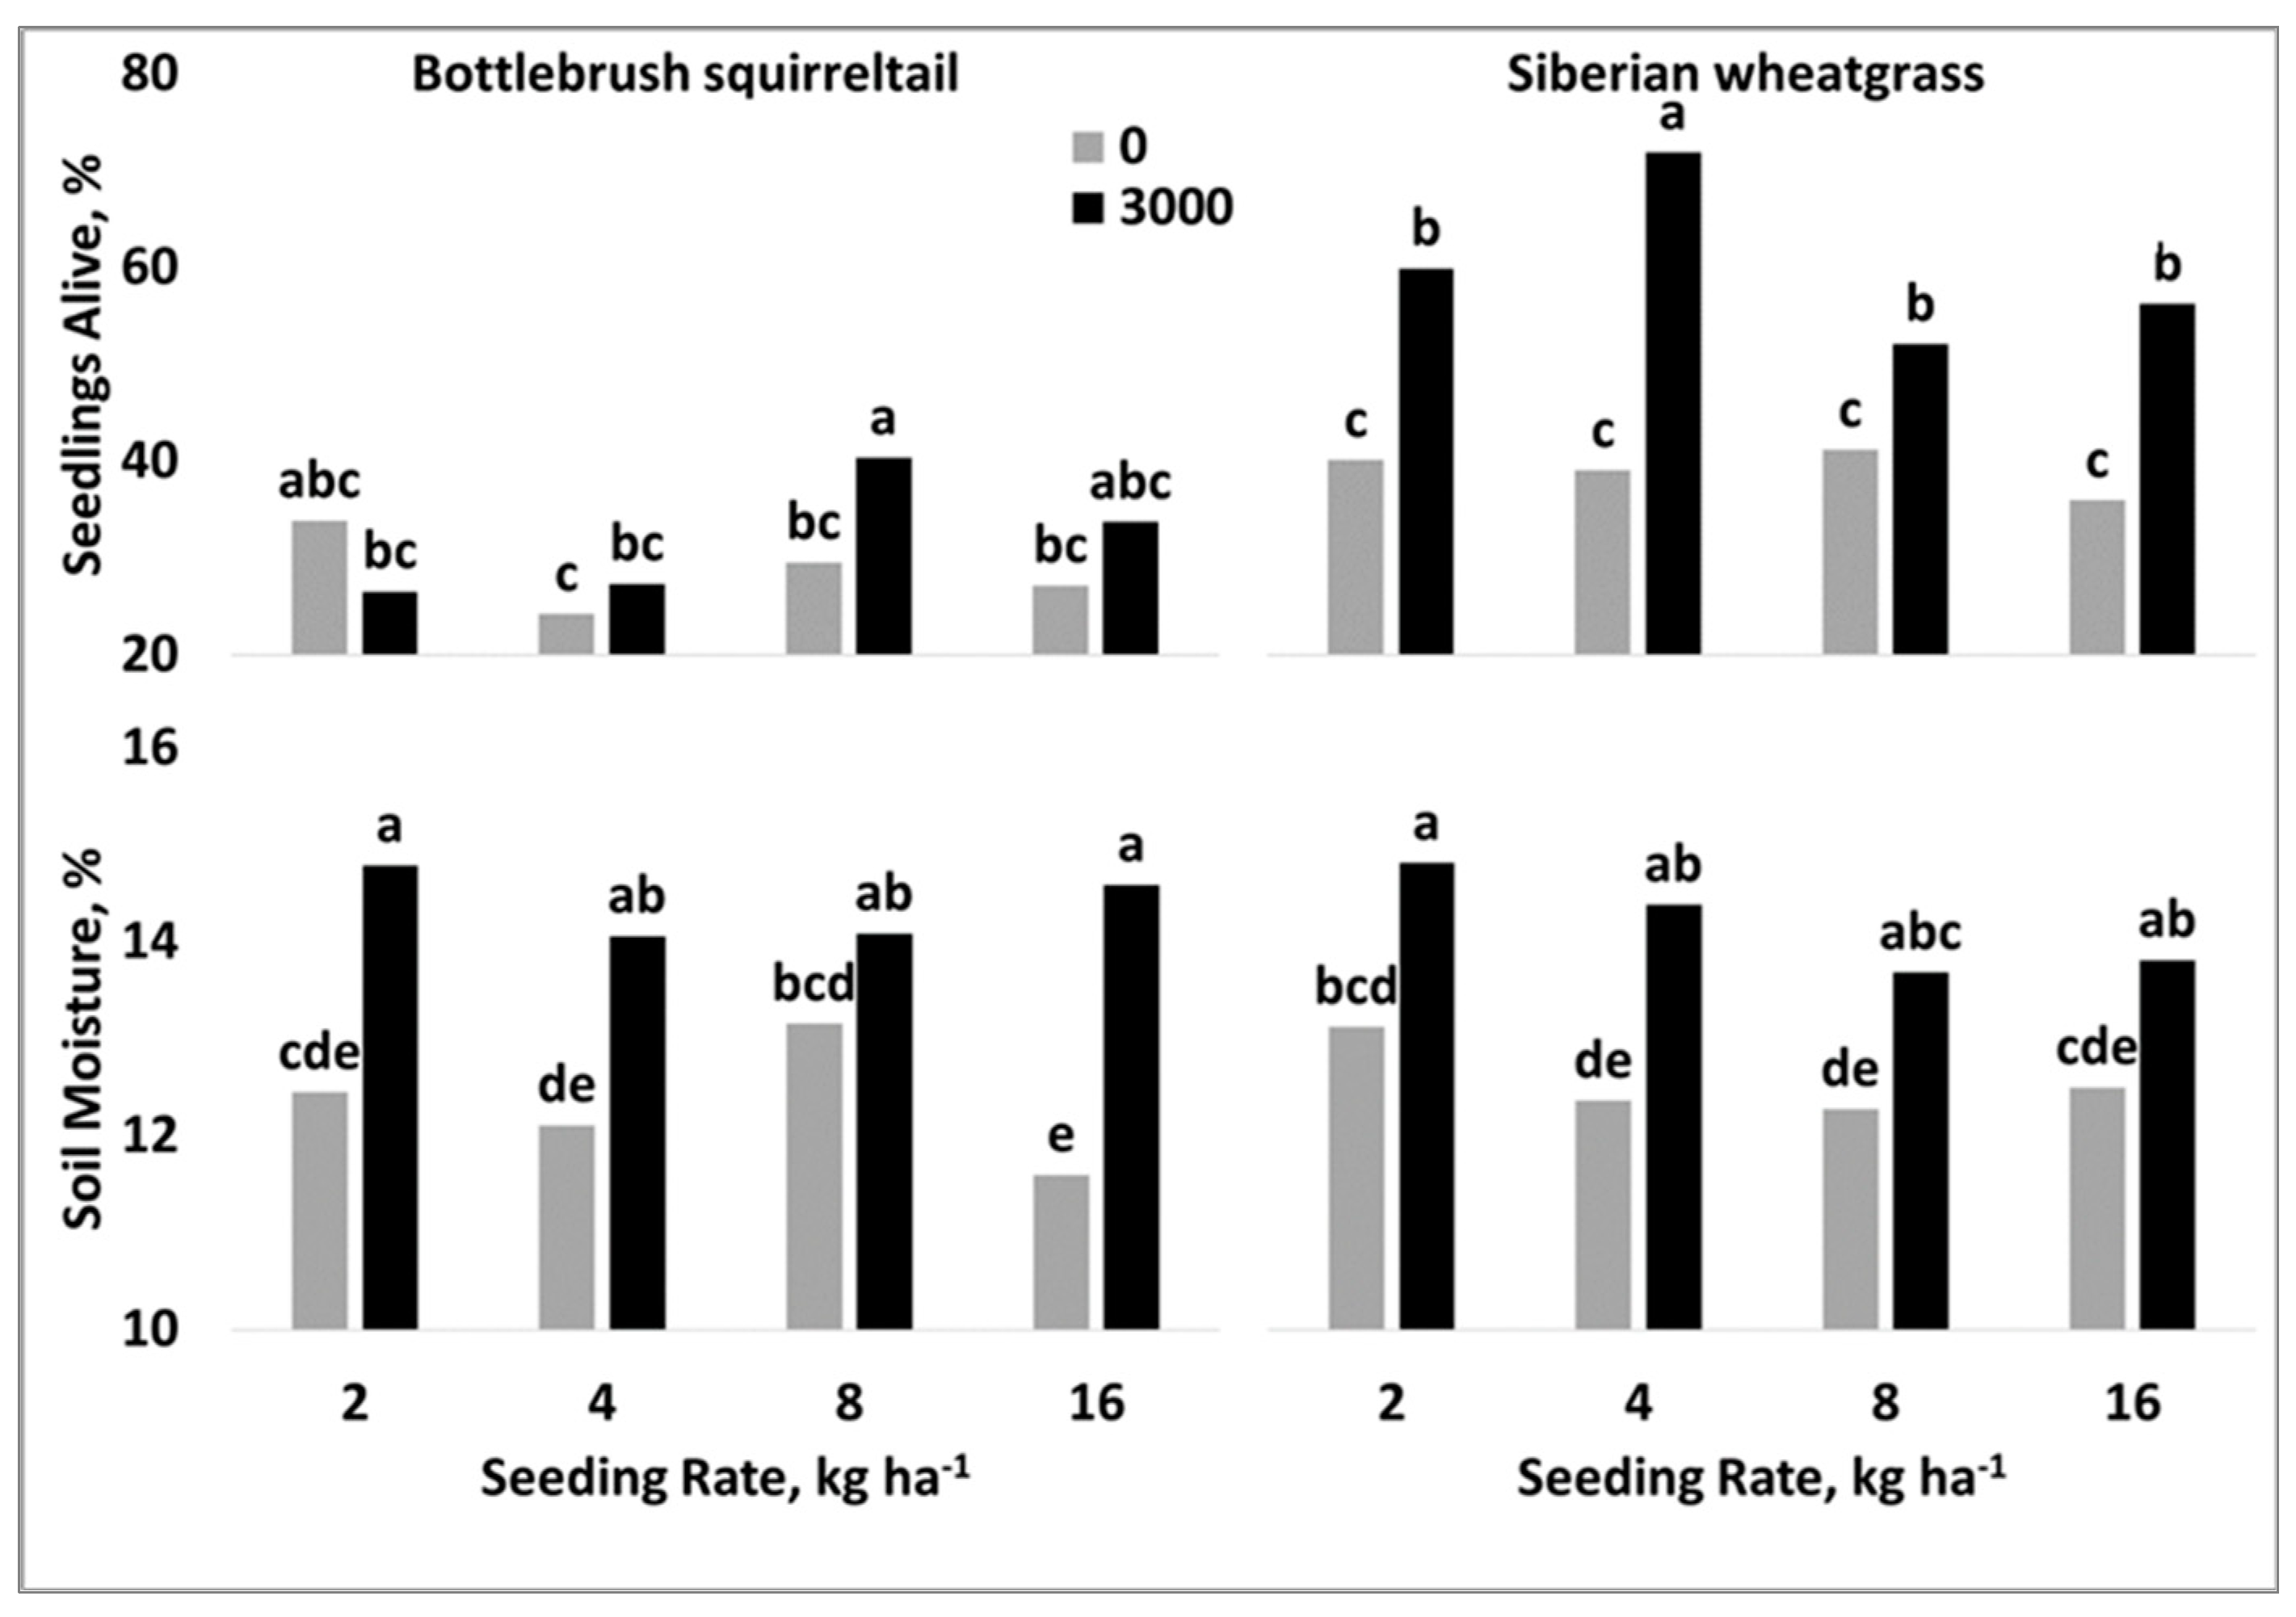
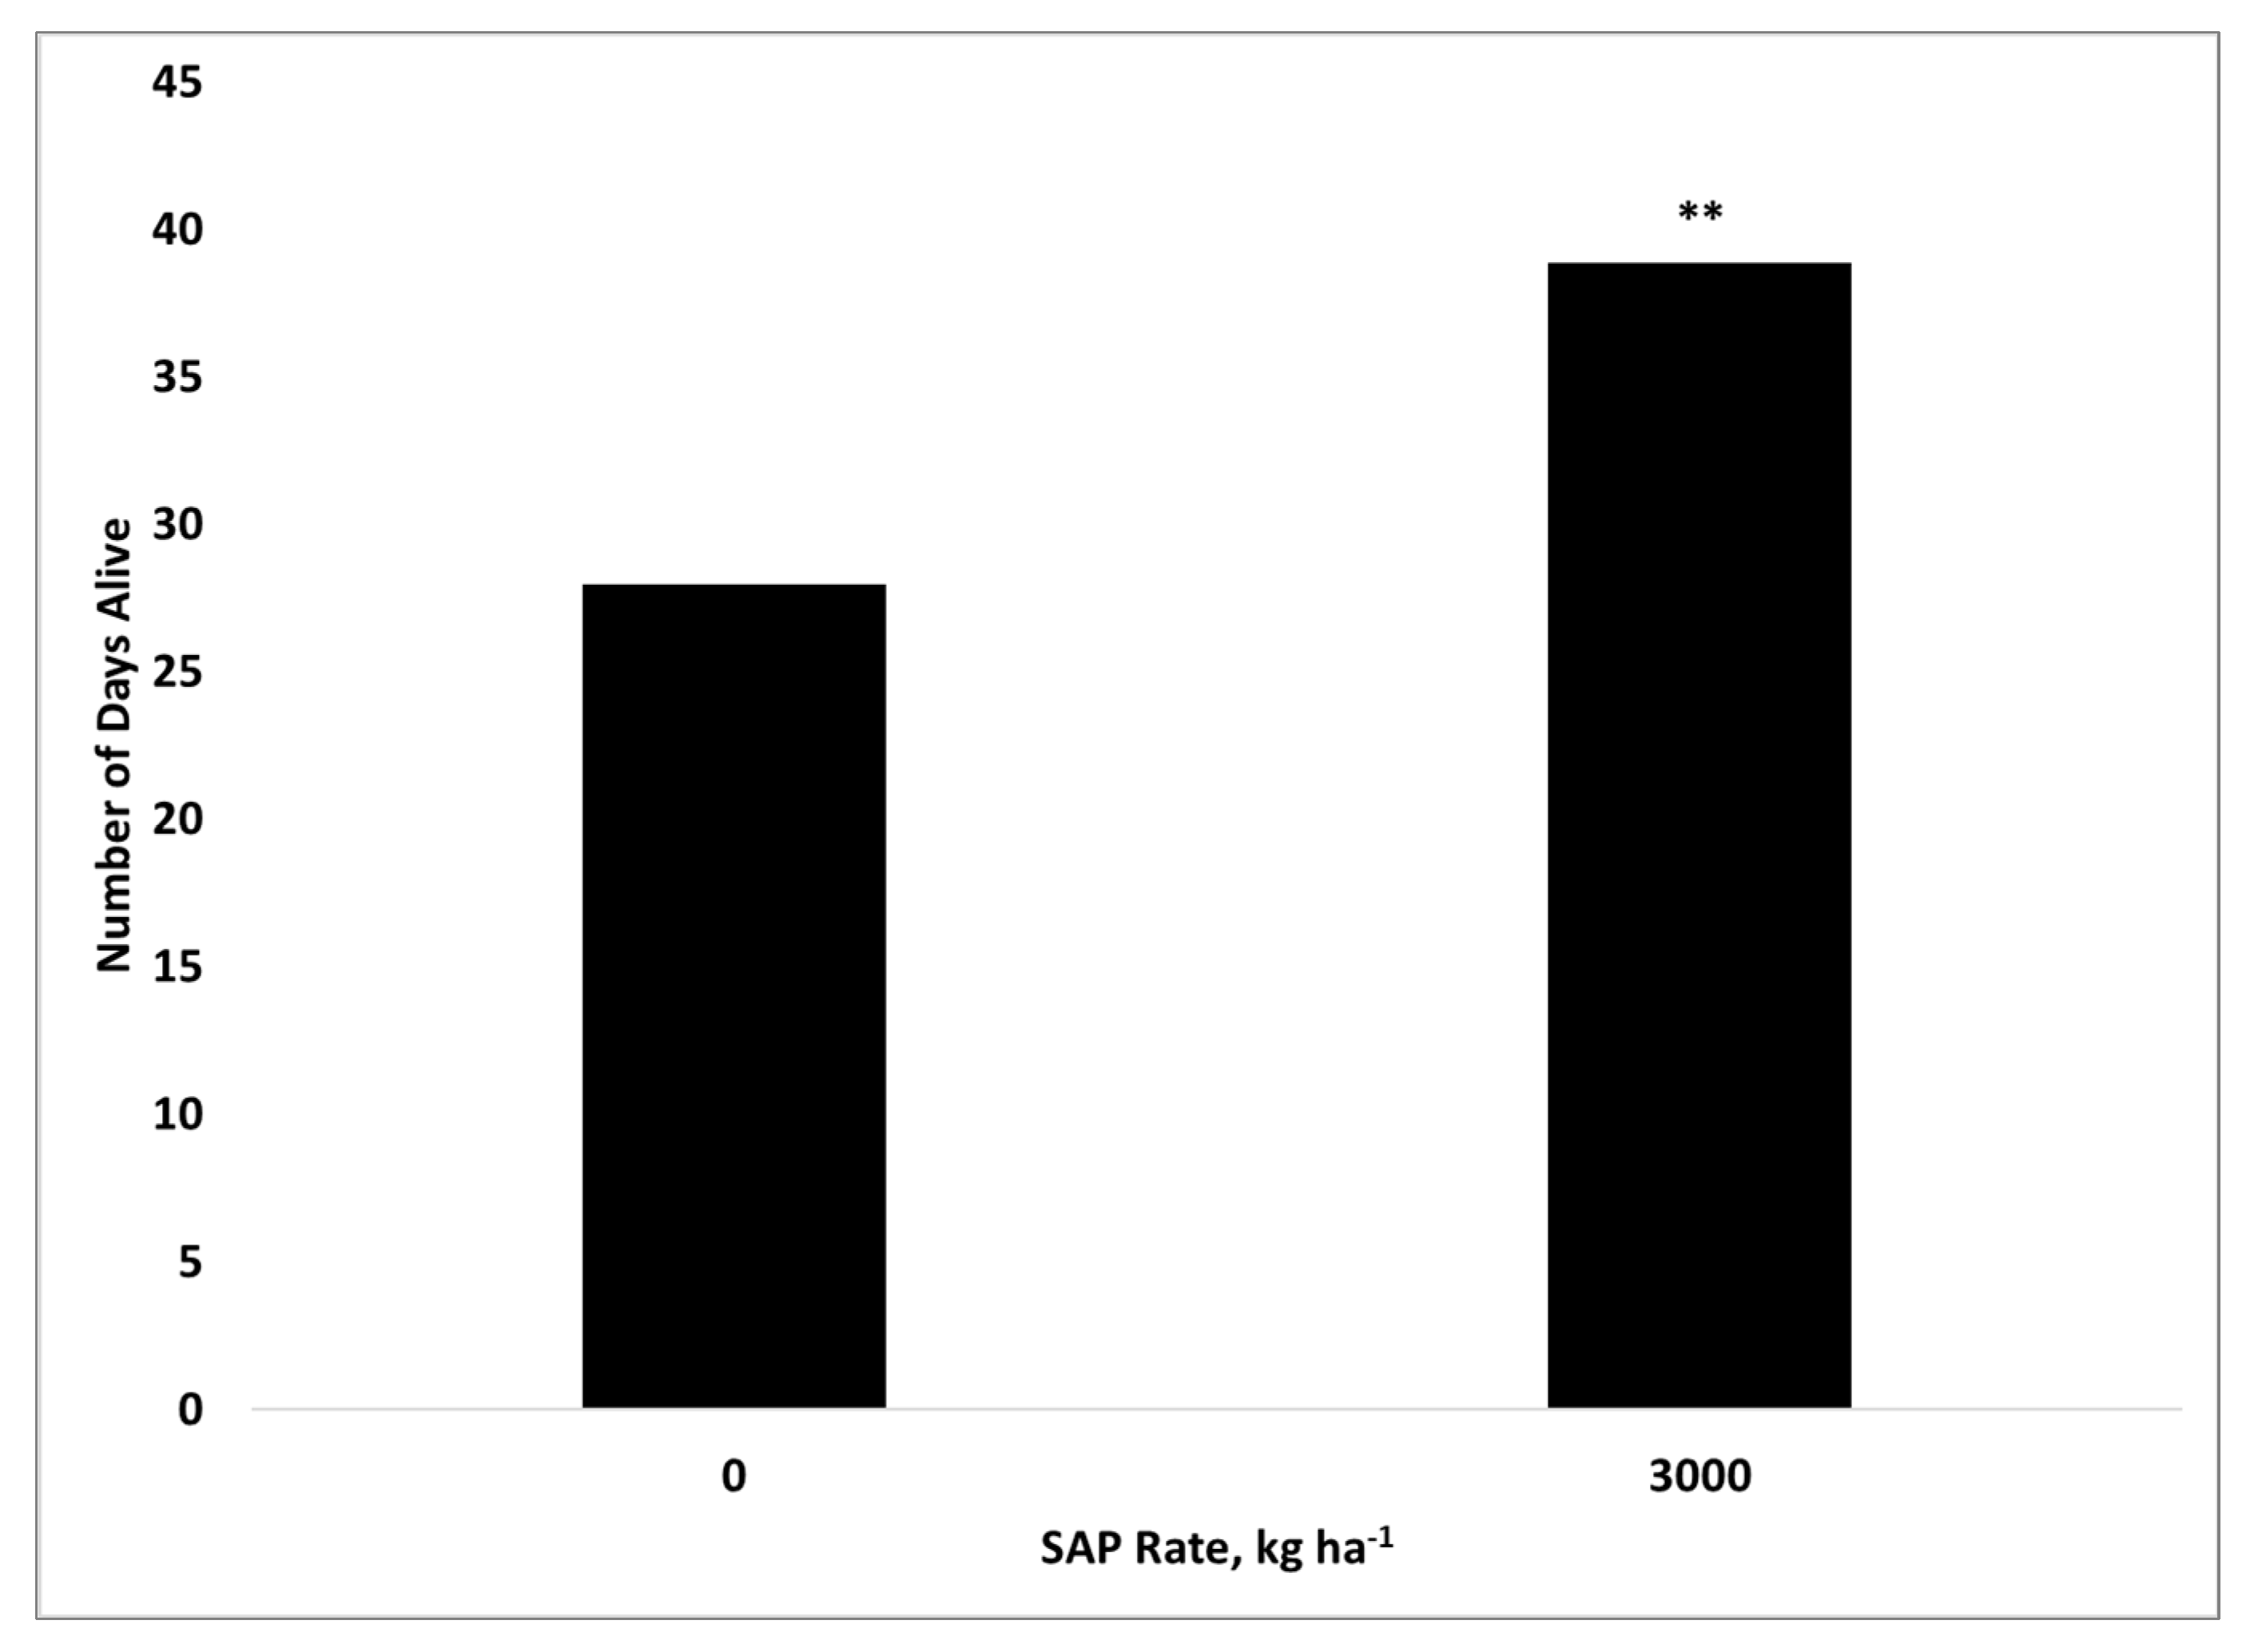
The use of banded SAP in these studies resulted in the same or better seedling longevity and/or persistence without any apparent negative impact on rooting. Significant longevity increases were measured at times, but only consistently at the highest rate of 3000 kg ha−1 and only at placement depths of 8 and 15 cm, where the highest soil moisture was also measured. Despite soil cracking and subsurface voids, there was no negative impact on longevity at either the 1500 or 3000 kg ha−1 rate at any placement depth. When it was measured, we found no effect on seedling emergence, longevity, shoot or root biomass, shoot:root ratio, or root growth.
There has been very little research done on the effects of placing SAP in a concentrated band in the soil on plant growth, but it may have a positive impact. El Asmar et al. [35] found similar longevity results which they attributed to the creation of soil water reservoirs in banded SAP. They applied SAP in clay (C) and sandy clay loam (SCL) soils at rates of 0.1, 0.2, 0.3, and 0.4% (approximately 1700–7100 kg SAP ha−1), either mixed with the soil or placed in bands 25 cm below the soil surface to pine (Pinus pinea) seedlings. They found an increase in seedling survival time with SAP rates of 0.2 and 0.4% when placed in bands. There was no difference relative to the control when the SAP was mixed in the soil. They also found increased corn shoot fresh and dry weights when the same SAP rates were banded and placed at a depth of 15 cm, but not when the SAP was mixed into the soil. We found no clear influence of SAP band application on plant height but did see an increase in the number of blades per plant. The extreme drought conditions of our studies prevented the seedlings from developing into mature plants. However, the increased blade count indicates the possibility that an increase in above-ground biomass may have resulted if they had persisted.
Other works have demonstrated that SAPs, in general, do have a positive impact on plant growth [25,42,43,68,69]. Lucero et al. [43] used both starch- and acrylic-based SAPs and found a significant effect on leaf biomass and area in black grama grass (Bouteloua eriopoda), another long-lived, warm-season rangeland grass species. Additionally, Hüttermann et al. [42] reported pronounced growth of Aleppo pine (Pinus halepensis) seedling shoots and roots under drought conditions with Stockosorb K 400 mixed into the soil at a concentration of 0.4% (w/w approximately 7000 kg ha−1). Rezashateri et al. [25] found similar results in a containerized study of wormwood (Artemisia sieberi), a variety of sagebrush, with three different SAPs, including one from Stockosorb, at rates of 5 and 10 g kg−1 soil (or approximately 1800–3700 kg SAP ha−1). Yang et al. [69] found that SAP rates between 30–45 kg ha−1 increased biomass, grain number, and yield in corn grown in low-rainfall conditions. Coello et al. [68] found that Aleppo pine growth generally increased with increased SAP application but noted a saturating effect.
Reducing the banded SAP rates below 1500 kg ha−1 in these studies did not impact seedling longevity compared to the control. This is in contrast to Johnston and Garbowski [70], who documented benefits to perennial grass establishment in field studies with in-season irrigation and application of two SAPs (Luquasorb 1280 RM and Tramfloc 1001) at rates of 310 and 450 kg ha−1 blended with the seed. This contrast could be due to different SAPs, higher soil moisture, field conditions, and direct seed placement in their study. The swelling of the dispersed SAP and any resulting soil cracking or subsurface void formation would also have been diffused across the planting area.
Root growth affects seedling establishment [25,26,71]. This may be especially true for seeded native species competing with invasive annuals in arid conditions [26]. We saw no SAP influence on any seedling root parameters for the first 7 weeks (approximately 20 cm) of growth of bottlebrush squirreltail and Siberian wheatgrass in the SAP Depth and Root Growth study. In contrast, Garbowski [72] saw higher root mass fraction in a field study using the same SAP as in our studies but at rates of 250 kg ha−1 and blended to a depth of 10 cm. The increase in root mass was dependent on other treatments such as ambient precipitation and increased cheatgrass presence. Rezashateri et al. [25] found increases in sagebrush root dry weight and root/shoot ratio with all tested SAPs and irrigation levels in sandy loam soil. Some treatments, including Stockosorb at 10 g kg−1 (4000 kg ha−1) at 75% average irrigation rate, resulted in increased root length, perimeter, area, and volume. Bandak et al. [62] saw an increase in root length and weight of rain-fed wheat with the application of the superabsorbent polymer A200 SAP. Zhou et al. [66] found shorter roots with more surface area in an irrigated summer maize (Zea mays) using organic–inorganic composite superabsorbent polymers, which are SAPs incorporating inorganic materials such as clays. Hüttermann et al. [42] found that the growth of Aleppo pine root tips stopped during water stress, but in the presence of SAP, the adventitious and side roots were able to continue to grow.
Our contrasting results may be a function of the length and the severe drought conditions of our studies. The impact of SAPs on seedling survival is diminished over multiple growing seasons [4,36,72]. This could be a function of the degradation of the product [39] or the plant roots growing beyond the placement location. Our trials were too short to observe SAP degradation, but we did not find any difference in root growth to and through SAP bands compared to the control in our study. However, the use of SAP has been shown to increase soil moisture in this and other studies, which may positively impact seedling survival in the short term [35,42,43,68,70].
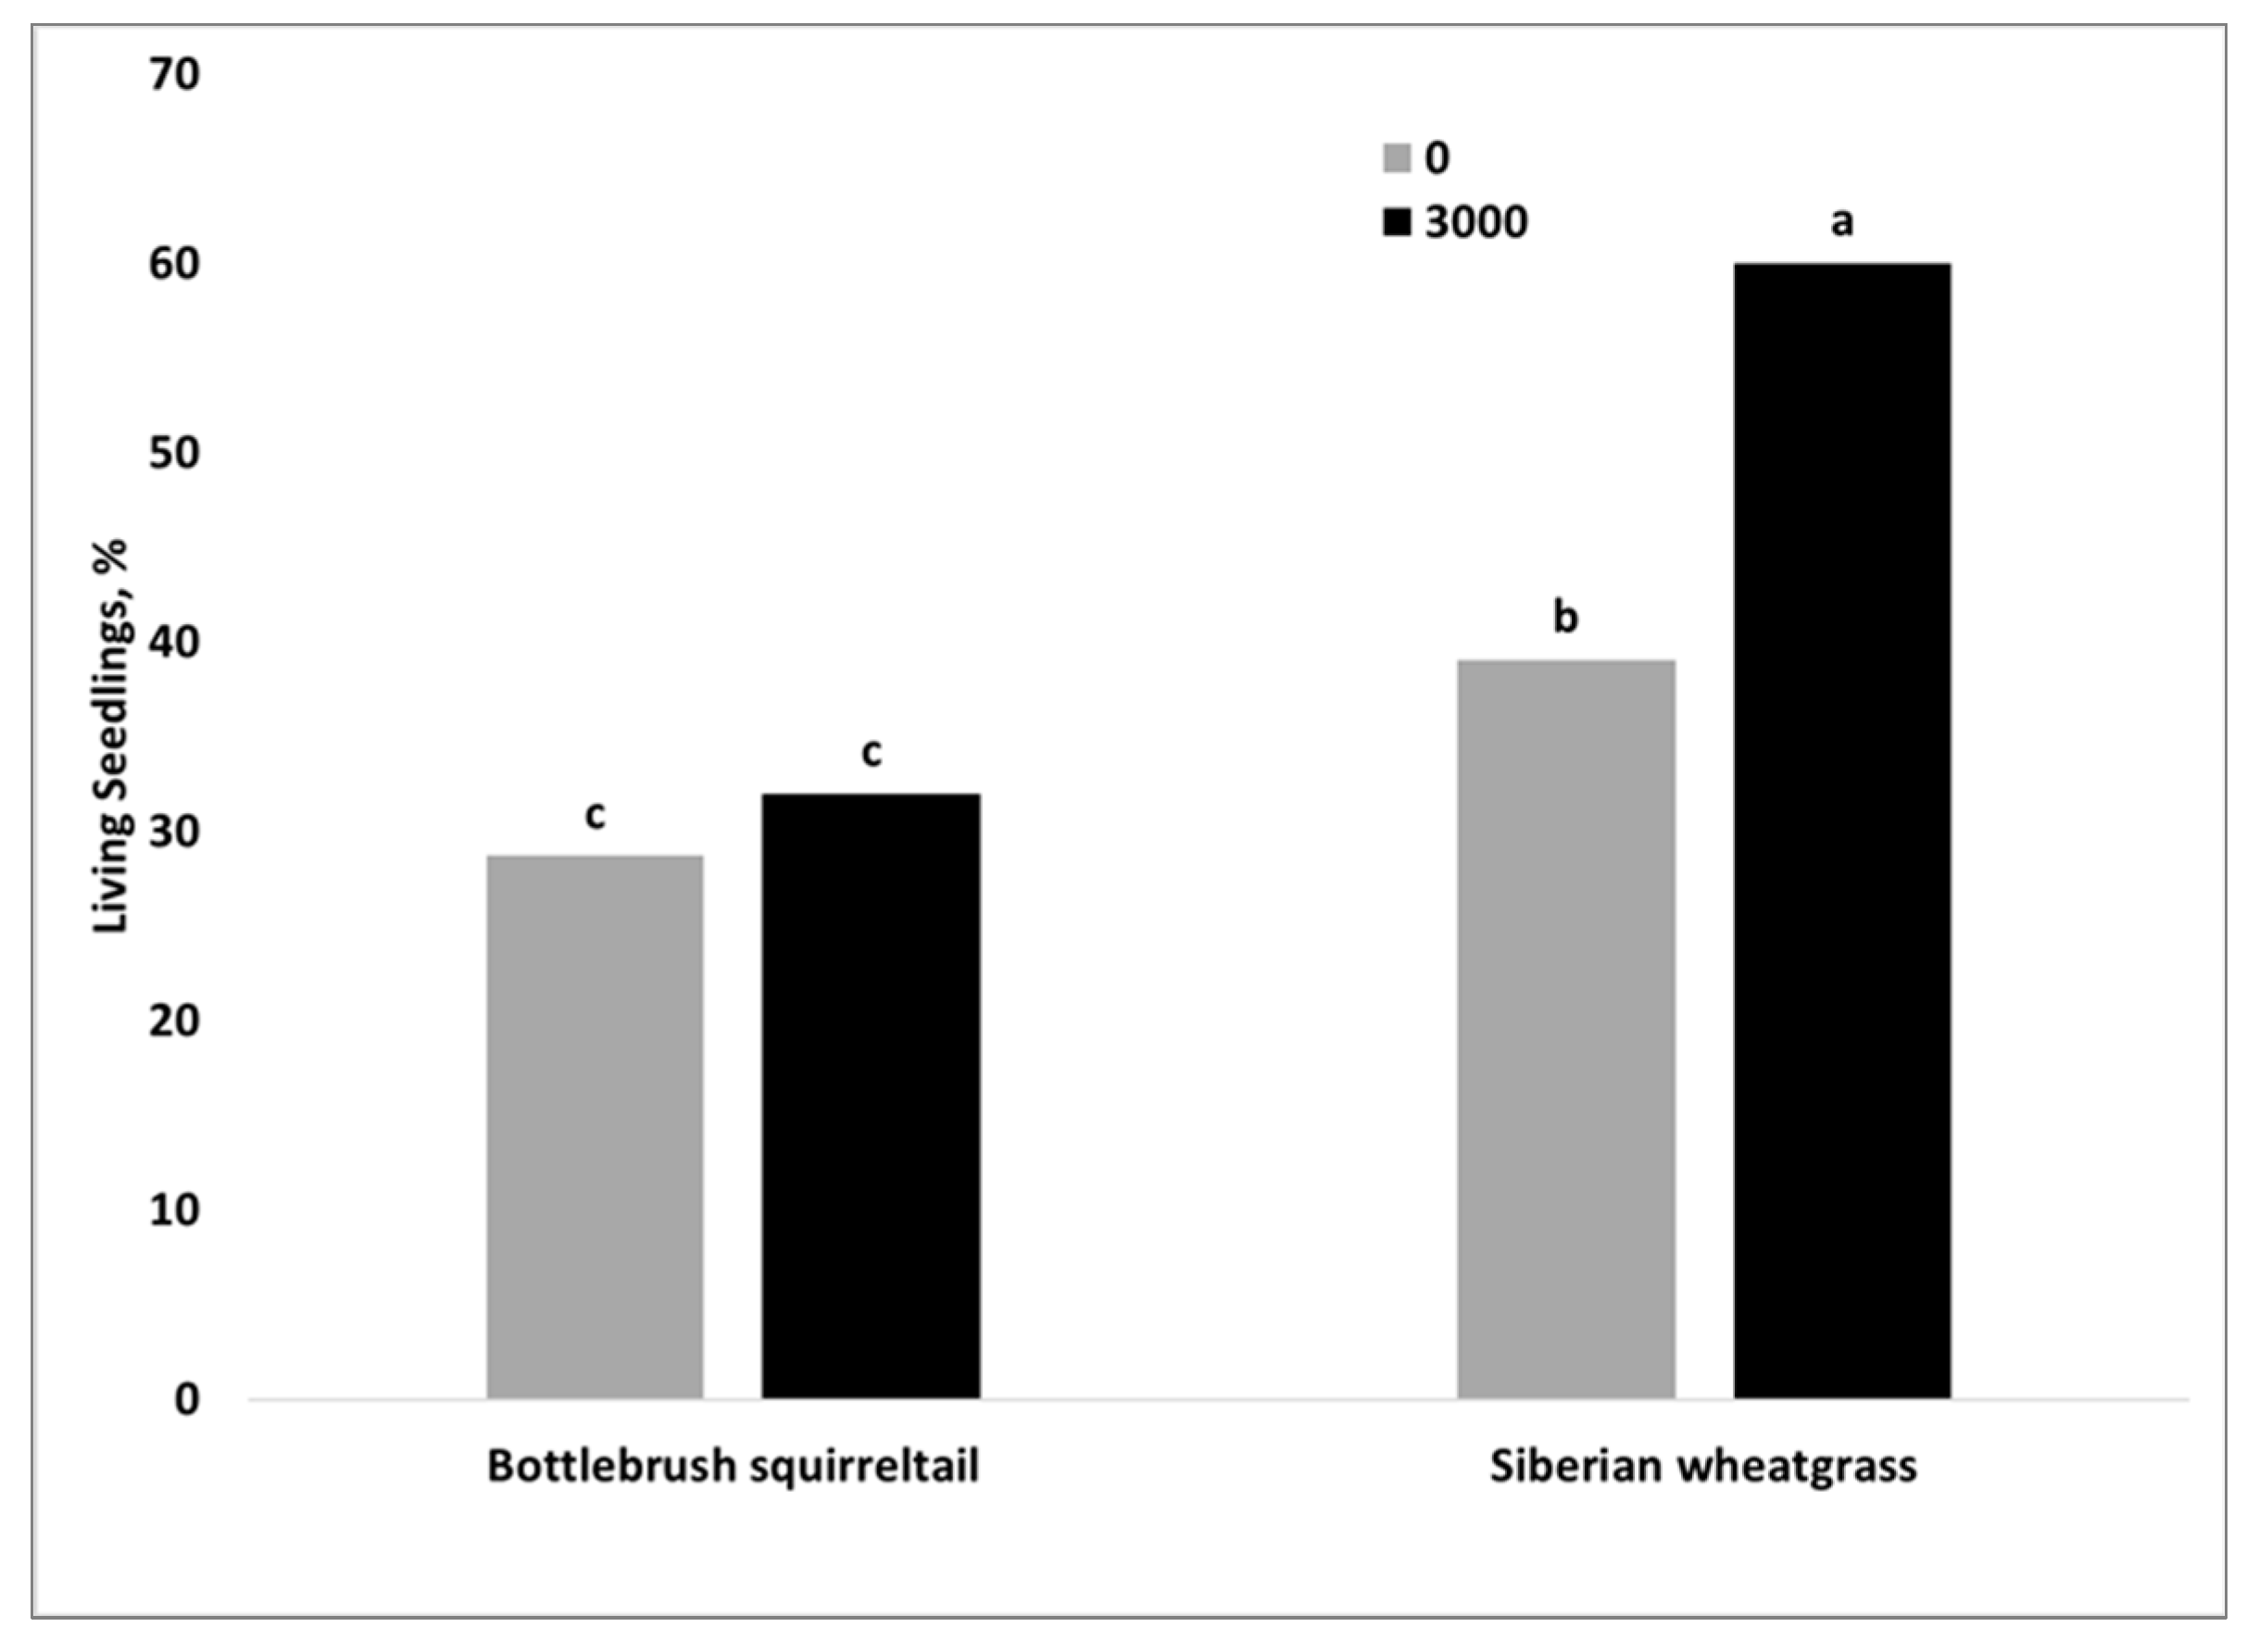
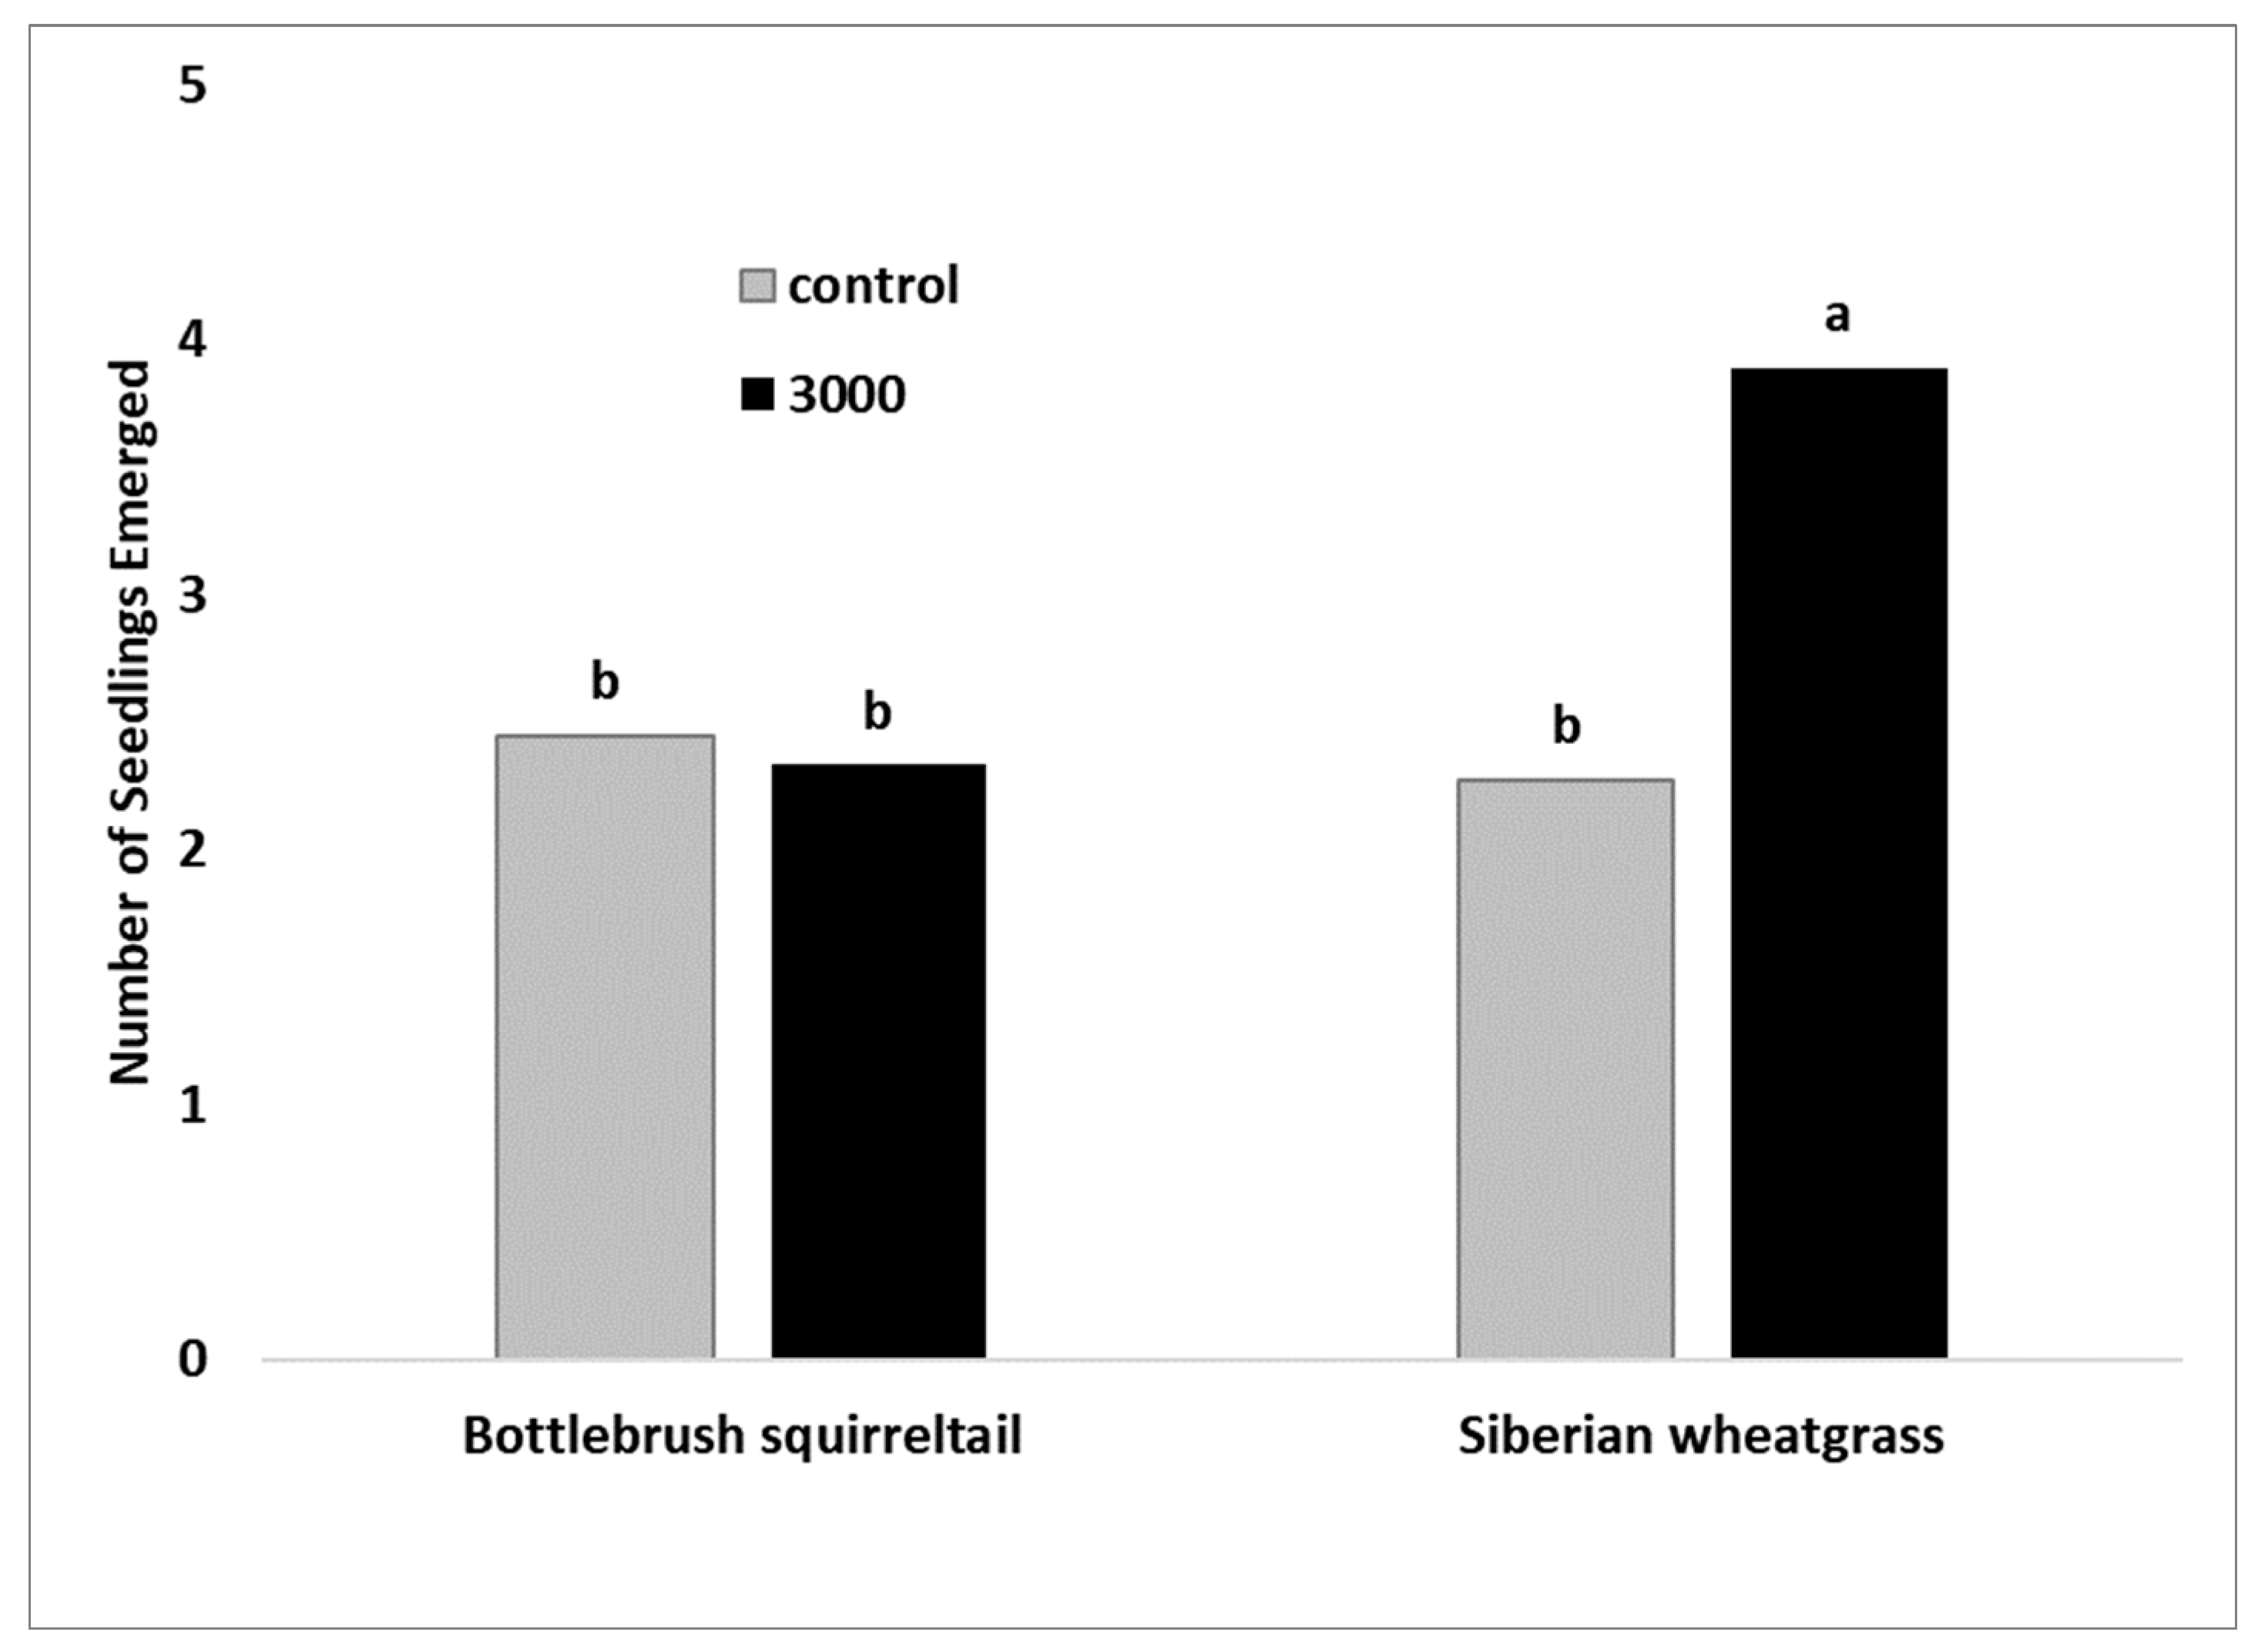
Some differences were observed between species in these studies, with Siberian wheatgrass responding more favorably to SAP than bottlebrush squirreltail. The number of days to emergence was not affected by SAP treatment in any study where it was measured. In most studies, the number of seedlings emerged was also not impacted. However, the number of Siberian wheatgrass seedlings that emerged was increased 1.6 times with SAP treatment in the Fertilizer study. Siberian wheatgrass persistence increased with SAP application in the Reduced Seeding Rate study. Bottlebrush squirreltail trended in the same direction, but this trend was not significant. This is similar to Minnick and Alward [4], who found that Aquasorb (Ark Enterprises, Warsaw, MO, USA), a cross-linked Na-polyacrylate SAP, increased survival of rubber rabbitbrush (Ericameria nauseosa) but not big sagebrush (Artemisia tridentata) or four wing saltbush (Atriplex canescens). The effects may be varied for different types of grasses as well. More research is needed to determine species that may benefit from banded SAP use more than others.
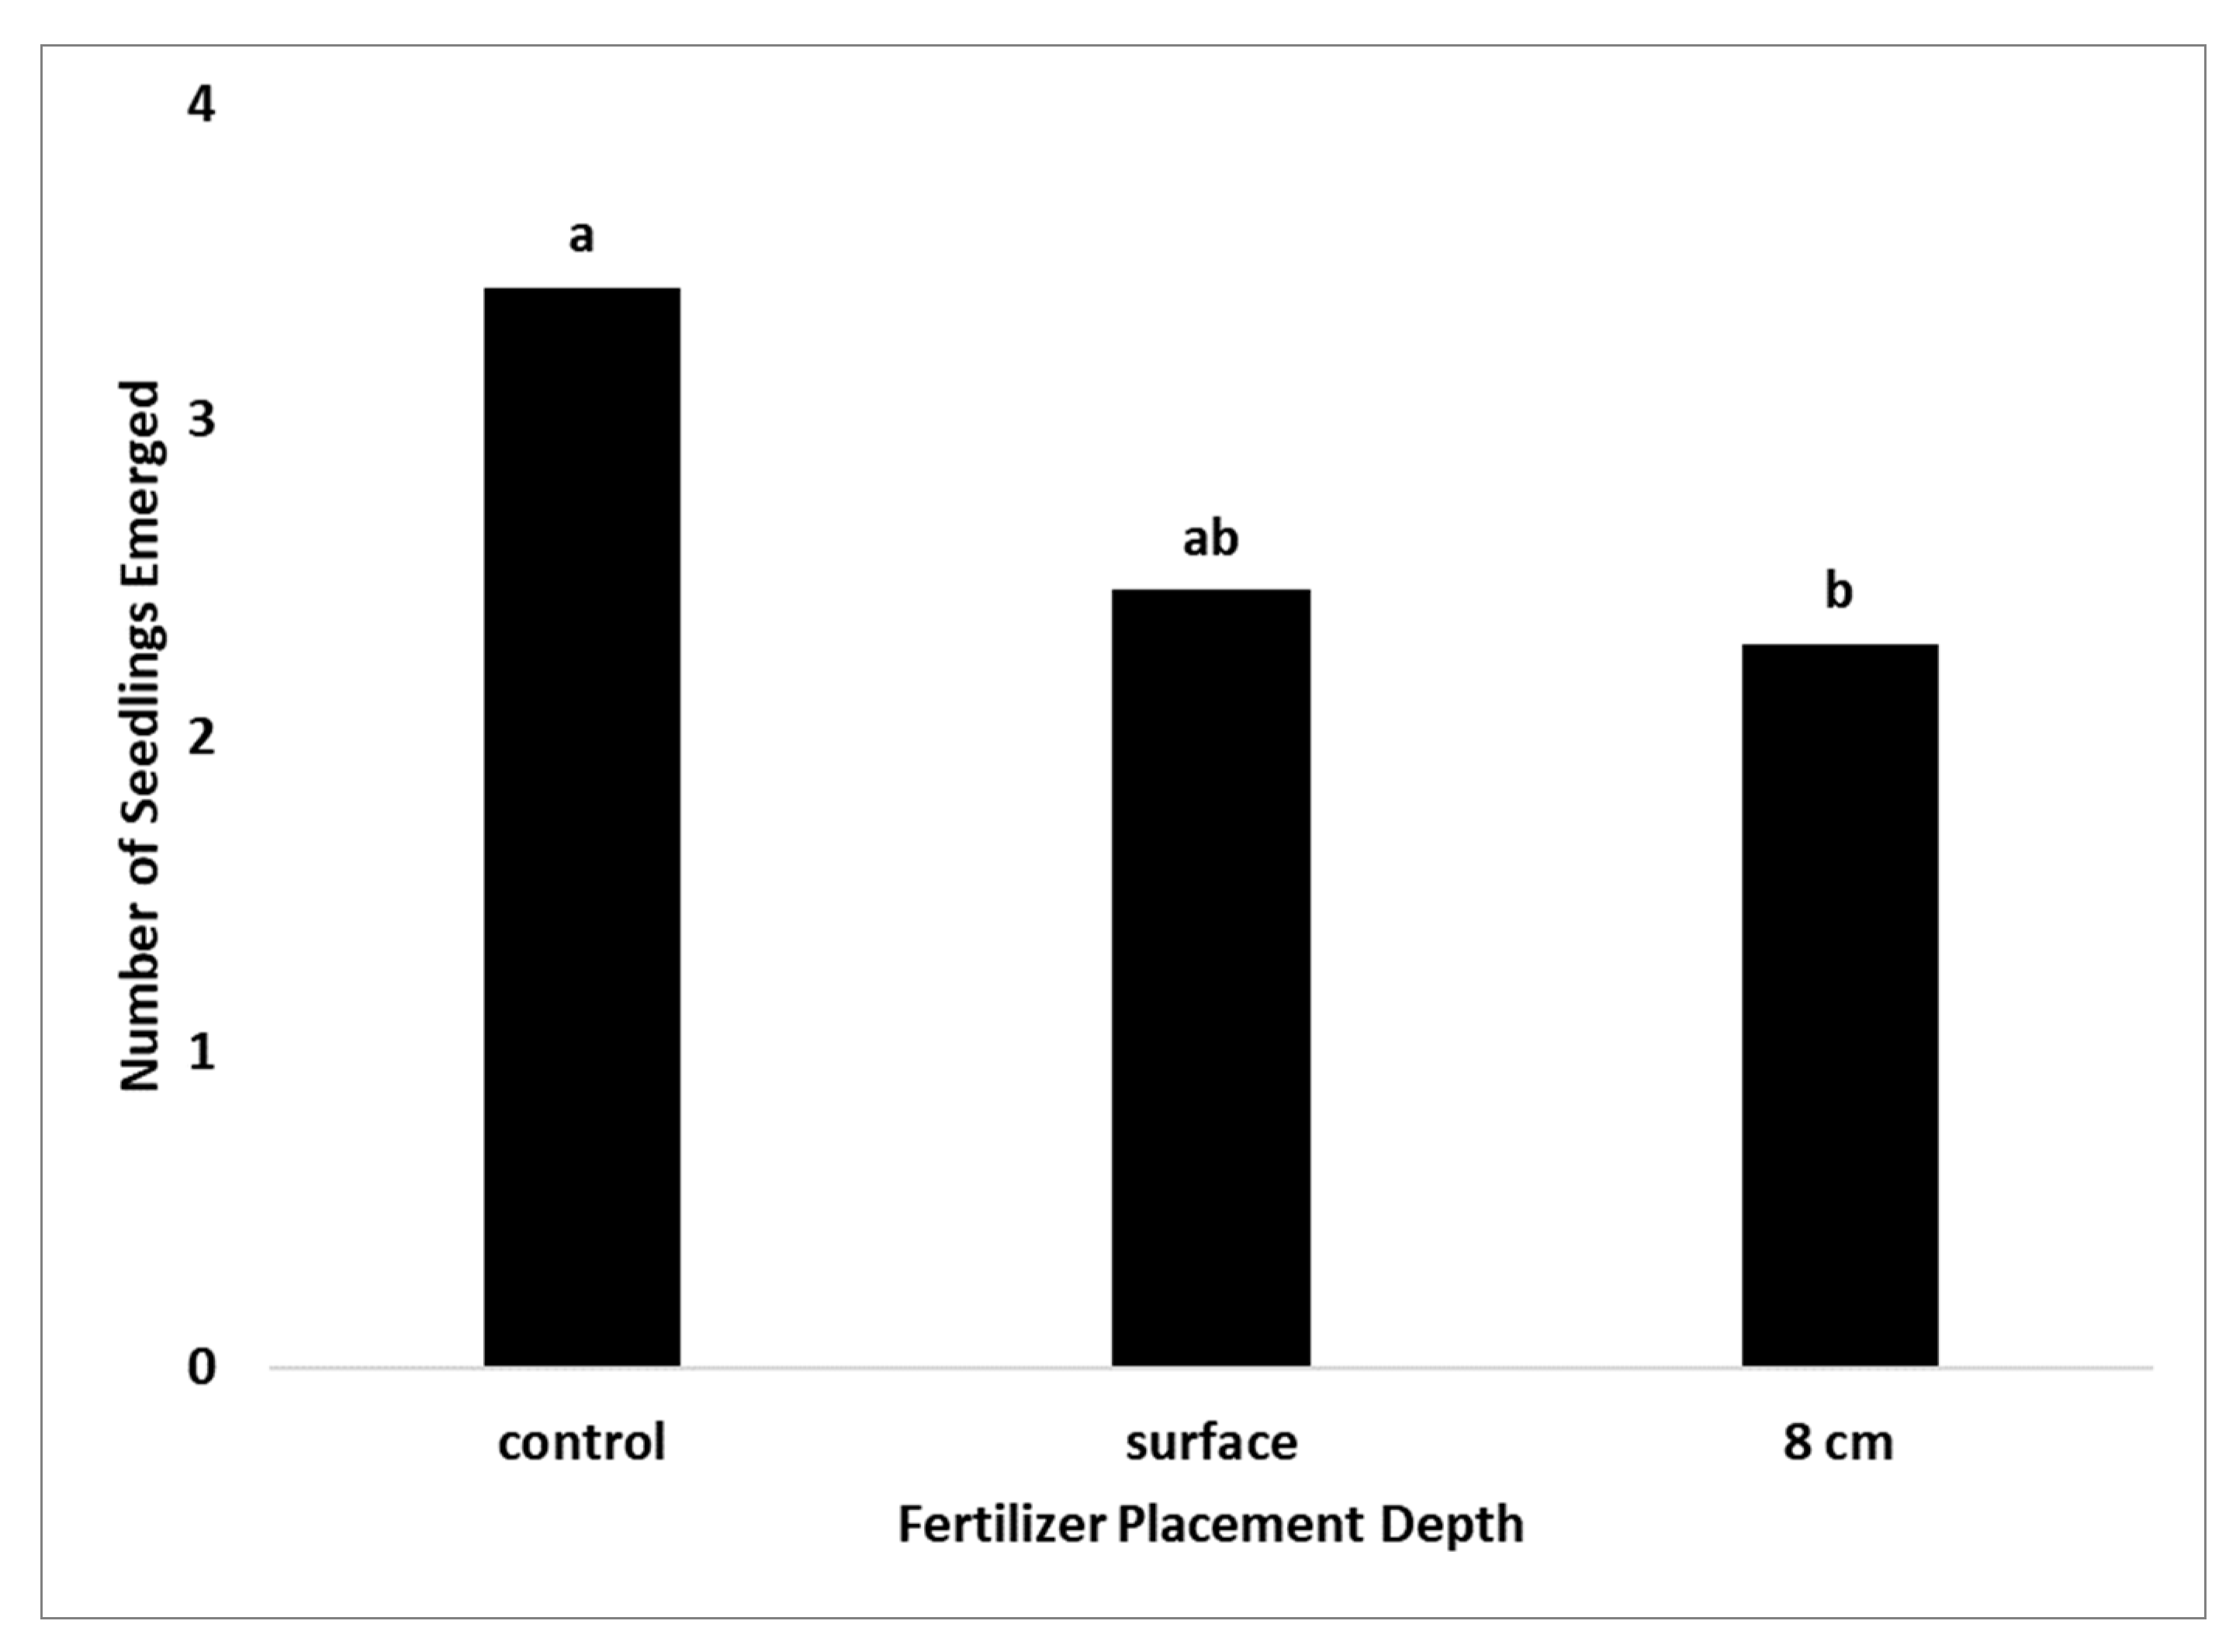
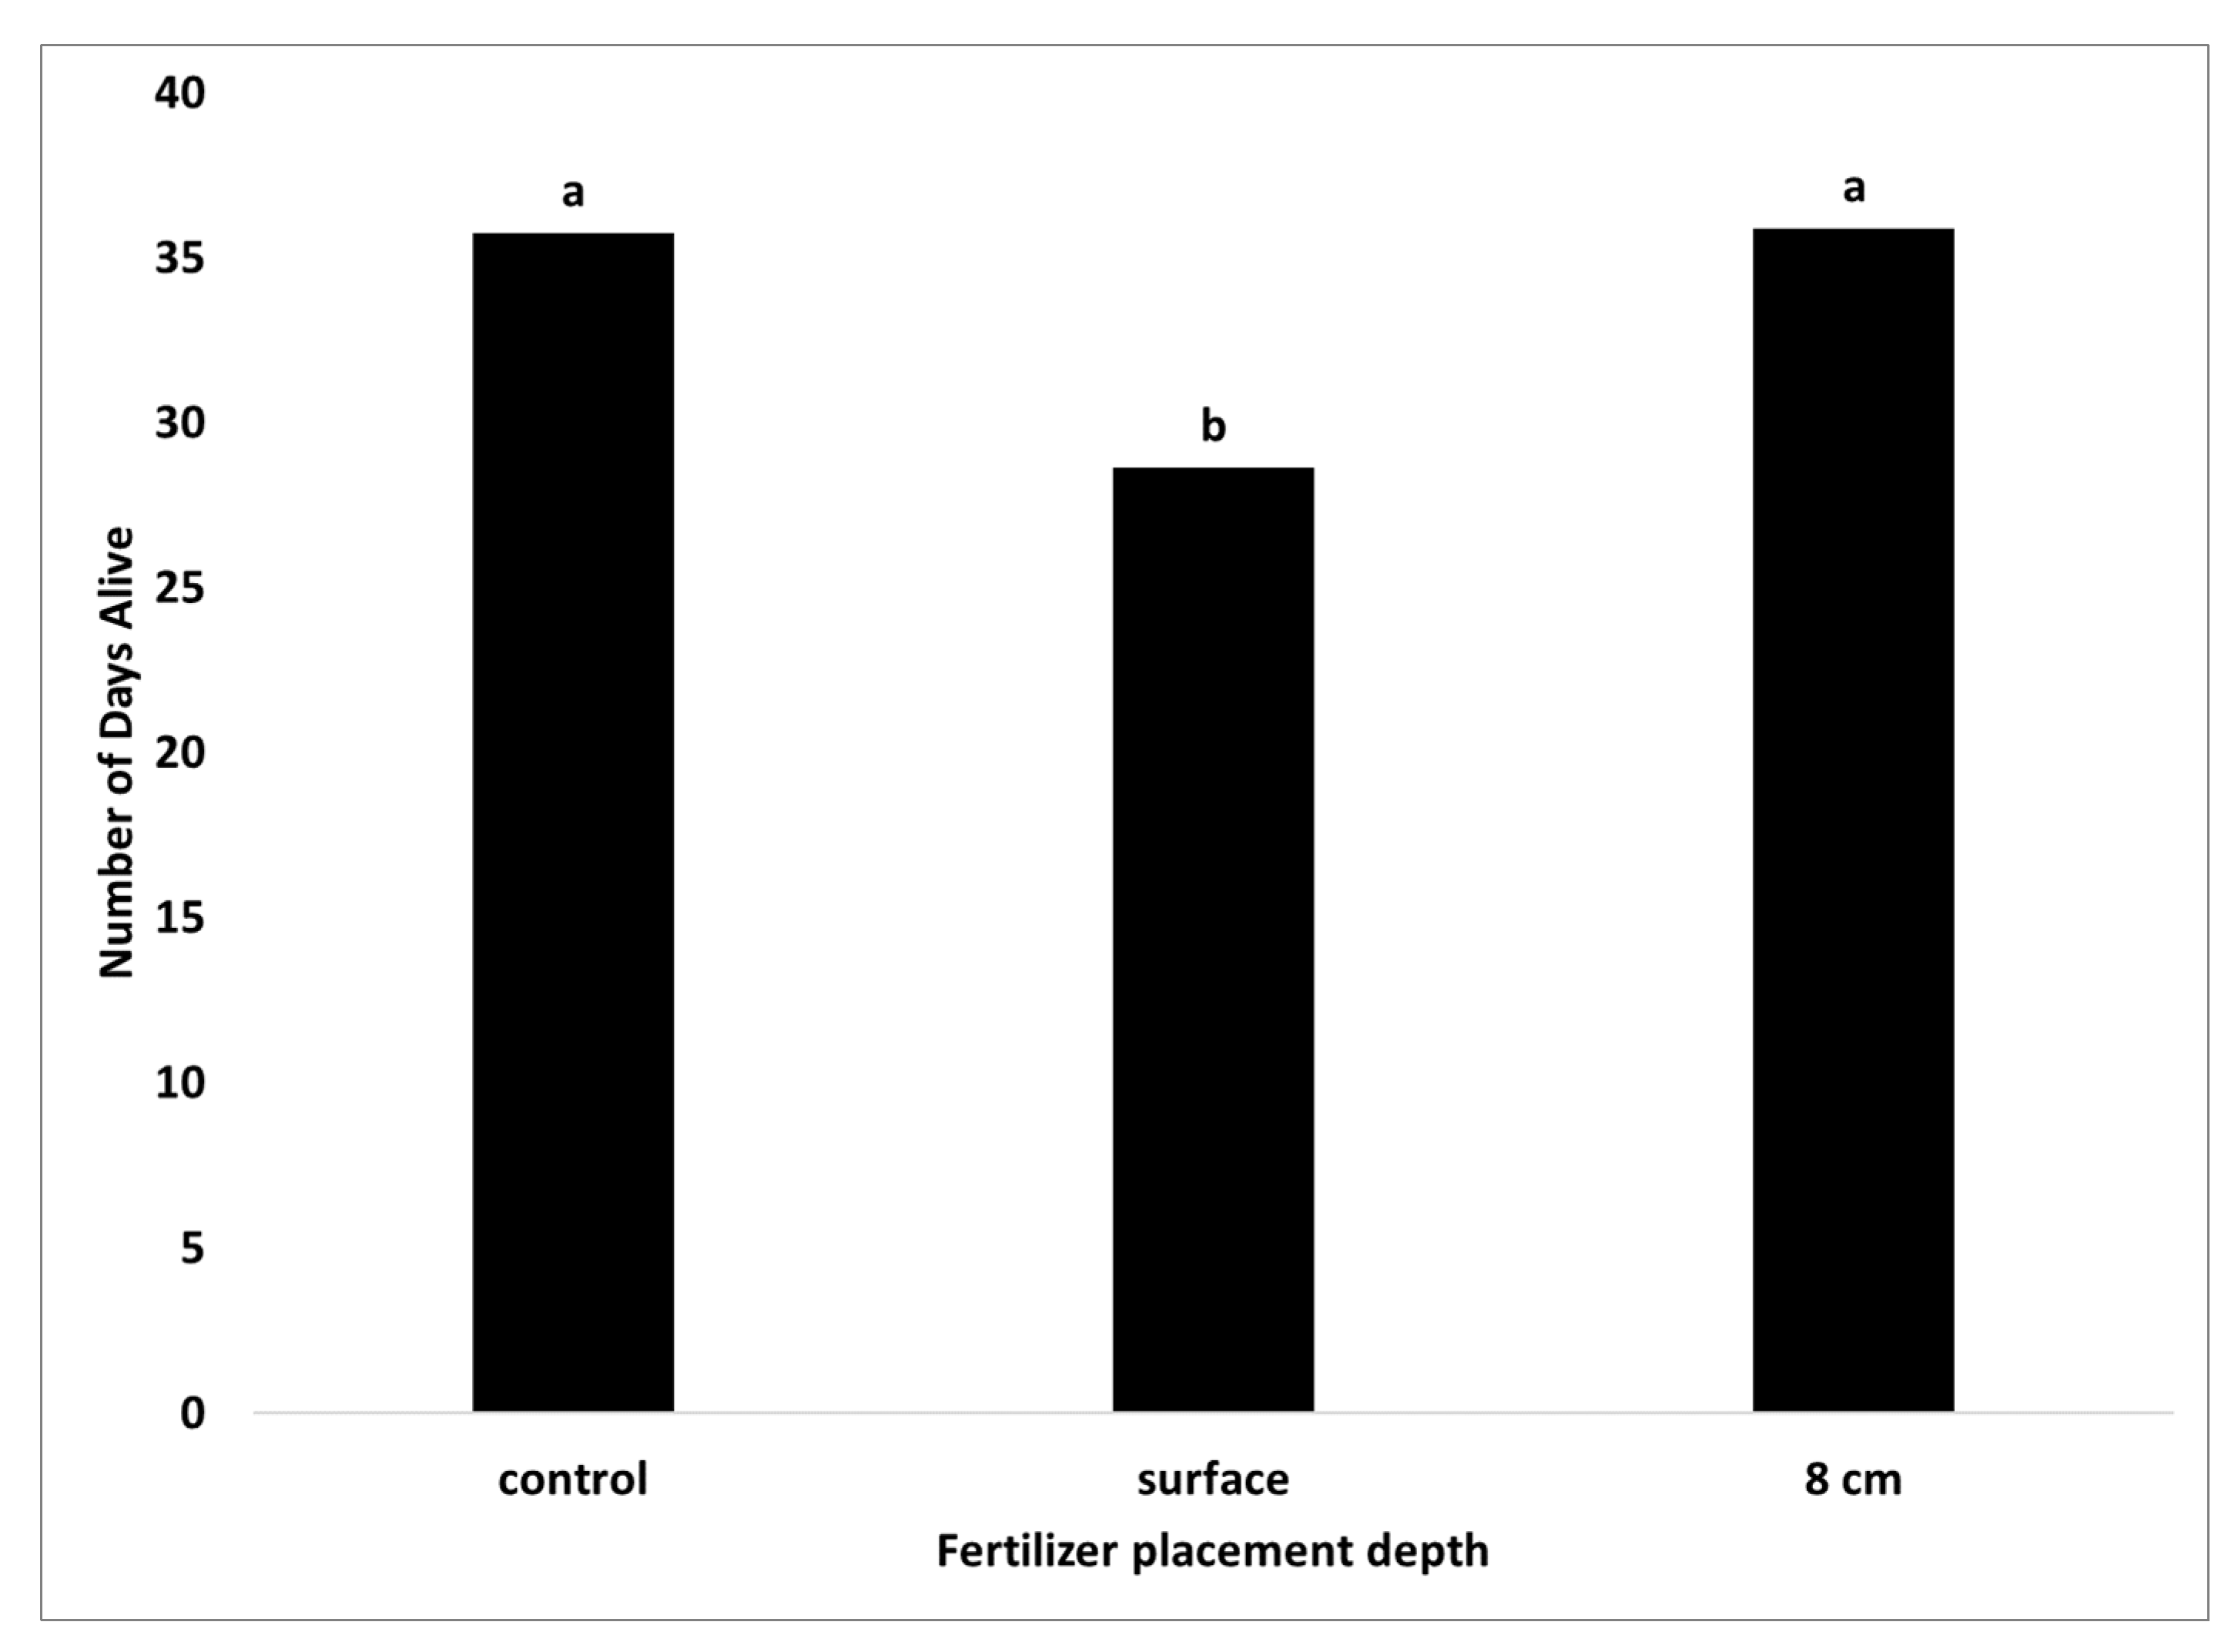
Though SAPs are reported to hold fertilizers in place to increase plant access and growth [27,73], we found the use of a low-N fertilizer, with or without SAP, had no positive impact on seedling emergence or longevity. In fact, application of the fertilizer at a depth of 8 cm negatively affected the number of seedlings that emerged, but not their longevity. This was despite an increase in soil moisture when SAP was also present at that depth. Applying the fertilizer at the soil surface negatively impacted seedling longevity but did not impact soil moisture. The use of fertilizers has been shown to negatively impact seedling establishment in restoration efforts in arid regions [74,75]. It is possible that rangeland species that have evolved in harsh conditions without additional nutrition inputs could be negatively impacted if SAPs held not only water, but also increased nutrient concentrations near their roots [40,56].
Drought severity may impact the effectiveness of SAP. In a containerized study using Aleppo pine, Del Campo et al. [76] found that three SAPs (Aguaspon, Stockosorb, and Terracottem) mixed into the soil at rates of 0.01 and 0.1% (180–1800 kg ha−1) were effective in moderate drought conditions, with effects diminished at suction tensions higher than 30 kPa. This would indicate that the effects of SAPs diminish beginning at about field capacity, much wetter than the dry soils in these studies or those found in the field during the summer. Garbowski et al. [72] reported no establishment effects on first-year field-grown rangeland seedlings under drought conditions, in contrast to positive effects in the deficit-irrigated agriculture condition. They suggest there may be a soil moisture threshold for positive effects on soil moisture content. Their SAP application rates were 1/6–1/12 those used in these studies, and higher rates could allow for higher moisture holding capacity. Rezashateri et al. [25] found that higher rates of SAP, 10 g kg−1 compared to 5 g kg−1 (or approximately 1800–3700 kg SAP ha−1), had a greater impact on the growth of wormwood at 75% of the normal precipitation rate than 100 or 150% applied every 30 d to simulate natural precipitation patterns. In contrast, most of our studies were conducted under what should be considered severe drought conditions. It is entirely possible, though unlikely, that no further moisture inputs would occur during a growing season in the Great Basin. If the SAP was present and could increase soil moisture enough to allow seedlings to survive to the next precipitation event or allow the seedling roots to grow deep enough to find moisture lower in the soil profile, it could greatly impact seedling establishment rates. The benefits would need to be balanced against the need for higher SAP rates to capture and retain enough soil moisture as well as possible soil cracking and seedling death due soil displacement by swelling higher SAP rates.
Severe drought conditions may also explain why we did not see an impact on seedling longevity or other growth parameters when the SAP was mixed in the soil. The effects of mixing SAP into the soil were measured in only two of our studies. In the SAP Rate and Depth study, we observed a significant increase in soil moisture over the duration of the study but no increase in seedling longevity. This could be due to the trial conditions. SAPs have been used in agriculture when mixed in the soil to reduce the number of irrigations needed [32,33,34]. They have also been shown to increase seedling growth in rangeland applications when mixed into the soil [36]. In each of these situations, there are at least occasional additions of water through irrigation or precipitation. In our studies, the soil and SAP were saturated once and then allowed to dry down. No additional water inputs after initial saturation would have greatly increased the drought severity over the course of the studies relative to field conditions.
The utility of SAP use for seedling establishment will likely vary depending on location and project. Precipitation, temperature, terrain, and site size are just some of the factors that determine restoration success generally and SAP feasibility specifically. Priced between USD 5.00–6.18 kg−1 (USD 2.27–2.80 lb−1) (Ken Aguilar, Global Plastic Sheeting, San Diego, CA, USA; personal communication (2017); Scott Mecom, Creasorb, Omaha, NE, USA; personal communication (2017)), the cost per kg of Stockosorb 660 micro is low relative to restoration seed mixes. Seed budgets for reseeding projects in the Great Basin run between USD 185–865 ha−1 (USD 75–350 acre−1), with the average falling between USD 370–500 ha−1 (USD 150–200 acre−1) (Josh Buck, Granite Seed, Lehi, UT, USA; personal communication (2018)). To increase the likelihood of seeing a response, SAP was used in these initial studies at rates ranging from 11 to 3000 kg ha−1. At these rates and prices, the cost for Stockosorb 660 micro would range from USD 55–18,500 ha−1.
There are several mitigating financial factors to consider, however. It may be possible to procure SAP at a lower price if purchased in very large quantities. The soil in these studies only received one saturating irrigation at the time of planting. Having the ability to reabsorb water during multiple precipitation events, lower amounts of SAP may be required to increase establishment in the field. If used in a band, the SAP must be buried in the ground, presumably with an attachment to a range drill. As such, it may only be used with species and in areas with terrain and slope that permit that seeding method or something similar, limiting the amount needed to be purchased. Improved establishment rates could reduce the amount of seed, and thus the cost, needed each year. If establishment rates are successfully improved, the need and cost to reseed the same area multiple times may also be reduced or eliminated. Rather than being used on the entire reseeding area, SAP could be used facilitate assisted succession. Bio-islands or green firebreaks of established perennial grasses could provide a free seed source, invasive species control, fire protection, and erosion reduction for the larger landscape, allowing other species to establish. Invasive weed and fire suppression provided by perennial grasses could also help reduce the overall restoration costs for the site by reducing the amount of money spent to manually, chemically or mechanically do the same. Once SAP effectiveness is demonstrated in the field, future studies should be done to evaluate the SAP effect on establishment in the field, determine best SAP and seeding rates, and determine species best suited to SAP use to improve the seedling establishment rate while lowering restoration costs.

5. Conclusions

We found that when mixed with the soil or placed in bands, moisture in the soil was increased at SAP rates of 1500 and 3000 kg ha−1 for up to 7 weeks under glasshouse conditions. We found seedling longevity improvements under the same conditions in two rangeland species, bottlebrush squirreltail and Siberian wheatgrass, when SAP was placed in bands at a rate of 3000 kg ha−1 at 8 and 15 cm depth. In some cases, we saw inconsistent trends or impacts at lower SAP rates. Soil moisture increased with SAP bands placed more shallowly, but seedling longevity was not impacted. However, at the high SAP rates, we observed soil cracking and the creation of subsurface voids which could impair soil moisture. Fertilizer placed in the SAP band increased soil moisture, but there was no benefit to seedling longevity. Generally, the two species responded differently to the presence of SAP, but there were some similarities. Further research should determine which species would benefit most. Because these are preliminary data from a glasshouse study, future work should evaluate banded SAP use under field conditions. The low cost of the SAP relative to the cost of seed makes it an appealing option in rangeland restoration. However, swelling SAP at high rates displaces soil, and lower rates do not seem to provide enough increase in water holding capacity within the soil to affect seedling establishment. Targeted applications where deeper band placement is possible could counteract the soil cracking. As such, banded SAP is potentially a better option to establish bio-islands or green firebreaks rather than as a general application.

Author Contributions

Conceptualization, B.G.H. and S.V.N.; methodology, B.G.H. and S.V.N.; validation, S.V.N.; formal analysis, S.V.N. and D.L.E.; investigation, S.V.N.; resources, B.G.H. and M.D.M.; data curation, S.V.N.; writing—original draft preparation, S.V.N.; writing—review and editing, S.V.N., B.G.H., M.D.M., V.J.A. and N.C.H.; visualization, S.V.N. and B.G.H.; supervision, S.V.N.; project administration, B.G.H. and S.V.N.; funding acquisition, B.G.H. All authors have read and agreed to the published version of the manuscript.

Funding

This research was funded by the United States Army Corps of Engineers, sponsor award number F19AC00962–03.

Data Availability Statement

Data available upon request from the corresponding author.

Conflicts of Interest

The authors declare no conflict of interest.

Appendix A

Table A1. Gravimetric water content (GWC) for bottlebrush squirreltail and Siberian wheatgrass grown in treatments with and without superabsorbent polymer (SAP) at seeding rates of 2, 4, 8, or 16 kg ha−1 (1/4, 1/2, 1, or 2 times the NRCS recommended seeding rate). All treatments were watered only once to saturation and allowed to dry down.
Bottlebrush SquirreltailSiberian Wheatgrass
Seeding Rate, kg ha−1
----2--------4--------8--------16--------2--------4--------8--------16----
ctrlSAPctrlSAPctrlSAPctrlSAPctrlSAPctrlSAPctrlSAPctrlSAP
Day
Gravimetric Water Content, %
041.044.642.044.941.344.241.244.042.244.541.243.039.645.342.142.9
236.440.537.740.936.239.937.040.238.040.036.338.835.541.036.639.3
531.234.832.935.530.634.531.834.332.834.630.933.429.335.331.533.8
728.732.530.633.328.432.129.331.930.432.128.431.026.932.829.231.6
926.430.328.431.026.129.726.829.728.229.926.128.624.830.226.729.2
1418.422.119.422.417.321.517.521.320.220.417.720.316.222.318.620.6
1615.619.216.219.514.518.314.518.317.217.214.817.513.519.415.517.6
1913.116.814.017.012.515.812.516.014.615.112.715.111.716.813.315.2
219.713.210.613.29.611.99.412.610.712.09.611.69.012.79.811.7
238.311.18.910.87.810.07.910.69.010.08.19.67.510.68.29.8
267.29.67.79.36.68.87.09.27.78.77.18.36.59.17.18.5
286.89.07.28.56.08.26.58.57.18.16.67.76.18.56.57.9
306.58.56.98.26.27.86.38.26.87.76.47.45.97.96.37.5
335.87.76.37.45.67.25.77.46.17.05.76.75.47.05.66.8
354.96.55.36.24.85.94.86.25.15.94.95.74.65.94.85.6
374.76.25.15.94.55.74.75.94.95.64.65.54.35.64.55.4
404.05.44.35.13.94.54.05.14.24.94.24.73.74.93.94.6
423.74.93.94.73.54.03.64.73.84.43.64.33.44.43.64.2
443.44.63.74.43.33.73.44.43.54.23.44.03.24.13.44.0
492.83.62.93.42.62.72.73.42.83.22.73.22.63.22.83.1
512.73.42.83.22.52.62.73.22.73.12.63.02.53.12.63.0
542.53.02.52.92.32.32.52.92.42.72.42.72.32.82.42.7
562.42.92.52.82.32.22.42.82.42.72.42.62.22.72.42.6
Table A2. Persistence (percent of seedlings alive) for bottlebrush squirreltail and Siberian wheatgrass grown in treatments with and without superabsorbent polymer (SAP) at seeding rates of 2, 4, 8, or 16 kg ha−1 (1/4, 1/2, 1, or 2 times the NRCS recommended seeding rates). All treatments were watered once to saturation and allowed to dry down.
Bottlebrush SquirreltailSiberian Wheatgrass
Seeding Rate, kg ha−1
----2--------4--------8--------16--------2--------4--------8--------16----
ctrlSAPctrlSAPctrlSAPctrlSAPctrlSAPctrlSAPctrlSAPctrlSAP
Persistence, %
Day
40000000000603000
5000000201325253128191625
71301913222834255075567550695066
950382538313836316375567550695369
1250383844315341366375698163725370
1450383850475945526375699469755681
1650383856506348506375759469786181
1950383856506348526375759469786181
2150383844505947525075759469786380
2350383844505947525075759469786380
2650383844505647525075759469786380
2850383844505647525075639469786380
3050383838505347505075569469665377
3350383838505347505075569469665377
3550383838505347505075569469665377
3750383838445042505075318844564273
4050383825345017425075138828563464
42382519191647636387568119501358
442525131313412283863075641542
472525131313412273863075638542
491325666380222550063331539
510130039030380380908
5400000000000190002
560000000000000000
Table A3. Soil moisture with associated p-values for individual dates × superabsorbent polymer (SAP) placement depth × measurement depth. Values within a grouping that are significant (p-value < 0.05) are in bold-face type and have means separated for statistical significance. Values not sharing the same letter(s) are statistically different from one another.
Days after Planting04132027344150
SAP depth
3 cm measurement depth
control36.0 g31.9229.44.620.615.513.4
3 cm35.9 g30.418.910.26.32318.213.3
8 cm36.6 fg31.721.412.44.219.814.813.5
mixed34.8 g29.719.110.54.819.416.813.8
5 cm measurement depth
control38.3 ef36.430.119.213.517.412.810.6
3 cm38.3 ef34.827.919.115.220.916.411.4
8 cm38.4 def35.328.919.11120.815.610.5
mixed39.2 cde36.529.51912.820.515.59.9
8 cm measurement depth
control39.9 cde37.731.5423.416.818.314.111.7
3 cm39.2 cde3732.623.718.722.618.312.5
8 cm40.1 bcd37.731.720.713.320.415.411.8
mixed39.5 cde37.530.222.616.721.917.412.5
10 cm measurement depth
control42.6 a39.633.825.719.119.115.110.2
3 cm39.5 cde37.534.625.921.121.914.510.5
8 cm40.6 bc38.633.424.519.921.815.310.9
mixed41.7 ab38.932.224.917.820.616.313
p-values<0.0010.5140.2190.2210.1280.1590.4910.586

References

  1. Warren, S.D. Perceptions and History of Rangeland. In Northeastern California Plateaus Bioregion Science Synthesis; Gen. Tech. Rep RMRS-GTR-409; Dumroese, R., Moser, W., Eds.; US Department of Agriculture, Forest Service, Rocky Mountain Research Station: Fort Collins, CO, USA, 2020; pp. 45–47. [Google Scholar]
  2. Kennedy, J.J.; Fox, B.L.; Osen, T.D. Changing Social Values and Images of Public Rangeland Management. Rangelands 1995, 17, 127–132. [Google Scholar]
  3. Davies, K.W.; Johnson, D.D. Established Perennial Vegetation Provides High Resistance to Reinvasion by Exotic Annual Grasses. Rangel. Ecol. Manag. 2017, 70, 748–754. [Google Scholar] [CrossRef]
  4. Minnick, T.J.; Alward, R.D. Soil Moisture Enhancement Techniques Aid Shrub Transplant Success in an Arid Shrubland Restoration. Rangel. Ecol. Manag. 2012, 65, 232–240. [Google Scholar] [CrossRef]
  5. Ott, J.E.; Kilkenny, F.F.; Summers, D.D.; Thompson, T.W. Long-Term Vegetation Recovery and Invasive Annual Suppression in Native and Introduced Postfire Seeding Treatments. Rangel. Ecol. Manag. 2019, 72, 640–653. [Google Scholar] [CrossRef]
  6. Brown, V.S.; Erickson, T.E.; Merritt, D.J.; Madsen, M.D.; Hobbs, R.J.; Ritchie, A.L. A Global Review of Seed Enhancement Technology Use to Inform Improved Applications in Restoration. Sci. Total Environ. 2021, 798, 149096. [Google Scholar] [CrossRef]
  7. Madsen, M.D.; Davies, K.W.; Boyd, C.S.; Kerby, J.D.; Svejcar, T.J. Emerging Seed Enhancement Technologies for Overcoming Barriers to Restoration. Restor. Ecol. 2016, 24, S77–S84. [Google Scholar] [CrossRef]
  8. Jessop, B.D.; Anderson, V.J. Cheatgrass Invasion in Salt Desert Shrublands: Benefits of Postfire Reclamation. Rangel. Ecol. Manag. 2007, 60, 235–243. [Google Scholar] [CrossRef]
  9. Chambers, J.C. Invasive Plant Species and the Great Basin. In USDA Forest Service—General Technical Report RMRS-GTR; USDA Forest Service, Rocky Mountain Research Station: Reno, NV, USA, 2008; pp. 1–7. [Google Scholar]
  10. Litt, A.R.; Pearson, D.E. Non-Native Plants and Wildlife in the Intermountain West. Wildl. Soc. Bull. 2013, 37, 517–526. [Google Scholar] [CrossRef]
  11. Bradley, B.A.; Curtis, C.A.; Fusco, E.J.; Abatzoglou, J.T.; Balch, J.K.; Dadashi, S.; Tuanmu, M.N. Cheatgrass (Bromus tectorum) Distribution in the Intermountain Western United States and Its Relationship to Fire Frequency, Seasonality, and Ignitions. Biol. Invasions 2018, 20, 1493–1506. [Google Scholar] [CrossRef] [Green Version]
  12. Garbowski, M.; Johnston, D.B.; Baker, D.V.; Brown, C.S. Invasive Annual Grass Interacts with Drought to Influence Plant Communities and Soil Moisture in Dryland Restoration. Ecosphere 2021, 12, e03417. [Google Scholar] [CrossRef]
  13. Simberloff, D. The Role of Propagule Pressure in Biological Invasions. Annu. Rev. Ecol. Evol. Syst. 2009, 40, 81–102. [Google Scholar] [CrossRef]
  14. Zouhar, K. Bromus Tectorum; Fire Effects Information System [Online]. U.S. Department of Agriculture, Forest Service, Rocky Mountain Research Station, Fire Sciences Laboratory (Porducer). 2003. Available online: https://www.fs.usda.gov/database/feis/plants/graminoid/brotec/all.html (accessed on 1 October 2020).
  15. Hirsch-Schantz, M.C.; Monaco, T.A.; Call, C.A.; Sheley, R.L. Large-Scale Downy Brome Treatments Alter Plant-Soil Relationships and Promote Perennial Grasses in Salt Desert Shrublands. Rangel. Ecol. Manag. 2014, 67, 255–265. [Google Scholar] [CrossRef]
  16. McGlone, C.M.; Sieg, C.H.; Kolb, T.E.; Nietupsky, T. Established Native Perennial Grasses Out-Compete an Invasive Annual Grass Regardless of Soil Water and Nutrient Availability. Plant Ecol. 2012, 213, 445–457. [Google Scholar] [CrossRef]
  17. Rau, B.M.; Chambers, J.C.; Pyke, D.A.; Roundy, B.A.; Schupp, E.W.; Doescher, P.; Caldwell, T.G. Soil Resources Influence Vegetation and Response to Fire and Fire-Surrogate Treatments in Sagebrush-Steppe Ecosystems. Rangel. Ecol. Manag. 2014, 67, 506–521. [Google Scholar] [CrossRef] [Green Version]
  18. Ryel, R.J.; Leffler, A.J.; Ivans, C.; Peek, M.S.; Caldwell, M.M. Functional Differences in Water-Use Patterns of Contrasting Life Forms in Great Basin Steppelands. Vadose Zone J. 2010, 9, 548–560. [Google Scholar] [CrossRef] [Green Version]
  19. Chambers, J.C.; Miller, R.F.; Board, D.I.; Pyke, D.A.; Roundy, B.A.; Grace, J.B.; Schupp, E.W.; Tausch, R.J. Resilience and Resistance of Sagebrush Ecosystems: Implications for State and Transition Models and Management Treatments. Rangel. Ecol. Manag. 2014, 67, 440–454. [Google Scholar] [CrossRef] [Green Version]
  20. Monaco, T.A.; Mangold, J.M.; Mealor, B.A.; Mealor, R.D.; Brown, C.S. Downy Brome Control and Impacts on Perennial Grass Abundance: A Systematic Review Spanning 64 Years. Rangel. Ecol. Manag. 2017, 70, 396–404. [Google Scholar] [CrossRef]
  21. Roundy, B.A.; Hardegree, S.P.; Chambers, J.C.; Whittaker, A. Prediction of Cheatgrass Field Germination Potential Using Wet Thermal Accumulation. Rangel. Ecol. Manag. 2007, 60, 613–623. [Google Scholar] [CrossRef]
  22. Chambers, J.C.; Roundy, B.A.; Blank, R.R.; Meyer, S.E.; Whittaker, A. What Makes Great Basin Sagebrush Ecosystems Invasible by Bromus Tectorum? Ecol. Monogr. 2007, 77, 117–145. [Google Scholar] [CrossRef] [Green Version]
  23. Vallejo, V.R.; Smanis, A.; Chirino, E.; Fuentes, D.; Valdecantos, A.; Vilagrosa, A. Perspectives in Dryland Restoration: Approaches for Climate Change Adaptation. New For. 2012, 43, 561–579. [Google Scholar] [CrossRef] [Green Version]
  24. Cline, N.; Roundy, B.; Gill, R.A.; Hopkins, B. Wet—Thermal Time and Plant Available Water in the Seedbeds and Root Zones Across the Sagebrush Steppe Ecosystem of the Great Basin; Brigham Young University: Provo, UT, USA, 2014. [Google Scholar]
  25. Rezashateri, M.; Khajeddin, S.J.; Abedi-Koupai, J.; Majidi, M.M.; Matinkhah, S.H. Growth Characteristics of Artemisia sieberi Influenced by Super Absorbent Polymers in Texturally Different Soils under Water Stress Condition. Arch. Agron. Soil. Sci. 2017, 63, 984–997. [Google Scholar] [CrossRef]
  26. Ferguson, S.D.; Leger, E.A.; Li, J.; Nowak, R.S. Natural Selection Favors Root Investment in Native Grasses during Restoration of Invaded Fields. J. Arid. Environ. 2015, 116, 11–17. [Google Scholar] [CrossRef]
  27. Zohuriaan-Mehr, M.J.; Kabiri, K. Superabsorbent Polymer Materials: A Review. Iran. Polym. J. 2008, 17, 451–477. [Google Scholar]
  28. Evonik Industries STOCKOSORB® 660—Evonik Industries. Available online: https://www.break-thru.com/en/products/STOCKOSORB (accessed on 8 December 2021).
  29. Abdallah, A.M. The Effect of Hydrogel Particle Size on Water Retention Properties and Availability under Water Stress. Int. Soil Water Conserv. Res. 2019, 7, 275–285. [Google Scholar] [CrossRef]
  30. Singh, N.; Agarwal, S.; Jain, A.; Khan, S. 3-Dimensional Cross Linked Hydrophilic Polymeric Network “Hydrogels”: An Agriculture Boom. Agric. Water Manag. 2021, 253, 106939. [Google Scholar] [CrossRef]
  31. Abdallah, A.M.; Mashaheet, A.M.; Burkey, K.O. Super Absorbent Polymers Mitigate Drought Stress in Corn (Zea mays L.) Grown under Rainfed Conditions. Agric. Water Manag. 2021, 254, 106946. [Google Scholar] [CrossRef]
  32. Varaprasad, K.; Raghavendra, G.M.; Jayaramudu, T.; Yallapu, M.M.; Sadiku, R. A Mini Review on Hydrogels Classification and Recent Developments in Miscellaneous Applications. Mater. Sci. Eng. C 2017, 79, 958–971. [Google Scholar] [CrossRef] [PubMed]
  33. Evonik. Stockosorb_660 Tech Data; Evonik Industries: Krefeld, Germany, 2005. [Google Scholar]
  34. Demitri, C.; Scalera, F.; Madaghiele, M.; Sannino, A.; Maffezzoli, A. Potential of Cellulose-Based Superabsorbent Hydrogels as Water Reservoir in Agriculture. Int. J. Polym. Sci. 2013, 2013, 435073. [Google Scholar] [CrossRef] [Green Version]
  35. El-Asmar, J.; Jaafar, H.; Bashour, I.; Farran, M.T.; Saoud, I.P. Hydrogel Banding Improves Plant Growth, Survival, and Water Use Efficiency in Two Calcareous Soils. CLEAN–Soil Air Water 2017, 45, 1700251. [Google Scholar] [CrossRef]
  36. Chirino, E.; Vilagrosa, A.; Vallejo, V.R. Using Hydrogel and Clay to Improve the Water Status of Seedlings for Dryland Restoration. Plant Soil 2011, 344, 99–110. [Google Scholar] [CrossRef]
  37. Zhang, J.; Zhao, T.; Sun, B.; Song, S.; Guo, H.; Shen, H.; Wu, Y. Effects of Biofertilizers and Super Absorbent Polymers on Plant Growth and Soil Fertility in the Arid Mining Area of Inner Mongolia, China. J. Mt. Sci. 2018, 15, 1920–1935. [Google Scholar] [CrossRef]
  38. Bai, W.; Song, J.; Zhang, H. Repeated Water Absorbency of Super-Absorbent Polymers in Agricultural Field Applications: A Simulation Study. Acta Agric. Scand. B Soil Plant Sci. 2013, 63, 433–441. [Google Scholar] [CrossRef]
  39. Holliman, P.J.; Clark, J.A.; Williamson, J.C.; Jones, D.L. Model and Field Studies of the Degradation of Cross-Linked Polyacrylamide Gels Used during the Revegetation of Slate Waste. Sci. Total Environ. 2005, 336, 13–24. [Google Scholar] [CrossRef]
  40. Banedjschafie, S.; Durner, W. Water Retention Properties of a Sandy Soil with Superabsorbent Polymers as Affected by Aging and Water Quality. J. Plant Nutr. Soil Sci. 2015, 178, 798–806. [Google Scholar] [CrossRef]
  41. Abu-Zreig, M. Control of Rainfall-Induced Soil Erosion with Various Types of Polyacrylamide. J. Soils Sediments 2006, 6, 137–144. [Google Scholar] [CrossRef]
  42. Hüttermann, A.; Zommorodi, M.; Reise, K. Addition of Hydrogels to Soil for Prolonging the Survival of Pinus halepensis Seedlings Subjected to Drought. Soil Tillage Res. 1999, 50, 295–304. [Google Scholar] [CrossRef]
  43. Lucero, M.E.; Dreesen, D.R.; VanLeeuwen, D.M. Using Hydrogel Filled, Embedded Tubes to Sustain Grass Transplants for Arid Land Restoration. J. Arid Environ. 2010, 74, 987–990. [Google Scholar] [CrossRef]
  44. Evonik. STOCKOSORB®—BREAK-THRU®—Technology for Agriculture. Available online: https://www.break-thru.com/product/break-thru/en/products/STOCKOSORB/ (accessed on 30 June 2020).
  45. Evonik. STOCKOSORB® for Water and Soil Management in Agriculture and Horticulture. Evonik Industries: Krefeld, Germany, 2008. [Google Scholar]
  46. Evonik. Stockosorb 660 Label; Evonik Corporation: Greensboro, NC, USA, 2015. [Google Scholar]
  47. Whitlock, M.C.; Schluter, D. The Analysis of Biological Data; Roberts and Company Publishers: Greenwood Village, CO, USA, 2009; ISBN 978-0-9815194-0-1. [Google Scholar]
  48. Soil Survey Staff Web Soil Survey. Available online: https://websoilsurvey.sc.egov.usda.gov/App/WebSoilSurvey.aspx (accessed on 30 January 2020).
  49. Miller, R.O.; Gavlak, R.; Horneck, D. Soil, Plant and Water Reference Methods for the Western Region, 4th Edition; Colorado State University: Fort Collins, CO, USA, 2013. [Google Scholar]
  50. Plumb, H. NRCS Bottlebrush Squirreltail Elymus Elymoides Plant Fact Sheet; USDA-National Resources Conservation Service, Upper Colorado Environmental Plant Center: Meeker, CO, USA, 2010.
  51. USDA-NRCS-Aberdeen Plant Materials Center. Release Brochure for Vavilov II Siberian Wheatgrass (Agropyron Fragile); USDA-National Resources Conservation Service, Aberdeen Plant Materials Center: Aberdeen, ID, USA, 2012.
  52. Narjary, B.; Aggarwal, P.; Singh, A.; Chakraborty, D.; Singh, R. Water Availability in Different Soils in Relation to Hydrogel Application. Geoderma 2012, 187–188, 94–101. [Google Scholar] [CrossRef]
  53. Smagin, A.V.; Sadovnikova, N.B.; Smagina, M.V. Biodestruction of Strongly Swelling Polymer Hydrogels and Its Effect on the Water Retention Capacity of Soils. Eurasian Soil Sci. 2014, 47, 591–597. [Google Scholar] [CrossRef]
  54. Koupai, J.A.; Eslamian, S.S.; Kazemi, J.A. Enhancing the Available Water Content in Unsaturated Soil Zone Using Hydrogel, to Improve Plant Growth Indices. Ecohydrol. Hydrobiol. 2008, 8, 67–75. [Google Scholar] [CrossRef]
  55. Saha, A.; Sekharan, S.; Manna, U. Superabsorbent Hydrogel (SAH) as a Soil Amendment for Drought Management: A Review. Soil Tillage Res. 2020, 204, 104736. [Google Scholar] [CrossRef]
  56. Yu, J.; Shainberg, I.; Yan, Y.L.; Shi, J.G.; Levy, G.J.; Mamedov, A.I. Superabsorbents and Semiarid Soil Properties Affecting Water Absorption. Soil Sci. Soc. Am. J. 2011, 75, 2305–2313. [Google Scholar] [CrossRef]
  57. Allen, R.G.; Pereira, L.S.; Raes, D.; Smith, M. Crop Evapotranspiration: Guidelines for Computing Crop Requirements. In Irrigation and Drainage Paper No. 56; FAO: Italy, Rome, 1998; Volume 300. [Google Scholar] [CrossRef]
  58. Bai, W.; Zhang, H.; Liu, B.; Wu, Y.; Song, J.Q. Effects of Super-Absorbent Polymers on the Physical and Chemical Properties of Soil Following Different Wetting and Drying Cycles. Soil Use Manag. 2010, 26, 253–260. [Google Scholar] [CrossRef]
  59. Han, Y.G.; Yang, P.L.; Luo, Y.P.; Ren, S.M.; Zhang, L.X.; Xu, L. Porosity Change Model for Watered Super Absorbent Polymer-Treated Soil. Environ. Earth Sci. 2010, 61, 1197–1205. [Google Scholar] [CrossRef]
  60. Sarvaš, M.; Pavlenda, P.; Takácová, E. Effect of Hydrogel Application on Survival and Growth of Pine Seedlings in Reclamations. J. For. Sci. 2007, 53, 204–209. [Google Scholar] [CrossRef] [Green Version]
  61. Bakass, M.; Mokhlisse, A.; Lallemant, M. Absorption and Desorption of Liquid Water by a Superabsorbent Polymer: Effect of Polymer in the Drying of the Soil and the Quality of Certain Plants. J. Appl. Polym. Sci. 2002, 83, 234–243. [Google Scholar] [CrossRef]
  62. Bandak, S.; Naeini, S.A.R.M.; Zeinali, E.; Bandak, I. Effects of Superabsorbent Polymer A200 on Soil Characteristics and Rainfed Winter Wheat Growth (Triticum aestivum L.). Arab. J. Geosci. 2021, 14, 712. [Google Scholar] [CrossRef]
  63. Do Nascimento, C.D.V.; Feitosa, J.P.D.A.; Simmons, R.; Dias, C.T.D.S.; do Nascimento, Í.V.; Mota, J.C.A.; Costa, M.C.G. Durability Indicatives of Hydrogel for Agricultural and Forestry Use in Saline Conditions. J. Arid Environ. 2021, 195, 104622. [Google Scholar] [CrossRef]
  64. Evonik. Stockosorb 660 Material Safety Data Sheet; Evonik Corporation: Garyville, LA, USA, 2014. [Google Scholar]
  65. Lentz, R.D. Long-Term Water Retention Increases in Degraded Soils Amended with Cross-Linked Polyacrylamide. Agron. J. 2020, 112, 2569–2580. [Google Scholar] [CrossRef]
  66. Zhou, B.; Liao, R.; Li, Y.; Gu, T.; Yang, P.; Feng, J.; Xing, W.; Zou, Z. Water-Absorption Characteristics of Organic-Inorganic Composite Superabsorbent Polymers and Its Effect on Summer Maize Root Growth. J. Appl. Polym. Sci. 2012, 126, 423–435. [Google Scholar] [CrossRef]
  67. He, M.; Lv, L.; Li, H.; Meng, W.; Zhao, N. Analysis on Soil Seed Bank Diversity Characteristics and Its Relation with Soil Physical and Chemical Properties after Substrate Addition. PLoS ONE 2016, 11, e0147439. [Google Scholar] [CrossRef]
  68. Coello, J.; Ameztegui, A.; Rovira, P.; Fuentes, C.; Piqué, M. Innovative Soil Conditioners and Mulches for Forest Restoration in Semiarid Conditions in Northeast Spain. Ecol. Eng. 2018, 118, 52–65. [Google Scholar] [CrossRef]
  69. Yang, W.; Guo, S.; Li, P.; Song, R.; Yu, J. Foliar Antitranspirant and Soil Superabsorbent Hydrogel Affect Photosynthetic Gas Exchange and Water Use Efficiency of Maize Grown under Low Rainfall Conditions. J. Sci. Food Agric. 2019, 99, 350–359. [Google Scholar] [CrossRef] [PubMed]
  70. Johnston, D.B.; Garbowski, M. Responses of Native Plants and Downy Brome to a Water-Conserving Soil Amendment. Rangel Ecol. Manag. 2020, 73, 19–29. [Google Scholar] [CrossRef]
  71. Ovalle, J.F.; Arellano, E.C.; Ginocchio, R. Trade-Offs between Drought Survival and Rooting Strategy of Two South American Mediterranean Tree Species: Implications for Dryland Forests Restoration. Forests 2015, 6, 3733–3747. [Google Scholar] [CrossRef] [Green Version]
  72. Garbowski, M.; Brown, C.S.; Johnston, D.B. Soil Amendment Interacts with Invasive Grass and Drought to Uniquely Influence Aboveground vs. Belowground Biomass in Aridland Restoration. Restor. Ecol. 2019, 28, 1–11. [Google Scholar] [CrossRef] [Green Version]
  73. Islam, M.R.; Ren, C.; Zeng, Z.; Jia, P.; Eneji, E.; Hu, Y. Fertilizer Use Efficiency of Drought-Stressed Oat (Avena sativa L.) Following Soil Amendment with a Water-Saving Superabsorbent Polymer. Acta Agric. Scand. B Soil Plant Sci. 2011, 61, 721–729. [Google Scholar] [CrossRef]
  74. Jacobs, D.F.; Rose, R.; Haase, D.L.; Alzugaray, P.O. Fertilization at Planting Impairs Root System Development and Drought Avoidance of Douglas-Fir (Pseudotsuga menziesii) Seedlings. Ann. For. Sci. 2004, 61, 643–651. [Google Scholar] [CrossRef] [Green Version]
  75. Fehmi, J.S.; Kong, T.M. Effects of Soil Type, Rainfall, Straw Mulch, and Fertilizer on Semi-Arid Vegetation Establishment, Growth and Diversity. Ecol. Eng. 2012, 44, 70–77. [Google Scholar] [CrossRef] [Green Version]
  76. Del Campo, A.D.; Hermoso, J.; Flors, J.; Lidón, A.; Navarro-Cerrillo, R.M. Nursery Location and Potassium Enrichment in Aleppo Pine Stock 2. Performance under Real and Hydrogel-Mediated Drought Conditions. Forestry 2011, 84, 235–245. [Google Scholar] [CrossRef]
Figure 1. Frontal cross section diagram (a) of a grow box unit (b) containing soil with a superabsorbent polymer (SAP) band 8 cm below the soil surface of the furrow valley.
Land 12 00232 g001
Figure 2. Soil moisture as a function of a superabsorbent polymer (SAP) rate and placement relative to an untreated control averaged across 108 d of a glasshouse study with bottlebrush squirreltail. The SAP (1500 or 3000 kg ha−1) was blended with the soil to a depth of 15 cm or placed in a band at the surface or at 3, 8, or 15 cm deep directly below the seed. The soil was then saturated and allowed to dry down. Bars marked with “**” were highly significant at p < 0.0001.
Land 12 00232 g002
Figure 3. Seedling longevity, number of days alive, as a function of a superabsorbent polymer (SAP) rate and placement relative to an untreated control averaged across 108 d of a glasshouse study with bottlebrush squirreltail. The SAP (1500 or 3000 kg ha−1) was blended with the soil to a depth of 15 cm or placed in a band at the surface or at 3, 8, or 15 cm deep directly below the seed. The soil was then saturated and allowed to dry down. Bars marked with “*” were significant at p = 0.05.
Land 12 00232 g003
Figure 4. Increase in gravimetric water content (GWC) and viable seedlings as a function of superabsorbent polymer (SAP) application and time in a glasshouse study for bottlebrush squirreltail and Siberian wheatgrass. Data were averaged across all seeding rates of 2, 4, 8, and 16 kg ha−1. The SAP rate of 3000 kg ha−1 was placed in a band at a depth of 8 cm directly below the seed. Following SAP treatment, the soil was saturated once and then dried down naturally over the time of the study. For the treated plots, with square markers, the solid (filled in) markers indicate highly significant (p < 0.0001) differences compared to the control for that day, and open (not filled in) markers are not significant.
Land 12 00232 g004
Figure 5. Percentage of live seedlings (p < 0.0001) and percent soil moisture (p = 0.0218) as a function of seeding rate and superabsorbent polymer (SAP) application averaged across 56 d of a glasshouse study for bottlebrush squirreltail (on the left) and Siberian wheatgrass (on the right). The SAP rate of 3000 kg ha−1 was placed in a band at a depth of 8 cm directly below the seed. Following SAP treatment, the soil was saturated once and then dried down naturally over the time of the study. Bars within a species for each variable that share the same letter are not statistically different from each other.
Land 12 00232 g005
Figure 6. Percentage of live seedlings (p < 0.0001) as a function of a superabsorbent polymer (SAP) application averaged across 56 d of a glasshouse study and seeding rates of 2, 4, 8, or 16 kg ha−1 for bottlebrush squirreltail and Siberian wheatgrass. The SAP rate of 3000 kg ha−1 was placed in a band at a depth of 8 cm directly below the seed. Following SAP treatment, the soil was saturated once and then dried down naturally over the time of the study. Bars that share the same letter are not statistically different from each other.
Land 12 00232 g006
Figure 7. Volumetric Water Content (VWC) different from the control as a function of a superabsorbent polymer (SAP) rate and time relative to an untreated control in a glasshouse study with bottlebrush squirreltail and Siberian wheatgrass seeded at NRCS recommended rates. Data are averaged across both species. The SAP rates of 11, 47, 190, 750, or 1500 kg ha−1 were placed in a band at a depth of 8 cm perpendicular to the seed rows. Following the SAP treatment, the soil was saturated once and then dried down naturally over the time of the study. Bars with “*” indicate statistical significance relative to the control within that day (p = 0.05).
Land 12 00232 g007
Figure 8. Seedling roots 5–12 cm below soil surface 51 d after planting: (a) bottlebrush squirreltail control, (b) bottlebrush squirreltail with 3000 kg ha−1 SAP band placed at 8 cm depth, (c) Siberian wheatgrass control, (d) Siberian wheatgrass with 3000 kg ha−1 SAP band placed at 8 cm depth.
Land 12 00232 g008
Figure 9. Gravimetric water content (GWC) for a superabsorbent polymer (SAP) fertilizer glasshouse study with bottlebrush squirreltail and Siberian wheatgrass (data averaged across species). (A) Increase in GWC with SAP (compared to the control without SAP) for fertilizer applied at the: Surface, 8 cm below the surface, or No Fertilizer. Filled markers indicate significance compared to the control (no SAP) for each fertilizer treatment (p < 0.0001). The symbol “*” indicates days where No Fertilizer was statistically less than with fertilizer applied at 8 cm depth (p = 0.05). (B) The GWC with or without SAP. Data are averaged across fertilizer treatments. Filled markers on the SAP line indicate significance compared to the control (p < 0.0001).
Land 12 00232 g009
Figure 10. Number of seedlings emerged as a function of superabsorbent polymer (SAP) application averaged across applied fertilizer depths of 0 and 8 cm and 77 d of a glasshouse study with bottlebrush squirreltail and Siberian wheatgrass. The SAP rate of 3000 kg ha−1 was placed in a band at a depth of 8 cm directly below the seed. Following SAP treatment, the soil was saturated once and then dried down naturally over the time of the study. Bars with the same letters are not statistically different from each other. p = 0.05.
Land 12 00232 g010
Figure 11. Number of seedlings emerged as a function of fertilizer placement depth compared to an untreated control in a glasshouse study with bottlebrush squirreltail and Siberian wheatgrass. Data were averaged over SAP presence at rates of 0 or 3000 kg ha−1 and across species. The soil was saturated once and then dried down naturally over the time of the study. The fertilizer was placed at a depth of 8 cm directly below the seed prior to saturation or at the soil surface at the time of planting. Bars with the same letters are not statistically different from each other. p = 0.05.
Land 12 00232 g011
Figure 12. Seedling longevity, number of days alive, as a function of superabsorbent polymer (SAP) application averaged across 77 d of a glasshouse study with bottlebrush squirreltail and Siberian wheatgrass. Data were averaged across species and fertilizer placement depth (0 or 8 cm). The SAP rate of 3000 kg ha−1 was placed in a band at a depth of 8 cm directly below the seed. Following SAP treatment, the soil was saturated once and then dried down naturally over the time of the study. Bars marked with “**” are highly significant at p = 0.0002.
Land 12 00232 g012
Figure 13. Seedling longevity, number of days alive, as a function of fertilizer placement depth in a glasshouse study with bottlebrush squirreltail and Siberian wheatgrass. Data were averaged across species and SAP rates of 0 and 3000 kg ha−1 applied in a band at a depth of 8 cm directly below the seed. Following SAP treatment, the soil was saturated once and then dried down naturally over the time of the study. The fertilizer was applied at a depth of 8 cm directly below the seed prior to saturation or at the soil surface at the time of planting. Bars with different letters are statistically different from each other p = 0.0584.
Land 12 00232 g013
Figure 14. Comparison of gravimetric water content (GWC) as a function of superabsorbent polymer (SAP) application between original saturation for the fertilizer study and rehydration after dry-down period of 77 d. Data were averaged across species and fertilizer placement depth (0 or 8 cm). The SAP rate of 3000 kg ha−1 was placed in a band at a depth of 8 cm directly below the seed. Following SAP treatment, the soil was saturated once and then dried down naturally over the time of the fertilizer study then rehydrated. Bars with different letters are statistically different from each other. p < 0.0001.
Land 12 00232 g014
Table 1. Five glasshouse study treatments, parameters, and measurements. Gray squares in the treatments section indicate a treatment parameter for that study.
Study12345
Treatments
SAP, kg ha−10, 1500, 30000, 30000, 11, 47, 190, 750, 15000, 30000, 3000
SAP Depth, cm0, 3, 8, 15, mixed (top 15)883, 8,
mixed (top 8)
8
Fertilizernonononowith/without
Species *BBBB and SWBB and SWBB and SWBB and SW
Seeding Rate, kg ha−1242, 4, 8, 16846
Study Parameters
Study length, d10776787076/133 **
Dates14 February to
1 June 2017
7 September to
22 November 2018
8 February to
27 April 2019
19 July to
27 September 2019
16 December to
28 April 2018
Replicates44346
Dimensions, cm10 (each side)10 (each side)30 × 21.510 (diameter)10 (each side)
Depth, cm2323152510
Thinned,
number@DAP
3@14 & 1@29no1@191@13no
Saturation time, d215161816
Measurements
Soil Moisture3x/wk3x/wk3x/wk until 36 DAP then 57 & 78 DAPweekly @4 depths3x/wk
Seedling emergence and total alive ***8, 25, 29, 70, 72, 76, 81, 84, 86, 105, and 107 DAP3x/wk~3x/wkweeklyweekly
Seedling length and Blade number76 DAPweeklynoweeklyweekly
Root length/branchingnononoweeklyno
Root/shoot biomassnononoyesno
* BB = bottlebrush squirreltail; SW = Siberian wheatgrass. ** all seedlings were dead by 76 d in Study 5, with the rewetting portion of the study beginning at that time and ending on 133 d. *** total seedlings alive was not measured in Study 1.
Table 3. Statistical results of a glass house study evaluating the effect of SAP depth (D), rate (R), time (T), and their interactions on soil moisture, seedling longevity, shoot length, and blade count. Bolded numbers indicate p < 0.05.
Soil MoistureLongevityShoot LengthBlade Count
EffectDFF RatioProb > FF RatioProb > FF RatioProb > FF RatioProb. F
D433.6114<0.00011.89680.1372.36250.0761.74520.172
R1146.3037<0.00014.34680.0464.8480.0366.92310.014
T4121.6824<0.0001
D*R428.3439<0.00012.85330.0413.57220.0171.69610.182
D*T1642.9596<0.0001
R*T414.977<0.0001
D*R*T1640.69470.998
Table 4. Bottlebrush squirreltail seedling length, relative to an untreated control, as a function of superabsorbent polymer (SAP) rate and placement for a glasshouse study. The SAP (1500 or 3000 kg ha−1) was blended with the soil to a depth of 15 cm or placed in a band at the surface or at 3, 8, or 15 cm deep directly below the seed; the soil was saturated and allowed to dry down. Bolded lengths are significant.
Superabsorbent Polymer Rate
1500 kg ha−13000 kg ha−1
SAP Placement DepthSeedling Length Relative to Control (cm)p-ValueSeedling Length Relative to Control (cm)p-Value
surface−0.80.7222.80.232
3 cm4.70.052−0.60.787
8 cm−3.30.1558.00.002
15 cm−5.90.032−0.20.931
blended−2.80.220−2.10.362
Table 5. Statistical results of a glass house study evaluating the effect of species (S), seeding rate (R), SAP rate (SAP), time (T), and their interactions on soil moisture and persistence (percent of plants alive) each day. Bolded numbers indicate p < 0.05.
Soil Moisture (Mixed Model)Persistence (Anova)
EffectDFDF DenF RatioProb > FDFF RatioProb > F
S1480.01070.7221316.8774<0.0001
R3485.53060.01231.07050.361
SAP148211.2814<0.00011122.6885<0.0001
T22105632,415.25<0.00012370.231<0.0001
S*R3483.22710.022312.3834<0.0001
S*SAP1483.11310.139160.0828<0.0001
S*T2210560.42090.995233.404<0.0001
R*SAP3483.12850.03135.31870.001
R*T6610561.44080.005690.66210.985
SAP*T22105663.6763<0.0001232.7546<0.0001
S*R*SAP3483.52130.04138.2626<0.0001
S*R*T6610562.5588<0.0001690.30221
S*SAP*T2210562.6144<0.0001231.00730.452
R*SAP*T6610562.21<0.0001690.27221
S*R*SAP*T66662.8337<0.0001690.49851
Table 6. Statistical results of a glass house study evaluating the effect of species (S), seeding rate (R), SAP rate (SAP), and their interactions on days to emergence and percent emergence. Bolded numbers indicate p < 0.05.
Days to Emerge (Anova)% Emerged (Anova)
EffectDFF RatioProb > FDFF RatioProb > F
S110.02680.002124.2163<0.0001
R30.3350.80030.66470.578
SAP10.04620.83011.60280.212
S*R30.32580.80730.78140.510
S*SAP11.72080.19110.00980.922
R*SAP30.23730.87030.68380.566
S*R*SAP30.42440.73630.5370.659
Table 7. Statistical results of a glass house study evaluating the effect of species (S), planting location (L), SAP rate (R), time (T), and their interactions on soil moisture, as well as the effect of species and location on seedling longevity. Bolded numbers indicate p < 0.05.
Soil MoistureLongevity
EffectDFF RatioProb > FF RatioProb > F
L218.8207<0.0001
S10.20550.6587.15650.008
R50.92740.4973.94920.002
T167467.511<0.0001
L*S27.96410.0004
L*R104.7621<0.0001
L*T323.7136<0.0001
S*R51.1410.3910.35320.880
R*T804.7752<0.0001
Table 8. Statistical results of a glass house study evaluating the effect of species (S), SAP placement depth (P), moisture measurement depth (M), time (T), and their interactions on soil moisture. Bolded numbers indicate p < 0.05.
Soil Moisture
EffectDFDF DenF RatioProb > F
S1270.00820.929
P3270.90460.452
M384347.4975<0.0001
T71891741.724<0.0001
S*T71890.69960.672
P*M9840.79630.621
P*T211892.55070.0004
M*T2158826.6123<0.0001
P*M*T635881.8640.0001
Table 9. Statistical results of a glass house study evaluating the effect of species (S), superabsorbent polymer (SAP) placement depth (D), and their interaction on seedling emergence, shoot and root biomass, shoot:root ratio, time for roots to reach the bottom of the canister (Time), and root length at 3 weeks. Mean comparisons were also made orthogonally evaluating species (S), SAP presence or absence (P), and the interaction of the two. Bolded numbers indicate p < 0.05.
MetricDFF RatioProb > F
Total emergence74.6899<0.0001
S14.91450.028
D35.43870.001
S*D33.86610.010
Total emergence orthogonal33.96700.009
S110.20950.002
P10.06040.806
S*P17.30980.008
Days to emerge76.4688<0.0001
S127.2552<0.0001
D33.46730.018
S*D33.46730.018
Days to emerge orthogonal38.9142<0.0001
S122.2726<0.0001
P11.92670.167
S*P11.92670.167
Shoot biomass71.37740.266
Shoot biomass orthogonal31.80390.172
Root biomass73.05370.022
S17.59780.012
D32.39230.097
S*D31.89640.161
Root biomass orthogonal32.55160.078
shoot:root ratio70.31170.941
Shoot:Root ratio orthogonal30.1190.948
Time71.70130.166
Root length 21 DAP70.84540.563
Root length 21 DAP orthogonal31.49360.241
Table 10. Statistical results of a glass house study evaluating the effect of Species (S), Fertilizer placement depth (F), SAP presence (SAP), Time (T), and their interactions on soil moisture each day. Bolded numbers indicate p < 0.05.
EffectNparmDF DenF RatioProb > F
S159.790.03090.861
F259.790.10030.905
SAP159.7984.938<0.0001
T29171512,268.02<0.0001
S*F259.79501,2270.009
S*SAP159.791.25070.268
S*T2917152.325<0.0001
F*SAP259.792.22060.117
F*T5817154.0967<0.0001
SAP*T29171578.2095<0.0001
S*F*SAP259.790.95990.389
S*F*T5817153.5676<0.0001
S*SAP*T2917154.0605<0.0001
F*SAP*T5817152.2783<0.0001
S*F*SAP*T5817151.25060.100
Disclaimer/Publisher’s Note: The statements, opinions and data contained in all publications are solely those of the individual author(s) and contributor(s) and not of MDPI and/or the editor(s). MDPI and/or the editor(s) disclaim responsibility for any injury to people or property resulting from any ideas, methods, instructions or products referred to in the content.

