Article

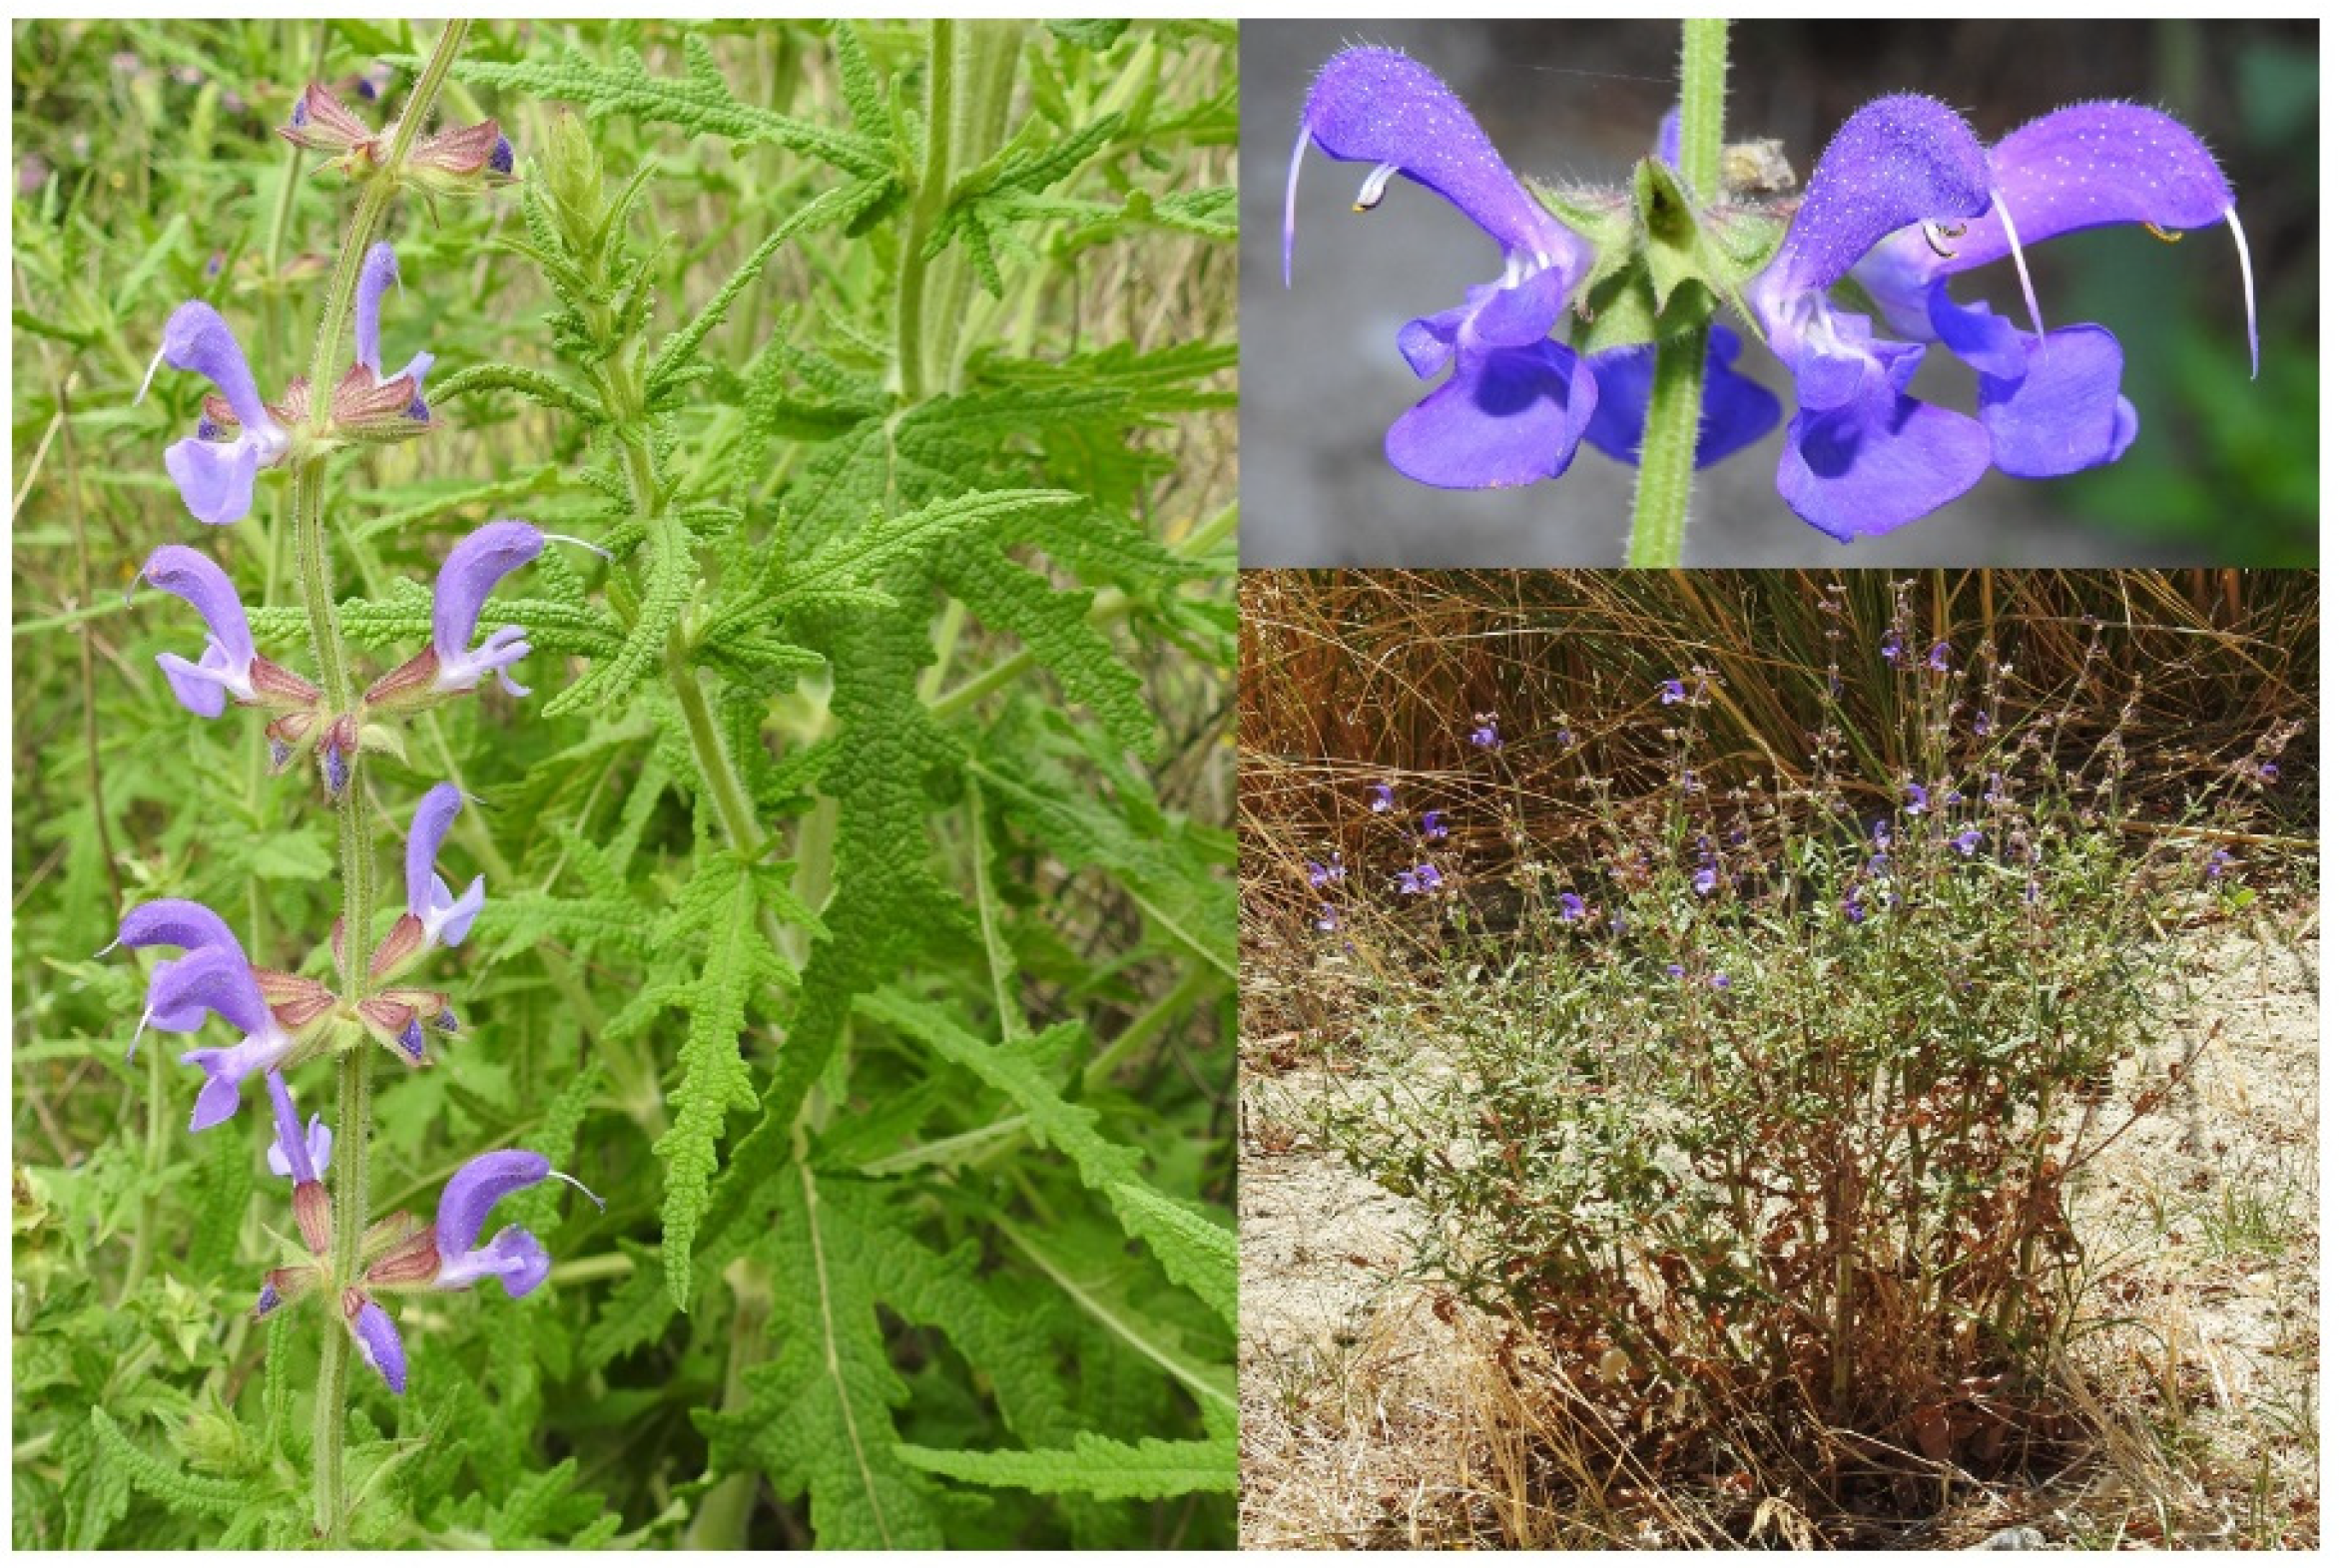
Current and Potential Future Distribution of Endemic Salvia ceratophylloides Ard. (Lamiaceae)

by
Valentina Lucia Astrid Laface
1,
Carmelo Maria Musarella
1,*,
Gianmarco Tavilla
2,
Agostino Sorgonà
1,
Ana Cano-Ortiz
3,
Ricardo Quinto Canas
4 and
Giovanni Spampinato
1,*
1
Department of AGRARIA, Mediterranean University of Reggio Calabria, 89122 Reggio Calabria, Italy
2
Department of Biological, Geological and Environmental Sciences, University of Catania, 95131 Catania, Italy
3
Department of Didactics of Experimental Social Sciences and Mathematics, Section of Didactics of Experimental Sciences, Faculty of Education, Complutense University of Madrid, 28040 Madrid, Spain
4
Faculty of Sciences and Technology, University of Algarve, Campus de Gambelas, 8005-139 Faro, Portugal
*
Authors to whom correspondence should be addressed.
Land 2023, 12(1), 247; https://doi.org/10.3390/land12010247
Submission received: 23 December 2022 / Revised: 9 January 2023 / Accepted: 10 January 2023 / Published: 13 January 2023

Abstract

:
Human activities and climate change are the main factors causing habitat loss, jeopardising the survival of many species, especially those with limited range, such as endemic species. Recently, species distribution models (SDMs) have been used in conservation biology to assess their extinction risk, environmental dynamics, and potential distribution. This study analyses the potential, current and future distribution range of Salvia ceratophylloides Ard., an endemic perennial species of the Lamiaceae family that occurs exclusively in a limited suburban area of the city of Reggio Calabria (southern Italy). The MaxEnt model was employed to configure the current potential range of the species using bioclimatic and edaphic variables, and to predict the potential suitability of the habitat in relation to two future scenarios (SSP245 and SSP585) for the periods 2021–2040 and 2041–2060. The field survey, which spanned 5 years (2017–2021), involved 17 occurrence points. According to the results of the MaxEnt model, the current potential distribution is 237.321 km2, which considering the preferred substrates of the species and land-use constraints is re-estimated to 41.392 km2. The model obtained from the SSP245 future scenario shows a decrease in the area suitable for the species of 35% in the 2021–2040 period and 28% in the 2041–2060 period. The SSP585 scenario shows an increase in the range suitable for hosting the species of 167% in the 2021–2040 period and 171% in the 2041–2060 period. Assessing variation in the species distribution related to the impacts of climate change makes it possible to define priority areas for reintroduction and in situ conservation. Identifying areas presumably at risk or, on the contrary, suitable for hosting the species is of paramount importance for management and conservation plans for Salvia ceratophylloides.

1. Introduction

Human activities and climate change are the main causes of habitat and biodiversity loss [1,2,3,4,5,6], seriously threatening the survival of many species, especially those with limited distribution and, especially, endemic species [7,8,9,10,11,12,13,14].
The 20th century saw the strongest warming trend of the last millennium, with an increase in average temperatures of approximately 0.6 °C, compared to pre-industrial times (1850–1900) [15,16,17,18,19]. Estimates suggest that future temperature increases could exceed this value, with an increase of between 0.1 and 0.2 °C expected per decade [19]. In addition, climate change, combined with economic globalisation, rapid infrastructure development, and human activities, has favoured the spread of invasive alien species, which, by rapidly expanding their range, affect natural habitats and lead to the extinction of species, especially those with limited ranges [20,21,22,23,24,25,26].
The Mediterranean region is characterised by high plant biodiversity and a remarkable richness of endemic species, which is due to several factors acting simultaneously [27,28,29,30]. Several authors assessed the impact that climate change could have on the distribution of species, particularly species with limited distributions, such as endemic species, which are more sensitive than others to environmental change and are at greater risk of extinction [10,31,32,33,34,35,36]. To this end, the ecological variables that influence the natural distribution of endemic species must be studied to identify the areas where they occur or could occur [10,32,37,38]. Currently, one of the most widely used systems for determining the environmental limits of species is the MaxEnt prediction model (Maximum Entropy Species Distribution Modeling) [39], which uses bioclimatic data and species occurrence to predict species distributions based on the maximum entropy theory, estimating a probabilistic distribution that is as uniform as possible but subject to environmental constraints [40,41,42,43,44,45,46,47].
The MaxEnt model has been used extensively in the field of conservation biology: it allows the prediction of the current and future potential range of a species [48,49]. Compared to other prediction models, it is more stable and reliable and works quickly and easily in modelling rare species with restricted ranges and limited occurrence data [43,47,50,51,52,53].
Lamiaceae, one of the largest families of angiosperms, includes more than 7000 species distributed throughout the world, with several species characterised by essential oils [54,55,56,57,58]. In the Italian flora, among the endemic species of this family with an extremely limited range [59,60], whose existence may be threatened in the near future by climate change, there is Salvia ceratophylloides Ard. (Figure 1), a species growing exclusively in southern Italy in the hill belt of the suburb of Reggio Calabria. It is clearly distinguished from the other perennial sage species of the Salvia pratensis L. group, to which it belongs [61,62], mainly by its wrinkled, pinnatifid leaves with toothed lobes [63,64]. Its chromosome number is 2n = 6x = 54 [65]. Salvia ceratophylloides (Figure 1) is a perennial herbaceous plant (scapose hemicryptophyte), densely pubescent with both glandular and simple patent hairs, has a main flowering period in spring from April to June, and has a second flowering period in autumn from October to November. Pollination is entomophilous, mediated mainly by hymenoptera (Eucera sp., Bombus sp., Apis sp.). The fruiting occurs after some flowering weeks. Seed dispersal is mainly carried out by ants (myrmecochory) [64]. Seed germination takes place mostly in spring, seedlings reach reproductive maturity (small generative) within 4–5 months, while they tiller (Large Generative) in the following year [13].
The species was known only in a few nearby places, as can be seen from bibliographical references from 1800 [66,67] to the early 1900s [68,69], when, moreover, it was already very rare. Subsequently, despite the research of various botanists, the species was no longer found, having disappeared from the locations mentioned in the literature (Gallico Superiore, Terreti, Straorino, Ortì, Vito Superiore, Pietrastorta) [69]. For this reason, the species was considered extinct in 1997 and included in the “Libro rosso della flora d’Italia” (Red Book of the Flora of Italy) among the extinct species (EX) [70] and confirmed by Del Carratore and Garbari [71] and Scoppola and Spampinato [72].
Subsequent surveys in 2008 revealed four new occurrence points in the surroundings of Reggio Calabria at sites approximately 10 km from those for which the species was known in the literature of the early 1900s, each consisting of a few dozen individuals, totalling nearly 100 mature individuals [73,74,75,76].
Laface et al. [13] carried out field surveys between 2017 and 2021 and identified 17 occurrence points, always in the suburbs of Reggio Calabria, some of these with a small number of individuals. Salvia ceratophylloides covers an “Extent of Occurrence” (EOO) of 4.2 km2 and an “Area of Occupancy” (AOO) of 7 km2: this made it possible to assess the species as “Critically Endangered” (CR) [13,64,76] according to IUCN (International Union for Conservation of Nature) criteria and categories [77].
Salvia ceratophylloides grows spontaneously in the habitat of the EEC Directive 43/93: “5330 thermo Mediterranean and predesert scrub” subtype “32.23 Diss dominated garrigues”. This habitat includes Mediterranean steppe, such as grasslands with Ampelodesmos mauritanicus (Poir.) Dur. & Schinz., sands vegetation with Artemisia campestris subsp. variabilis (Ten.) Greuter, and more rarely in garrigues, characterised by Cistus creticus L. subsp. creticus and Thymbra capitata (L.) Cav. The most frequently growing species with S. ceratophylloides, in addition to the aforementioned species, are some grasses (Lagurus ovatus L., Avena barbata Link, Macrobriza maxima (L.) Tzvelev, Hyparrhenia hirta (L.) Stapf., Dasypyrum villosum (L.) P. Candargy), several dwarf shrubs (Micromeria graeca (L.) Benth. ex Rchb., Phlomis fruticosa L.), and some shrubs (Cytisus infestus (C.Presl) Guss. subsp. infestus, Spartium junceum L.). Mostly, they are widespread species in the Mediterranean steppic grassland and garrigues [64,76]. The populations are located on hills at altitudes between 250 and 450 m a.s.l., characterised exclusively by layers of loose sands, alternating with banks of soft Pliocene calcarenites [78]. The species grows in a territory with average annual temperatures of 18 °C and an average annual rainfall of 600 mm, concentrated in the autumn, the months of November and December, and a summer dry period of approximately 5 months [13,64]. According to Pesaresi [79], the bioclimate is classified as oceanic pluviostagional Mediterranean, with upper thermo-Mediterranean thermotype and lower sub-humid ombrotype.
Numerous physiological studies have been carried out on S. ceratophylloides, and these have shown that the species has a very strong adaptive capacity to future climate change, and develops resilient forms of defence [80,81,82].
In order to safeguard the habitat of S. ceratophylloides, it is of fundamental importance, both theoretically and practically, to understand which areas are potentially suitable from a current and future climatic perspective. This, correlated with population dynamics [13], will make it possible to determine the most appropriate locations for effectively targeting conservation strategies aimed at protecting and reintroducing this critically endangered species. The aim of our study, therefore, is to analyse the species distribution patterns (SDM) of S. ceratophylloides by interpolating the occurrence points with environmental variables, and to model current and future scenarios to assess the current distribution and predict the habitat’s conservation capacity in the context of climate change [19].

2. Materials and Methods

2.1. Species Occurrence Data

Information concerning the current distribution of S. ceratophylloides was obtained during fieldwork carried out between 2017 and 2021 [13], and also considering historical information reported in the literature by several authors [66,67,68,69,73,74,75,76] and verified in the field. For each point of occurrence, field coordinates were taken and the substrate and plant community recorded.
The collected data were analysed using QGIS 3.26.3® software (OSGeo, Beaverton, OR, USA) [83].

2.2. Environmental Variables

In order to model the potential habitat of S. ceratophylloides, based on its current occurrence, a total of 22 ecological variables were considered (Table 1); specifically, 19 bioclimatic and 3 topographic. This information was obtained from the WorldClim database [84,85] at a spatial resolution (expressed as minutes of a degree of longitude and latitude) of 30 s (approx. 1 × 1 km). The topographic variables were extracted using QGIS 3.26.3® software [83].
Information on the environmental variables is an essential parameter for building a predictive model: however, overuse of the environmental variables may increase the spatial correlation between them, leading to overfitting and reducing the transferability of the model [86]. To avoid overfitting, it is necessary to calculate the correlation between all variables considered and exclude the highly correlated variables, which exponentially improves the predictive ability of the model [87]. For this purpose, Pearson’s correlation analysis [88] was carried out using Past 4.1.4 © software (Hammer, Oslo, Norway) [89]. Environmental variables with correlation values falling in the following range were considered significant: −0.8 ≤ r ≤ +0.8. To assess the dominant environmental variables, i.e., those that defined the potential distribution of the species, the jackknife test [90] was performed. For the modelling of future scenarios, the Global Climate Model (GCM) BCC-CSM2-MR was used, with this model producing excellent results in many studies at the European and Mediterranean level [91,92]. For the scenarios reference for the IPCC’s Sixth Assessment Report [19], where four Shared Socioeconomic Pathways (SSPs) are assumed:
  • SSP585: with an additional radiative forcing of 8.5 W/m2 by the year 2100;
  • SSP370: with an additional radiative forcing of 7 W/m2 by the year 2100;
  • SSP245: with an additional radiative forcer of 4.5 W/m2 by the year 2100;
  • SSP126: with an additional radiative forcer of 2.6 W/m2 by the year 2100.
To make the modelling more reliable and plausible, the scenarios SSP585 (most extreme) and SSP245 (intermediate) were chosen, for the periods 2021–2040 and 2041–2060.
Pearson’s [88] correlation analysis made it possible to determine six ecological variables (out of 22) useful for modelling the distribution of the species. Five bioclimatic variables (Bio 1, Bio 4, Bio 13, Bio 14, Bio 19) and one topographic variable (Elev.) were found to be significant (−0.8 ≤ r ≤ +0.8) (Table 1, Figure 2). These variables were also used for modelling the future scenarios. Variables with values >0.8 and those <−0.8 were not considered in order to avoid overfitting.

2.3. Model Construction

The distribution point data (species and geographical coordinates, saved in .csv format) and the resulting bioclimatic variable data were imported into MaxEnt 3.4.4® (American Museum of Natural History, New York, NY, USA) [93,94].
In the analysed models, 75% of the data were selected for model training (calibration), using a maximum number of iterations of 1000, and 25% as test data, for model validation [93,94], keeping the other values as defaults. The Bootstrap method was used, implemented with 10 repetitions and the multiplier value at 0.5. The output format is complementary log-log (cloglog).
The accuracy of the generated model was verified using the Receiver Operating Characteristic (ROC) curve analysis method. The ROC curve has as the ordinate the percentage of true positive values (the ratio that exists and is expected to exist) and as the abscissa the percentage of false positive values (the ratio that does not exist but is expected to exist) [95]. The AUC (Area under the Curve) value is the area enclosed between the abscissa and the ROC curve, and has a range between 0.5 and 1. The higher the AUC value, the greater the distance from the random distribution, the more relevant the correlation between the environmental variables and the geographic distribution of the species, and the more reliable the predictive power of this model.
Conversely, the predictive power of the model is not very reliable. The model’s performance is classified as: inadequate with AUC values ranging from 0.5 to 0.6; poor with values ranging from 0.6 to 0.7; reasonable with values ranging from 0.7 to 0.8; good with values ranging from 0.8 to 0.9; and excellent with values ranging from 0.9 to 1. The necessary means of measuring the model performance is the AUC score, as it has a strong independence from threshold choices. The smallest difference between the training and test AUC data (AUCDiff) was also observed; a lower difference indicates less overfitting in the model [96].

2.4. Distribution Maps: Visualisation and Analysis

For the visualisation and investigation of the distribution areas of the species, the models created with the software MaxEnt (range 0–1) [39] were imported into the software QGIS 3.26.3 [83]. The areas found to be suitable for the species were grouped into 5 habitat potential classes (ranging from 0 to 1): highly unsuitable (≤0.20); unsuitable (0.21–0.40); moderately suitable (0.41–0.60); highly suitable (0.61–0.80); very highly suitable (≥0.80). For each model, the area for each selected class was calculated using QGIS [83].
To define the real distribution of the species, we interpolated the current and future models on the geological map of Calabria [78] and with the land use map of the Region of Calabria “Carta di Uso del Territorio” [97] using the software QGIS. In the first case, we considered the geological substrates on which the species grows, i.e., sands, calcarenites and conglomerates more or less cemented. In the land use map, which is divided into five macro-categories of land cover (1. Artificial surfaces; 2. Agricultural areas; 3. Forests and semi-natural areas; 4. Wetlands; 5. Water bodies), we considered land cover 2 and 3, because S. ceratophylloides grows in areas with a highly fragmented mosaic of agricultural and semi-natural habitats [13].

3. Results

3.1. Natural Distribution Data

A total of 23 occurrence points of S. ceratophylloides are known (Figure 3), of which 17 currently occur in the area (albeit with a small number of individuals for occurrence points) while 6 are extinct: occurrence point 13 became extinct in 2019 and had only one individual in the previous year; occurrence point 19 was reported in 2008 [73] and was not found in subsequent years during field surveys; occurrence points 20, 21, 22, and 23 are historical reports dating back to the early 1900s [68,69] and were not found in the second half of the last century [71].

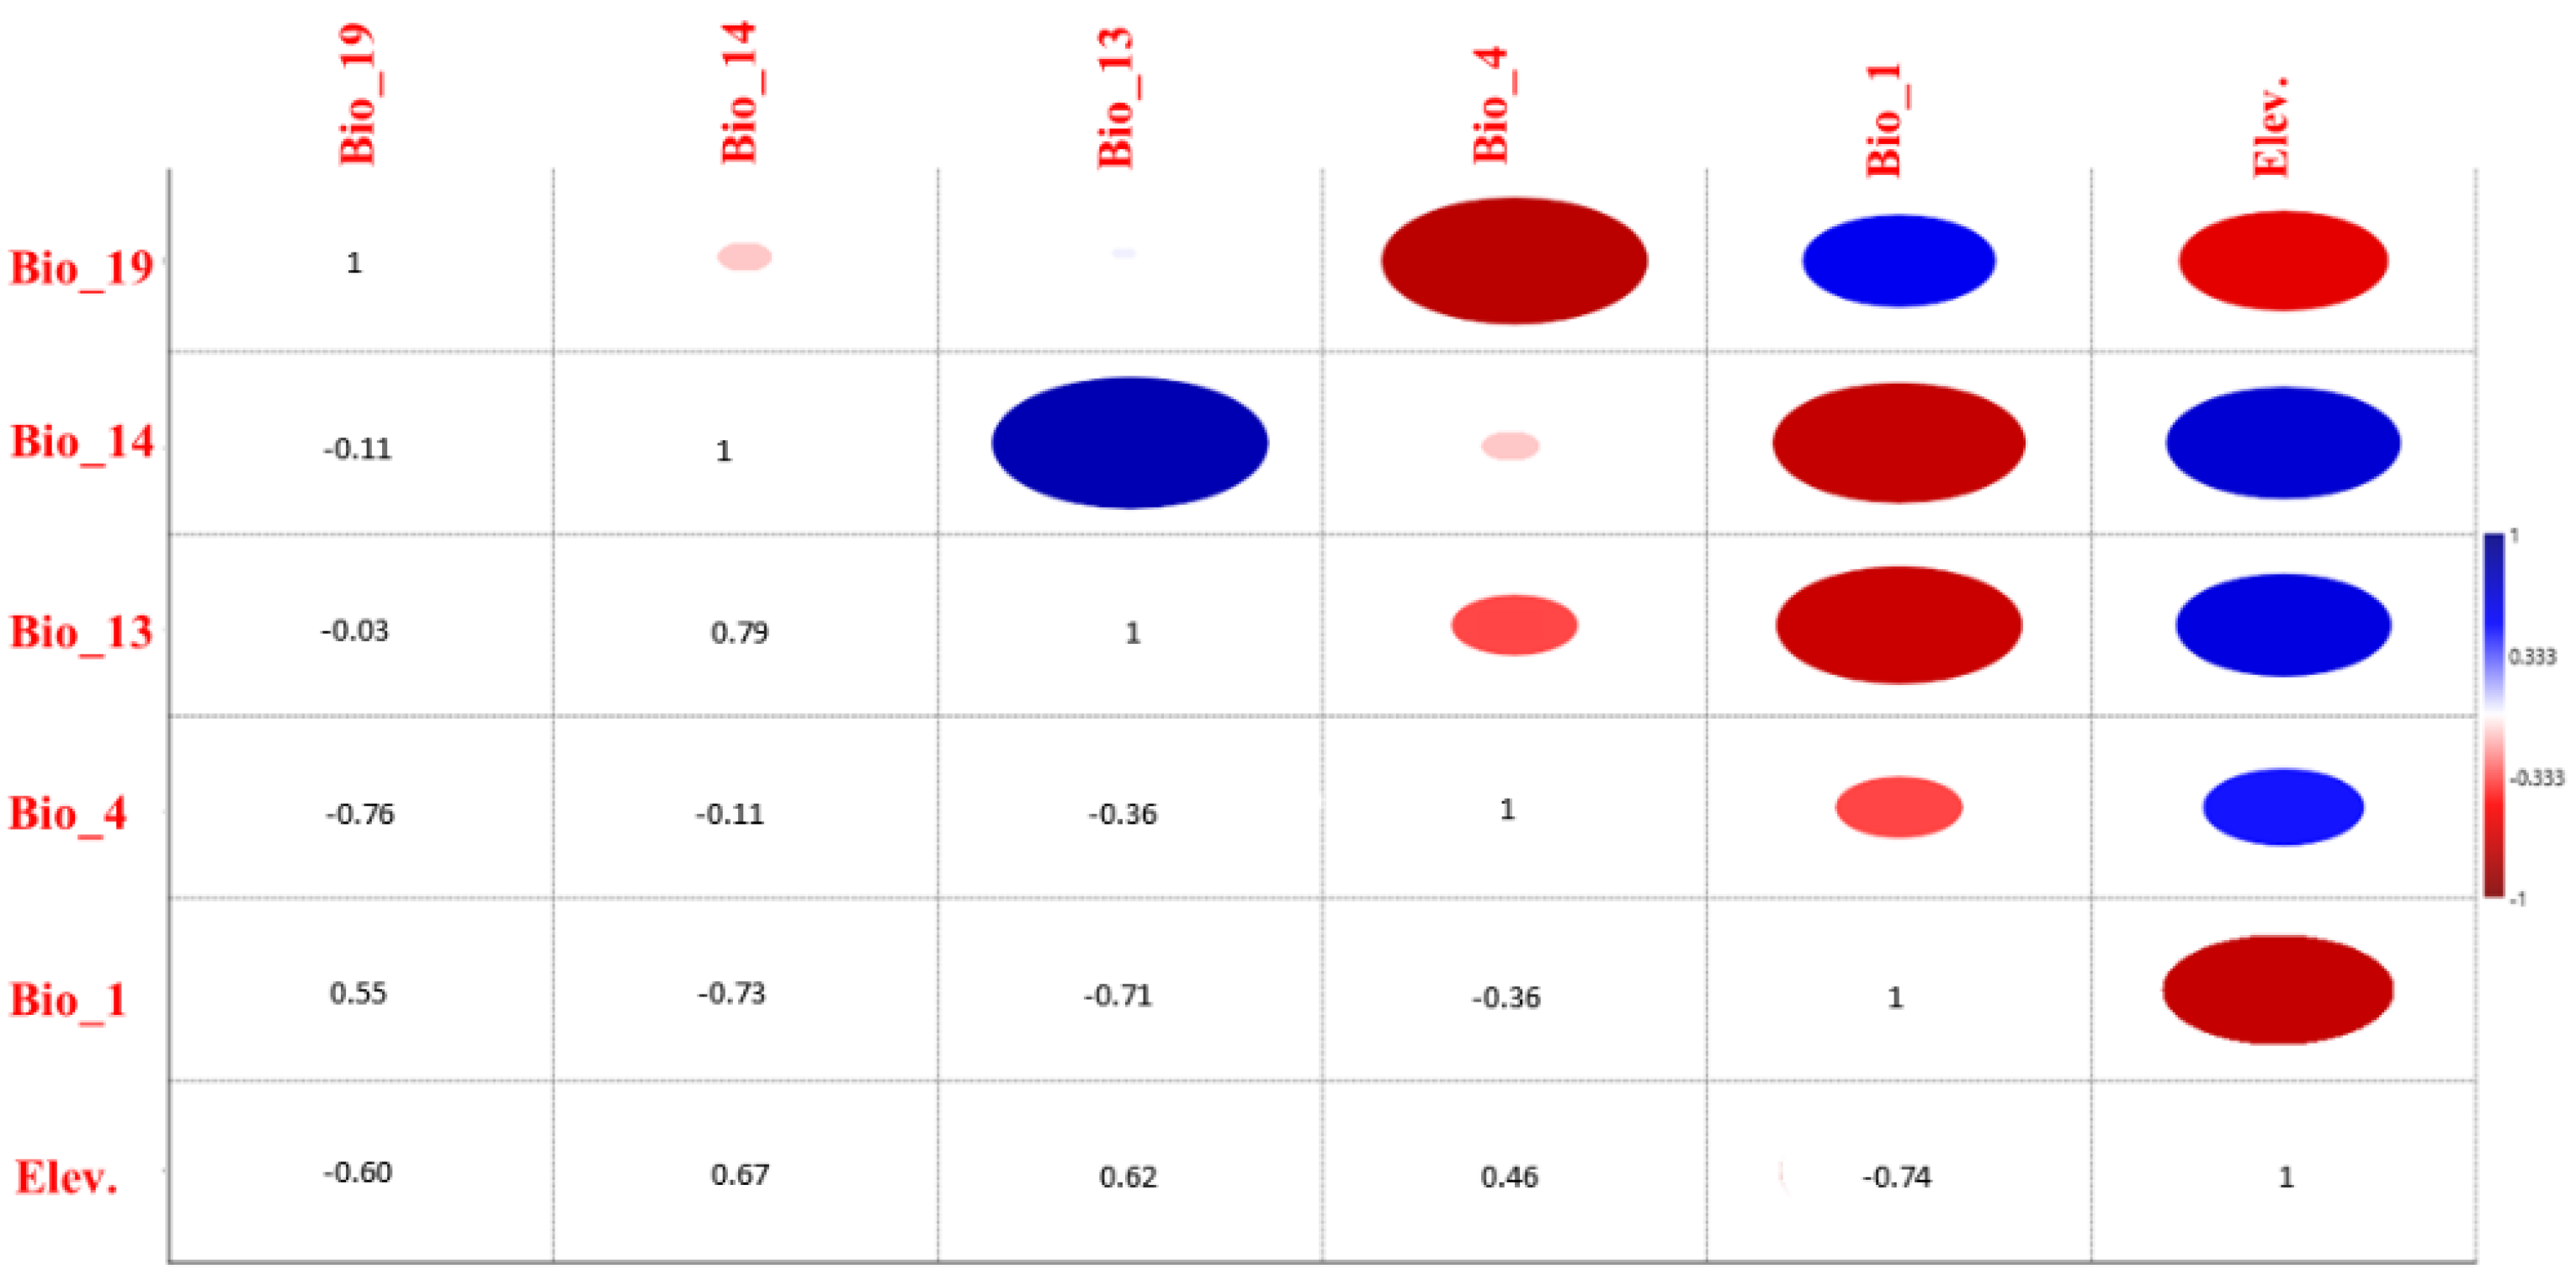
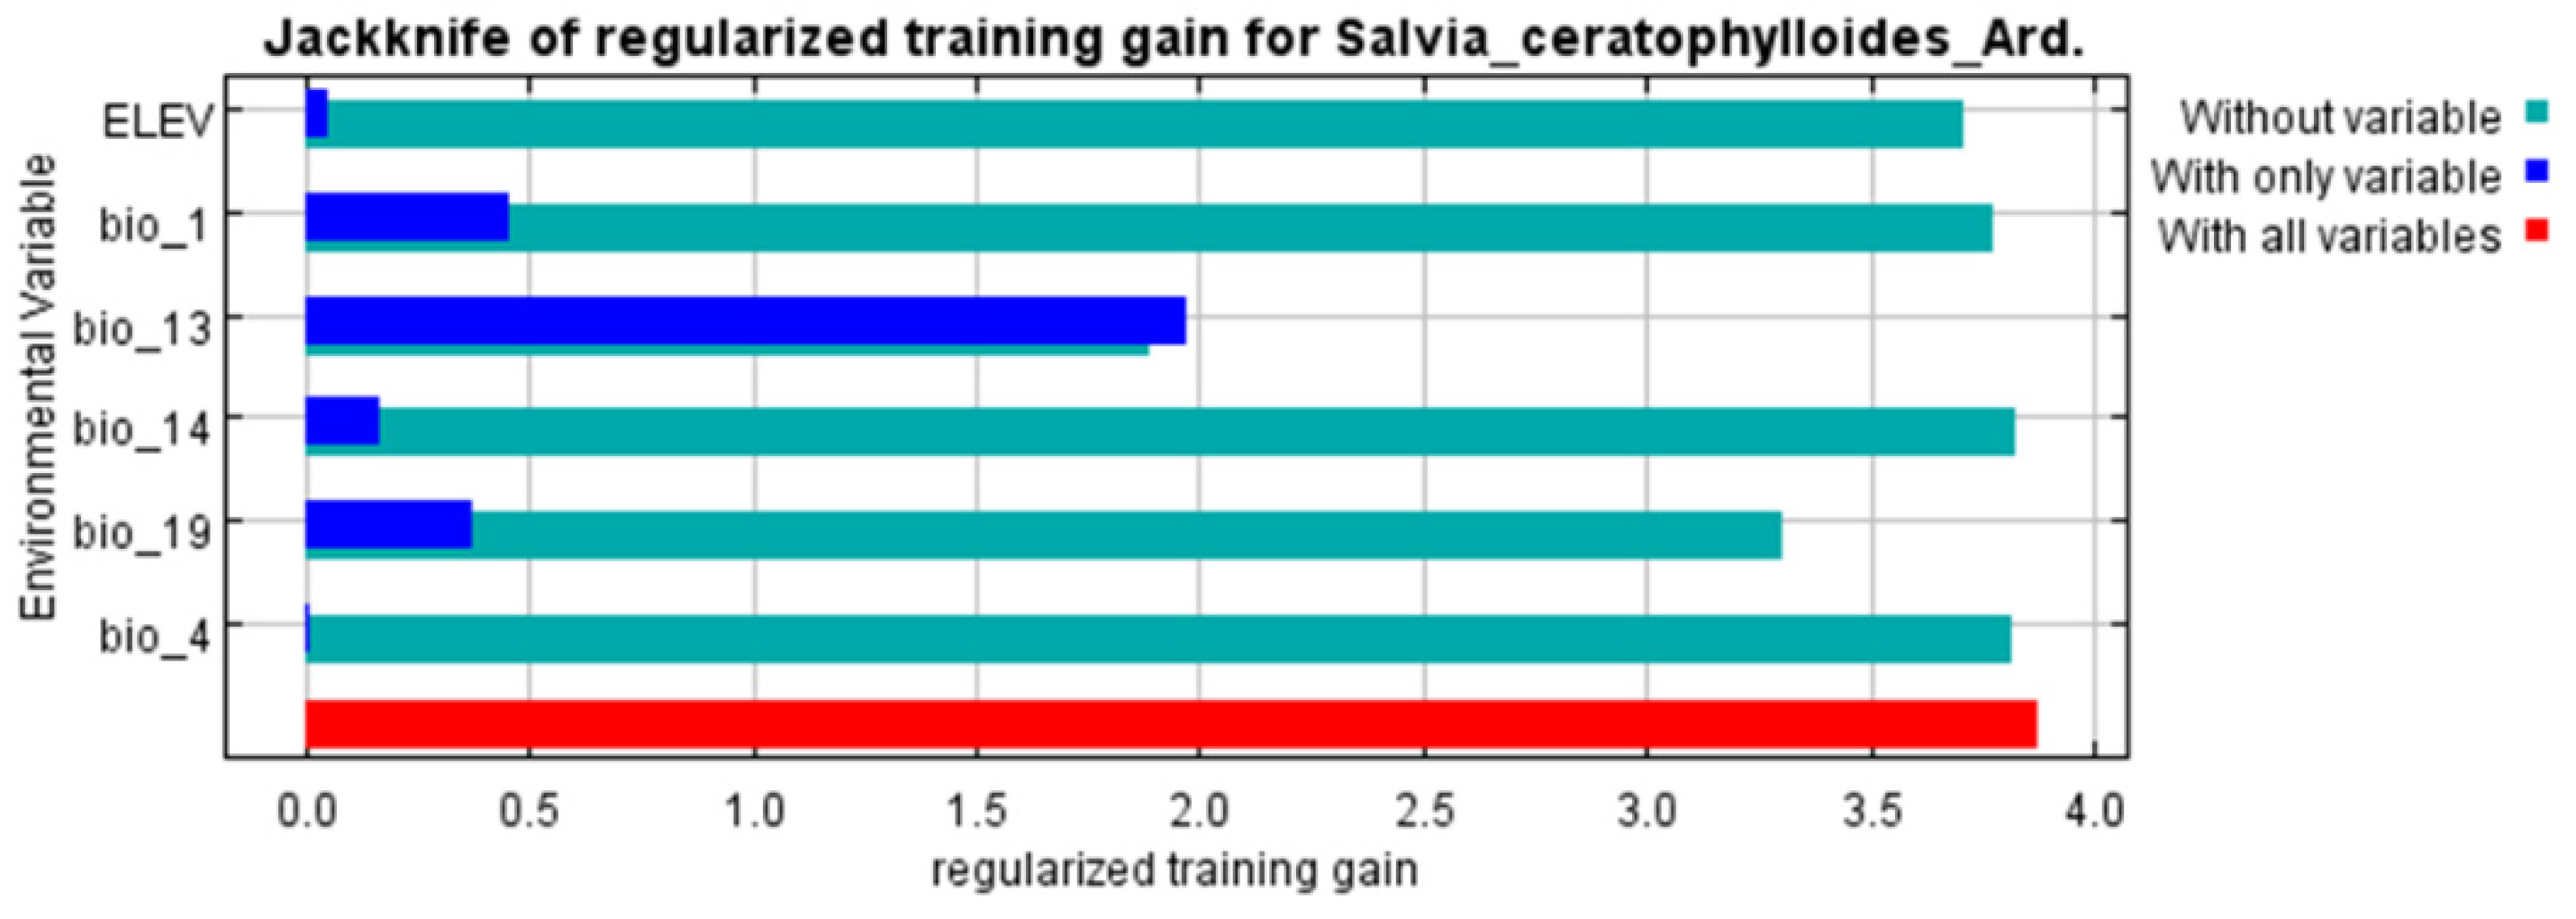
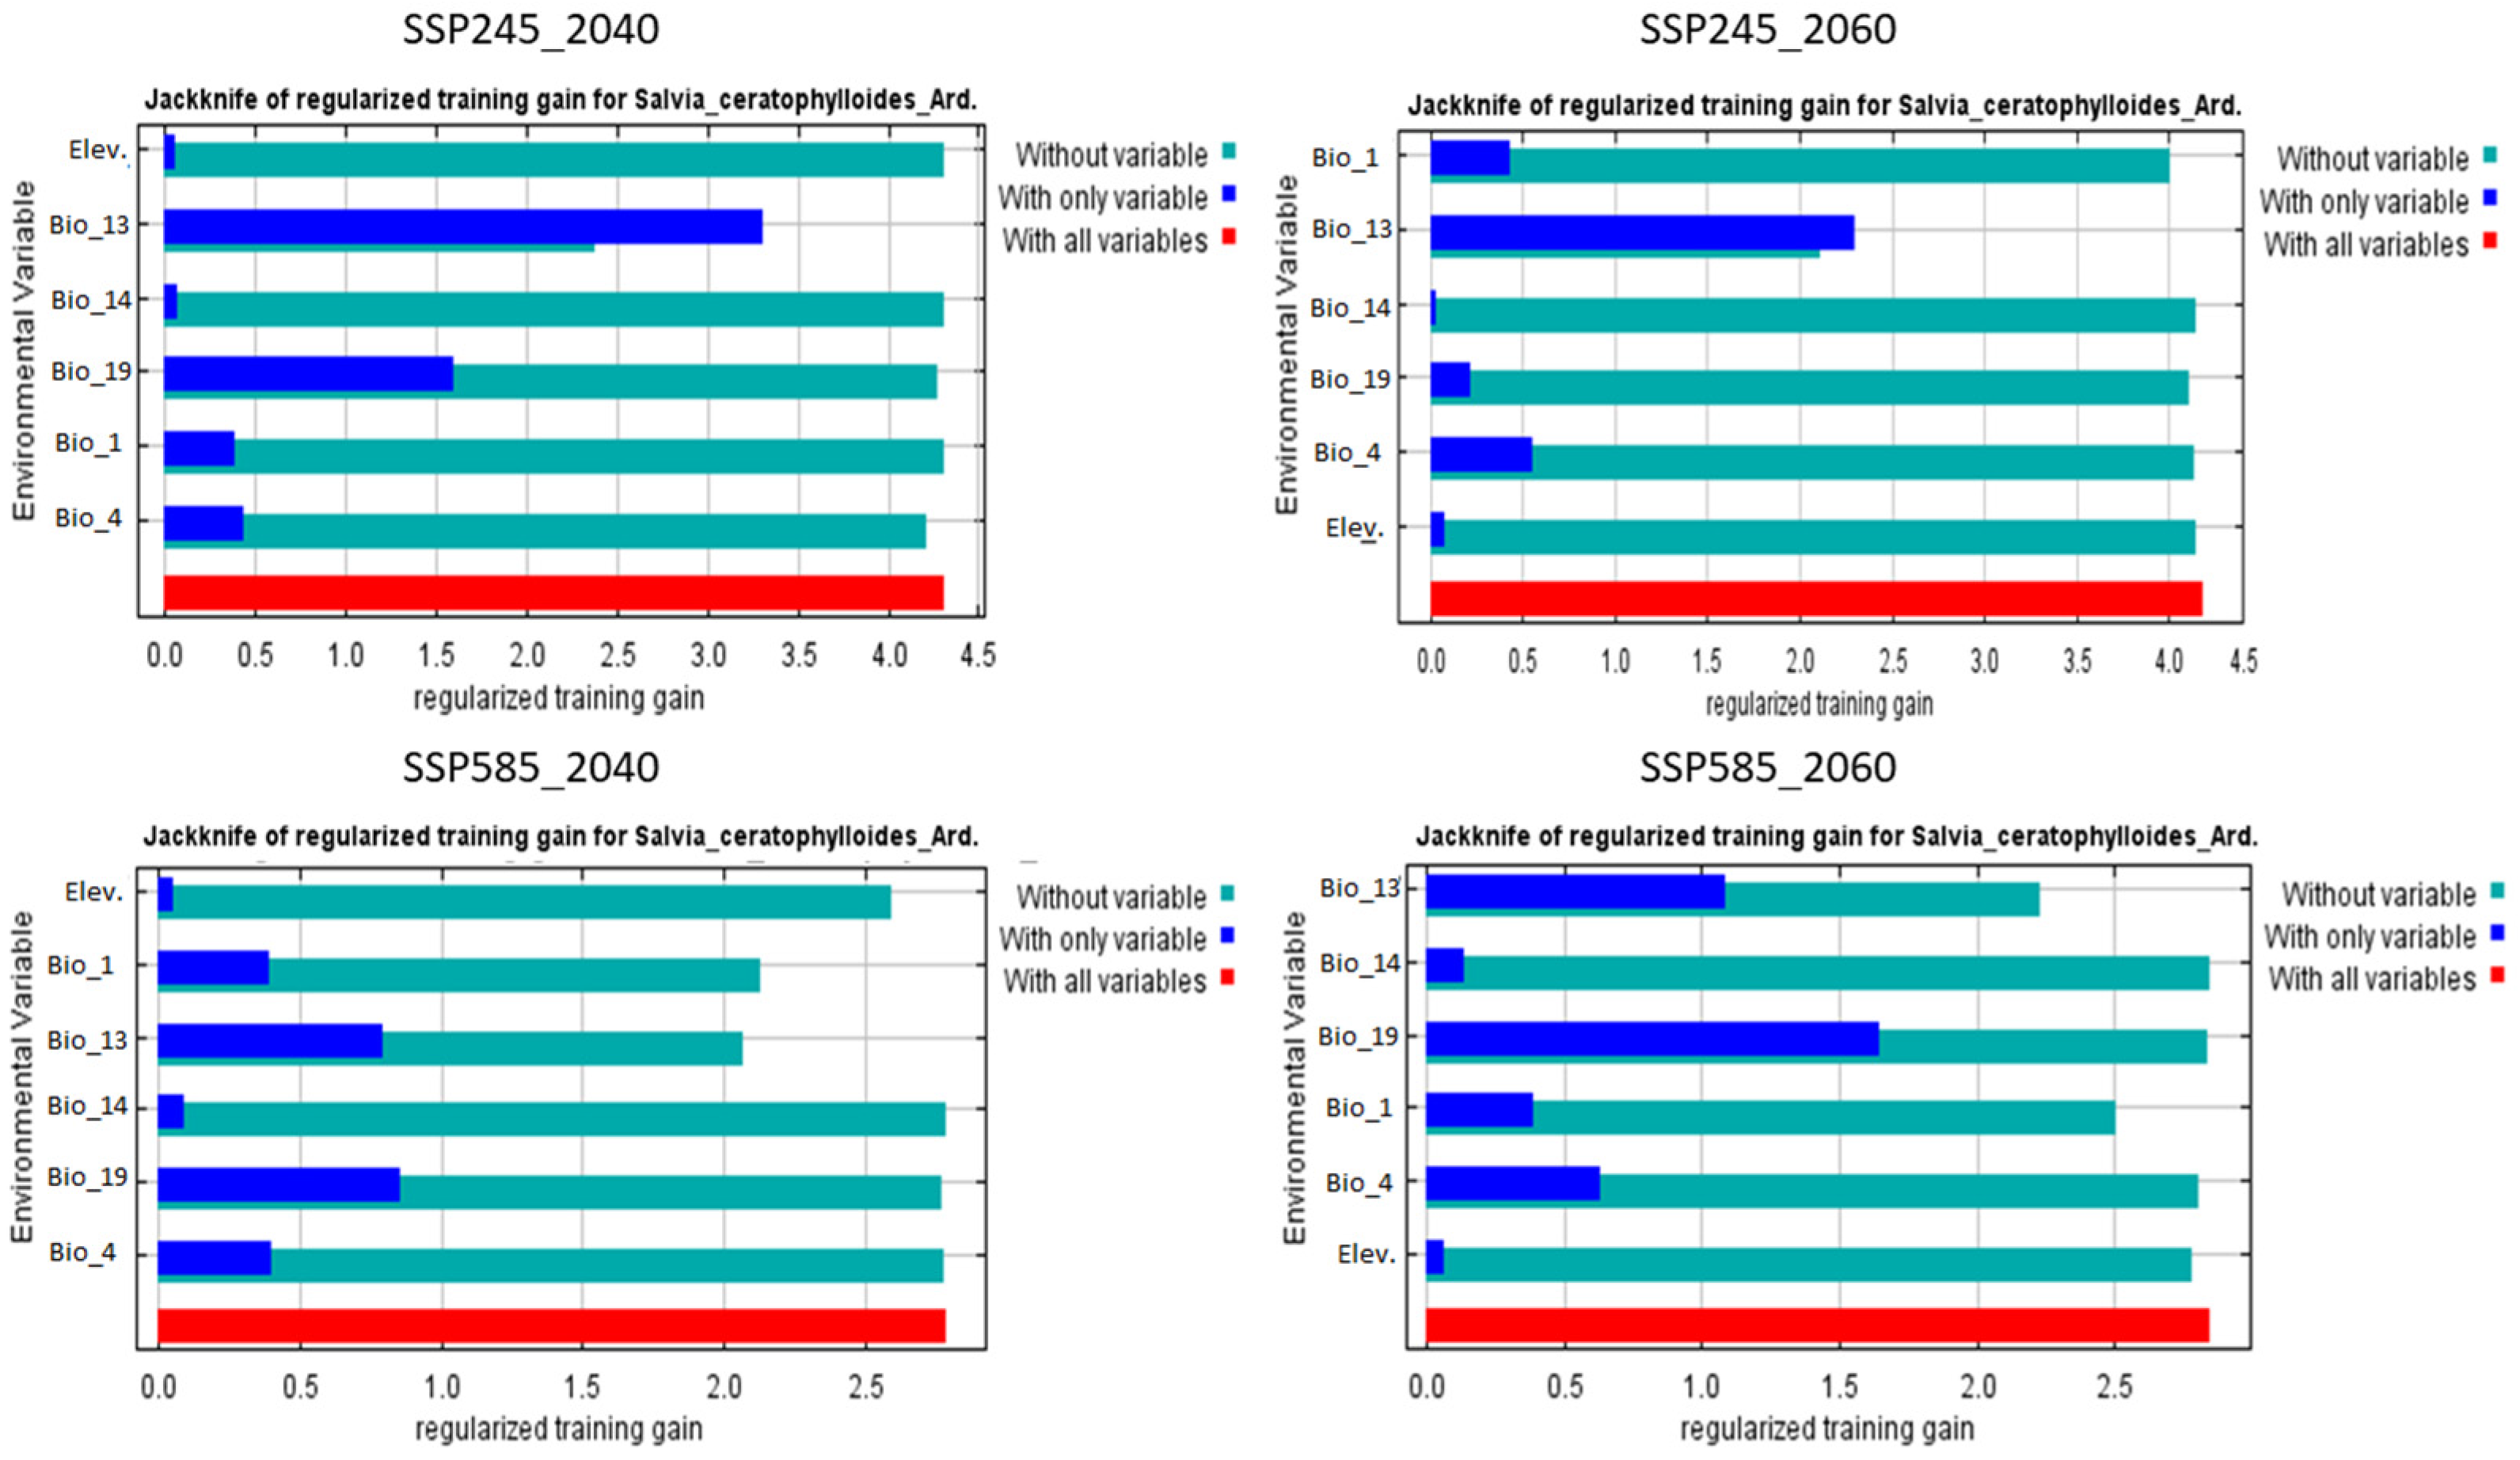
3.2. Analysis and Evaluation of Environmental Variables

The calibration of the current potential distribution model for S. ceratophylloides, using the variables thus selected, was optimal (AUC mean = 0.986, ±0.001; AUCDiff (0.09 ± 0.006).
From the results obtained with the jackknife test, we know that the distribution of S. ceratophylloides is mainly influenced by the precipitation of wettest month (Bio 13), the annual mean temperature (Bio 1), and the precipitation of the coldest quarter (Bio 19); these contributed 69.3%, 7.8%, and 11.4%, respectively, to the MaxEnt model (Figure 4). In addition, two other environmental variables (Bio 4, Bio 14) contributed a total of 8.3% to the habitat distribution model and 3.2% to the topographic variable (Elev.) (Figure 4, Table 2).
In view of the importance of the permutation, the precipitation of wettest month (Bio 13) had the greatest impact on the model with 66.9%, the annual mean temperature (Bio 1) with 13.3%, while the other variables contributed a smaller percentage, totalling 19.8%.
Considering the six bioclimatic variables previously selected, the mean annual temperature range (Bio 1) of S. ceratophylloides is 15.7–19.7 °C, and the temperature seasonality (Bio 4) is 549–576%. In addition, the average precipitation in the wettest month (Bio 13) is 108–111 mm, in the driest month (Bio 14) it is 10–15 mm, and in the coldest quarter (Bio 19) it is 256–297 mm, on average. The altitude ranges from 11 to 689 m a.s.l.

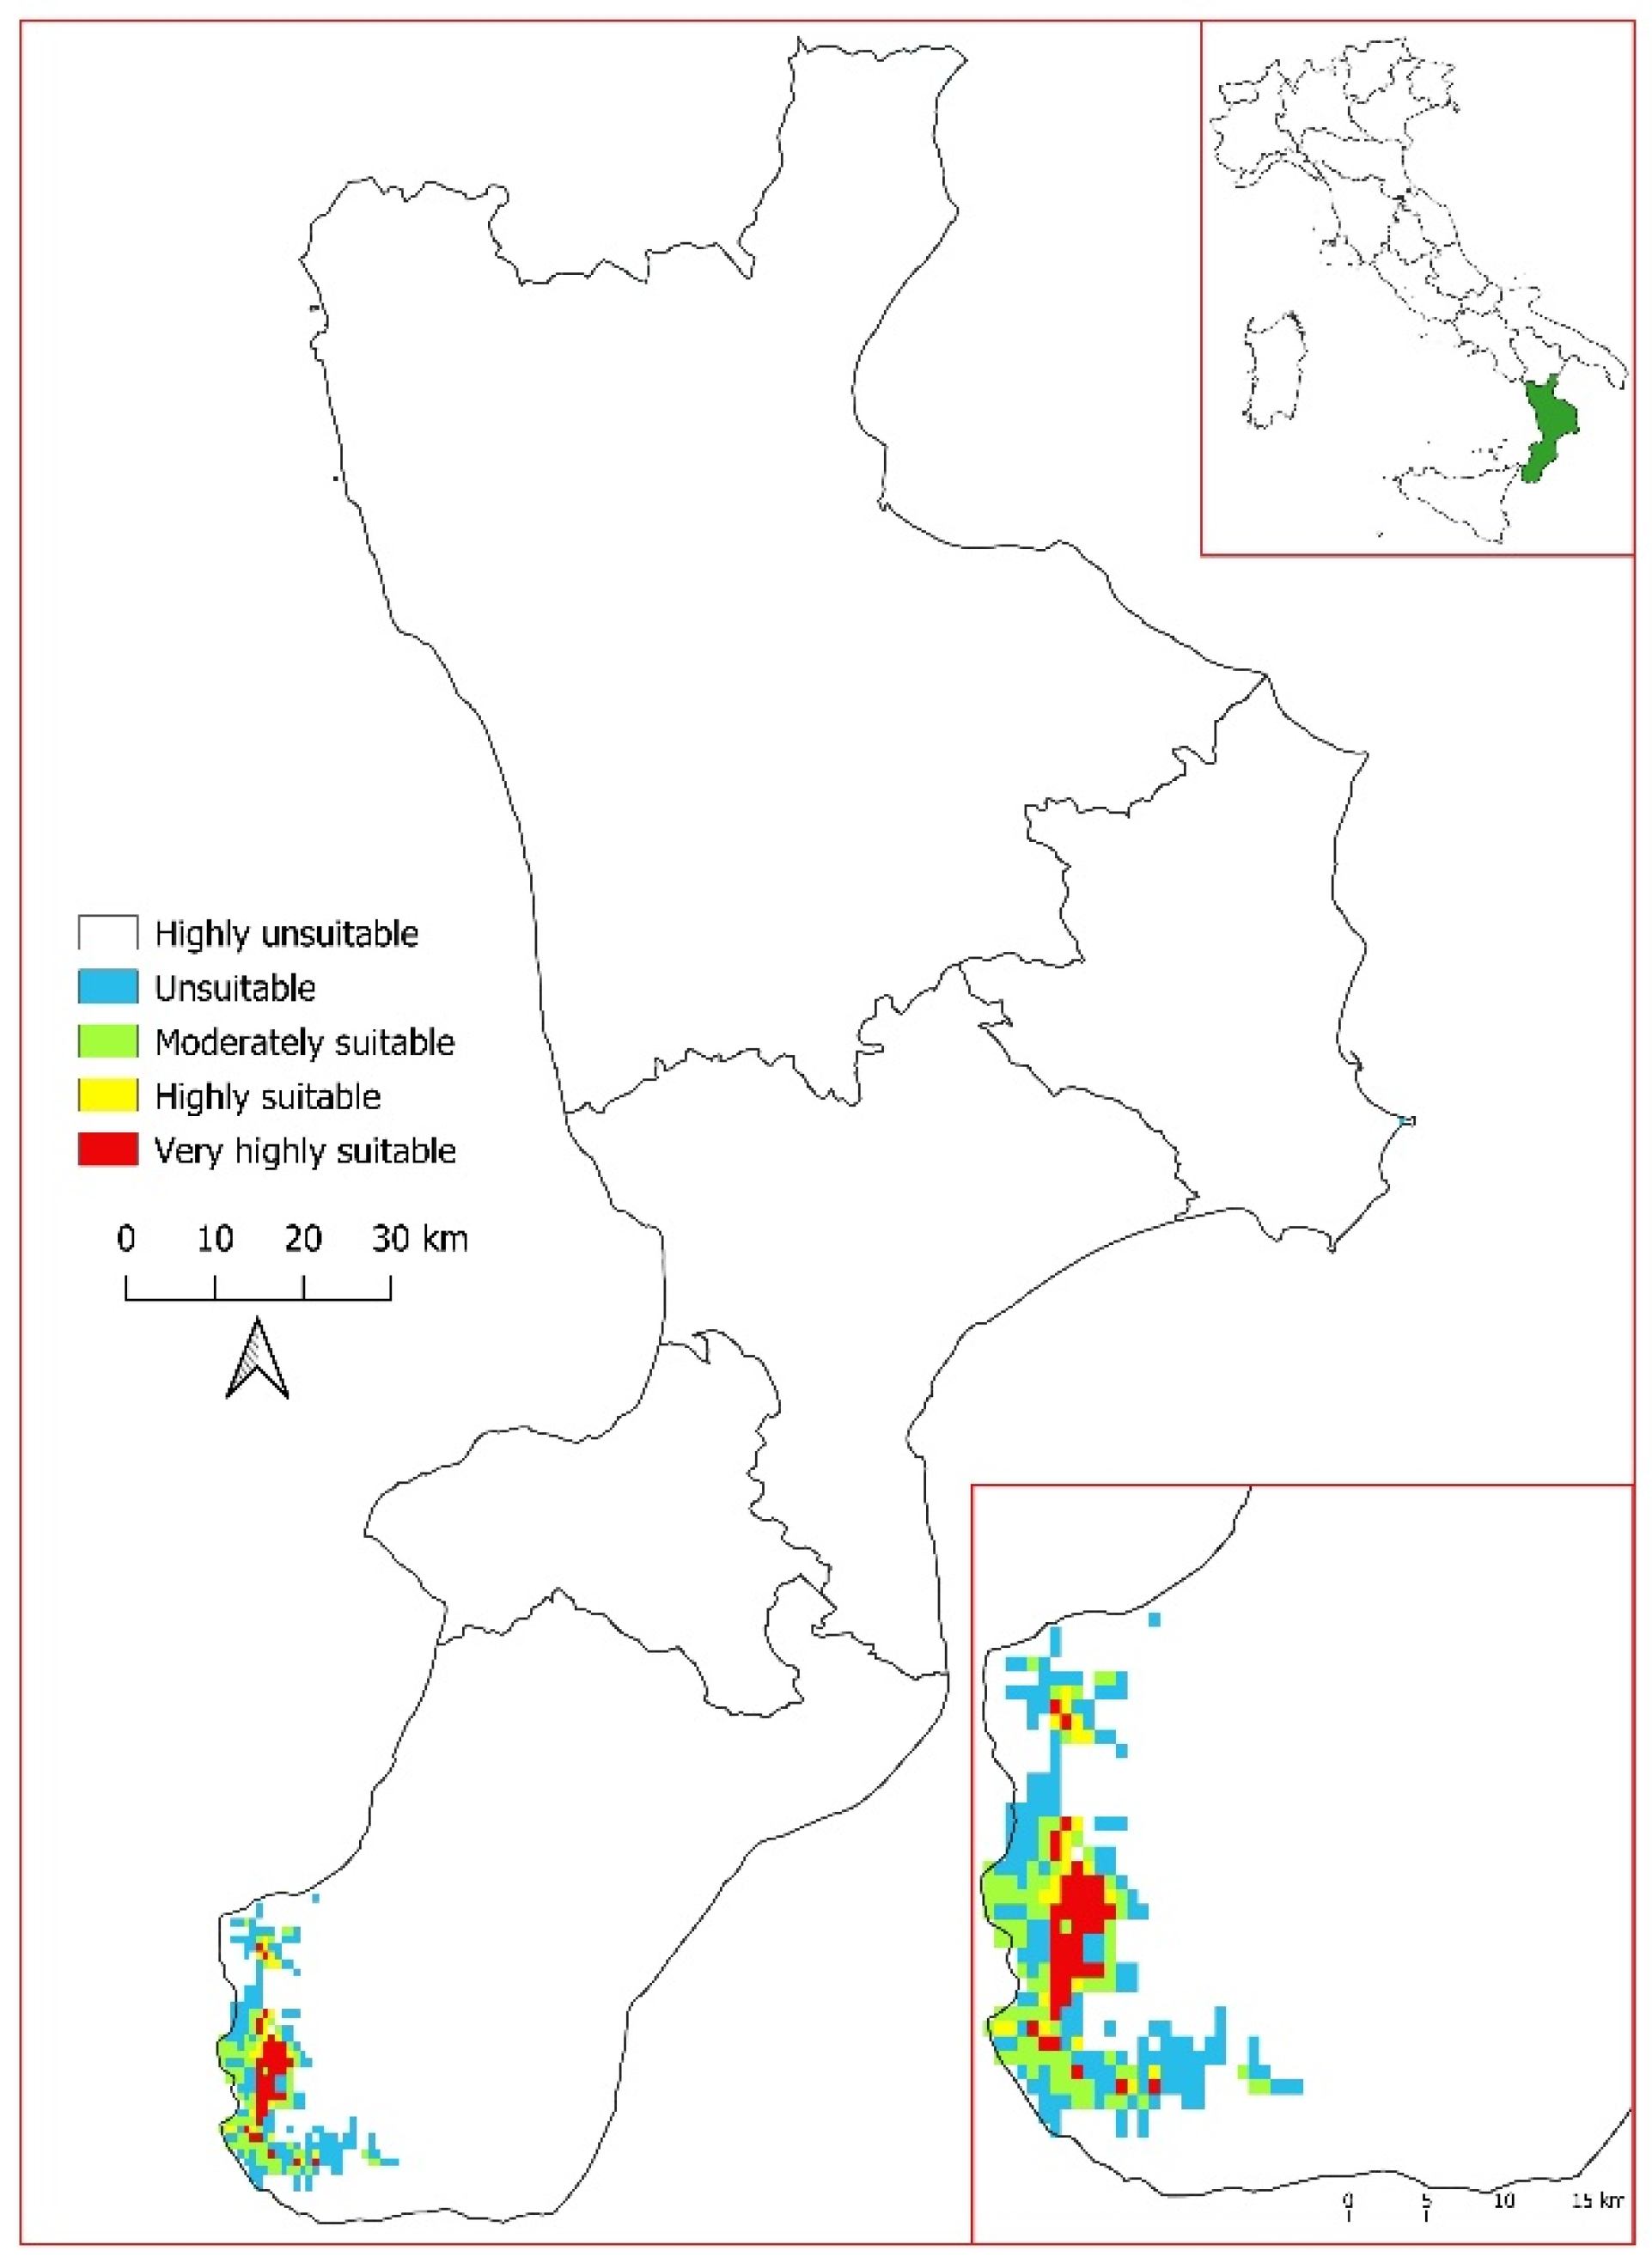
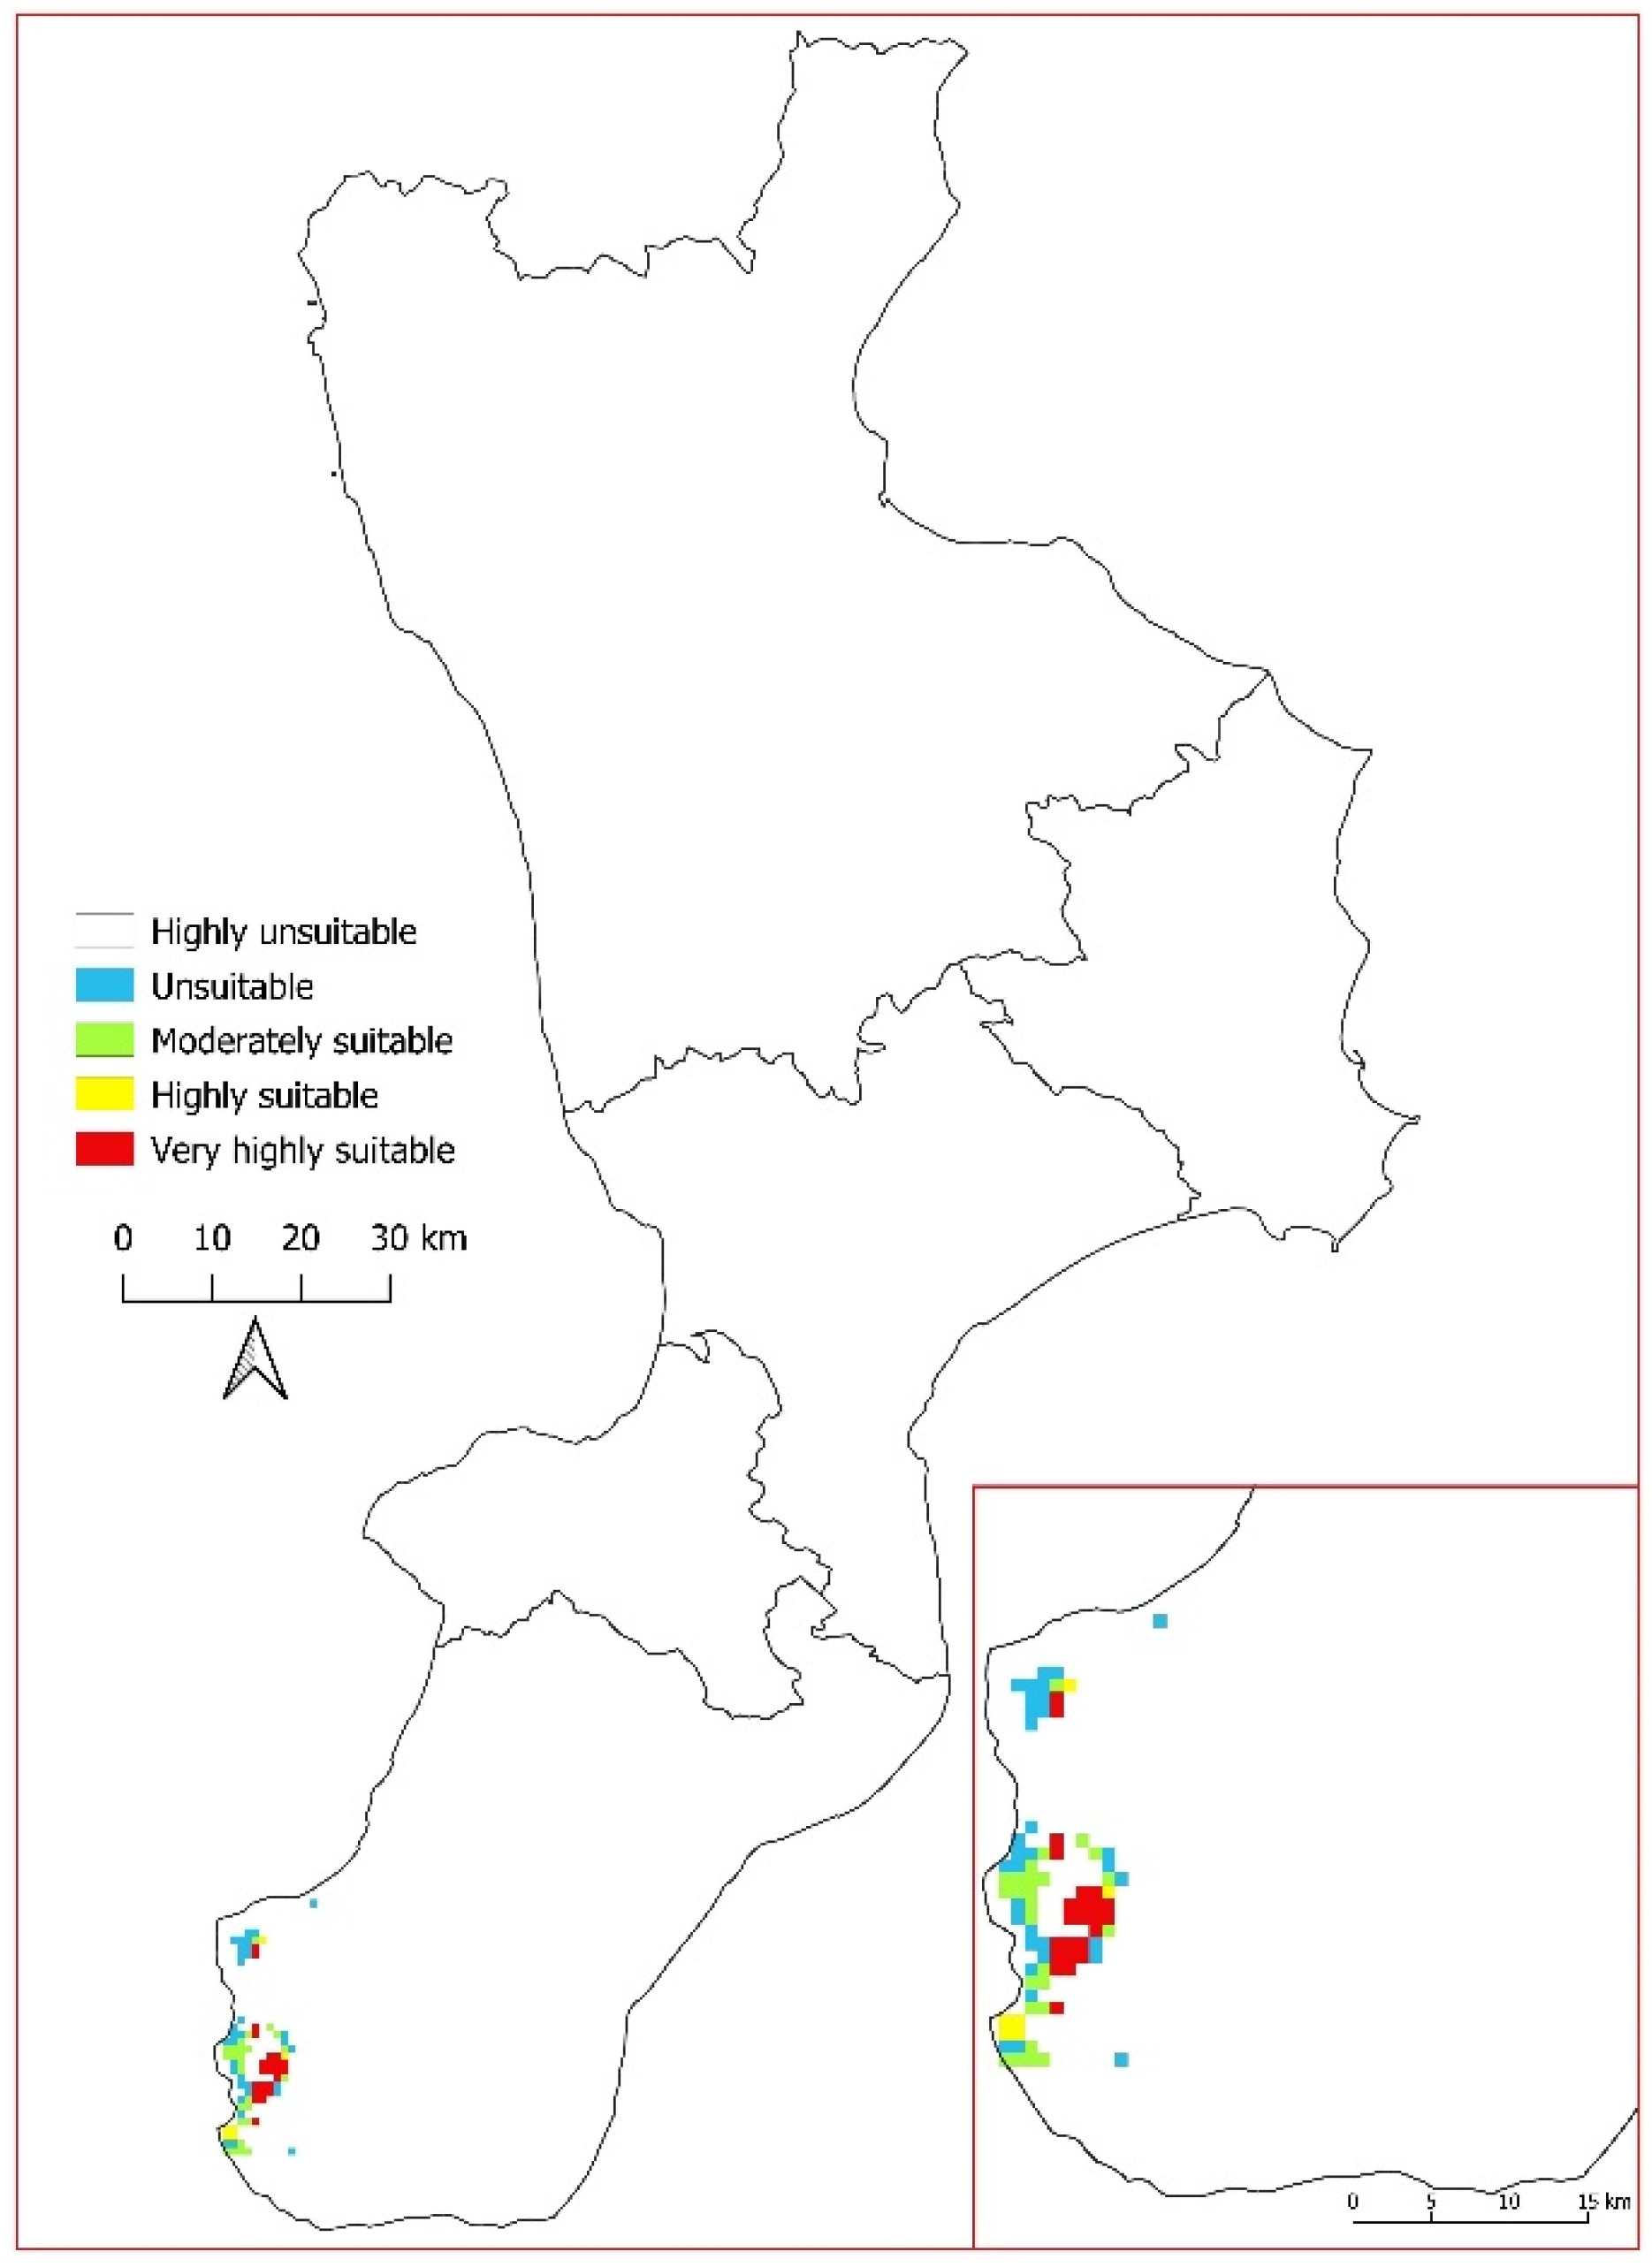
3.3. Current Potential Distribution of Salvia ceratophylloides

The current estimated potential habitat for S. ceratophylloides is located exclusively in the south/west of the Italian peninsula and Calabria (Figure 5): this corresponds to a total area of 237.321 km2, equal to 1.58% of the entire regional territory and 0.08% of the Italian territory. In relation to the probability of occurrence of the species, the area is distributed as follows: very highly suitable (≥0.80) with an area of 30,440 km2 (0.20%); highly suitable (0.61–0.80) with an area of 20,962 km2 (0.14); moderately suitable (0.41–0.60) with a surface area of 59,434 km2 (0.39%); and unsuitable (0.21–0.40) with a surface area of 126,485 km2 (0.84%). The remaining territory (14,813,597 km2, 98.42%) is unsuitable for the species (Table 3).

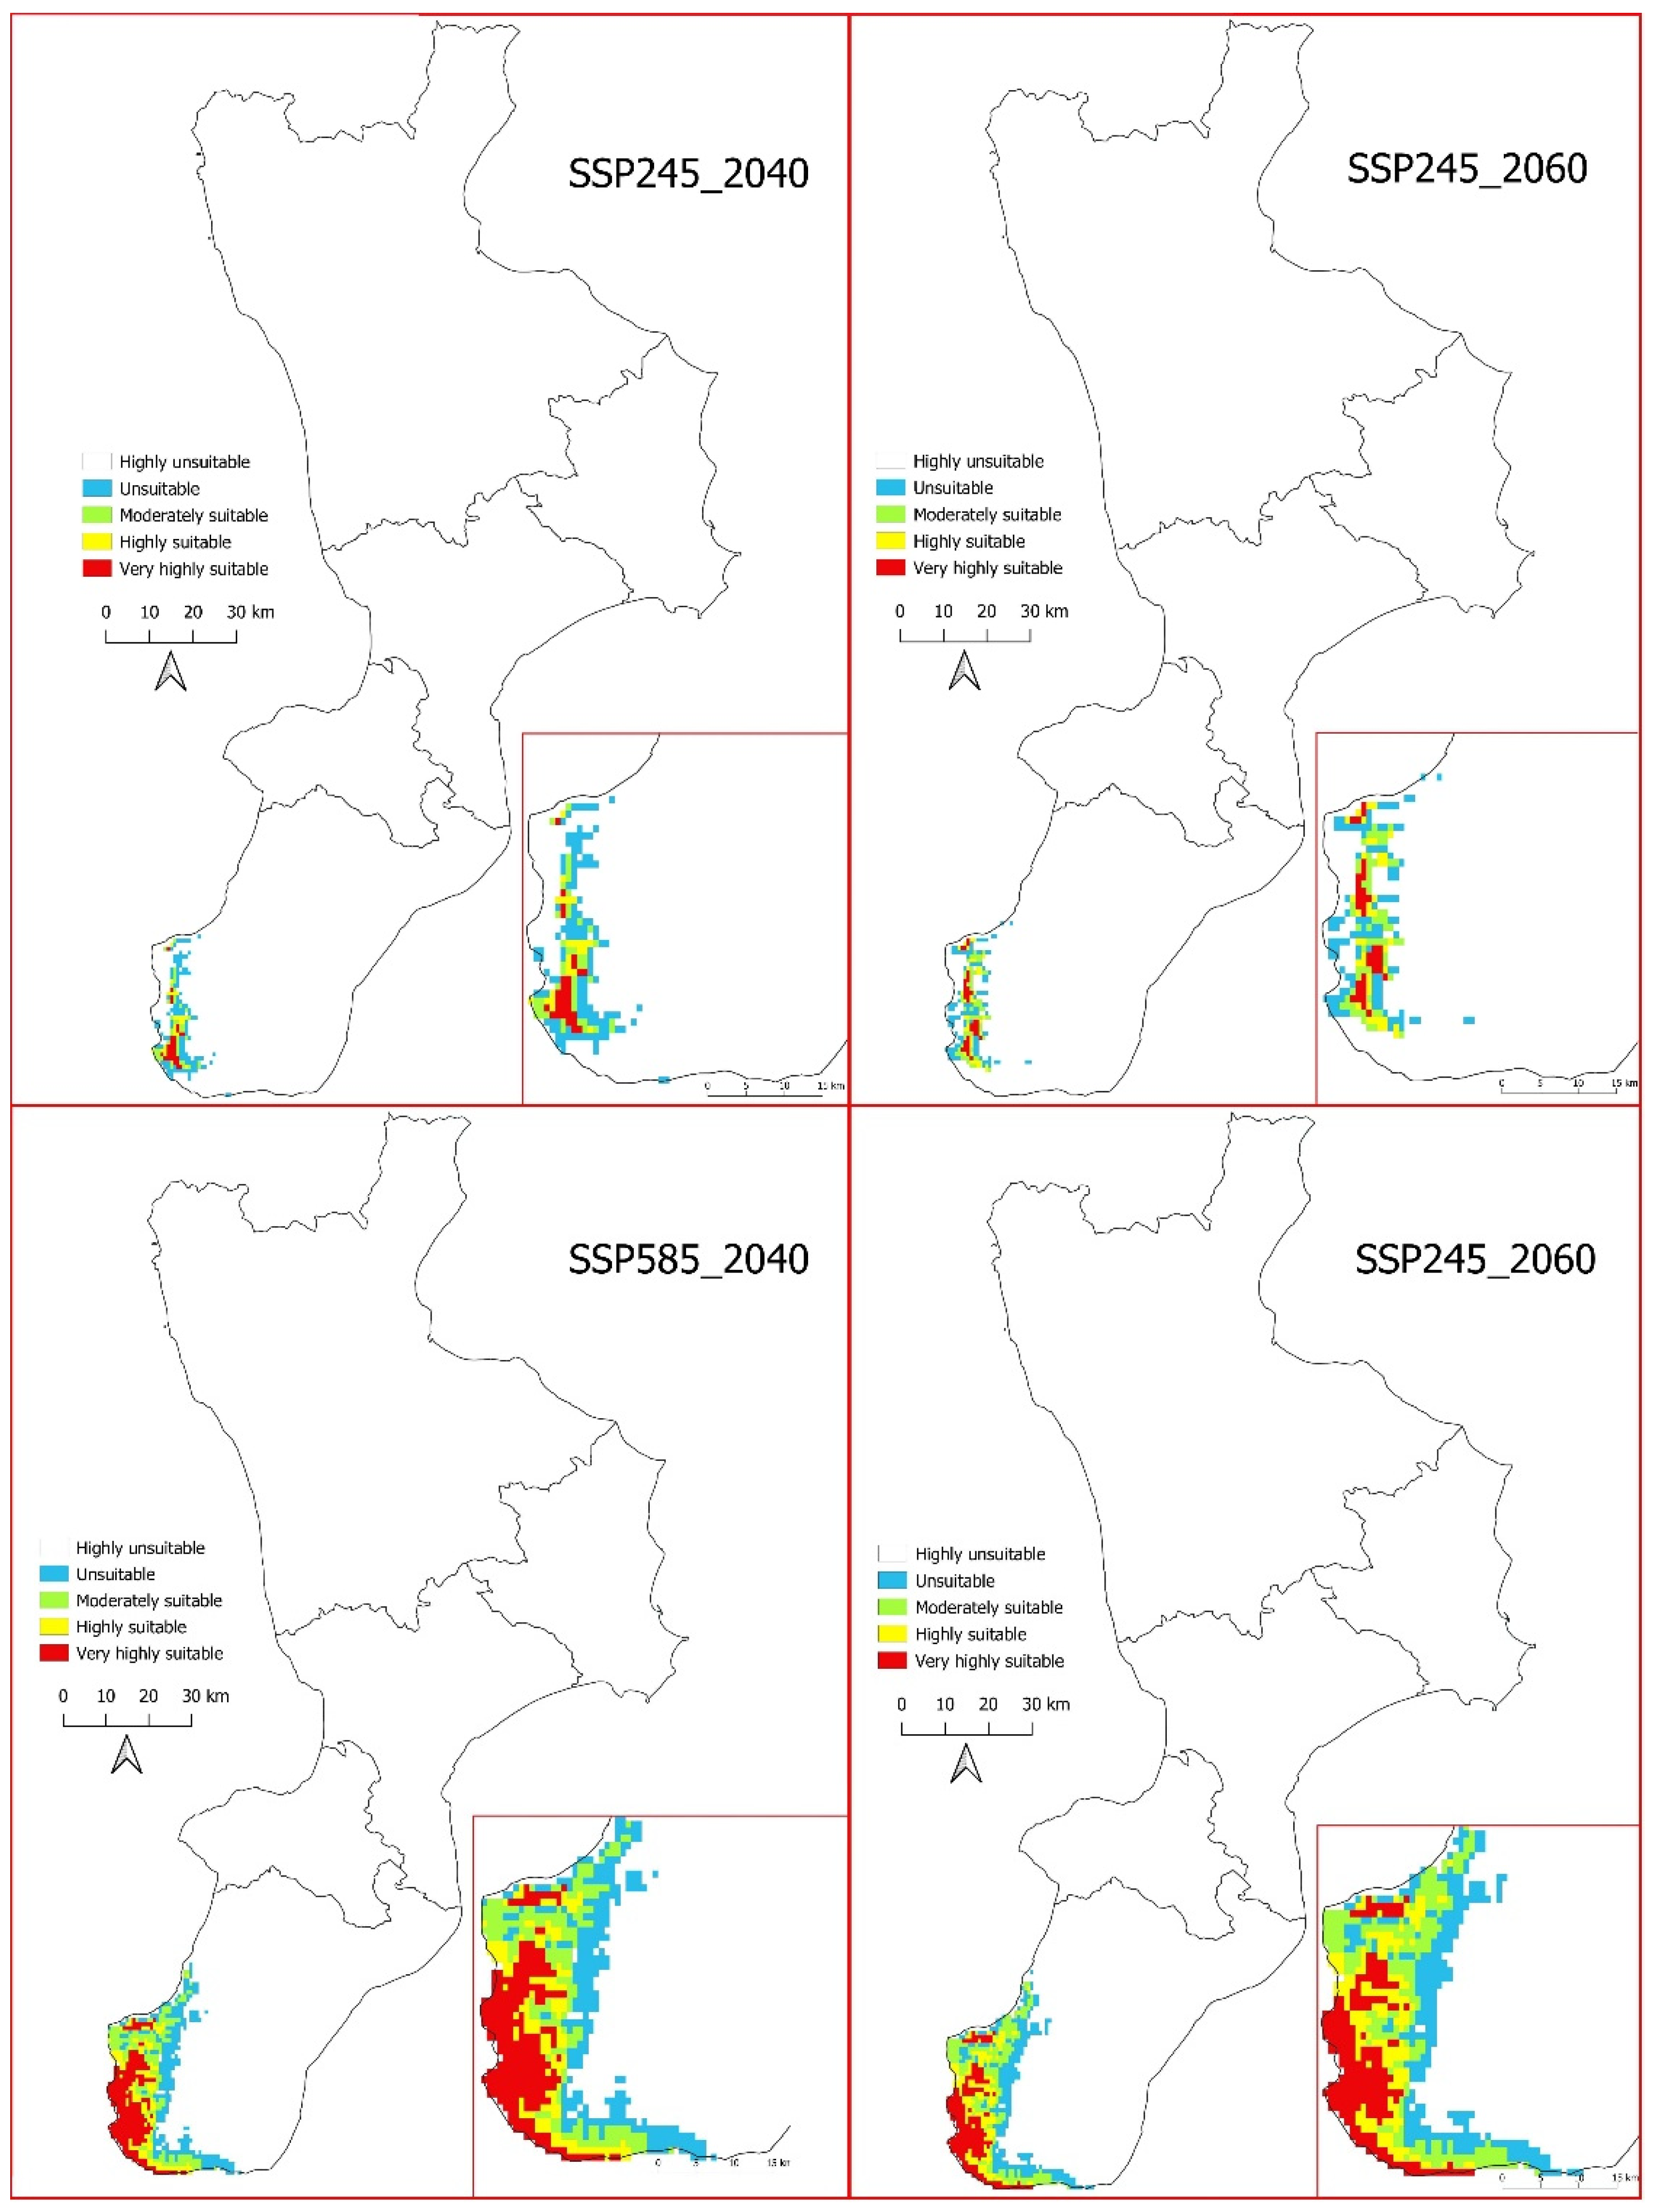
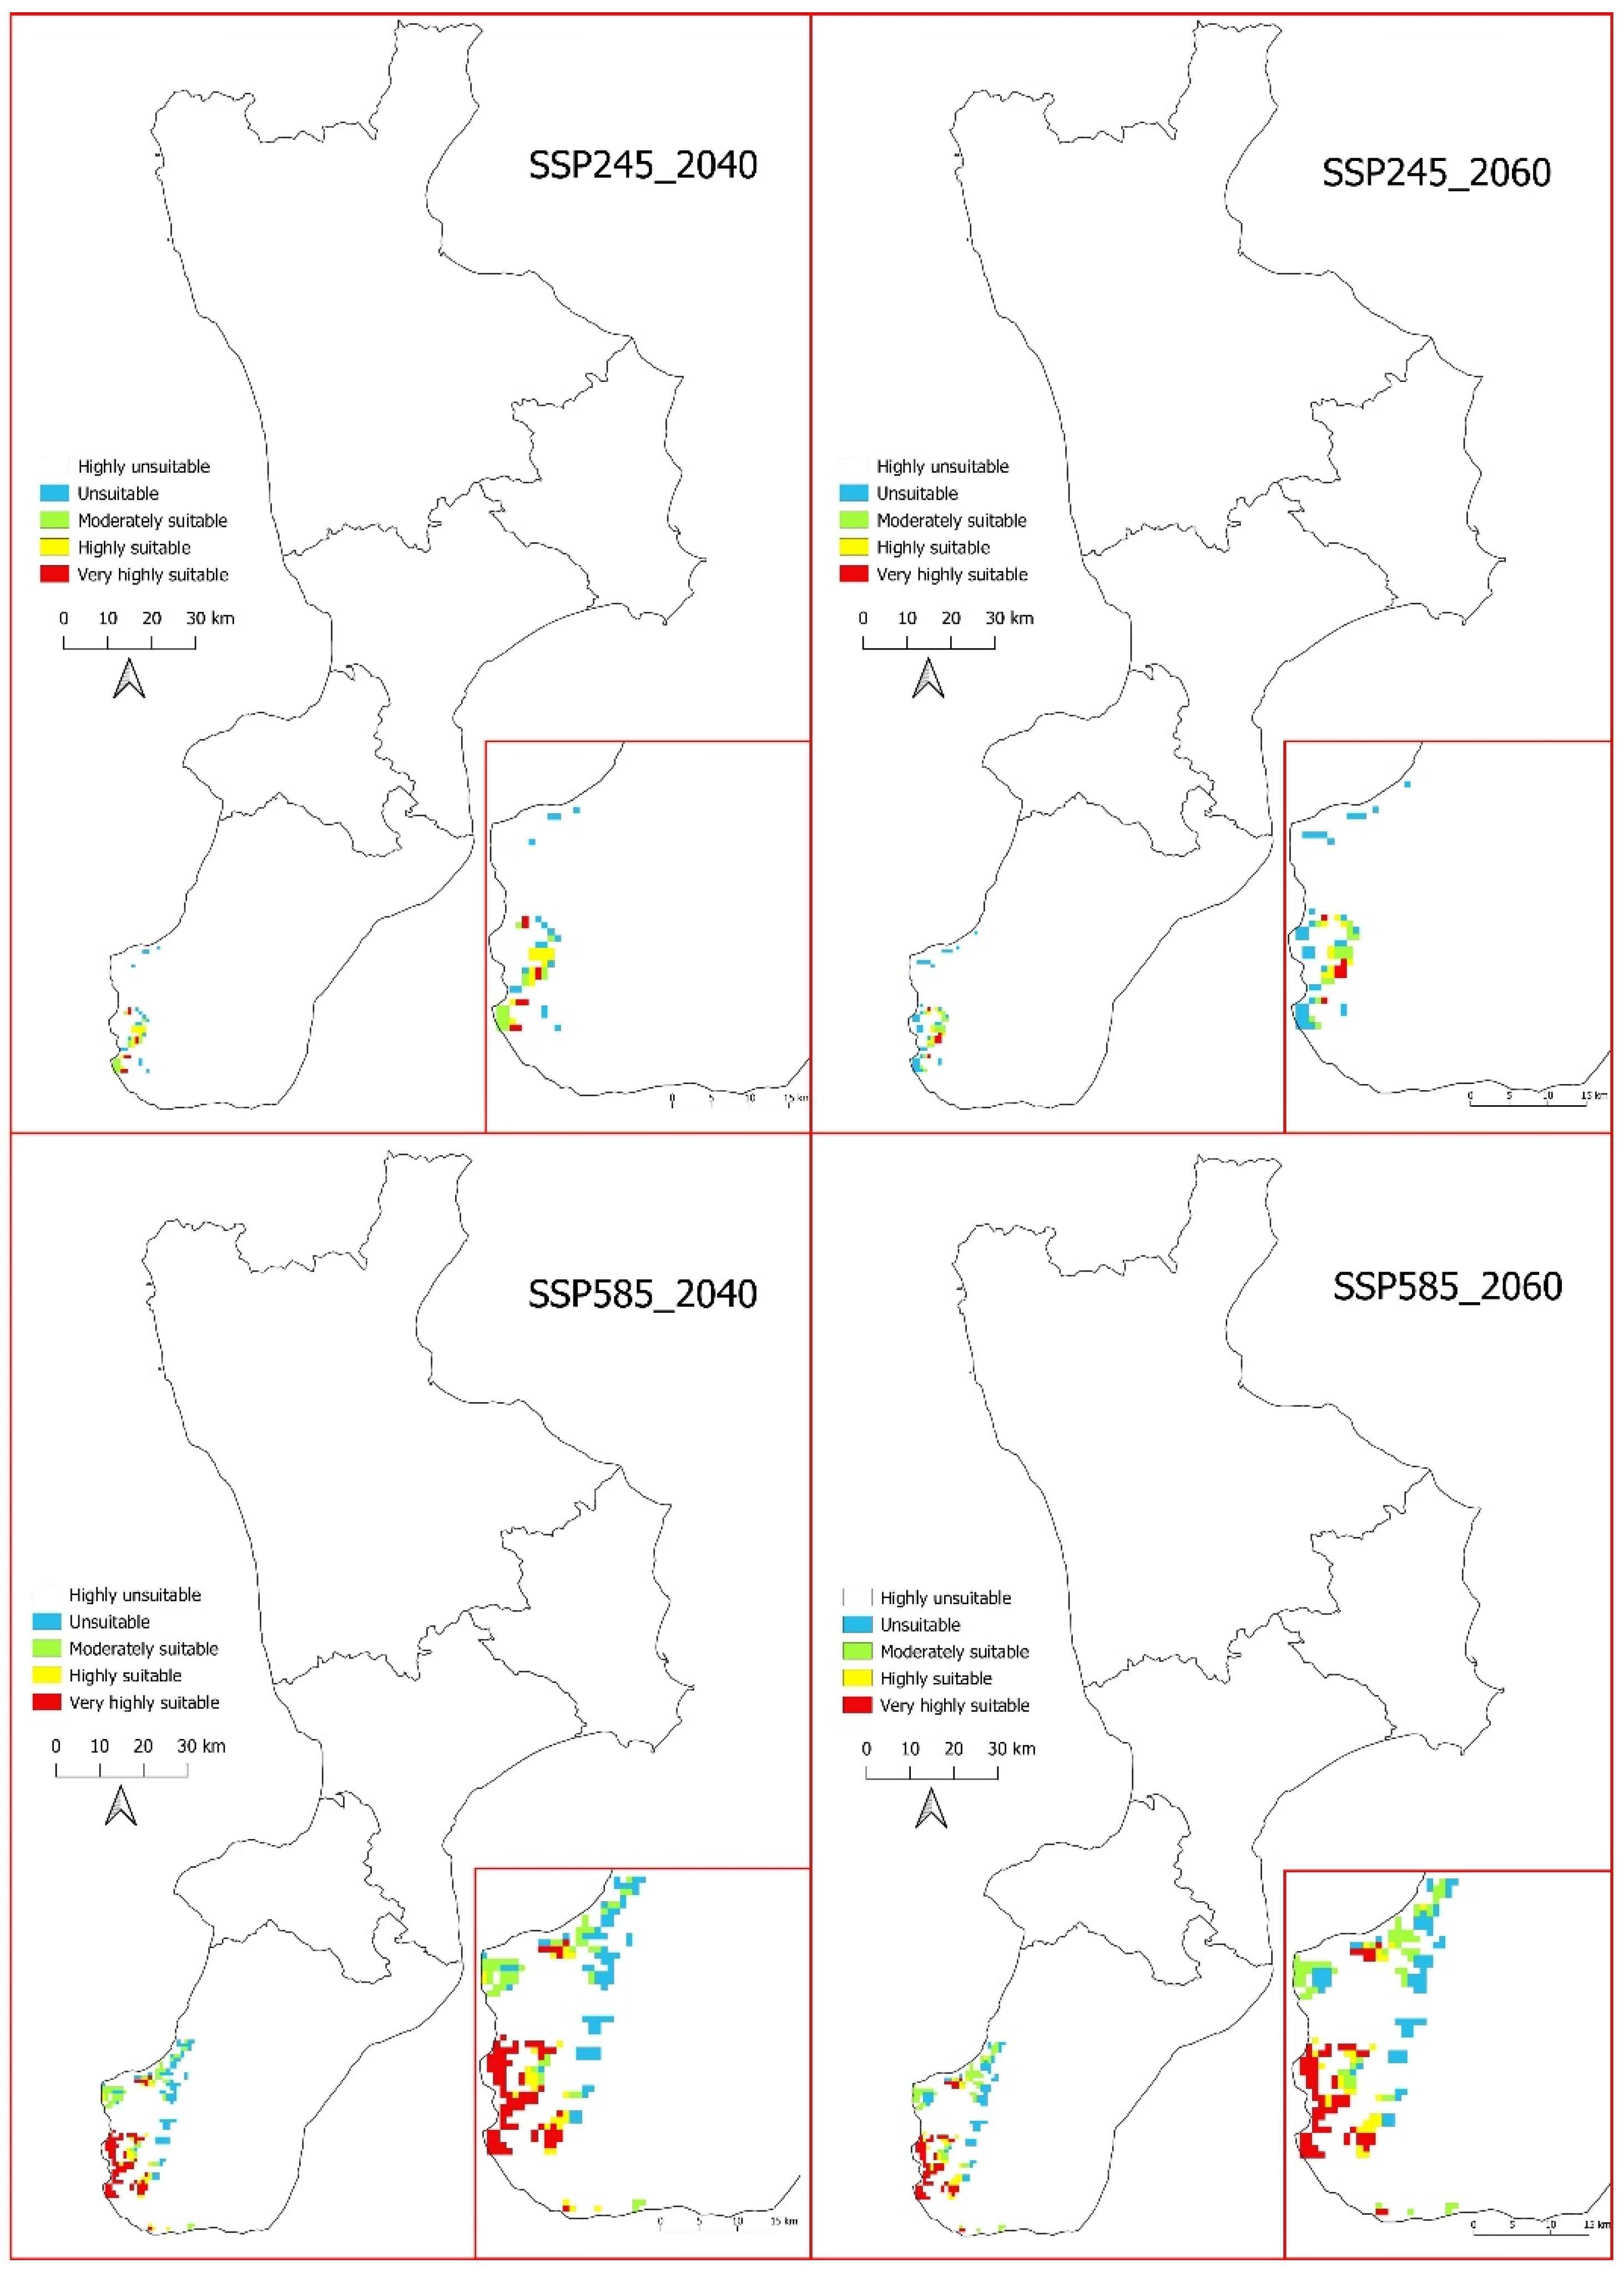
3.4. Future Potential Distribution of Salvia ceratophylloides

The jackknife test (Figure 6) reveals that the distribution of S. ceratophylloides with SSP 245 over the 2021–2040 period is mainly influenced by the precipitation of the wettest month (Bio 13) with 86.3%, an annual mean temperature (Bio 1) with 7%, and a temperature seasonality (Bio 4) with 5.5%; the remaining variables contributing a total of 1.2%. Regarding the importance of permutation, the most influential variable is Bio 13 with 97.8%. With SSP 245 in the 20-year period between 2041–2060, the variables that contribute the most are the precipitation of the wettest month (Bio 13) with 73.4%, the temperature seasonality (Bio 4) with 12.1%, and the annual mean temperature (Bio 1) with 11.9%; the remaining variables contribute a total of 2.6%.
Regarding the SSP585 scenario in the 20-year period between 2021–2040, the variables contributing most to the model are Bio 13 with 40.7%, Bio 1 with 24.4%, Bio 4 with 15.4%, and Elev. with 16.5%; the remaining variables contribute 3% (Table 2). By permutation importance, there are Bio 1 with 52.4%, Bio 13 with 25%, and Bio 19 with 21.7%; the remaining variables with 0.8%. For the 20-year period between 2041–2060, the variables contributing most to the model are Bio 19 with 42.6%, Bio 13 with 25.6%, Bio 1 with 16.5%, and Bio 4 with 14.2%; the other variables contribute 1.1%. With regard to the importance of permutation, the most influential variables are Bio 4 with 76%, Bio 1 with 15.4%, and Elev. with 6.2%; the other variables account for 2.4% (Table 2).
The future potential distribution of S. ceratophylloides, estimated for two types of scenarios (SSP245 and SSP585), always occupies the south/west part of the Italian peninsula and Calabria (Figure 7), without expanding into other parts of the region. The habitat suitable for the species covers a total area of 153,321 km2 (1.02%) in the SSP245 scenario, 2021–2040 and 171,414 km2 (1.14%) in the SSP245 scenario of the following 20 years. It can be seen that, from the current distribution model, there is a decrease of 83,335 km2 or 35% in the 20-year period between 2021–2040, and a decrease of 28% in the following 20-year period, with a loss of 65,907 km2. In relation to the probability values for the presence of the species in the area of the SSP245 model, 2021–2040, is distributed as follows: very highly suitable (≥0.80) with an area of 25,020 km2 (0.17%); and highly suitable (0.61–0.80) with an area of 18,258 km2 (0.12%) (Table 3, Figure 7). The area of the SSP245 model, 2041–2060 is distributed as follows: very highly suitable (≥0.80) with an area of 29.071 km2 (0.19%); and highly suitable (0.61–0.80) with an area of 22.984 km2 (0.15%) (Table 3, Figure 7). It can be seen that the most significant decrease is in the optimal occurrence probability value of the species (≥0.80) with 17.81%, or 5420 km2, less in the SSP245 scenario 2021–2040, compared to the current scenario; in the SSP245 2041–2060 scenario, it is 4.5%, or 1369 km2, less.
The distribution model with the SSP585 scenario, shows a total area, suitable to host the species, of 633.513 km2 (4.21%) in the 20-year period between 2021–2040 and 643.814 km2 (4.28%) in the 20-year period between 2041–2061. Compared to the modelling of the current potential distribution, we can see an increase in area of 396.192 km2 or 167%, in the 20-year period between 2021–2040, and an increase of 171% in the following 20-year period, with an increase of 65.907 km2. In relation to the probability values for the presence of the species, the area of the SSP585 model, 2021–2040 is distributed as follows: very highly suitable (≥0.80) with an area of 129.708 km2 (0.86%); and highly suitable (0.61–0.80) with an area of 94.667 km2 (0. 63%) (Table 3, Figure 7). The potential area of the SSP585 model, 2041–2060 is distributed differently: very highly suitable (≥0.80) with an area of 145.446 km2 (0.97%); and highly suitable (0.61–0.80) with an area of 122.362 km2 (0.81%) (Table 3, Figure 7). It can be seen that the most significant increase is in the probability value of optimal occurrence of the species (≥0.80) in the SSP585 scenario 2021–2040 with 326.11%, or 99.268 km2, more than the current scenario, in the SSP585, 2041–2060 scenario it is 377.81%, or 115.006 km2, more.

3.5. Real Distribution of Salvia ceratophylloides Analysed with Two Limiting Factors: Geology and Land Use

Field studies and bibliographical references [13,64,68,69,74,75] show that S. ceratophylloides grows, in nature, exclusively on loose, sandy, and calcarenite substrates of Pliocene and Pleistocene origin; in particular, the analysis of the geological map [78] shows that there are three types of sandy substrates in Calabria: sands and conglomerates (Pleistocene); sands and conglomerates (Pleistocene–Pliocene); sands and conglomerates (Yellow Sands)–Pliocene, widespread throughout the region.
Although the geological substratum suitable for the species occupies 2066.204 km2 (14.14% of the regional territory), from the superimposition of the current potential distribution models of the species we can observe that: the habitat suitable for the species covers a total area of 62.427 km2, or 2.93% of the area occupied in the region by the geological substratum, and 0.41% of the entire regional territory. The suitable area is subdivided as follows in relation to the probability of occurrence of the species: very highly suitable (≥0.80) 16.285 km2 (0.77% of the area occupied in the region by the substratum, 0.11% of the regional territory); and highly suitable (0.61–0.80) 4.071 km2 (0.19% of the geological substratum, 0.03% of the regional territory (Table 4, Figure 8). This modelling shows a decrease of 74% compared to the current potential distribution model.
The model with SSP245 2021–2040 presents a total area of 31.892 km2, equal to 1.50% of the geological substrate and 0.21% of the entire regional territory. In detail, the probability values for the presence of the species are distributed as follows: very highly suitable (≥0.80) with an area of 5.428 km2 (0.25% of the geological substratum, 0.04% of the regional territory); and highly suitable (0.61–0.80) with an area of 9.500 km2 (0.45% of the geological substratum, 0.06% of the regional territory) (Table 4, Figure 8).
The SSP245 2041–2060 scenario presents a total area of 50.213 km2, equal to 2.36% of the geological substratum and 0.33% of the regional territory. In relation to the probability values for the presence of the species, the area of model SSP245 2041–2060 is distributed as follows: very highly suitable (≥0.80) with an area of 4.750 km2 (0.22% of the substratum, 0.03% of the regional territory); and highly suitable (0.61–0.80) with an area of 6.107 km2 (0.29% of the substratum, 0.04% of the regional territory) (Table 4, Figure 9). Compared to the modelling of the current potential distribution interpolated with geological substrate data, we can see an increase in area of 18.164 km2 or 132% in the 2021–2040 period, and an increase of 266% in the following 20 years with an increase of 36.485 km2. Considering, on the other hand, the distribution area with the highest probability of hosting the species (≥0.80), overall, there is a decrease. In the 20-year period between 2021–2040, there is a decrease of 66.67% with a reduction in area of 10.857 km2, and for the 20-year period between 2041–2060, there is a reduction of 70.83% and a loss of 11.535 km2.
The distribution model with the SSP585 scenario shows a total area, suitable for hosting the species, of 187.960 km2 in the 20-year period between 2021–2040, equal to 8.83% of the geological substratum considered and 1.25% of the entire Calabrian territory. In the following 20-year period (2041–2061), the area involved is 192.031 km2, equal to 9.02% of the geological substratum and 1.28% of the regional territory. Considering the probability values for the presence of the species the area of the SSP585 model, in 2021–2040, is divided as follows: very highly suitable (≥0.80) 56.320 km2 (2.65% of the geological substratum, 0.37% of the regional territory); and highly suitable (0.61–0.80) 17.642 km2 (0.83% of the geological substratum, 0.12% of the regional territory) (Table 4, Figure 9). The next 20 years (2041–2060) show a distribution area of the species divided as follows: very highly suitable (≥0.80) 50.892 km2 (2.39% of the geological substratum, 0.34% of the regional territory); and highly suitable (0.61–0.80) 19.678 km2 (0.92% of the geological substratum, 0.13% of the regional territory) (Table 4, Figure 9). Comparing the current potential distribution model interpolated with substrate data, with the SSP585 scenario, we find an increase of 174.232 km2, or 1269%, for the 2021–2040 period, and an increase of 1299% in the following 20 years, with an increase of 178.303 km2. Considering the distribution area with the highest probability of hosting the species, for the 20-year period between 2021–2040, we would have an increase of 245.84% with an increase of 40.035 km2, for the 20-year period between 2041–2060, we would have an increase of 212.51% and a gain of 34.607 km2. The future potential distribution models, interpolated with the geological substratum, show a decrease in area compared to the current potential distribution model. In the 20 years between 2021–2040, with scenario SSP245, there is a 79% decrease, while in the 20 years between 2041–2060 scenario SSP245, the decrease is 71%. The SSP585 scenario shows a decrease of 70% for both of the 20-year periods considered in the modelling.
In accordance with the CORINE Land Cover system [98], class 2 (agricultural areas) and class 3 (forests and semi-natural areas) were considered in relation to the actual occurrence of the species; the second class was also considered because the Calabrian territory has fragmented agricultural areas that form a complex cultivation mosaic with the forests and semi-natural areas. All other land-use classes were omitted from the analyses.
Interpolating the current distribution model and the land use map shows that the area suitable for the species corresponds to 183.295 km2, i.e., 1.22% of the entire regional territory; relating this to the current potential distribution model shows a decrease in the area suitable for the species of 54.026 km2, i.e., 23% less (Table 5, Figure 10). The interpolation of the current distribution model with the exclusion of areas where there is no geological substrate suitable for the growth of the species, shows that the entire distribution area is 41.392 km2, or 0.28%, of the entire regional territory, and in relation to the current potential distribution model, the area undergoes a decrease of 83%, or 195.929 km2 (Figure 10). The table also shows the measures and percentages relating to the classification of habitat suitability in relation to the probability of occurrence values (Table 5).

4. Discussion

The results of the current potential modelling show that the environmental suitability of S. ceratophylloides always falls within the same range as the observations made in the field in recent years, and are in accordance with the known distribution reported in the literature [13,64,66,67,68,69,73,74,76]. We can observe that the species does not extend its range; it is localised exclusively on the extreme southwestern side of the Italian Peninsula and the Calabria region, overlooking the Strait of Messina.
Further analyses of the current model suggest that the distribution of the species is strongly influenced by the same climatic conditions reported earlier in the literature [13,64]. The temperature and humidity variables that condition the reproductive biology of the species [13] proved important in defining the species’ current potential distribution pattern. In particular, the average annual temperature parameters limit the distribution (7.8%) of this typically thermophilus species, as do the humidity parameters (precipitation of wettest month, precipitation of driest month, precipitation of coldest quarter) and temperature seasonality, which are closely linked to the species’ ecological needs for germination and the release of young seedlings [13,64,80,81,82]. The elevation variable also has a range that does not differ from elevations measured at actual occurrence points [13,64]. The current potential distribution model includes (with a probability value of very highly suitable occurrence ≥0.80) areas where the species occurs as well as those where it is extinct [70,71]. Therefore, the extinction of the species in the latter areas is the result of severe environmental changes in the suburban area of Reggio Calabria, which is subject to extensive urbanisation and frequent devastating fires [99]. Future model projections for 2021–2040 and 2041–2060, obtained from the SSP245 and SSP585 scenarios, indicate that climate change will significantly influence the distribution of this species. The models with the SSP585 scenario show more significant impacts than the SSP245 scenario, which considers the same bioclimatic characteristics currently in place [19]. The SSP585 scenario shows that, the range suitable for the species will increase by 167% in the 2021–2040 period and 171% in the 2041–2060 period (Table 3, Figure 7). This trend can also be seen in other similar studies [100,101]. Furthermore, the SSP585 scenario predicts an extension of the optimal range to lower altitudes, down to sea level, and other authors also point to an altitudinal shift in the current potential distribution area of the examined species [43].
The SSP245 scenario shows a potential distribution of S. ceratophylloides similar to the current modelling, but with a decrease of 35% in the 2021–2040 period and 28% in the 2041–2060 period (Table 3, Figure 7). Similar decreases with the same scenario are also shown for other species [100].
Salvia ceratophylloides is a species with remarkable edaphic specialisation, as it grows exclusively on loose substrates characterised by Pliocene and/or Pleistocene sands and sandy conglomerates [13,64]; these substrates occupy 14% of the entire regional territory, but only 2.93% is occupied by the current potential distribution range of S. ceratophylloides. The geological substrate, in this case, becomes one of the limiting factors for the distribution of the species. Compared to the current distribution pattern, there is a decrease of 74%, with a loss of 174,894 km2 of suitable area (Table 4, Figure 9), which considerably reduces the potential distribution range of the species. The model obtained by interpolating the SSP245 scenario with the geological substratum shows that the range suitable for the species will decrease by 79% in the period of 2021–2040 and by 71% in the period of 2041–2060 (Table 4, Figure 9), while the SSP585 scenario will show a decrease of 70% in both of the 20 years examined (2021–2040/2041–2060).
A further limiting factor is land use. The species’ real range is entirely within a complex environmental mosaic, where agricultural areas (land use class 2) and natural and semi-natural habitats (land use class 3) are highly fragmented and interconnected. On the other hand, it is not present in urban areas (land use category 1), where it was probably present in the past before the expansion of the city, as bibliographic references attest [69]. Excluding the distribution of the species from urban areas, the potential distribution is reduced by 23%, with a loss of 54,026 km2, which mainly affects the lower elevation band (Table 5, Figure 10).
Considering the constraints imposed by the combination of geologic substrate and land use, the area suitable for S. ceratophylloides is reduced by 83% with a total area of 41,392 km2 (Table 5, Figure 10) compared to 237,321 km2 (Table 5, Figure 10) in the current distribution model that considers only bioclimatic variables and elevation.
Modelling obtained by subtracting the two limiting factors (geological substrate and land use) from the current range shows that the very highly suitable habitat (≥0.80), i.e., the one in which the probability of finding the species is very high, occupies 14.928 km2; on the other hand, Laface et al. [13] show that the species has an Area of Occupancy (AOO) of 7 km2. The modelled distribution is therefore greater than the observed AOO, and S. ceratophylloides could potentially be found in other areas where it has not yet been observed or where it is not present due to anthropogenic urbanisation [13] or other limitations, such as pests [102]. The current AOO and anthropogenic pressures justify the assessment of this species as Critically Endangered (CR) [13,64,75]. Without pressures and threats that currently limit the distribution of the species, the range will be 14.928 km2 (very highly suitable ≥0.80), which would reassess the species as Endangered (EN).
Research on S. ceratophylloides confirms that the magnitude of change in the distribution of potential 2021–2040 and 2041–2060 niches is comparable. That is, the changes expected for the later period will occur approximately 20 years earlier than is commonly believed, as 2041–2060 is often overlooked in many studies, most of which are for 2061–2080. Hence, there is less time to develop strategies to mitigate the effects of climate change than is usually believed [103,104].

5. Conclusions

This study allowed us to develop very efficient models of the current and future potential distribution of S. ceratophylloides. These showed that habitat suitable for the species will decrease in 2021–2040 and 2041–2060 in the SSP245 scenario, and increase in the SSP585 scenario, but it should be noted that important constraints on the species’ distribution are due to the geological substrate and land use, which significantly limit the current potential distribution.
The potential distribution model identifies areas of suitable habitat for the species occurrence to evaluate the presence of new occurrence points or to identify locations where there is a high probability of the species occurrence.
The assessment of changes in species distribution related to climate change impacts also made it possible to identify priority areas for reintroduction. Therefore, considering the results obtained, to reduce the risk of extinction of S. ceratophylloides in the wild, the reintroduction of the species in areas that are suitable according to modelling is an important in situ conservation measure
The model also gives us clear indications of where to focus conservation activities; for example, by establishing micro-reserves, small protected areas created to ensure the conservation, study, and monitoring of endemic endangered flora in the future, which can be entrusted to environmental associations or the landowner. Furthermore, this work may be useful for future actions to reintroduce and reinforce the existing S. ceratophylloides population in areas showed according to modelling. These activities should be accompanied by greater awareness raising among public opinion and political authorities to reduce the impact of human activities.

Author Contributions

Conceptualisation, V.L.A.L. and G.S.; methodology, V.L.A.L. and G.S.; validation, V.L.A.L., C.M.M. and G.S.; formal analysis, V.L.A.L., G.T. and G.S.; investigation, V.L.A.L., C.M.M., G.T. and G.S.; data curation, V.L.A.L., G.T., C.M.M. and G.S.; writing—original draft preparation, V.L.A.L., C.M.M. and G.S.; writing—review and editing, V.L.A.L., C.M.M., G.T., A.S., A.C.-O., R.Q.C. and G.S.; visualisation, V.L.A.L., C.M.M., G.T., A.S., A.C.-O., R.Q.C. and G.S.; supervision, C.M.M. and G.S.; project administration, G.S.; funding acquisition, G.S. All authors have read and agreed to the published version of the manuscript.

Funding

The present research work has been made possible thanks to the Research Project “PROGRAMMA OPERATIVO CALABRIA FESR-FSE 2014/2020-ASSE VI-AZIONE 6.5.A.1-Sub 1-2 (scientific manager Giovanni Spampinato)”.

Data Availability Statement

Not applicable.

Conflicts of Interest

The authors declare no conflict of interest.

References

  1. Walther, G.R.; Post, E.; Convey, P.; Menzel, A.; Parmesan, C.; Beebee, T.J.; Fromentin, J.M.; Hoegh-Guldberg, O.; Bairlein, F. Ecological responses to recent climate change. Nature 2002, 416, 389–395. [Google Scholar] [CrossRef] [PubMed]
  2. Thuiller, W.; Lavorel, S.; Araújo, M.B.; Sykes, M.T.; Prentice, I.C. Climate change threats to plant diversity in Europe. Proc. Natl. Acad. Sci. USA 2005, 102, 8245–8250. [Google Scholar] [CrossRef] [Green Version]
  3. Moreno-Saiz, J.C.; Martínez García, F.; Gavilán, R.G. Plant Conservation in Spain: Strategies to halt the loss of plant diversity. Mediterr. Bot. 2018, 39, 65–66. [Google Scholar] [CrossRef]
  4. Wood, A.; Stedman-Edwards, P.; Mang, J. The Root Causes of Biodiversity Loss; Routledge: London, UK, 2000; p. 416. [Google Scholar]
  5. Del Río, S.; Canas, R.; Cano, E.; Cano-Ortiz, A.; Musarella, C.; Pinto-Gomes, C.; Penas, A. Modelling the impacts of climate change on habitat suitability and vulnerability in deciduous forests in Spain. Ecol. Indic. 2021, 131, 108202. [Google Scholar] [CrossRef]
  6. Dineva, S. Applying Artificial Intelligence (AI) for Mitigation Climate Change Consequences of the Natural Disasters. Res. J. Ecol. Environ. Sci. 2022, 1, 1–8. [Google Scholar] [CrossRef]
  7. Içik, K. Rare and endemic species: Why are they prone to extinction? Turk. J. Bot. 2011, 35, 411–417. [Google Scholar]
  8. Signorino, G.; Cannavò, S.; Crisafulli, A.; Musarella, C.M.; Spampinato, G. Fagonia cretica L. Inf. Bot. Ita. 2011, 43, 397–399. [Google Scholar]
  9. Spampinato, G.; Musarella, C.M.; Cano-Ortiz, A.; Signorino, G. Habitat, occurrence and conservation status of the Saharo-Macaronesian and Southern-Mediterranean element Fagonia cretica L. (Zygophyllaceae) in Italy. J. Arid. Land 2018, 10, 140–151. [Google Scholar] [CrossRef] [Green Version]
  10. Abdelaal, M.; Fois, M.; Fenu, G.; Bacchetta, G. Using MaxEnt modeling to predict the potential distribution of the endemic plant Rosa arabica Crép. in Egypt. Ecol. Inform. 2019, 50, 68–75. [Google Scholar] [CrossRef]
  11. Carmona, E.C.; Ortiz, A.C.; Musarella, C.M. Introductory Chapter: Endemism as a Basic Element for the Conservation of Species and Habitats. In Endemic Species [Internet]; Carmona, E.C., Musarella, C.M., Ortiz, A.C., Eds.; IntechOpen: London, UK, 2019; Available online: https://www.intechopen.com/chapters/65963 (accessed on 16 October 2022).
  12. Orsenigo, S.; Bernardo, L.; Cambria, S.; Gargano, D.; Laface, V.L.A.; Musarella, C.M.; Passalacqua, N.G.; Spampinato, G.; Tavilla, G.; Fenu, G. Global and Regional IUCN Red List Assessments: 9. Ital. Botanist. 2020, 9, 111–123. [Google Scholar] [CrossRef]
  13. Laface, V.L.A.; Musarella, C.M.; Sorgonà, A.; Spampinato, G. Analysis of the population structure and dynamic of endemic Salvia ceratophylloides Ard. (Lamiaceae). Sustainability 2022, 14, 10295. [Google Scholar] [CrossRef]
  14. Caruso, G. Anthyllis hermanniae L. subsp. brutia Brullo & Giusso (Fabaceae): Population survey and conservation tasks. Res. J. Ecol. Environ. Sci. 2022, 2, 92–102. [Google Scholar] [CrossRef]
  15. Jones, P.D.; Osborn, T.J.; Briffa, K.R. The evolution of climate over the last millennium. Science 2001, 292, 662–667. [Google Scholar] [CrossRef] [PubMed] [Green Version]
  16. Xoplaki, E.; Gonzales-Rouco, F.J.; Luterbacher, J.; Wanner, H. Mediterranean summer air temperature variability and its connection to the large-scale atmospheric circulation and SSTs. Clim. Dyn. 2003, 20, 723–739. [Google Scholar] [CrossRef]
  17. Solomon, S.; Qin, D.; Manning, M.; Alley, R.B.; Berntsen, T.; Bindoff, N.L.; Chen, Z.; Chidthaisong, A.; Gregory, J.M.; Hegerl, G.C.; et al. Technical summary. In Climate Change 2007: The Physical Science Basis. Contribution of Working Group I to the Fourth Assessment Report of the Intergovernmental Panel on Climate Change; Solomon, S., Qin, D., Manning, M., Chen, Z., Marquis, M., Averyt, K., Tignor, M., Miller, H., Eds.; Cambridge University Press: Cambridge, UK; New York, NY, USA, 2007. [Google Scholar]
  18. Mariotti, A.; Pan, Y.; Zeng, N.; Alessandri, A. Long-term climate change in the Mediterranean region in the midst of decadal variability. Clim. Dyn. 2015, 44, 1437–1456. [Google Scholar] [CrossRef]
  19. Intergovernmental Panel on Climate Change (IPCC). Climate Change 2022: Mitigation of Climate Change. In Contribution of Working Group III to the Sixth Assessment Report of the Intergovernmental Panel on Climate Change; Shukla, P.R., Skea, J., Slade, R., al Khourdajie, A., van Diemen, R., McCollum, D., Pathak, M., Some, S., Vyas, P., Fradera, R., et al., Eds.; Cambridge University Press: Cambridge, UK; New York, NY, USA, 2022. [Google Scholar]
  20. Laface, V.L.A.; Musarella, C.M.; Ortiz, A.C.; Canas, R.Q.; Cannavò, S.; Spampinato, G. Three New Alien Taxa for Europe and a Chorological Update on the Alien Vascular Flora of Calabria (Southern Italy). Plants 2020, 9, 1181. [Google Scholar] [CrossRef]
  21. Musarella, C.M.; Stinca, A.; Cano-Ortíz, A.; Laface, V.L.A.; Petrilli, R.; Esposito, A.; Spampinato, G. New data on the alien vascular flora of Calabria (Southern Italy). Ann. Bot. 2020, 10, 55–66. [Google Scholar] [CrossRef]
  22. Musarella, C.M. Solanum torvum Sw. (Solanaceae): A new alien species for Europe. Genet. Resour. Crop Evol. 2020, 67, 515–522. [Google Scholar] [CrossRef]
  23. Raposo, M.A.M.; Pinto Gomes, C.J.; Nunes, L.J.R. Evaluation of Species Invasiveness: A Case Study with Acacia dealbata Link. on the Slopes of Cabeça (Seia-Portugal). Sustainability 2021, 13, 11233. [Google Scholar] [CrossRef]
  24. Zhang, Y.; Tang, J.; Ren, G.; Zhao, K.; Wang, X. Global potential distribution prediction of Xanthium italicum based on Maxent model. Sci. Rep. 2021, 11, 16545. [Google Scholar] [CrossRef]
  25. de Carvalho, C.A.; Raposo, M.; Pinto-Gomes, C.; Matos, R. Native or Exotic: A Bibliographical Review of the Debate on Ecological Science Methodologies: Valuable Lessons for Urban Green Space Design. Land 2022, 11, 1201. [Google Scholar] [CrossRef]
  26. Spampinato, G.; Laface, V.L.A.; Posillipo, G.; Cano-Ortiz, A.; Quinto-Canas, R.; Musarella, C.M. Alien flora in Calabria (Southern Italy): An updated checklist. Biol. Invasions 2022, 24, 2323–2334. [Google Scholar] [CrossRef]
  27. Ighbareyeh, J.M.H.; Suliemieh, A.A.-R.A.; Sheqwarah, M.; Cano-Ortiz, A.; Carmona, E.C. Flora and Phytosociological of Plant in Al-Dawaimah of Palestine. Res. J. Ecol. Environ. Sci. 2022, 2, 58–91. [Google Scholar] [CrossRef]
  28. Molina-Venegas, R.; Aparicio, A.; Lavergne, S.; Arroyo, J. Climatic and topographical correlates of plant palaeo- and neoendemism in a Mediterranean biodiversity hotspot. Ann. Bot. 2017, 119, 229–238. [Google Scholar] [CrossRef] [PubMed] [Green Version]
  29. Rundel, P.W.; Arroyo, M.T.K.; Cowling, R.M.; Keeley, J.E.; Lamont, B.B.; Vargas, P. Mediterranean biomes: Evolution of their vegetation, floras, and climate. Annu. Rev. Ecol. Evol. Syst. 2016, 47, 383–407. [Google Scholar] [CrossRef]
  30. Musarella, C.M.; Tripodi, G. La flora della rupe e dei ruderi di Pentidattilo (Reggio Calabria). Inform. Bot. Ital. 2004, 36, 3–12. [Google Scholar]
  31. Pecl, G.T.; Araújo, M.B.; Bell, J.D.; Blanchard, J.; Bonebrake, T.C.; Chen, I.C.; Clark, T.D.; Colwell, R.K.; Danielsen, F.; Evengård, B.; et al. Biodiversity redistribution under climate change: Impacts on ecosystems and human well-being. Science 2017, 355, eaai9214. [Google Scholar] [CrossRef]
  32. Qin, A.; Liu, B.; Guo, Q.; Bussmann, R.W.; Ma, F.; Jian, Z.; Xu, G.; Pei, S. Maxent modeling for predicting impacts of climate change on the potential distribution of Thuja sutchuenensis Franch., an extremely endangered conifer from southwestern China. Glob. Ecol. Conserv. 2017, 10, 139–146. [Google Scholar] [CrossRef]
  33. del Río, S.; Álvarez-Esteban, R.; Cano, E.; Pinto-Gomes, C.; Penas, Á. Potential Impacts of Climate Change on Habitat Suitability of Fagus sylvatica L. For. Spain Plant Biosyst. 2018, 152, 1205–1213. [Google Scholar] [CrossRef]
  34. Rus, J.D.; Ramírez-Rodríguez, R.; Amich, F.; Melendo-Luque, M. Habitat Distribution Modelling, under the Present Climatic Scenario, of the Threatened Endemic Iberian Delphinium fissum subsp. sordidum (Ranunculaceae) and Implications for Its Conservation. Plant Biosyst. 2018, 152, 891–900. [Google Scholar] [CrossRef]
  35. Anand, V.; Oinam, B.; Singh, H. Predicting the current and future potential spatial distribution of endangered Rucervus eldii eldii (Sangai) using MaxEnt model. Environ. Monit. Assess. 2021, 193, 147. [Google Scholar] [CrossRef]
  36. Rojo, J.; Fernández-González, F.; Lara, B.; Bouso, V.; Crespo, G.; Hernández-Palacios, G.; Rodríguez-Rojo, M.P.; Rodríguez-Torres, A.; Smith, M.; Pérez-Badia, R. The effects of climate change on the flowering phenology of alder trees in Southwestern Europe. Mediterr. Bot. 2021, 42, e67360. [Google Scholar] [CrossRef]
  37. Wilson, C.D.; Roberts, D.; Reid, N. Applying species distribution modelling to identify areas of high conservation value for endangered species: A case study using Margaritifera margaritifera (L.). Biol. Conserv. 2011, 144, 821–829. [Google Scholar] [CrossRef]
  38. Reich, D.; Flatscher, R.; Pellegrino, G.; Hülber, K.; Wessely, J.; Gattringer, A.; Greimler, J. Biogeography of amphi-adriatic Gentianella crispata (Gentianaceae): A northern refugium and recent trans-adriatic migration. Plant Biosyst. 2022, 156, 754–768. [Google Scholar] [CrossRef]
  39. Phillips, S.J.; Anderson, R.P.; Schapire, R.E. Maximum entropy modeling of species geographic distributions. Ecol. Model. 2006, 190, 231–259. [Google Scholar] [CrossRef] [Green Version]
  40. Elith, J.; Phillips, S.J.; Hastie, T.; Dudík, M.; Chee, Y.E.; Yates, C.J. A statistical explanation of maxent for ecologists. Divers. Distrib. 2011, 17, 43–57. [Google Scholar] [CrossRef]
  41. Soilhi, Z.; Sayari, N.; Benalouache, N.; Mekki, M. Predicting current and future distributions of Mentha pulegium L. in Tunisia under climate change conditions, using the MaxEnt model. Ecol. Inform. 2022, 68, 101533. [Google Scholar] [CrossRef]
  42. Thakur, S.; Rai, I.D.; Singh, B.; Dutt, H.C.; Musarella, C.M. Predicting the Suitable Habitats of Elwendia persica in Indian Himalayan Region (IHR). Plant Biosyst. 2023, in press.
  43. Gebrewahid, Y.; Abrehe, S.; Meresa, E.; Eyasu, G.; Abay, K.; Gebreab, G.; Kidanemariam, K.; Adissu, G.; Abreha, G.; Darcha, G. Current and future predicting potential areas of Oxytenanthera abyssinica (A. Richard) using MaxEnt model under climate change in Northern Ethiopia. Ecol. Process. 2020, 9, 6. [Google Scholar] [CrossRef] [Green Version]
  44. Bhandari, M.S.; Shankhwar, R.; Maikhuri, S.; Pandey, S.; Meena, R.K.; Ginwal, H.S.; Kant, R.; Rawat, P.S.; Martins-Ferreira, M.A.; Silveira, L.H. Prediction of ecological and geological niches of Salvadora oleoides in arid zones of India: Causes and consequences of global warming. Arab. J. Geosci. 2021, 14, 524. [Google Scholar] [CrossRef]
  45. Dai, X.; Wu, W.; Ji, L.; Tian, S.; Yang, B.; Guan, B.; Wu, D. MaxEnt model-based prediction of potential distributions of Parnassia wightiana (Celastraceae) in China. Biodivers. Data J. 2022, 10, e81073. [Google Scholar] [CrossRef]
  46. Khan, A.M.; Li, Q.; Saqib, Z.; Khan, N.; Habib, T.; Khalid, N.; Majeed, M.; Tariq, A. MaxEnt Modelling and Impact of Climate Change on Habitat Suitability Variations of Economically Important Chilgoza Pine (Pinus gerardiana Wall.) in South Asia. Forests 2022, 13, 715. [Google Scholar] [CrossRef]
  47. Zhang, L.; Zhu, L.; Li, Y.; Zhu, W.; Chen, Y. Maxent Modelling Predicts a Shift in Suitable Habitats of a Subtropical Evergreen Tree (Cyclobalanopsis glauca (Thunberg) Oersted) under Climate Change Scenarios in China. Forests 2022, 13, 126. [Google Scholar] [CrossRef]
  48. Parveen, S.; Kaur, S.; Baishya, R.; Goel, S. Predicting the potential suitable habitats of genus Nymphaea in India using MaxEnt modeling. Environ. Monit. Assess. 2022, 194, 853. [Google Scholar] [CrossRef]
  49. Khajoei Nasab, F.; Mehrabian, A.; Mostafavi, H.; Neemati, A. The influence of climate change on the suitable habitats of Allium species endemic to Iran. Environ. Monit. Assess. 2022, 194, 169. [Google Scholar] [CrossRef] [PubMed]
  50. Kumar, S.; Stohlgren, T.J. Maxent modeling for predicting suitable habitat for threatened and endangered tree Canacomyrica monticola in New Caledonia. J. Ecol. Nat. Environ. 2009, 1, 94–98. [Google Scholar]
  51. Marcer, A.; Sáez, L.; Molowny-Horas, R.; Pons, X.; Pino, J. Using species distribution modelling to disentangle realised versus potential distributions for rare species conservation. Biol. Conserv. 2013, 166, 221–230. [Google Scholar] [CrossRef]
  52. Shcheglovitova, M.; Anderson, R.P. Estimating optimal complexity for ecological niche models: A jackknife approach for species with small sample sizes. Ecol. Model. 2013, 269, 9–17. [Google Scholar] [CrossRef]
  53. Booth, T.H. Why understanding the pioneering and continuing contributions of BIOCLIM to species distribution modelling is important. Austral Ecol. 2018, 43, 852–860. [Google Scholar] [CrossRef] [Green Version]
  54. Heywood, V.H.; Richardson, I.B.K. Labiatae. In Flora Europaea; Tutin, T.G., Heywood, V.H., Burges, N.A., Moore, D.M., Valentine, D.H., Walters, S.M., Webb, D.A., Eds.; Cambridge at the University Press: Cambridge, UK, 1972; Volume 3, pp. 126–192. [Google Scholar]
  55. Kadereit, J.W. The Families and Genera of Vascular Plants; Lamiales: Berlin, Germany, 2004; Volume VII. [Google Scholar]
  56. Perrino, E.V.; Valerio, F.; Gannouchi, A.; Trani, A.; Mezzapesa, G. Ecological and Plant Community Implication on Essential Oils Composition in Useful Wild Officinal Species: A Pilot Case Study in Apulia (Italy). Plants 2021, 10, 574. [Google Scholar] [CrossRef]
  57. Valerio, F.; Mezzapesa, G.N.; Ghannouchi, A.; Mondelli, D.; Logrieco, A.F.; Perrino, E.V. Characterization and Antimicrobial Properties of Essential Oils from Four Wild Taxa of Lamiaceae Family Growing in Apulia. Agronomy 2021, 11, 1431. [Google Scholar] [CrossRef]
  58. Cianfaglione, K.; Bartolucci, F.; Ciaschetti, G.; Conti, F.; Pirone, G. Characterization of Thymus vulgaris subsp. vulgaris Community by Using a Multidisciplinary Approach: A Case Study from Central Italy. Sustainability 2022, 14, 3981. [Google Scholar] [CrossRef]
  59. Peruzzi, L.; Conti, F.; Bartolucci, F. An inventory of vascular plants endemic to Italy. Phytotaxa 2014, 168, 1–75. [Google Scholar] [CrossRef]
  60. Bartolucci, F.; Peruzzi, L.; Galasso, G.; Albano, A.; Alessandrini, A.; Ardenghi, N.M.G.; Astuti, G.; Bacchetta, G.; Ballelli, S.; Banfi, E.; et al. An updated checklist of the vascular flora native to Italy. Plant Biosyst. 2018, 152, 179–303. [Google Scholar] [CrossRef]
  61. Pignatti, S. Flora d’Italia; Edagricole: Bologna, Italy, 1982; Volume 2, pp. 502–507. [Google Scholar]
  62. Pignatti, S. Flora d’Italia, 2nd ed.; Edagricole: Bologna, Italy, 2018; Volume 3, pp. 301–310. [Google Scholar]
  63. Spampinato, G. Guida alla flora dell’Aspromonte, 2nd ed.; Laruffa Editore: Reggio Calabria, Italy, 2014; pp. 38, 244–245. [Google Scholar]
  64. Spampinato, G.; Laface, V.L.A.; Ortiz, A.C.; Canas, R.Q.; Musarella, C.M. Salvia ceratophylloides Ard. (Lamiaceae): A rare endemic species of Calabria (Southern Italy). In Endemic Species; Cano Carmona, E., Musarella, C.M., Cano Ortiz, A., Eds.; IntechOpen: London, UK, 2019. [Google Scholar]
  65. Salmeri, C. Karyological data of some plant species native to South Italy. Flora Mediterr. 2019, 29, 334–340. [Google Scholar] [CrossRef]
  66. Tenore, M. Sylloge Plantarum Vascularium Florae Neapolitanae Hucusque Detectarum; Ex Typographia Fibreni: Neapoli, Greece, 1831; p. 1. [Google Scholar]
  67. Macchiati, C. Catalogo delle piante raccolte nei dintorni di Reggio Calabria dal settembre 1881 al febbraio 1883. Nuovo Giorn. Bot. Ital. 1884, 16, 59–100. [Google Scholar]
  68. Lacaita, C. Addenda et emendanda ad floram italicam. Bull. Soc. Bot. Ital. 1921, 28, 18–19. [Google Scholar]
  69. Lacaita, C. Piante italiane critiche o rare: 67. Salvia ceratophylloides Arduino. Nuovo Giorn. Bot. Ital. 1921, 28, 144–147. [Google Scholar]
  70. Conti, F.; Manzi, A.; Pedrotti, F. Liste Rosse Regionali delle Piante d’Italia; WWF Italia, Società Botanica Italiana: Camerino, Italy, 1997. [Google Scholar]
  71. Del Carratore, F.; Garbari, F. Il Gen. Salvia Sect. Plethiosphace (Lamiaceae) in Italia. Arch. Geobot. 2001, 7, 41–62. [Google Scholar]
  72. Scoppola, A.; Spampinato, G. Atlante delle specie a rischio di estinzione. Versione 1.0. CD-Rom enclosed to the volume. In Stato Delle Conoscenze Sulla Flora Vascolare d’Italia; Scoppola, A., Blasi, C., Eds.; Palombi Editori: Roma, Italy, 2005. [Google Scholar]
  73. Spampinato, G.; Crisafulli, A. Struttura delle popolazioni e sinecologia di Salvia ceratophylloides (Lamiaceae) specie endemica minacciata di estinzione, 56. In Book of Abstracts of 103° S.B.I. Congress; Università Mediterranea di Reggio Calabria: Reggio Calabria, Italy, 2008; pp. 17–19. [Google Scholar]
  74. Crisafulli, A.; Cannavò, S.; Maiorca, G.; Musarella, C.M.; Signorino, G.; Spampinato, G. Aggiornamenti floristici per la Calabria. Inform. Bot. Ital. 2010, 42, 431–442. [Google Scholar]
  75. Spampinato, G.; Crisafulli, A.; Marino, A.; Signorino, G. Salvia ceratophylloides Ard. Inf. Bot. Ital. 2011, 43, 381–458. [Google Scholar]
  76. Laface, V.L.A.; Musarella, C.M.; Spampinato, G. Conservation status of the Aspromontana flora: Monitoring and new stations of Salvia ceratophylloides Ard. (Lamiaceae) endemic species in Reggio Calabria (southern Italy). In Abstracts Book of 113°Congresso della Società Botanica Italiana (V International Plant Science Conference (IPSC); Società Botanica Italiana: Fisciano, Italy, 2018; pp. 12–15. ISBN 978-88-85915-22-0. [Google Scholar]
  77. International Union for Conservation of Nature (IUCN). IUCN Red List Categories and Criteria: Version 3.1, 2nd ed.; IUCN: Gland, Switzerland; Cambridge, UK, 2012; pp. iv + 32. ISBN 978-2-8317-1435-6. [Google Scholar]
  78. Cassa per il Mezzogiorno—Cassa per Opere Straordinarie di Pubblico Interesse nell’Italia Meridionale, Carta Geologica della Calabria; Cassa per il Mezzogiorno: Rome, Italy, 1967–1972.
  79. Pesaresi, S.; Galdenzi, D.; Biondi, E.; Casavecchia, S. Bioclimate of Italy: Application of the worldwide bioclimatic classification system. J. Maps 2014, 10, 538–553. [Google Scholar] [CrossRef]
  80. Abate, E.; Azzarà, M.; Trifilò, P. When Water Availability Is Low, Two Mediterranean Salvia Species Rely on Root Hydraulics. Plants 2021, 10, 1888. [Google Scholar] [CrossRef] [PubMed]
  81. Abate, E.; Nardini, A.; Petruzzellis, F.; Trifilò, P. Too dry to survive: Leaf hydraulic failure in two Salvia species can be predicted on the basis of water content. Plant Physiol. Biochem. 2021, 166, 215–224. [Google Scholar] [CrossRef] [PubMed]
  82. Vescio, R.; Abenavoli, M.R.; Araniti, F.; Musarella, C.M.; Sofo, A.; Laface, V.L.A.; Spampinato, G.; Sorgonà, A. The Assessment and the Within-Plant Variation of the Morpho-Physiological Traits and VOCs Profile in Endemic and Rare Salvia ceratophylloides Ard. (Lamiaceae). Plants 2021, 10, 474. [Google Scholar] [CrossRef]
  83. QGIS 2022. QGIS Geographic Information System. Open Source Geospatial Foundation Project. Available online: http://qgis.osgeo.org (accessed on 10 October 2022).
  84. WordClim. Available online: https://www.worldclim.org/ (accessed on 10 October 2022).
  85. Fick, S.E.; Hijmans, R.J. WorldClim 2: New 1km spatial resolution climate surfaces for global land areas. Int. J. Climatol. 2017, 37, 4302–4315. [Google Scholar] [CrossRef]
  86. Dormann, C.F.; Elith, J.; Bacher, S.; Buchmann, C.; Carl, G.; Carré, G.; Marquéz, J.R.G.; Gruber, B.; Lafourcade, B.; Leitão, P.J.; et al. Collinearity: A review of methods to deal with it and a simulation study evaluating their performance. Ecography 2013, 36, 27–46. [Google Scholar] [CrossRef]
  87. Saupe, E.E.; Barve, V.; Myers, C.E.; Soberón, J.; Barve, N.; Hensz, C.M.; Peterson, A.T.; Owens, H.L.; Lira-Noriega, A. Variation in niche and distribution model performance: The need for a priori assessment of key causal factors. Ecol. Model. 2012, 237–238, 11–22. [Google Scholar] [CrossRef]
  88. Pearson, K. Notes on regression and inheritance in the case of two parents. Proc. R. Soc. Lond. 1895, 58, 240–242. [Google Scholar]
  89. Hammer, Ø. Past Software. In Natural History Museum; University of Oslo: Oslo, Norway, 2022. [Google Scholar]
  90. Quenouille, M.H. Approximate Tests of Correlation in Time Series. J. R. Stat. Soc. 1949, 11, 68–84. [Google Scholar]
  91. Castellana, S.; Martin, M.Á.; Solla, A.; Alcaide, F.; Villani, F.; Cherubini, M.; Neale, D.; Mattioni, C. Signatures of local adaptation to climate in natural populations of sweet chestnut (Castanea sativa Mill.) from southern Europe. Ann. For. Sci. 2021, 78, 1–21. [Google Scholar] [CrossRef]
  92. Abou-Shaara, H.F.; Darwish, A.A. Expected prevalence of the facultative parasitoid Megaselia scalaris of honey bees in Africa and the Mediterranean region under climate change conditions. Int. J. Trop. Insect Sci. 2021, 41, 3137–3145. [Google Scholar] [CrossRef]
  93. Phillips, S.J. Transferability, sample selection bias and background data in presence-only modeling: A response to Peterson et al. and (2007). Ecography 2008, 31, 272–278. [Google Scholar] [CrossRef]
  94. Phillips, S.J.; Dudik, M.; Schapire, R.E. Maxent Software for Modeling Species Niches and Distributions (Version 3.4.4). Available online: http://biodiversityinformatics.amnh.org/open_source/maxent/ (accessed on 11 October 2022).
  95. Fielding, A.H.; Bell, J.F. A review of methods for the assessment of prediction errors in conservation presence/absence models. Environ. Conserv. 1997, 24, 38–49. [Google Scholar] [CrossRef]
  96. Warren, D.L.; Seifert, S.N. Ecological niche modeling in Maxent: The importance of model complexity and the performance of model selection criteria. Ecol. Appl. 2001, 21, 335–342. [Google Scholar] [CrossRef] [Green Version]
  97. Carta di Uso del Territorio della Regione Calabria. ARSAC. Available online: http://93.51.147.138/corine_land_cover.html (accessed on 11 October 2022).
  98. Bossard, M.; Feranec, J.; Otahel, J. CORINE Land Cover Technical Guide: Addendum 2000; European Environment Agency: Copenhagen, Denmark, 2000; Volume 40.
  99. European Forest Fire Informationon System (EFFIS). Available online: https://effis.jrc.ec.europa.eu/ (accessed on 14 October 2022).
  100. Canturk, U.; Kulaç, Ş. The effects of climate change scenarios on Tilia ssp. in Turkey. Environ. Monit. Assess. 2021, 193, 771. [Google Scholar] [CrossRef]
  101. Ma, B.; Sun, J. Predicting the distribution of Stipa purpurea across the Tibetan Plateau via the MaxEnt model. BMC Ecol. 2018, 18, 10. [Google Scholar] [CrossRef] [Green Version]
  102. Bonsignore, C.P.; Laface, V.L.A.; Vono, G.; Marullo, R.; Musarella, C.M.; Spampinato, G. Threats Posed to the Rediscovered and Rare Salvia ceratophylloides Ard. (Lamiaceae) by Borer and Seed Feeder Insect Species. Diversity 2021, 13, 33. [Google Scholar] [CrossRef]
  103. Olszewski, P.; Dyderski, M.K.; Dylewski, Ł.; Bogusch, P.; Schmid-Egger, C.; Ljubomirov, T.; Zimmermann, D.; Le Divelec, R.; Wiśniowski, B.; Twerd, L.; et al. European beewolf (Philanthus triangulum) will expand its geographic range as a result of climate warming. Reg. Environ. Chang. 2022, 22, 129. [Google Scholar] [CrossRef]
  104. Puchałka, R.; Dyderski, M.K.; Vítková, M.; Sádlo, J.; Klisz, M.; Netsvetov, M.; Prokopuk, Y.; Matisons, R.; Mionskowski, M.; Wojda, T.; et al. Black locust (Robinia pseudoacacia L.) range contraction and expansion in Europe under changing climate. Glob. Chang. Biol. 2021, 27, 1587–1600. [Google Scholar] [CrossRef]
Figure 1. Details of the inflorescence, flowers, and habitat of Salvia ceratophylloides Ard. in its natural habitat (Ph. V.L.A. Laface).
Land 12 00247 g001
Figure 2. Pearson correlation analysis of significative environment variables for Salvia ceratophylloides Ard. (−0.8 ≤ r ≤ +0.8). Created with Past 4.1.4 © (Hammer, Oslo, Norway).
Land 12 00247 g002
Figure 3. Occurrence points of Salvia ceratophylloides Ard. In blue are the micro-populations currently occurring, in orange the extinct ones. 1—Serro Ciugna, Mosorrofa; 2—Serro Ciugna, Mosorrofa; 3—Spilingari, Armo; 4—Contrada S. Todaro, Aretina; 5—Contrada S. Todaro, Aretina; 6—Serro dei Morti, Puzzi fraz. di Gallina; 7—Prai, Aretina; 8—Prai, Aretina; 9—Aretina; 10—Aretina; 11—Grotta di S. Arsenio, Armo; 12—Mosorrofa vecchio; 13—Mosorrofa vecchio; 14—Serro d’Angelo, Puzzi fraz. of Gallina; 15—Prai, Aretina; 16—Prai, Aretina; 17—Serro della Cattina, Aretina; 18—Serro della Cattina, Aretina; 19—Lutrà, Fiumara di Sant’Agata; 20—Galluzzi, Gallico Superiore; 21—Pietra Storta; 22—Croce Missionaria, Terreti; 23—Fontana Acqua Fresca, Straorino. In the top left-hand corner, the distribution area of the points of occurrence is highlighted in red.
Land 12 00247 g003
Figure 4. Relative predictive power of different environmental variables based on the jackknife of regularised training gain in MaxEnt models for Salvia ceratophylloides Ard.
Land 12 00247 g004
Figure 5. Prediction of the current potential distribution of Salvia ceratophylloides Ard. In white, highly unsuitable habitat (≤0.20); in blue, unsuitable (0.21–0.40); in green, moderately suitable (0.41–0.60); in yellow, highly suitable (0.61–0.80); in red, highly suitable (≥0.80). In the top left-hand corner, the Calabria region within the Italian territory is highlighted in green.
Land 12 00247 g005
Figure 6. Relative predictive power of different environmental variables based on the jackknife of regularised training gain in MaxEnt models for Salvia ceratophylloides Ard.
Land 12 00247 g006
Figure 7. Prediction of the future potential distribution of Salvia ceratophylloides Ard. in two different scenarios SSP245 and SSP585 in two periods 2021–2040, 2041–2060. In white, highly unsuitable (≤0.20); in blue, unsuitable (0.21–0.40); in green, moderately suitable (0.41–0.60); in yellow, highly suitable (0.61–0.80); and in red, very highly suitable (≥0.80).
Land 12 00247 g007
Figure 8. Prediction of the current potential distribution of Salvia ceratophylloides Ard. In relation to geological substrate. In white, highly unsuitable habitat (≤0.20); in blue, unsuitable (0.21–0.40); in green, moderately suitable (0.41–0.60); in yellow-low, highly suitable (0.61–0.80); and in red, highly suitable (≥0.80).
Land 12 00247 g008
Figure 9. Prediction of the current potential distribution of Salvia ceratophylloides Ard. related to geological substrate, in two different scenarios SSP245 and SSP585 and two periods 2021–2040, 2041–2060. In white, highly unsuitable (≤0.20); in blue, unsuitable (0.21–0.40); in green, moderately suitable (0.41–0.60); in yellow, highly suitable (0.61–0.80); and in red, very highly suitable (≥0.80).
Land 12 00247 g009
Figure 10. Prediction of the current potential distribution of Salvia ceratophylloides Ard. Only in relation to land use and land use with geological substrate. In white, highly unsuitable (≤0.20); in blue, unsuitable (0.21–0.40); in green, moderately suitable (0.41–0.60); in yellow, highly suitable (0.61–0.80); and in red, very highly suitable (≥0.80).
Land 12 00247 g010
Table 1. Description of variables used in the prediction of the MaxEnt model. The variables in bold were selected through Pearson’s correlation analysis and were used in the modelling.
CodeDescriptionUnit
Bio 1Annual Mean Temperature°C
Bio 2Mean Diurnal Range (Mean of monthly (max temp–min temp))°C
Bio 3Isothermality (BIO2/BIO7) (*100)%
Bio 4Temperature Seasonality (standard deviation *100)%
Bio 5Max Temperature of Warmest Month°C
Bio 6Min Temperature of Coldest Month°C
Bio 7Temperature Annual Range (BIO5-BIO6)°C
Bio 8Mean Temperature of Wettest Quarter°C
Bio 9Mean Temperature of Driest Quarter°C
Bio 10Mean Temperature of Warmest Quarter°C
Bio 11Mean Temperature of Coldest Quarter°C
Bio 12Annual Precipitationmm
Bio 13Precipitation of Wettest Monthmm
Bio 14Precipitation of Driest Monthmm
Bio 15Precipitation Seasonality (Coefficient of Variation)%
Bio 16 Precipitation of Wettest Quartermm
Bio 17Precipitation of Driest Quartermm
Bio 18Precipitation of Warmest Quartermm
Bio 19Precipitation of Coldest Quartermm
Elev.Elevationmeter
SlopeSlopedegree
Aspe.Aspectdegree
Table 2. Percent contribution and permutation importance of environmental variables used to predict the MaxEnt model of Salvia ceratophylloides Ard. [SSPs- future scenarios (see text) Bio 1, Bio 4, Bio 13, Bio 14, and Bio 19. Elev (see Table 1)].
TimeSSPsVariableBio 1Bio 4 Bio 13Bio 14Bio 19Elev.
Present time Percent contribution (%)7.87.369.3111.43.2
Permutation importance (%)13.3166.90.899
2021/2040245Percent contribution (%)75.586.30.10.90.2
Permutation importance (%)0.11.197.80.20.60.
585Percent contribution (%)24.415.440.70316.5
Permutation importance (%)52.40250.221.70.7
2041/2060245Percent contribution (%)11.912.173.411.30.3
Permutation importance (%)13.70.678.70.85.40.7
585Percent contribution (%)16.514.225.60.142.61
Permutation importance (%)15.41.5760.10.86.2
Table 3. Classification of habitat suitability in relation to the probability values for the presence of Salvia ceratophylloides Ard. (highly unsuitable (≤0.20); unsuitable (0.21–0.40); moderately suitable (0.41–0.60); highly suitable (0.61–0.80); very highly suitable (≥0.80); area in km2, relative percentage (%) in relation to the entire regional territory, % decrease (−) or increase (+) of the area suitable for the species.
TimeSSPUnitArea tot.≥0.800.61–0.800.41–0.600.21–0.40≤0.20
Present time km2237.32130.44020.96259.434126.48514,813.597
%1.580.200.140.390.8498.42
2021/2040245km2153.98625.02018.25826.32684.38214,896.932
%1.020.170.120.170.5698.98
% inc./dec.−35.11−17.81−12.90−55.71−33.29+0.56
585km2633.513129.70894.667171.816237.32214,417.405
%4.210.860.631.141.5895.79
% inc./dec.+166.94+326.11+351.61+189.09+87.63−2.67
2041/2060245km2171.41429.07122.98441.24178.11814,879.504
%1.140.190.150.270.5298.86
% inc./dec.−27.77−4.50+9.65−30.61−38.24+0.44
585km2643.814145.446122.362150.514225.49214,407.104
%4.280.970.811.001.5095.72
% inc./dec.+171.28+377.81+483.73+153.25+78.28−2.74
Table 4. Classification of habitat suitability related to the probability values for the presence of the Salvia ceratophylloides Ard. in areas with sandy substrate and conglomerates in the Calabria Region. [highly unsuitable (≤0.20); unsuitable (0.21–0.40); moderately suitable (0.41–0.60); highly suitable (0.61–0.80); very highly suitable (≥0.80); area (km2), and the relative percentage in relation to the geological substratum (% sub.) and percentage in relation to the entire regional territory (% reg. ter.)].
TimeSSPUnitArea tot.≥0.800.61–0.800.41–0.600.21–0.40≤0.20
Present time km262.42716.2854.07119.00023.0712066.204
% sub.2.930.770.190.891.0897.07
% reg. ter.0.410.110.030.130.1513.73
2021/2040245km231.8925.4289.5005.42811.5362096.739
% sub.1.500.250.450.250.5498.50
% reg. ter.0.210.040.060.040.0813.93
585km2187.96056.32017.64237.32176.6771940.671
% sub.8.832.650.831.753.6091.17
% reg. ter.1.250.370.120.250.5112.89
2041/2060245km250.2134.7506.10710.85728.4992078.418
% sub.2.360.220.290.511.3497.64
% reg. ter.0.330.030.040.070.1913.81
585km2192.03150.89219.67848.85672.6051936.600
% sub.9.022.390.922.303.4190.98
% reg. ter.1.280.340.130.320.4812.87
Table 5. Ranking of habitat suitability of Salvia ceratophylloides Ard. Related to the values of probability of occurrence values in the different modelling obtained by interpolation with the current potential distribution. Very unsuitable (≤0.20); unsuitable (0.21–0.40); moderately suitable (0.41–0.60); very suitable (0.61–0.80); very suitable (≥0.80); and the area in km2 and relative percentage (%) of decline compared to current potential modelling.
TimeUnitArea tot.≥0.800.61–0.800.41–0.600.21–0.40
Present timekm2237.32130.44020.96259.434126.485
Present time–km2183.29526.47616.97240.73299.115
land use%2313193122
Present time–km262.42716.2854.07119.00023.071
geological substrate%7447816882
Present time–
geological substrate–
land use
km241.39214.9282.71410.85712.893
%8351878290
Disclaimer/Publisher’s Note: The statements, opinions and data contained in all publications are solely those of the individual author(s) and contributor(s) and not of MDPI and/or the editor(s). MDPI and/or the editor(s) disclaim responsibility for any injury to people or property resulting from any ideas, methods, instructions or products referred to in the content.

