1. Introduction
Approximately 20–25% of the world’s population relies on karstic aquifers for water supply and, according to world-scale studies, 10 to 15% of the land surface overlies karstic aquifers [
1,
2]. This applies in particular for the Mediterranean countries, where carbonate terrains occupy 35% of the land surface, and, in some countries, its groundwater contributes up to 50% to the total drinking water supply [
3]. Groundwater recharge is a crucial factor to be considered towards sustainable groundwater management. It is the main variable used to assess the maximum volume of water that can be withdrawn from aquifers without over-exploiting them [
4].
The first stage of a recharge study in an area that has not previously been studied should involve collecting existing data on potential controls on recharge, such as climate, hydrology, geomorphology, and geology [
5]. Vegetation cover is also an important variable when assessing recharge at any given site. Recharge is generally much greater in non-vegetated than in vegetated regions [
6] and greater in areas with annual crops and grasses than in areas with trees and shrubs [
7]. The impact of vegetation was demonstrated, for instance, in Australia [
8], where replacement of deep-rooted native Eucalyptus trees with shallow-rooted crops resulted in recharge increases of about two orders of magnitude.
Information on land use and land cover, topography, and soil textures and permeability are combined to define the geomorphic systems that control recharge. Such systems are closely related to the underlying geologic systems [
5].
Land use, and thus land cover, is strongly linked to human activities and demography. Previous studies have shown that land-use changes are closely related to rural depopulation in Mediterranean areas [
9], especially in mountainous areas with lower productive value [
10], where this fact constitutes one of the main reasons for agricultural abandonment [
11]. This evident divergence in demographic trends between urban and rural areas, where the exponential growth of coastal cities contrasts with a persistent rural depopulation inland, has ecological consequences. These consequences and conservation implications have been well identified in some southern European countries and are known to include, for instance, shrub and tree encroachment on abandoned cropland [
10].
To estimate recharge, the first step is to develop a conceptual model. Obtaining an accurate spatial distribution of recharge involves estimating and simulating the water flow by means of a balance method, integrating climate records with geospatial data (geomorphology, geology, topography, land cover, among others) within a geographic information system (GIS). Balance methods present several advantages, such as the availability of data (pluviometry, piezometric levels, yields, etc.), their straightforward implementation, and relatively low cost. They consider all possible water inputs and outputs, and they can be applied to all types of recharge and aquifers. However, balance methods also have disadvantages, arising from the fact that the terms in the balance normally include errors of measurement, interpretation, and estimation [
3].
Based on the conceptual model, the hydrogeological system can be simulated through a numerical model, which replicates and predicts its functioning and eventual responses when it undergoes disturbances. The numerical model is a common tool used in hydrogeology, which solves a discrete form of the equations that describe the groundwater flow under the assumptions that constitute the conceptual model [
12]. MODFLOW is a three-dimensional modular finite-difference flow model, developed by the U.S. Geological Survey, which solves the groundwater flow equation [
13]. MODFLOW is the most popular groundwater modeling tool and has been successfully used in many studies [
14,
15,
16,
17], although it has certain limitations when simulating processes such as atmosphere–land interactions, land use, surface runoff and hydrologic phenomena within the root zone [
18,
19]. Consequently, to improve the accuracy of the simulations, MODFLOW must be coupled with analyses that consider these variables and their influence in recharge rates and spatial distribution. Continuously developing context-specific groundwater recharge models is essential to increase the long-term viability of water resources, particularly in semi-arid, strongly groundwater-dependent scenarios.
Given the influence of land use and land cover on the spatio-temporal distribution of recharge, it is fundamental to study, understand, and responsibly manage them as a part of an integrated approach toward a sustainable use of groundwater resources [
20,
21]. The uncertainty regarding land-cover changes and how they influence the hydrologic cycle is an issue that complicates water supply modelling [
22].
Since changes in land use and land cover may have a strong impact on aquifer recharge, as well as on the vulnerability of groundwater, there are a significant number of studies that have attempted to establish correlations between these variables. Some of the methodologies used are, for instance, SWAT hydrological modeling using land use predictions [
23], econometric estimation via a modified water-table fluctuation method using field data [
24], or the WetSpass hydrological model, using projections of both future climate and land-use change [
25]. The studies show the fundamental importance of land cover in the study of groundwater systems by concluding, for example, that even with an increase in precipitation driven by climate change, some locations could experience drastic decreases in groundwater recharge of their aquifers [
23]. Studies regarding this subject must be carried out considering the different hydrogeological and climatic configurations, but also the data availability and socioeconomic contexts.
We used a popular open-source software such as MODFLOW to model the piezometric heads under different land use scenarios and, to reduce uncertainties, we applied the same public climatic record instead of predictions or synthetic series. The methodology used in this work is therefore an accessible, simple yet efficient approximation to objectively study the behavior of an aquifer solely under the influence of changes in land cover. This paper aims to estimate the impact of diverse types of land cover on water table levels in a karstic aquifer located in a mountainous zone in south-eastern Spain. This was done by calculating recharge and then simulating and comparing the groundwater dynamics over the last two decades for the actual land cover evolution, and for two different hypothetic land cover scenarios: one being similar to that of the early 1980s, with extensive agriculture taking place; and the other with most of its surface occupied by natural forests on the most evolved stage of natural vegetation, representing a situation with extreme depopulation and landscape intervention being reduced to a minimum.
2. Materials and Methods
2.1. Study Site
The study site is the Almudaina-Segaria aquifer, located in the north of the Alicante province (SE Spain). The main populations that settle on the aquifer are Vall d’Ebo and Vall d’Alcalà, with a combined population of 383 inhabitants in 2019, with a marked downward trend [
26,
27]. The aquifer belongs to the Almudaina-Segaria hydrogeological domain, along with eight other smaller aquifers with no hydraulic connection.
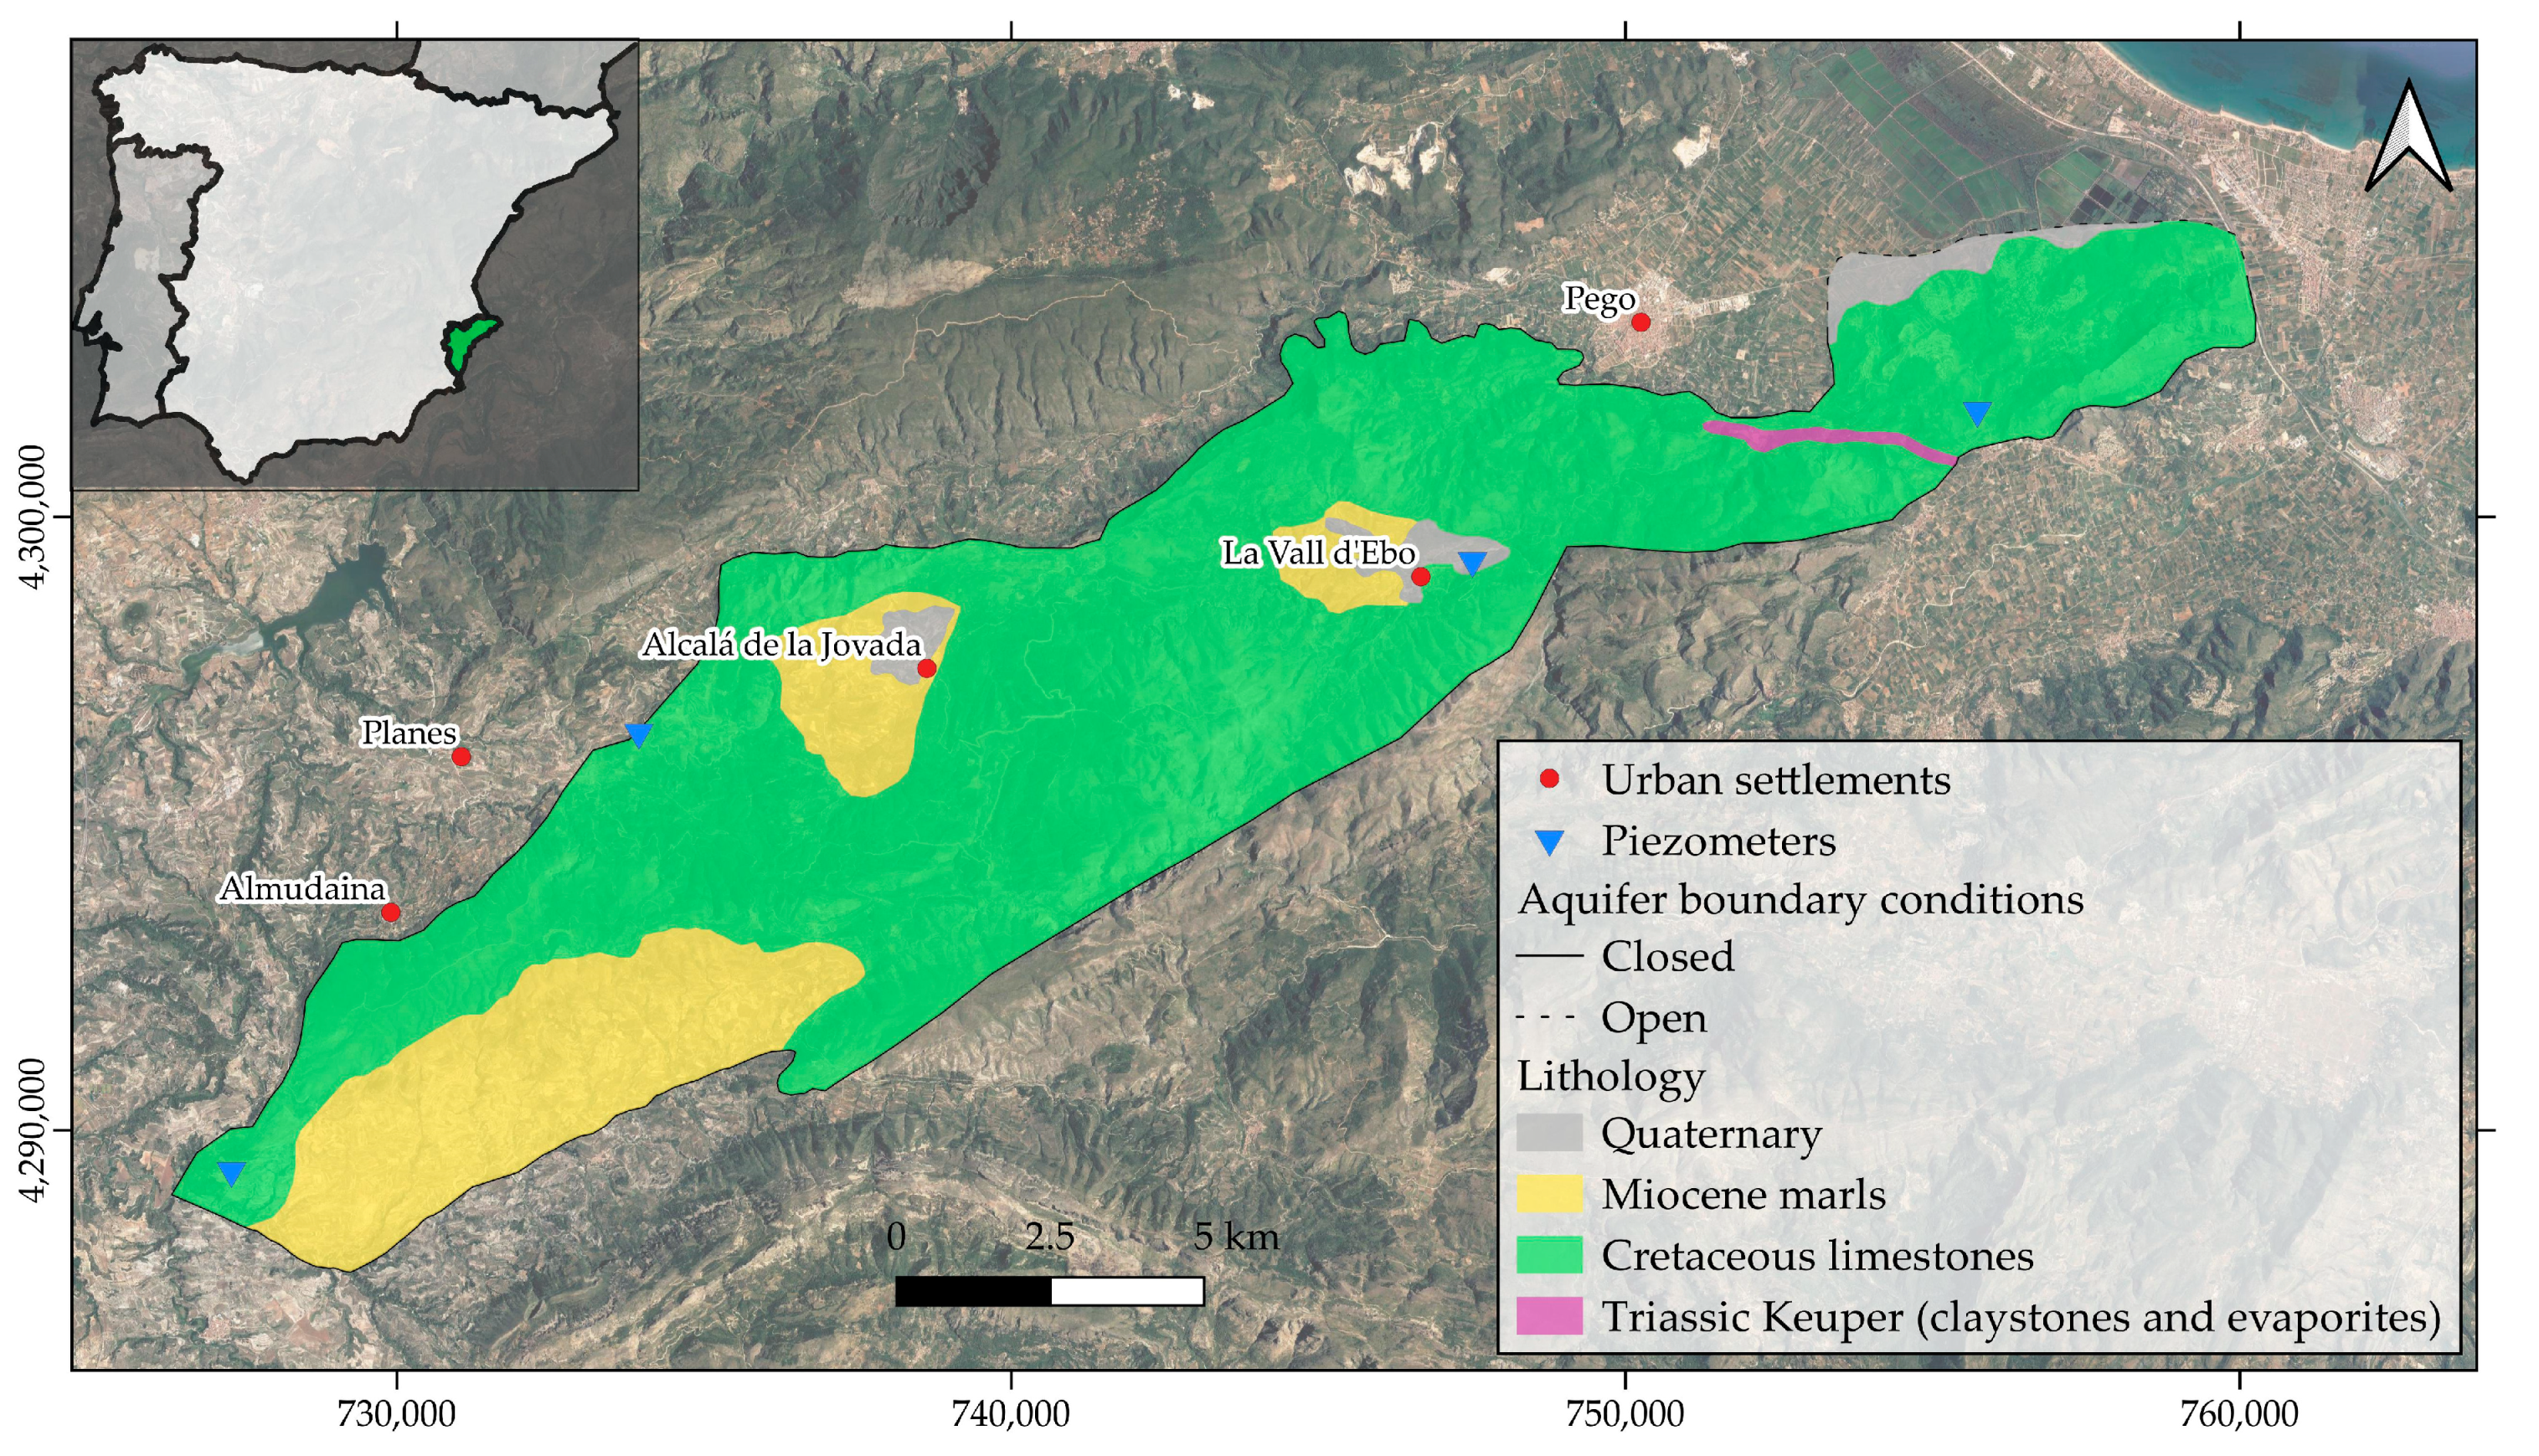
The Almudaina-Segaria aquifer has an elongated shape of about 35 × 5 km, except in its north-eastern sector where it narrows approximately by half (
Figure 1). It has an elongated morphology in SW-NE direction and occupies an area of 167 km
2, of which 145 km
2 correspond to permeable materials. The study area presents a high average slope (37.3 %) as it is part of a mountain domain composed of (from west to east) the Almudaina, Alfaro, La Carrasca, Mediodía and Segaria ranges.
The permeable layer is made of carbonate formations (marls and limestones) with an average thickness of about 800 m in the western sector, and 300 m in the eastern sector. The identified lithologies are mainly limestones with Aptian–Albian marly intercalations, Eocene limestones and sandstones, conglomerates, and lower Miocene limestones. This highly permeable aquifer overlies an impermeable layer determined by Barremian marl and marl limestones with an estimated thickness of 400 m. All the Upper Cretaceous permeable sections are in hydraulic connection, constituting a single aquifer except in its southern sector where the marly horizons may produce small permeable sections with poor hydraulic connection with the main section of the aquifer [
28]. In the central east sector of the aquifer there are small outcrops of Keuper facies, defining a hydraulic barrier that causes a significant drop in the piezometric heads.
The permeable materials of the aquifer are sealed across its perimeter by different hydraulic boundaries (Tap facies and faults in the north, Miocene marls to the east, and tectonic elevation of the base impermeable layer in the south), except at its easternmost end (east of Pego), where there is connection with the detrital materials of the adjacent aquifer [
28].
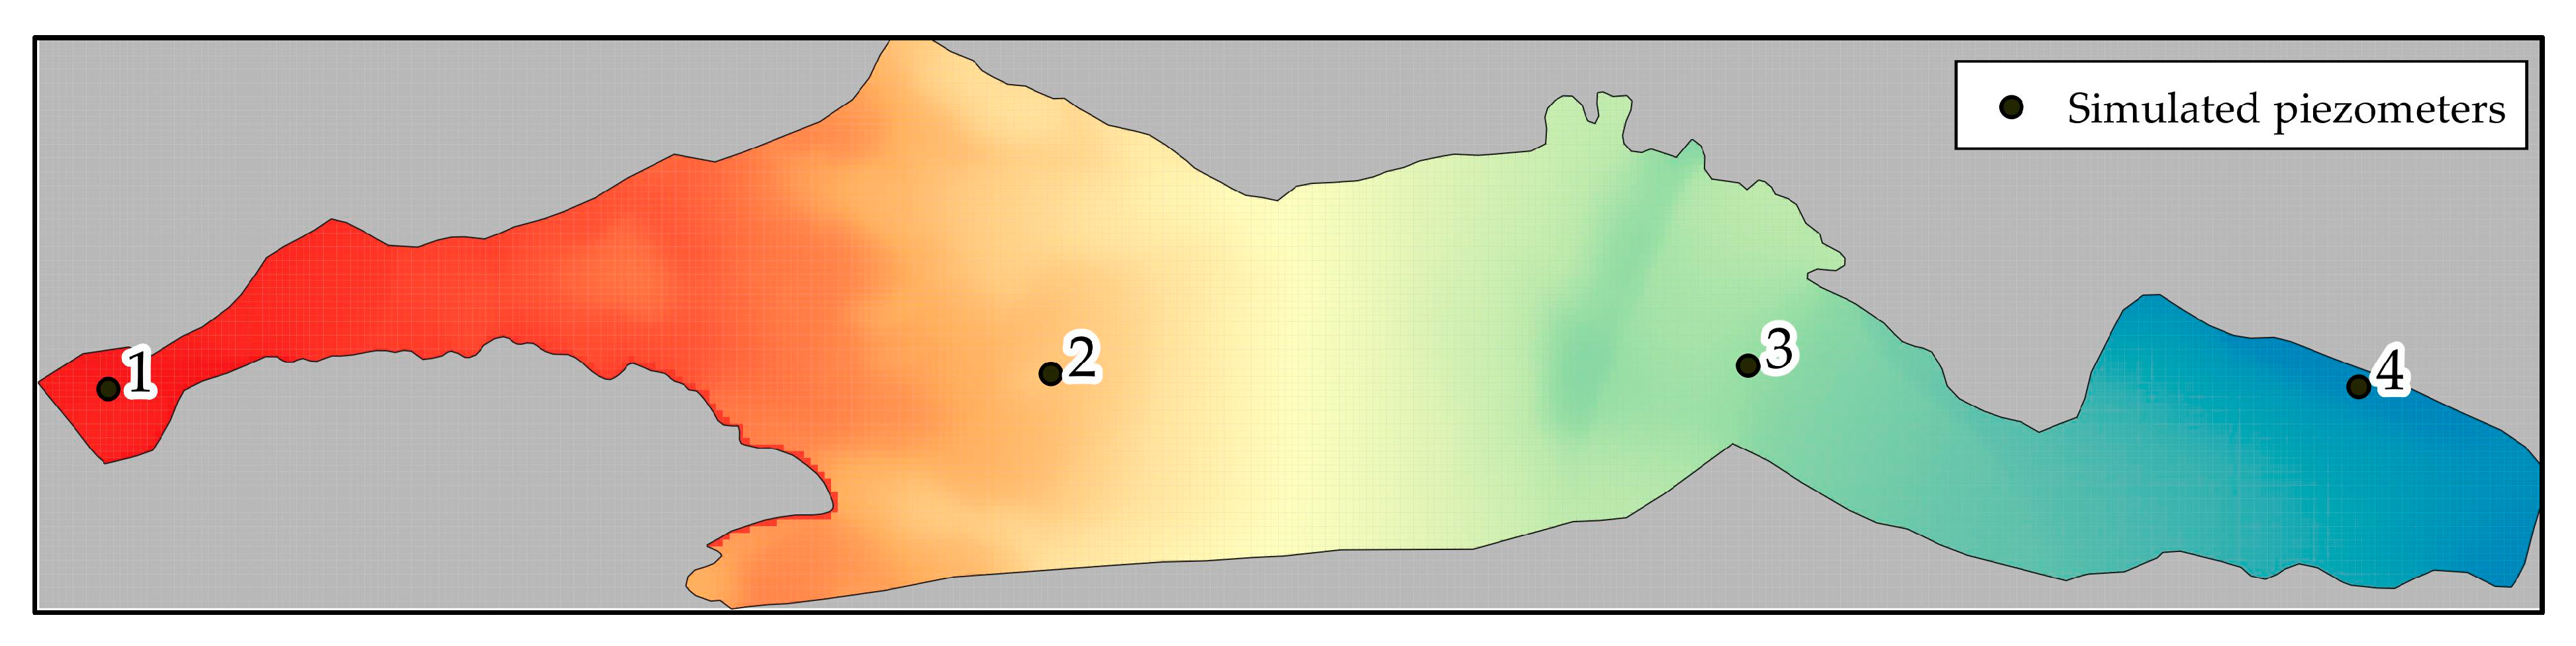
The water table elevation is monitored via piezometers, four of them being shown in
Figure 1. In the western portion, the elevation is only known at specific points, and it varies between about 320 and 150 m.a.s.l (meters above sea level), which implies depths of over 530 m. Toward east, the heads are close to 50 to 70 m.a.s.l. in the vicinity of Pego, and below five m.a.s.l. at the eastern end of the aquifer.
The recharge of the system is produced via the infiltration of rainfall, while the discharge takes place by withdrawal for urban, agricultural, and industrial uses, as well as by lateral subterranean drainage, and superficial drainage to the Racons River and Finca Rincón del Rosario [
28].
The region features a semi-arid climate, characterized by dry, hot summers with average temperatures above 22 °C, and wet, rainy winters, with an average rainfall of around 680 mm per year, according to data from the last 20 years [
29].
The Thermo-Mediterranean holm oak forests (
Quercus ilex) constitute the authentic potential vegetation of the area. The associations of sclerophyllous vegetation, very widespread today and regionally named
coscojar, only represent the initial stage of the ancient holm oaks, and they can only be considered as climax vegetation in the semi-arid thermo-Mediterranean zones. It is in these situations that the Aleppo pine (
Pinus halepensis) would have its natural area. The
coscojar is a plant community in which the Kermes oak (
Quercus coccifera) predominates, a bush of the same genus as the holm oaks [
30].
Thus, for the studied site, it is possible to find an initial stage of sclerophyllous vegetation that develops into Aleppo pine forests. Although Aleppo pine forests represent the natural forest formations, they can be also a development stage to the Holm oaks Thermo-Mediterranean forests, a species that appears in over 30% of its forests [
31]. The existence of the Thermo-Mediterranean holm oaks highlights the potentiality of trees on Mediterranean limestone brown soils and the remains of a well-developed
terra rossa [
30]. Few examples of these ancient forests remain, due to the agricultural hyper-exploitation that the entire area has suffered since the first human settlements appeared.
2.2. Land Cover Scenarios
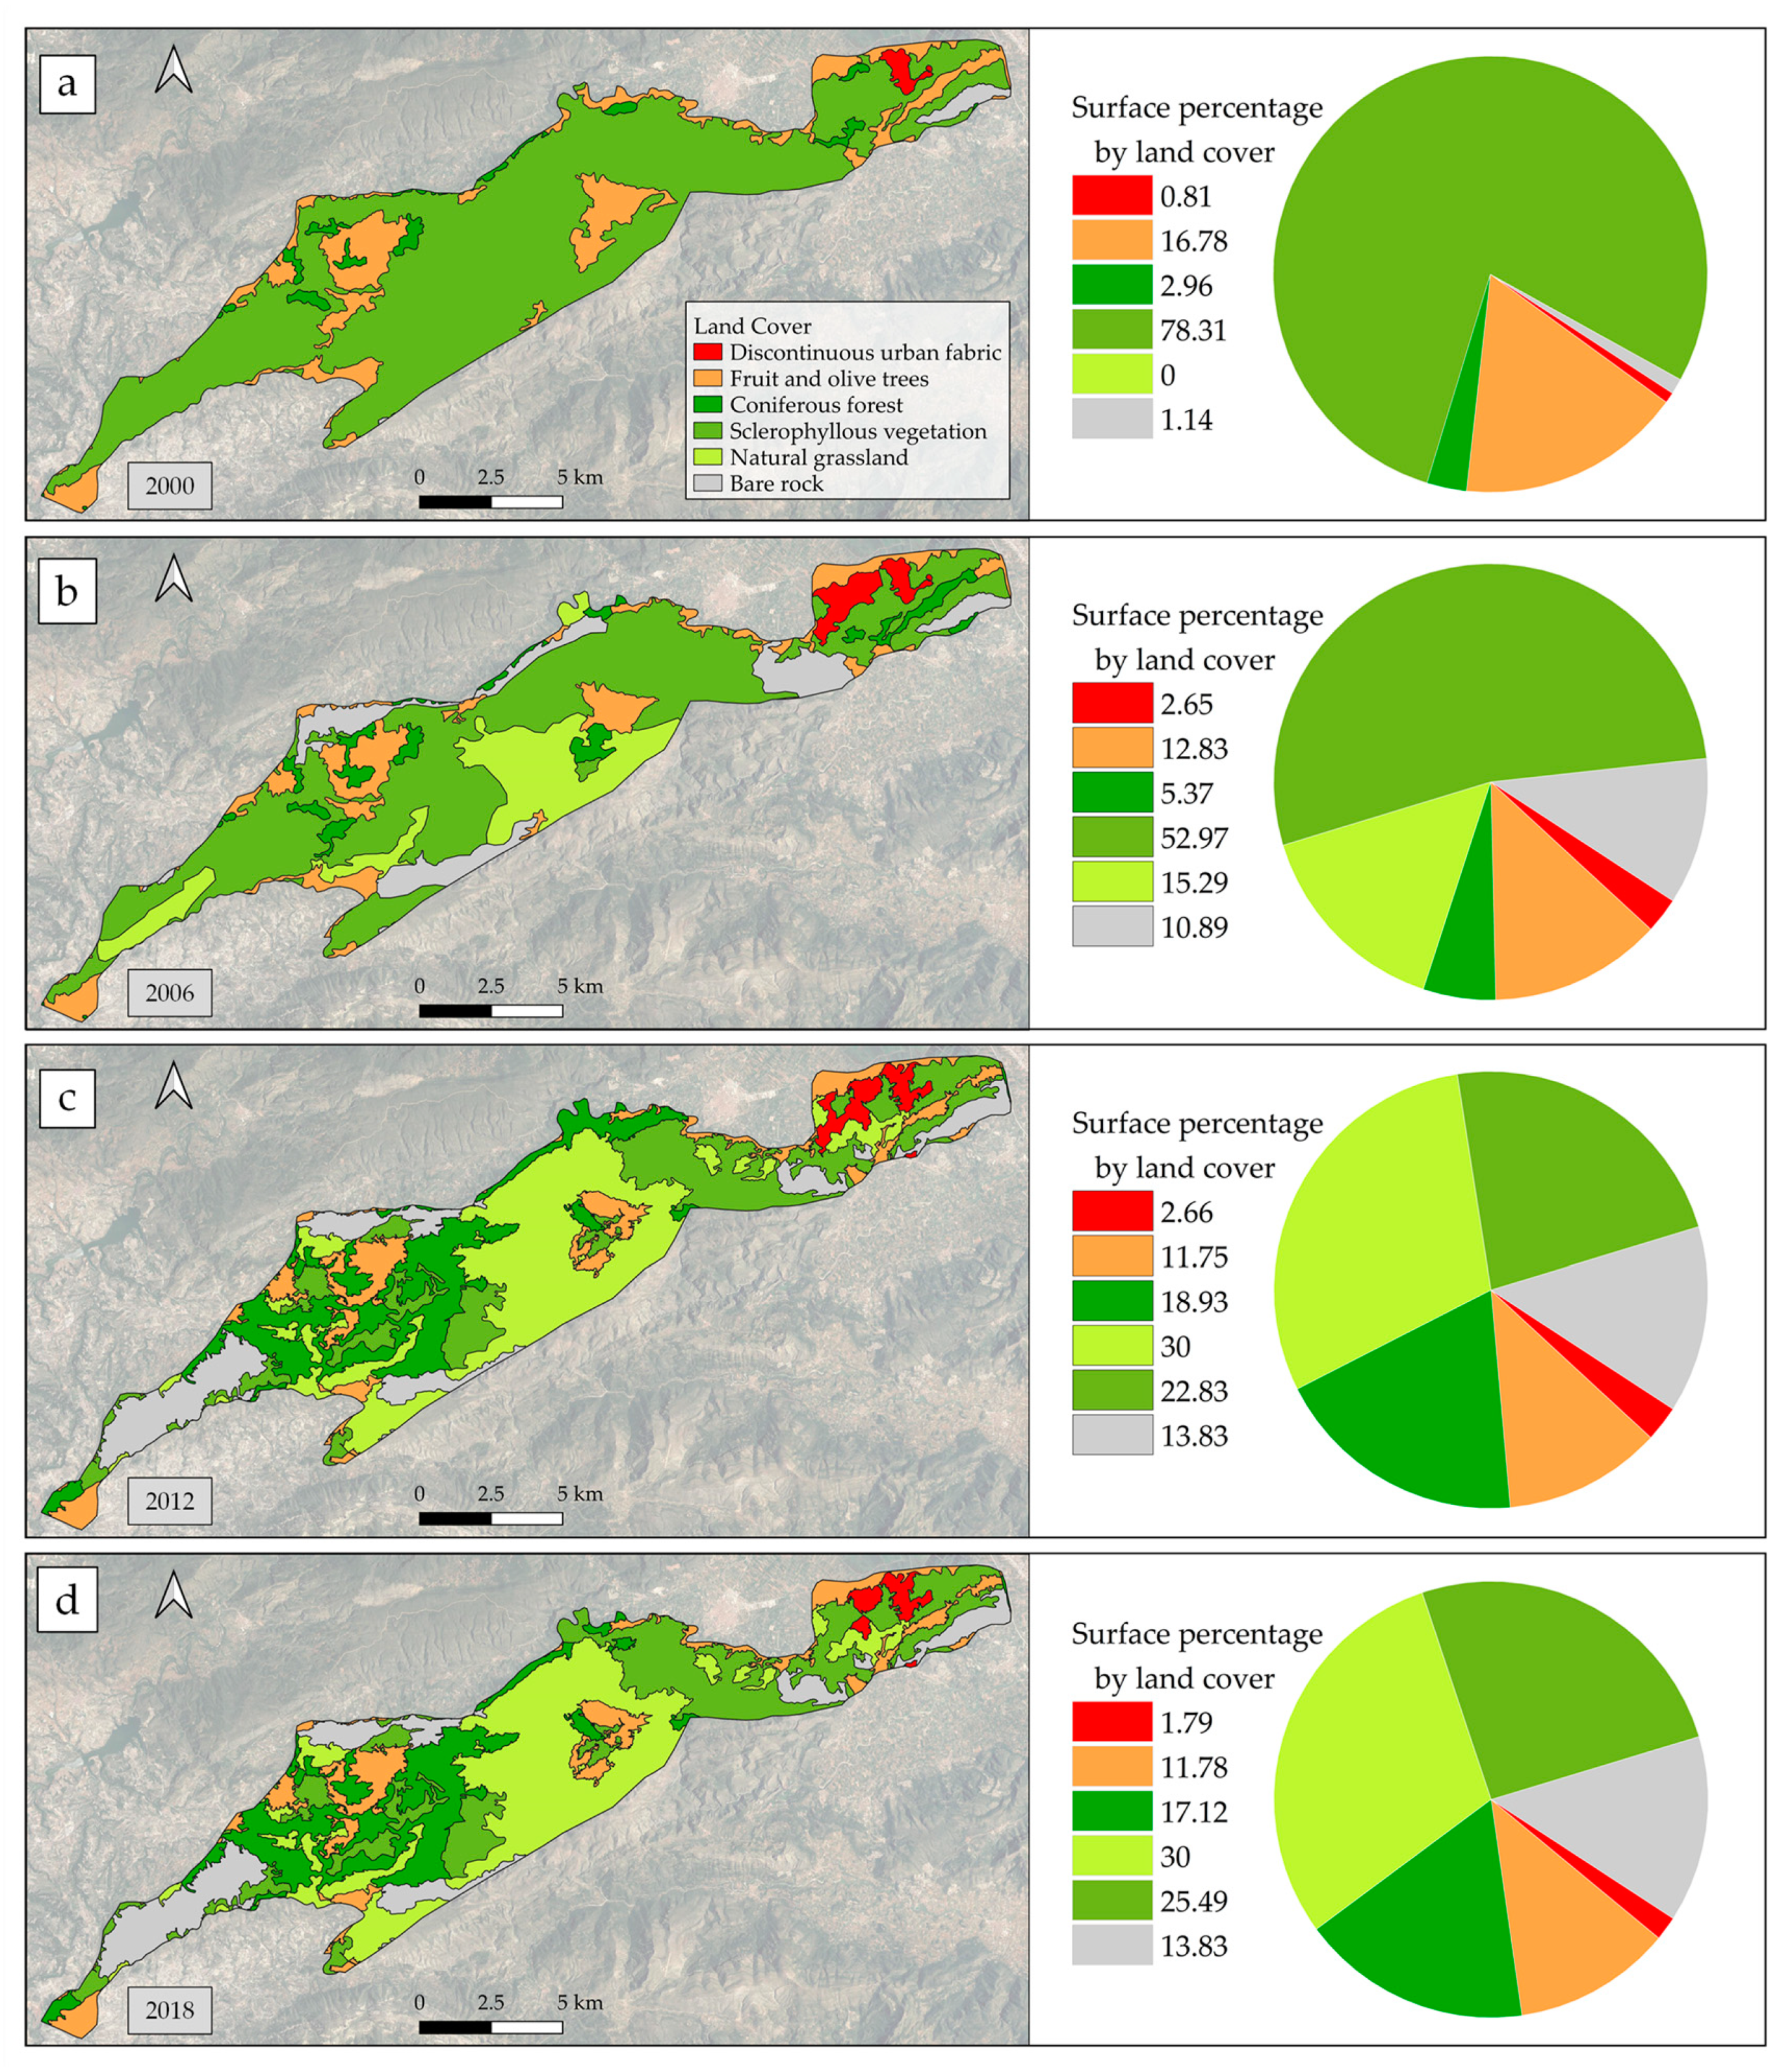
The analysis of the CORINE Land Cover (CLC) maps for the years 2000, 2006, 2012 and 2018 [
32,
33,
34,
35] allowed us to identify a total of 18 (out of its 44) categories present within the Almudaina-Segaria aquifer area. These 18 categories were regrouped into six main categories that represent the most common land covers in the study area, based on surface extension and similarities in the type of cover and hydrological behavior in the context of the aquifer. This contextualization and simplification of the original CORINE maps was performed by discarding the land cover categories that are present in the area, but with a negligible surface (such as “Sport and leisure facilities”). We joined then the categories that are similar in the particular context of this aquifer. For instance, the original category “Complex cultivation patterns”, which corresponds to different types of land cover, is occupied by fruit tree crops, and therefore assigned to the category “Fruit tree and berry plantations”. The reclassification of multipurpose categories is easily achievable through open access satellite images. The resulting maps were simplified in GIS by dissolving the polygons belonging to the same category. The resulting six categories are listed in
Table 1. The categories and types of land cover defined by the CORINE project, mainly based on textural criteria, were corroborated also by comparing them with the maps available in the Forest Map of Spain (MFE50), developed by the Spanish Ministry for the Ecological Transition and the Demographic Challenge [
36]. To analyze the recharge that enters the Almudaina-Segaria aquifer under different land use and land cover settings, we defined three scenarios.
2.2.1. Actual Scenario: Historical Land Cover Evolution
The first scenario is a real, historical geospatial land cover evolution between 2000 and 2022, period for which the changes in the territory cover were outlined according to the European CORINE Land Cover (CLC) dataset. We addressed the maps corresponding to the years 2000, 2006, 2012 and 2018 to select and redefine the dominant land cover classes, considering their areal extension and validity of the classes in the context of our studied area, as previously stated. We obtained simplified maps that accurately represent the territory cover at four points within the studied time series. The time consistency for the CORINE Land Cover maps was originally set for one or two years, but for this study we assumed each map to be representative of the land cover in the year it was issued, and up to half of the time intervals separating it from the preceding and following maps.
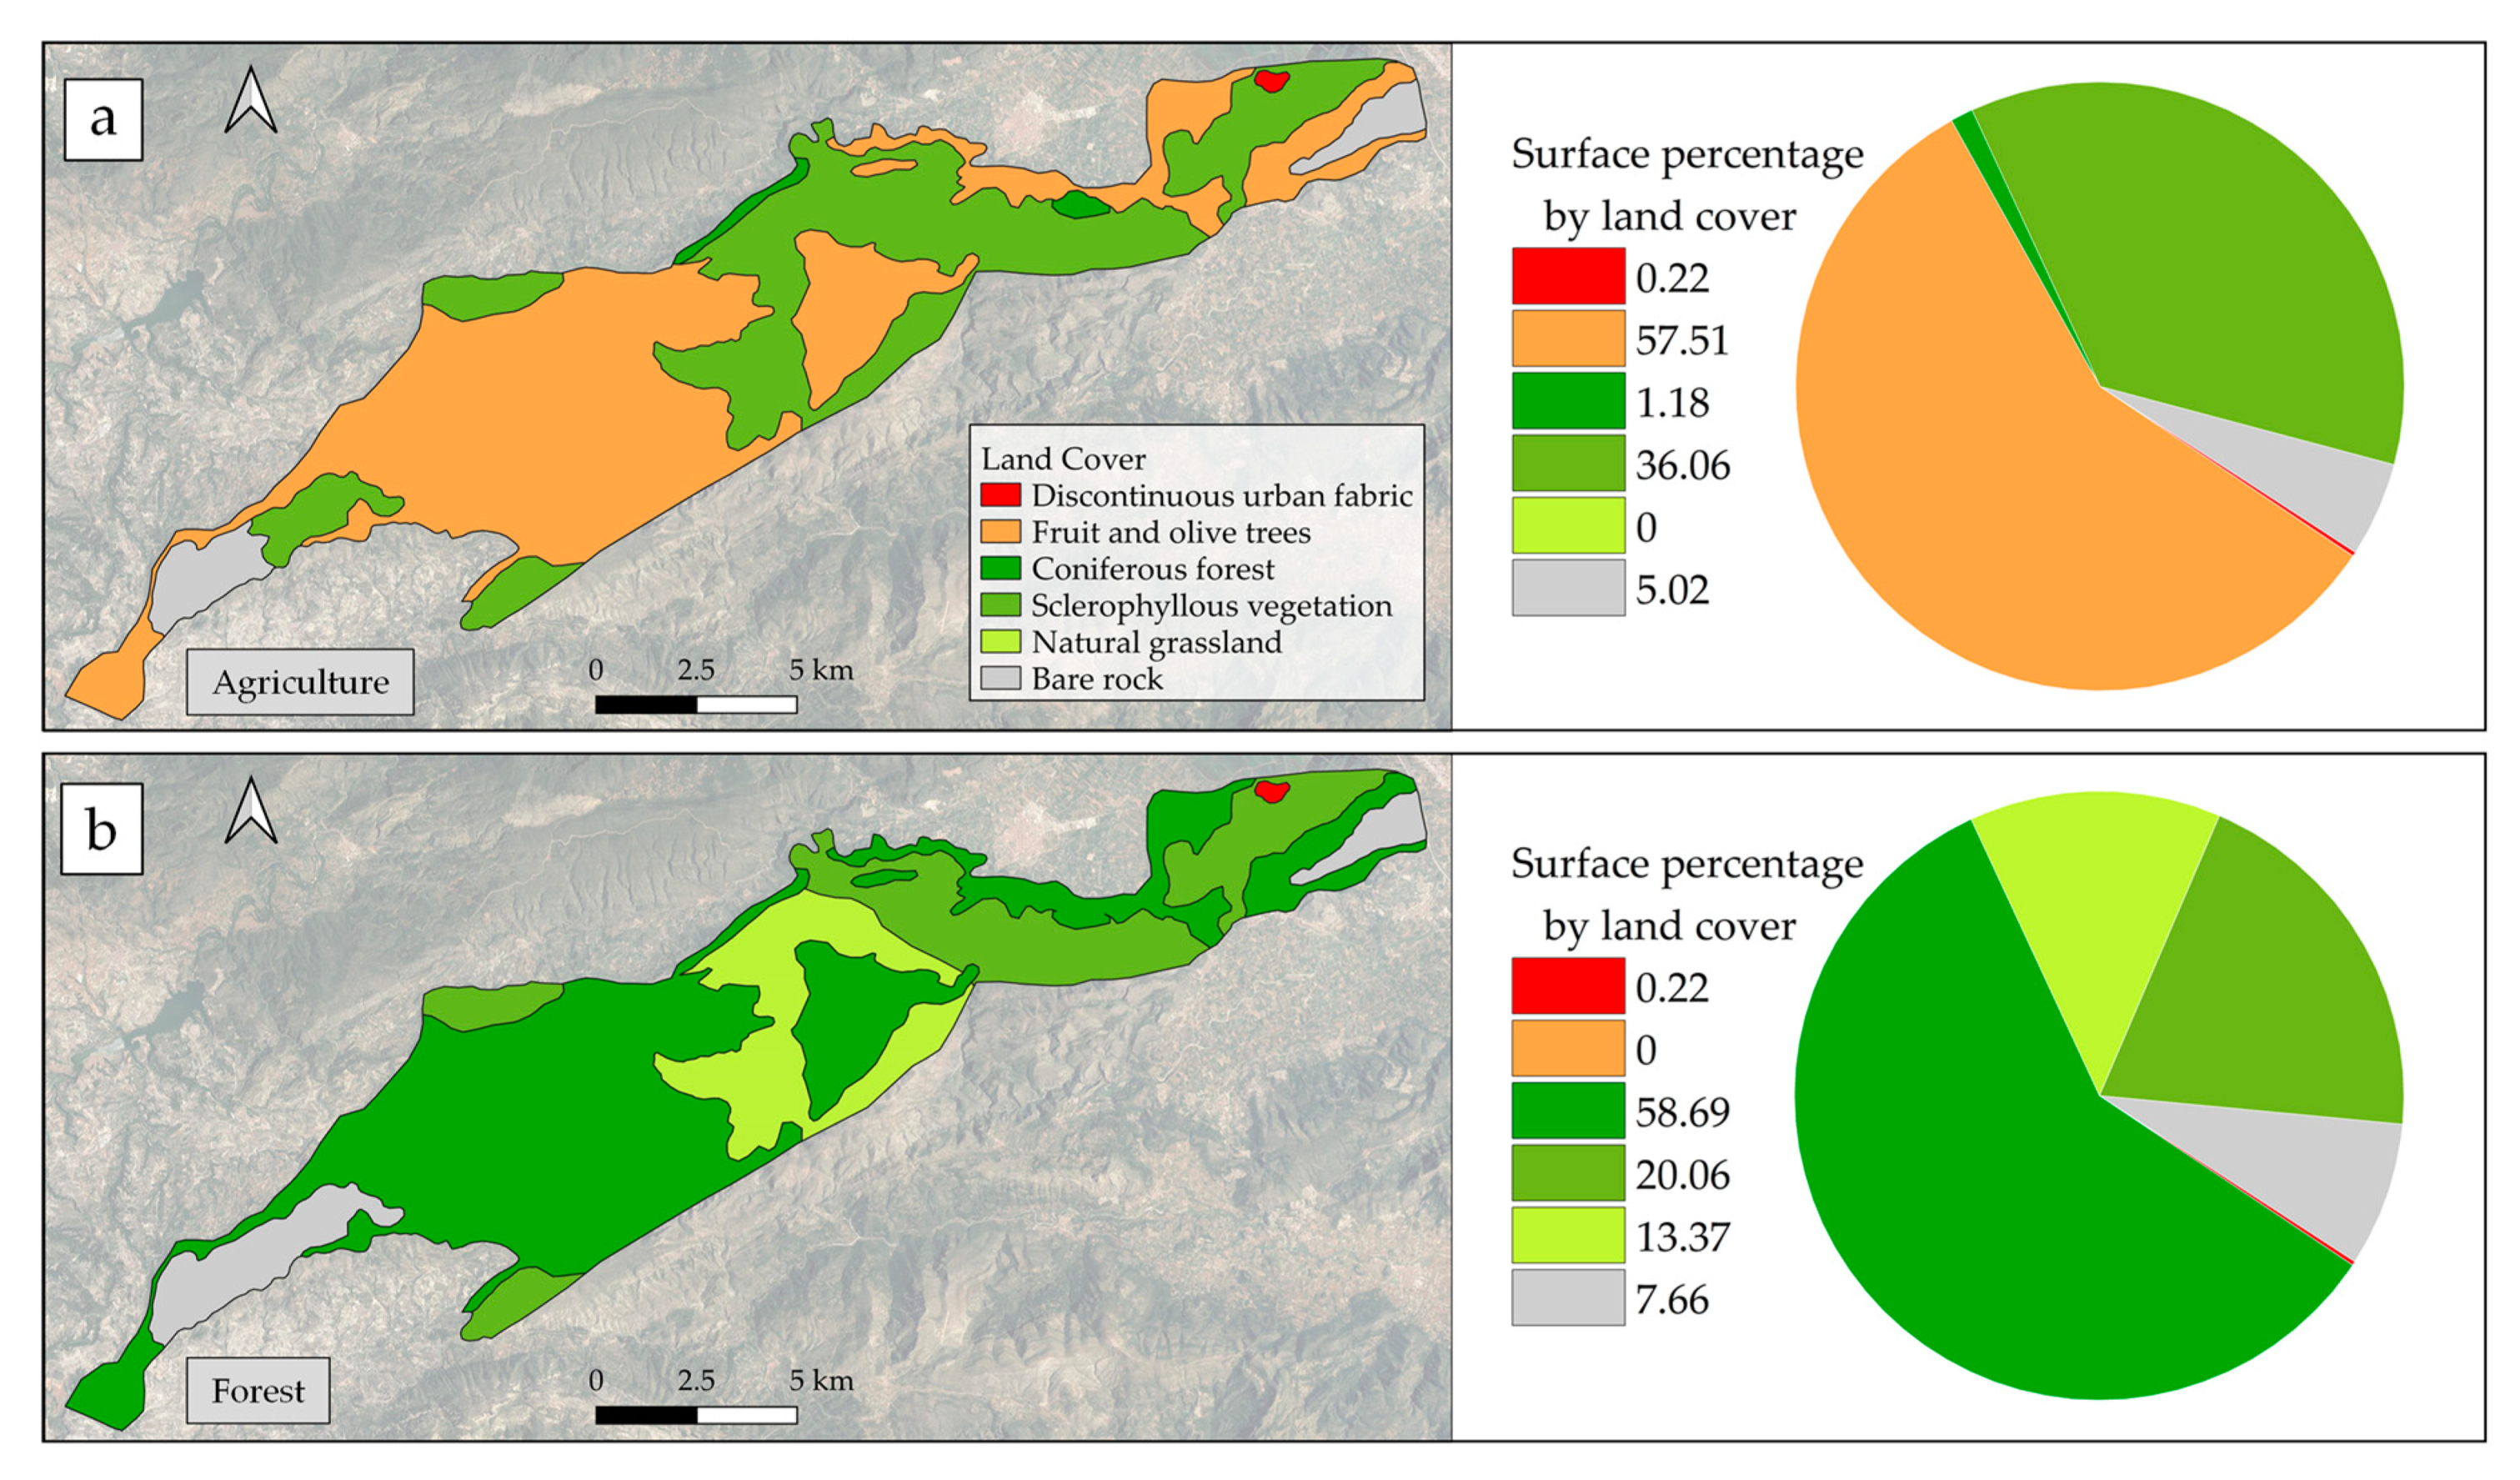
2.2.2. Agriculture Scenario: Agricultural Predominance
We proposed a first hypothetical land cover scenario in which a large part of the territory would be assigned to agricultural activity, as it occurred during the expansion of the population settlements in the area in the 20th century. The most common agriculture in the area is rainfed, and based on olive, fruit, almond trees and, to a lesser extent, cereal [
37]. This setting was built by the digitization of orthophotos, from the National Geographic Information Centre [
38], part of the National Geographic Institute. These orthophotos correspond to the national photogrammetric flight carried out between 1980 and 1986. This data set correspond to the dates in which the combined population of the most important settlements in the aquifer area, Vall d’Ebo and Vall d’Alcalà was significantly higher than in the present [
26], and the agricultural activity was visibly more extended [
38].
2.2.3. Forest Scenario: Abandonment of the Agricultural Activity
The second hypothetical scenario was built considering a likely future where agricultural activities in the Almudaina-Segaria aquifer area were completely abandoned and the progressive natural evolution of vegetation reached its peak development stage, with the formation of forests. This hypothetical future scenario must be considered as highly probable, due to the sustained decrease of population in the study area (which has decreased over 60% in the last century, according to [
26,
27]) combined with a decline in the percentage of active population dedicated to agriculture. This scenario was configured based on a supposed advance of the forest vegetation over the areas previously dedicated to agriculture, and also above the areas occupied by sclerophyllous vegetation, considering factors that would favor the development of forests, such as slope and location in intermountain areas or valleys. A certain degree of coherence was maintained with the CORINE 2018 map regarding areas that naturally have little or no vegetation, as we interpreted that they are not likely apt to support forests.
2.3. Estimation of Aquifer Recharge
We approached the recharge assessment by a soil–water budget method. This method is common in most hydrologic models, such as surface-water and groundwater flow models, due to its remarkable flexibility. The recharge (R) was estimated daily following Equation (1).
where P is the precipitation, VR is the amount of water intercepted by canopy, SR is surface runoff, ET is evapotranspiration, and SW is soil water, the amount of water retained by the soil storage, all variables measured in mm.
In this approach, the recharge is estimated as a “residual” approach, where all of the variables in the water-budget equation except R are measured or estimated, and R is set equal to the residual. The small inaccuracies in the values of these variables, that commonly result in large uncertainties in the recharge rate, are minimized if the water budget is calculated on a daily time step, even in arid settings [
5].
Daily precipitation and potential evapotranspiration data (calculated using the Penman-Monteith method) were taken from the Planes agroclimatic station [
29].
Surface runoff was determined by the adoption of a runoff threshold, understood as the number of millimeters of rainfall after which surface runoff begins to occur. It was calculated by means of intersecting land slope, land cover determined by the CLC (CORINE Land Cover) classes, and soil permeability [
39], according to the Soil Conservation Service—Curve Number (SCS-CN) method. The standard SCS-CN method as developed by USDA-SCS (United States Department of Agriculture, Soil Conservation Service) National Engineering Handbook (1973) was modified as suggested by [
40].
The soil water content (SW) depends on soil properties such as field capacity, permanent wilting point and initial soil moisture, and land cover. The influence of the vegetation cover on water balance at soil level is given by the root depth, variable according to the type and degree of plant development. The amount of rainfall that the vegetation is capable of intercept and retain (VR) is, in this context, negligible.
By combining these variables, we identified areas with similar hydrologic response regarding effective infiltration and runoff generation. These are zones with similar runoff thresholds, land cover, soil hydraulic properties and topography.
In order to obtain comparable results that let us conclude how soil use and land cover affects the recharge process, we applied the same 20 years rainfall series to calculate recharge for all land use scenarios. We also assumed that there were no variations in land slopes and main soil properties throughout the studied period. Therefore, the differences between the amounts of recharge calculated for each scenario can be certainly linked to the different land covers settings.
2.4. Model Construction and Calibration
Groundwater flow in the Almudaina-Segaria aquifer was modelled using the MODFLOW-2005 code [
13], with ModelMuse [
41] as Graphic User Interface. The model was built by reconstructing and actualizing the existing simulations elaborated by government institutions [
42]. For this project, a steady-state simulation was built and then, using this model as initial condition, the transient-state was developed and calibrated. For the transient simulation, nearly 21 and a half years of daily data were processed, from 23 December 1999 to 30 June 2022. We considered the results starting from the first day of the year 2000.
The aquifer was discretized in 100 × 100 m finite cells resulting in an array of 370 columns and 84 rows within a single permeable layer (31,080 cells), being active cells those intersected and enclosed by the aquifer’s contour. The upper and lower boundaries were defined by using digital elevation models, with no vertical flow through the aquifer bottom. The boundary conditions are defined based on the hydrogeological setting, as seen in
Figure 1. The permeable materials of the aquifer are sealed by different hydraulic boundaries (Tap facies and faults in the north, Miocene marls to the east, and tectonic elevation of the base impermeable layer in the south), resulting in no-flow boundaries across the entire perimeter of the aquifer except for the eastern sector, where there is connection with the detrital materials of the adjacent aquifer [
28]. The dashed line in
Figure 1 represents the aquifer flow boundaries, where most of the water output takes place. This contact is integrated by the following segments: Racons River, Finca Rincón del Rosario drainage, and two sectors of lateral drainage. The Racons River and Finca Rincón del Rosario drainage were assigned to the river package with a bed conductance of 1500 and 2000 m
2/d, respectively. In the lateral drain sectors, Pego and Vergel, there is a flow boundary assigned to the drain package, with conductances of 500 and 300 m
2/d, respectively. Discharge takes place also through five wells with relevant withdrawal volumes. For each well, the corresponding series of water extractions were loaded into ModelMuse.
The horizontal hydraulic conductivity was initially assigned by sectors with values between 0.005 and 30 m/d, while the storage coefficient was between 0.0001 and 0.05.
The Almudaina-Segaria aquifer is recharged exclusively by the infiltration of rainfall through the permeable unsaturated zone. To build the input for the recharge package, the previously delimited zones with similar hydrologic response were loaded according to each scenario: for the historical spatial distribution, the recharge input has four different arrangements that represent the land use and cover throughout the studied series. For both hypothetical scenarios, the spatial distribution of the recharge zones remained constant throughout the modelled period.
The used flow package was layer property flow (LPF), and the solver was preconditioned conjugate gradient solver with improved nonlinear control (PCGN).
The model calibration and validation were carried out using the head-observation package, by comparing the simulated heads and the heads series from the abovementioned 4 piezometers, with a combined amount of almost 12,000 daily measurements. To adjust the simulation, the parameters modified were hydraulic conductivity and specific storage, although the modifications in the latter were minimal. Five years of the series, corresponding to its final section, were used to validate the model using data from a piezometer located in the center-west sector of the aquifer.
The goodness-of-fit between the observed and simulated water heads was quantified by calculating the coefficient of determination (R2), root mean square error (RMSE), normalized root mean square error (NRMSE) and Nash–Sutcliffe model efficiency coefficient (NSE) for the whole time series, both calibration and validation.
Finally, we compared the variation of the groundwater table between the three different scenarios, by selecting four points distributed in different sectors of the aquifer and their associated hydrographs.
3. Results
3.1. Spatio-Temporal Variation of Land Cover
The land cover in the Almudaina-Segaria aquifer has remarkably changed over the last two decades.
Figure 2 shows the evolution of the actual scenario, defined as such since it represents the real land cover evolution and how the area occupied by each one of these categories varied through the studied period.
In the year 2000 (
Figure 2a), most of the territory (almost 80% of the total surface) was covered by sclerophyllous-type vegetation (Maquis, scrub, garrigue and thermo-Mediterranean brushes, characterized by shrubs of sclerophyllous character, with hard leaves and short internodes, and abandoned olive groves). Toward 2006 (
Figure 2b), there is an increase in the percentage of non-vegetated surface, grassland areas (where herbaceous vegetation, as gramineous species, is prevailing) and a slight increase in areas considered artificial surfaces (mainly urbanizations and areas under construction). In 2012 (
Figure 2c), an important change is observed, with another increase in areas lacking vegetation, but also in surface covered by forests. Sclerophyllous vegetation was reduced to localized sectors, as well as areas dedicated to agriculture, located in the vicinity of small urban settlements. The variations between the maps corresponding to the years 2012 and 2018 (
Figure 2d) are irrelevant at aquifer scale and they are associated with the evolution of sclerophyllous vegetation into forests, and the abandonment of areas previously under construction at the eastern end of the aquifer, replaced by bushy vegetation and thickets.
The first hypothetical scenario (reconstructed from aerial photography), in which the land is mostly covered by crops such as fruit trees, shows approximately 57% of the surface of the territory dedicated to agriculture, as seen in
Figure 3a. The second hypothetical scenario, where the agricultural activities have been completely replaced by natural vegetation, shows 58% of its surface covered by forests, as shown in
Figure 3b.
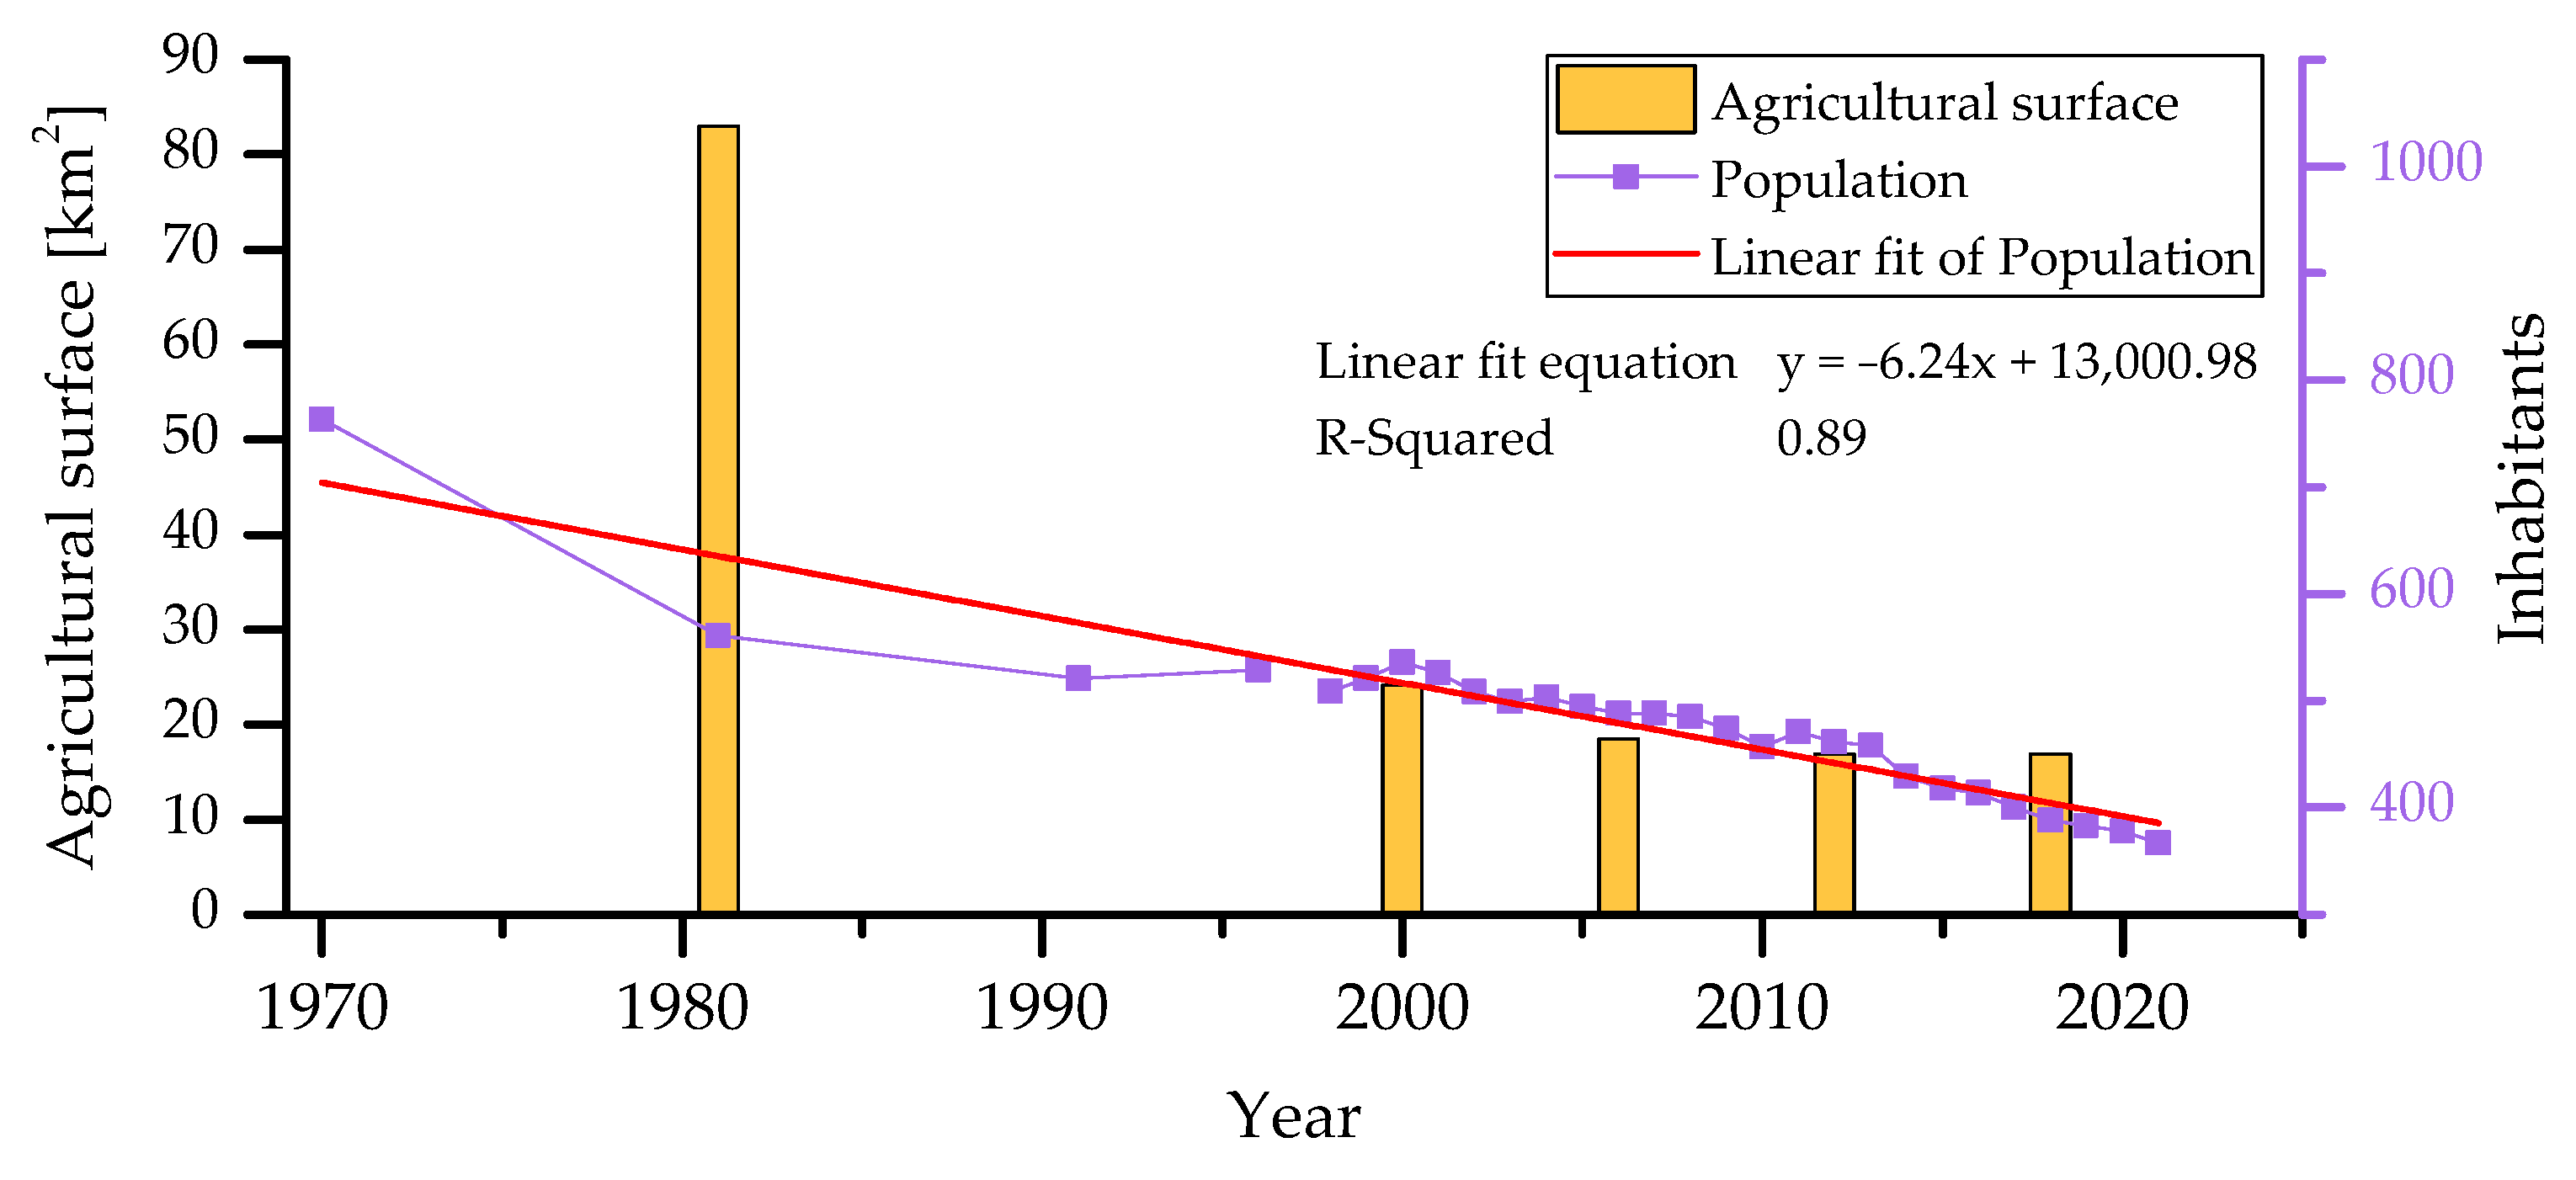
This variation in land use and the associated land cover shows a certain degree of correlation with the variation in the demographic data corresponding to the most important populations located in the aquifer sector, Vall d’Ebo and Vall d’Alcalà. As seen in
Figure 4, the scenario in which the land is mostly occupied by agricultural activity (based on aerial photographs from 1980) coincides with the years of highest number of inhabitants of the selected populations for the studied period (2000–2022). Afterwards, there is a decrease in the cultivated area, which is progressively replaced by other types of cover. The decrease in the cultivated area observed throughout the series is similar to the drop in the number of de facto inhabitants. Should the trend of depopulation in the area continue, and therefore also the most likely decrease in the agricultural activity, it is then that we will reach the stage in which the forest vegetation becomes the predominant land cover.
3.2. Estimated Recharge
For each of the three scenarios considered (the actual evolution of land cover for 2000–2022, the predominantly cultivated scenario, and the predominantly forested scenario), recharge was calculated at a daily level considering the spatial and temporal variation of the parameters that influence it, that is, rainfall, potential and real evapotranspiration, land cover, vegetation type, soil hydraulic properties, and slope.
For the actual land cover evolution scenario (
Figure 2), the total aquifer recharge between the years 2000 and June 2022 has accounted for 487.8 hm
3. Considering the same period and the same climatic setup, for the forest dominated scenario (
Figure 2b) the total recharge would have been 357.5 hm
3, while for the agriculture dominated scenario (
Figure 2a) the recharge would have been 523 hm
3. This means that the scenario with most of the aquifer surface being dedicated to agriculture is the one with the highest water inflow into the aquifer system, followed by the actual scenario, and, finally, the lowest water inflows to the aquifer were calculated for the configuration where forests predominate.
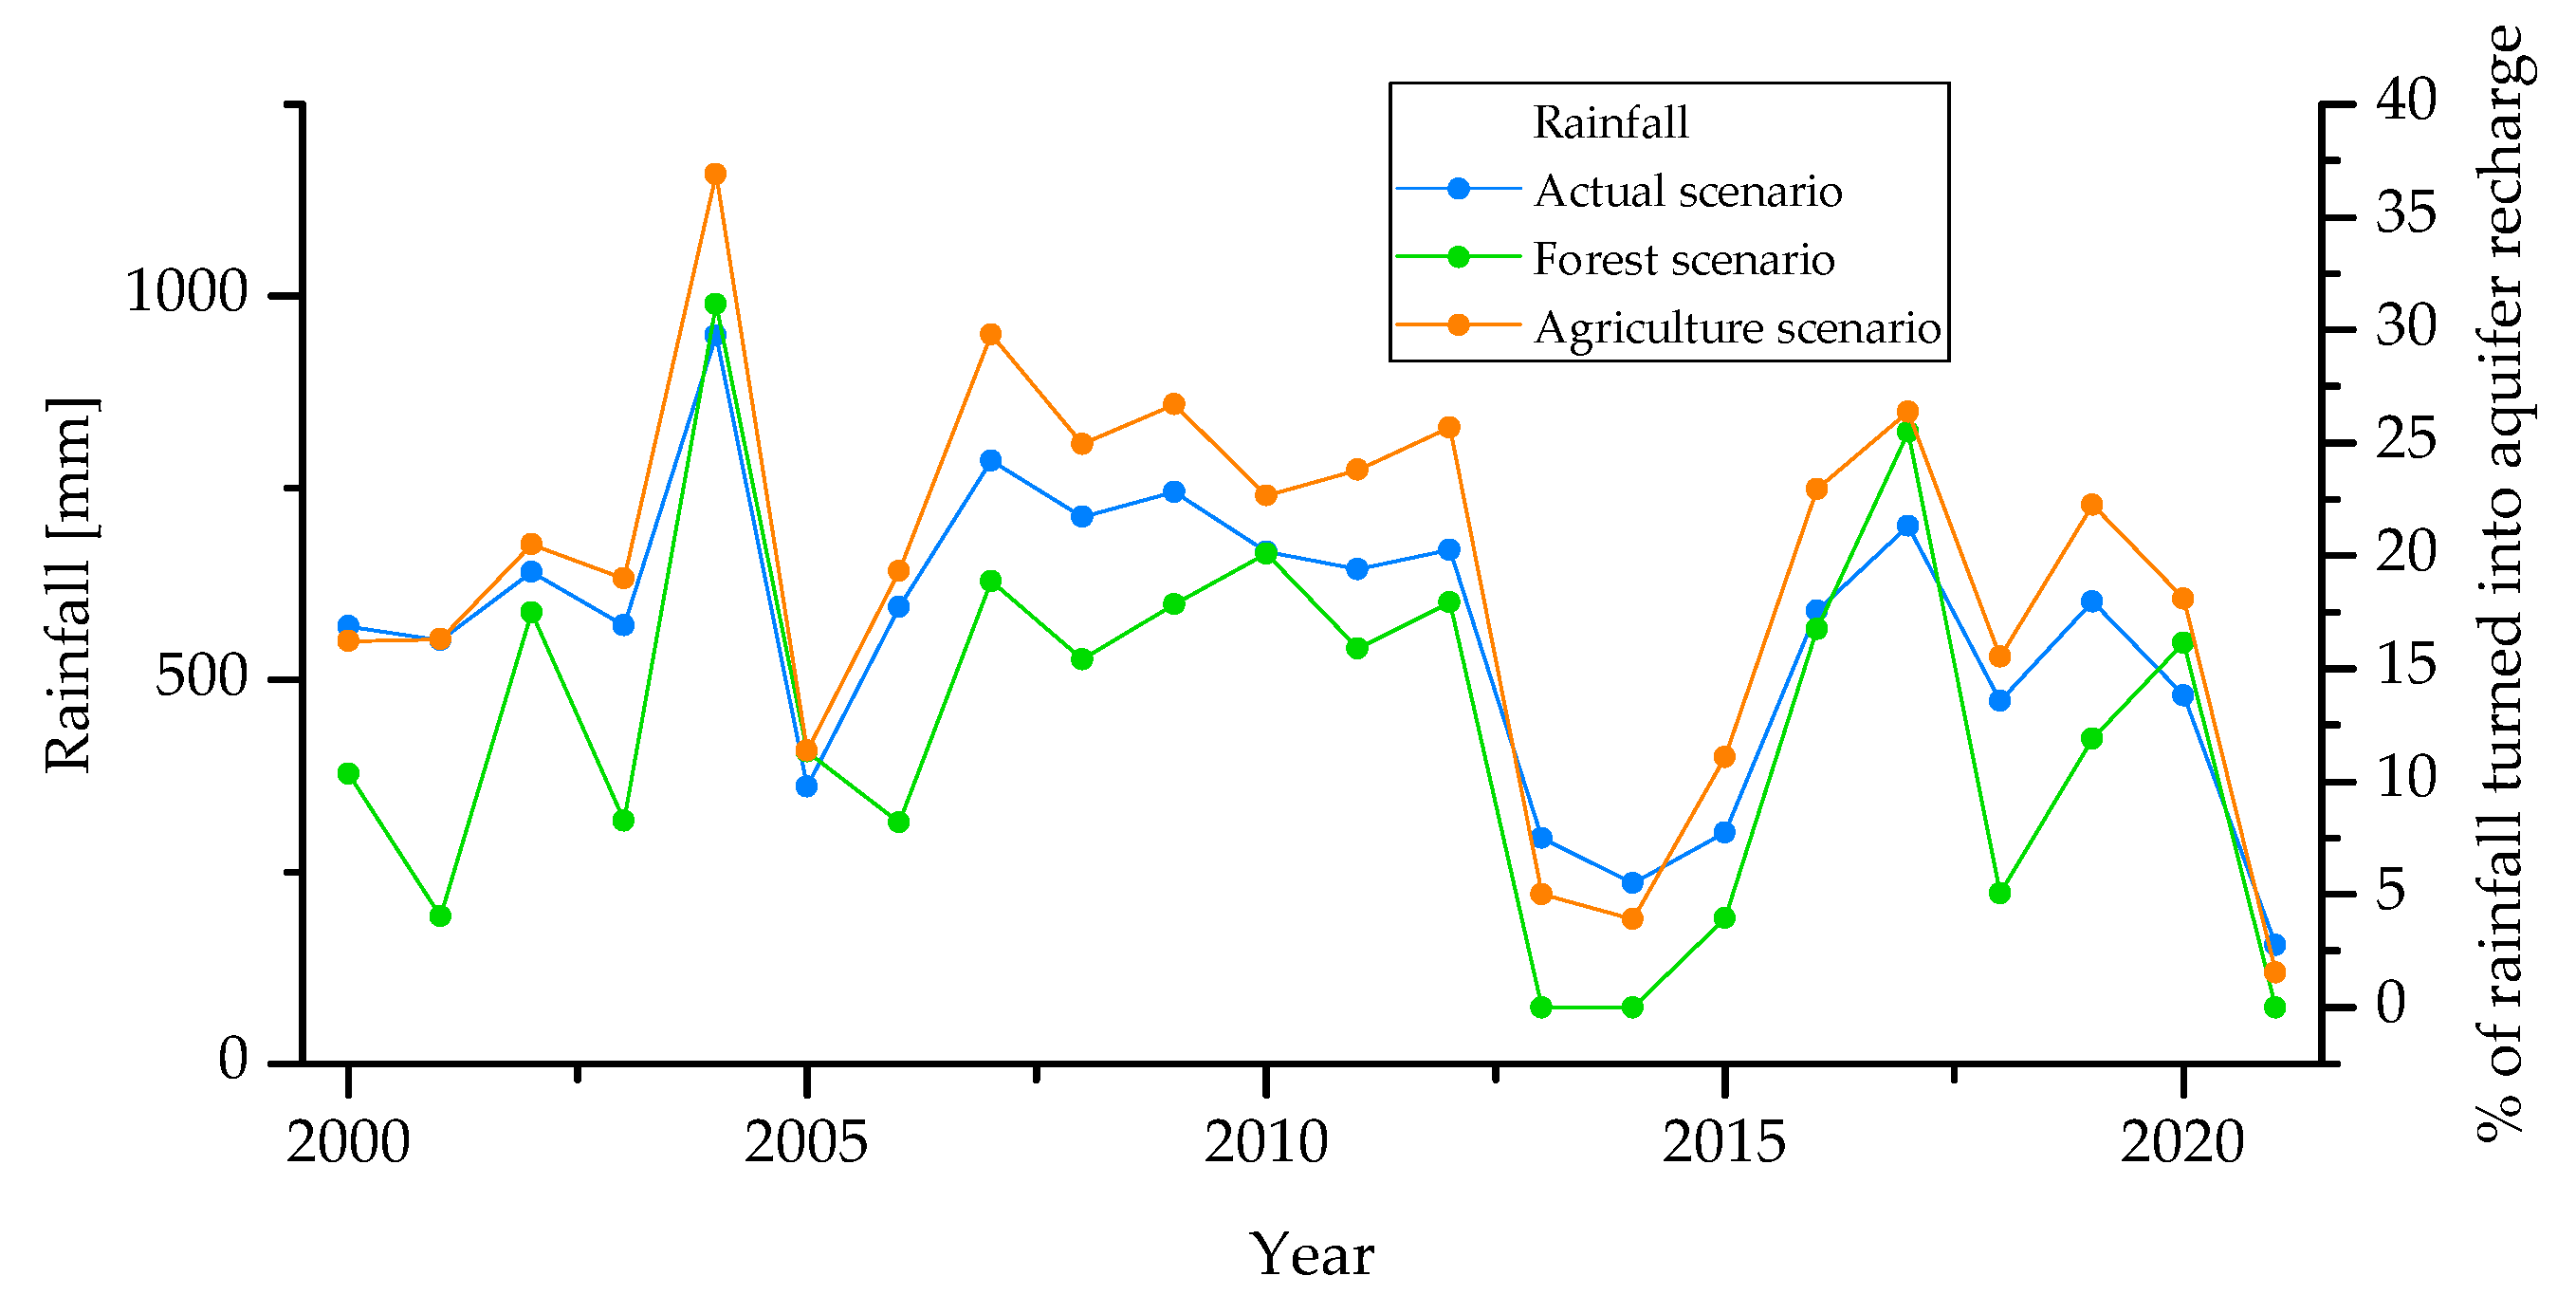
The discretization of results in annual intervals shows that this pattern is repeated for most of the years in the series (
Figure 5). The difference between the percentage of recharge produced in each scenario is not constant and varies according to the distribution of precipitation in the year.
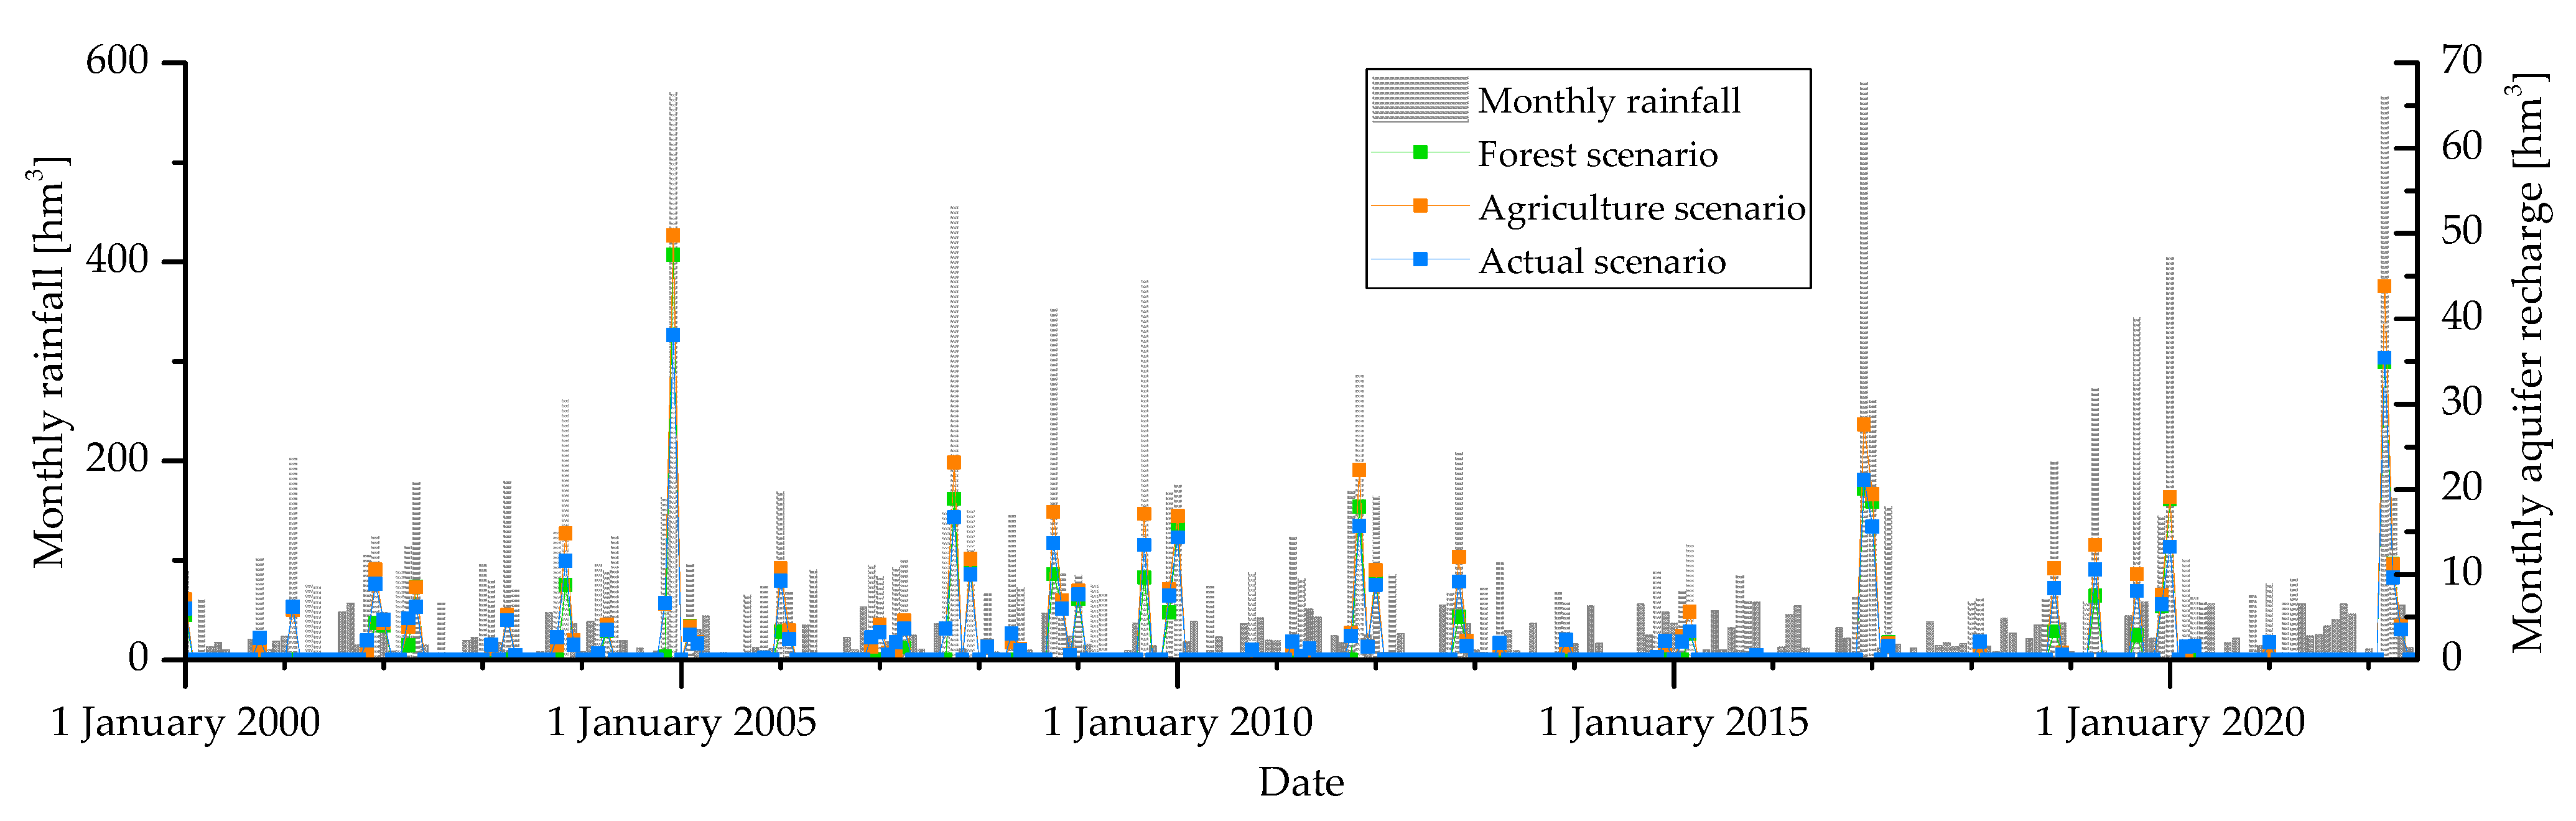
At a monthly scale (
Figure 6), it is in the agriculture scenario where the recharge is most abundant for almost every significant rainfall. By comparing annual and monthly discretization of the data, it is shown that the years in which the percentage of recharge is approximately the same for the three scenarios, correspond to the years with no registers of monthly precipitations greater than 50 mm (such as years 2005 and 2021). Also, for the months in which the recorded rainfall is greater than 200 mm, the recharge produced in a mostly forested scenario would exceed the actual recharge for the last two decades. This means that for major monthly rainfall, both land cover settings have similar recharge responses instead of the opposite behavior noticed at annual scale.
The temporal discretization at a daily scale does not show any evident recharge behavior pattern nor correlations. Considering the importance of the humidity present in the soil at the time of the rains and its determining role in the amount of recharge produced, it is necessary to carry out more complex studies that consider the evolution of soil humidity and analyze in depth the role of the roots and their impact on the soil reservoir.
3.3. Piezometric Heads Variations
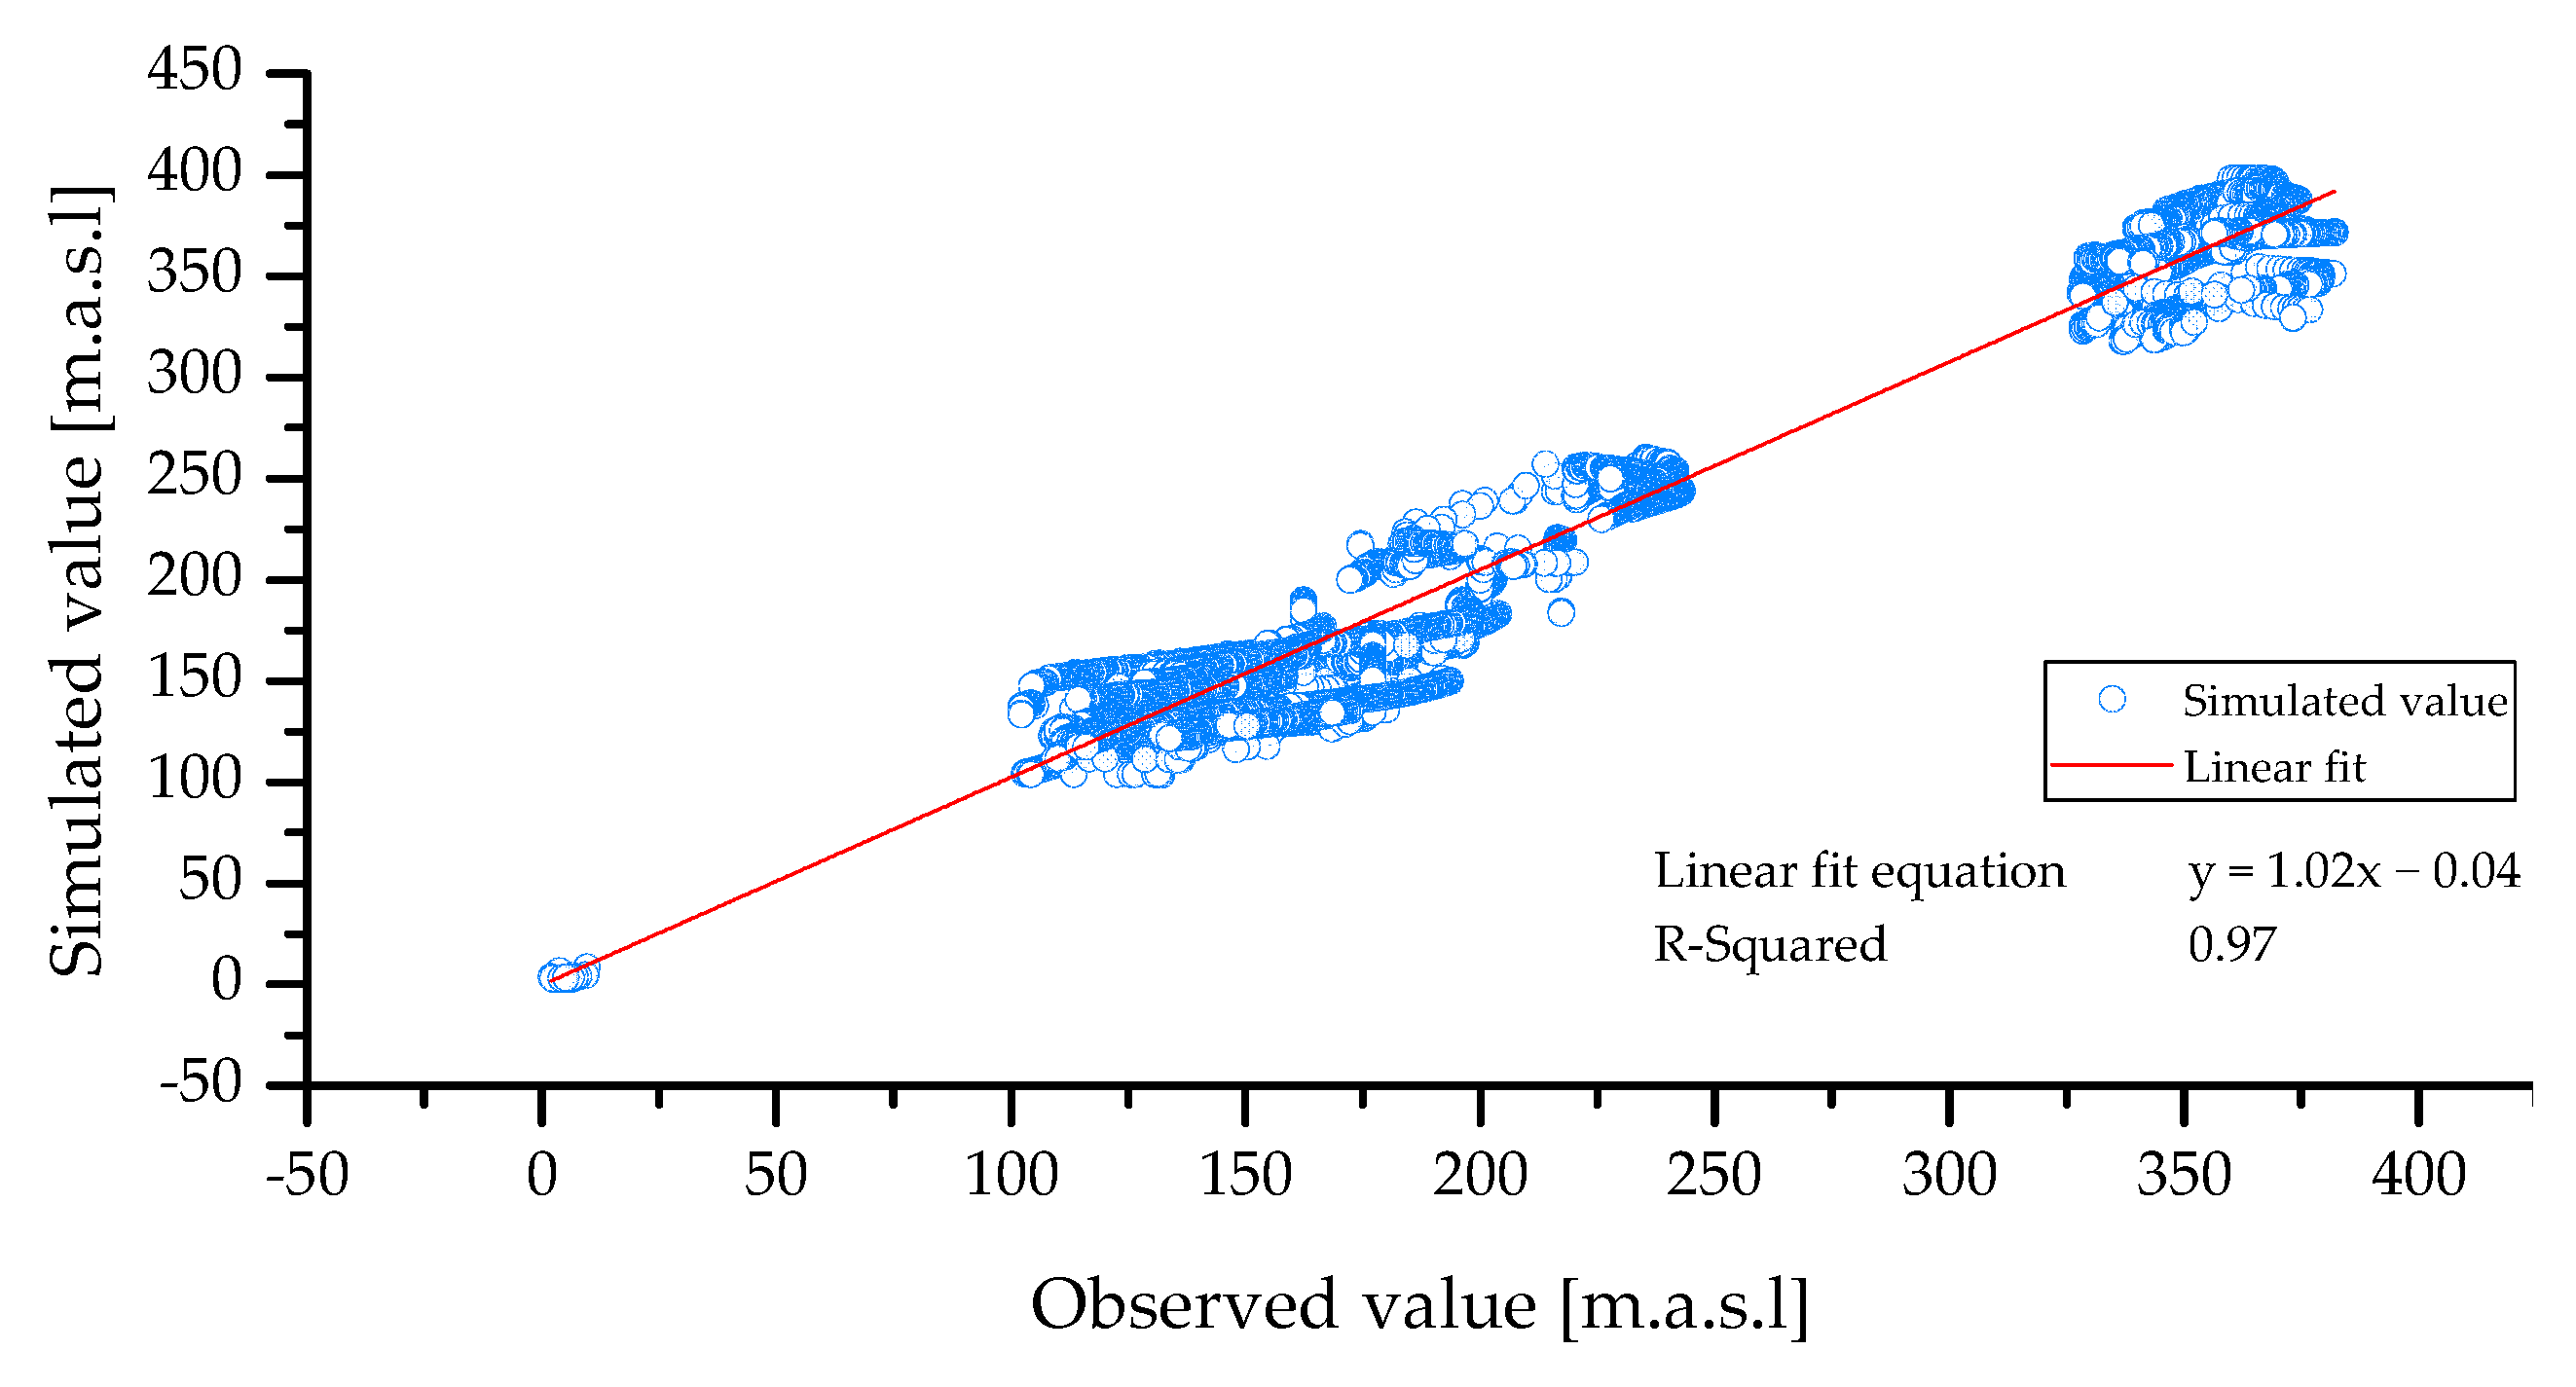
The model shows an acceptable degree of correlation between the observed and simulated heads. The scatter plot comparing both datasets shows a coefficient of determination (R
2) of 0.97, as shown in
Figure 7. The RMSE and NRMSE values are 18.4 m and 0.046, respectively, with a NSE of 0.96.
Given these calibration and validation parameters that show the similarity between the observed and simulated heads, we consider that the model accurately represents the real water table variations for the Almudaina-Segaria aquifer. The hydraulic conductivities vary between 0.01 and 30 m/day, and the storage coefficient between 0.003 and 0.008, depending on the geological context. Both parameters are consistent with the values estimated by previous studies [
42].
The piezometric heads have the highest heights in the mountainous sectors of the aquifer, mainly in the westernmost and central-southern sectors, decreasing toward east, where the discharge zone is located, as represented in
Figure 8. The formations with lower permeability identified in previous studies [
42] and the available geological maps cause steep increases in the hydraulic gradient. The main flow direction is then west-east toward its discharge area near the Marjal de Pego, a wetland system close to the Mediterranean coastline.
The elevation of the water table at the different sectors of the aquifer depends mainly on surface topography and the hydraulic properties at depth of the sector in particular. As there is no record of major alterations in the mechanisms of water input and output, the variations observed in the piezometric heads are related to the amount and intensity of rainfall. By using the same series of recorded precipitations for each one of the analyzed configurations, we conclude that the differences in the water table evolution between scenarios are exclusively due to the change in land use and land cover.
The elevation of the piezometric heads depends, in addition to precipitation and thus the water entering the system, on the hydraulic properties of the aquifer. It is necessary to consider that the amount of water that enters the system through recharge does not affect the variation of piezometric levels and water storage in a directly proportional way, but rather it is a multifactorial complex stochastic phenomenon. Therefore, the hydraulic heads variation, due to the lack of precise information on the properties of the aquifer in the subsoil, constitutes a simple yet useful indirect approximation to the state and evolution of the aquifer reserves.
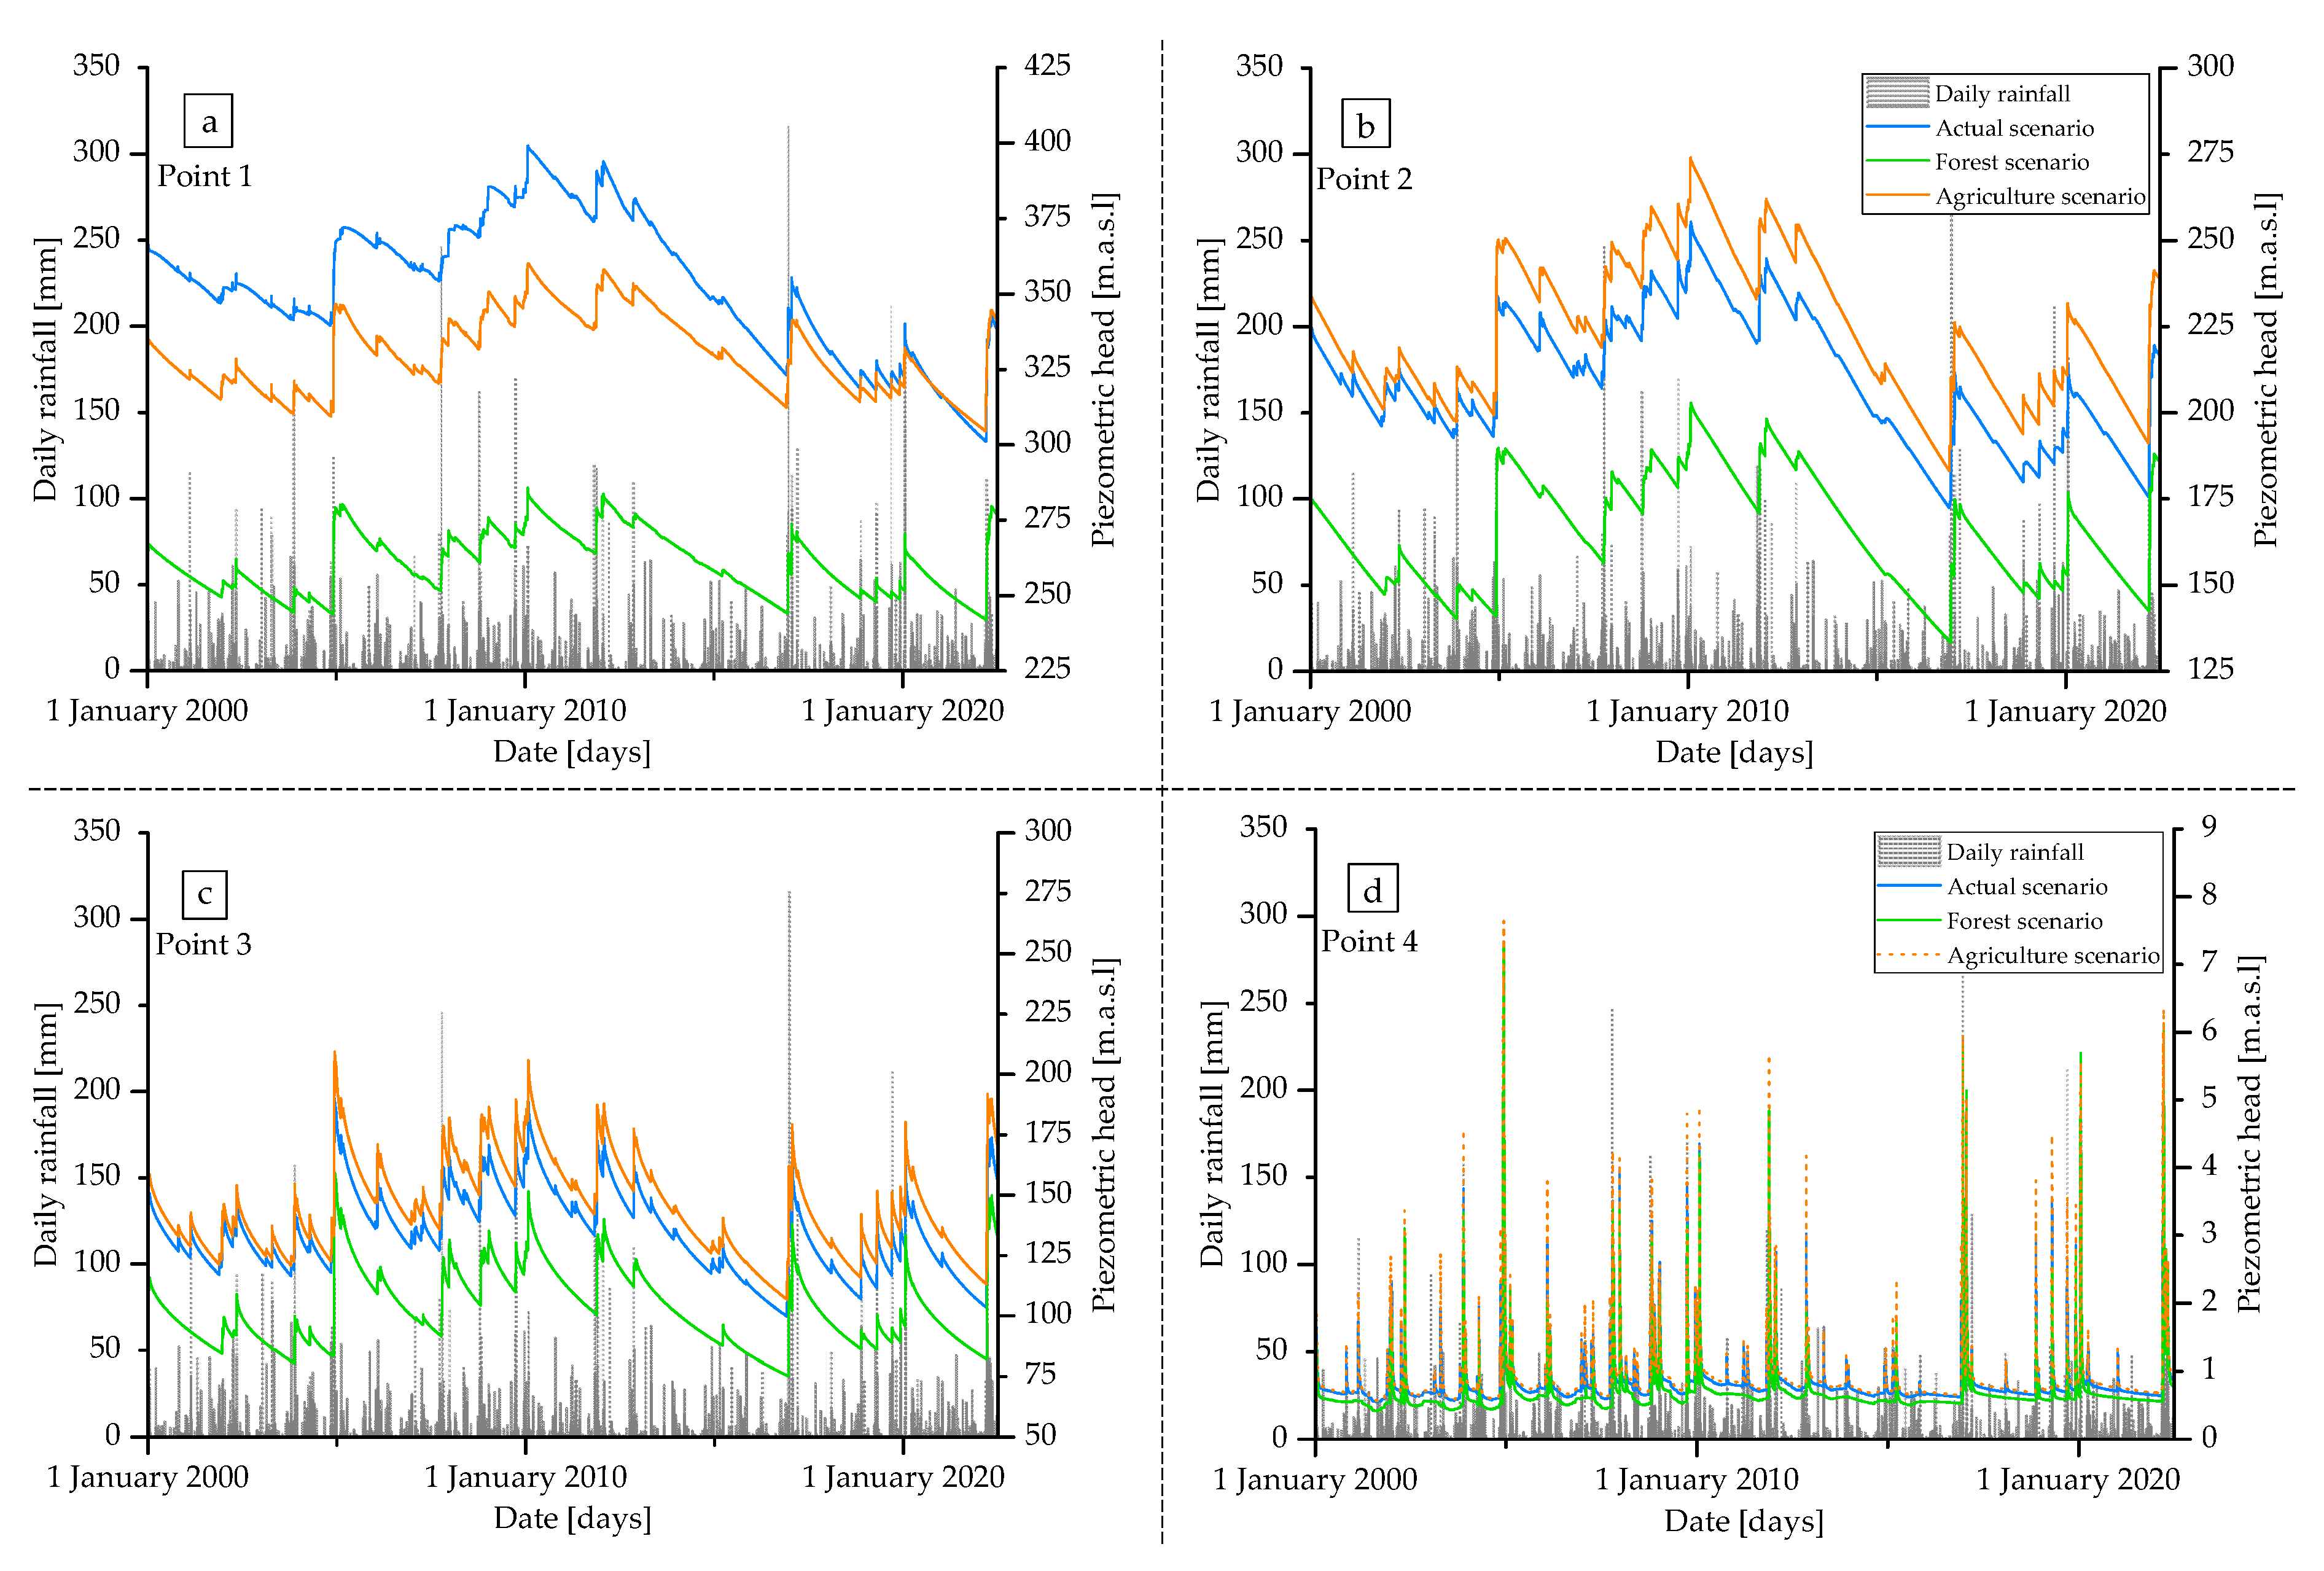
Four points (located in
Figure 8), selected from west to east in different sections of the aquifer, provide insight of the variation of piezometric heads under the three land cover scenarios (
Figure 9). As previously described, the water table level varies naturally following the hydraulic gradient in a general west-east direction (
Figure 8). In the scenario of a territory mostly occupied by fruit and olive crops, the distribution of recharge on the surface of the aquifer causes the hydraulic gradient to be attenuated, with a smoother slope, when compared with the real observed gradient.
Point 1 (
Figure 9a) is probably the best location to evaluate the effect of the change in land use on recharge, since its position in the highest areas of the water table implies that it will not be affected by the recharge that occurs in sectors located higher. At Point 1 then, located at the western end of the aquifer, it is observed that the highest levels occur with the actual variation in land cover through the last 20 years, and also that, toward the end of the studied period, the simulated heads for the agriculture scenario and the actual heads (plotted in orange and blue, respectively), are nearly the same. This might be explained because, according to the studied CLC maps, around the year 2012 the land cover in that specific area changed from sclerophyllous vegetation to forests, thus reducing the recharge and therefore the levels. The significant difference in the water table between the analyzed scenarios should be considered carefully because it may increase the risk of a shortage in water supply, since almost all water demands in the area are satisfied by groundwater exploitation.
Regardless of the amount and distribution of recharge, the simulated water table for a scenario in which forests are predominant remains below the others, for the entire aquifer. The differences between water tables fade toward east (
Figure 9d) since the aquifer presents greater multi-annual stability near the discharge zone.
4. Discussion
For the hypothetical scenario in which most of the territory is occupied by agricultural land (typically fruit and olive trees), the absolute volume of recharge would be higher than the actual volume recharged during the last 20 years. The differences in piezometric levels between scenarios depend on the sector of the aquifer where the comparison is made: at the eastern end there are slight differences in the order of a few meters, in the central sector there is notable change (50–100 m), and at the western end the differences are remarkable (over 100 m). This is an indicator of changes in gradients, circulation dynamics, and storage of water within the system, due to differences in the magnitude and distribution of recharge. In the portion of the aquifer located to the west of point 3 in
Figure 8, the terrain topography is mountainous, irregular, and has pronounced slopes that are reflected in the irregular surface of the water table. There are also important seasonal and pluri-annual variations, as seen in
Figure 9a–c. In contrast, in the sector to the east of Pego, the water table shows a gradual descent until it reaches the aquifer discharge zones in the vicinity of the Marjal de Pego, a protected wetland. The great multi-annual stability of the piezometric levels in this portion of the aquifer (
Figure 9d), associated with the proximity to the discharge zone, is what causes the water table to be similar for the three considered scenarios, that is, stable regardless of the overlying land cover.
The decrease in the population residing in the area follows the trend of rural depopulation observed in Spain and other Mediterranean countries [
43], while the downward trend in the cultivated area in the Almudaina-Segaria aquifer is consistent with the general trend observed throughout the province of Alicante during the 20th century: rainfed crops went from 71% of the cultivated area in 1960 to 45% in 2000, with a key turning point in the time span between the years 1990 and 2000, when there was a reduction of over 45% of the area occupied by rainfed crops at the provincial level [
44]. There are also studies that document the correlation between depopulation and the influence of abandonment of cultivated areas on vegetation dynamics [
45,
46].
There is a transition from homogeneous extensive areas of sclerophyllous vegetation, observed in the year 2000 (
Figure 2a), to a heterogeneous configuration composed of grasslands and forests, observed in 2006 (
Figure 2b). This could be explained by the fact that these are, for the most part, areas of old olive and fruit crops (
Figure 3a), abandoned due to the aforementioned decrease in agricultural activity in the area. This abandonment of crops (and therefore the human intervention responsible for maintaining them) possibly led to the development of an intermediate stage of sclerophyllous vegetation followed by grasslands in areas that, due to the territory configuration (slope, water availability, etc.), were not likely to naturally develop tree vegetation. On the other hand, in the sectors suitable for the development of forests, the crops abandoned during the last decades could naturally evolve to more leafy vegetation, typically Aleppo pine and oak holm.
For a scenario in which the land surface is mostly covered by forests (represented in
Figure 3b and likely to occur in the future considering the abandonment of agriculture and ongoing trend of migration from rural areas; as seen in
Figure 4), there would possibly be a marked decrease in the piezometric levels, since the hydrographs of the modeled points (
Figure 9) show the water table of the forest scenario significantly below the other land use configurations for most of the aquifer. A decrease in the height of the piezometric surface directly implies a reduction in the volume of aquifer reserves. This is a priori consistent with previous studies that show similar or equivalent responses, for instance: in Australia, land use and land cover changes related to deforestation have increased recharge by up to about two orders of magnitude [
47]. Multiple studies show that when the deep-rooted natural vegetation replaced with shallower-rooted agricultural crops, there is an increase in the recharge rate [
8,
48,
49]. Consequently, it shows the role of forests as the cause of a potential reduction of recharge rates in arid and semi-arid climates. Areas covered with deep-rooted vegetation such as forests have then lower groundwater recharge rates than areas of shallow-rooted vegetation, such as crops [
50].
Regarding the time discretization, in Australia the rainfall recharge to groundwater was modelled my means of an unsaturated zone model and then compared to climate data, soil and vegetation to estimate rainfall recharge. It was observed that modelled recharge had a stronger correlation with parameters based on a rainfall intensity threshold rather than total annual rainfall [
51]. Due to antecedent moisture conditions, the time scale used must be carefully selected depending on the aim of the study. In this case, we compared annual and monthly discretization to study the water table and reserves response in the long term and at an aquifer-scale, but daily or hourly discretization could be used to study the aquifer regarding possible changes in rainfall intensity, rather than quantity.
For most of the studied aquifer, a scenario with extensive agricultural activities (
Figure 3a) would imply a rise of the piezometric heads (as shown by the hydrographs of the modeled points in
Figure 9) and the consequent increase in the reserves of the aquifer, when compared to a more heterogeneous distribution of land covers (as it was the real land cover setting through the last two decades, represented in
Figure 2). Managed land cover such as crops are less efficient than natural vegetation in extracting soil moisture [
49], and therefore, the conversion of natural vegetation to the agricultural surface results in increased groundwater recharge. It is then generally considered that the replacement of native vegetation with managed land use types leads to increased groundwater recharge. However, the replacement of large areas of natural vegetation entails unwanted effects on other equally important components of the system, such as biodiversity, and could even affect local climatic dynamics, with likely unpredictable consequences.
The overall differences observed in the recharge produced for each one of the proposed scenarios are consistent with previous research where recharge is related to land use and land cover as follows: no recharge in natural rangeland ecosystems (grassland), and moderate recharge in non-irrigated (dryland) agricultural ecosystems when compared to irrigated crops [
52], and forests as an element of potential reduction of recharge [
50]. It is therefore coherent to find the lowest recharge rates in a scenario dominated by forests and the highest in a scenario dominated by agricultural activities, while the actual scenario studied between 2000–2022 (with greater heterogeneity of land cover types, including forests, crops, and grassland) shows intermediate recharge rates and water table levels, between the scenarios considered.
These results highlight that the influence of the territory use and cover on the volumes of water that enter the aquifer system must be considered for a proper management of groundwater resources, which are of key importance in arid and semi-arid climates where numerous activities depend on this resource.
5. Conclusions
We have studied the hydrological behavior of a karstic aquifer located in a Mediterranean semi-arid climate, which has undergone significant changes in its land cover through the last two decades. The analysis was extended to two hypothetical scenarios: a past land use configuration with over 50% of the aquifer surface dedicated to agricultural activities and, on the other hand, a probable scenario in which the observed downward demographic trend (that leads to the progressive abandonment of agriculture in the area), is prolonged through time and natural vegetation in the form of forests becomes predominant.
The aquifer recharge and groundwater flow were at first calibrated-validated using a 20-year dataset of field observations (piezometric heads) to obtain a representation of the aquifer behavior under the land cover changes that occurred during this period, as shown in the CORINE Land Cover maps. Afterwards, the same climatic record was used for the two hypothetical scenarios in order to evaluate the impact of land cover changes.
Aquifer recharge is largely affected by changes in land use and the associated land cover. Recharge will be most hindered in the scenario with a predominance of natural forest, mostly due to the increase in the transpiration demands and alteration of soil structure and capacity because of root growth. With the same rainfall series, the calculated total recharge accounts for a reduction of almost 32% compared to the scenario set in 1983, where land use is dominated by agriculture. The results are consistent with the existing literature on the subject, showing an increase in recharge when the existing heterogeneous cover is replaced by large tracts of managed land covers such as crops, and a decrease in recharge when it is replaced by deep-rooted vegetation such as forests. However, the differences in the rates of increase or decrease in recharge, or even the possibility of different responses, show the need to assess recharge through studies that consider the particular parameters and contexts of each area and aquifer.
The water table elevation comparison led us to conclude that the availability of water does not show absolute differences when comparing agriculture and the actual historic scenario, and they will be mostly affected by the specific location under analysis. However, for most of the aquifer, the water table under a predominant agricultural land use with fruit and olive crops is located higher than the water table under a more heterogeneous land cover configuration, such as that observed between 2000–2022. By contrast, a scenario with a complete development of natural vegetation shows a significantly lower water table altitude. This scenario should be considered by water resources local managers, since the abandonment of crop lands and possible unmanaged forest growth may pose a risk for the aquifer storage and future water supply. The magnitude of the differences in water tables is strongly conditioned by the geological setting, for instance being almost negligible in the eastern part of the aquifer where the discharge zone is located.
This means that both agricultural practice and reforestation, natural or artificial, must be managed in such a way that the negative effects on all the components of the system (biosphere, hydrosphere, lithosphere, atmosphere, and even the socioeconomic component) are minimal. A sustainable environmental management approach is one that takes all these factors into account.

 ,
, 


