Article

Uncontrolled Exploitation of Pterocarpus tinctorius Welw. and Associated Landscape Dynamics in the Kasenga Territory: Case of the Rural Area of Kasomeno (DR Congo)

by
Médard Mpanda Mukenza
1,
Héritier Khoji Muteya
2,3,*,
Dieu-Donné N’Tambwe Nghonda
2,3,
Kouagou Raoul Sambiéni
4,
François Malaisse
3,
Sylvestre Cabala Kaleba
2,
Jan Bogaert
3 and
Yannick Useni Sikuzani
2,5
1
Département de Gestion des Ressources Naturelles Renouvelables, Faculté des Sciences Agronomiques, Université Technologique Katumba Mwanke, Lubumbashi BP 74, Democratic Republic of the Congo
2
Unité Ecologie, Restauration Ecologique et Paysage, Faculté des Sciences Agronomiques, Université de Lubumbashi, Lubumbashi BP 1825, Democratic Republic of the Congo
3
Unité Biodiversité et Paysage, Gembloux Agro-Bio Tech, Université de Liège, 5030 Gembloux, Belgium
4
Ecole Régionale Post-Universitaire d’Aménagement et de Gestion Intégrés des Forêts et Territoires Tropicaux (ERAIFT), Université de Kinshasa (UNIKIN), Kinshasa BP 15373, Democratic Republic of the Congo
5
Centre de Compétences en Planification et Gestion Urbaine, Université de Lubumbashi, Lubumbashi BP 1825, Democratic Republic of the Congo
*
Author to whom correspondence should be addressed.
Land 2022, 11(9), 1541; https://doi.org/10.3390/land11091541
Submission received: 2 August 2022 / Revised: 26 August 2022 / Accepted: 5 September 2022 / Published: 12 September 2022
(This article belongs to the Special Issue Landscapes and Sustainable Farming)

Abstract

:
The uncontrolled logging of Pterocarpus tinctorius Welw. in the Kasenga territory in the southeast of the Democratic Republic of the Congo is of significant socioeconomic benefit, but above all, it is a threat to the stability of forest ecosystems. Based on Landsat images from 2009, 2013, 2017 and 2021, the landscape dynamics of the Kasomeno region in the Kasenga territory, a P. tinctorius exploitation area, was quantified using a mapping approach coupled with landscape ecology analysis tools. The results reveal a continuous loss of forest cover over all the periods studied, mostly between 2013 and 2017, primarily through the dissection of patches. Also, through the spatial process of attrition, the fields recorded a regressive dynamic between 2013–2017, a sign of abandonment of agricultural activity in favour of P. tinctorius illegal logging. These landscape dynamics are the consequences of strong anthropic activities in the study area, leading to an important spatial expansion of the savannah. Consequently, the level of landscape disturbance doubled from 0.8 to 1.7 between 2009 and 2021. Our results suggest that, without regulatory enforcement, illegal logging of P. tinctorius seriously compromises forest ecosystem health and household food security in the region.

1. Introduction

Deforestation is the conversion of a forest into another form of spatial cover or the long-term reduction of forest cover below a threshold of ten percent [1]. Many of the nations with the highest rate of deforestation have significant proportions of their forest losses come from tropical dry forests, which have few areas of protected legal status [2]. Indeed, tropical forests are among the richest ecosystems on the planet [3,4]. However, they are experiencing a decrease in their surface area and fragmentation, which would be responsible for the disappearance of 7% of the non-harvested species associated with these habitats [5].
Among these forest ecosystems, Miombo woodlands are the largest seasonal tropical and dry forest formation in Africa, covering around 2.4 million km2 [6]. This type of vegetation, dominant in southern Africa, is characterised by the predominance of species belonging to Brachystegia, Julbernardia and Isoberlinia genera, of the Caesalpionioideae sub-family [7,8,9,10]. These forests are undergoing a fairly strong anthropic pressure [11]. In DR Congo, they cover nearly 23% of the total forest area and remain the most dominant type (>50%) in the former Katanga province [12,13] where the expansion of subsistence activities (agriculture, fuelwood harvesting and charcoal production), coupled with the accelerated demographic trends and urbanisation [13], is one of the main causes of its regression [13,14,15].
In this region, because of the degradation and loss of forests, various negative effects of the deportation of forest ecosystems can be observed. For example, many non-wood resources, including harvested products such as honey, mushrooms and caterpillars are gradually disappearing due to the selective cutting of host plants [16]. This deterioration also leads to a significant reduction in game fauna and a progressive lack of animal proteins generally obtained from hunting (game products) and gathering by the village population [8]. Another consequence is the albedo, which results in the reduction of the number of rainy days [17].
Several studies have shown the impact of anthropogenic pressures (threats) on these forests, including (peri-)urbanization, agricultural development, charcoal production, collection of non-timber forest products, etc. [14,18,19]. These anthropogenic activities lead to the reduction of miombo woodland cover and the rarefaction of its patches around villages [20,21,22,23,24].
This is particularly the case in the Upper Katanga Province, where the average yield of maize on family farms fluctuates around 800 kg per hectare, while the daily income is estimated at less than $1 per day [25]. Thus, the exploitation of Pterocarpus tinctorius, a species of tropical trees in the Fabaceae family, known as padauk [26], has been shown to make a significant socioeconomic contribution, given that the owners of private forest concessions use local farming households as labour to cut wood for sale [27]. Indeed, in a fragile economic context, local people care little about the sustainability of forest resources and are only concerned with short-term survival objectives [28]. For years, P. tinctorius has been exploited in Zambia to supply Chinese furniture manufacturing markets [27]. The production of P. tinctorius in Zambia was estimated around 110,000 cubic meters per annum [29]. Due to the damage caused by its exploitation on forest ecosystems, Zambia made combatting illegal logging of P. tinctorius one of its priorities in 2013 [29]. This has led to a rush of illegal logging of P. tinctorius in the Upper Katanga province in southern DR Congo, committed by Chinese individuals from Zambia where the legislation has restricted them [27]. Locally, this species is used in traditional pharmacopoeia and as a dye [30], which made it one of the species prized by the Asian market for the manufacture of luxury furniture [31].
The Kasenga territory in the Upper Katanga province is no exception to the illegal exploitation of P. tinctorius and, in fact, is regarded as the epicentre of this illegal exploitation. A large part of its population has abandoned agricultural activities in favour of P. tinctorius exploitation. This exploitation results in deforestation, followed by fragmentation of the forest landscape [18]. Moreover, this deforestation is amplified by the presence of paved roads that facilitate the transport of logs to Lubumbashi city [32], as is the case in the Kasomeno region.
In the current context of power dualism in DR Congo, the quantification of landscape dynamics in rural areas seems very opportune. In the Kasomeno region, issues of land use/cover allocation and disallocation with significant consequences on the landscape are the responsibility of traditional authorities [33]. The interaction between legal structures and indigenous legal systems is common to most post-colonial states in Africa, including in the DR Congo. The two systems have merged into a legal framework that is itself a source of conflict. In rural areas, access to land is governed by traditional authorities, each of whom is responsible for a terroir within the village boundary. Access rights differ according to whether or not one belongs to the lineage. For members of the lineage, access to the land is free of charge and allocation is made by the lineage chief. In the case of a non-native resident or someone not in the village, access to the land is regulated by the payment of a fee in cash or in kind to the customary chief. In this context, a thorough understanding of the latter phenomenon requires the contribution of landscape ecologists who study land use dynamics [34].
The present study assesses landscape dynamics within the Kasenga territory in response to the illegal exploitation of P. tinctorius. It is based on the hypothesis that the enthusiasm of local populations for the uncontrolled cutting of P. tinctorius has led to landscape dynamics in the form of the retreat and isolation of forest areas and the abandonment of certain agricultural areas.

2. Materials and Methods

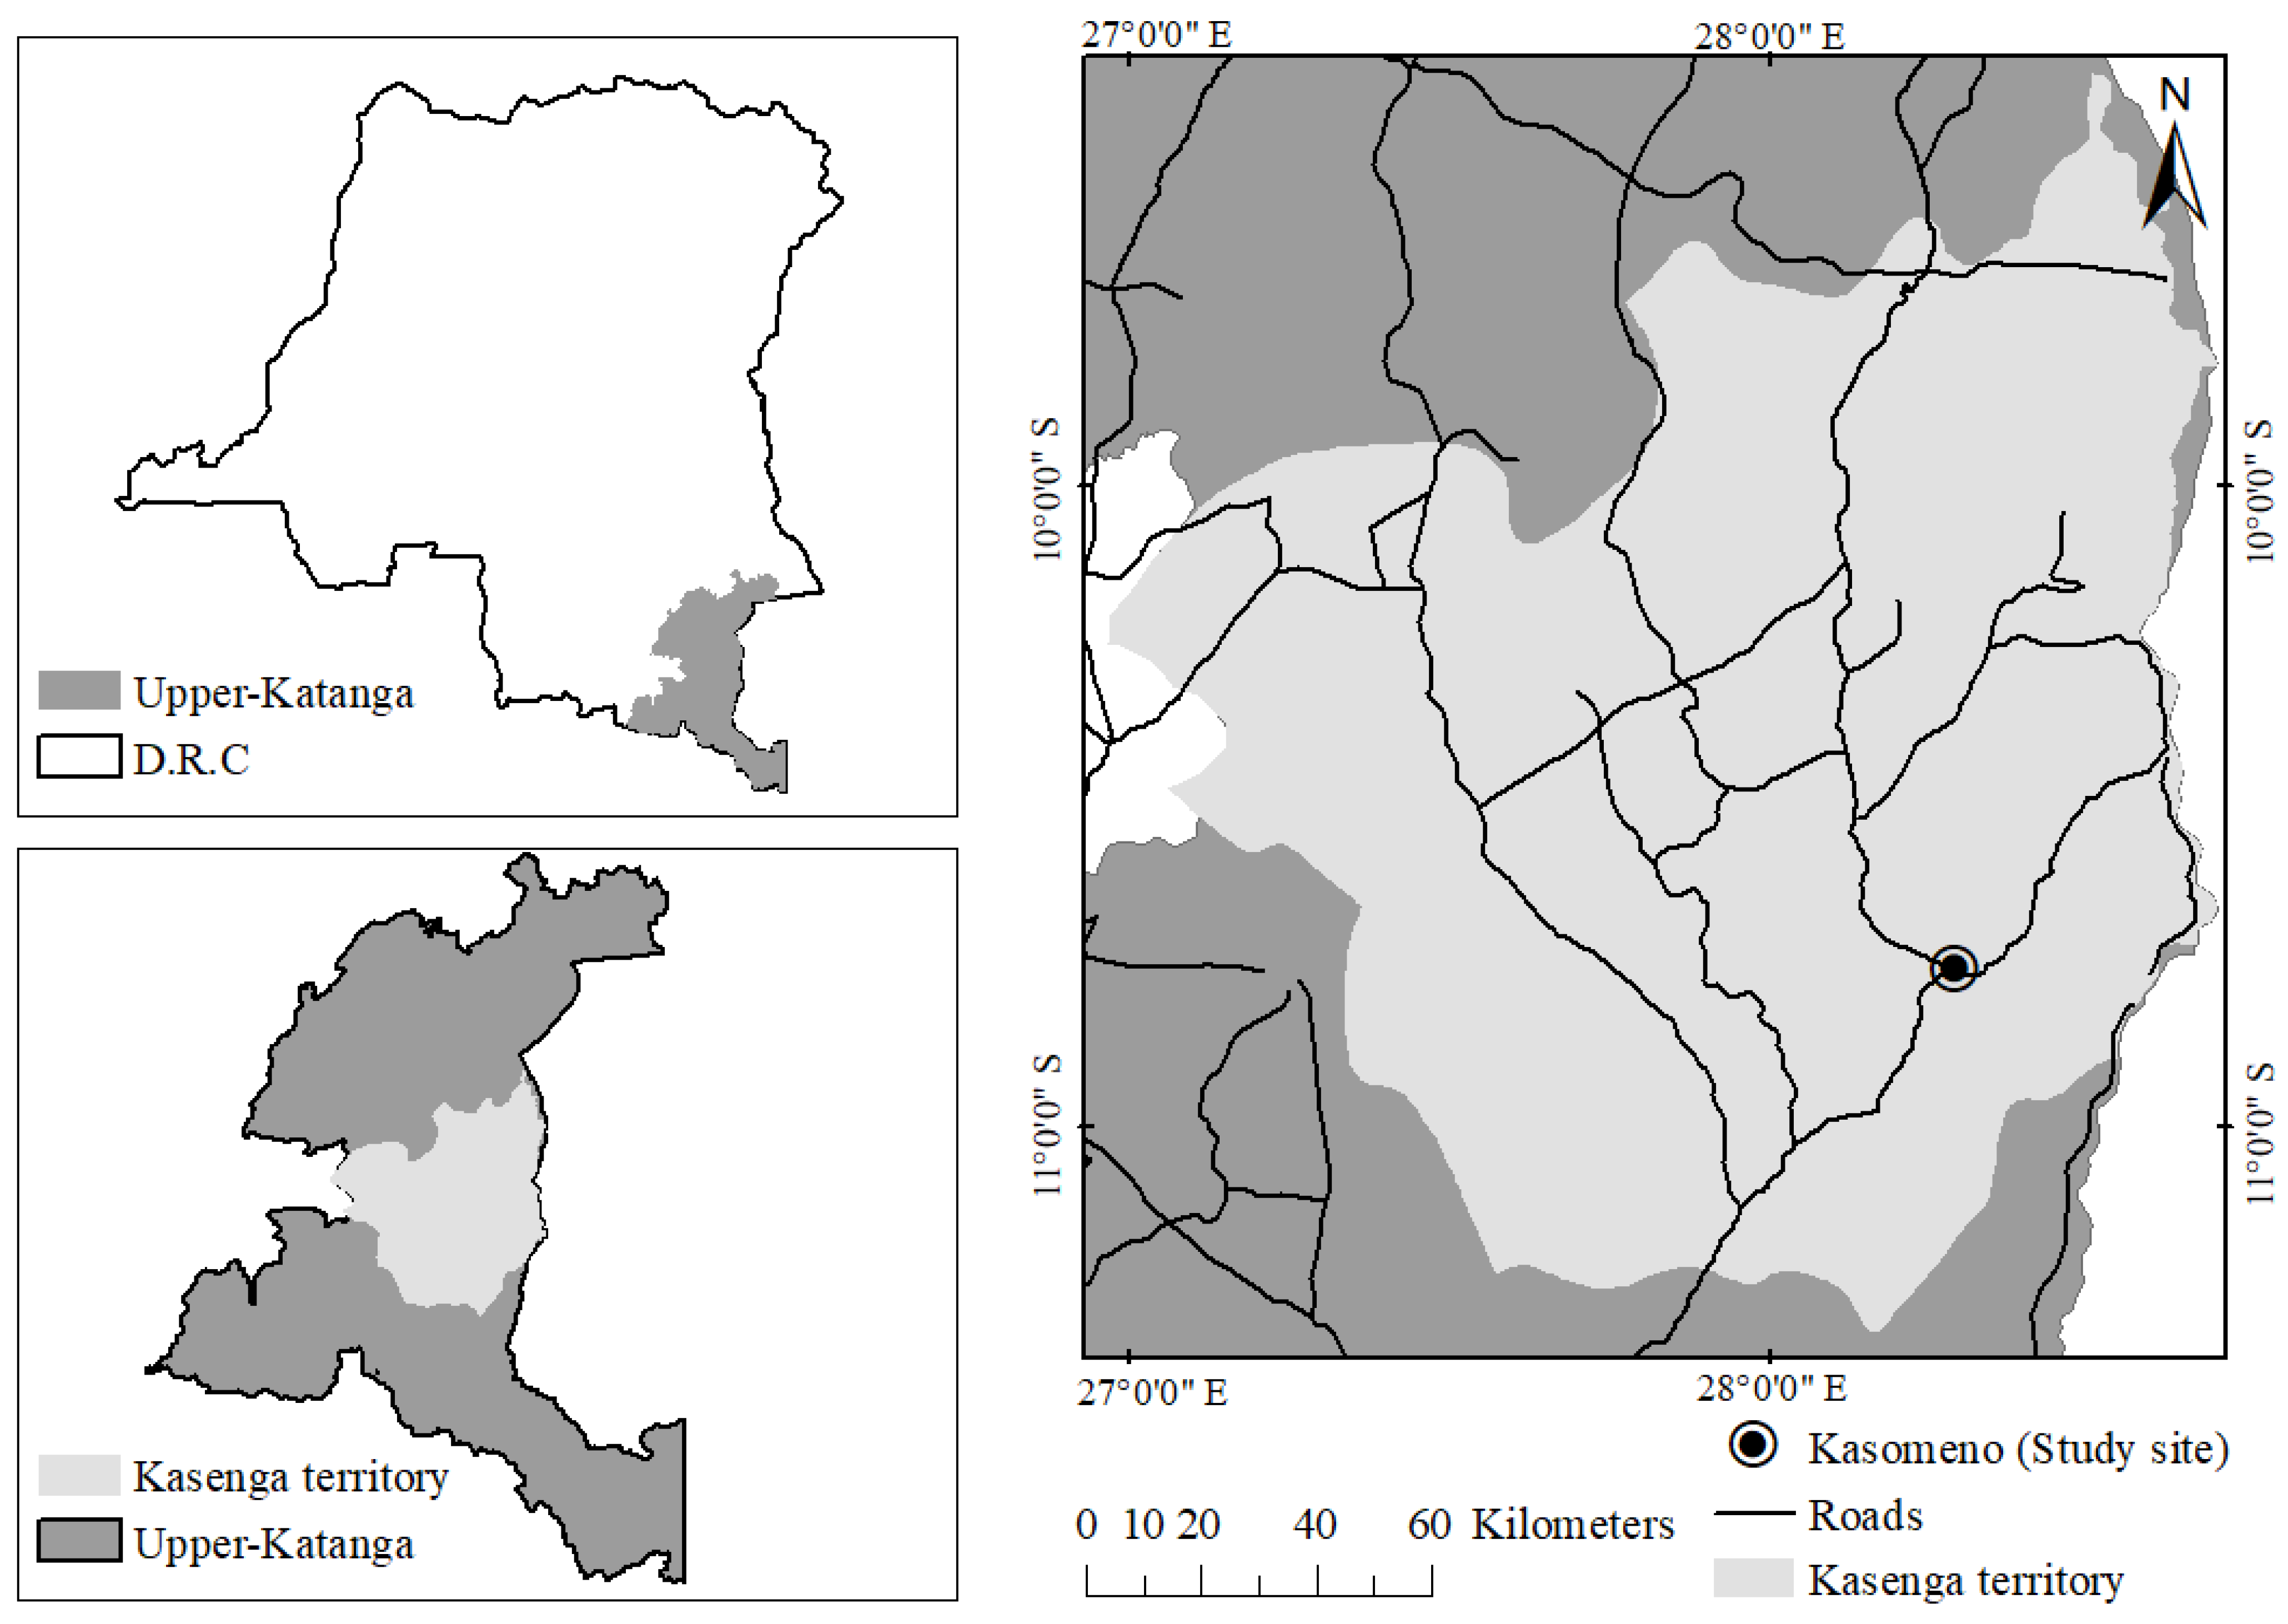
2.1. Study Area: Kasomeno Area in Kasenga Territory

The Kasomeno area and its periphery is located in the Kasenga territory (9°21′–11°22′ S and 26°9′–28°41′ E), in the southeast of the Haut-Katanga province in D.R. Congo (Figure 1) at an average altitude of about 970 m. In this region, the climate is dry tropical and type Aw5 according to the Köppen classification system [35,36]. It is characterised by an alternating dry season (May to September) and rainy season (November to March), separated by two transition months (April and October). Average annual temperatures vary between 16 °C and 33 °C, while a total rainfall of around 1260 mm [37] falls on soils whose main types are Ferralsols [38]. The miombo woodland was the dominant vegetation in the area. It is currently in a fragmented state due to significant anthropogenic activities [18]. Until 2013, the fields and charcoal production were the main activities of the local population. The local population is currently estimated to be around 100,000 people. Between 2013 and 2017, commercial exploitation of P. tinctorius intensified in several villages in the Kasenga territory, starting from the town of Kasomeno, which is considered the epicentre of the activity, and therefore, the area chosen for our study.

2.2. Landsat Image Choice and Preprocessing

The study area of 986 km² was extracted from four Landsat type images (30 m spatial resolution) taken in the dry season over the period 2009–2021 with a time step of 4 years and from the Thematic Mapper (of 11 July 2009) and Operational Land Imager (of 6 July 2013, 17 July 2017 and 26 June 2021). These images were chosen mainly on the basis of their availability, seasonality and the objective of the study [39,40]. Furthermore, their use allowed for the cover of three important periods: (i) before the illegal exploitation of P. tinctorius in the study area (2009–2013), (ii) the period of full illegal exploitation of P. tinctorius (2013–2017) and (iii) the period of the prohibition of the illegal cutting of P. tinctorius (after 2017). The (pre-) processing of Landsat images was carried out in ENVI 5.3 and ArcGIS 10.2.2.
The radiometric correction of the images involved the subtraction of the darkness due to the state of the atmosphere at the time of shooting. The images were then georeferenced using the WGS-84 reference ellipsoid in the UTM Zone 35S datum. Finally, the mosaicking was carried out using only two Landsat image scenes from 2009 in order to cover the entire study area.

2.3. Landsat Image Classification

Based on the false color composite, produced from the mid-infrared, near-infrared and red spectral bands for best vegetation discrimination [41], an unsupervised classification of Landsat images was performed. This allowed for the clustering of land use classes in the landscape [20].
Subsequently, a supervised classification of Landsat images based on the maximum likelihood algorithm was performed after defining localised training areas using a Garmin 64 s GPS (3 m accuracy). For effective representation of the land cover types, the training areas were visited in June-July 2021, in the middle of the dry season, with at least 35 polygons per land cover. Four land covers were retained following supervised classification, namely “forests” (miombo woodland, including patches of dry dense forest and gallery forest); “savannahs” (grassy and shrubby formation, characterised by a low density of trees: the grassy formation is more often replaced by bare land in the dry season, after the passage of bushfire); “fields” (agricultural land after harvesting or occupied by annual and off-season crops); and “other land uses” (the built-bare ground complex, water bodies and the unclassified). It should be noted that the “forest” land cover is considered natural in the studied landscape. Furthermore, the validation of the classifications was based on the visit of 210 GPS points, independent of those used for the supervised classification. These points were used to construct the confusion matrix for each Landsat image after classification. The calculation of two indices, namely the overall accuracy and the Kappa index (κ), made it possible to test the reliability of the classification carried out [42,43]. Thus, an adopted classification is only considered admissible and its results judiciously usable when the Kappa index evaluated in the classification operations is greater than 61% [42,44].

2.4. Landscape Dynamics Assessment

To establish the relationships between landscape configuration and associated ecological processes in quantifiable terms, landscape metrics were calculated [45]. At the level of land cover, the class area (CA) and average area (am) of patches per land cover type; the total number of patches per land cover (PN) and their total perimeter (p); and the fractal dimension of the land cover (Df) were calculated. The higher the human pressure on the landscape, the lower the values of the fractal dimension. Df is obtained from the slope of the regression line of the Neperian Logarithms of the perimeters according to the areas of the patches in the classes [46,47]. Finally, the largest Patch Index (LPI), defined as the ratio of the largest patch in the land cover class to the total area of the same class [48], was calculated. Subsequently, at the landscape scale, the disturbance index, (U) defined by the ratio of the cumulative area of the anthropogenic classes in the landscape to the cumulative area of the natural class [46], was calculated.
In addition, three transition matrices (2009–2013, 2013–2017 and 2017–2021) were used to quantify the frequencies of area conversion/transfer between land cover during the periods studied [49]. For a more in-depth reading of these transition matrices, the stability index at the level of each land cover was calculated [47].
Finally, the identification of the spatial transformation processes of the natural and anthropic land cover (relevant according to the study objective) in the landscape was based on the decision tree algorithm [45]. This decision tree algorithm is focused on the evolutionary trend in patch number, class area and patch perimeter between two dates [45]. The value of t = 0.5 was used to dissociate the process of fragmentation from that of dissection, with values greater than 0.5 suggesting dissection, while those less than or equal to 0.5 indicated the prevalence of fragmentation [41].

3. Results

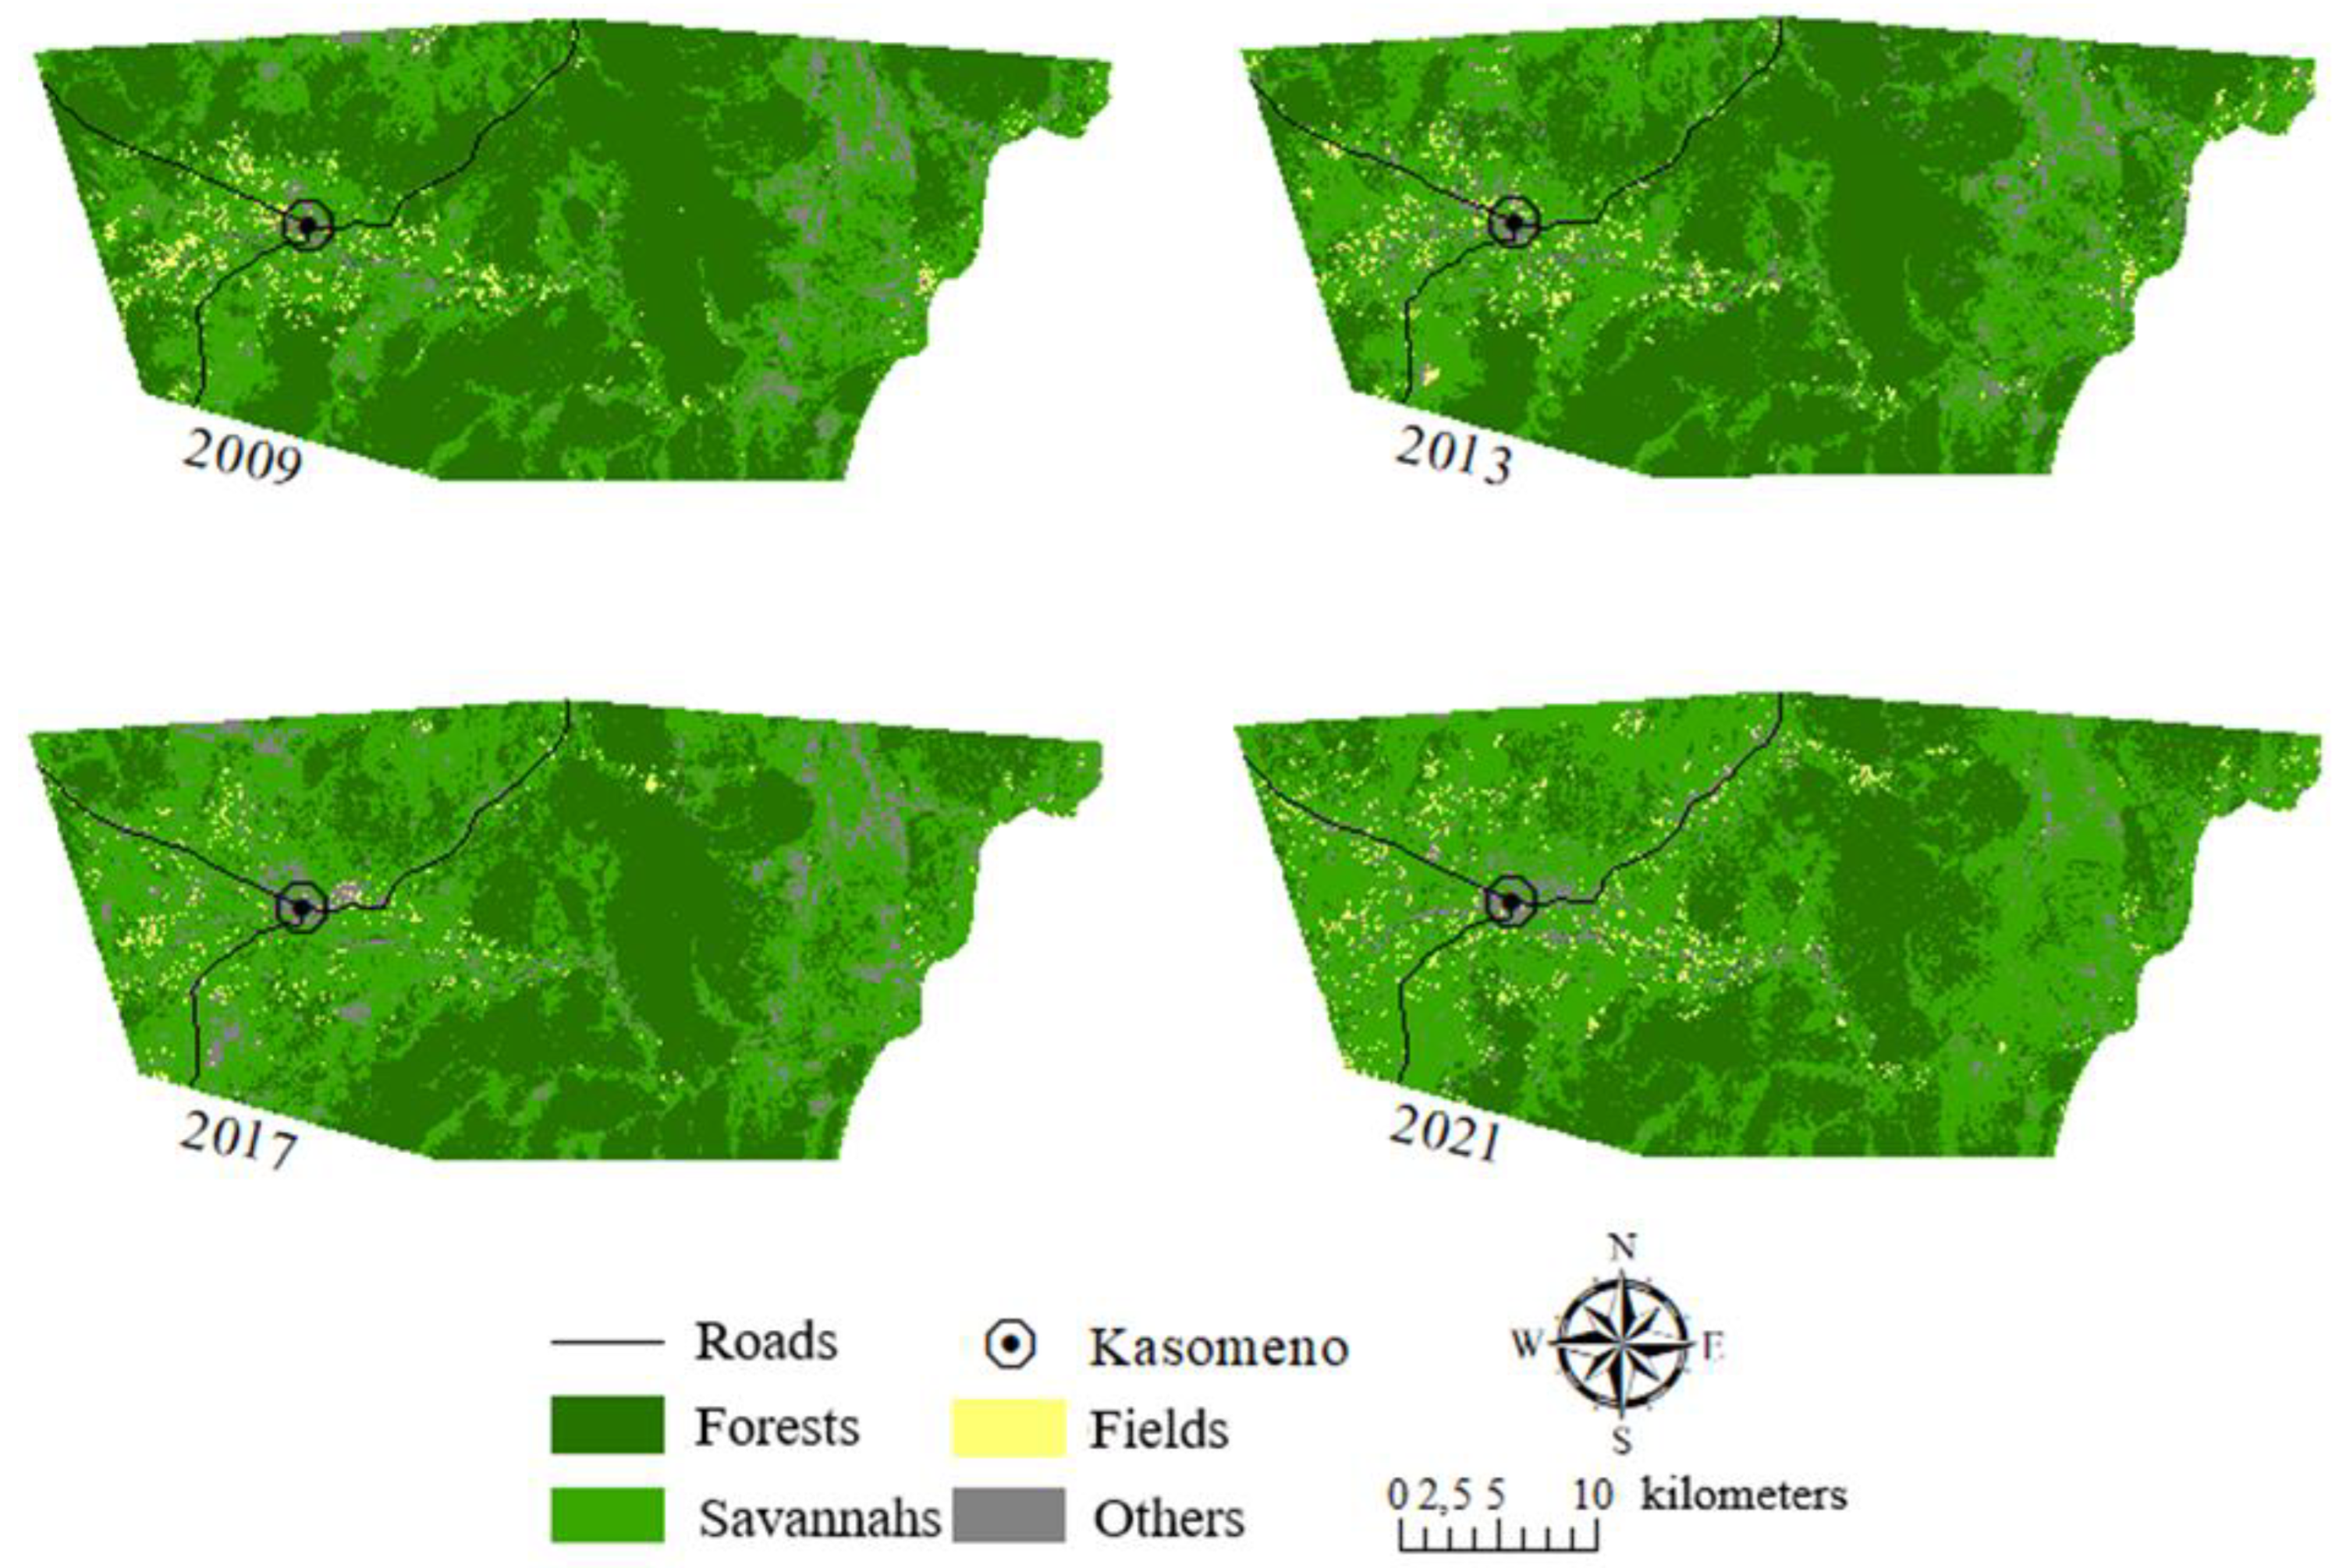
3.1. Classification and Land Cover Mapping in the Kasomeno Region between 2009 and 2021

Supervised classifications of Landsat images based on the maximum likelihood algorithm gave overall accuracies of 91% to 96%, with Kappa (κ) values ranging from 0.89 to 0.94. These results are acceptable and can be used judiciously. Furthermore, visual analysis of the maps (Figure 2) shows a continuous regression of forest areas in all directions, including along roads, to the benefit of anthropogenic classes, notably savannahs, which have expanded dramatically.

3.2. Landscape Composition within the Area of Illegal Exploitation of P. tinctorius in the Region of Kasomeno from 2009 to 2021

Forests have continuously lost their cover over all study periods (Table 1). Their coverage in the landscape dropped from 54.8% in 2009 to 36.4% in 2021. In contrast, over the same period, the savannahs showed a progressive dynamic. Their area has increased by around 19% in twelve years. Also, with the exception of the period from 2013 to 2017, fields have increased their extent in the landscape over all periods between 2009 and 2021, with the area increasing from 1.8% to 2.3%. On the other hand, the area of the landscape covered by other land cover underwent a transition from a regression phase (2009 and 2013) to an increase (2013–2021).
The Forests recorded major spatial changes over all three periods of the study (2009–2013, 2013–2017 and 2017–2021). Between 2009 and 2013, 47.2% of the forest-covered landscape remained intact, while 6.6%, 0.3% and 0.7% of the landscape occupied by forests in 2009 were converted to savannahs, fields and other land cover, respectively. Also, forests were invaded between 2013 and 2017 by savannah (10.1%), fields (0.2%) and other land cover (0.5%). Over the same period from 2013 to 2017, only 40.2% of the landscape occupied by forest remained stable. Finally, over the period from 2017 to 2021, although forests have remained stable in the landscape at 31.7%, it should be noted that 10.4% of the landscape occupied by forests in 2017 has evolved into savannahs, compared to 0.8% that has evolved into fields and other land cover.
Analysis of the stability of the land cover shows that forest was the most stable over the 2009–2013 and 2013–2017 periods. A transition was noted over the 2017–2021 period, with the appearance of a new land cover that was the most stable, namely the “savannah”. In addition, beyond the stability observed in the “forest” class, weak forest regeneration trends were noted over the 2009–2021 period, particularly from savannahs (10.7%) and other land cover (0.3%).

3.3. Landscape Spatial Pattern Dynamics

For all the periods considered between 2009 and 2021, forest recorded the process of patch dissection, materialised by a decrease in the class area in parallel with the increase in the number of patches (Table 2). In contrast, the increase in the class area of savannah patches was accompanied by a decrease in the number of patches (2009–2013 and 2013–2017) and an increase in the number of patches (2017–2021), which is a clear indication of patch aggregation and creation, respectively. Apart from the attrition of field patches (2013–2017) and other land cover (2017–2021), which is reflected in the decrease in the number of patches and their class area, both classes recorded the creation of patches (2009–2013, 2017–2021 for fields; 2009–2013, 2013–2017 for other land cover), especially as the increase in the class area was due to the increase in the number of patches.
Table 2 shows that between 2009 and 2021, all the land cover recorded values of the fractal dimension greater than and close to 1, reflecting a slight simplicity of patch shapes. Furthermore, the largest patch index value, which was low in 2009 for the savannah, increased remarkably in 2021. Conversely, the largest patch index value is decreasing for the forest, especially since it has gone from 56% in 2009 to 36% in 2021. All of this seems to confirm the phenomenon of environmental degradation and, thus, the anthropisation of forest ecosystems, as confirmed by the evolution of the landscape disturbance index, which rose from 0.8 to 1.7 between 2009 and 2021 (Figure 3).

4. Discussion

4.1. Uncontrolled Logging of Pterocarpus tinctorius Welw., Miombo Woodland Deforestation and Agricultural Lands Dynamics within Kasomeno Region

Miombo woodland has been identified as one of the highest priority ecosystems for conservation due to its high level of endemism and its place as an important carbon reservoir [8,10,50,51]. More than 100 million people depend on this forest for their daily requirements of (non-)wood forest products [8,52]. However, the activities that have been identified as responsible for the increased pressure on miombo in the Upper Katanga region are agriculture and the persistent increase in the urban demand for wood energy [53].
But this study shows that the landscape dynamics of the study area were characterised by a regression of forests at a variable rate of deforestation over the three periods studied (0.9% between 2009 and 2013; 2% between 2013 and 2017; and 1.6% between 2017 and 2021). The intensification of human activities in the study area and the trade in P. tinctorius (between 2013 and 2017) are the major causes of these different variations. Indeed, since the start of the illegal exploitation of P. tinctorius in 2013 in Upper Katanga, particularly in the Kasenga territory, the study area has seen a significant increase in its population. Thus, anthropic pressures have multiplied, as was the case during the liberalization of the mining sector in 2002 in the Katangese Copperbelt area [18]. The attraction of the local population to illegal exploitation is largely explained by the socioeconomic situation in Democratic Republic of Congo, where most of the population lives on less than $1.25 per day in the context of a tight labour market. In addition, the country ranks low on the human development index list and is experiencing various other socioecological difficulties [54]. Thus, the illegal exploitation of P. tinctorius provides an important livelihood strategy for the population, who have moved to occupy the exploitation sites. In the rural area of Kasomeno, households cultivate a maximum of 2 ha of maize, producing around 1600 kg. With a ton of maize costing nearly $400, households earn barely $640 over the year, meaning $1.75 is earned per day per farming household. Yet, the members of local communities who walk through the forest cutting P. tinctorius earn about $5 a day (personal communication from the provincial environmental coordinator). The impact of having many people in the middle of the forest has implications in terms of soil degradation, ecosystem destruction and, ultimately, a loss of biodiversity [55,56].
The deforestation rates recorded in this study over the three periods studied are far higher than those estimated at the national level (0.2%) [57,58], though close to those (0.6–1.8%) reported for the former Katanga province [59] or the region of Lubumbashi [60]. Almost 70% of the Congolese population lives in rural areas. Their activities are based on agriculture, gathering and wood exploitation. These activities, which also constitute the basis of their income and food, rely on natural resources [18,54]. The sale of forest products, which is both a source of employment and income, involves the populations of Lubumbashi city in the context of the Kasomeno area. The high demand for forest products by households in Lubumbashi justifies the regression of woody forest resources in the periphery of the city, the radius of which increases over time [20].
The regression of forests in the study area has favoured the progression of anthropogenic classes, mainly savannahs. This regression is believed to be a consequence of multiple and repeated intrusion of local populations into the forests for various activities, notably timber cutting [8,18]. Many authours also claim that the causes of the regression in the quantity and quality of forest ecosystems are anthropogenic [57,58,60]. Ref. [8] considers southern Katanga savannahs to be a result of forest landscape anthropisation. Indeed, the opening of the forest canopy following various anthropogenic activities allows light penetration favourable for the development of herbaceous species, most of which are heliophilous [61]. Indeed, forest areas with frequent human activities generally show a more noticeable opening of the canopy than the reference forest. This favours the development of herbaceous species and leads to the conversion of forests into savannahs. In fact, wooded, arboreal and shrub savannahs are rarely natural in the region and, therefore, their importance increases with the increase in anthropogenic activities [8]. Subsequently, when abandoned, savannahs with significant wooded, arboreal and shrub cover record a densification of wooded pockets, thus corroborating the meagre tendency toward forest regeneration recorded in this study.
In addition, the fields also lost their surface area between 2013 and 2017, which is a sign of the abandonment of agricultural activities in the area. Alternatively, illegal P. tinctorius exploitation seemed to be a secure and rapid source of income. Indeed, the high demand for P. tinctorius over the abovementioned period has attracted several farming households, some of whom are forced to pay less attention to their fields, as they only provide a very low daily income compared to the sale of P. tinctorius. This situation is comparable to that of the Mutshatsha territory in DR Congo where artisanal mining has led to the abandonment of farming activities [18]. Also, some authours have noted that the artisanal exploitation of natural resources generally pushes people in rural areas to abandon their land in search of more remunerative activities [62]. On the other hand, ref. [63] believes that abandoning farmland is a rational behaviour. The farmer stops farming when the costs of production exceed the benefits of agricultural production [64,65].
Agriculture, as one of the activities on which the economy and food supply of Kasenga households are based, has been adversely affected by the illegal exploitation of P. tinctorius. A similar trend has been observed in the Kabonwule region of northern Ghana, where local farmers have complained about the massive destruction of their farmland as a result of the illegal exploitation of Pterocarpus erinaceus [64]. Apart from Ghana, illegal logging of the species known as “rosewood” has spread to other African countries, notably Nigeria, Zambia and Madagascar, due to the rapid increase in demand in Asia (mainly China) [29,65,66].
The results on the structural pattern analysis of the Kasomeno area revealed that the forest, considered a natural ecosystem in the landscape, underwent dissection as a spatial transformation process. It is recognised that when a natural landscape undergoes human-influenced transformations, perforation comes before dissection, followed by shrinkage or fragmentation [67]. This is not the case with the results of the present study. This may be related to the very short time step in the present study on the one hand, and on the other hand, it may be due to the government measure declaring the ban on the exploitation of P. tinctorius after 2017. This measure reduced the extent of deforestation, but did not reverse the trend. Also, the decrease in the pressure on forest ecosystems, favoured by the same measure, has resulted in a weak reconstitution of forest patches in some parts of the study area. The limitation of the extent of the anthropisation of miombo woodland, resulting from better implementation of forest protection measures, was demonstrated in the Bururi Forest Reserve near Bujumbura city [68]. Ref. [69] indicated that current human pressures on forest resources prevent the regeneration of natural plant formations, which are thus seriously threatened. Furthermore, the fractal dimension calculated for all classes revealed a slight simplicity in their task forms. This can be explained by the fact that the exploitation or cutting of P. tinctorius was done in a selective way, and it is almost rare to find stands grouped in the same places.

4.2. Implications for Sustainable Miombo Woodland Management and Food Security

Despite the significant socioeconomic contribution of the exploitation of P. tinctorius in the study area, it has strongly contributed to the imbalance of ecosystems [27]. This can be explained by the fragile economic context in which these populations find themselves, which only allows them to display minimal concern for the sustainability of natural resources, which do not pertain to short-term survival objectives [28,70]. Forest ecosystems are undeniably necessary for the survival of local populations [54]. Woody species provide humans with leaves, flowers, fruits, seeds and products made from plants such as farming tools (axe and knife handles), furniture (chair, bed, stool), household utensils (mortar, pestle, basket) and cleaning products (rope, incense, soap). Some authours argue that natural vegetation is a vital element and a precious capital for humans, providing for the multiple needs of a fast-growing population [71]. However, in the context of the Kasomeno region, illegal logging has led to a reduction in patch size and isolation for many species. The same form of logging has been identified in Indonesian villages as one of the factors that have contributed to the imbalances in forest ecosystems [72,73]. In addition, the Kasomeno area is located less than 75 km from Kundelungu National Park where several human intrusions have been reported. With the remoteness of the forest resources, the risk of local communities exploiting the park resources is clearly high. It is important to improve criminal justice efforts to combat illegal logging [74,75] and implement an integrated and participatory management policy through community forestry. This approach has worked well in Mampu and the Batéké Plateau in southwestern D.R. Congo, in the province of Kinshasa [76]. There is a link between the stability of natural resources and the poverty of populations [77]. This poverty often affects people living in rural areas, whose dependence on forests is deeply rooted in history [78]. However, the success of the approach to sustainable forest management in these environments depends mainly on reducing poverty through the development of other income-generating activities, including agriculture. However, our results also point to the abandonment of farming activities by a fringe of the population, to the benefit of the illegal exploitation of P. tinctorius. This situation threatens the food security of populations that depend heavily on agricultural crops, but also on the collection of non-timber forest products (NTFPs), for their subsistence [63,71,79]. One of the unfortunate and visible consequences of this situation is the presence of large quantities of imported manufactured goods on local markets. In a region where yields of the main crops are clearly low compared to the optimum, the rush of farming households to exploit P. tinctorius will lead to food insecurity beyond the region’s borders, particularly in Lubumbashi city where some markets are supplied by agricultural produce from the adjacent rural area. It is important to make agriculture competitive with other economic activities in the region through better supervision of producers by public services. Farming households should also be trained in agroforestry [80], in particular the practice of planting crops next to indigenous miombo species of economic interest, notably P. tinctorius, a potential candidate species for the restoration of degraded miombo due to its abundance of biomass [81]. Finally, despite the efficiency and feasibility of our methodology, the study was not able to identify the spectral signature of P. tinctorius communities or quantify their spatiotemporal dynamics using satellite images of very fine spatial resolution. Furthermore, it did not integrate the perception of local communities. Nevertheless, our study confirmed the main trends in landscape dynamics in southern Katanga, where the ecological balance of forest landscapes is significantly disturbed and will be even more so in the coming decades. The objective of such a study is to alert decision-makers and populations to the evolutionary trend of natural vegetation formations if current practices are not rapidly modified; this is considered in a context where the economic growth of this rural area will continue to depend on slash-and-burn agriculture and forest exploitation for a long time to come, not to mention a galloping demography.

5. Conclusions

The aim of this study was to assess the landscape change in Kasenga territory in response to the illegal exploitation of P. tinctorius. Our results confirm the view that forest cover has experienced a marked regression in area between 2013 and 2017, with the configuration of the study area undergoing significant changes over this 12-year period. The landscape matrix, which was characterised by forest in 2009, is dominated by savannah in 2021. On the other hand, during the same period, the surface area and number of agricultural tasks have also decreased, as a consequence of the abandonment of agricultural activities. The imbalance of forest ecosystems has materialised through forest dissection and conversion to savannahs, and other land uses, which have extended their hold on the landscape through the creation and aggregation of patches. These results were supported by the analysis of the level of disturbance in the landscape, which doubled between 2009 and 2021, reflecting the anthropisation of the natural class.
The present study was limited to the detection and quantification of anthropogenic effects on the landscape. Our results are necessary to address the negative impacts associated with the illegal exploitation of P. tinctorius in the study area and show the urgency of putting policies in place to improve the socioeconomic conditions of the populations in the short-term. These results can be supported by the analysis of other anthropogenic factors responsible for forest degradation in the region, allowing for the prediction of changes that may occur in the future, in order to develop research and conservation options.

Author Contributions

M.M.M.: Conceptualization, methodology and writing—original draft preparation, D.-D.N.N. and H.K.M.: data curation and writing—review, K.R.S.: writing—review and editing, F.M.: writing—review and editing, S.C.K.: writing—review and editing, J.B.: writing—review and editing, Y.U.S.: supervision, writing—original draft and funding acquisition. All authors have read and agreed to the published version of the manuscript.

Funding

The research was funded by the project CHARLU (ARES-CCD, Belgium).

Institutional Review Board Statement

Not applicable.

Informed Consent Statement

Not applicable.

Data Availability Statement

All data presented in this study are available upon request from the corresponding author.

Conflicts of Interest

No conflict of interest were declared by the authors.

References

  1. Kanninenm, M.; Murdaiyarso, D.; Seymour, F.; Angelsen, A.; Wunder, S.; German, L. Do Trees Grow on Money? The Implications of Deforestation Research for Policies to Promote REDD; Cifor: Bogor, Indonesia, 2007. [Google Scholar]
  2. Green, J.M.H.; Larrosa, C.; Burgess, N.D.; Balmford, A.; Johnston, A.; Mbilinyi, B.P.; Platts, P.; Coad, L. Deforestation in an African biodiversity hotspot: Extent, variation and the effectiveness of protected areas. Biol. Conserv. 2013, 164, 62–72. [Google Scholar] [CrossRef]
  3. Leigh, E.G.; Davidar, P.; Dick, C.W.; Terborgh, J.; Puyravaud, J.-P.; Ter Steege, H.; Wright, S.J. Why do some tropical forests have so many species of trees? Biotropica 2004, 36, 447–473. [Google Scholar]
  4. De Wasseige, C.; Devers, D.; De Marcken, P.; Eba’a, A.R.; Nasi, R.; Mayaux, P. Les Forêts du Bassin du Congo: État des Forêts 2008; Office des Publications de l’Union Européenne: Bruxelles, Belgium, 2009. [Google Scholar]
  5. De Wasseige, C.; Flynn, J.; Louppe, D.; Hiol Hiol, F.; Mayaux, P. Les Forêts du Bassin du Congo: État des Forêts 2013; Weyrich: Neufchâteau, Belgique, 2014; 328p. [Google Scholar]
  6. Campbell, B.M.; Frost, P.; Byron, N. Miombo woodlands and their use: Overview and key issues. In The Miombo in Transition: Woodlands and Welfare in Africa; Campbell, B., Ed.; Centre for International Forestry Research: Bogor, Indonesia, 1996; pp. 1–10. [Google Scholar]
  7. White, F. The Vegetation of Africa; Natural Resources Research, No 20; UNESCO: Paris, France, 1983; 356p. [Google Scholar]
  8. Malaisse, F. Se Nourrir en Forêt Claire Africaine: Approche Écologique et Nutritionnelle; Les Presses Agronomiques de Gembloux: Belgium, 1997; 384p. [Google Scholar]
  9. Malaisse, F. How to Live and Survive in Zambezian Open Forest (Miombo ecoregion); Presses Agronomiques de Gembloux: Jean Bleu, Belgium, 2010. [Google Scholar]
  10. Campbell, B.M.; Angelsen, A.; Cunningham, A.; Katerere, Y.; Sitoe, A.; Wunder, S. Miombo Woodlands–Opportunities and Barriers to Sustainable Forest Management; CIFOR: Bogor, Indonesia, 2007; p. 41. [Google Scholar]
  11. Khoji, M.H.; N’Tambwe, N.D.-D.; Malaisse, F.; Waselin, S.; Sambiéni, K.R.; Cabala, K.S.; Munyemba, K.F.; Bastin, J.-F.; Bogaert, J.; Useni, S.Y. Quantification and Simulation of Landscape Anthropization around the Mining Agglomerations of Southeastern Katanga (DR Congo) between 1979 and 2090. Land 2022, 11, 850. [Google Scholar] [CrossRef]
  12. Kabulu, D.J.-P.; Bamba, I.; Munyemba, K.F.; Defourny, P.; Vancutsem, C.; Nyembwe, N.S.; Ngongo, L.M.; Bogaert, J. Analyse de la structure spatiale des forêts au Katanga. Ann. Fac. Sci. Agron. 2008, 1, 12–18. [Google Scholar]
  13. Potapov, P.V.; Turubanova, S.A.; Hansen, M.C.; Adusei, B.; Broich, M.; Altstt, A.; Mane, L.; Justice, C.O. Quantifyng forest cover loss in Democratic Republic of the Congo, 2000-2010, with Landsat ETM+data. Remote Sens. Environ. 2012, 122, 106–116. [Google Scholar] [CrossRef]
  14. Megevand, C.; Sanders, K.; Doetinchem, N. Dynamique de Déforestation dans le Bassin du Congo: Réconcilier la Croissance Économique et la Protection de la Forêt; World Bank: Washington, DC, USA, 2013. [Google Scholar]
  15. Münkner, C.A.; Bouquet, M.; Muakana, R. Elaboration du Schéma Directeur D’approvisionnement Durable en Bois-Énergie pour la Ville de Lubumbashi (Katanga). In Programme Biodiversity et ForSts (PBF) Projet Filiere Bois/Chaînes de valeur ajoutee, GIZ, MEDD, DFS, GFA; GIZ: Bellevue, WA, USA, 2015. [Google Scholar]
  16. Barima, Y.S.S.; Kabulu, D.J.-P.; Alongo, S.; Ndayishimiye, J.; Bomolo, O.; Kumba, B.; Iyongo, L.; Bamba, I.; Mama, A.; Toyi, M.; et al. Deforestation in central and West African: Landscape dynamics, anthropogenic effects and ecological consequences. In Advances in Environmental Research; Daniels, J.A., Ed.; Nova Science Publishers: USA, 2011; Volume 7, pp. 95–120. [Google Scholar]
  17. Sanga-Ngoiem, K.; Fukuyama, K. Interannual and long-term climate variability over the Zaire River Basin during the last 30 years. JGR 1996, 101, 21351–21360. [Google Scholar]
  18. Cabala, K.S.; Useni, S.Y.; Sambieni, K.R.; Bogaert, J.; Munyemba, K.F. Dynamique des écosystèmes forestiers de l’Arc Cuprifère Katangais en République Démocratique du Congo. Causes, Transformations spatiales et ampleur. Tropicultura 2017, 35, 192–202. [Google Scholar]
  19. Useni, S.Y.; Malaisse, F.; Cabala, K.S.; Kalumba, M.A.; Mwana, Y.A.; Nkuku, K.C.; Bogaert, J.; Munyemb, K.F. Tree diversity and structure on green space of urban and peri-urban zones: The case of Lubumbashi City in the Democratic Republic of Congo. Urban For. Urban Green. 2019, 41, 67–74. [Google Scholar] [CrossRef]
  20. Useni, S.Y.; Cabala, K.S.; Nkuku, K.C.; Amisi, M.Y.; Malaisse, F.; Bogaert, J.; Munyemba, K.F. Vingt-cinq ans de monitoring de la dynamique spatiale des espaces verts en réponse à l’urbanisation dans les communes de la ville de Lubumbashi (Haut-Katanga, R.D. Congo). Tropicultura 2017, 35, 300–311. [Google Scholar]
  21. Gillet, P.; Vermeulen, C.; Feintrenie, L.; Dessard, H.; Garcia, C. Quelles sont les causes de la déforestation dans le bassin du Congo? Synthèse bibliographique et études de cas. Biotechnol. Agron. Soc. Environ. 2016, 20, 183–194. Available online: https://hdl.handle.net/2268/197566 (accessed on 25 August 2022).
  22. Chidumayo, E.N. Woody Biomass Stucture and Utilization for Charcoal Production in a Zambian Miombo Woodland. Bioresour. Technol. 1991, 37, 43–52. [Google Scholar] [CrossRef]
  23. Kabulu, D.-J.P. Évaluation de l’état de la Fragmentation des Forêts au Katanga (Rép. Dém. du Congo); Mémoire de DEA; Université Libre de Bruxelles: Bruxelles, Belgium, 2007. [Google Scholar]
  24. Binzangi, K. La Production de bois de feu et de Charbon de Bois dans L’arrière-Pays de Lubumbashi: Aspects Techniques, Sociaux et Économiques, D.E.S., UNILU; Faculté des Sciences: Paris, France, 1983. [Google Scholar]
  25. PNUD (Programme des Nations Unies pour le Développement). Unité de Lutte Contre la Pauvreté, Province du Katanga. Profil, Résumé. Pauvreté et Conditions de vie des Ménages, 2009; 19p. Available online: https://www.undp.org/sites/g/files/zskgke326/files/migration/cd/UNDP-CD-Profil-PROVINCE-Katanga.pdf (accessed on 13 January 2021).
  26. Qian, J.; Li, J.; Wang, Z.; Qu, L.; Ding, Y.; Yi, S.; China, B.P. Effects of wax and dimethyl silicone oil mixed impregnation on dimensional stability of two hardwoods. Wood Res. 2019, 64, 165–176. [Google Scholar]
  27. République Démocratique du Congo: Saignée de Bois Rouge dans le Haut-Katanga. Available online: https://www.jeuneafrique.com/mag/457866/societe/rdc-saignee-de-bois-rouge-haut-katanga/ (accessed on 13 January 2021).
  28. Cabala, K.S.; Useni, S.Y.; Munyemba, K.F.; Bogaert, J. Activités anthropiques et dynamique spatiotemporelle de la forêt claire dans la Plane de Lubumbashi. In Anthropisation des Paysages Katangais; Bogaert, J., Colinet, G., Mahy, G., Eds.; Les Presses Universitaires de Liège: Liège, Belgique, 2018; pp. 253–266. [Google Scholar]
  29. Cerutti, P.O.; Gumbo, D.J.; Moombe, K.B.; Schoneveld, G.C.; Nasi, R.; Borchard, N.; Weng, X. Mukula (Rosewood) Trade between China and Zambia; CIFOR: Bogor, Indonesia, 2018; Volume 211. [Google Scholar]
  30. Augustino, S.; Hall, J.B. Population status of Pterocarpus tinctorius: A medicinal plant species in Urumwa forest reserve, Tanzania. Tanzan. J. For. Nat. Conserv. 2008, 78, 89–99. [Google Scholar]
  31. Hong, Z.; Wu, Z.; Zhao, K.; Yang, Z.; Zhang, N.; Guo, J.; Xu, D. Comparative analyses of five complete chloroplast genomes from the genus Pterocarpus (Fabacaeae). Int. J. Mol. Sci. 2020, 21, 3758. [Google Scholar] [CrossRef]
  32. André, M.; Vrancken, I.; Boisson, S.; Mahy, G.; Rüdisser, J.; Visser, M.; Lejeune, P.; Bogaert, J. Quantification of anthropogenic effects in the landscape of Lubumbashi. In Anthropisation des Paysages Katangais; Bogaert, J., Colinet, G., Mahy, G., Eds.; Les Presses Universitaires de Liège: Liège, Belgique, 2018; pp. 231–252. [Google Scholar]
  33. Vermeulen, C.; Doucet, J.; Dubiez, É. Enjeux fonciers, exploitation des ressources naturelles et Forêts des Communautés Locales en périphérie de Kinshasa, RDC. Biotechnol. Agron. Société Environ. 2011, 15, 535–544. [Google Scholar]
  34. Bogaert, J.; André, M. L’écologie du paysage: Une discipline unificatrice. Tropicultura 2013, 31, 1–2. [Google Scholar]
  35. Van Engelen, V.W.P.; Verdoodt, A.; Dijkshoorn, K.; Van Ranst, E. Soil and Terrain Data Base of Central African; SOTERCAF, Version 1.0; FAO: Rome, Italy, 2006; 22p. [Google Scholar]
  36. Kasongo, L.M.E. Système D’évaluation des Terres à Multiples Échelles pour la Détermination de L’impact de la Gestion Agricole sur la Sécurité Alimentaire au Katanga, RDC. Ph.D. Thesis, Université Gent, Gent, Belgique, 2008; 336p. [Google Scholar]
  37. CAID. Données par Province Administrative, Kinshasa, Gombe. 2017. Available online: https://www.caid.cd (accessed on 12 September 2018).
  38. FAO; WRB. World Reference Base for Soil Resources 2006; World Soil Resources Reports N°103; FAO: Rome, Italy, 2006. [Google Scholar]
  39. Mama, A.; Sinsin, B.; De Cannière, C.; Bogaert, J. Anthropisation et dynamique des paysages en zone soudanienne au nord du Bénin. Tropicultura 2013, 31, 78–88. [Google Scholar]
  40. Barima, Y.S.S.; Egnankou, W.M.; N’doumé, A.T.C.; Kouamé, F.N.; Bogaert, J. Modélisation de la dynamique du paysage forestier dans la région de transition forêt-savane à l’est de la Côte d’Ivoire. Télédétection 2010, 9, 129–138. [Google Scholar]
  41. Barima, Y.S.S.; Barbier, N.; Bamba, I.; Traore, D.; Lejoly, J.; Bogaert, J. Dynamique paysagère en milieu de transition ivoirienne. Bois Forêts Trop. 2009, 299, 15–25. [Google Scholar] [CrossRef]
  42. Landis, J.R.; Koch, G.G. The measurement of observer agreement for categorical data. Biometrics 1977, 33, 159–174. [Google Scholar] [CrossRef]
  43. Pontius, R.G., Jr. Quantification error versus location incomparison of categorical maps. Photogramm. Eng. Remote Sens. 2000, 66, 1011–1016. [Google Scholar]
  44. Jessen, L.I.F.; Frans, J.M.; Wel, V.D. Accuracy assessment of satellite derived land cover data: A review. Photogramm. Eng. Remote Sens. 1994, 60, 410–432. [Google Scholar]
  45. Bogaert, J.; Mahamane, A. Ecologie du paysage: Cibler la configuration et l’échelle spatiale. Ann. Sci. Agron. Bénin 2005, 7, 1–15. [Google Scholar] [CrossRef]
  46. O’Neill, R.V.; Krummel, J.R.; Garner, R.H.; Sugihara, G.; Jackson, B.; Deangelis, D.L.; Milne, B.T.; Turner, M.G.; Zygmunt, B.; Christensen, S.W.; et al. Indices of landscape pattern. Landsc. Ecol. 1988, 1, 153–162. [Google Scholar] [CrossRef]
  47. Bogaert, J.; Ceulemans, R.; Salvador-Van, E.D. Decision tree algorithm for detection of spavial processes in landscape transformation. Environ. Manag. 2004, 33, 62–73. [Google Scholar] [CrossRef]
  48. Mcgarigal, K.; Ene, E.; Holmes, C. FRGSTATS (Version 3); FRAGSTATS Metrics; University of Massachusets-Produced Program: Amherts, MA, USA, 2002. [Google Scholar]
  49. Schlaepfer, R. Analyse de la Dynamique du Paysage; Fiche d’enseignement 4.2; Laboratoire de Gestion des Ecosystèmes, Ecole Polytechnique de Lausanne: Lausanne, Switzerland, 2002; p. 10. [Google Scholar]
  50. Mittermeier, R.A.; Mittermeier, C.G.; Brooks, T.M.; Pilgrim, J.D.; Konstant, W.R.; Da Fonseca, G.A.; Kormos, C. Wilderness and biodiversity conservation. Proc. Natl. Acad. Sci. USA 2003, 100, 10309–10313. [Google Scholar] [CrossRef]
  51. Shirima, D.D.; Totland, Ø.; Munishi, P.K.; Moe, S.R. Relationships between tree species richness, evenness and aboveground carbon storage in montane forests and miombo woodlands of Tanzania. Basic Appl. Ecol. 2015, 16, 239–249. [Google Scholar] [CrossRef]
  52. Mwitwa, J.; German, L.; Muimba-Kankolongo, A.; Puntondewo, A. Governance andsustainability challenges in landscape shaped by mining: Mining-forestry linkages and impacts in the copper belt of Zambia and the DR Congo. For. Policy Econ. 2012, 25, 19–30. [Google Scholar] [CrossRef]
  53. Dewees, P.A.; Campbell, B.M.; Katerere, Y.; Sitoe, A.; Cunningham, A.B.; Angelsen, A.; Wunder, S. Managing the miombo woodlands of southern Africa: Policies, incentives and options for the rural poor. J. Nat. Resour. Policy Res. 2010, 2, 57–73. [Google Scholar] [CrossRef]
  54. Lebailly, P. Rapide Évaluation de L’impact de la Crise du Secteur Minier de la Zone Lubumbashi-Likasi-Kolwezi de la Province du Katanga (RD Congo) et des Potentialités en Termes de Promotion de L’emploi; La Problématique Agricole Rapport Final; BIT: New York, NY, USA, 2010. [Google Scholar]
  55. N’guessan, K.G.; Oura, K.R.; Loba, A.D.F.V. Crise politique, pression foncière et sécurité alimentaire dans les périphéries de la forêt classée du mont Peko. Tropicultura 2018, 36, 356–368. [Google Scholar]
  56. Weerts, A. Sites miniers en République Démocratique du Congo: Conflits et développement autour d’un espace hybride. In Territoires Périurbains. Développement, Enjeux et Perspectives dans les Pays du Sud; Bogaert, J., Halleux, J.-M., Eds.; Presses Agronomiques de Gembloux: Gembloux, Belgium, 2015; pp. 75–81. [Google Scholar]
  57. De Wasseige, C.; De Marken, P.; Bayol, N.; Hiol, F.; Mayaux, P.; Desclée, B.; Nasi, R.; Billand, A.; Defourny, P.; Eba Atyi, R. Les Forêts du Bassin du Congo: Etats des Forêts 2010; OSFAC, Office de publication de l’Union Européenne: Luxembourg, 2012; p. 276. [Google Scholar]
  58. Defourny, J.-P.; Delhage, C.; Kibambe, L.J.-P. Analyse Quantitative des Causes de la Déforestation et de la Dégradation des Forêts en République Démocratique du Congo; Rapport final; FAO: Kinshasa, République Démocratique du Congo, 2011. [Google Scholar]
  59. Kabulu, D.J.-P.; Vranken, I.; Bastin, J.-F.; Malaisse, F.; Nyembwe, S.; Useni, S.Y.; Ngongo, L.M.; Bogaert, J. Approvisionnement en charbon de bois des ménages lushois: Quantités, alternatives et conséquences. In Anthropisation des Paysages Katangais; Bogaert, J., Colinet, G., Mahy, G., Eds.; Les Presses Universitaires de Liège: Liege, Belgium, 2018; pp. 297–311. [Google Scholar]
  60. Munyemba, K.F.; Bogaert, J. Anthropisation et dynamique de l’occupation du sol dans la région de Lubumbashi de 1956 à 2009. E-Revue UNILU 2014, 1, 3–23. [Google Scholar]
  61. Rakotondrasoa, O.L.; Malaisse, F.; Rajoelison, G.; Gaye, J.; Razafimanantsoa, T.M.; Rabearisoa, M.; Ramamonjisoa, B.S.; Raminosoa, N.; Verheggen, F.; Poncelet, M.; et al. Identification des indicateurs de dégradation de la forêt de Tapia (Uapaca bojeri) par une analyse sylvicole. Tropicultura 2013, 31, 10–19. [Google Scholar]
  62. Wahidi, F.L.; Bellefontaine, R.; Quentin, P.; Defourny, P. Dynamique de changement de l’arganeraie entre sur usage et mutation sociale: Une opportunité d’équilibre socio- écologique. J. Agric. Environ. Int. Dev. 2014, 2, 108–114. [Google Scholar]
  63. Prishchepov, A.V. Agricultural Land Abandonment; Oxford Bibliographies, Environmental Science, Bibliographies Online; Oxford University Press: Oxford, UK, 2020; p. 9780199363445-0129. Available online: https://www.researchgate.net/publication/345402448_Agricultural_Land_Abandonment (accessed on 4 May 2022).
  64. Abdul-Rahaman, I.; Kabanda, J.; Braima, M.M. Desertification of the savanna: Illega logging of rosewood, causes and effects on the people of Kabonwule, Northern Region. Saudi J. Hum. Soc. Stud. 2016, 1, 48–54. [Google Scholar] [CrossRef]
  65. Schuurman, D.; Lowry, P.P., II. The Madagascar rosewood massacre. Madag. Conserv. Dev. 2009, 4, 98–102. [Google Scholar] [CrossRef]
  66. EIA. The Rosewood Racket: China’s Billion Dollar Illegal Timber Trade and the Devastation of Nigeria’s Forests. 2017. Available online: https://content.eia-global.org/assets/2017/rosewoodracket/PDF/Rosewood+Racket+Report+(High+Res).pdf (accessed on 3 May 2022).
  67. Bogaert, J.; Barima, Y.S.S.; Iyongo, W.M.L.; Bamba, I.; Mama, A.; Toy, M.; Lafortezza, R. Forest fragmentation: Causes, ecological impacts and implications for landscape management. In Globe; Li, C., Lafortezza, R., Chen, J., Eds.; Springer: Beijing, China; Berlin/Heidelberg, Germany, 2011; pp. 273–296. [Google Scholar]
  68. Havyarimana, F.; Masharabu, T.; Kouao, J.K.; Bamba, I.; Nduwarugira, D.; Bigendako, M.J.; Hakizimana, P.; Mama, A.; Bangirinama, F.; Banyankimbona, G.; et al. The forest spatial dynamics in the Bururi forest nature reserve, Burundi. Tropicultura 2017, 35, 158–172. [Google Scholar]
  69. Mama, A.; Bamba, I.; Sinsin, B.; Bogaert, J.; De Cannière, C. Déforestation, savanisation et développement agricole des paysages de savanes-forêts dans la zone soudano-guinéenne du Bénin. Bois Forêts Trop. 2014, 322, 66–75. [Google Scholar] [CrossRef]
  70. Nellemann, C. Interpol Environmental Crime Programme. In Green Carbon, Black Trade. Illegal Logging, Tax Fraud and Laundering in the World’s Tropical Forests; GRID: Arendal, Norway, 2012. [Google Scholar]
  71. Biloso, A.; Lejoly, J. Etude de l’exploitation et du marché des produits forestiers non ligneux à Kinshasa. Tropicultura 2006, 24, 183–188. [Google Scholar]
  72. McCarthy, J.F. Wild Logging: State Agency, District Networks of Power and Interest, and Biodiversity Conservation in South Aceh, Sumatra, Asia Research Centre, Murdoch University, Australia. 2000. Available online: https://www.academia.edu/67296911 (accessed on 6 June 2022).
  73. Palmer, C. The extent and causes of illegal logging: An analysis of a major cause of tropical deforestation in Indonesia 2001. Mondes Développement 2019, 187, 113–132. Available online: https://www.researchgate.net/publication/39065603_The_Extent_and_Causes_of_Illegal_Logging_An_Analysis_of_a_Major_Cause_of_Tropical_Deforestation_in_Indonesia (accessed on 6 June 2022).
  74. Brito, B.; Barreto, P. Enforcement against illegal logging in the Brazilian Amazon. In Compliance and Enforcement in Environmental Law; Edward Elgar Publishing: Cheltenham, UK, 2011. [Google Scholar] [CrossRef]
  75. Goncalves, M.P.; Panjer, M.; Greenberg, T.S.; Magrath, W.B. Justice for Forests. Improving Criminal Justice Efforts to Combat Illegal Logging; The World Bank: Washington, DC, USA, 2012. [Google Scholar]
  76. Reyniers, C. Agroforesterie et déforestation en République démocratique du Congo. Miracle ou mirage environnemental? Mondes Développement 2019, 3, 113–132. Available online: https://www.cairn.info/revue-mondes-en-developpement-2019-3-page-113.htm (accessed on 25 July 2022). [CrossRef]
  77. Cao, A.N.; Wyatt, T. The Sustainable Development Goals Link to human Security: An Exploration of Illegal Logging in Vietnam. In The Emerald Handbook of Crime, Justice and Sustainable Development; Blaustein, J., Fitz-Gibbon, K., Pino, N.W., White, R., Eds.; Emerald Publishing Limited: Bingley, UK, 2020; pp. 513–532. [Google Scholar] [CrossRef]
  78. (SCDB) Secrétariat de la Convention sur la Diversité Biologique. Gestion Durable des Forêts, Diversité Biologique et Moyens D’existence: Un Guide des Bonnes Pratiques. Montréal. 2009, 47 + iii pages. Available online: https://www.cbd.int/development/doc/cbd-guide-des-bonnes-pratiques-forests-web-fr.pdf (accessed on 27 July 2022).
  79. Van Solinge, T.B. Researching illegal logging and deforestation. Int. J. Crime Justice Soc. Democr. 2014, 3, 35–48. [Google Scholar] [CrossRef]
  80. Nnko, L.; Kashaigili, J.; Monela, G.; Munishi, P.; Lyimo, P.; Nyemo, C. The Extent of Adoption of Agroforestry Systems and Practices and Conservation Implications in Kilombero District, Tanzania. East Afr. J. For. Agrofor. 2022, 5, 105–117. [Google Scholar] [CrossRef]
  81. Kyalamakasa, J.M.K.; Mulambi, M.M.M.; Mukonzo, E.K.L.; Shutcha, M.N.; Tekeu, H.; Nkombe, A.K.; Khasa, D. Early Selection of Tree Species for Regeneration in Degraded Woodland of Southeastern Congo Basin. Forests 2021, 12, 117. [Google Scholar] [CrossRef]
Figure 1. Geographical location of the study site (Kasomeno and its peripheral zone) in the southeast of the province of Haut-Katanga in D.R. Congo.
Land 11 01541 g001
Figure 2. Land cover maps of the Kasomeno region in 2009, 2013, 2017 and 2021, obtained from supervised classifications of Landsat images. The ‘Other’ class refers to other land uses.
Land 11 01541 g002
Figure 3. Evolution of the level of disturbance in the Kasomeno area in 2009, 2013, 2017 and 2021.
Land 11 01541 g003
Table 1. Transition probability matrix of land cover between 2009–2013, 2013–2017 and 2017–2021. The initial and final dates are presented in the rows and the columns, respectively, with values in boldface referring to the stability proportions. The values in the table are expressed as a percentage (%) of the total area of the study area (986 km2).
ForestsSavannahsFieldsOther Land CoverTotal 2009
Forests47.26.60.30.754.8
Savannahs3.830.90.92.838.4
Fields0.01.00.60.21.8
Other land cover0.02.70.21.84.9
Total 20135141.22.05.5
Stability index4.11.70.20.3
ForestsSavannahsFieldsOther land coverTotal 2013
Forests40.210.10.20.551.0
Savannahs2.534.90.63.241.2
Fields0.01.20.40.52.1
Other land cover0.13.10.02.45.6
Total 201742.849.31.26.6
Stability index3.01.70.20.3
ForestsSavannahsFieldsOther land coverTotal 2017
Forests31.710.40.40.442.9
Savannahs4.541.41.32.149.3
Fields0.00.70.40.21.3
Other land cover0.24.40.21.76.5
Total 202136.456.92.34.4
Stability index2.03.00.10.2
Table 2. Land cover spatial pattern dynamics in 2009, 2013, 2017 and 2021, and identification of spatial transformation processes (STP) based on the decision tree algorithm of Bogaert [47]. N: number of patches per class, CA: class area in km2 (%), am: average area of the land cover in km2, Df: the fractal dimension of the land cover and LPI: Largest Patch Index (%).
ForestsSavannahsFieldsOther Land Cover
N 20095957.005663.003405.008709.00
CA 2009540.20 (54.80)377.99 (38.40)18.30 (1.8)49.70 (4.9)
am 20090.090.070.010.01
Df 20091.471.461.421.49
LPI 2009 56.3087.105.9053.20
N 20136070.005570.003224.009234.00
CA 2013503.90 (51.00)406.30 (41.20)20.60 (2.1)55.50 (5.6)
am 20130.080.070.010.01
Df 20131.451.461.391.48
LPI 2013 61.4051.800.0020.70
STP 2009–2013DissectionAggregationAggregationCreation
N 20177483.005469.002288.0010,432.00
CA 2017422.10 (42.90)484.90 (49.30)12.70 (1.30)66.40 (6.50)
am 20170.060.090.010.01
Df 20171.481.451.351.45
LPI 2017 65.6060.102.2021.40
STP 2013–2017DissectionAggregationAttritionCreation
N 20217730.007082.003807.009617.00
CA 2021358.70 (36.40)559.70 (56.90)22.60 (2.30)45.20 (4.40)
am 20210.050.080.010.01
Df 20211.461.451.361.44
LPI 2021 38.4094.201.1031.00
STP 2017–2021DissectionCreationCreationAttrition
Publisher’s Note: MDPI stays neutral with regard to jurisdictional claims in published maps and institutional affiliations.

