Article

Impact of Long-Term Nutrient Supply Options on Soil Aggregate Stability after Nineteen Years of Rice–Wheat Cropping System

by
Sunita Kumari Meena
1,2,
Brahma Swaroop Dwivedi
1,3,
Mahesh Chand Meena
1,*,
Saba Prasad Datta
1,
Vinod Kumar Singh
1,4,
Rajendra Prasad Mishra
5,
Debashish Chakraborty
1,
Abir Dey
1 and
Vijay Singh Meena
6,7
1
ICAR-Indian Agricultural Research Institute (ICAR-IARI), New Delhi 110012, India
2
Department of Soil Science, Sugarcane Research Institute, Dr. Rajendra Prasad Central Agricultural University (RPCAU), Pusa, Samastipur 848125, India
3
ICAR-National Bureau of Soil Survey and Land Use Planning (ICAR-NBSS & LUP), Nagpur 440033, India
4
ICAR-Central Research Institute for Dryland Agriculture (ICAR-CRIDA), Hyderabad 500059, India
5
ICAR-Indian Institute of Farming Systems Research (ICAR-IIFSR), Modipuram Meerut 250110, India
6
ICAR-Vivekananda Parvatiya Krishi Anusandhan Sansthan (ICAR-VPKAS), Almora 263601, India
7
CIMMYT-Borlaug Institute for South Asia (BISA), Samastipur 848125, India
*
Author to whom correspondence should be addressed.
Land 2022, 11(9), 1465; https://doi.org/10.3390/land11091465
Submission received: 12 July 2022 / Revised: 26 August 2022 / Accepted: 28 August 2022 / Published: 2 September 2022
(This article belongs to the Special Issue Water-Energy-Food Nexus for Sustainable Land Management)

Abstract

:
Continuing soil degradation remains a serious threat to future food security. Soil aggregation can help protect soil organic matter from biodegradation; it affects soil physical (aeration), chemical (water infiltration), and biological (microbial) activities. The integrated plant nutrition system (IPNS) and organic farming (OF) options have been contemplated as a sustainable strategy to sustain soil aggregate stability under adverse climatic conditions and a possible tool to restore degraded soil systems. Results suggested that the application of plant nutrients based on IPNS and soil test crop response (STCR) including mineral fertilizers and organic manure (farmyard manure: FYM) improved soil aggregate stability and mean weight diameter (MWD) under rice–wheat cropping systems. A long-term (19 year) cropping system (rice–wheat) experiment was examined to identify best nutrient management practices. Seven nutrient supply options were applied: organic, mineral fertilizer in combination with IPNS, IPNS + B/IPNS + C to improve soil aggregate stability and MWD after completing 19 cropping cycles of rice–wheat cropping systems. Results showed that significantly higher (+31%) macroaggregates were dominant in the surface soil layer than in the subsurface soil. The significantly highest macroaggregates were observed under OF (60.12 g 100 g−1 dry soil) management practices followed by IPNS options. The MWD was significantly increased (+17%) between surface and subsurface soil. Maximum MWD was reported with OF (0.93 mm) management practices followed by the IPNS + C (0.78 mm), IPNS + B (0.77 mm), IPNS (0.70 mm), STCR (0.69 mm), NPK (0.67 mm), and unfertilized control (0.66 mm) plots. Overall, results suggest that the adoption of IPNS options, such as organic farming (OF), RDF, STCR, and inclusion of pulses (berseem and cowpea), significantly improved all soil aggregation fractions in the soil system and also offered an additional benefit in terms of soil sustainability.

1. Introduction

The global food system will encounter an unprecedented convergence of pressures over the next few decades. Soil degradation is considered one of the main causes of stagnating productivity growth. Soil aggregate stability improves soil quality, porosity, nutrient and water storage capacity, and food production, as well as decreases soil and nutrient loss. Soil aggregates, especially water stable aggregates, are of special importance for high water infiltration and good soil structure. These properties help determine soil quality and directly influence water-energy and food nexus. Soil aggregate stability can be used as combined index to maintain nutrients holding capacity and soil sustainability [1,2], which help to maintain agroecosystem sustainability [3,4]. Soil aggregates are the fundamental indicators of soil structure and store plant nutrient, which help the growth and development of plants [5,6,7]. Intensive agriculture management practices are exposed to land degradation. The improvement of soil aggregate stability is vital to strengthen the management value of degraded land of subtropical and tropical regions [8,9].
Crop yields will continue to be vitally important in the fight to achieve global food security, and the soil offers a great opportunity to boost crop production by enhancing the natural interaction between the soil and crops. Judicious application of organic manures and inorganic fertilizers accelerate soil aggregation and improve the organic matter in agriculture soils [10,11]. Instabilities of soil structure through mismanagement of tillage, nutrients, and agrochemicals can result in low soil quality, loss of soil and nutrients, reduce water availability, and degraded the soil quality [2,12,13]. Mostly, soil aggregate stability can be promoted by higher concentrations of carbon, mean weight diameter (MWD), and water-stable aggregates [2,14,15].
Intensive management practices have been considered a key factor in monitoring, regulating, stabilizing, and restoring the soil ecosystem [16,17,18]. The mismanagement of agricultural practices are one of the major causes of land degradation [19]; there are four types (i) physical (soil structure), (ii) chemical (soil fertility), (iii) biological (soil biodiversity), and (iv) ecological (all three factors lead to this) agroecosystem sustainability [20]. In the last few decades, there has been unparalleled interest and research attempts in finding adaptive management practices to efficiently restore degraded ecosystems [21,22,23].
Minimum soil disturbances, balanced application of organic manure and mineral fertilizers, preservation soil covers, and adoption of pules and green manuring crops in cropping systems, had positive impacts on soil aggregate stability by restoring degraded land, which in turn lead to superior crop growth development [22,24,25,26].
Despite its encouraging possibility, the IPNS options in rice–wheat cropping systems are limitedly adopted by farmers due to the insufficient support and impact assessment. Hence, to implement, design, and adopt the most effective IPNS options towards optimizing the soil aggregate stability, it is vital to launch efficient regulating, monitoring, and restoring assessments of soil aggregate stability and food security. The proportion of soil particles sequestered in aggregates contributes to the movement and storage of water, soil aeration, and species composition and distribution of soil organisms.
Moreover, there is a lack of studies in the literature about different nutrient supply options that evaluated the impacts of IPNS options, STCR, and OF practices on soil aggregate stability and soil sustainability. Consequently, developing our knowledge of the relationships between macroaggregate, microaggregate, and mean weight diameter under long-term applications of different nutrient supply options at aggregate scales is crucial for increasing aggregate stability and soil sustainability. Thus, it could be understood that changing soil quality induced by IPNS options, STCR, and OF practices would provide more scientific indications in evaluating soil aggregate stability. Hence, it is urgent to improve aggregation stability by adopting integrated plant nutrition system (IPNS) supply options (inclusion of pulses), soil test crop response (STCR), and organic farming (OF) practices, to maintain aggregate stability and soil quality.
Some fundamental questions remain unexplored, such as (i) how do IPNS options influence macroaggregate and microaggregate?; (ii) does organic manure application influence different soil aggregation fractions?; (iii) does IPNS and pulses (berseem and cowpea) options alleviate the adverse effect of climatic factors on soil aggregate stability?; and (iv) how does the relationship of different soil aggregation fractions influences MWD under rice–wheat cropping systems? Therefore, the effects of long-term application of IPNS options, STCR, and OF practices were tested to appraise their impact on soil aggregate stability after the completion of 19 cropping system cycles.
Based on the literature discussed above and the questions raised here, we hypothesized that in IPNS options, STCR and OF practices could increase or decrease the soil aggregate stability. Consequently, we intend to elucidate long-term IPNS options’ effects (i) to quantify the IPNS options and soil depths on soil aggregation fractions and (ii) to assess the best nutrient supply options and quantitative aggregate stability, MWD, and relationship compared to different nutrient supply options in long-run with a broad view to assess optimum options to maintain soil sustainability.

2. Materials and Methods

2.1. Site Descriptions

The ongoing long-term experimental site of ICAR-Indian Institute of Farming Systems Research Meerut is situated at 29°4′ N, 77°46′ E, 237 m above sea level located in the Western part of Uttar Pradesh, represents an irrigated, mechanized, and input-intensive cropping area of the Upper Gangetic Plain (UGP) transect of the Indo-Gangetic Plain (IGP). This long-term field experiment was started in 1998 to identify “Sustainable Production Model for Rice-Wheat Cropping System” on a sandy loam soil representing AEZ 4.1 (Hot semi-arid eco-region). Initial soil characteristics are presented in Table 1.

2.2. Climatic Features of the Experimental Site

The climate of the experimental site is semi-arid subtropical, with dry hot summers and cool winters. The average monthly minimum and maximum temperatures in January (the coolest month) are 7.2 °C and 20.1 °C, respectively. The corresponding temperatures in May (the hottest month) are 24.2 °C and 39.8 °C, respectively. Average annual rainfall is 823 mm out of which ~75% rainfall is received through the South-west monsoon during July–September month (Supplementary Table S1).

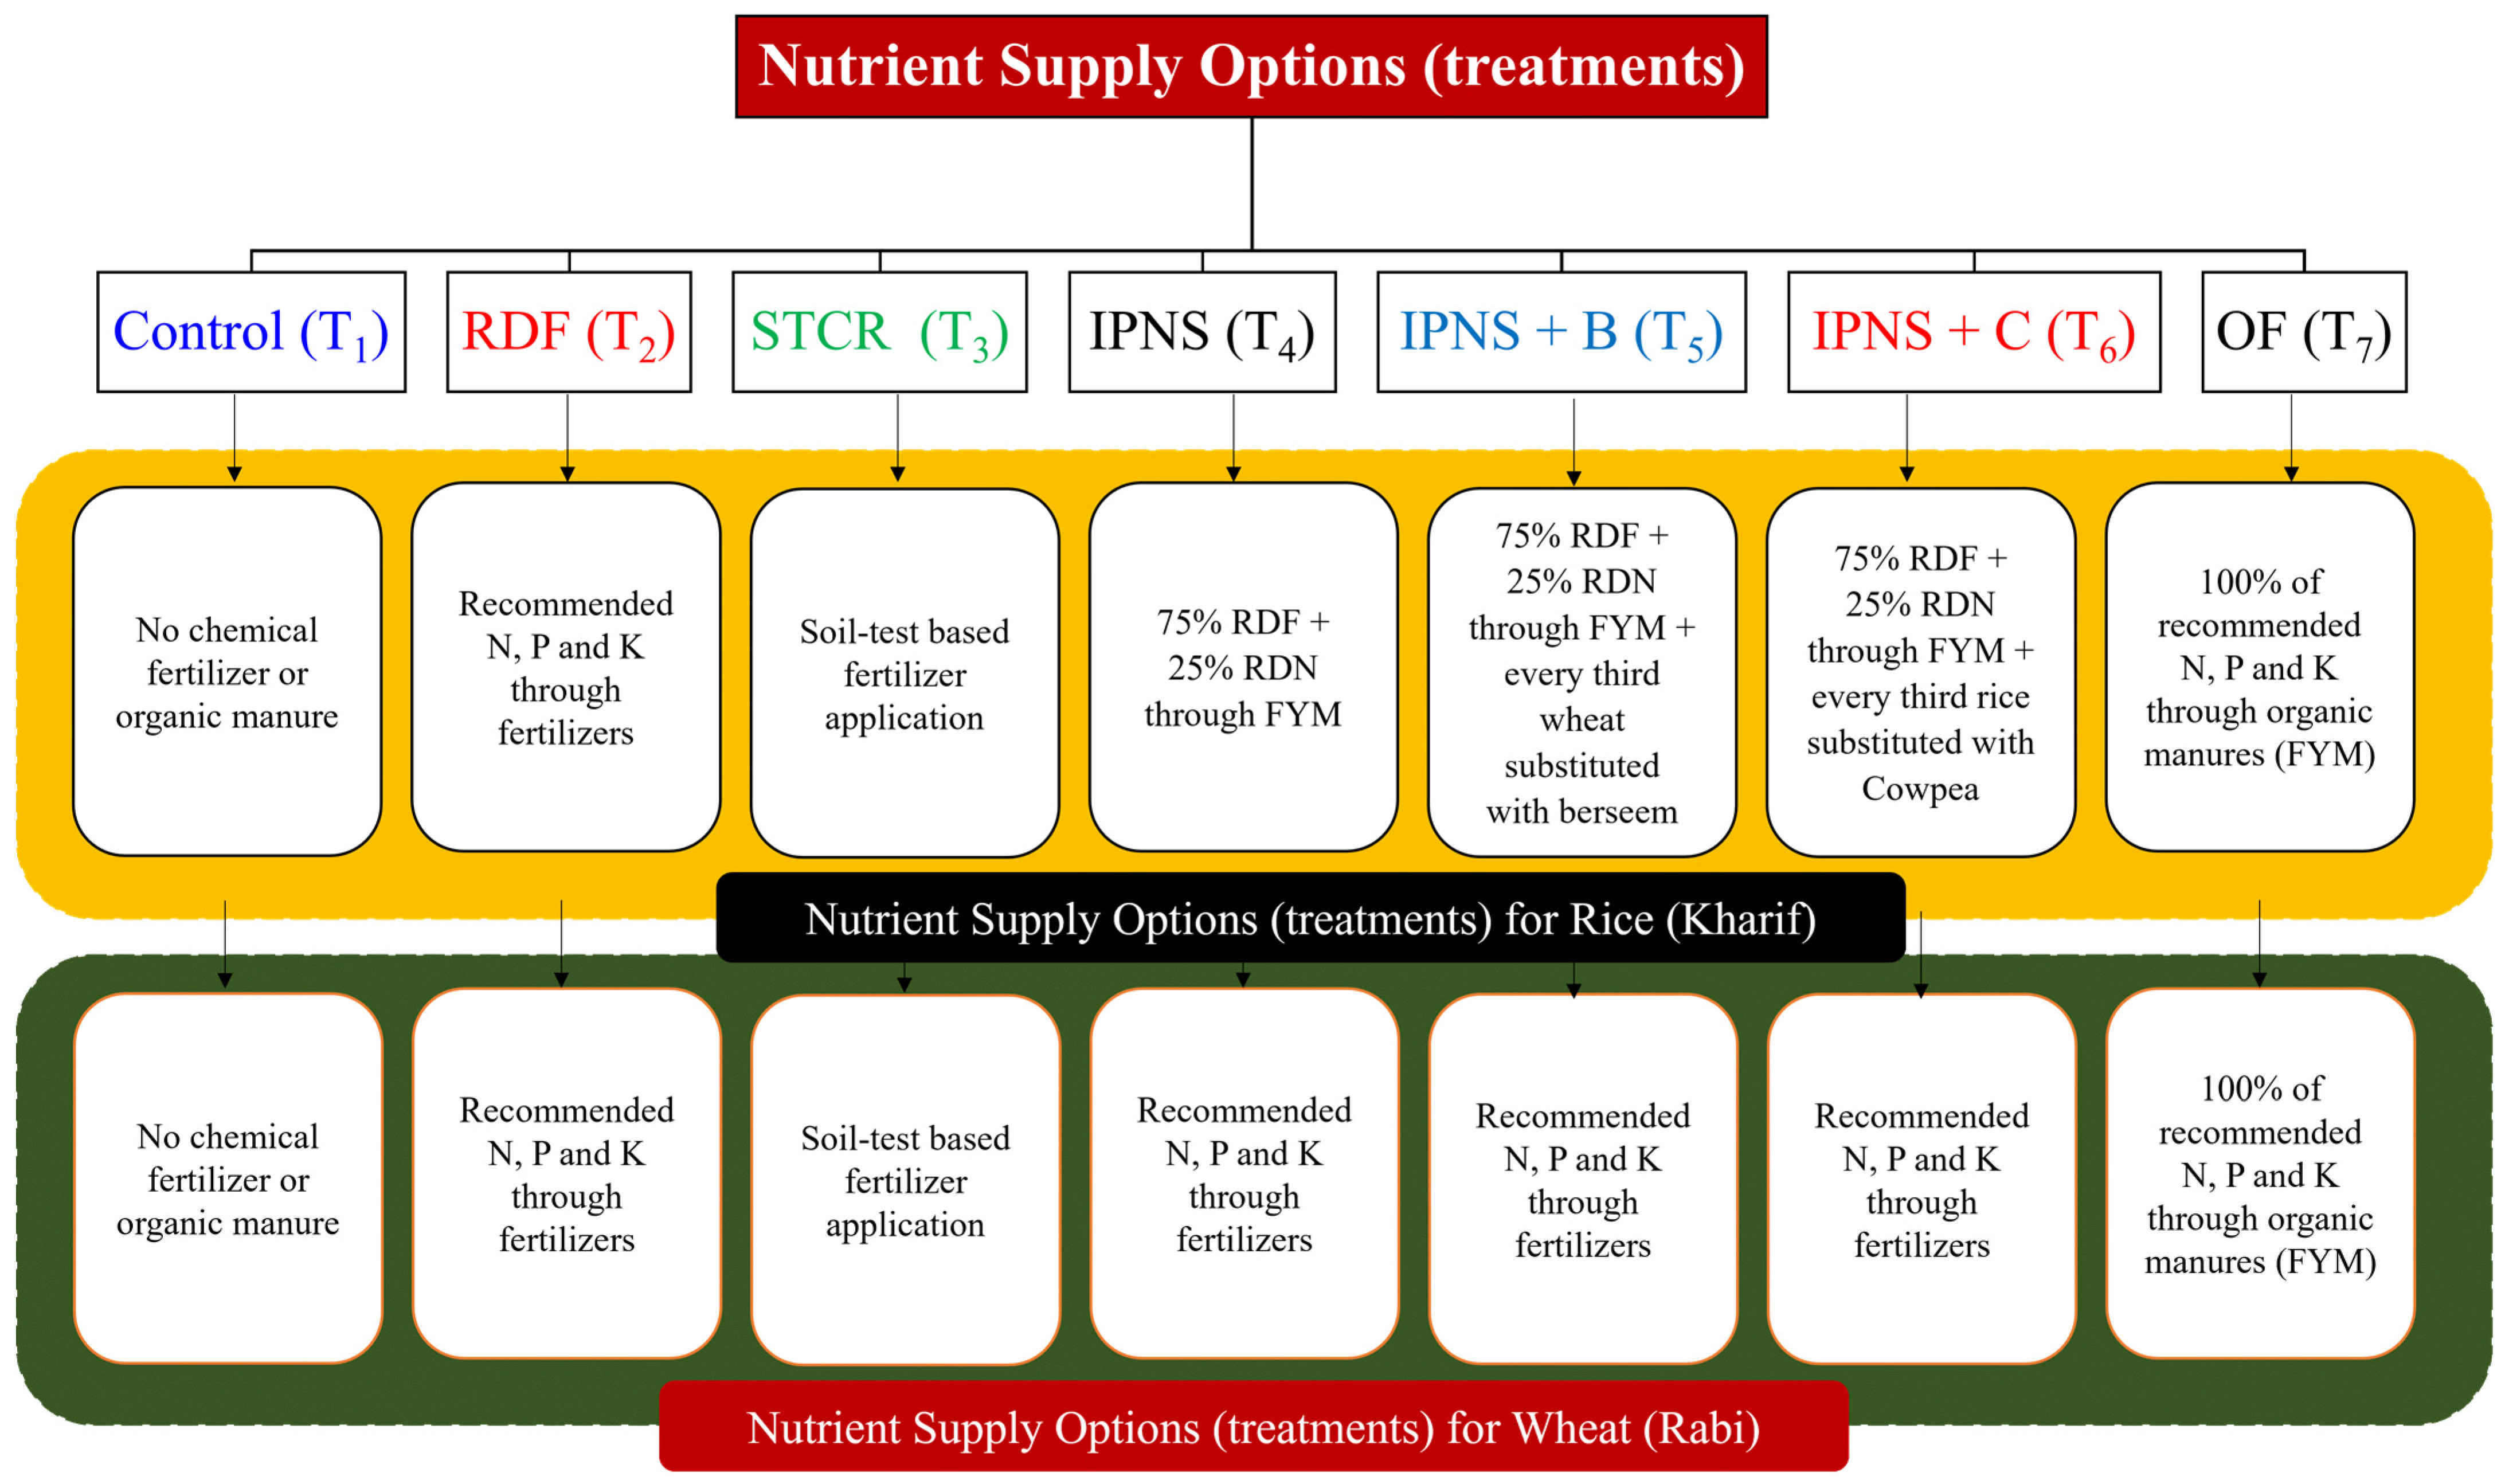
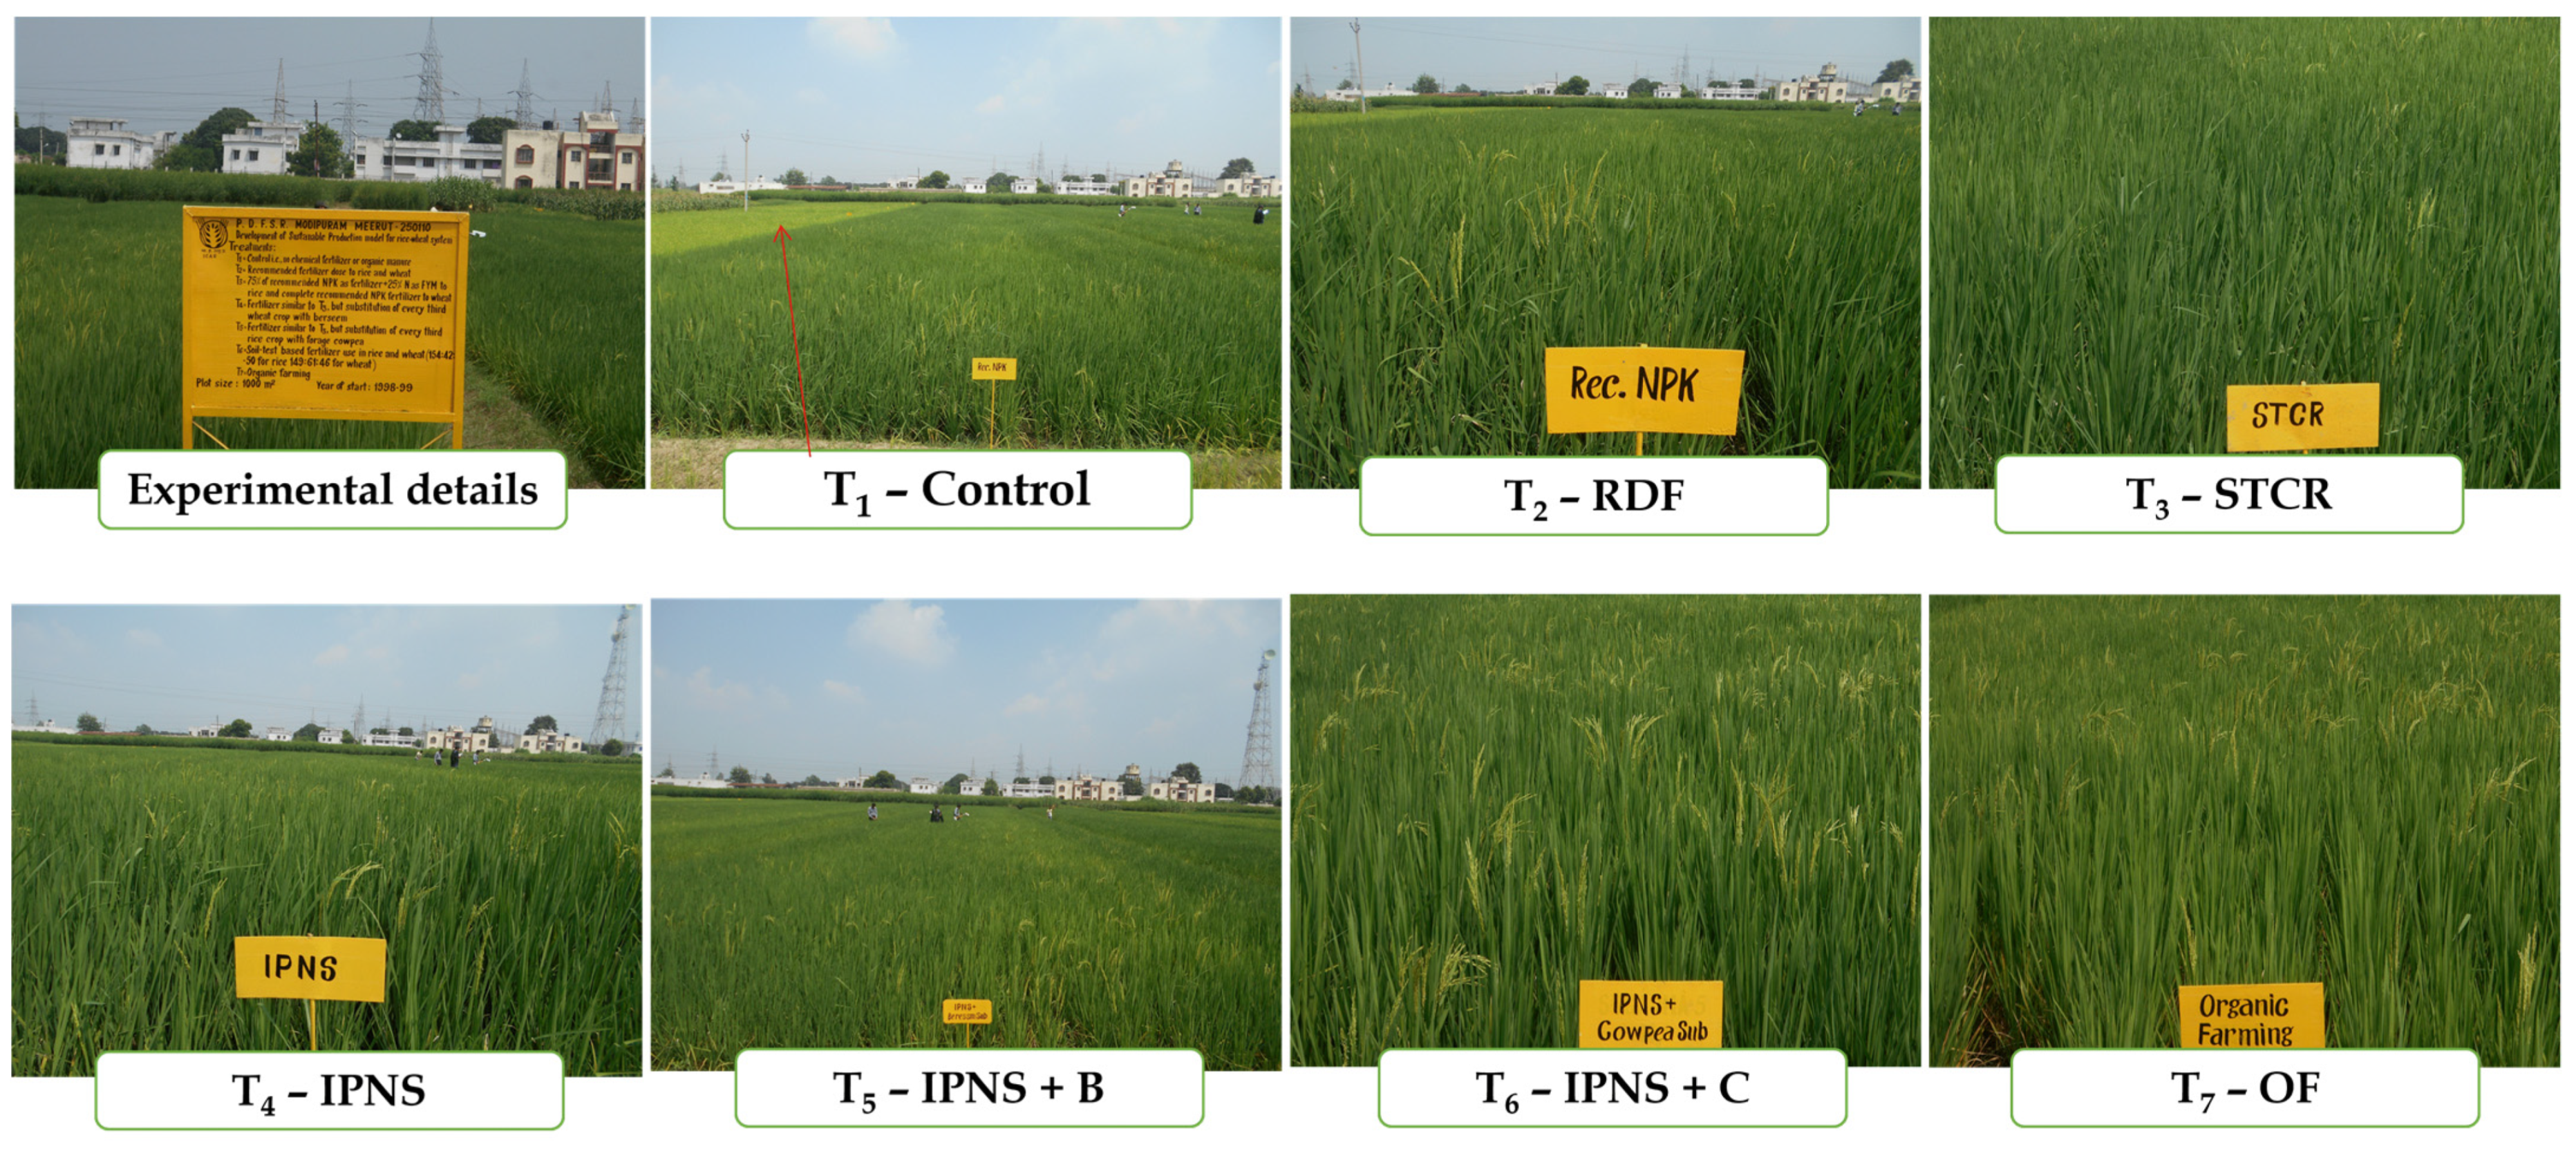
2.3. Treatments and Experimental Design

The long-term cropping system experiment at an involving different nutrient supply options under rice-wheat rotation (Figure 1). The experiment was conducted in large plots (individual plot area 1000 m2). All treatments were Randomized Block Design (RBD) and four replications. Treatments for a total of seven nutrient supply options were used in the long-term cropping system experiment as T1: control i.e., no chemical fertilizer or organic manure; T2: recommended fertilizer dose to rice and wheat; T3: soil-test based fertilizer application in both crops; T4: 75% of recommended N, P, and K through fertilizers +25% substitution of recommended N through FYM in rice and RDF in wheat crop; T5: 75% of recommended N, P, and K through fertilizers + 25% substitution of recommended N through FYM + every third wheat substituted with berseem for rice and RDF for wheat crop; T6: 75% of recommended N, P, and K through fertilizers + 25% substitution of recommended N through FYM + every third rice substituted with cowpea for rice and RDF for wheat crop; and T7: 100% of recommended N, P, and K through organic manures (FYM) in both crops. Experimental photographs during Kharif season (Figure 2).

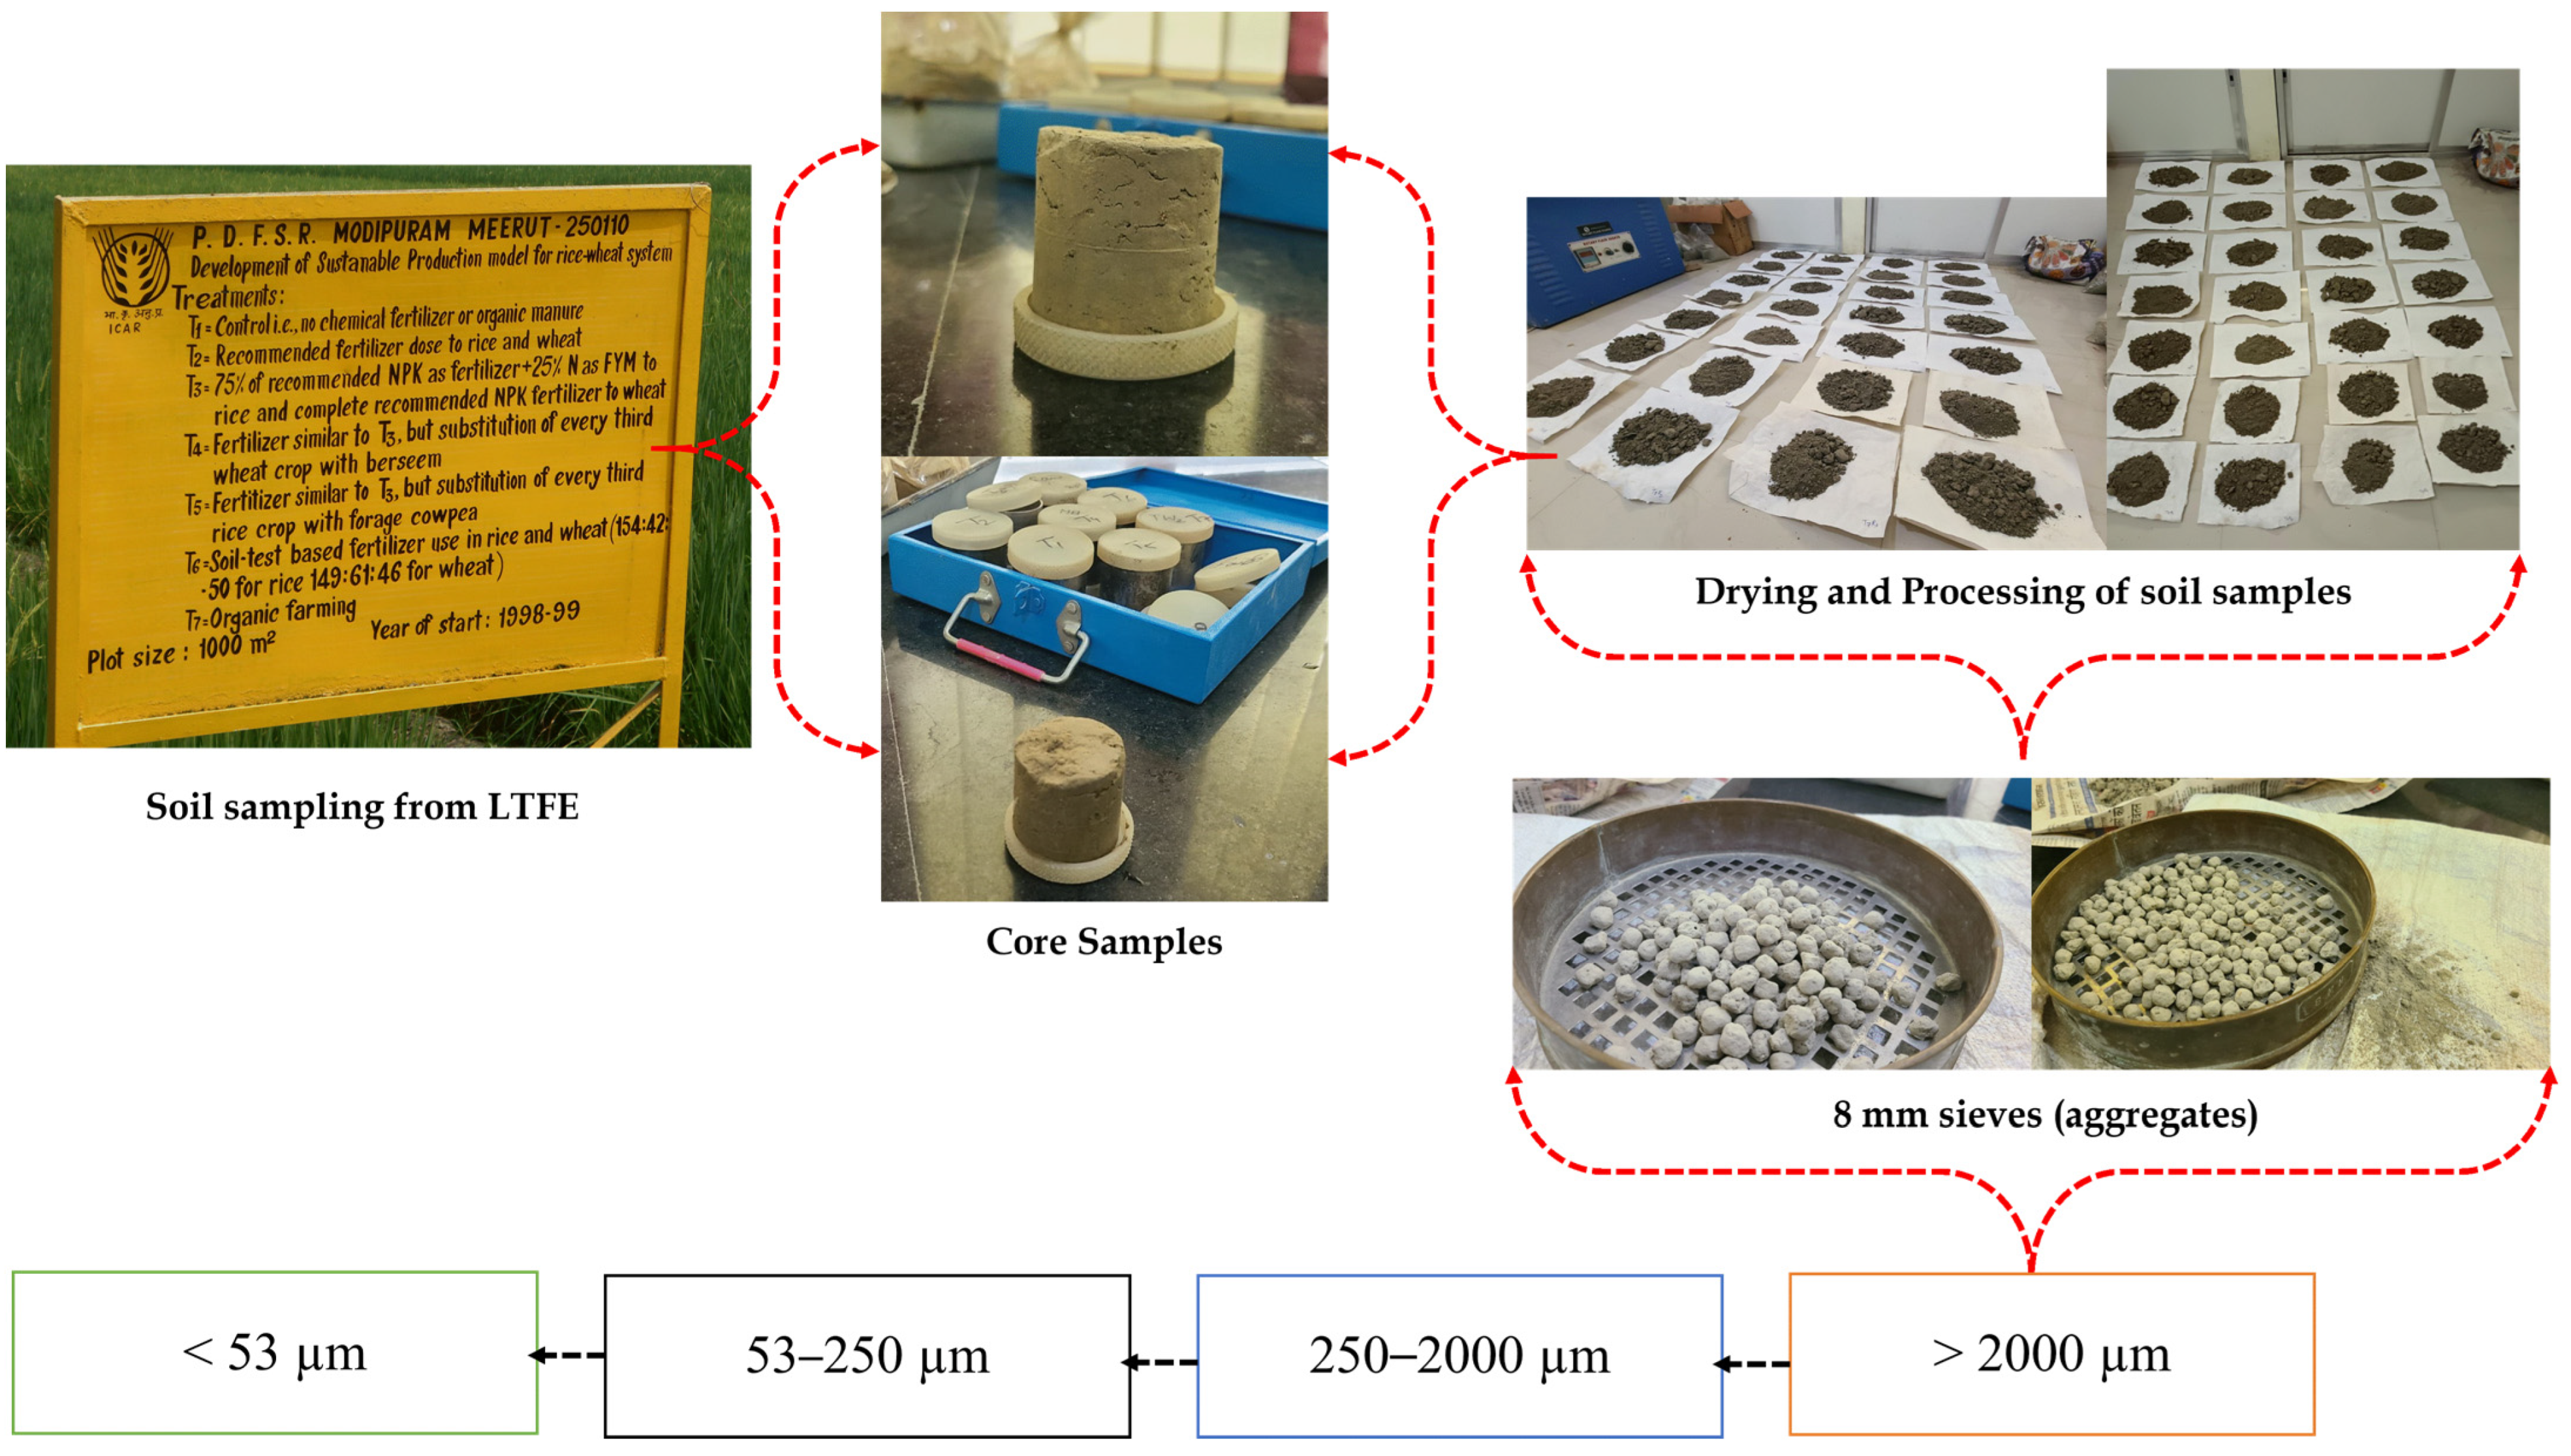
2.4. Collection and Processing of Soil Samples

After the completion of 19 cropping cycles at ICAR-IIFSR, Modipuram, Meerut, four sets of replicated samples of both surface (0–15 cm) and sub-surface (15–30 cm) soil layers were collected from all treatments during May 2017 using a core sampler (with a core of 3.9 cm diameter and 179.2 cm3 volume). The soil samples were collected after 19 cropping cycles of the rice–wheat cropping system were completed. The first set was used to measure soil bulk density. From the second set of undisturbed soil samples, a set of sub-samples was taken for the determination of soil aggregate fractionations (Figure 3).

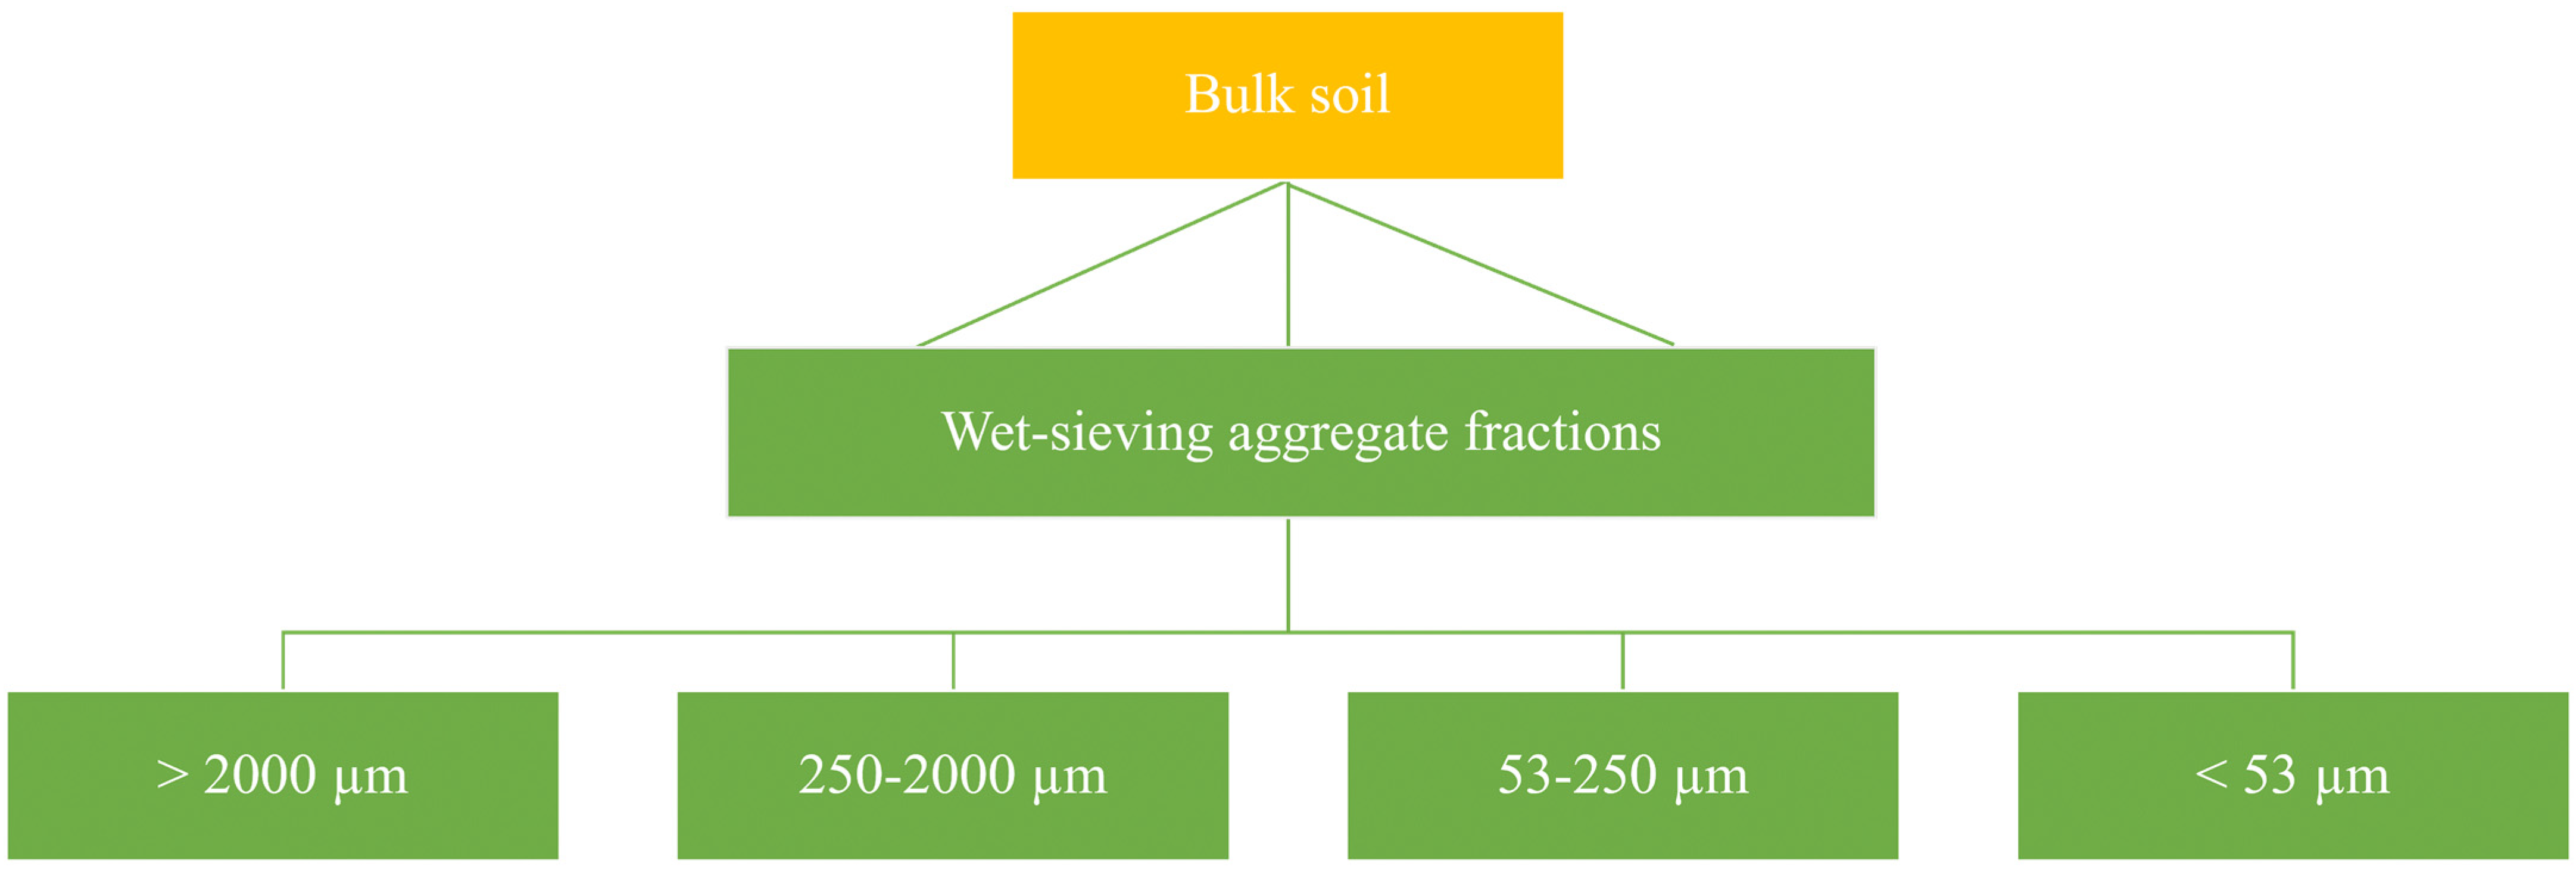
2.5. Soil Aggregate Fractions Separation

Briefly, to obtain four soil fractions, 100 g air dried (4.75-mm sieved) soil sample was placed on the top of a 2-mm sieve (Figure 4). A series of three sieves (2000, 250, and 53 μm) was used to obtain four aggregate fractions: (i) >2000 μm; (ii) 250–2000 μm; (iii) 53–250 μm; (iv) and <53 μm (silt and clay particles) [27]. Small and large macroaggregates together constitute the macroaggregates. Sieving was done mechanically using a modified Yodar apparatus that moved the sieve up and down 3 cm, 50 times in 2 min to achieve aggregate separation [28].

2.6. Mean Weight Diameter (MWD)

Mean weight diameter (MWD) was calculated using the procedure given by Van Bavel [29] where four aggregate fractions {>2000 μm, 250–2000 μm, 53–250 μm, and <53 μm (silt and clay particles)} were considered.
M W D = i = 1 n x ¯ i i = 1 n w i
  • x ¯ i —Mean diameter of different sizes of aggregates.
  • w i —Proportion of different sizes of aggregates to total weight of aggregate

2.7. Data Analyses

The produced data was treated for analysis of variance (ANOVA) and Duncan’s multiple range test (DMRT) p < 0.05 [30] was performed to test statistical differences in soil aggregation fractions (i) >2000 μm; (ii) 250–2000 μm; (iii) 53–250 μm; (iv) and <53 μm, macroaggregate, microaggregate, and mean weight diameter between different treatment combinations and soil depth. To check the data normality, Shapiro–Wilks test were performed. The relationship among macroaggregate, microaggregate, and mean weight diameter of both soil layers were described by linear regression functions.

3. Results

3.1. Aggregate-Size (>2000 µm) Distribution

Data indicated that the significant differences in aggregate size fractions were found across the different nutrient management practices and soil depths of rice–wheat cropping systems (Table 2 and Table 3). Organic farming (OF) treatment contained larger >2000 µm (20.79 and 13.68 g 100 g−1 dry soil) followed by the IPNS + C (16.61 and 12.48 g 100 g−1 dry soil), it was on par with IPNS + B (16.08 and 12.54 g 100 g−1 dry soil), although the differences in the IPNS/STCR and NPK/unfertilized control were not statistically significant in the 0–15 and 15–30 cm soil depth, respectively. This increase in the >2000 µm might be due to higher organic carbon concentration in OF options, in which recommended doses of nutrients were applied through FYM in both cropping seasons (Table 2 and Table 3).

3.2. Aggregate-Size (250–2000 µm) Distribution

Results observed that the 250–2000 µm fraction of aggregation was significantly higher under OF (39.33 g 100 g−1 dry soil) management followed by the IPNS + C (37.86 g 100 g−1 dry soil), IPNS + B (37.54 g 100 g−1 dry soil), IPNS (36.47 g 100 g−1 dry soil), STCR (33.76 g 100 g−1 dry soil), NPK (32.85 g 100 g−1 dry soil), and the lowest values were found in the control (31.77 g 100 g−1 dry soil) plot in surface (0–15 cm) soil. A similar trend was also observed in the subsurface (15–30 cm) soil (Table 2 and Table 3).

3.3. Aggregate-Size (53–250 µm) Distribution

Table 2 and Table 3 showed that significantly higher soil aggregation distributions (53–250 µm) were observed under NPK and unfertilized plot, followed by STCR/IPNS and IPNS + C/IPNS + B; on the other hand, the lowest value of 53–250 µm fraction of soil aggregation was observed with OF management in both soil depth in both soil layer. At 0–15 cm soil depth, the highest 53–250 µm fractions were observed in control (47.99 g 100 g−1 dry soil) and NPK (46.05 g 100 g−1 dry soil), which was on par with control and STCR and IPNS (41.77 and 38.47 g 100 g−1 dry soil), respectively. In contrast, the significantly lowest values were recorded for the OF option (25.20 g 100 g−1 dry soil). However, in the case of 15–30 cm soil layer, 53–250 µm fractions sizes were reported in the following order: control > NPK ≥ STCR > IPNS > IPNS ≥ IPNS + B ≥ IPNS + C ≥ OF under different nutrient supply options.

3.4. Aggregate-Size (<53 µm) Distribution

A significantly higher <53 µm size fraction was found in OF (14.67 g 100 g−1 dry soil); it was on par with IPNS + C (13.56 g 100 g−1 dry soil), followed by IPNS + B (12.96 g 100 g−1 dry soil), IPNS (10.88 g 100 g−1 dry soil), STCR (10.43 g 100 g−1 dry soil), NPK (7.79 g 100 g−1 dry soil), and control (7.72 g 100 g−1 dry soil) treatment in 0–15 cm soil depth. In the case of subsurface soil, results were observed in the following order: IPNS + B > IPNS > IPNS + C > STCR > OF > NPK, and control treatment (Table 2 and Table 3). In contrast to the other sizes of soil aggregation, the significantly highest <53 µm were found for OF options followed by the IPNS options, and the lowest were found for the control and NPK options.

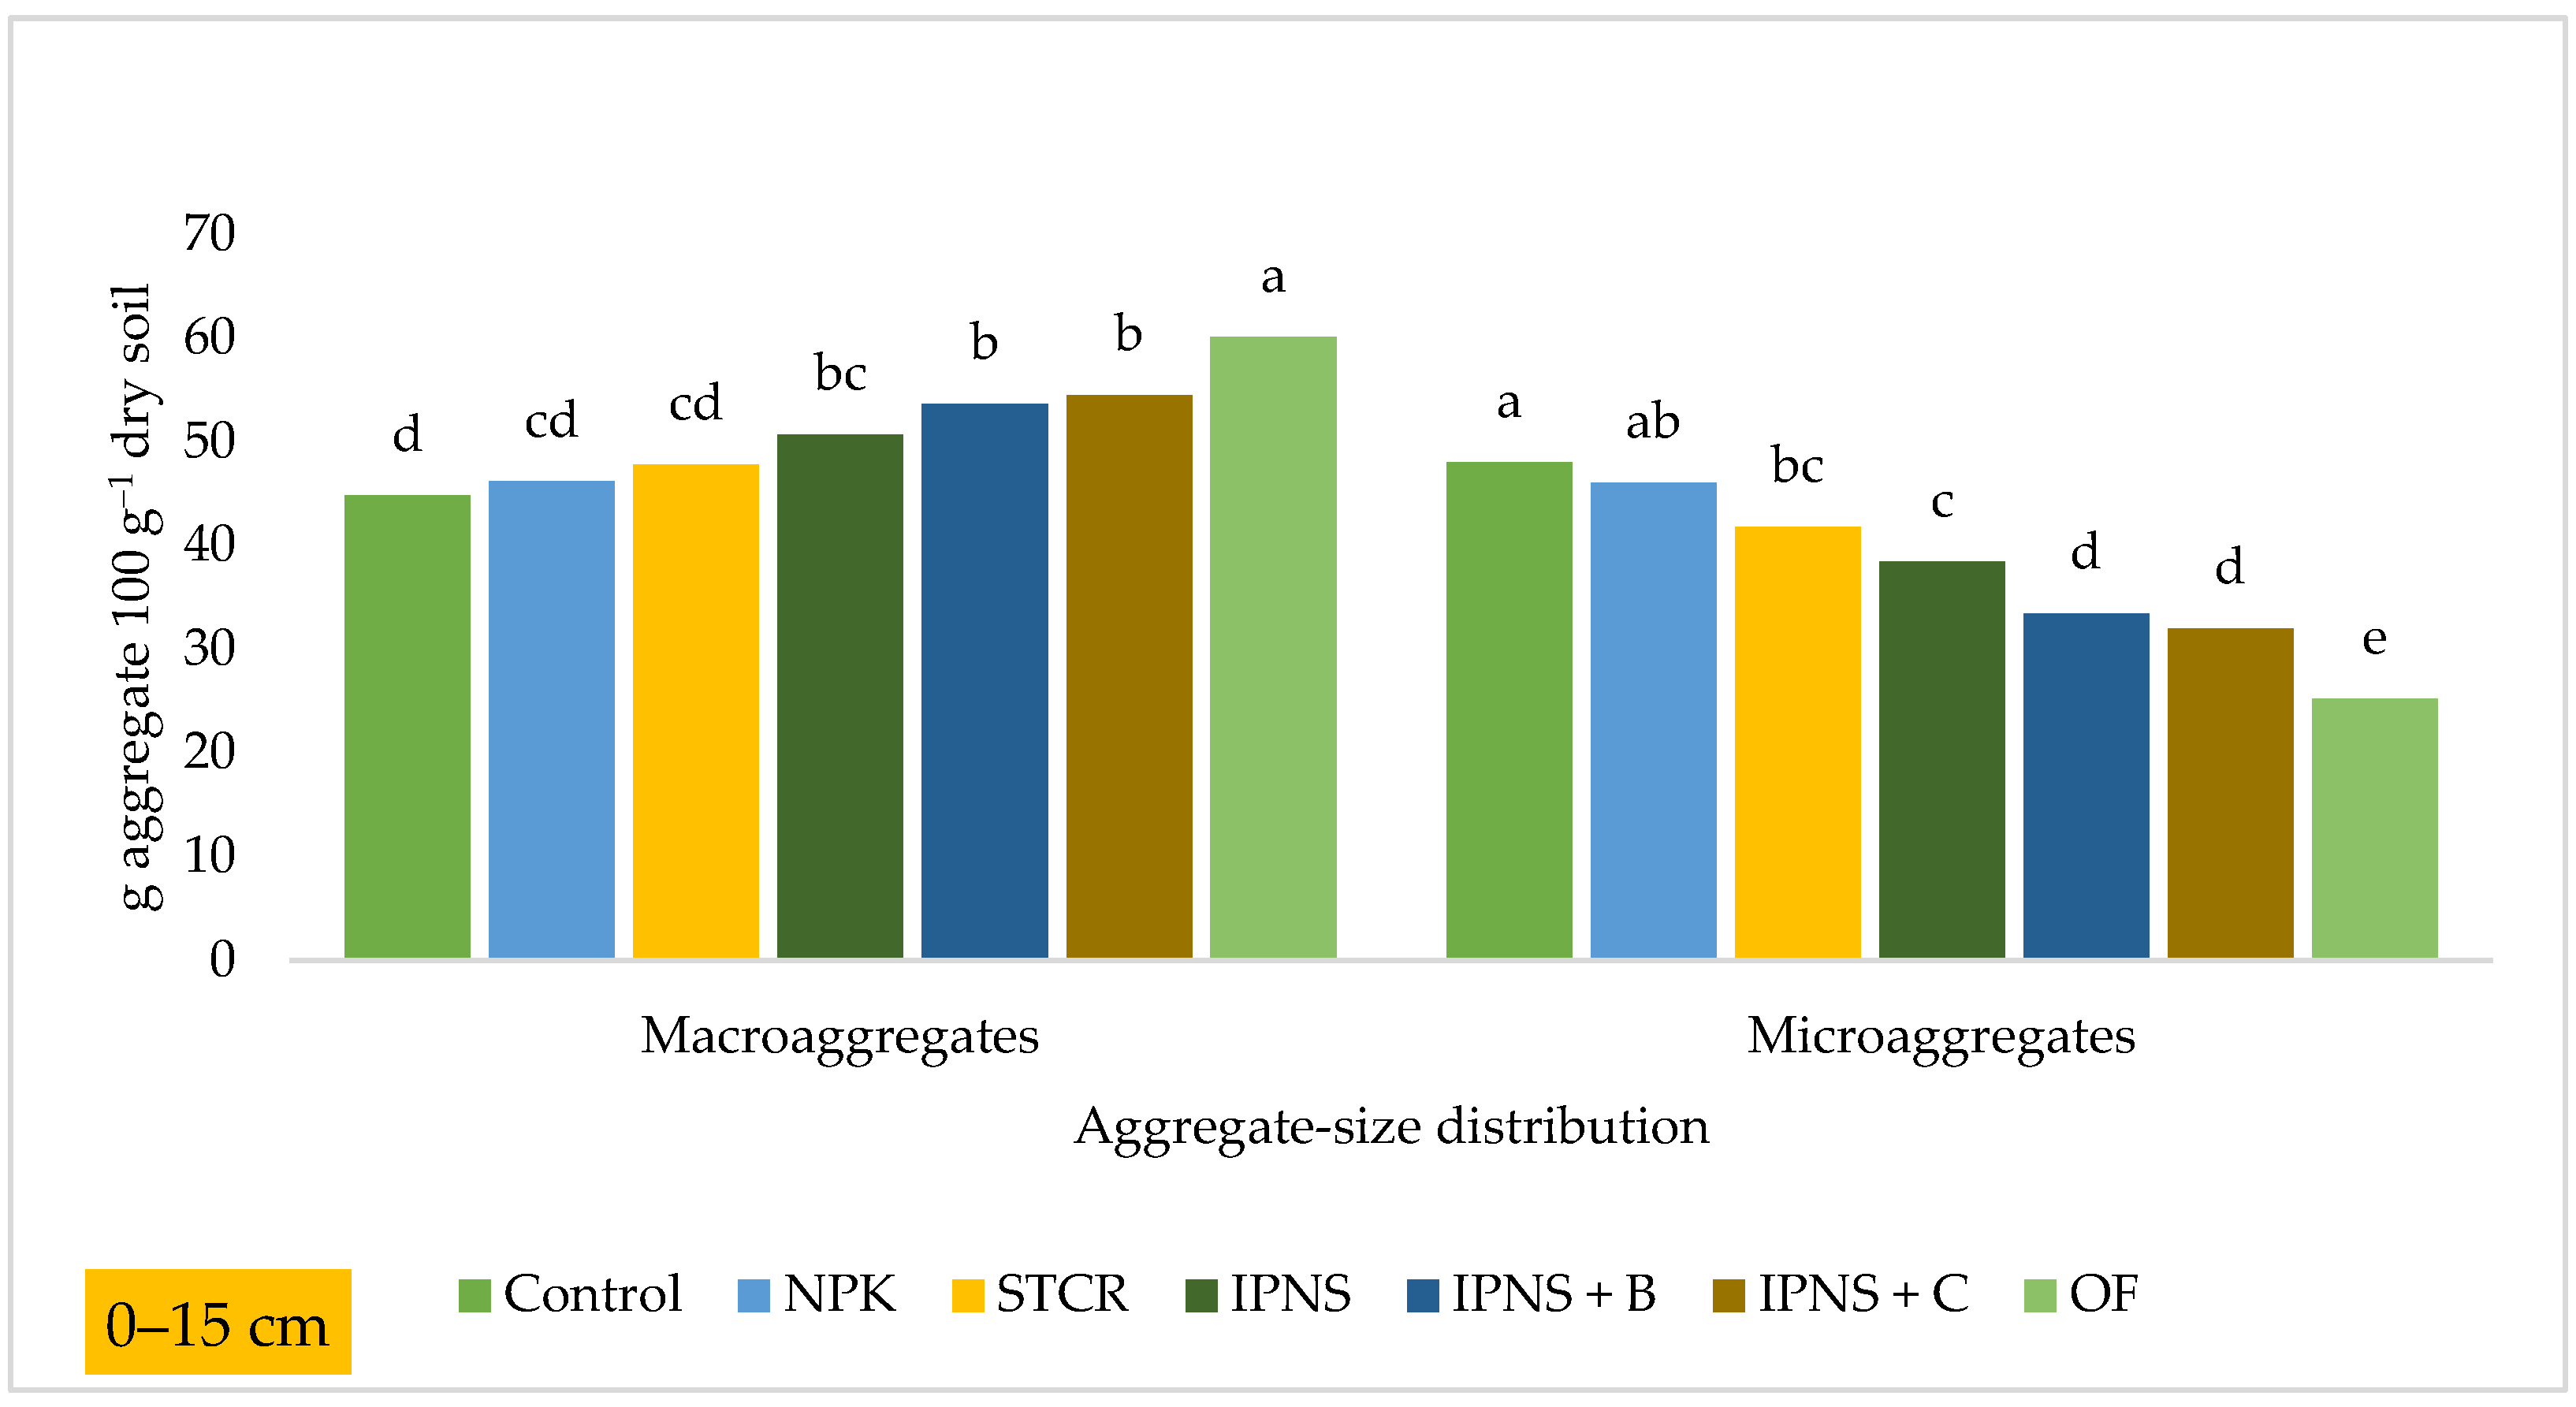
3.5. Macroaggregates Distribution

Data revealed that both (macro and micro) aggregates significantly varied among the different nutrient management practices in both soil depths over the periods (Figure 5 and Figure 6). Macroaggregates significantly varied from 44.79 to 60.12 and 49.50 to 61.34 g 100 g−1 dry soil in the surface and subsurface soil layers, respectively. Macroaggregates accounted for ~31% of the total aggregates and were more dominant in the surface soil layer than the subsurface soil layer. Maximum macroaggregates were observed under OF (60.12 g 100 g−1 dry soil) management practices followed by IPNS + C (54.47 g 100 g−1 dry soil), IPNS + B (53.62 g 100 g−1 dry soil), IPNS (50.66 g 100 g−1 dry soil), STCR (49.49 g 100 g−1 dry soil), and NPK (46.16 g 100 g−1 dry soil), and lower values (44.79 g 100 g−1 dry soil) were reported for the unfertilized control plot. Having said that, the results of macroaggregates fractions under 15–30 cm soil depth were reported in the following order: OF > IPNS + C > IPNS + B > IPNS > STCR > NPK, and the lowest values were found for the unfertilized control plot (Figure 5).
In macroaggregates, OF (60.12 and 61.34 g 100 g−1 dry soil) and IPNS + C (54.47 and 59.47 g−1 dry soil) had significantly larger aggregate fractions than NPK (46.16 and 51.82 g 100 g−1 dry soil) and unfertilized control (44.79 and 49.50 g 100 g−1 dry soil) treatment in 0–15 and 15–30 cm soil depths, respectively.

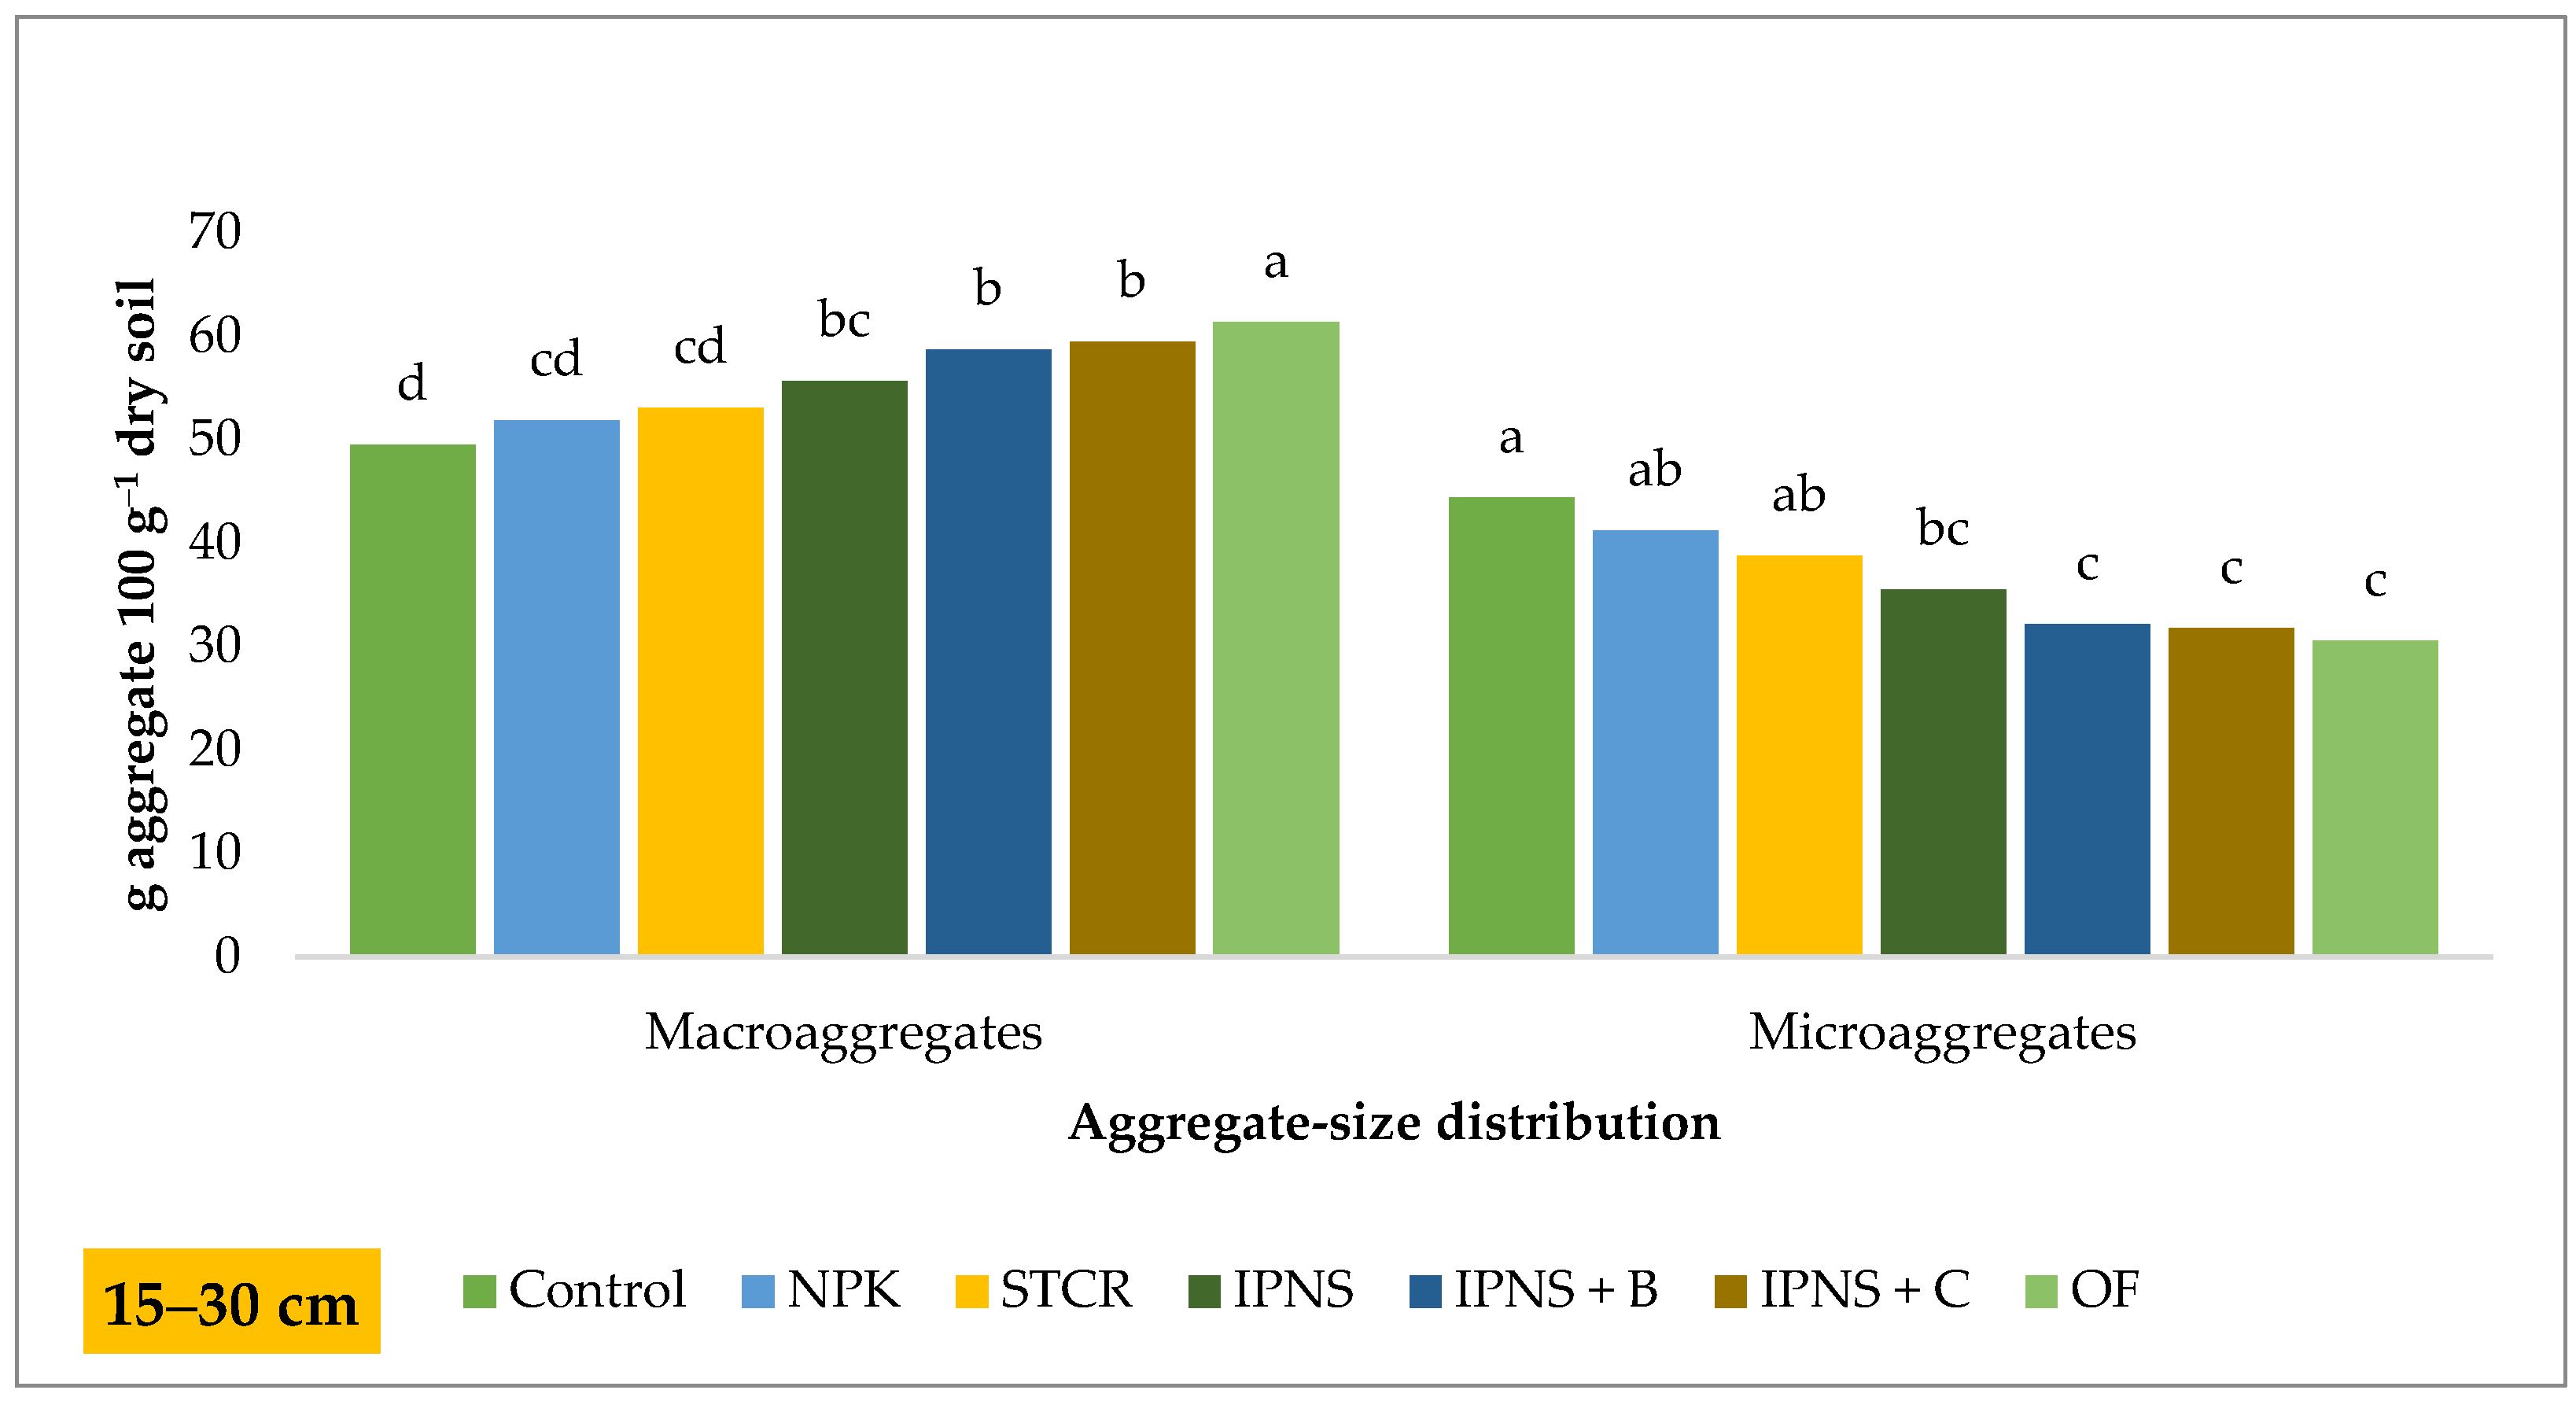
3.6. Microaggregates Distribution

The results of microaggregates varied from 25.20 to 47.99 and 30.57 to 44.39 g 100 g−1 dry soil in 0–15 and 15–30 cm soil depth, respectively. Significantly highest (47.99 g 100 g−1 dry soil) values were reported for the unfertilized control plot; this was on par with the NPK-treated (46.05 g 100 g−1 dry soil) plot, followed by the STCR (41.77 g 100 g−1 dry soil), IPNS (38.47 g 100 g−1 dry soil), IPNS + B (33.42 g 100 g−1 dry soil), and IPNS + C (31.97 g 100 g−1 dry soil), and the lowest (25.20 g 100 g−1 dry soil) values were reported for OF management practices in 0–15 cm soil depth. Similar trends were also reported in subsurface soil of the rice–wheat cropping system over the periods (Figure 6).
In contrast to what was observed for large and small macroaggregates, NPK (46.05 and 41.19 g 100 g−1 dry soil) and unfertilized control (47.99 and 44.39 g 100 g−1 dry soil) had a significantly higher quantity of microaggregates than OF (25.20 and 30.57 g 100 g−1 dry soil) and IPNS + C (31.97 and 31.78 g 100 g−1 dry soil) in 0–15 and 15–30 cm soil depth, respectively.

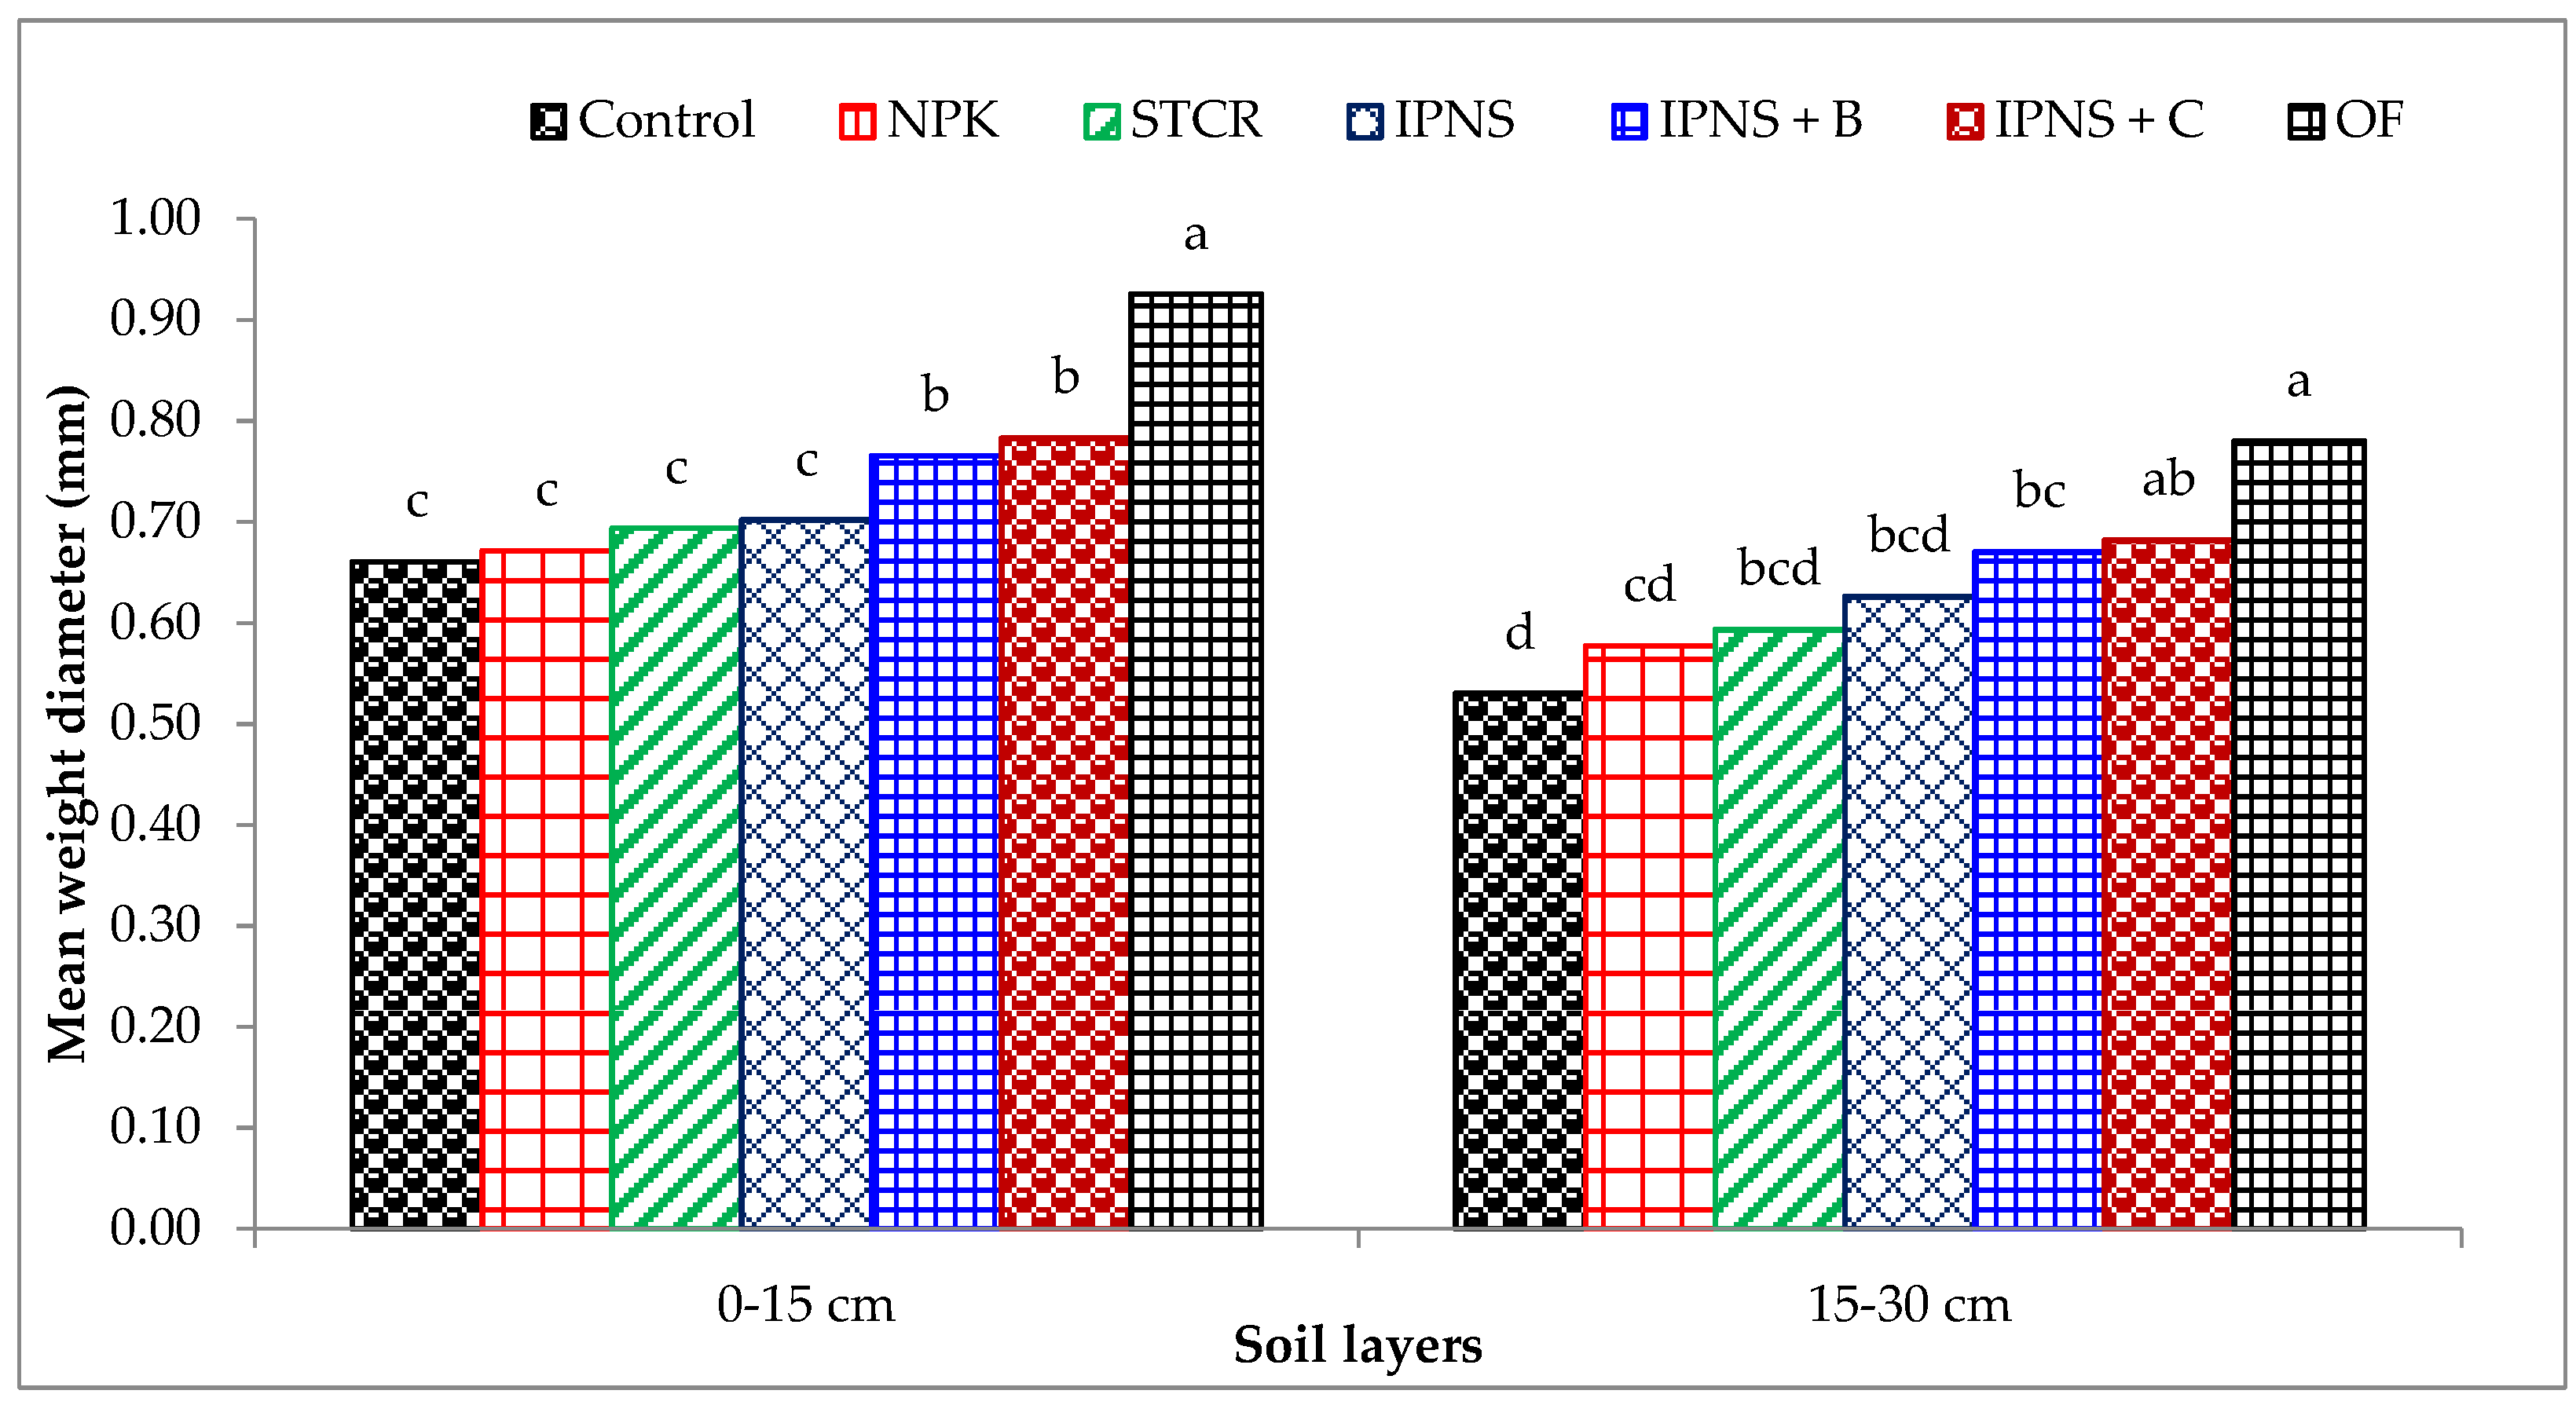
3.7. Mean Weight Diameter (MWD)

Mean weight diameter (MWD) was estimated as measures of soil aggregate stability, and it was significantly affected by various nutrient management treatments over the periods (Figure 7). The MWD was significantly increased (+17%) between surface and subsurface soil. The proportion of MWD of the surface soil was significantly increased compared with the subsurface soil. MWD significantly varied from 0.66 to 0.93 and 0.53 to 0.78 mm in the 0–15 and 15–30 cm soil depth, respectively. Maximum MWD was reported for OF (0.93 mm) management practices, followed by the IPNS + C (0.78 mm), IPNS + B (0.77 mm), IPNS (0.70 mm), STCR (0.69 mm), NPK (0.67 mm), and unfertilized control (0.66 mm) plots. Consequently, in 15–30 cm soil depth, the maximum values were observed for OF (0.78 mm), followed by IPNS + C (0.68 mm), IPNS + B (0.67 mm), IPNS (0.63 mm), STCR (0.59 mm), and NPK (0.58 mm), and the significantly lowest (0.53 mm) values were reported for the unfertilized control plot. The plots with OF management showed significant superiority over the rest of the treatment areas; its superiority was ~29% and 32% higher than the control treatment in the 0–15 and 15–30 cm soil depth, respectively (Figure 7).

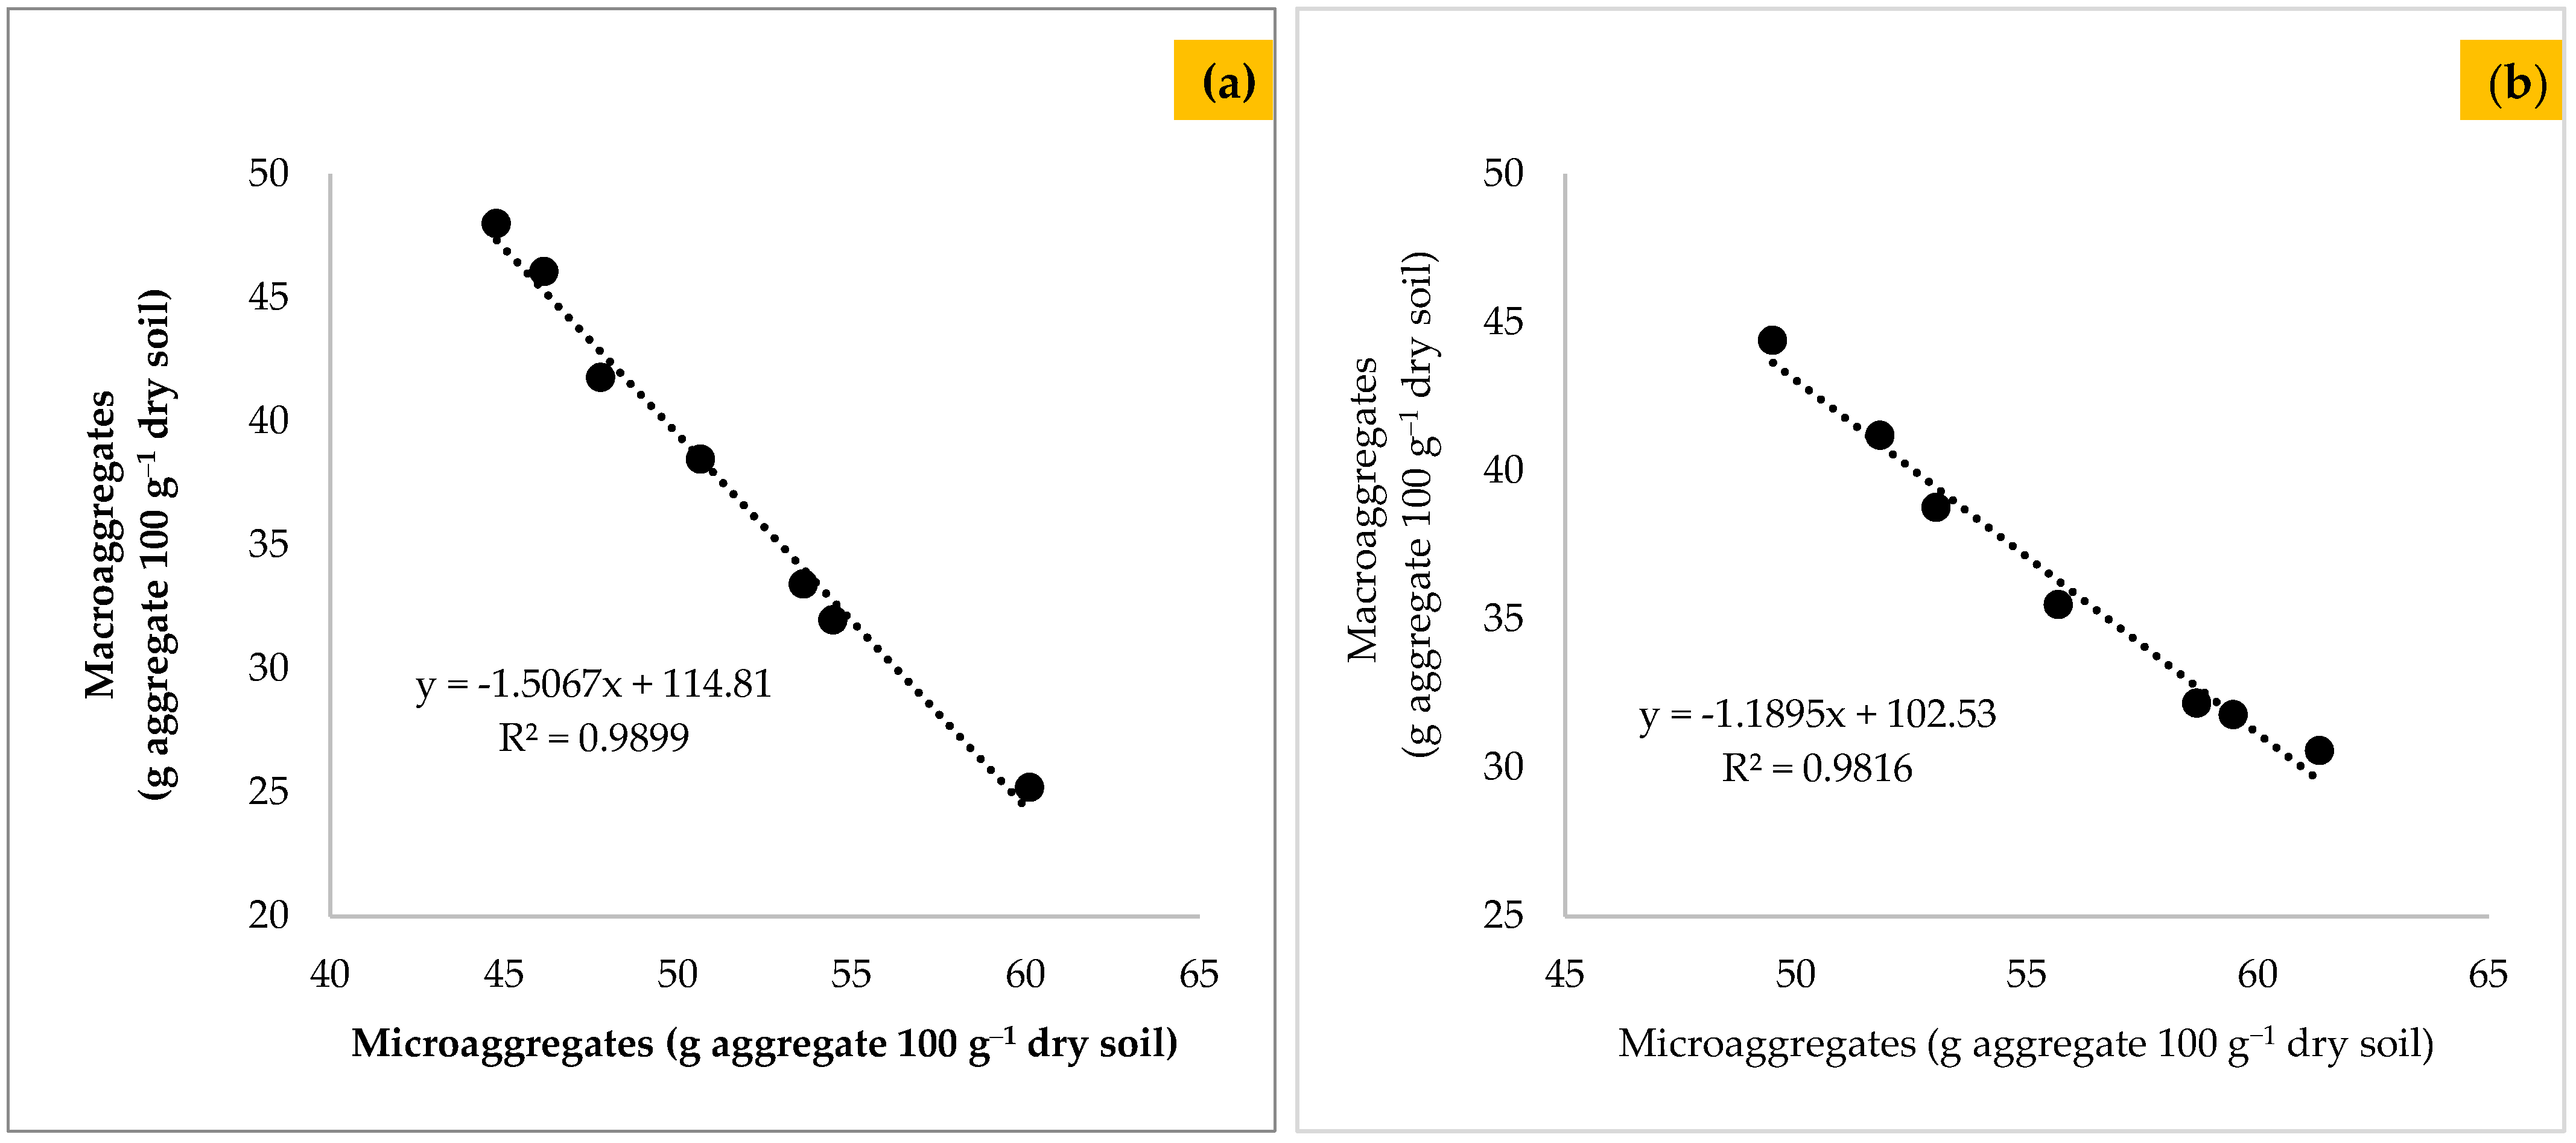
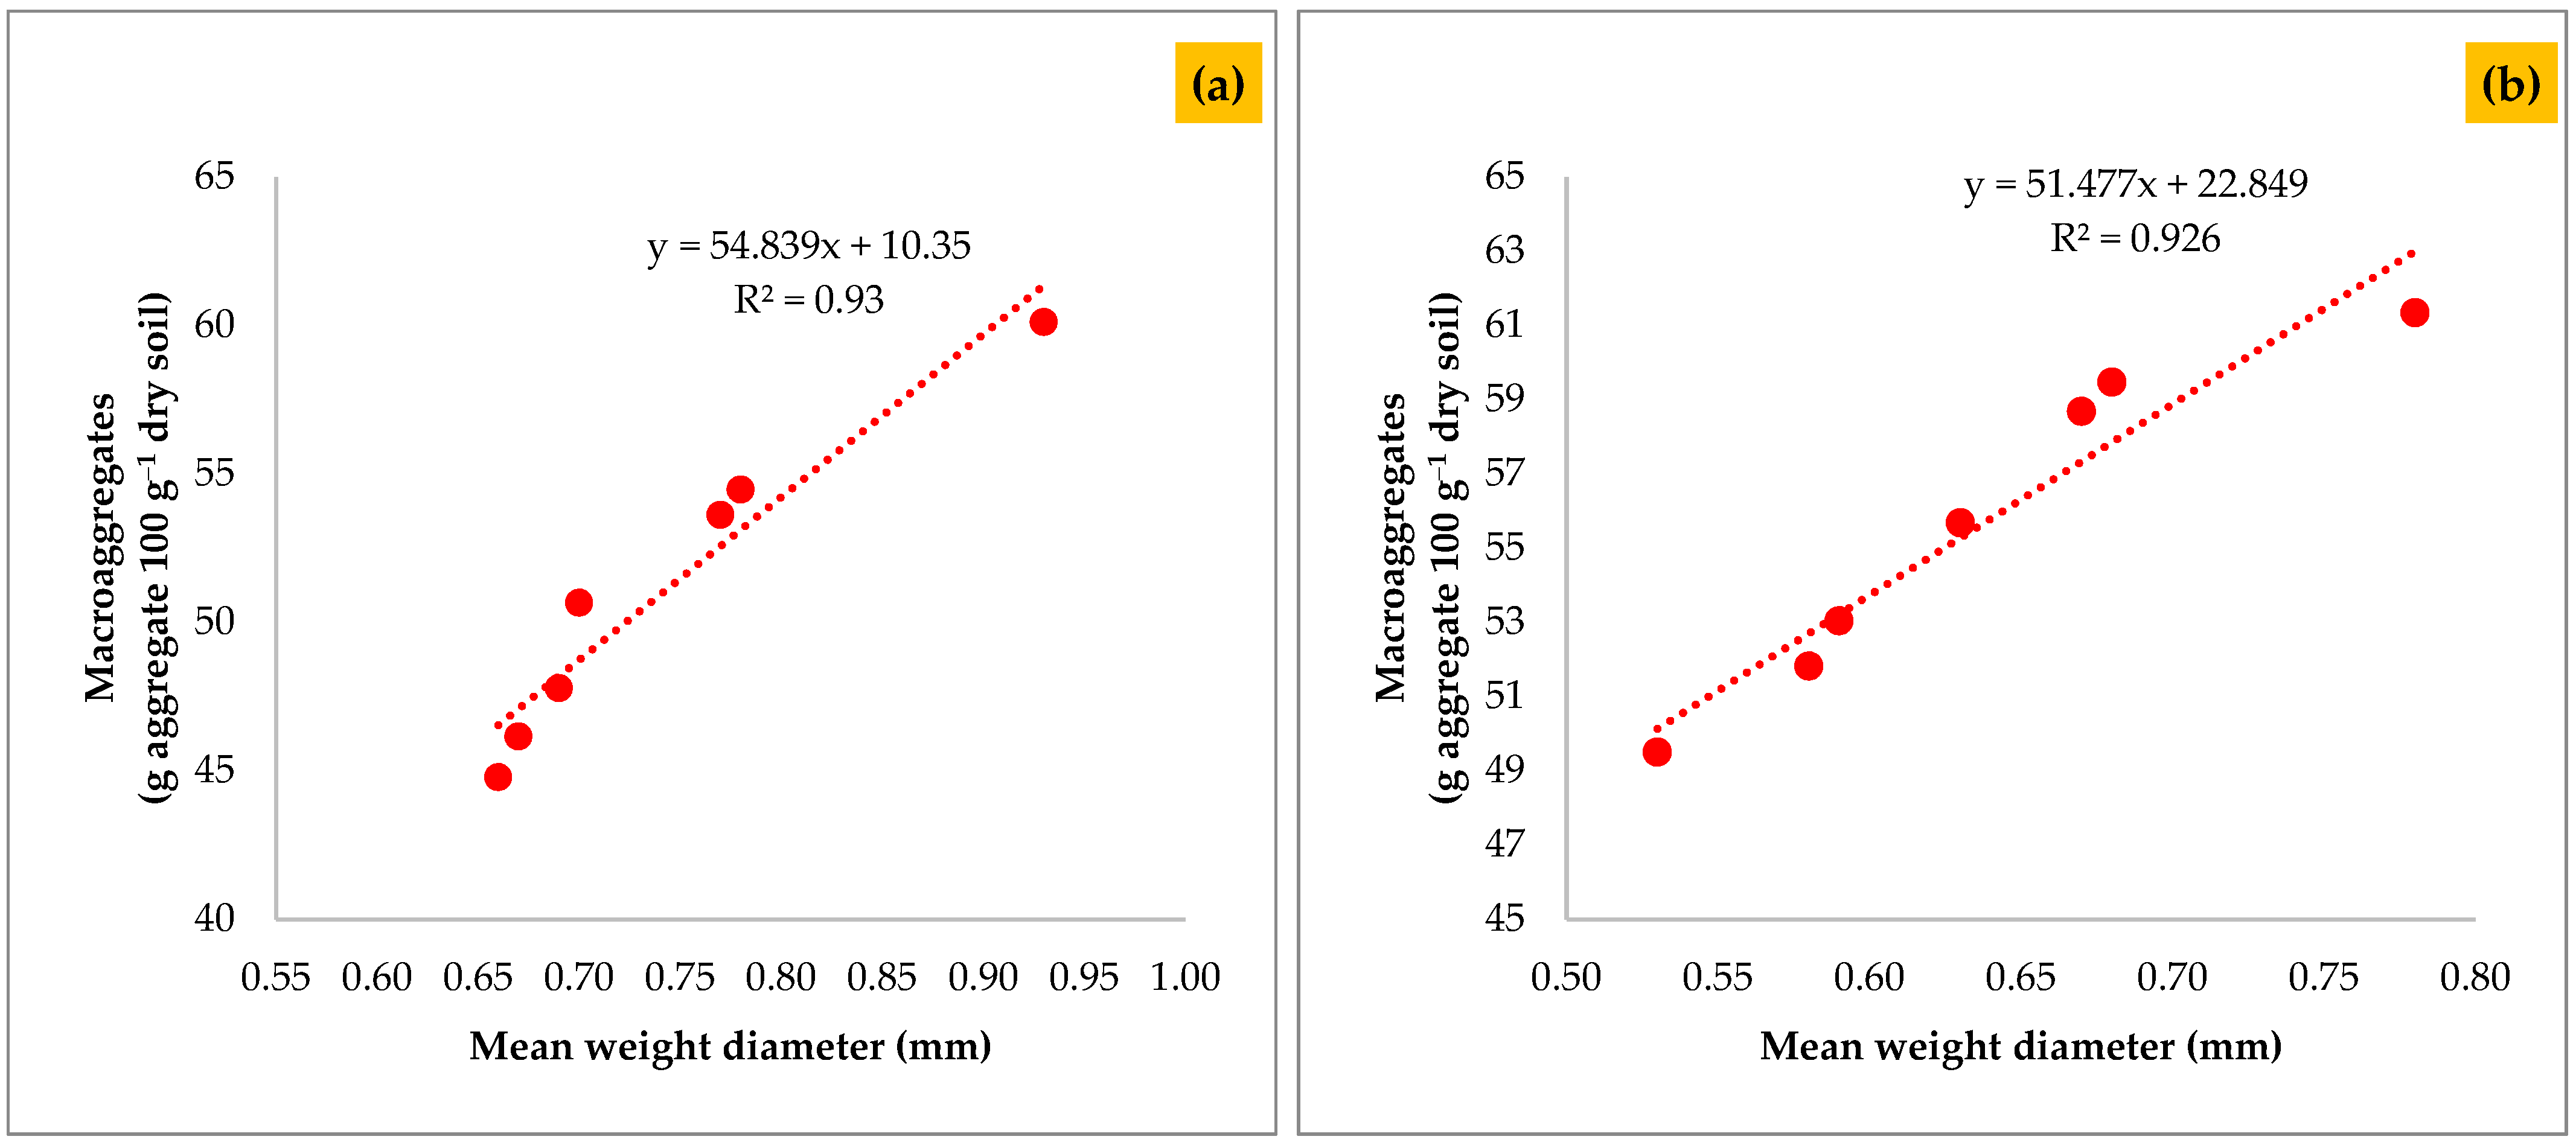
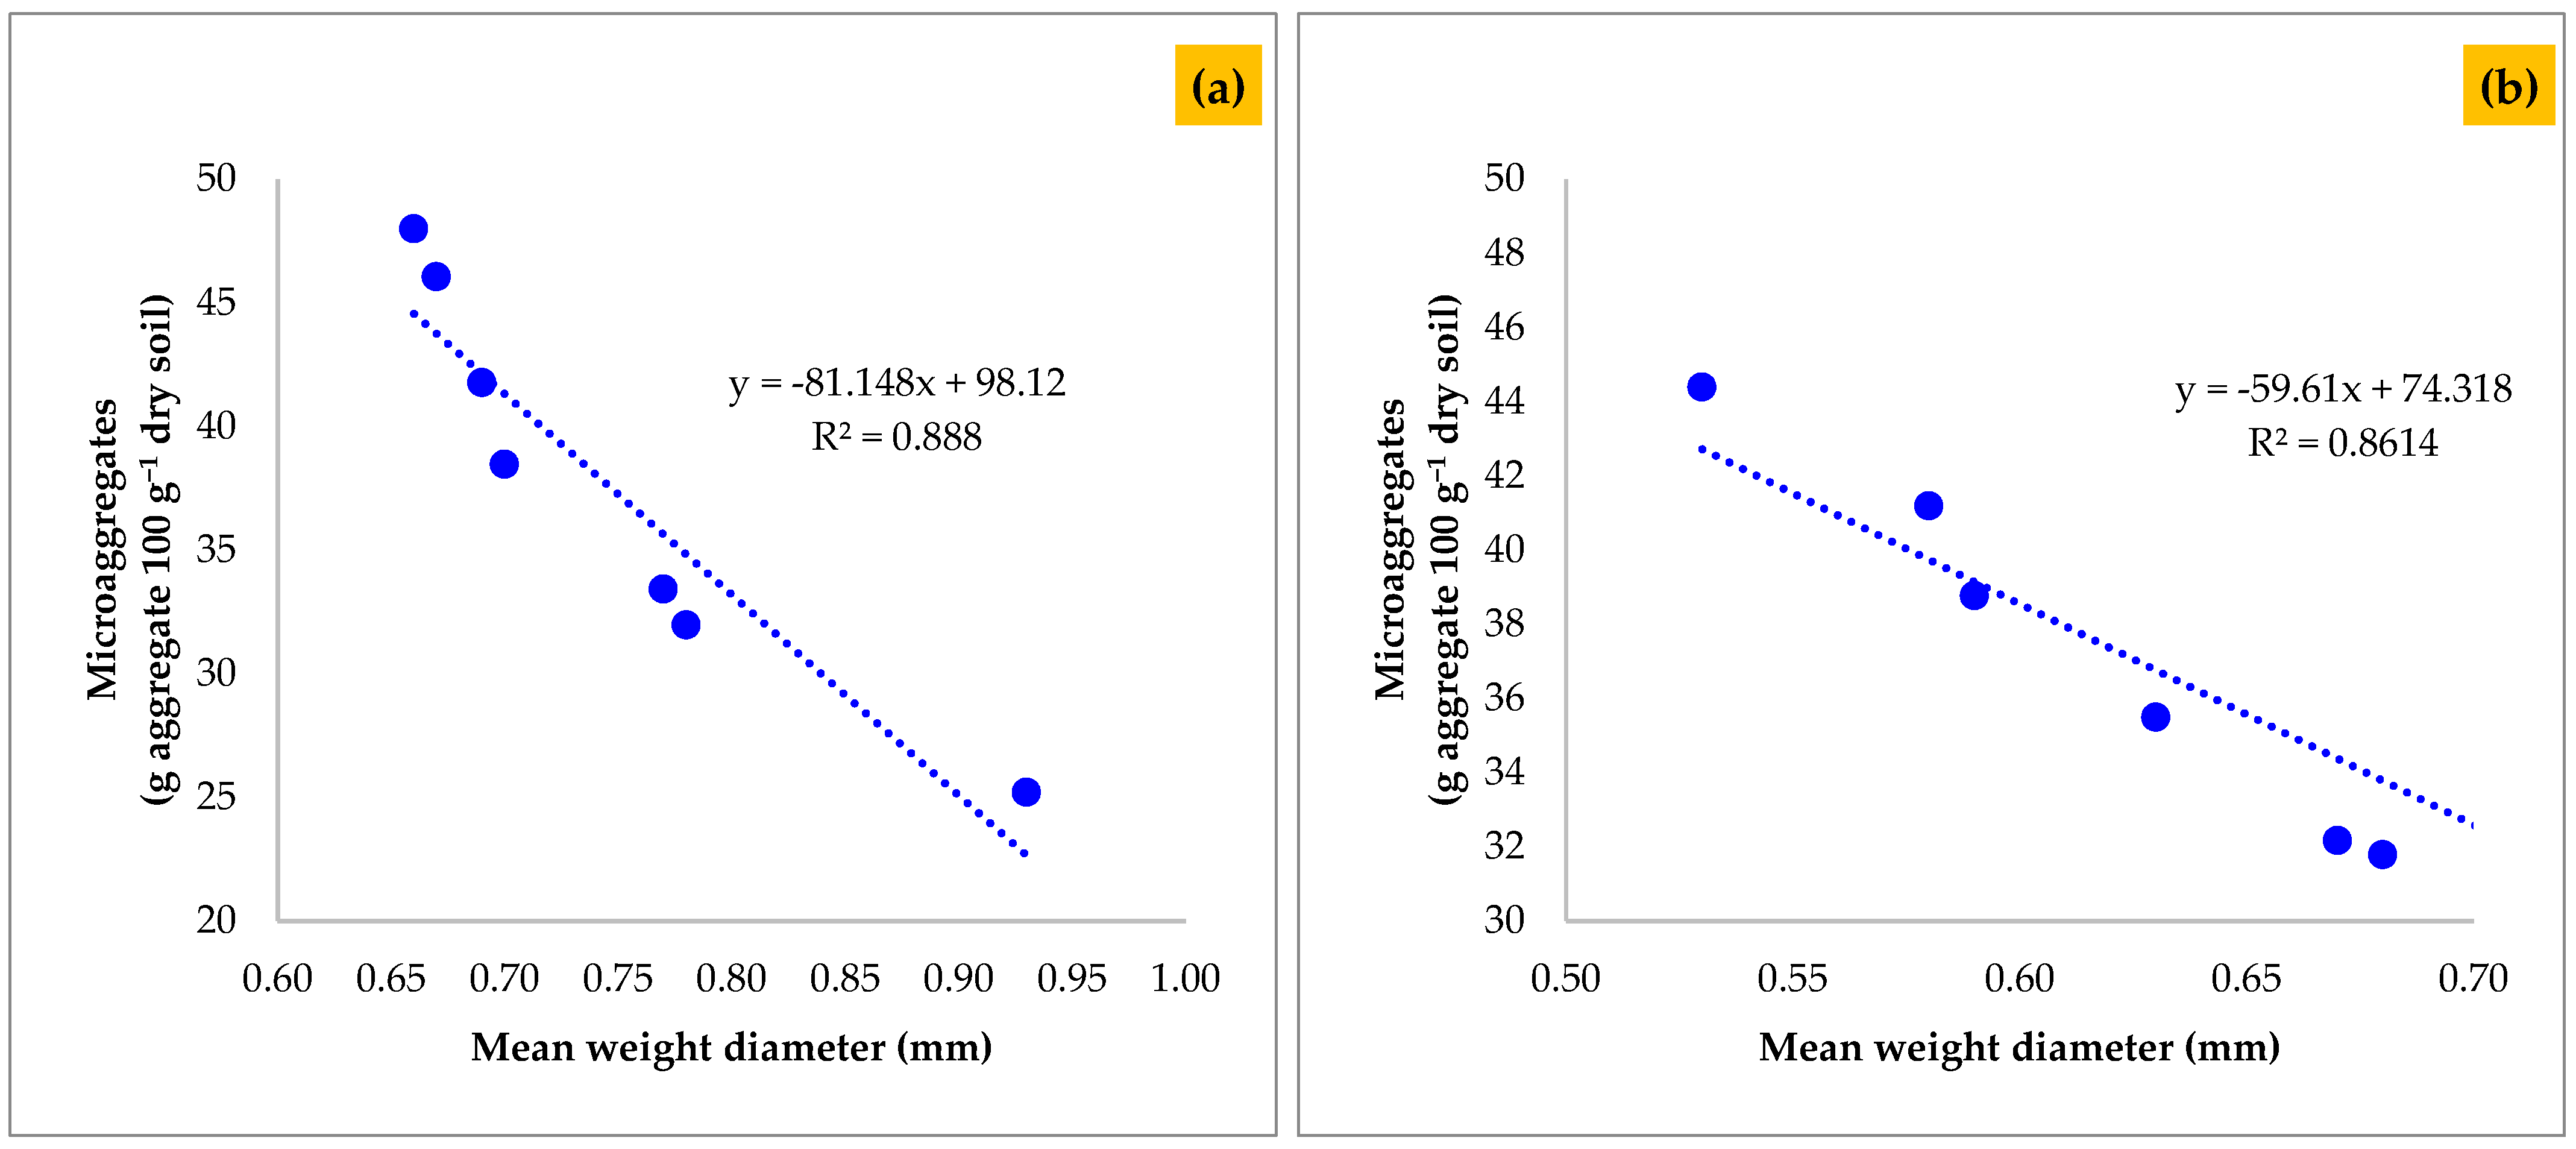
3.8. Relationship between Macroaggregate, Microaggregate, and Mean Weight Diameter

The macroaggregate, microaggregate fractions, and mean weight diameter have often been used as indices of soil sustainability. Results showed that macroaggregates were significantly negatively correlated with microaggregates (R2 = 0.99, p < 0.01; Figure 8a) in 0–15 cm soil depth and in 15–30 cm soil depth (R2 = 0.98, p < 0.01; Figure 8b). The regression lines for macroaggregates versus microaggregates showed a negative linear relationship (macroaggregate = −1.5067x + 114.81 and −1.1895x + 102.53) in the 0–15 and 15–30 cm soil depth.
In the case of macroaggregates with mean weight diameter, the results showed a strong positive relationship (R2 = 0.93, p < 0.01; Figure 9a) in 0–15 cm soil depth and in 15–30 cm soil depth (R2 = 0.92, p < 0.01; Figure 9b).
The regression lines for macroaggregate versus MWD showed a positive linear relationship (macroaggregate = 54.839x + 10.35 and 51.477x + 22.849) in the 0–15 and 15–30 cm soil depth. However, microaggregates and MWD had a significantly strong negative relationship (R2 = 0.89, p < 0.01; Figure 10a) in 0–15 cm soil depth and in 15–30 cm soil depth (R2 = 0.86, p < 0.01; Figure 10b).
The regression lines for microaggregate versus MWD showed a negative linear relationship (microaggregate = −81.148x + 98.12 and −59.61x + 74.318) in the 0–15 and 15–30 cm soil depth (Figure 10a,b).

4. Discussion

4.1. Aggregate-Size Distribution

Soil aggregate fraction and stability of aggregates can be used as a combined index to maintain nutrients holding capacity and agroecosystem sustainability [1,4]. The judicious application of organic manures and inorganic fertilizers accelerates soil aggregation [1] and improves organic matter in agriculture soils [10,11]. The increase in the size of aggregates might be due to higher organic carbon concentration in OF options, in which recommended doses of nutrients were applied through FYM in both cropping seasons (Table 2 and Table 3). The addition of higher organic matter might have a cementing effect, aggregating and nutrient cycling, which helps to promote crop growth and development [31,32,33].
OF and all the IPNS options, IPNS + B, IPNS + C, and IPNS showed significant superiority over the STCR, NPK, and control plot. This might be due to the higher concentration of carbon and inclusion of legumes (berseem and cowpea), which help to improve soil sustainability. The soil depth’s influence on these processes increased with judicious use of organic manure and mineral fertilizers [34,35,36].
Our study results support the notion that the judicious application of organic manure and mineral fertilizers significantly improves soil aggregations, as it promotes a higher concentration of organic matter [33,34]. Nevertheless, the impact of this same technology may differ with different soil types. Similarly, significantly higher soil aggregation fractions (53–250 µm) and aggregate stability were associated with the judicious application of animal and chicken manure [36,37,38]. Jiang et al. [39] and Ghosh et al. [34] also suggested that silt + clay had higher carbon concentrations. We also found that silt + clay fractions were highest in OF options. This might be due to the application of organic manure that works as a cementing agent and helps to promote the formation of aggregations [5,36,40]. Soil organic matter and soil water content significantly influenced the aggregate stability of soils with contrasting cropping histories [41,42,43,44,45]. A significant relation between aggregate breakdown, crusting, and water erosion were observed [46]. The use of organic matter has positive influences on both soil aggregation and aggregate stability [41,42,47].

4.2. Micro- and Macroaggregates Distribution

Results showed that both aggregate fractions significantly varied among the different nutrient management practices in both soil depth over the periods (Figure 5 and Figure 6). Significantly higher quantities of macroaggregates were observed in OF, followed by IPN + C/IPNS + B, which had positive impacts on aggregation [3,31]; this might be due to higher carbon concentrations that help as a cementing agent during the formation of macroaggregates [48,49]. Results showed that the IPNS and OF options had a higher quantity of macroaggregates than microaggregates after completing 19 cropping system cycles (Figure 5 and Figure 6). The significantly higher quantities of macroaggregates than microaggregates could be due to the lesser amount of soil organic carbon, and the non-addition of organic manure [35,36].

4.3. Mean Weight Diameter (MWD)

Aggregate stability was significantly affected by various nutrient management treatments over the periods (Figure 5 and Figure 6). Plots with OF management showed its significant superiority over the rest of the treatments in both soil layers (Figure 7). In subsurface soil, the decreased MWD was driven by the change in aggregate distribution, especially for the disintegration of large macroaggregates into microaggregates, which indicated the presence of aggregates with higher stability in OF management practices in comparison with the rest of the treatment combinations under long-term fertilization; macroaggregates also directly correlated with MWD [36,40,50]. Results suggest that higher soil organic matter content may be responsible for relatively higher percentage aggregation, larger median aggregate size, and more kinetic energy required to disrupt aggregates as compared to plow-tillage treatments. Similarly, our results corroborate that aggregate stability as measured by MWD was significantly macroaggregate [51,52].

4.4. Relationship between Macroaggregate, Microaggregate and MWD

Macroaggregates significantly negatively correlated with microaggregates in both soil layers (Figure 8a,b). In contrast, macroaggregates with mean weight diameter results showed a strong positive relationship in the 0–15 cm soil depth and in 15–30 cm soil depth (Figure 9a,b). However, in the case of microaggregates and MWD, there was a significantly strong negative relationship for both soil depths (Figure 10a,b). A significant increase in aggregate stability was found when adopting IPNS and OF options and adding organic manure; organic input directly contributed to SOC and works as a cementing agent between the soil particles [36,53,54]. Soil management practices also significantly influenced soil properties under rainfed lowland rice-based cropping systems [55].
Our results suggest that the adoption of IPNS options (berseem and cowpea) and organic farming had a significant role in improving the aggregate stability. This can alter how IPNS and OF options affect aggregate stability. Consequently, it is crucial to study the effects of best management practices (NPK, STCR, IPNS, IPNS + B, IPNS + C, and OF) on aggregate size distribution (micro- and macro-aggregate) and mean weight diameter in rice–wheat cropping systems after the completion of 19 cropping cycles. Soil fungi and organic matter significantly influenced plant nutrition and soil aggregate formation [56], and similarly increased mycorrhizal associations, soil aggregation, and the weathering of minerals [57]. However, a decline in soil organic matter levels lead to a decrease in soil aggregate stability and infiltration rates, and an increase in susceptibility to compaction, run-off, and erosion [58]. The results suggested that the soil structure characteristics (macro and micro aggregates) along the climatic transect are non-linear [59]. Soil structure influences soil water movement and retention, erosion, crusting, nutrient recycling, root penetration, and crop yield [60,61,62], soil aggregates are one component of soil structure [63,64,65,66].

5. Conclusions and Recommendations

The long-term (19-year) combined application of organic manure, mineral fertilizer, and adoption of integrated plant nutrition system (IPNS) options, significantly improved soil aggregate stability with higher mean weight diameter (MWD) and macroaggregates. MWD was significantly positively correlated with macroaggregate in the long run. In addition, MWD was increased (+17%) with organic farming (OF) options and with IPNS + C, IPNS + B, and STCR. Therefore, the adoption of IPNS and OF options could provide better nutrient management practices in improving soil aggregate stability after the completion of 19 cropping system cycles. We concluded that the adoption of organic farming options improves soil aggregate stability and MWD, followed by IPNS options for long-term rice–wheat cropping systems.
We also found that certain nutrient management strategies (STCR, OF, IPNS + berseem and cowpea) have the potential for maintaining soil aggregate stability. When legumes (cowpea and berseem) were grown every three years, the nutrient availabilities to plants were positive in both IPNS options. At the level of legume inclusion, berseem (+12%) and cowpea (+14%) were reported compared to the control plot after the completion of 19 cropping system cycles. Overall, the results suggest that innovative IPNS and OF strategies need to be adopted and applied to achieve soil sustainability. In the soil–plant system, higher soil organic matter resulted in a higher percentage of macroaggregates that improve pores for aeration and water flow to sustain these soils.

Supplementary Materials

The following supporting information can be downloaded at: https://www.mdpi.com/article/10.3390/land11091465/s1, Table S1: Annual average weather data recorded at ICAR-IIFSR agrometeorology observatory during 2006–2017, data represent mean ± SD (average/annual), Kurtosis and Skewness test, Patents—NIL.

Author Contributions

S.K.M.: investigation, data curation, writing—original draft, visualization. B.S.D.: conceptualization, investigation, supervision. M.C.M.: software, review, editing, supervision. S.P.D.: conceptualization, investigation, supervision. V.K.S.: conceptualization, investigation, methodology, supervision. R.P.M.: methodology, investigation, data curation, maintenance. D.C.: methodology, investigation, review, editing, supervision. A.D.: software, formal and data analysis, editing. V.S.M.: data curation, writing, review, visualization, editing. All authors have read and agreed to the published version of the manuscript.

Funding

This research has received no external funding.

Institutional Review Board Statement

Not applicable.

Informed Consent Statement

Not applicable.

Data Availability Statement

The data that support the findings of this study are available from the corresponding author upon reasonable request.

Acknowledgments

We thank ICAR-IIFSR, Modipuram for sharing the ongoing long-term experiment. The authors are highly thankful to Nurnabi Meherul Alam, Scientist (Agricultural Statistics) at ICAR-Central Research Institute for Jute and Allied Fibers (ICAR-CRIJAF), Kolkata (India) for providing support during the data analysis.

Conflicts of Interest

All authors agree that there is no potential conflict of interest, financially or non-financially, directly or indirectly, in relation to the work.

References

  1. Six, J.; Paustian, K.; Elliott, E.T.; Combrink, C. Soil structure and organic matter: I. Distribution of aggregate-size classes and aggregate-associated carbon. Soil Sci. Soc. Am. J. 2000, 64, 681–689. [Google Scholar] [CrossRef]
  2. Chen, M.; Zhang, S.; Liu, L.; Wu, L.; Ding, X. Combined organic amendments and mineral fertilizer application increase rice yield by improving soil structure, P availability and root growth in saline-alkaline soil. Soil Tillage Res. 2021, 212, 105060. [Google Scholar] [CrossRef]
  3. Wang, S.; Li, T.; Zheng, Z.; Zhang, X.; Chen, H.Y. Soil organic carbon and nutrients associated with aggregate fractions in a chronosequence of tea plantations. Ecol. Indic. 2019, 101, 444–452. [Google Scholar] [CrossRef]
  4. Morugán-Coronado, A.; Linares, C.; Gómez-López, M.D.; Faz, Á.; Zornoza, R. The impact of intercropping, tillage and fertilizer type on soil and crop yield in fruit orchards under Mediterranean conditions: A meta-analysis of field studies. Agric. Syst. 2020, 178, 102736. [Google Scholar] [CrossRef]
  5. Six, J.; Bossuyt, H.; Degryze, S.; Denef, K. A history of research on the link between (micro)aggregates, soil biota, and soil organic matter dynamics. Soil Tillage Res. 2004, 79, 7–31. [Google Scholar] [CrossRef]
  6. Tong, X.; Xu, M.; Wang, X.; Bhattacharyya, R.; Zhang, W.; Cong, R. Long-term fertilization effects on organic carbon fractions in a red soil of China. CATENA 2014, 113, 251–259. [Google Scholar] [CrossRef]
  7. Wang, S.; Li, T.; Zheng, Z.; Chen, H.Y. Soil aggregate-associated bacterial metabolic activity and community structure in different aged tea plantations. Sci. Total Environ. 2019, 654, 1023–1032. [Google Scholar] [CrossRef]
  8. Martin-Gorriz, B.; Maestre-Valero, J.F.; Almagro, M.; Boix-Fayos, C.; Martínez-Mena, M. Carbon emissions and economic assessment of farm operations under different tillage practices in organic rainfed almond orchards in semiarid Mediterranean conditions. Sci. Hortic. 2020, 261, 108978. [Google Scholar] [CrossRef]
  9. Jien, S.-H.; Kuo, Y.-L.; Liao, C.-S.; Wu, Y.-T.; Igalavithana, A.D.; Tsang, D.C.; Ok, Y.S. Effects of field scale in situ biochar incorporation on soil environment in a tropical highly weathered soil. Environ. Pollut. 2021, 272, 116009. [Google Scholar] [CrossRef]
  10. Lal, R. Restoring Soil Quality to Mitigate Soil Degradation. Sustainability 2015, 7, 5875–5895. [Google Scholar] [CrossRef] [Green Version]
  11. Li, Y.; Nie, C.; Liu, Y.; Du, W.; He, P. Soil microbial community composition closely associates with specific enzyme activities and soil carbon chemistry in a long-term nitrogen fertilized grassland. Sci. Total Environ. 2019, 654, 264–274. [Google Scholar] [CrossRef] [PubMed]
  12. FAO. Trees, Forests and Land Use in Drylands: The First Global Assessment-Full Report; FAO Forestry Paper No.184; FAO: Rome, Italy, 2019. [Google Scholar]
  13. Liu, Y.F.; Fan, X.X.; Zhang, T.; Sui, X.; Song, F.Q. Effects of atrazine application on soil aggregates, soil organic carbon and glomalin-related soil protein. Plant Soil Environ. 2021, 67, 173–181. [Google Scholar] [CrossRef]
  14. Zheng, X.; Fan, J.; Xu, L.; Zhou, J. Effects of Combined Application of Biogas Slurry and Chemical Fertilizer on Soil Aggregation and C/N Distribution in an Ultisol. PLoS ONE 2017, 12, e0170491. [Google Scholar] [CrossRef]
  15. Zhang, Q.; Song, Y.; Wu, Z.; Yan, X.; Gunina, A.; Kuzyakov, Y.; Xiong, Z. Effects of six-year biochar amendment on soil aggregation, crop growth, and nitrogen and phosphorus use efficiencies in a rice-wheat rotation. J. Clean. Prod. 2019, 242, 118435. [Google Scholar] [CrossRef]
  16. Pittarello, M.; Lonati, M.; Enri, S.R.; Lombardi, G. Environmental factors and management intensity affect in different ways plant diversity and pastoral value of alpine pastures. Ecol. Indic. 2020, 115, 106429. [Google Scholar] [CrossRef]
  17. Kan, Z.-R.; Ma, S.-T.; Liu, Q.-Y.; Liu, B.-Y.; Virk, A.L.; Qi, J.-Y.; Zhao, X.; Lal, R.; Zhang, H.-L. Carbon sequestration and mineralization in soil aggregates under long-term conservation tillage in the North China Plain. CATENA 2020, 188, 104428. [Google Scholar] [CrossRef]
  18. Ma, Z.; Bai, J.; Xiao, R.; Wang, C.; Cui, Y.; Wu, J.; Xu, J.; Zhang, Z.; Zhang, M. Incorporating soil aggregate-associated indicators into evaluating ecological responses of degraded estuarine wetlands to freshwater replenishment at different intensity: A case study from the Yellow River Delta, China. Ecol. Indic. 2021, 121, 107039. [Google Scholar] [CrossRef]
  19. Gibbs, H.K.; Salmon, J.M. Mapping the world’s degraded lands. Appl. Geogr. 2015, 57, 12–21. [Google Scholar] [CrossRef]
  20. Lal, R. Sequestering carbon and increasing productivity by conservation agriculture. J. Soil Water Conserv. 2015, 70, 55A–62A. [Google Scholar] [CrossRef]
  21. Astier, M.; García-Barrios, L.; Galván-Miyoshi, Y.; Gonzalez-Esquivel, C.E.; Masera, O.R. Assessing the Sustainability of Small Farmer Natural Resource Management Systems. A Critical Analysis of the MESMIS Program (1995–2010). Ecol. Soc. 2012, 17, 25. [Google Scholar] [CrossRef] [Green Version]
  22. Abhilash, P.C. Restoring the Unrestored: Strategies for Restoring Global Land during the UN Decade on Ecosystem Restoration (UN-DER). Land 2021, 10, 201. [Google Scholar] [CrossRef]
  23. Edrisi, S.A.; Abhilash, P.C. Need of transdisciplinary research for accelerating land restoration during the UN Decade on Ecosystem Restoration. Restor. Ecol. 2021, 29, e13531. [Google Scholar] [CrossRef]
  24. Almagro, M.; de Vente, J.; Boix-Fayós, C.; García-Franco, N.; Melgares de Aguilar, J.; González, D.; Solé-Benet, A.; Martínez-Mena, M. Sustainable land management practices as providers of several ecosystem services under rainfed Mediterranean agroecosystems. Mitig. Adapt. Strateg. Glob. Chang. 2016, 21, 1029–1043. [Google Scholar] [CrossRef]
  25. Soto, R.L.; Martínez-Mena, M.; Padilla, M.C.; de Vente, J. Restoring soil quality of woody agroecosystems in Mediterranean drylands through regenerative agriculture. Agric. Ecosyst. Environ. 2021, 306, 107191. [Google Scholar] [CrossRef]
  26. Soto, R.L.; Padilla, M.C.; de Vente, J. Participatory selection of soil quality indicators for monitoring the impacts of regenerative agriculture on ecosystem services. Ecosyst. Serv. 2020, 45, 101157. [Google Scholar] [CrossRef]
  27. Kemper, W.D.; Rosenau, R.C. Aggregate stability and size distribution. In Methods of Soil Analysis. Part 1. Agronomy Monograph, 2nd ed.; Klute, A., Ed.; American Society of Agronomy: Madison, WI, USA, 1986; pp. 425–442. [Google Scholar]
  28. Elliott, E.T. Aggregate Structure and Carbon, Nitrogen, and Phosphorus in Native and Cultivated Soils. Soil Sci. Soc. Am. J. 1986, 50, 627–633. [Google Scholar] [CrossRef]
  29. Van Bavel, C.H.M. Mean Weight-Diameter of Soil Aggregates as a Statistical Index of Aggregation. Soil Sci. Soc. Am. J. 1950, 14, 20–23. [Google Scholar] [CrossRef]
  30. Duncan, D.B. Multiple Range and Multiple F Tests. Biometrics 1955, 11, 1–42. [Google Scholar] [CrossRef]
  31. Ghosh, A.; Kumar, S.; Manna, M.C.; Singh, A.K.; Sharma, P.; Sarkar, A.; Saha, M.; Bhattacharyya, R.; Misra, S.; Biswas, S.S.; et al. Long-term in situ moisture conservation in horti-pasture system improves biological health of degraded land. J. Environ. Manag. 2019, 248, 109339. [Google Scholar] [CrossRef]
  32. Yang, Y.; Wu, J.; Zhao, S.; Gao, C.; Pan, X.; Tang, D.W.; van der Ploeg, M. Effects of long-term super absorbent polymer and organic manure on soil structure and organic carbon distribution in different soil layers. Soil Tillage Res. 2020, 206, 104781. [Google Scholar] [CrossRef]
  33. Meena, V.S.; Ghosh, B.N.; Singh, R.J.; Bhattacharyya, R.; Sharma, N.K.; Alam, N.M.; Meena, S.K.; Mishra, P.K. Land use types and topographic position affect soil aggregation and carbon management in the mountain agro-ecosystems of the Indian Himalayas. Land Degrad. Dev. 2021, 32, 3992–4003. [Google Scholar] [CrossRef]
  34. Ghosh, A.; Bhattacharyya, R.; Meena, M.; Dwivedi, B.; Singh, G.; Agnihotri, R.; Sharma, C. Long-term fertilization effects on soil organic carbon sequestration in an Inceptisol. Soil Tillage Res. 2018, 177, 134–144. [Google Scholar] [CrossRef]
  35. Wankhede, M.; Ghosh, A.; Manna, M.C.; Misra, S.; Sirothia, P.; Rahman, M.M.; Bhattacharyya, P.; Singh, M.; Bhattacharyya, R.; Patra, A.K. Does soil organic carbon quality or quantity govern relative temperature sensitivity in soil aggregates? Biogeochemistry 2020, 148, 191–206. [Google Scholar] [CrossRef]
  36. Ghosh, A.; Singh, A.K.; Kumar, S.; Manna, M.C.; Jha, P.; Bhattacharyya, R.; Sannagoudar, M.S.; Singh, R.; Chaudhari, S.K.; Kumar, R. Do moisture conservation practices influence stability of soil organic carbon and structure? CATENA 2021, 199, 105127. [Google Scholar] [CrossRef]
  37. Cao, Y.; Wang, B.; Guo, H.; Xiao, H.; Wei, T. The effect of super absorbent polymers on soil and water conservation on the terraces of the loess plateau. Ecol. Eng. 2017, 102, 270–279. [Google Scholar] [CrossRef]
  38. Yang, Y.; Wu, J.; Zhao, S.; Han, Q.; Pan, X.; He, F.; Chen, C. Assessment of the responses of soil pore properties to combined soil structure amendments using X-ray computed tomography. Sci. Rep. 2018, 8, 695. [Google Scholar] [CrossRef]
  39. Jiang, M.; Wang, X.; Liusui, Y.; Han, C.; Zhao, C.; Liu, H. Variation of soil aggregation and intra-aggregate carbon by long-term fertilization with aggregate formation in a grey desert soil. CATENA 2017, 149, 437–445. [Google Scholar] [CrossRef]
  40. Wen, Y.; Tang, Y.; Wen, J.; Wang, Q.; Bai, L.; Wang, Y.; Su, S.; Wu, C.; Lv, J.; Zeng, X. Variation of intra-aggregate organic carbon affects aggregate formation and stability during organic manure fertilization in a fluvo-aquic soil. Soil Use Manag. 2021, 37, 151–163. [Google Scholar] [CrossRef]
  41. Tisdall, J.M.; Oades, J.M. Organic matter and water-stable aggregates in soils. Eur. J. Soil Sci. 1982, 33, 141–163. [Google Scholar] [CrossRef]
  42. Gerard, C.J. The influence of soil moisture, soil texture, drying conditions and exchangeable cations on soil strength. Soil Sc. Soc. Amer. Proc. 1965, 29, 641–645. [Google Scholar] [CrossRef]
  43. Haynes, R.J.; Swift, R.S. Stability of soil aggregates in relation to organic constituents and soil water content. Eur. J. Soil Sci. 1990, 41, 73–83. [Google Scholar] [CrossRef]
  44. Fukumasu, J.; Jarvis, N.; Koestel, J.; Kätterer, T.; Larsbo, M. Relations between soil organic carbon content and the pore size distribution for an arable topsoil with large variations in soil properties. Eur. J. Soil Sci. 2022, 73, e13212. [Google Scholar] [CrossRef]
  45. Yu, Q.; Xu, L.; Wang, M.; Xu, S.; Sun, W.; Yang, J.; Shi, Y.; Shi, X.; Xie, X. Decreased soil aggregation and reduced soil organic carbon activity in conventional vegetable fields converted from paddy fields. Eur. J. Soil Sci. 2022, 73, e13222. [Google Scholar] [CrossRef]
  46. LE Bissonnais, Y. Aggregate stability and assessment of soil crustability and erodibility: I. Theory and methodology. Eur. J. Soil Sci. 1996, 47, 425–437. [Google Scholar] [CrossRef]
  47. Karami, A.; Homaee, M.; Afzalinia, S.; Ruhipour, H.; Basirat, S. Organic resource management: Impacts on soil aggregate stability and other soil physico-chemical properties. Agric. Ecosyst. Environ. 2012, 148, 22–28. [Google Scholar] [CrossRef]
  48. Ghosh, A.; Bhattacharyya, R.; Dey, A.; Dwivedi, B.S.; Meena, M.C.; Manna, M.C.; Agnihortri, R. Long-term fertilisation impact on temperature sensitivity of aggregate associated soil organic carbon in a sub-tropical inceptisol. Soil Tillage Res. 2019, 195, 104369. [Google Scholar] [CrossRef]
  49. Liu, X.; Chen, D.; Yang, T.; Huang, F.; Fu, S.; Li, L. Changes in soil labile and recalcitrant carbon pools after land-use change in a semi-arid agro-pastoral ecotone in Central Asia. Ecol. Indic. 2020, 110, 105925. [Google Scholar] [CrossRef]
  50. Qiu, L.; Wei, X.; Gao, J.; Zhang, X. Dynamics of soil aggregate-associated organic carbon along an afforestation chronosequence. Plant Soil 2015, 391, 237–251. [Google Scholar] [CrossRef]
  51. Zhong, Z.; Wu, S.; Lu, X.; Ren, Z.; Wu, Q.; Xu, M.; Ren, C.; Yang, G.; Han, X. Organic carbon, nitrogen accumulation, and soil aggregate dynamics as affected by vegetation restoration patterns in the Loess Plateau of China. CATENA 2021, 196, 104867. [Google Scholar] [CrossRef]
  52. Ghosh, A.; Singh, A.B.; Kumar, R.V.; Manna, M.C.; Bhattacharyya, R.; Rahman, M.M.; Sharma, P.; Rajput, P.S.; Misra, S. Soil enzymes and microbial elemental stoichiometry as bio-indicators of soil quality in diverse cropping systems and nutrient management practices of Indian Vertisols. Appl. Soil Ecol. 2020, 145, 103304. [Google Scholar] [CrossRef]
  53. Su, Y.Z.; Liu, W.J.; Yang, R.; Chang, X.X. Changes in Soil Aggregate, Carbon, and Nitrogen Storages Following the Conversion of Cropland to Alfalfa Forage Land in the Marginal Oasis of Northwest China. Environ. Manag. 2009, 43, 1061–1070. [Google Scholar] [CrossRef] [PubMed]
  54. Zhong, Z.; Han, X.; Xu, Y.; Zhang, W.; Fu, S.; Liu, W.; Ren, C.; Yang, G.; Ren, G. Effects of land use change on organic carbon dynamics associated with soil aggregate fractions on the Loess Plateau, China. Land Degrad. Dev. 2019, 30, 1070–1082. [Google Scholar] [CrossRef]
  55. So, H.B.; Ringrose-Voase, A.J. Management of clay soils for rainfed lowland rice-based cropping systems: An overview. Soil Tillage Res. 2000, 56, 3–14. [Google Scholar] [CrossRef]
  56. Pareek, N. Climate Change Impact on Soils: Adaptation and Mitigation. MOJ Ecol. Environ. Sci. 2017, 2, 136–139. [Google Scholar] [CrossRef]
  57. Jones, D.L.; Nguyen, C.; Finlay, R.D. Carbon flow in the rhizosphere: Carbon trading at the soil–root interface. Plant Soil 2009, 321, 5–33. [Google Scholar] [CrossRef]
  58. Bot, A.; Benites, J. The Importance of Soil Organic Matter Key to Drought-Resistant Soil and Sustained Food and Production; FAO Soils Bulletin 80; Food and Agriculture Organization of the United Nations: Rome, Italy, 2005; p. 78. [Google Scholar]
  59. Sarah, P. Soil aggregation response to long- and short-term differences in rainfall amount under arid and Mediterranean climate conditions. Geomorphology 2005, 70, 1–11. [Google Scholar] [CrossRef]
  60. Zhang, S.; Wang, R.; Yang, X.; Sun, B.; Li, Q. Soil aggregation and aggregating agents as affected by long term contrasting management of an Anthrosol. Sci. Rep. 2016, 6, 39107. [Google Scholar] [CrossRef]
  61. Wang, W.; Chena, W.C.; Wang, K.R.; Xie, X.L.; Yin, C.M.; Chen, A.L. Effects of long-term fertilization on the distribution of carbon, nitrogen and phosphorus in water-stable aggregates in paddy soil. Agric. Sci. China 2011, 10, 1932–1940. [Google Scholar] [CrossRef]
  62. Bronick, C.J.; Lal, R. Soil structure and management: A review. Geoderma 2005, 124, 3–22. [Google Scholar] [CrossRef]
  63. Angers, D.A. Changes in Soil Aggregation and Organic Carbon under Corn and Alfalfa. Soil Sci. Soc. Am. J. 1992, 56, 1244–1249. [Google Scholar] [CrossRef]
  64. Xie, J.-Y.; Xu, M.-G.; Ciren, Q.; Yang, Y.; Zhang, S.-L.; Sun, B.-H.; Yang, X.-Y. Soil aggregation and aggregate associated organic carbon and total nitrogen under long-term contrasting soil management regimes in loess soil. J. Integr. Agric. 2015, 14, 2405–2416. [Google Scholar] [CrossRef]
  65. Xie, H.; Li, J.; Zhang, B.; Wang, L.; Wang, J.; He, H.; Zhang, X. Long-term manure amendments reduced soil aggregate stability via redistribution of the glomalin-related soil protein in macroaggregates. Sci. Rep. 2015, 5, 14687. [Google Scholar] [CrossRef] [PubMed] [Green Version]
  66. Ladd, J.N. The role of the soil microflora in the degradation of organic matter. In Recent Advances in Microbial Ecology; Hattori, T., Ishida, Y., Muruyama, Y., Morita, R.Y., Uchida, A., Eds.; Japan Scientific Societies Press: Tokyo, Japan, 1989; pp. 168–174. [Google Scholar]
Figure 1. Experimental setup and treatment details for different nutrient supply options for rice–wheat cropping system.
Land 11 01465 g001
Figure 2. Experimental view during the Kharif season (rice) sowing all treatment combination.
Land 11 01465 g002
Figure 3. Experimental photographs of the soil samples used in the analysis.
Land 11 01465 g003
Figure 4. Soil aggregation fractionation schemes used to obtain aggregates and subfractions within microaggregate and microaggregates.
Land 11 01465 g004
Figure 5. Effect of long-term nutrient supply options on macroaggregate and microaggregate fractions in the 0–15 cm soil layer of a rice–wheat cropping system. Means of different treatments followed by the different lower-case letters are significantly different at p < 0.05 level of significance according to DMRT.
Land 11 01465 g005
Figure 6. Effect of long-term nutrient supply options on macroaggregate and microaggregate fractions in the 15–30 cm soil layer of a rice–wheat cropping system. Means of different treatments followed by the different lower-case letters are significantly different at p < 0.05 level of significance according to DMRT.
Land 11 01465 g006
Figure 7. Effect of long-term nutrient supply options on mean weight diameter in the 0–15 and 15–30 cm soil layer of rice–wheat system. Means of different treatments followed by the different lower-case letters are significantly different at p < 0.05 level of significance according to DMRT.
Land 11 01465 g007
Figure 8. Relationship between microaggregate and macroaggregate fractions of soil aggregation; (a) 0–15 cm and (b) 15–30 cm soil depths.
Land 11 01465 g008
Figure 9. Relationship between macroaggregate and mean weight diameter fractions of soil aggregation; (a) 0–15 cm and (b) 15–30 cm soil depths.
Land 11 01465 g009
Figure 10. Relationship between microaggregate and mean weight diameter fractions of soil aggregation; (a) 0–15 cm and (b) 15–30 cm soil depths.
Land 11 01465 g010
Table 1. Initial soil properties of experimental site (1998).
Soil CharacteristicsType/Values
Texture ClaySandy loam
Sand (g kg−1)62.90
Silt (g kg−1)19.30
Clay (g kg−1)17.80
Bulk density (Mgm−3)
0–15 cm1.49
15–30 cm1.52
pH (1:2, soil/water)
0–15 cm8.01
15–30 cm7.89
EC (dSm−1)
0–15 cm0.11
15–30 cm0.12
Organic carbon (g kg−1)
0–15 cm5.10
15–30 cm3.60
Table 2. Soil aggregation distribution as affected by long-term nutrient supply options of rice–wheat system in the 0–15 cm soil layer. Means of different treatments followed by the different lower-case letter are significantly different at p < 0.05 level of significance according to DMRT.
TreatmentsSize Distribution of Aggregates, μm
>2000250–200053–250<53
g 100 g–1 Dry Soil
Control13.0 d31.8 e48.0 a7.2 d
NPK13.3 d32.9 de46.1 a7.8 d
STCR14.0 cd33.8 cde41.8 b10.4 c
IPNS14.2 cd36.5 bcd38.5 b10.9 c
IPNS + B16.1 bc37.5 abc33.4 c13.0 b
IPNS + C16.6 b37.9 ab32.0 c13.6 ab
OF20.8 a39.3 a25.2 d14.7 a
Table 3. Soil aggregation distribution as affected by long-term nutrient supply options of rice-wheat system in the 15–30 cm soil layer. Means of different treatments followed by the different lower-case letter are significantly different at p < 0.05 level of significance according to DMRT.
TreatmentsSize Distribution of Aggregates, μm
>2000250–200053–250<53
g Aggregate 100 g–1 Dry Soil
Control8.5 d41.0 d44.4 a6.1 d
NPK9.9 cd41.9 cd41.2 ab7.0 d
STCR10.4 bcd42.7 bcd38.8 ab8.2c
IPNS11.3 abcd44.3 abcd35.5 bc8.8 b
IPNS + B12.5 abc46.1 abc32.2 c9.2 a
IPNS + C12.8 ab46.6 ab31.8 c8.8 b
OF13.7 a47.7 a30.6 c8.1 c
Publisher’s Note: MDPI stays neutral with regard to jurisdictional claims in published maps and institutional affiliations.

