Article

Detection, Morphometric Analysis and Digital Surveying of Archaeological Mounds in Southern Iraq with CartoSat-1 and COSMO-SkyMed DEMs

1
Italian Space Agency (ASI), Via del Politecnico snc, 00133 Rome, Italy
2
Institute of Atmospheric Sciences and Climate (ISAC), National Research Council (CNR), Via del Fosso del Cavaliere 100, 00133 Rome, Italy
*
Author to whom correspondence should be addressed.
Land 2022, 11(9), 1406; https://doi.org/10.3390/land11091406
Submission received: 4 August 2022 / Revised: 17 August 2022 / Accepted: 18 August 2022 / Published: 27 August 2022
(This article belongs to the Special Issue Landscape Archaeology by Using Remote Sensing Data)

Abstract

:
In Near and Middle Eastern archaeology, satellite-derived digital elevation models (DEM) of medium spatial resolution (≥30 m) are mostly used to locate and map archaeological mounds (namely ‘tells’), whereas high resolution DEMs (≤10 m) are still poorly exploited. To fill this gap, the 5 m resolution CartoSat-1 Euro-Maps 3D Digital Surface Model (DSM) is assessed vs. the 30 m Shuttle Radar Topography Mission (SRTM) global DEM, the Advanced Land Observing Satellite (ALOS) World 3D–30 m (AW3D30) and a 10 m COSMO-SkyMed DEM, on a test area in Wasit, southern Iraq, where the high density of tells is yet to be exhaustively documented. A total of 344 sites was mapped, with one order of magnitude improvement compared to previous mapping exercises, existing databases and historical maps. The morphometric analysis not only highlights the reliability of CartoSat-1 DSM height and volume estimates, but also suggests that, in the test area, the volume of a tell can robustly be calculated based on the simple knowledge of its basal area, following a quadratic function. Morphology and elevation of at least 53% irregularly shaped tells were impacted by anthropogenic disturbances. Morphometric indices (e.g., Topographic Position Index, DEViation from mean elevation) are a viable automated method to ease tells detection. When integrated with other satellite datasets (e.g., CORONA, Google Earth, Sentinel-2 imagery), the CartoSat-1 DSM can unveil morphological changes and support condition assessment. In Wasit, agriculture and modern development are among the major threats for tells preservation, alongside looting.

1. Introduction

In landscape archaeology, it is now common practice that digital elevation models (DEM), either as terrain or surface models (DTM and DSM, respectively), are used by archaeologists [1,2]. Several tasks are typically supported, for example: investigation of the topography of the studied region; identification of anthropogenic relieves (e.g., hillforts, embankments) and structures (e.g., channels, dams, hydraulic infrastructure); detection of environmental features of past landscapes (e.g., paleo-channels); characterization of physical environment properties that may have influenced land use and human activities (e.g., for least-cost path analysis). An overview of the technologies and the state-of-the-art in archaeological remote sensing can be found in [3].
In recent years, DEMs processed from either airborne (e.g., LiDAR) or satellite (e.g., the Shuttle Radar Topography Mission—SRTM [4]) sensor data have proved particularly helpful for documentation of the presence and spatial distribution of anthropogenic features belonging to one or more specific archaeological categories (e.g., Motte-and-Bailey castles [5], medieval wetlands [6], shell rings, middens, shell heaps, and earthen mounds [7]), that are peculiar of a given landscape. Vast regions can be cost-effectively screened, compared to intensive and widespread in-situ surveying that would require much more significant manpower and longer time to provide the same spatial extent and synoptic view of mapped sites and features.
A common use-case of DEMs, in particular in Near Eastern, South Eastern and Asian archaeology, is landscape study of archaeological mounds. Frequently indicated by archaeologists with the Arabic term ‘tell’, mounds of anthropogenic origin represent key features in modern landscapes testifying millennia of geological and natural processes of deposition of sediments, intermingled with cycles of human occupation, land use, abandonment and reuse [8]. Mapping tells is foundational activity for settlement pattern studies aiming to understand emergence, development, and organization of the first complex human societies [9].
Most studies on archaeological mounds relying on satellite-derived DEMs have made use of open and free DEMs from global datasets, such as the above mentioned SRTM, the Advanced Land Observing Satellite (ALOS) World 3D–30 m (AW3D30 [10,11]) and the Advanced Spaceborne Thermal Emission and Reflection Radiometer Global DEM (ASTER GDEM, at 30 m resolution [12]). In particular, Sherratt [13] was among the firsts to bring to the general attention the usefulness of satellite-derived DEMs to search for archaeological tells. Menze et al. [9] pinpointed likely tell sites in the upper Khabur catchment at the boundaries between Turkey, Syria and Iraq, using the 90 m SRTM DEM.
Instead, still limited is the use of high resolution DEMs generated from dedicated satellite-based surveys. There are only few examples of research focusing on paleo-channels and landforms (e.g., [14,15,16,17]). Even fewer studies specifically focus on archaeological mounds based on elevation products generated by means of interferometric synthetic aperture radar (InSAR) techniques [3]. Equally meager are the landscape studies exploiting DEMs produced from high resolution multispectral imagery via stereo-photogrammetry. The study by Gupta et al. [18] is the first where DEM and 3D anaglyphs produced from the Indian Remote Sensing satellite known as CartoSat-1 (or IRS-P5) were tested to identify buried sites and archaeological mounds. However, this study stands alone in the literature, whereas much more research is needed to fully unveil the potential of the CartoSat-1 DSM for landscape studies.
It is in this regard that the present paper aims to demonstrate the usefulness of this satellite asset, and in particular of its derived product called CartoSat-1 Euro-Maps 3D DSM, i.e., a commercial product that is open for research and application development, prototype and test projects to users located in the territory of the European Space Agency (ESA) and the European Commission Member States [19]. The product provides nearly global coverage, with good to very good stereo data availability over Europe, Near East, India, most of Asia, United States of America and Latin America. These geographic locations encompass wide areas and landscapes at high to very high archaeological potential. Therefore, the CartoSat-1 DSM may represent a valuable high resolution dataset for landscape archaeology studies.
The demonstration of this functionality is carried out on a test area located in southern Iraq characterised by a dense distribution of tells (Section 2.1), which are mapped in this work, also benefitting from a high resolution InSAR DEM generated from COSMO-SkyMed acquisitions at 3 m spatial resolution (Section 2.2). The latter is used in conjunction with open baseline DEM datasets (i.e., SRTM and AW3D30) to assess the quality of CartoSat-1 DSM as well as its accuracy in height, area and volume of mapped tells (Section 2.3). Commonly used DEM derivatives such as shaded reliefs, slope and aspect are also tested alongside two morphometric indices, i.e., the Topographic Position Index (TPI) and DEViation from mean elevation (DEV), to undertake a morphometric analysis of tells, and discuss how the CartoSat-1 DSM can support this approach that is increasingly exploited in landscape archaeology, and thus be used for archaeological applications (Section 3 and Section 4).

2. Materials and Methods

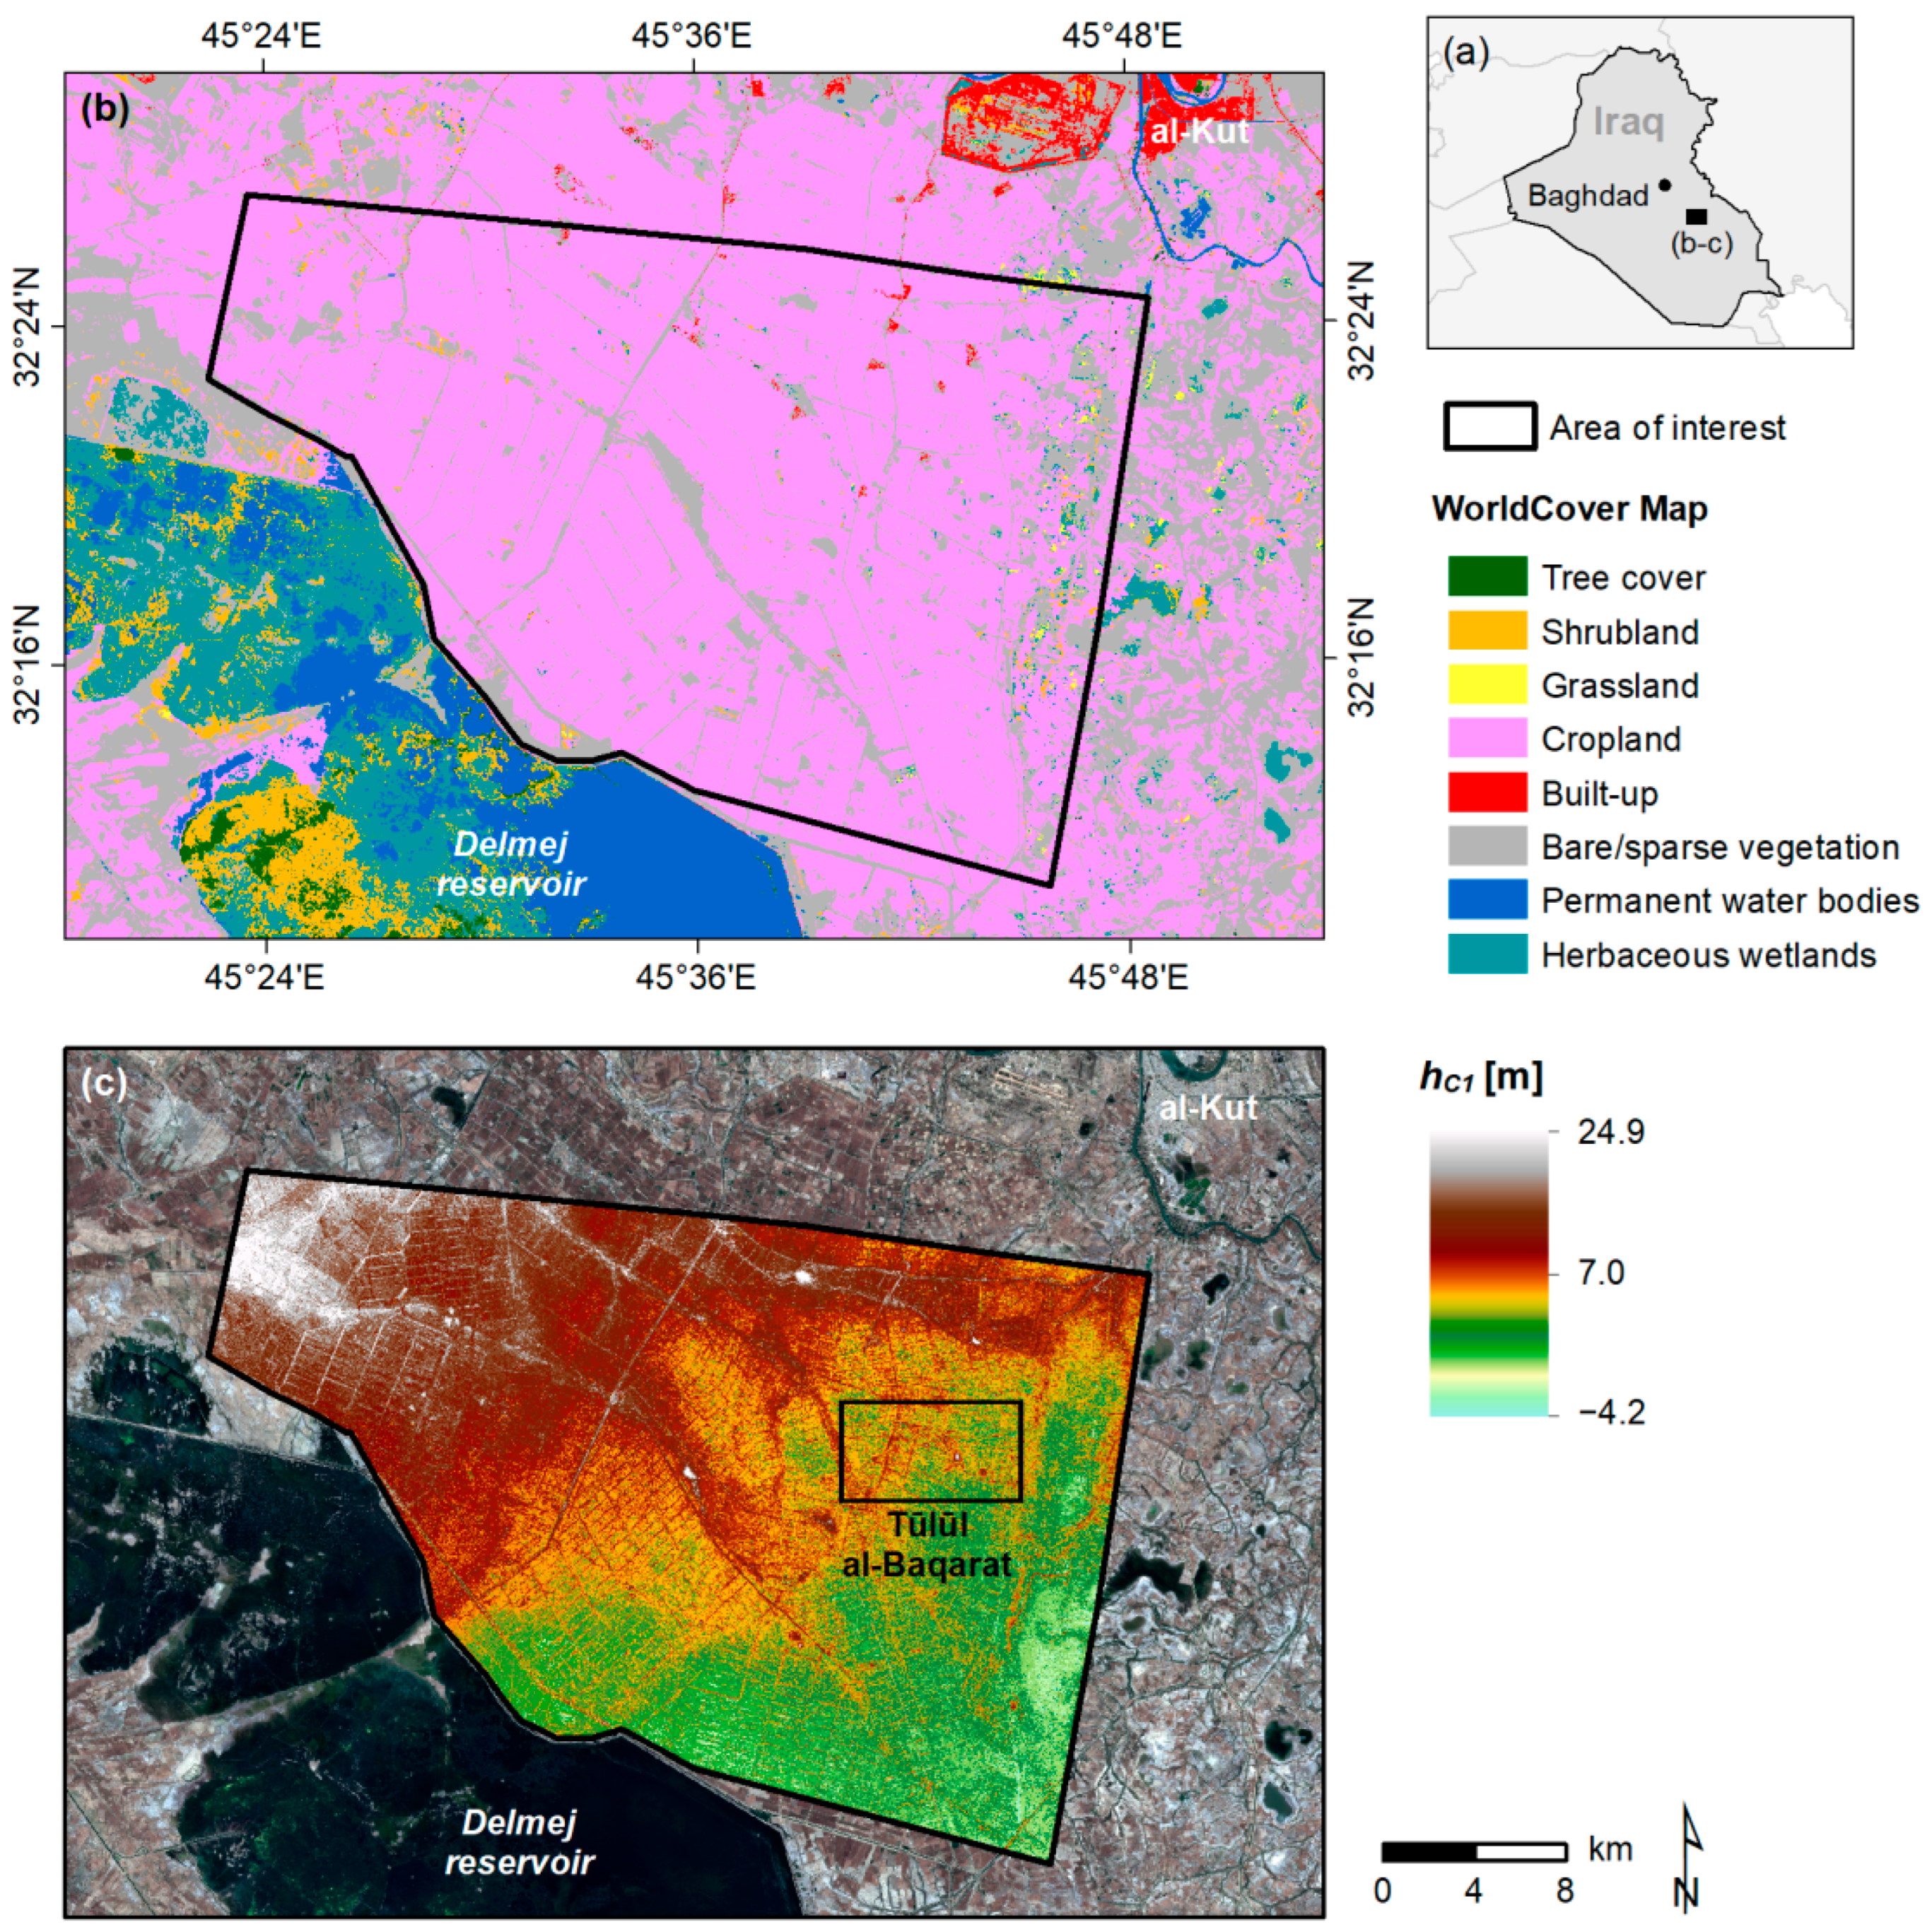
2.1. Test Area: Al-Ahrar, Al-Nu’maniya, Wasit (Iraq)

Figure 1a shows the test area in central Iraq, within the Al-Nu’maniya District of Wasit Governorate, that was selected to undertake the analysis. With a total extent of ~810 km2, the test area mainly falls within the Al-Ahrar sub-district. As depicted in ESA WorldCover 10 m 2020 v100 dataset [20] (Figure 1b), the landscape within this area is dominated by croplands (~82%), sparse vegetation and bare lands (16%), plus some minor towns and villages in its northern sector, and limited extents of shrubland, grasslands and herbaceous wetlands in the eastern sector.
The test area is also located north-east of the Delmej reservoir (Figure 1b,c), a ~616 km2 hydraulic infrastructure that was created between the late 1960s and the early 1970s to contrast the risk of desertification and provide a source of water to the local community. As quantified in a recent study [21], 146 previously surveyed sites were flooded in consequence of the reservoir up-filling. Such a statistic is informative of the significant amount of sites of archaeological relevance that can be found even in relatively small areas in this region. In the Al-Ahrar sub-district, recent archaeological surveys by the State Board of Antiquities and Heritage have highlighted a high density of sites dating back to late periods such as Hellenistic, Parthian and Sasanian. The total number of tells and archaeological deposits largely exceeds the historic records collected during Robert McCormick Adams and colleagues’ surveys [22], as well as the open access database of placemarks of Ancient Near East (ANE) sites published by Pedersén ([23], see also Section 2.2.2), thus suggesting that this is an ideal area to test the CartoSat-1 DSM for mapping tells.
The use-case that a type of landscape such as the Al-Ahrar subdistrict’s poses to archaeologists, and that this paper intentionally aims to demonstrate with the use of the CartoSat-1 DSM, is therefore the remote detection and mapping of a high density of topographic relieves and tells through a cost-effective and less time-consuming systematic procedure that also allows for morphometric measurements to be extracted for those sites that are recorded. Such measurements are advantageous not only to recognize and classify man-made landforms such as archaeological mounds [24,25] and gather geomorphological insights of ancient settlement strategies and the environmental factors that played a relevant role [26], but also to document the present condition of tells and archaeological deposits and infer the impacts due to natural and/or anthropogenic processes. In addition to intentional destruction and looting [3,27], there is evidence-base that most damage comes from agricultural and economic development-related activities [21,28].

2.2. Input Data

2.2.1. DEM Datasets

The main input dataset is a CartoSat-1 Euro-Maps 3D DSM—level A+ product, which includes an elevation dataset and an orthorectified image, both with an extent of ~810 km2 and geographically referenced to the WGS84 datum. These were developed by GAF AG in cooperation with the German Aerospace Center (DLR) [29,30] and are generated from high resolution in-flight stereo image pairs acquired by the dual-optics 2-line along-track stereoscopic push broom scanner (31° stereo angle and 2.5 m resolution) onboard the Indian CartoSat-1 (formerly IRS-P5) satellite [31], during its 2005–2019 lifetime.
The DSM is in GeoTIFF format, with 16-bit signed integer values, and is characterized by pixel spacing of 4.2 m by 5 m (E–W by N–S direction). The product is vertically referenced to the EGM96 geoid [32], and orthometric heights in the area range between +5 and +33 m. Quality and traceability layers provided as auxiliary data to the DSM show that 98.05% of the product was derived from four or more overlapping stereo pairs, only 1.90% by one to three pairs, and the remaining 0.05% height values were either filled using an auxiliary elevation model or detected as water bodies based on Copernicus Sentinel-2 data and flattened [33]. Absolute vertical accuracy is 5 m for slopes < 20° (99.87% of the product), while it increases to 7 m for 20–40% slopes (0.12%), and 10 m for slopes > 40° (less than 0.01%). Relative vertical accuracy is below 3 m.
The baseline datasets against which the quality of the CartoSat-1 DSM is evaluated are:
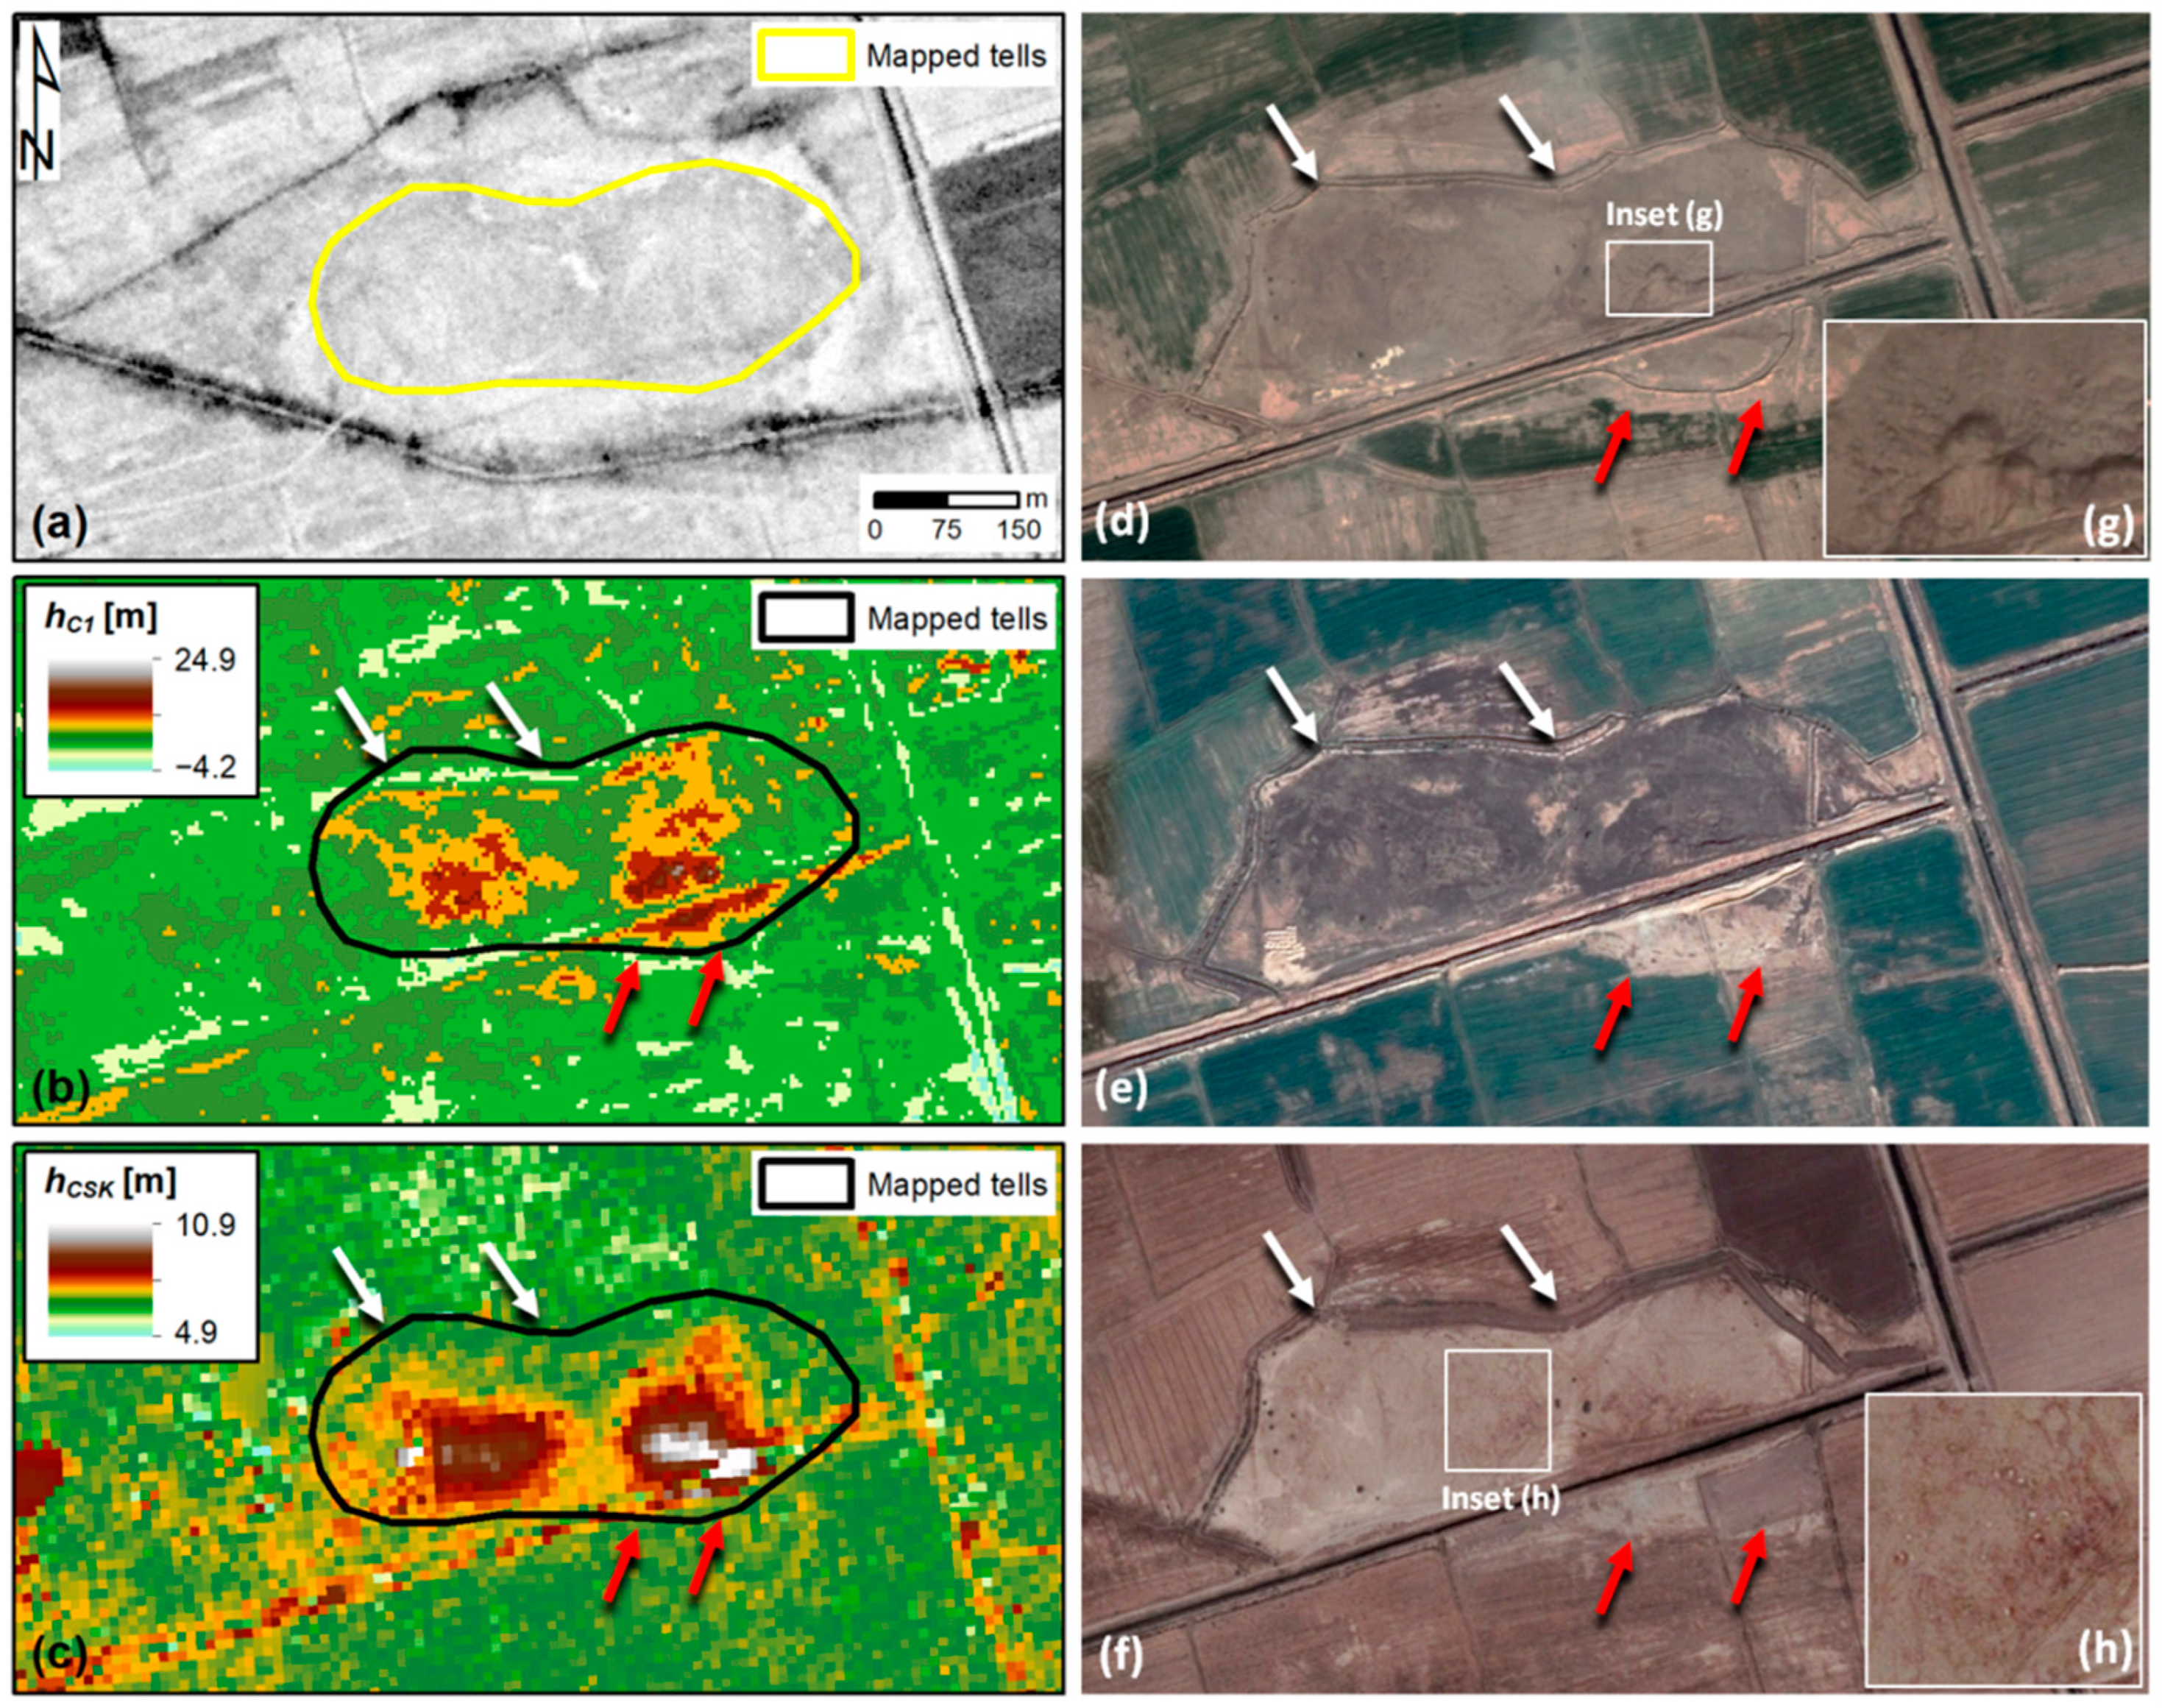
  • a 10 m resolution ellipsoidal DEM product generated from 1-day baseline pairs of Synthetic Aperture Radar (SAR) imagery in StripMap HIMAGE mode acquired by the COSMO-SkyMed constellation [34] during an experimental campaign in 2018 (full details of which are available in [3], wherein accuracy and performance assessment for regional systematic mapping of archaeological mounds is reported);
  • 30 m resolution DEMs that are freely available for the test area and typically exploited by archaeologists and practitioners, namely: SRTM global 1-arcsecond (GL1) DEM [4] produced by NASA and characterized by 90% absolute height error of 6.2 m in Eurasia [35], and the AW3D30 DEM generated by the Japan Aerospace Exploration Agency (JAXA), with 5 m height accuracy [11]. Both were accessed via OpenTopography, in their ellipsoidal versions [36,37].
Both the reference DEMs and the CartoSat-1 product are surface models (DSMs), hence depict elevations of both the ground and any elements (e.g., vegetation, buildings) above it.

2.2.2. Other Geospatial Datasets

The first geospatial dataset that was exploited is the orthorectified image of the test area that was supplied as part of the CartoSat-1 Euro-Maps 3D DSM level A+ product (see Section 2.2.1) and consists of a panchromatic (500–850 nm) top-of-atmosphere reflectance scene with 2.1 m by 2.5 m (E–W by N–S direction) pixel spacing acquired by one of the two cameras. This image provides a very useful visual reference in addition to the geospatial datasets listed here below, in order to describe the mapped tells or archaeological deposits, refine the archaeological interpretation and assess the condition on the ground.
To this purpose, the following satellite image collections were used to achieve a time-lapse of the landscape changes in the test area:
  • CORONA satellite imagery from the namesake United States intelligence satellite program [38], taken by KH-4B in 1968 with pixel spacing of 2.4 m by 2.8/2.9 m (E–W by N–S). The tiles used in this research are identified with unique image designators ds1107-2170da128, ds1107-2170da129, ds1107-2170da130 and ds1107-2170da131, and were accessed as orthorectified GeoTIFF files (native Spatial Reference System: EPSG 4326/WGS84) from the CORONA Atlas of the Middle East [39];
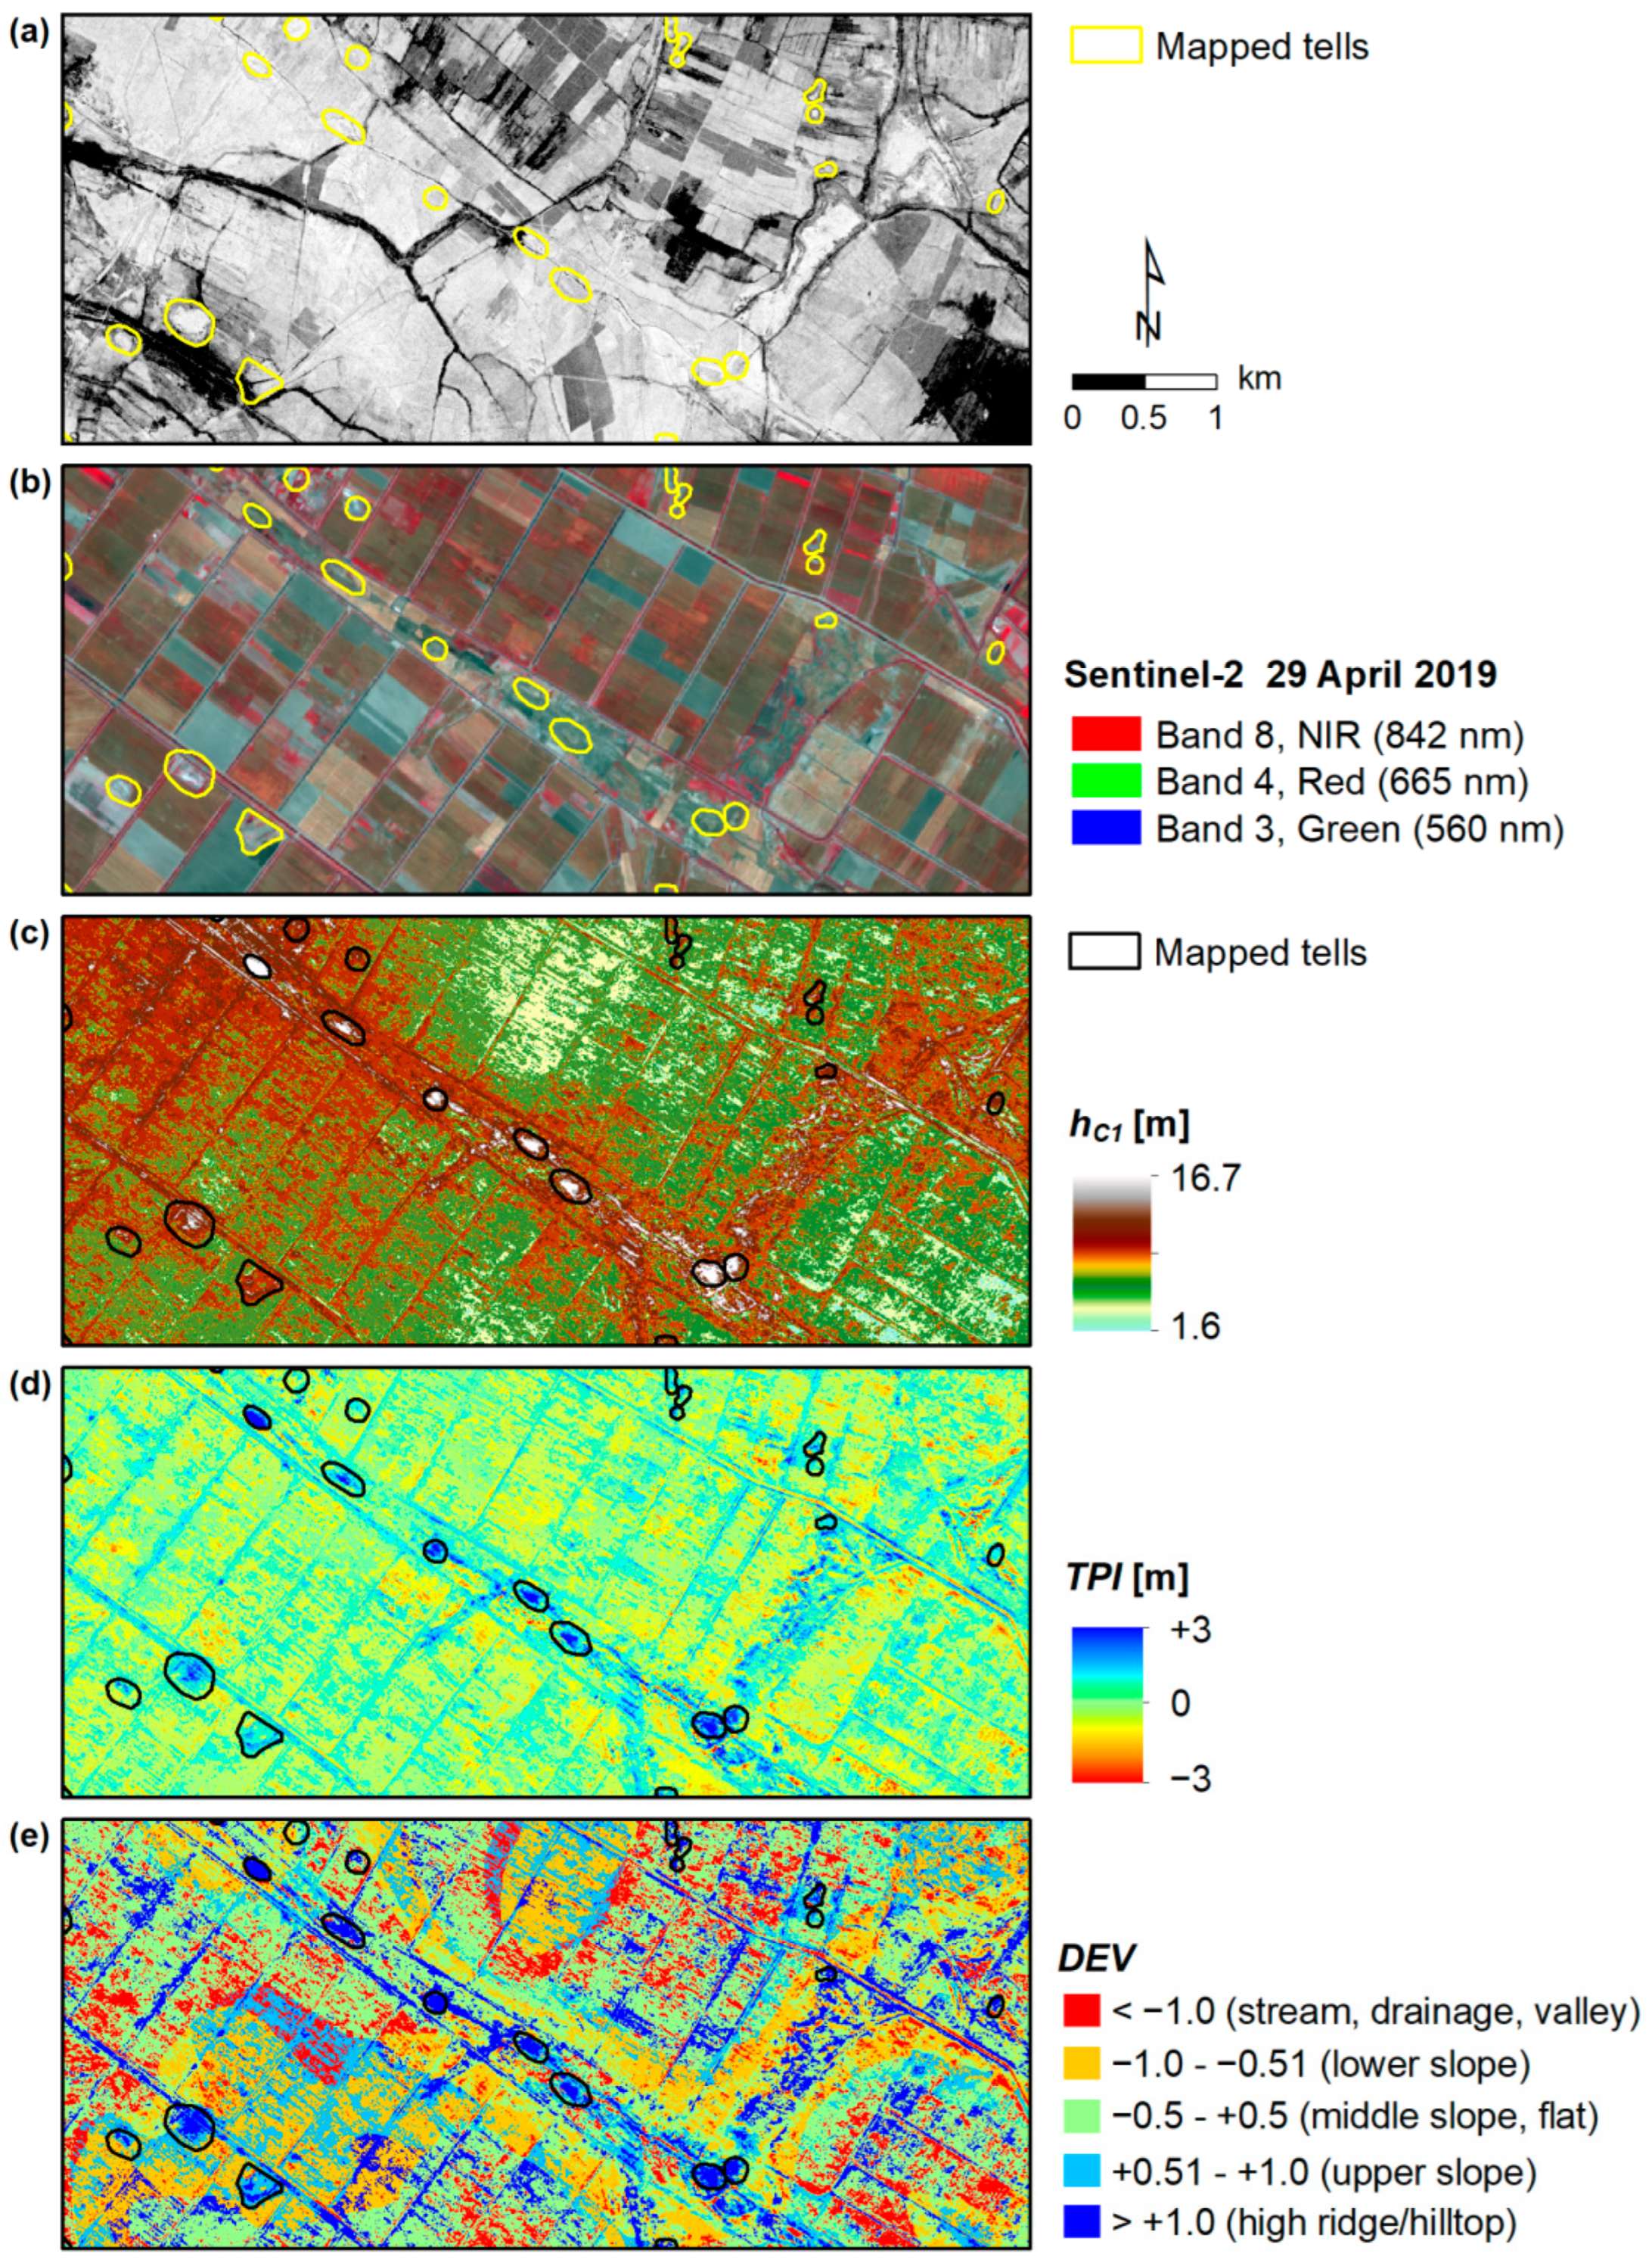
  • Copernicus Sentinel-2 multispectral image collection available over the test area in the period 2017–2022, accessed as bottom-of-atmosphere reflectance in cartographic geometry (i.e., Level 2A, or L2A) products. Visible and near-infrared (NIR) bands at 10 m spatial resolution were later processed using the approach described in [40,41], to generate false-colored infrared composites (R: Band 4—NIR1; G: Band 3—red; B: Band 2—green) and enhance the spectral signature patterns of tells compared to the surrounding agricultural fields. The latter are a peculiar property of tells that have been observed in other locations in the Middle East (e.g., in Syria; [42]);
  • Google Earth and ESRI World Imagery, the latter accessed through ArcGIS software. These were used for visual inspection of mapped tells to corroborate the detection and interpretation made based on the DEM datasets and assess condition changes between 2002 and 2020. It is worth noting that, depending on the location, the number of images, their temporal coverage and frequency (i.e., temporal granularity) and visibility may unevenly and significantly vary across the test area, as per the known limitation of this visualisation platform [41,42,43].
In addition, using the same approach implemented over the whole Wasit Governorate in [3], historic Soviet military maps at the 1:200,000 scale [44,45] were used as a further source of reference to identify earthen mounds, alongside the ANE database by Pedersén [23].

2.3. Methods

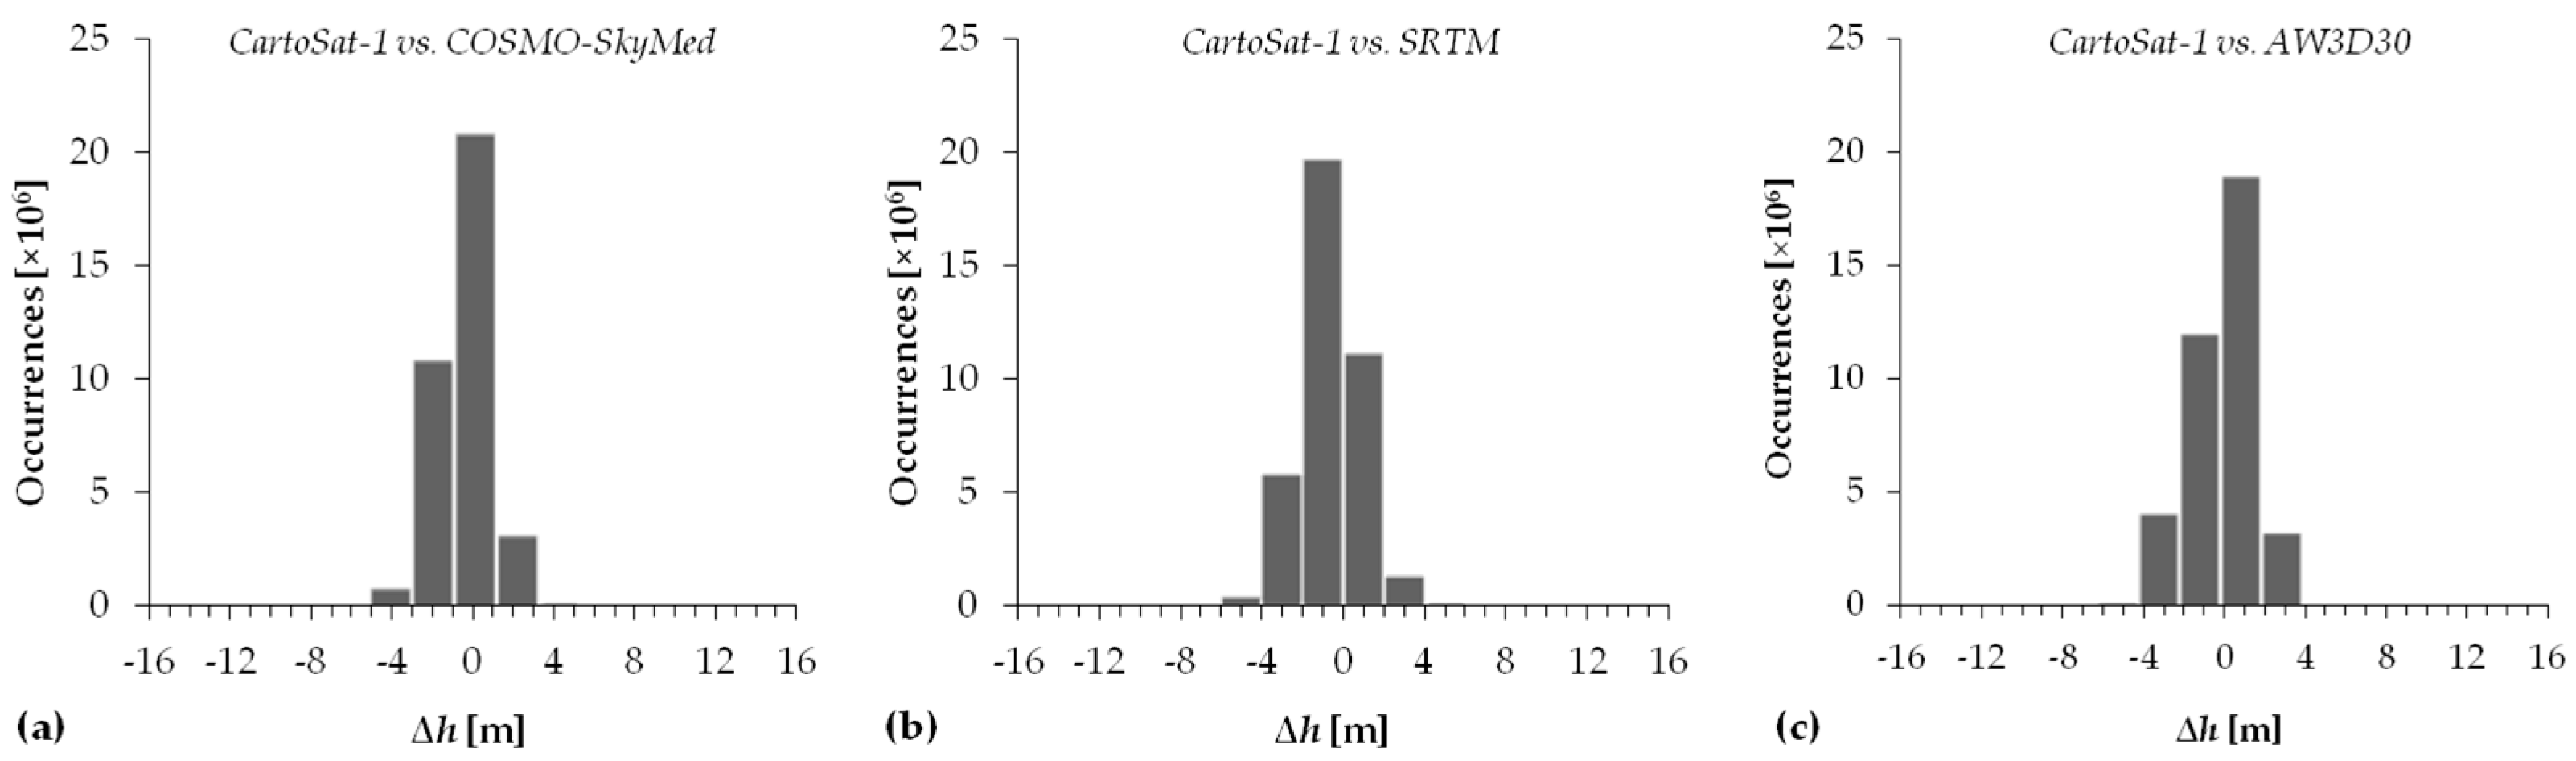
2.3.1. DSM Elevation Differences

EGM96 orthometric heights of the CartoSat-1 DSM were first converted to the WGS84 ellipsoid by accounting for local geoid undulation (i.e., its height relative to the ellipsoid that, in the area of interest, ranges between −7.9 and −9.3 m). The quality of the CartoSat-1 DSM was then estimated by comparing its elevation values (hC1) at each location i against those retrieved at the same location from each of the three reference DSM products (href), i.e., COSMO-SkyMed, SRTM 30 m and AW3D30 (see Section 2.2.1):
Δ h i = h C 1 i h r e f i

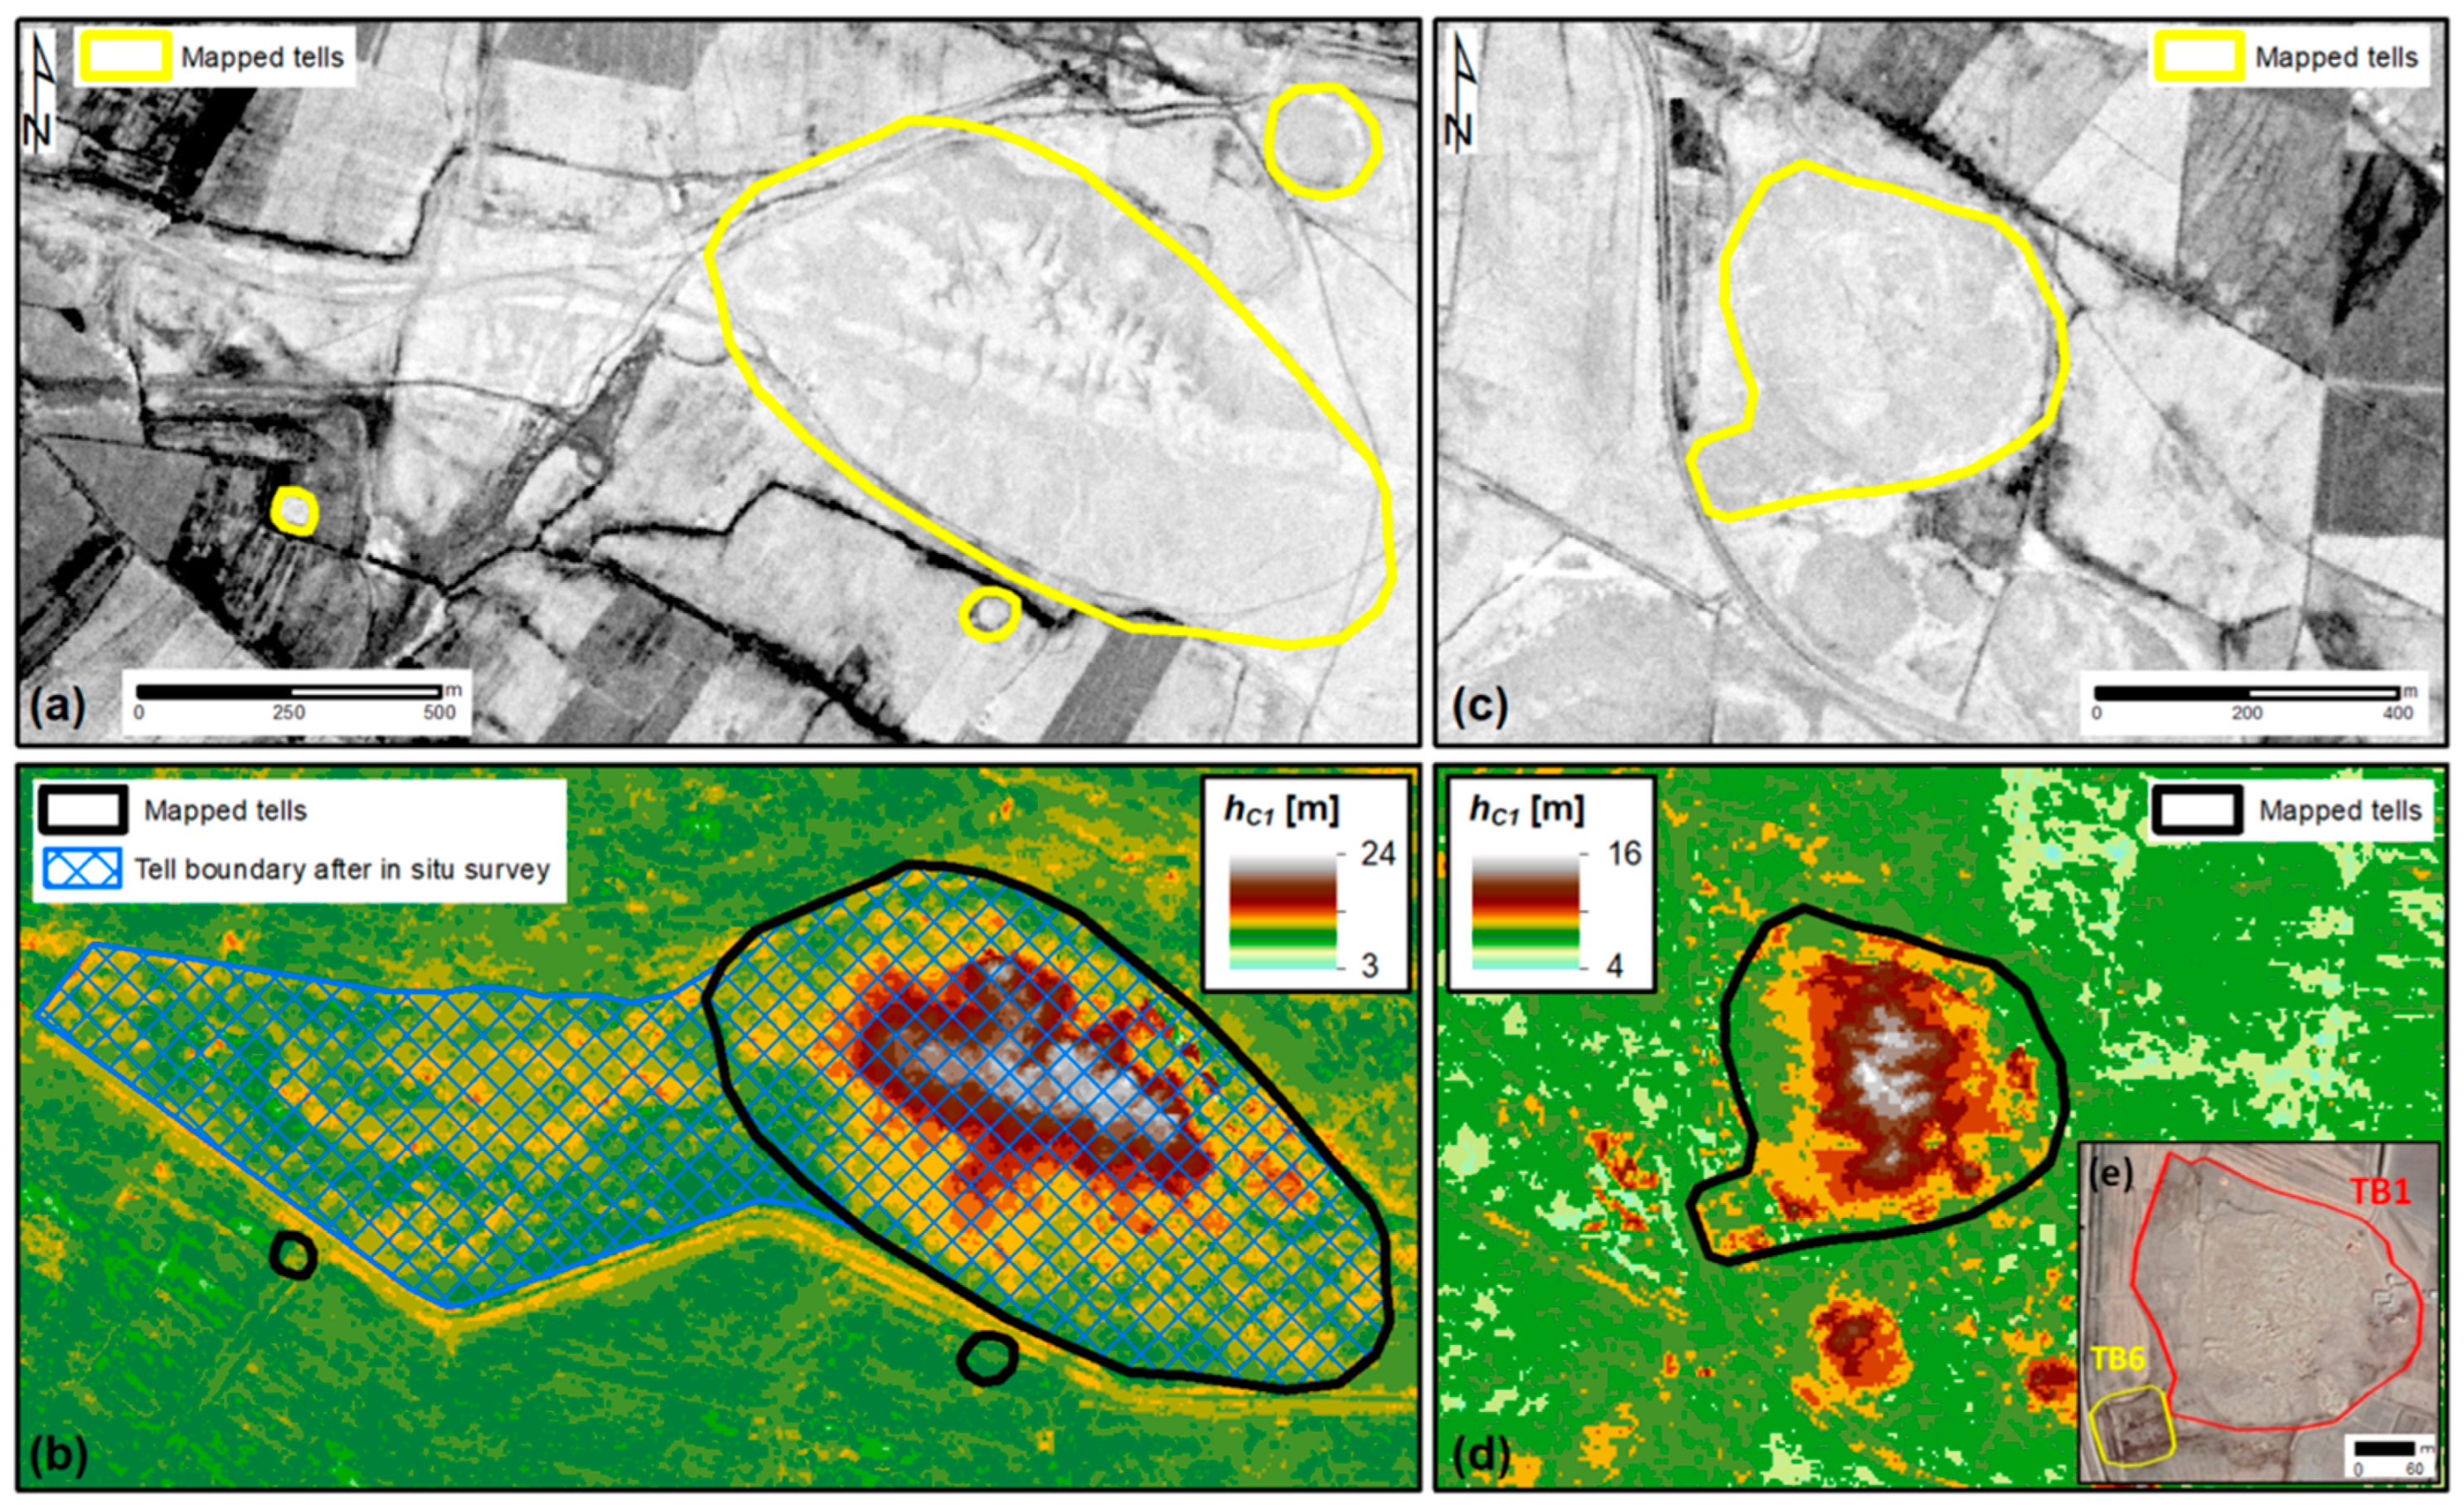
2.3.2. Tells Mapping Method and DSM Derivatives

A 5 km × 5 km search grid was exploited to perform a systematic mapping of tells within the test area, based on evidence and information from the four sources of optical imagery, the existing maps/databases, and the four DSMs. Each mapped tell was recorded in a geospatial database of polygon features with associated fields, containing information about visibility in one or more of the analyzed DEMs and the optical imagery, presence/absence in the existing databases, and detailed notes about any landscape changes and site condition assessment. In particular, given the types of threats affecting the region (see Section 2.1), we focused on any irregularities, evidence of looting, anthropogenic alteration, ploughing, land use change or other surface features observed.
Derived products from the CartoSat-1 DSM were also used, namely shaded reliefs, slope and aspect, as well as two morphometric indices, i.e., TPI and DEV [46,47,48]. TPI indicates the elevation difference of a location (hi) against the average elevation within its neighborhood ( h ¯ ), thus quantifying its relative topographic position with respect to its surroundings:
T P I i = h i h ¯
In turn, DEV normalizes the TPI to local surface roughness (defined in terms of elevation standard deviation within the neighborhood, σ h i ), and thus provides the relative topographic position of a location as a fraction of local relief:
D E V i = T P I i σ h i
A radius of 500 m was used to identify the size of the reference neighborhood, thus trading-off the need to detect subtle topographic features (e.g., nearly flattened tells) with the typical size of the archaeological tells in the region (at least a few hundreds of meters wide). Following [47], DEV > 1 (i.e., TPIi > σ h i ) typically indicates high ridge/hilltop landforms (including tells), −1 ≤ DEV ≤ 1 encompasses upper, middle to lower slopes and flat areas, and DEV < −1 indicates streams, drainage and valleys.
After identifying each tell in one or more of the input datasets, its position, height and the following main morphological characteristics were estimated and annotated in the geospatial database (Figure 2):
  • WGS84 coordinates of its central point (Lat, Lon), in decimal degrees;
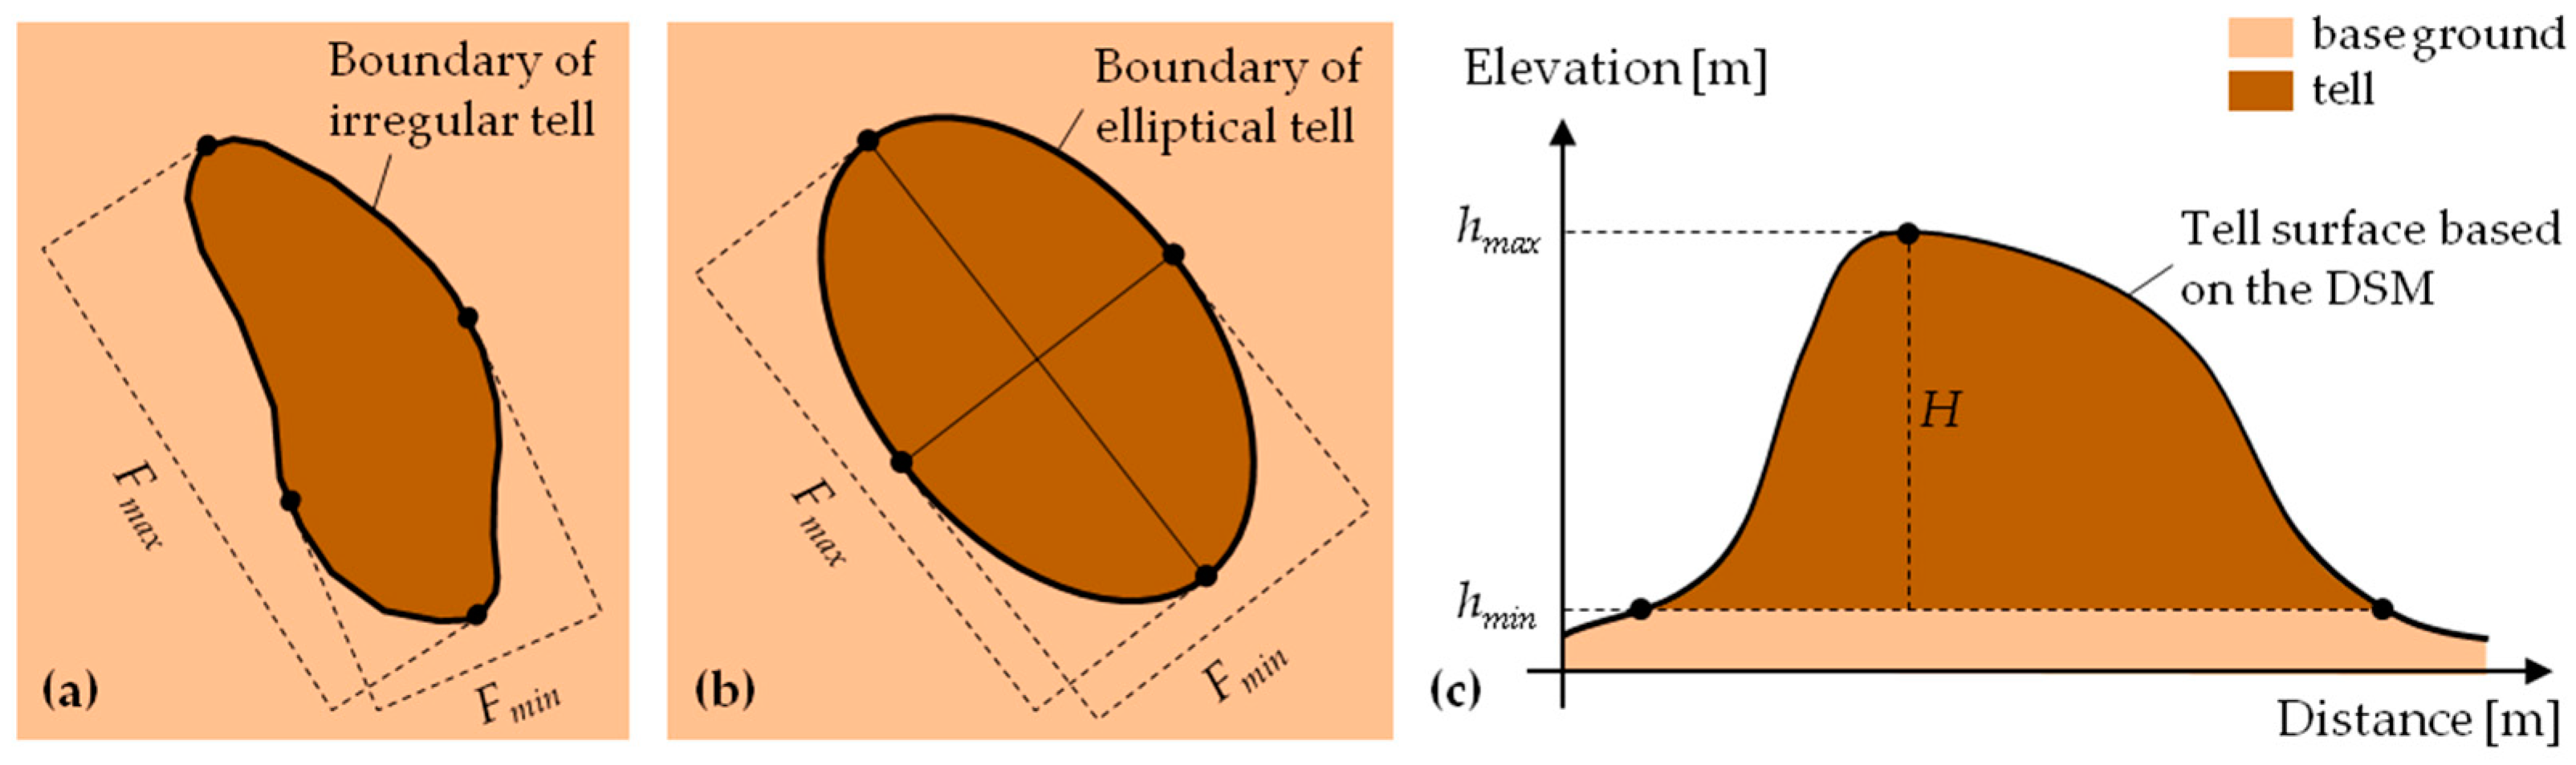
  • Perimeter (P) of its base (i.e., length of the basal edge), in meters;
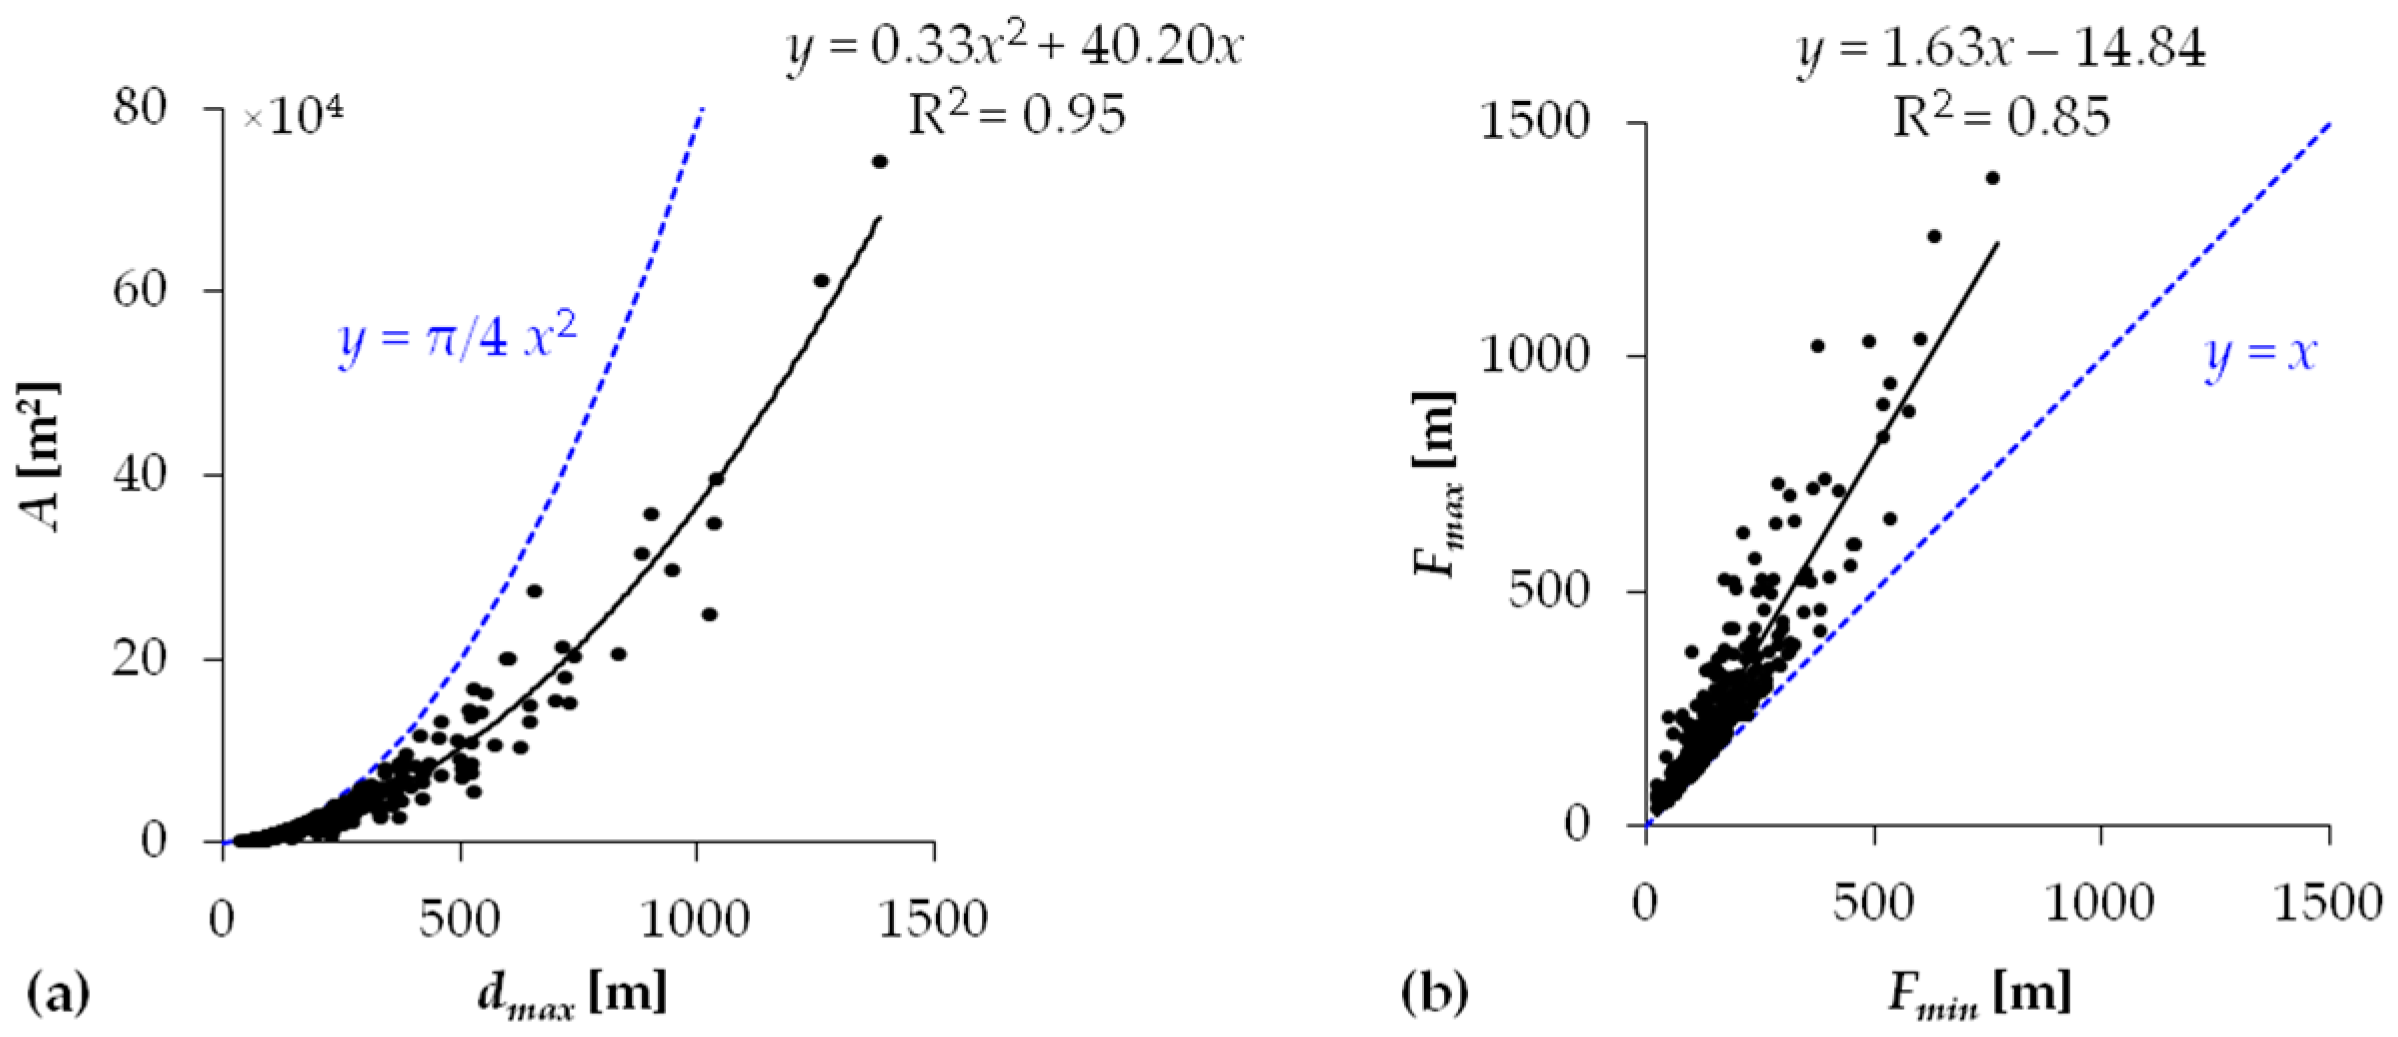
  • Area (A) of its base, in square meters;
  • Circularity (C), computed as:
    C = P e q P
    where Peq is the perimeter of the equivalent circle (i.e., 2 A π ). C equal to 1 indicates a perfectly circular tell, and the more irregular shape, the lower C;
  • Planar shape: visual interpretation of the basal shape, either circular, elliptical or irregular;
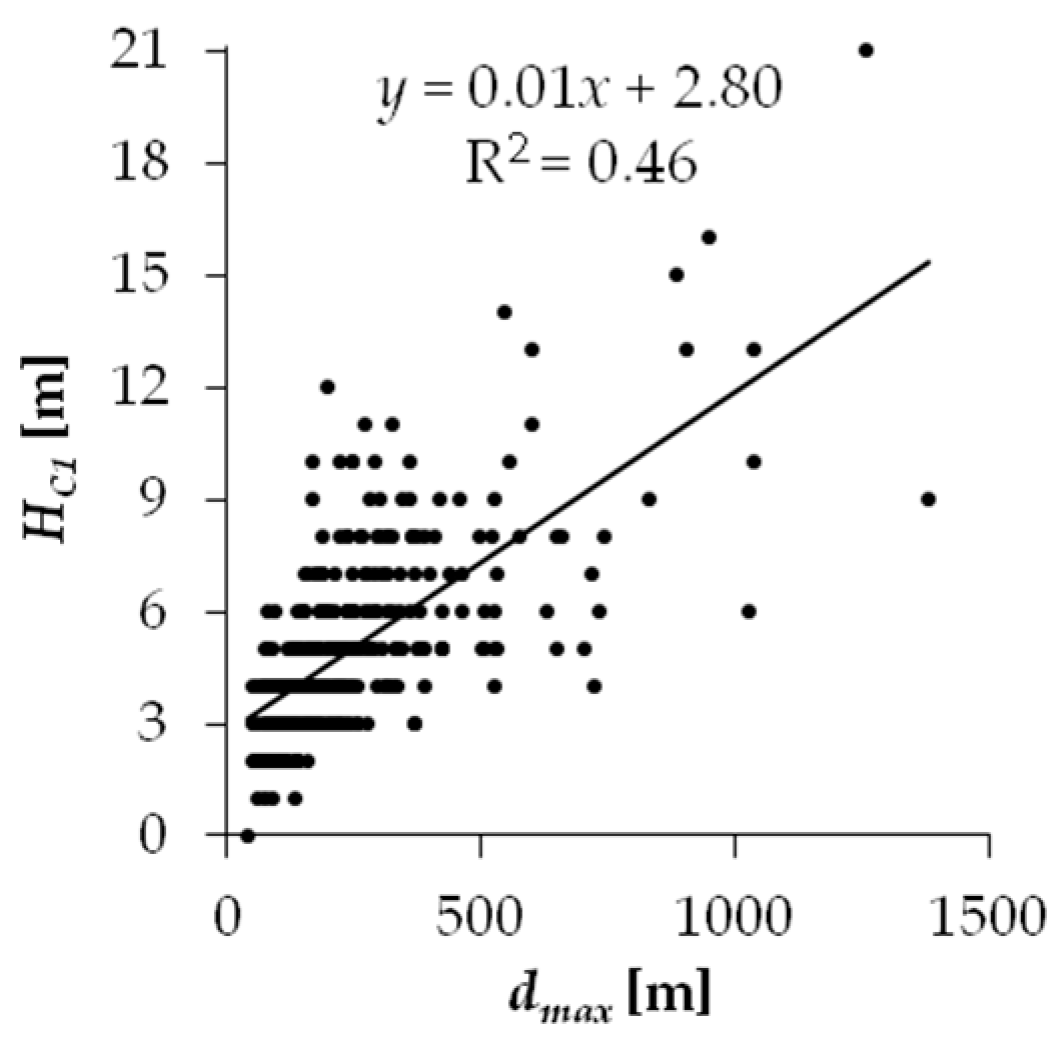
  • Maximum diameter (dmax), i.e., the distance between the two farthest vertices of the tell base, in meters;
  • Maximum (Fmax) and minimum (Fmin) Feret diameters, expressed in meters;
  • Elevation of the tell base (hmin) and top (hmax) based on the DSM, in meters above the WGS84 ellipsoid;
  • Base-to-top height (H), estimated as the difference between hmax and hmin, in meters;
  • Volume (V), estimated as the volume of the terrain between the base of the tell and its surface as provided by the DSM, in cubic meters.
In particular, hmin, hmax, H and V were calculated based on the CartoSat-1 and each of the baseline DSMs and used for comparison.

3. Results

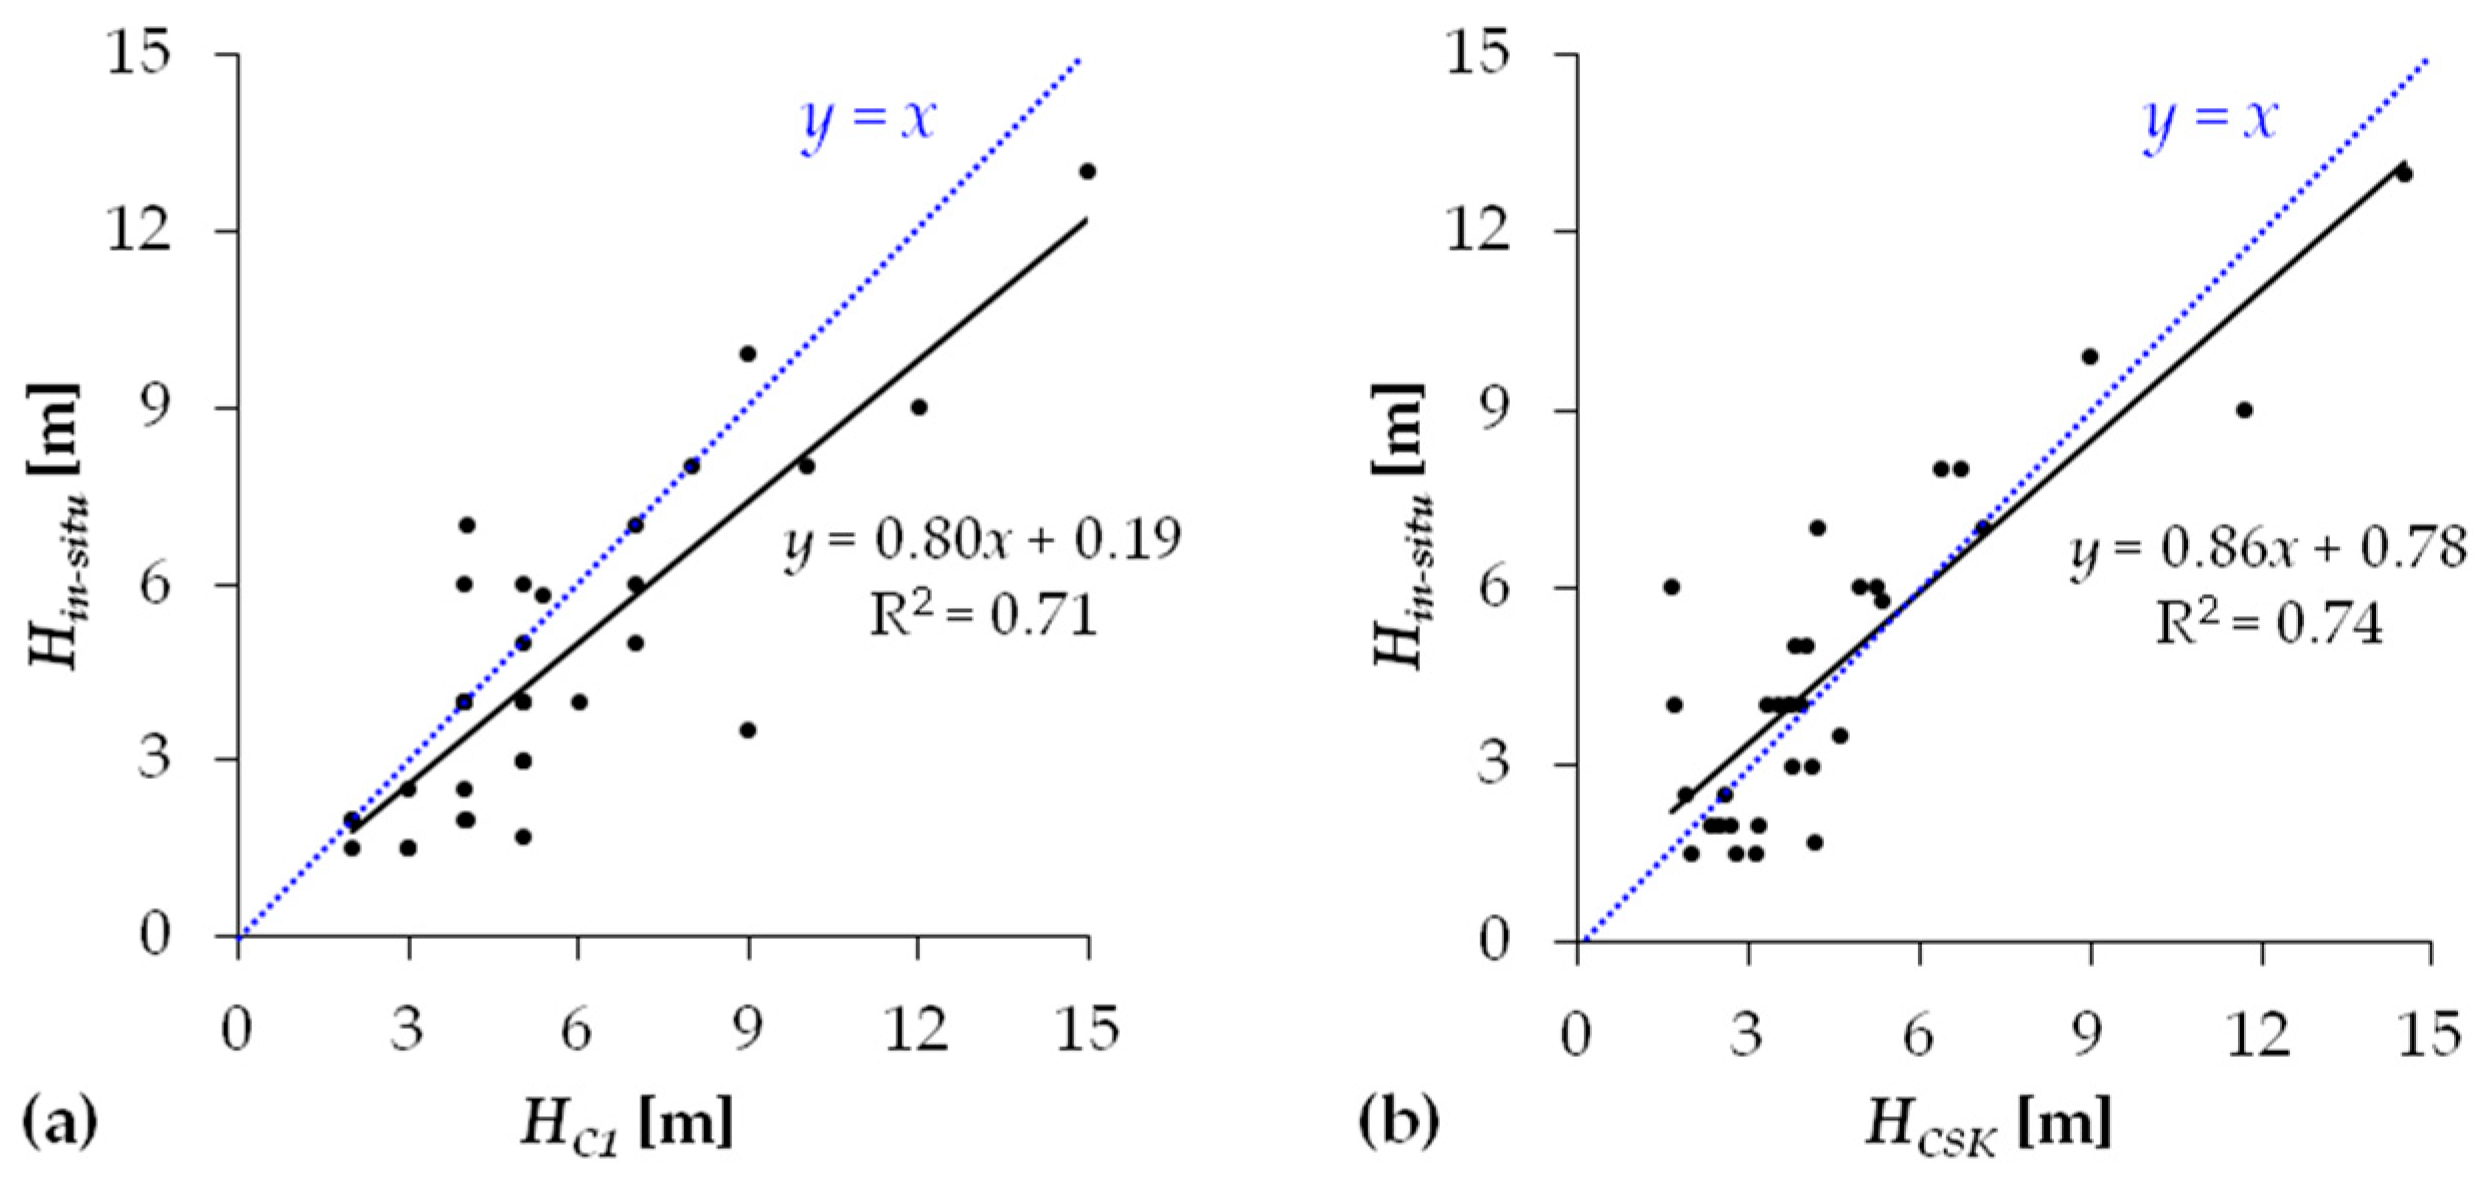
3.1. CartoSat-1 DSM Quality Assessment

The morphology of the test area is generally flat, with elevations (hC1) ranging between −4.2 and +24.9 m above the WGS84 ellipsoid. In such a confined elevation range, tells represent distinctive topographic relieves of Al-Ahrar landscape, as the CartoSat-1 DSM highlights (Figure 3).
Table 1 summarizes the observed minimum, maximum, average, standard deviation and root mean square errors (RMSE) of the elevation differences Δhi of the ~38.3 million pixels of the CartoSat-1 DSM with respect to the three reference DEMs. Average elevation differences are extremely low against all the reference datasets, and no systematic shifts are found across the area. This also comes out very evidently from the histograms in Figure 4, where the distribution of Δhi for each pair of DEMs is centered around the 0 to ±2 m classes. The RMSE confirms the very good vertical accuracy of the product, with ~1.46 m and ~1.16 m against the 30 m resolution SRTM and ALOS datasets, respectively, and ~1.09 m against the 10 m resolution COSMO-SkyMed product. Although these values do not inform on the absolute vertical accuracy of the CartoSat-1 DSM product, they provide an indication of its relative quality against both established global DEMs that are widely used by the archaeological and remote sensing community, and a higher resolution InSAR product that might be generated on demand for specific sites of interest.

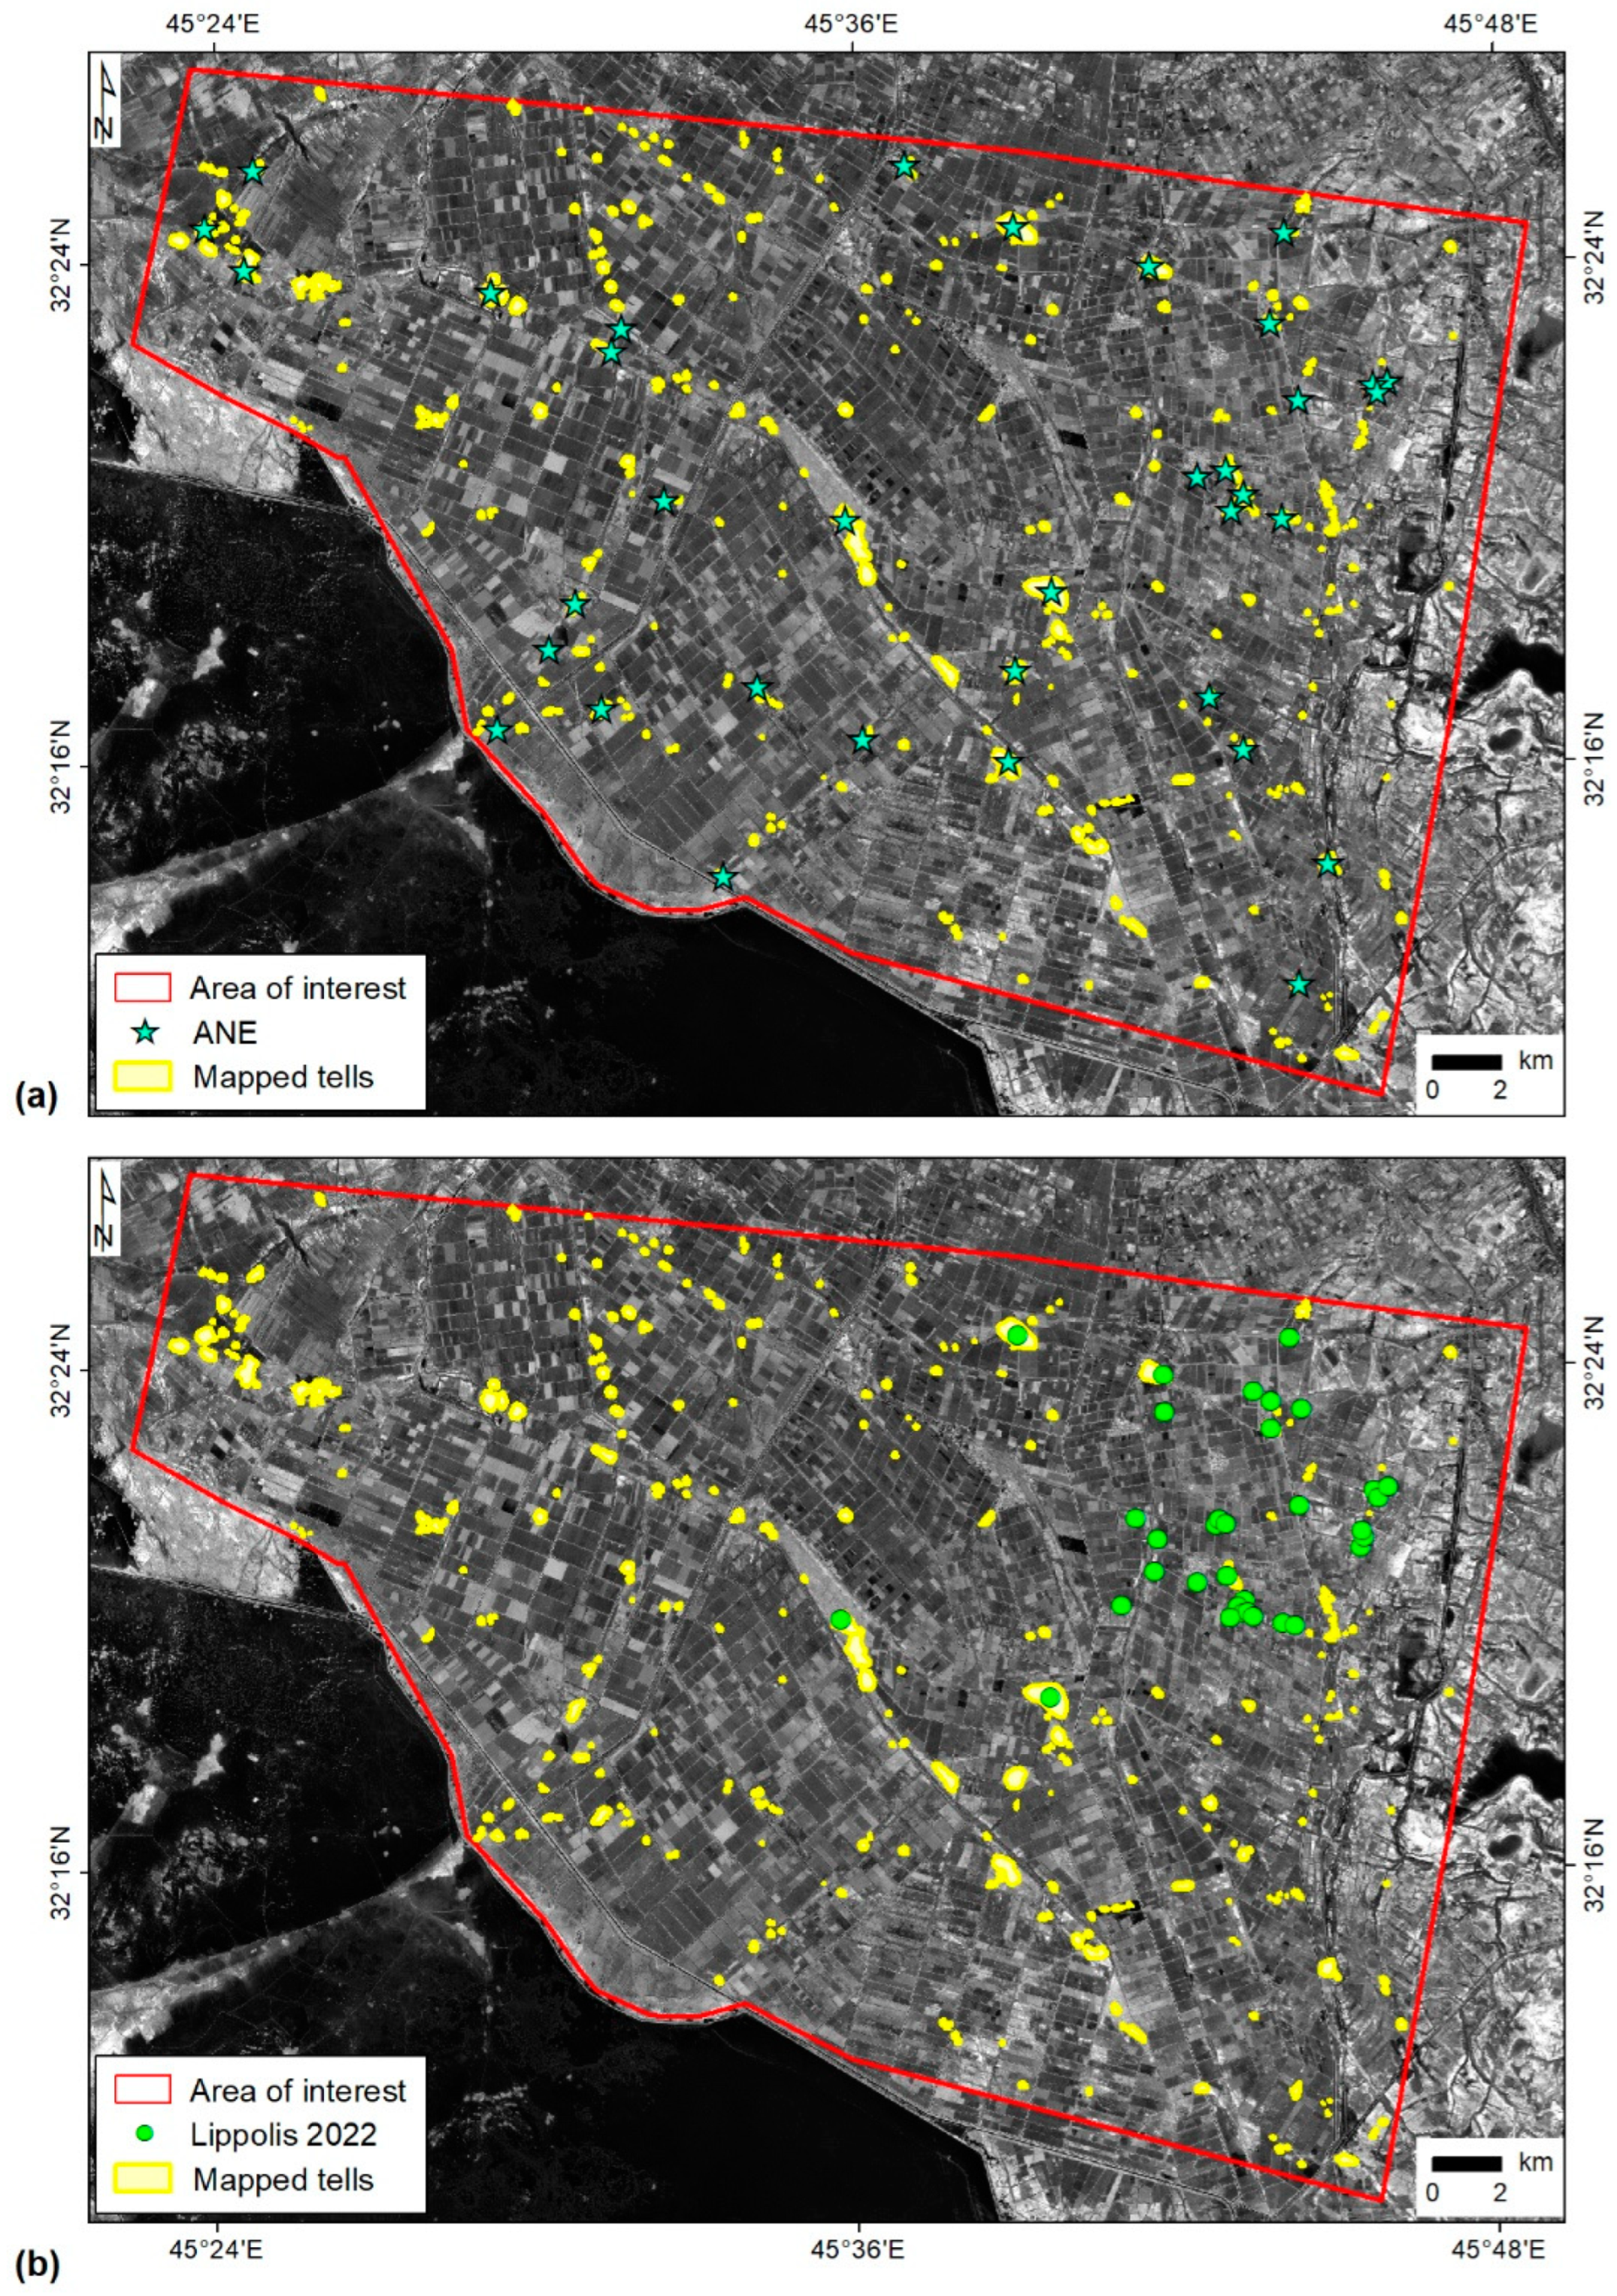
3.2. Mapping of Tells

Using the methodology described in Section 2.3.2, we mapped a total of 344 tells within the test area (Figure 5). This number includes all the 36 sites mapped in ANE (Figure 5a), meaning that our database correctly identifies the same tells that were mapped via the independent remote survey undertaken by Pedersén [23], the latter being already widely used as a source of reference. Moreover, our survey also provides an improvement in the number of detected tells of approximately 10 times compared to the publicly available ANE database. Furthermore, the present digital survey results upgrade the spatial knowledge of mounds in the test area, as it also comes out when the mapped tells are compared with those investigated by Lippolis [49] (Figure 5b) that are later used for quantitative and morphometric comparison (see Section 4.2). However, it must be noted that Lippolis’ report focuses on Tūlūl al-Baqarat area only.
With respect to land cover as per the WorldCover dataset [20] (Figure 1b), nearly 61% of the mapped tells mainly fall within “bare/sparse vegetation” class, while 39% fall in “cropland”. Their spatial distribution substantiates the assumption at the foundation of this research (see Section 2.1) that the test area is dense of tells (i.e., nearly one tell every two km2, and the area occupied by tells spans around 1.7% of the total extent of the test area), spread across the landscape. However, some spatial patterns can be observed. While the location of some tells makes them arranged as clusters, others align along water courses where multi-temporal assessment of landscape changes since the 1960s using CORONA imagery suggests the presence of paleo-channels and paleo-hydrographic features. These spatial patterns are in agreement with those retrieved in a similar mapping exercise in the wider region of Wasit, e.g., in Al-Zubaidiya and Al-Shehamiya sub-districts [3].
To assess the visibility of tells in the CartoSat-1 DSM, benchmarking was made with the COSMO-SkyMed DEM product, given the comparable pixel spacing and resolution, although achieved with completely different imaging mechanisms and type of DEM processing (stereo-photogrammetry and InSAR, respectively). Nearly 80% of the 344 mapped tells are visible in both CartoSat-1 and COSMO-SkyMed products, whereas in a very few cases tells are visible in one of the two products only (3% and 6%, respectively). In addition, ~12% of the tells—the presence of which was known from historical data such as 1968 CORONA imagery—are basically flat, with no elevation peaks against their surrounding landscape (see also discussion in Section 3.4).
Of course, the improved observation capability brought by the pixel spacing of the CartoSat-1 DSM compared to the global DEM products makes the former a much more suitable elevation product than the latter for digital mapping of tells. The exercise of tell detection undertaken by an image-analyst expert highlighted that, in nearly 65% of the cases, it could not have been said that a tell was present based on the AW3D30 only.
With regard to planar shape, the majority of the mapped tells (i.e., 52%) are ‘irregular’ with Circularity (C) generally less than 0.93, while ‘elliptical’ tells (C range of 0.93–0.97) are slightly more abundant than ‘circular’ (C range of 0.97–0.99), i.e., 27% and 21%, respectively. It is worth noting that, when planar shape is intersected with information about landscape changes and site condition, 53% of the irregular tells have been subject to reworking or reshaping or different types of disturbances that have altered the former morphology and elevation (see also examples in Section 3.4). Therefore, anthropogenic impact cannot be neglected in the morphometric analysis of the mapped tells.
With regard to surface extent of the tell base, nearly 91% of mapped tells exhibit Area (A) ranging from 0 to 9 hm2, with 0–3 hm2 being the most represented class, and less than 9% of tells show 9 to 40 hm2 A. The two most apparent outliers are Tell Bismaya H882 and Tell Wilaya—both already recorded in ANE placemarks by [23], with A of ~61 and 74 hm2, respectively. Figure 6a shows the observed relationship between the maximum diameter (dmax) of each tell vs. its A, and the theoretical curve of A for circular tells with the same dmax. Typically, A of the mapped tells follows a quadratic function of dmax, though is less than half of the respective value that a circular tell with the same dmax would have.
As expected, when maximum (Fmax) and minimum (Fmin) Feret diameters are plotted for each tell (Figure 6b), very few tells appear to be perfectly circular, i.e., tells approaching the condition by which FmaxFmin (blue line). The plot shows that Fmax is generally over 50% greater than Fmin, thus indicating typically elongated shapes, either irregular or elliptical.

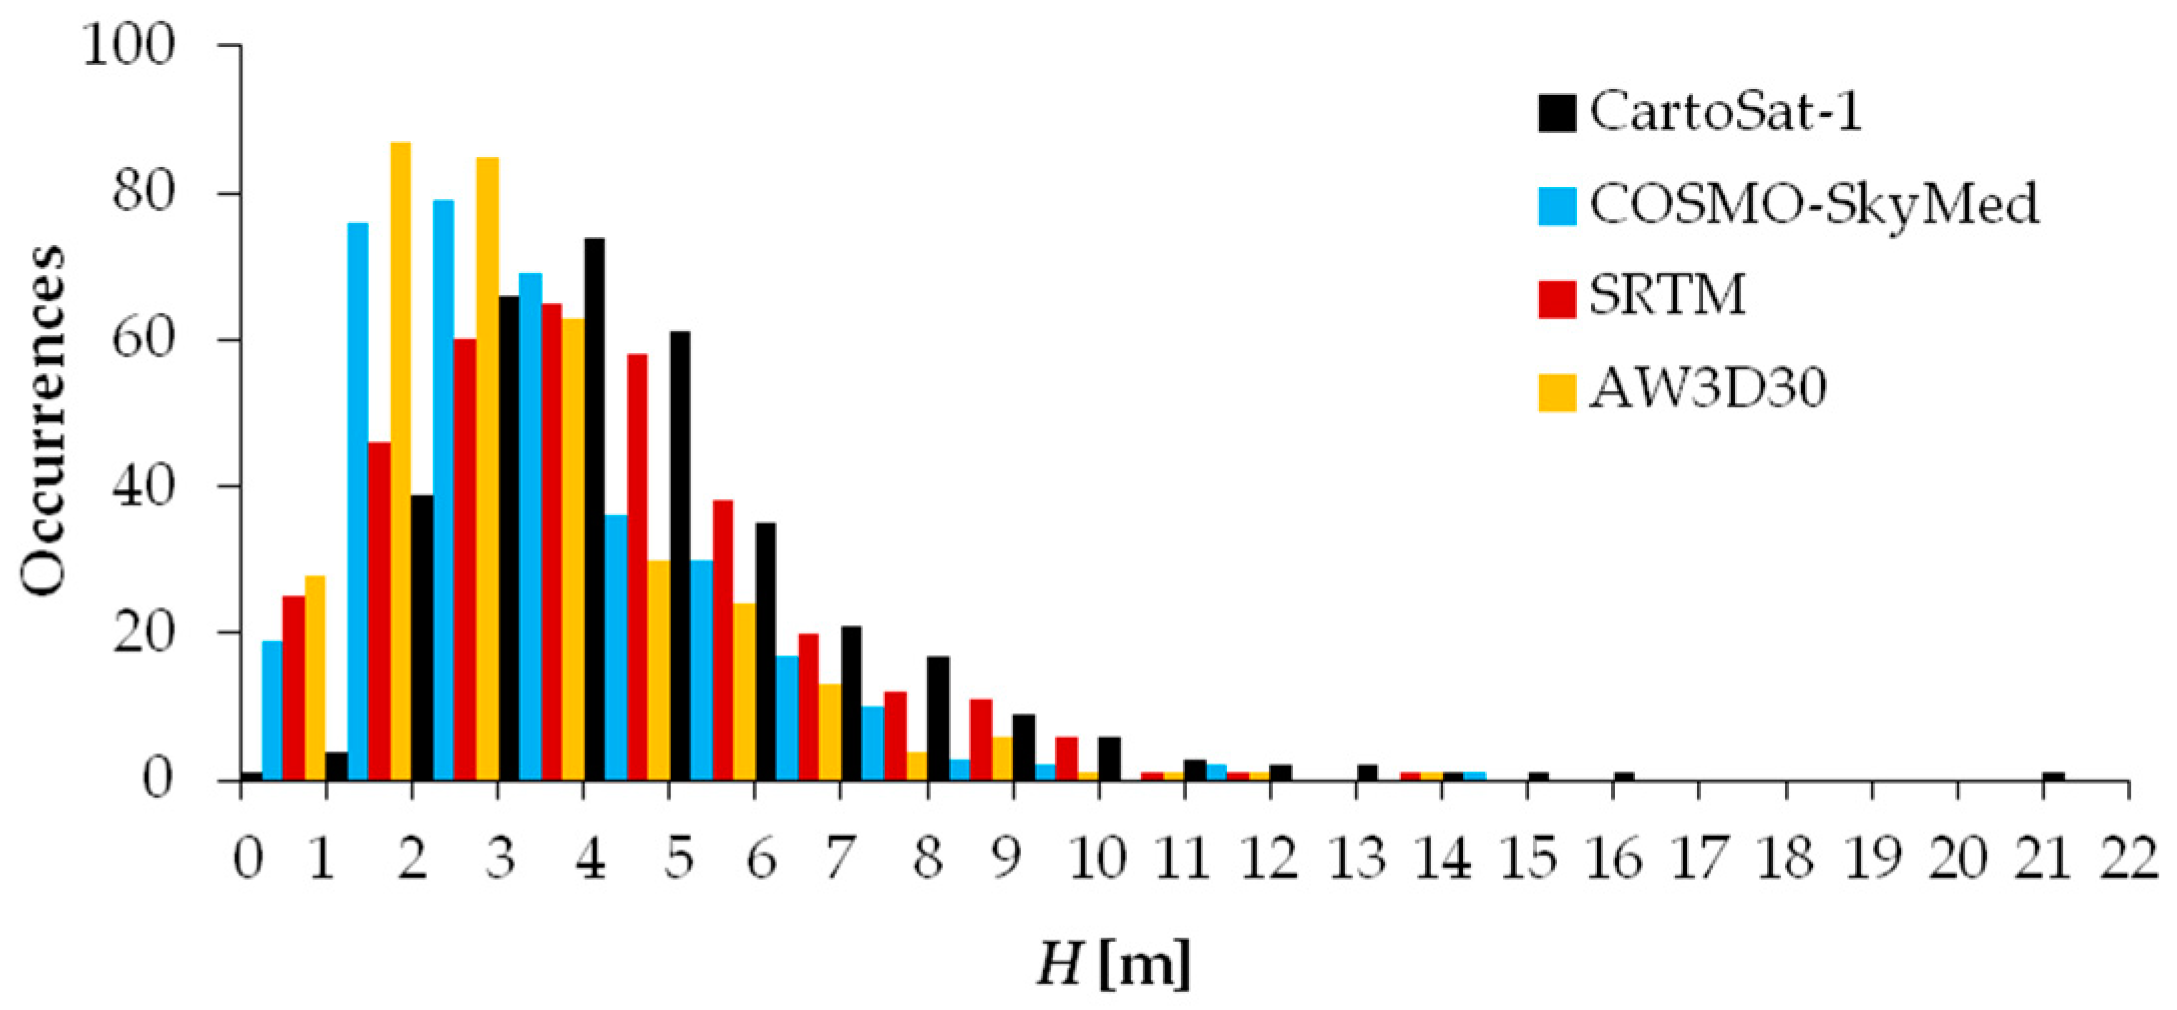
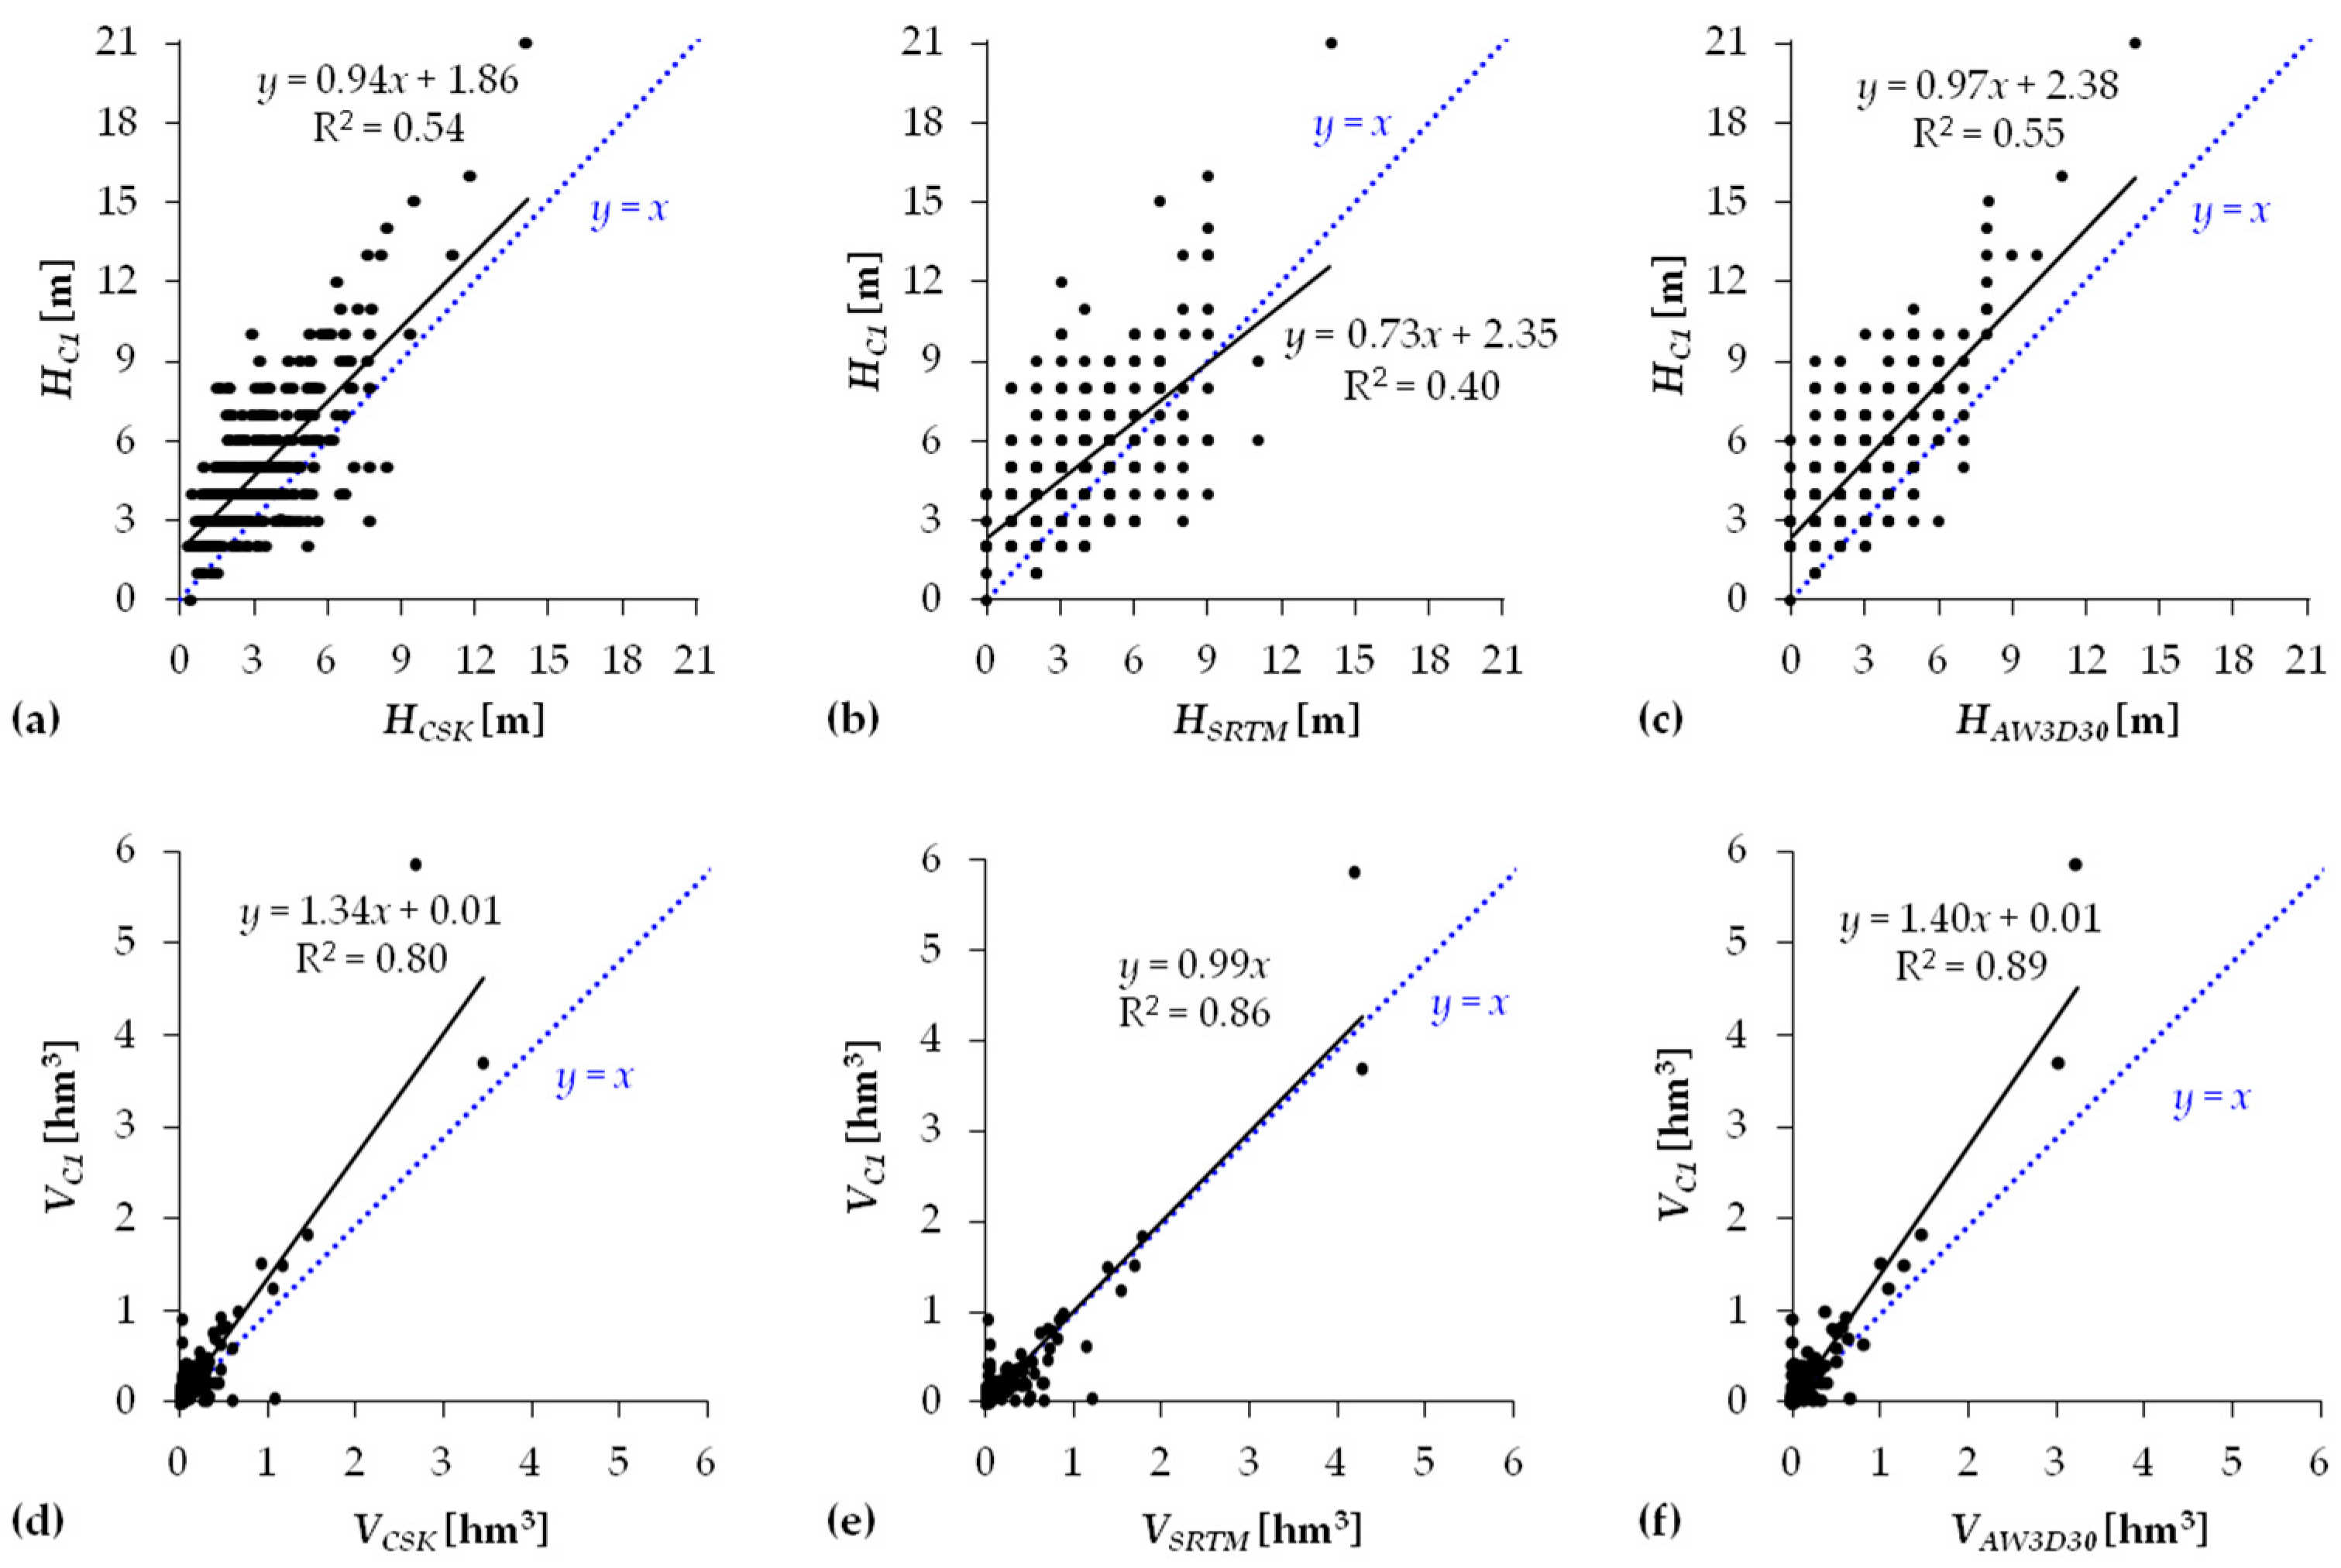
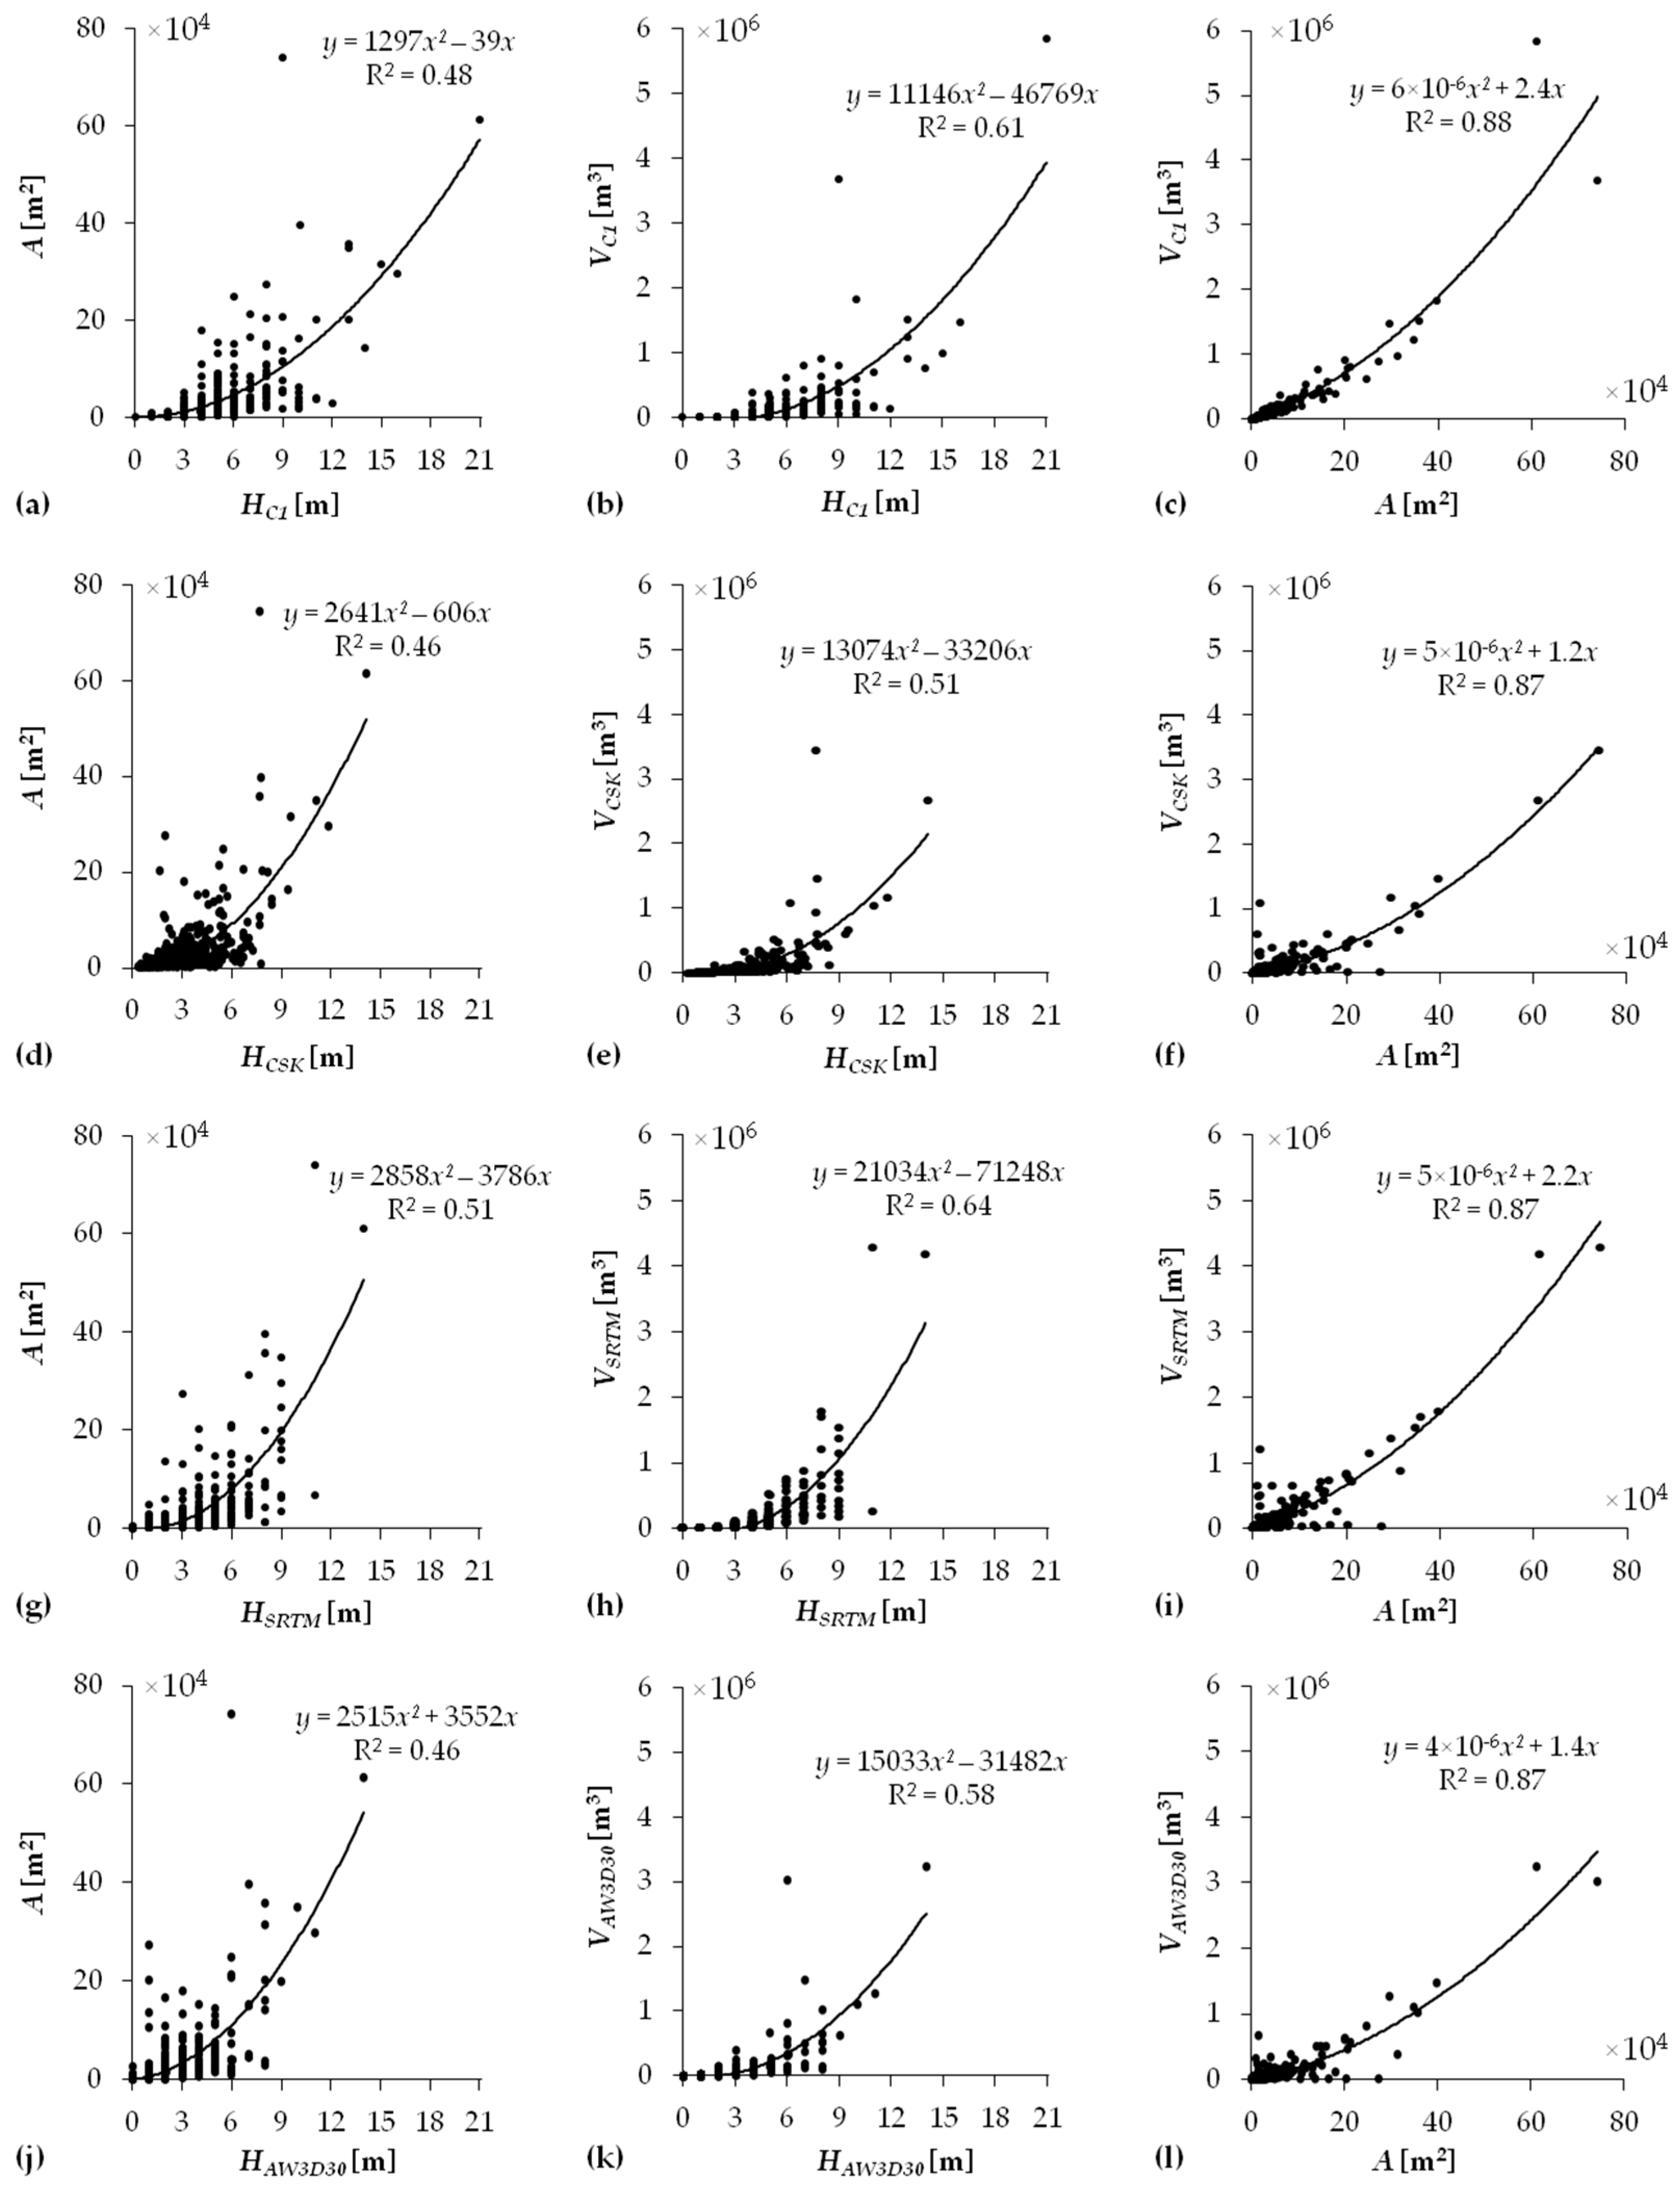
3.3. Morphometric Analysis of Tells

Table 2 summarizes tell height (H) and volume (V) ranges estimated with each input DEM dataset based on the whole sample of 344 mapped tells. Figure 7 instead compares the distribution of the estimated H. By combining this information, it is evident that H estimated from the CartoSat-1 DSM and the SRTM-GL1 DEM are generally higher than those from the COSMO-SkyMed and AW3D30 DEMs, and the shapes of the respective histograms in Figure 7 mutually match.
To further deepen the comparison, tell-wise analysis of H and V is presented for each pair of DEM datasets in Figure 8. In all the plots, H and V exhibit agreement and are distributed around the 1:1 line. However, some distinctions are to be made. With regard to H, values from CartoSat-1 and COSMO-SkyMed datasets (Figure 8a) match with a narrower distribution around the 1:1 line than CartoSat-1 vs. SRTM (Figure 8b) and CartoSat-1 vs. AW3D30 (Figure 8c). Although the slopes of the linear regressions for CartoSat-1 vs. COSMO-SkyMed and CartoSat-1 vs. AW3D30 approach a value of ~1, the intercepts of 1.86 and 2.38 m, respectively, confirm that CartoSat-1 estimates are higher than COSMO-SkyMed and AW3D30 ones, meaning that in general a given tell would appear higher in the CartoSat-1 dataset. With regard to V, the CartoSat-1 vs. SRTM plot (Figure 8e) shows the best match, followed by CartoSat-1 vs. COSMO-SkyMed (Figure 8d) and CartoSat-1 vs. AW3D30 (Figure 8f). In all the three plots, the two points with greatest V coincide with the above mentioned Tell Bismaya H882 and Tell Wilaya that are characterised by the highest A values of the whole tell sample (see Section 3.2).
The investigation of the relationships between A, H and V of the mapped tells based on the CartoSat-1 DSM (Figure 9a–c) reveals some correlation between H and A (R2 equal to 0.48), slightly higher between H and V (R2 equal to 0.61), and definitely much stronger between A and V (R2 equal to 0.88) following a quadratic function (in line with the quadratic relationship between tell H and A observed by Menze et al. [9] using modelled data). The extremely clear correlation observed in the A vs. V plot in Figure 9c suggests that, in the test area, the V of each tell can robustly be calculated based on the simple knowledge of its basal area A, following the quadratic function indicated in the plot. For instance, a tell with a basal area of 40 hm2 is expected to have a volume of around 1.9 hm3, while a tell with a basal area of 20 hm2 is expected to have a volume of around 0.7 hm3.
Similar observations can be made if the same analysis is undertaken with the other three reference DEM datasets (Figure 9d–l). With regard to the A to V relationship, the greatest similarity with CartoSat-1 estimates is found based on the SRTM (Figure 9i), while the relationships based on COSMO-SkyMed and AW3D30 data suggest smaller volumes. This is in line with the generally smaller values of H observed using these two datasets, with respect to CartoSat-1 and SRTM (as discussed above).
Finally, Figure 10 shows the plot of tell dmax vs. H as estimated from the CartoSat-1 DSM. Despite a moderate spread of the data within the plot, some correlation can be observed between the two variables (R2 equal to 0.46 for a linear regression). The regression suggests that tells with dmax of 200 m typically show H of 4.8 m, whilst tells with dmax of 400 m, typically show H of 6.8 m.
The majority of the tells exhibits dmax up to 500 m (i.e., ~90%), with maximum, mean and median H of 12, 4.6 and 4 m, respectively. The latter two values appear of particular relevance, given that previous research proved that COSMO-SkyMed DEM allows detection of both well preserved and leveled or disturbed tells, standing out for more than 4 m from the surrounding landscape [3].

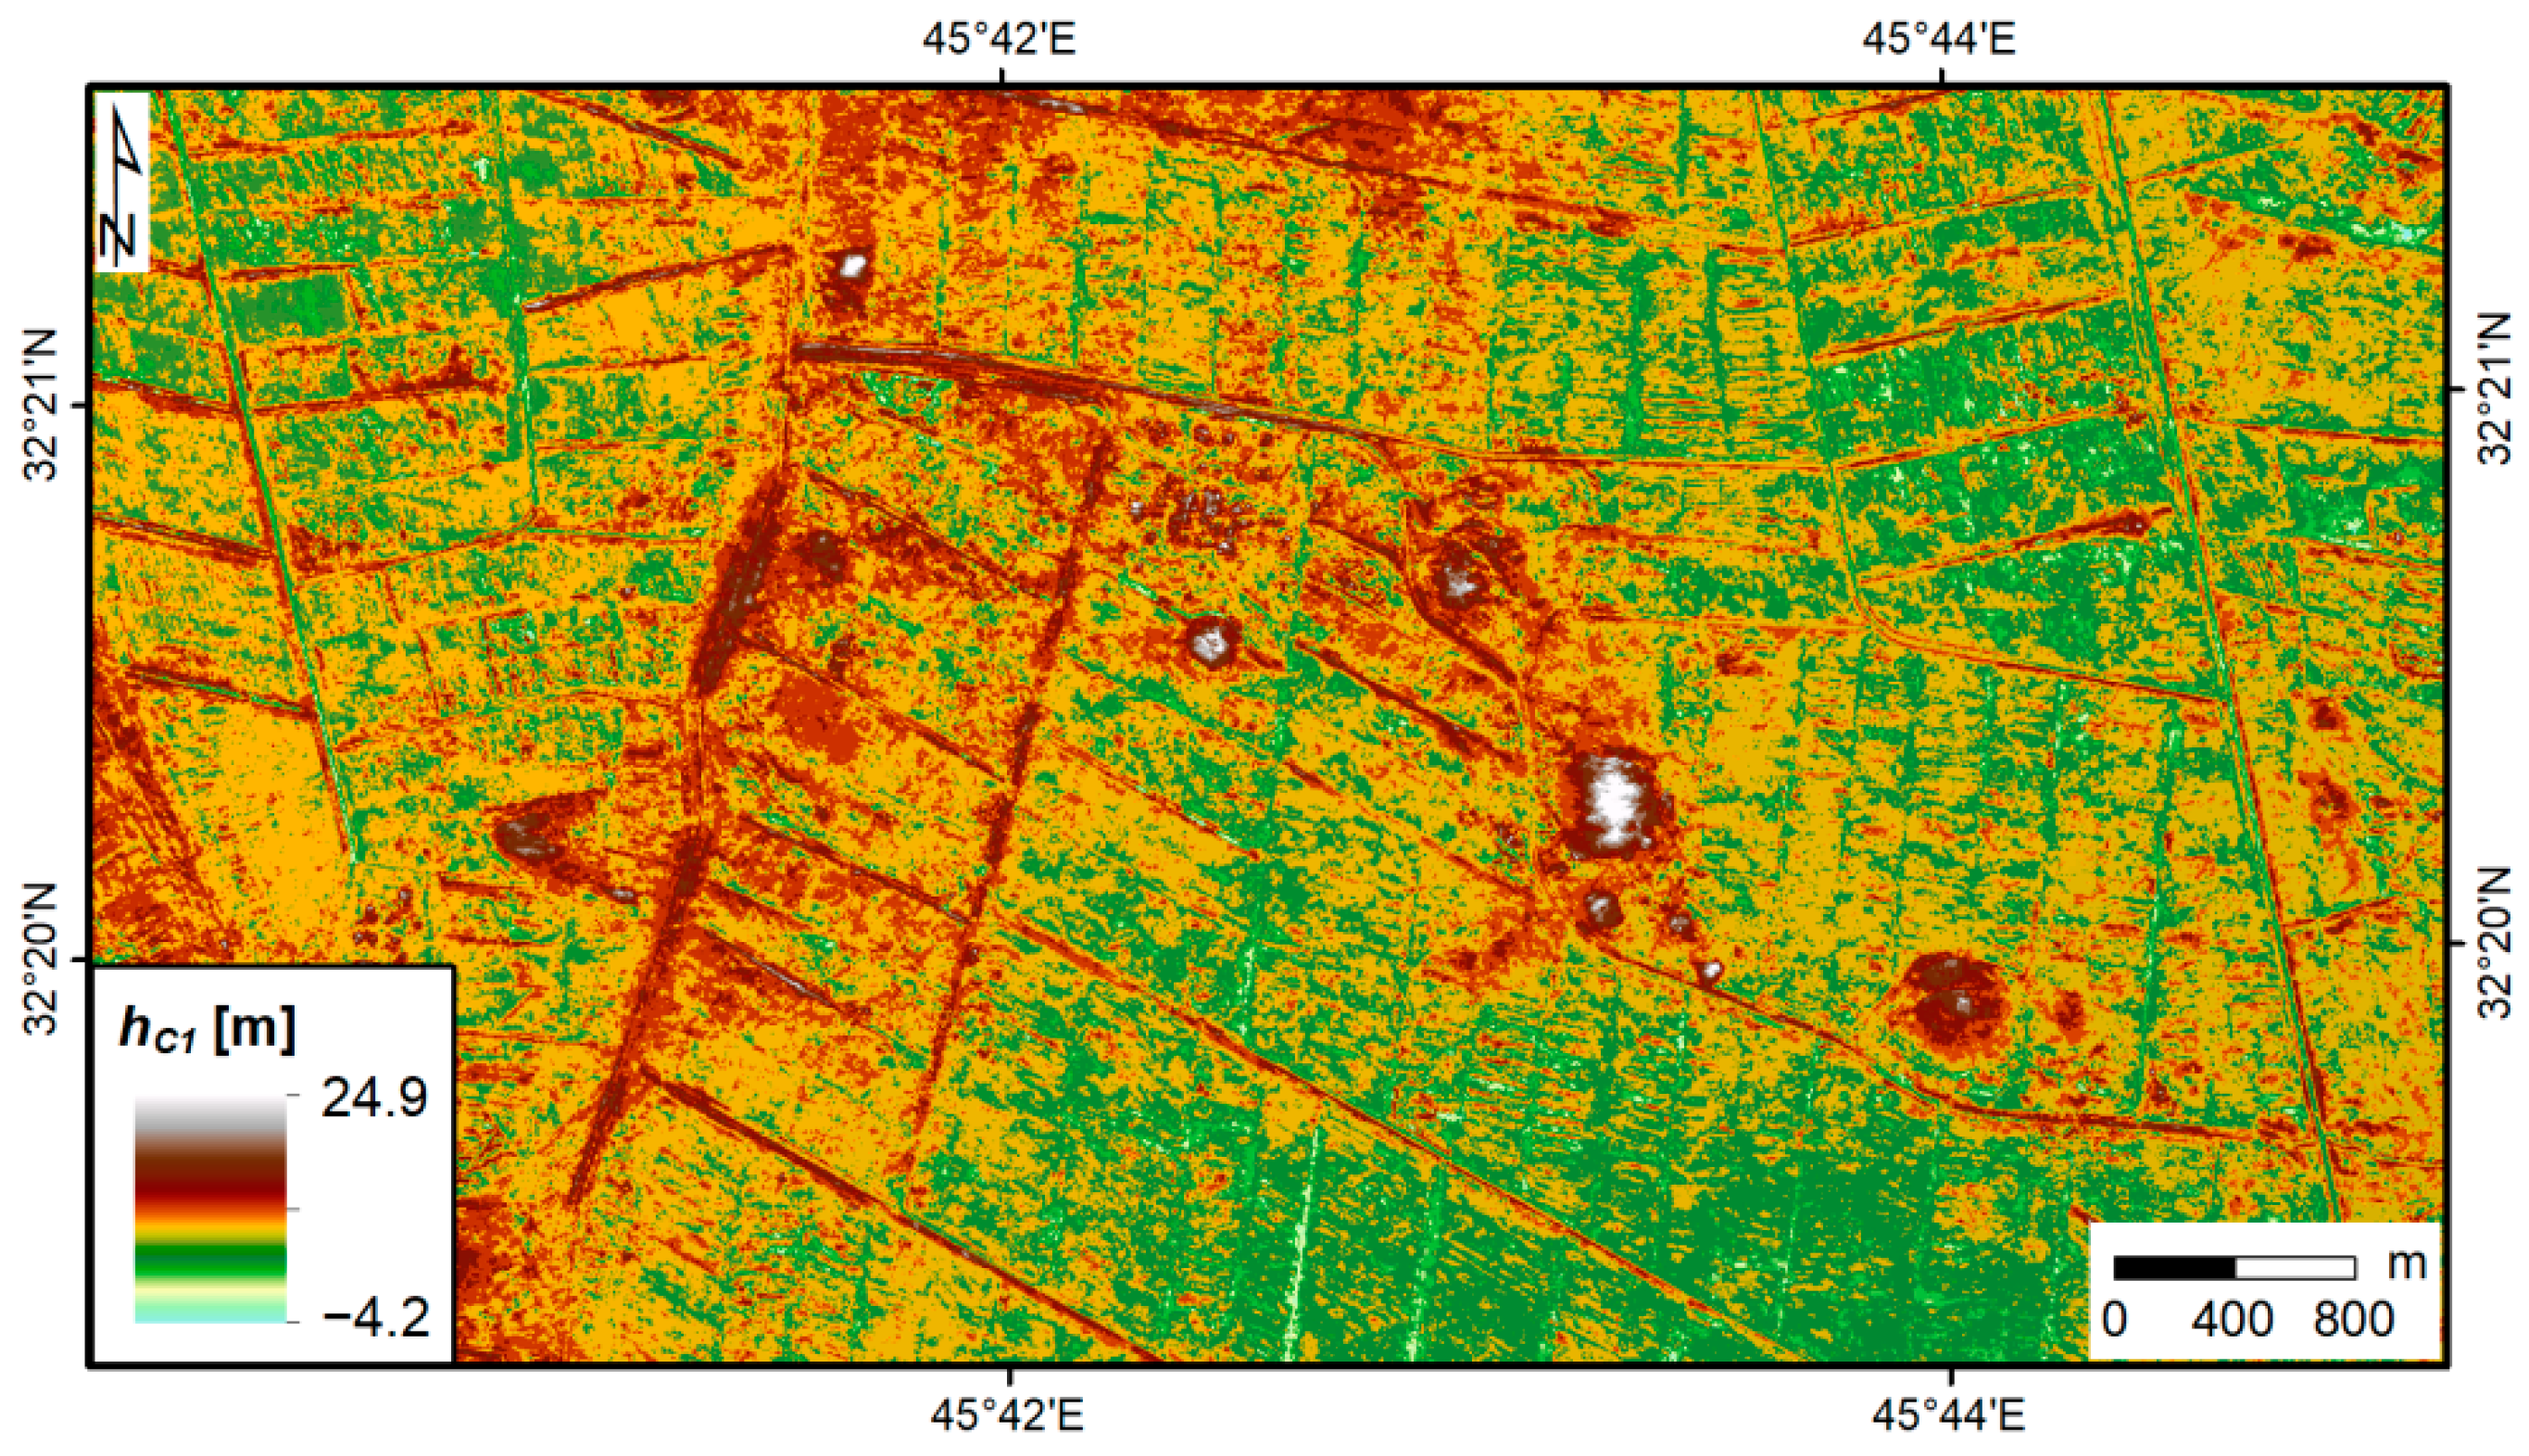
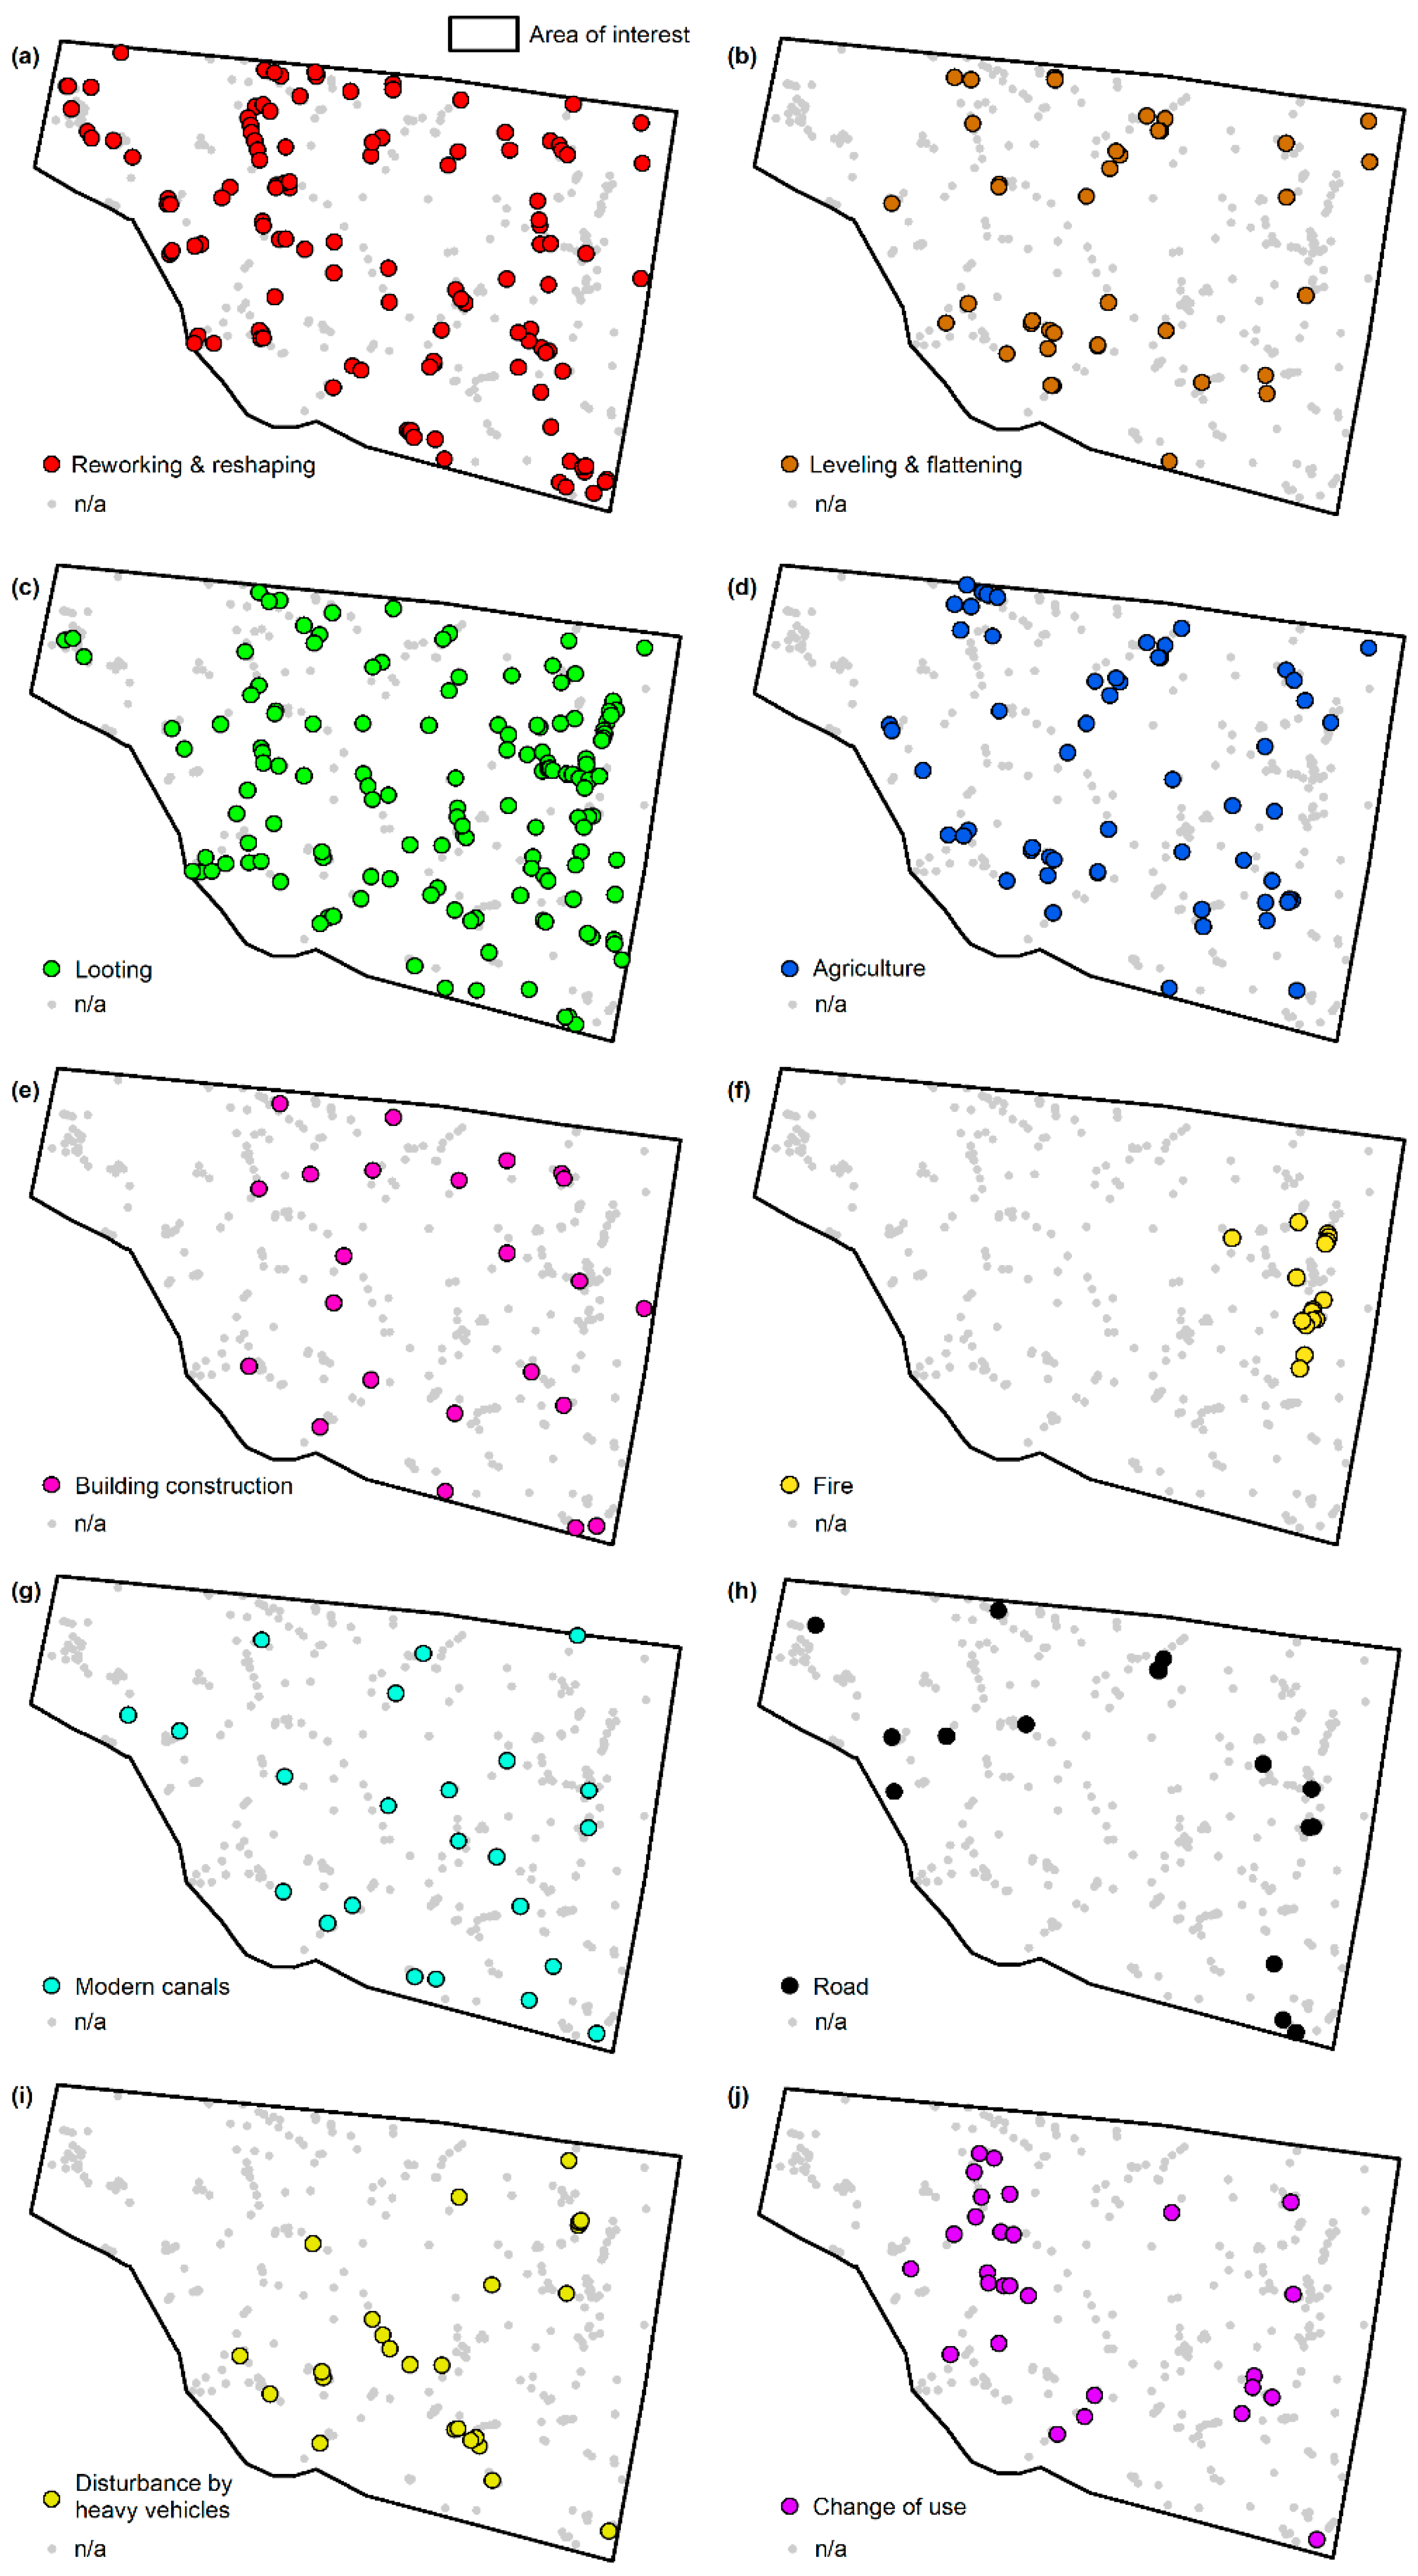
3.4. Evidence of Anthropogenic Disturbances

The integrated analysis of the CartoSat-1 DSM with all the other geospatial datasets (see Section 2.2.2) clearly highlights that, alongside profound and extensive changes of the whole test area landscape, the condition of most mapped tells has changed over time and thus is different from the situation documented in historic Soviet military maps and by CORONA imagery in 1968.
First of all, of the totally mapped 344 tells, 40 are currently flat compared to clear evidence of their presence in CORONA imagery (see also Section 3.2). This means that at least 12% of tells have now disappeared and, in the absence of historical documentation, would not be known.
Figure 11 shows the spatial distribution of the mapped tells by the mostly impacting threats due to anthropogenic actions. The latter are defined accounting for the standard list of primary threats and secondary factors affecting the Outstanding Universal Value of UNESCO’s World Heritage properties [50], as well as the three-tier framework of risk to archaeological sites implemented by Zaina [28] in a neighboring region in southern Iraq. Table 3 summarizes the statistics for all the 344 sites.
It is clear that each tell was affected by more than one threat and anthropogenic actions, with ‘looting’ and ‘reworking and reshaping’ being by far the most common (Table 3) and spatially spread (Figure 11a,c). It is worth noting that these two anthropogenic actions frequently co-exist. In 36% of the cases, tells that were found to have been reworked and reshaped up to the point that their former morphology and shape were substantially altered, were also affected by illegal excavations (albeit not necessarily at the same time). An example is provided in Figure 12. Compared to the shape mapped based on CORONA imagery (Figure 12a), the CartoSat-1 DSM highlights substantial alteration of the local topography (Figure 12b), as well as fragmentation between higher peaks also due to the construction of a SW-NE-oriented modern canal cutting the southern part of the tell and isolating a higher elevation islet (red arrows in Figure 12b). Furthermore, owing to the high resolution of the DSM, trenches along the northern side of the tell are clearly depicted (white arrows in Figure 12b). While it is plausible that the disturbances and topographic alterations happened prior to CartoSat-1 image acquisition, the multi-temporal comparison with the COSMO-SkyMed DEM produced using SAR images collected in May 2018 suggests that further alteration phases occurred in more recent years. The topographic pattern of the southern islet is definitely weaker and smaller (red arrows in Figure 12c) and different elevation values characterize the northern side of the tell (white arrows in Figure 12c). It is therefore evident that, in the relatively short time span between the CartoSat-1 DSM and COSMO-SkyMed DEM products, the tell has been further reworked and reshaped. This is confirmed by the contextual multi-temporal analysis based on Google Earth imagery, wherein subsequent phases of trenches for modern canals are documented (Figure 12d–f), but also the southern islet has been progressively leveled since at least January 2018 (Figure 12e). The insets in Figure 12g,h reveal that, in parallel, looting pits were illegally dug, plausibly in search of goods from the buried structures that are visible in the central-western part of the tell (squared patterns in Figure 12e).
A similar observation can be made for ‘agriculture’ and ‘leveling and flattening’ that are the second most recurring anthropogenic actions (Table 3), and exhibit matching spatial distribution (Figure 11b,d). In this case, 75% of the tells that were leveled are now crop fields. An example of this situation is showed in Figure 13. The three tells completely disappeared (Figure 13b,c) and their former presence would not have been known without the historical records provided by CORONA imagery (Figure 13a). The very high percentage observed provides corroborating evidence that one of the main reasons for leveling and flattening mounds is in order to increase the available land for farms. This was also observed by other scholars, e.g., Zaina [28] in the QADIS area, south of El Delmej reservoir, i.e., less than 20 km south-west of Al-Ahrar test area.
More sparse is the distribution of incidents due to ‘building construction’, ‘modern canals’, ‘road’, ‘disturbance by heavy vehicles’, and ‘change of use’ (Figure 11e,g–j), with the latter showing a clear densification of incidents in the western part of the test area and, in 79% of the cases, being associated with ‘reworking and reshaping’. Figure 14 shows an example of two neighboring tells (labeled “i” and “ii”) affected by ‘change of use’ and ‘modern canals’, respectively. Both tells were clearly delineated in CORONA imagery (Figure 14a), while in the CartoSat-1 DSM they appear significantly modified (Figure 14b). In the first case (tell “i”), more than half of the total extent of the former topographic relief has been lost, as clearly outlined by the residual topographic pattern in the CartoSat-1 DSM (Figure 14b). The contextual multi-temporal analysis based on Google Earth imagery reveals that the tell has been recently further reworked and reshaped (Figure 14c,d,f,g), and these modifications were preparatory to the current change of use (Figure 14e) in connection to very recently built farm dwellings (Figure 14h). In the second case (tell “ii”), the topographic relief is still visible in the CartoSat-1 DSM (Figure 14b), but the tell is now crossed by modern canals and currently seems abandoned (Figure 14e), as the last phase of a sequence of changes occurred inside its boundaries (Figure 14c,d).
A separate consideration can be instead made with regard to ‘fire’ incidents. They are all located in a confined sector of the eastern part of the test area and refer to 2013, when Google Earth imagery clearly shows burning patterns and scars (Figure 15). The latter are mostly found within the tell perimeter (Figure 15b,c,e) and along the base boundaries (Figure 15d). Whereas, very few to no burning signs are observed in the nearby crop fields. This suggests an intentional action of burning the mounds top. However, there is no clear evidence that the observed burning is related to a practice aiming to clear the land for crops (as documented in other circumstances across the Middle East), given that later satellite imagery does not show conversion of these tells to agricultural use. On the other side, 12 out of 16 tells were also affected by looting and in many cases satellite imagery suggests the presence of buried structures of potential archaeological relevance.

4. Discussion

4.1. Quality Assessment and Impact on Tell Mapping

The statistics shown in Section 3.1 highlight a very good accuracy of the CartoSat-1 DSM product against the 10 m resolution InSAR-derived COSMO-SkyMed DEM and the 30 m resolution global DEMs, and reassure about its suitability to support the archaeological mapping of deposits and tells.
Of course, the visibility of the anthropogenic features is much more enhanced compared to the global DEM products. The statistic that nearly 65% tells would not have been detected based on AW3D30 only speaks for itself. Differently, when it is compared to the high resolution product, some considerations on the CartoSat-1 DSM performance can be made. The statistics reported in Section 3.2 prove that the CartoSat-1 DSM allows for a tell detection rate comparable to COSMO-SkyMed StripMap product, and suggest that the two products are mutually complementary datasets. Accounting that the CartoSat-1 DSM is distributed as a global coverage commercial product referring to the specific year when the input satellite imagery were collected, while COSMO-SkyMed StripMap DEM used in this research can be generated as a tailored product as new satellite SAR image pairs are collected [3,51], these two datasets could be jointly used for multi-temporal change detection for purposes of condition assessment (and same would apply to other repeatable DEM sources of equal or better spatial resolution and vertical accuracy). Further discussion is provided in Section 4.3.
The performance of the CartoSat-1 DSM for tell detection in southern Iraq can be measured by comparison with what was achieved by using the other geospatial datasets showing the presence of tells that are publicly available for the region (see Section 2.2.2). The digital survey with the CartoSat-1 DSM results in a total number of mapped tells that is one order of magnitude higher than the 35 mounds visible in the historic Soviet military maps and the 36 tells recorded among the ANE placemarks within the same area. However, some distinctions are to be made. In the case of the Soviet maps, the mapped features were only indicative and, in very few instances, provided a clear indication of the presence of tells that were later confirmed by the CartoSat-1 and COSMO-SkyMed datasets. On the contrary, a perfect match was found with the ANE placemarks, given that all the ANE sites mapped by Pedersén [23] were also detected with the CartoSat-1 DSM (see Figure 5a). However, the mounds detected with CartoSat-1 (i.e., 344) are overwhelmingly more abundant than ANE (i.e., 36). This result provides a further proof that the ANE database is a very good entry point resource for the study of archaeological mounds, but it is not exhaustive, can be improved (as also acknowledged by the producer [23]) and there is enough room to fill the current gaps with satellite imagery and higher resolution DEMs (as found in previous research over the whole Wasit region [3]).
Compared to the existing literature focusing on the test area, a reliable comparison can be made with the survey results published in [49]. This interim report provides geographic coordinates of the tells surveyed by the archaeologists (see green dots in Figure 5b), alongside pictorial evidence, also through the aid of Google Earth, Bing and other satellite imagery for the archaeological area of Tūlūl al-Baqarat (see Figure 3), thus allowing for a unique identification of tells. In this area located about 20 km south of the modern city of al-Kūt, a total of 10 (namely, tells TB1–TB10) and 22 (namely, tells T1–T22) tells in Tūlūl al-Baqarat and its nearby, respectively, were mapped [49]. The size of these tells ranges from 70 to 1370 m by 50 to 750 m, with area from less than 0.5 hm2 to 74 hm2, thus providing a quite varied sample of tells. The final result of our comparison is that all the 32 tells were also recorded in our survey with the CartoSat-1 DSM and COSMO-SkyMed DEM (Figure 5b). In the absence of other published catalogues of equal detail and available to the present study with which to run the same comparison, the perfect match with [49]—albeit confined to 9% sample of the totally mapped tells—is definitely a good indicator of the performance achieved using the CartoSat-1 DSM.

4.2. Comparative Morphometric Analysis of Tells

One of the key outcomes of the comparative assessment presented in Section 3.3 is the relationship found in the test area between tell A and V (see Figure 9 and specifically the plot in Figure 9c). This relationship opens the possibility to achieve a robust estimation of V for a given tell with CartoSat-1 DSM based on the sole knowledge of its A. This is especially relevant for those tells that are known from historic maps only, but for which the volume cannot be estimated using the available DEMs because their morphology has now been partially to totally leveled and any information about their elevation has been lost.
Figure 16 showcases another advantage brought by the CartoSat-1 DSM and, in particular, the morphometric derivatives extracted from it to enhance the visibility of tells. As proven by the abundant literature on tell detection in CORONA imagery (e.g., [52,53]), tells are easily detected as lighter spots against the surrounding natural environment and owing to their distinctive morphologies such as the shape and the casting of shadows (Figure 16a). Therefore, an archaeologist would use this approach to map tells in CORONA, as was done here and in [3] to create the reference database. Additionally, spectral analysis of recently acquired Sentinel-2 images would provide a further confirmation of the distinctive fingerprint of tells compared to the surrounding crop fields and modern structures (Figure 16b).
A further enhancement is achieved with the CartoSat-1 DSM derivatives, such as the TPI which takes values higher than +3 m for all the main peaks and topographic relieves falling within the mapped tells (Figure 16d where the color scale is saturated between −3 and +3 m). Consequently, DEV values ranging from +1 to +12.3 mark the location of the tells (Figure 16e), although it is to be noted that similar DEV values can be found in other patches of the landscape that are not associated with tells but are higher than the surrounding landscape (such as raised pathways between crop fields), and thus TPI seems to be a more selective index in the majority of the instances.
With regard to the morphometric analysis, the statistics on shape and surface extent provided in Section 3.2 are those coming from the automatic computation made in GIS on the mapped tells and follow the equations illustrated in Section 2.3.2. As such, they are objective and replicable morphometric estimates and, because they are retrieved from a high resolution DEM product, can capture the micro-topography of the sites (though with vertical resolution of 1 m, due to the integer nature of the elevation values in the CartoSat-1 DSM; see Section 2.2.1). The intrinsic limitation is, however, that these morphometric estimates are desk-based. Therefore, they may be subject to refinement or revision to account for the archaeological evidence found in the field.
Figure 17 shows two examples where the desk-based drawn tell boundaries are compared with those verified in the field and published in [49]. In the first case (Figure 17a,b), i.e., tell Bismaya H882 (namely tell Tūlūl al-Baqarat T15, as per the nomenclature in [49]), the boundary drawn from satellite data (i.e., CORONA and CartoSat-1 DSM; see solid line polygons in Figure 17a,b) results in a correct zoning of the main central relief but, at the same time, is an underestimation (and consequentially an erroneous shape classification) compared to the total surface extent of the tell that was mapped and inspected in situ by archaeologists (see gridded pattern polygon in Figure 17b). Vice versa, in the second example (Figure 17c,d), the boundary drawn based on the CartoSat-1 DSM and the other geospatial datasets encompasses both the topographic relieves (namely tells Tūlūl al-Baqarat TB1 and TB6, as per the nomenclature in [49]), as if they were a single tell feature together. Whereas, based on the archaeological survey and interpretation of the local records, archaeologists mapped tell TB6 as a separate feature from TB1 (Figure 17e).
These examples should not be read as false positives or negatives of the proposed method or, worse, as an indication that the method does not work as intended. They are, indeed, a confirmation that, in their objectiveness, the outcomes from digital surveying using the CartoSat-1 DSM can serve as a desk-based assessment in preparation for (and not as a replacement of) in situ surveying and archaeological investigations and interpretation in the field. As a further corroboration, the same approach was implemented by Lippolis [49]. Based on optical satellite imagery only, tell TB3 was classified as a separate feature and then, after the in situ inspection, was revised to be considered as part of the same archaeological context as tell TB2.
To validate tell height values, we exploited the same sample of 32 tells documented in [49] that are used in Section 4.1 for the assessment of the mapping results. The plots in Figure 18 compare the in situ measurements of tell height extracted from [49] with the height values derived from the CartoSat-1 DSM and the COSMO-SkyMed DEM, respectively. In both cases, the correlation is high (R2 is higher than 0.7), with COSMO-SkyMed estimates being slightly more narrowly distributed around the 1:1 line than CartoSat-1 ones. Except for three cases only where CartoSat-1 estimates diverge from in situ measurements of about 3 to 5.5 m, all the other values match well, thus providing an encouraging evidence on the accuracy of the CartoSat-1 DSM for tell height estimation. It is plausible to expect that a higher R2 and better fitting could be achieved if more in situ measurements were available, alongside precise information about the exact point in the field where these measurements had been taken. In this respect, some uncertainty derives from the lack of such information in the case of the in situ measurements found in the literature and used in this validation exercise, and needs to be accounted for in order to fairly assess the relationships displayed in Figure 18.

4.3. Condition Assessment and Anthropogenic Impacts

The morphological analysis based on the CartoSat-1 DSM product and its combination with multi-temporal satellite imagery clearly show that tells in Al-Ahrar sub-district are located in a dynamic changing landscape and, as such, are currently subject to anthropogenic encroachments threatening their preservation. However, the condition assessment presented in this paper and the associated statistics are to be considered as a lower bound and a conservative estimate of the condition on site. In situ surveys and more recent observations may update these findings and reveal further damage and transformations.
An intrinsic constraint on the present study, indeed, comes from the acquisition date of the exploited satellite imagery. Google Earth collections are unevenly distributed over the whole test area from 2002 to 2020; the CartoSat-1 DSM and COSMO-SkyMed DEM products were generated from satellite images taken in 2010s and 2018, respectively; Sentinel-2 scenes selected as the most recent comprehensive data source refer to years 2019–2022, despite a spatial resolution that not always is sufficient to provide the needed detail to achieve a comparable observation level to update observations made on very high resolution Google Earth and CartoSat-1 orthorectified images.
These diverse data combined together compose a multi-temporal dataset that enables multiple observations and tracking of transformations and changes. The latter can be due to either different processes and threats affecting each tell or a more distributed sequence of incidents belonging to the same process (e.g., conversion to agricultural land starting from reworking and reshaping and progressing up to flattening and leveling, to conclude with ploughing, sowing and harvesting). Additionally, satellite imagery may have incidentally captured very event-related impacts—such as the burning scars and patterns observed in Google Earth imagery taken in 2013 over the eastern part of the test area—that, otherwise, would not have been documented. Again, it is likely that many other similar incidents have occurred and the achieved statistics cannot account for them.
A key contribution that the CartoSat-1 DSM product can bring when added to a multi-temporal dataset is clearly on enabling a quantitative morphometric estimate of the impacts caused by anthropogenic modifications of tells. In this regard, the figure by which 53% of the irregularly-shaped tells have been subject to reworking or reshaping (see Section 3.2) suggests that a DEM product of suitable spatial resolution is a helpful resource to document types of anthropogenic disturbance that may have altered the former morphology and elevation, to complement visual inspection of satellite imagery.
Finally, the example provided in Figure 12 is a proof of concept of what can be achieved with the CartoSat-1 DSM product in a multi-temporal analysis with other DEM products of comparable resolution produced from older or more recent satellite imagery, although a more robust 1:1 comparison could only be made if two CartoSat-1 DSM products referring to two different periods and generated with the same image processing were compared.

5. Conclusions

The present research is focused on the CartoSat-1 Euro-Maps 3D DSM dataset that was accessed as a commercial high resolution elevation product open for research and application development, to investigate the suitability and usefulness for landscape archaeology studies. Given that the CartoSat-1 DSM is available for different geographic locations at high to very high archaeological potential, and its spatial resolution and horizontal posting significantly upgrade those provided by free and open satellite-derived DEMs (e.g., SRTM and AW3D30) that are commonly used by archaeologists, it is envisaged that the demonstration illustrated in this paper may encourage further use of the CartoSat-1 DSM in landscape studies.
The results achieved during the experiment carried out on the test area of Al-Ahrar, Al-Nu’maniya, in Wasit, southern Iraq, prove that the CartoSat-1 DSM is a valuable product for detection and mapping of tells and topographic relieves of anthropogenic origin. The performance is comparable with other DEMs of similar spatial resolution and horizontal posting, such as those generated by means of InSAR techniques like the COSMO-SkyMed DEM produced from 3 m StripMap SAR imagery. Furthermore, the quantitative comparison with SRTM and AW3D30 reassures about the reliable accuracy achievable with the CartoSat-1 DSM for tell detection and morphometric analysis.
The total amount of 344 mapped sites is one order of magnitude higher than the one reported in previous mapping exercises and databases, and the one that could be produced using historical maps. Additionally, this figure substantiates the high density of sites contributing to the rich archaeological heritage of this portion of Wasit. In this regard, the present digital survey upgrades the spatial distribution of the records about mounds and topographic relieves, and thus may improve the understanding of settlement patterns in the region (which, however, is beyond the scope of this study and is left to future dedicated archaeological work).
For each site it was possible to retrieve morphometric derivatives, including the two morphometric indices known as Topographic Position Index (TPI) and DEViation from mean elevation (DEV). These indices were tested to facilitate the detection of tells and topographic relieves. The enhancement achieved over Al-Ahrar suggests that TPI was a more selective index in the majority of the instances.
Intentionally, the research presented in this paper aims to provide a proof of concept of the use-case by which the CartoSat-1 DSM is utilized by archaeologists to detect and map mounds and topographic relieves from remote. Whereas verification by means of in situ inspection remains the main mean (if not even the only way) to assess whether a topographic relief is archaeologically relevant or not, or a burial mound hides an archaeological site, or the chronology to which it belongs, the proposed method can be used in preparation of field investigations, as well as when in situ surveying and ground-truthing cannot be undertaken or are not feasible. This is the use-case scenario of reference to also account for the evidence that, while such activities are an intrinsic part of the archaeological research and desk-based assessment cannot replace them as an exhaustive alternative, they are not always possible due to high costs and execution times. In countries affected by instability situations or warfare, security concerns may also apply and thus constrain the feasibility of field activities.
Notwithstanding, to further support the accuracy assessment of height and morphometric estimates retrieved from the CartoSat-1 DSM, a direct quantitative comparison was made with the tell height data that were found in the literature. The observed correlation highlights promising results that the use of large and fully replicable datasets of in situ measurements may further improve. For the same sample of tells, independent information on surface extent and boundaries were available. Therefore, it was also possible to assess the accuracy of the boundaries drawn using the CartoSat-1 DSM, and ascertain that these morphometric estimates can be used as an effective and reliable desk-based dataset in preparation of field surveys which may led to further refinement or revision, depending on the archaeological records found on site and their interpretation.
An additional function that the CartoSat-1 DSM can benefit is condition assessment, especially if this elevation product is combined with other satellite data and historical collections such as CORONA and Google Earth imagery. The morphometric analysis not only revealed tells that are now lost due to flattening and leveling, but also situations of ongoing morphological alteration and anthropogenic disturbance that can be documented according to a multi-temporal change detection analysis. In this paper, we have provided an example by comparison with COSMO-SkyMed DEM produced from imagery collected a few years later than the CartoSat-1 DSM. The same analysis could be well undertaken if other CartoSat-1 DSM products of subsequent years could be accessed and compared.
The relevance of the present demonstration for a region like Wasit (and more generally for Iraq and other countries of the Near and Middle East) is highlighted by the statistics of the anthropogenic actions that are transforming the landscape, and thus threatening the conservation of tells. Most of the mapped tells were found to have been affected by more than one threat and anthropogenic action. ‘Reworking and reshaping’ frequently associates with ‘looting’ or is simultaneous or preparatory to ‘change of use’ or land conversion for ‘agriculture’. These processes also represent the most widespread types of threats and as such provide a quantitative figure and spatial depiction of the fact that activities related to modern development are as much impacting as illegal excavations.
The main directions for future research are twofold. First, it is worth exporting this method and the use of the CartoSat-1 DSM to other geographic areas encompassing similar and other categories of archaeological features. This activity could also provide suitable samples to test the wider applicability of the area-to-volume relationship according to a quadratic function that was found for the present test area. Second, in the present research the automation was intentionally focused on enhancement of topographic relieves and morphometric analysis, therefore there is definitely room for testing fully automated approaches for tell detection and mapping.

Author Contributions

Conceptualization, D.T. and F.C.; methodology, D.T. and F.C.; software, F.C.; formal analysis, D.T. and F.C.; writing—original draft preparation, D.T.; writing—review and editing, F.C.; visualization, D.T. and F.C. All authors have read and agreed to the published version of the manuscript.

Funding

This research received no external funding.

Institutional Review Board Statement

Not applicable.

Informed Consent Statement

Not applicable.

Data Availability Statement

Research conducted using CartoSat-1 Euro-Maps 3D Digital Surface Model (DSM)—level A+ product that was provided by the European Space Agency (ESA) through Category-1 project id. 42783 “Detection of features of archaeological and cultural significance in high resolution CartoSat-1 Digital Surface Model and imagery” (Principal Investigator: Deodato Tapete; Co-Investigator: Francesca Cigna). COSMO-SkyMed®® Products, ©Italian Space Agency (ASI), were delivered under a license to use by ASI (Project “LARICI”, led by Deodato Tapete). Sentinel-2A/B scenes were sourced as open data from the Copernicus Open Access Hub. Google Earth images (©2021 Maxar Technologies) were sourced and analyzed from Google Earth Pro.

Acknowledgments

The authors thank ESA for the provision of the CartoSat-1 DSM product to support this research.

Conflicts of Interest

The authors declare no conflict of interest.

References

  1. Chase, A.S.Z.; Chase, D.Z.; Chase, A.F. LiDAR for Archaeological Research and the Study of Historical Landscapes; Springer: Cham, Switzerland, 2017; pp. 89–100. [Google Scholar]
  2. Opitz, R.S.; Cowley, D.C. Interpreting Archaeological Topography Airborne Laser Scanning, 3D Data and Ground Observation; Oxbow Books: Oxford, UK, 2013; ISBN 978-1-84217-516-3. [Google Scholar]
  3. Tapete, D.; Traviglia, A.; Delpozzo, E.; Cigna, F. Regional-scale systematic mapping of archaeological mounds and detection of looting using COSMO-SkyMed high resolution DEM and satellite imagery. Remote Sens. 2021, 13, 3106. [Google Scholar] [CrossRef]
  4. Farr, T.G.; Rosen, P.A.; Caro, E.; Crippen, R.; Duren, R.; Hensley, S.; Kobrick, M.; Paller, M.; Rodriguez, E.; Roth, L.; et al. The Shuttle Radar Topography Mission. Rev. Geophys. 2007, 45, 2005RG000183. [Google Scholar] [CrossRef]
  5. Meyer, M.F.; Pfeffer, I.; Jürgens, C. Automated Detection of Field Monuments in Digital Terrain Models of Westphalia Using OBIA. Geosciences 2019, 9, 109. [Google Scholar] [CrossRef]
  6. Abballe, M. Geoarchaeological mapping of medieval wetlands and their reclamation in the hinterland of Ravenna: Two case studies from Massa Lombarda (RA) and Villafranca di Forlì (FC). Archeol. Data 2022, 2, 42–62. [Google Scholar] [CrossRef]
  7. Davis, D.S.; Sanger, M.C.; Lipo, C.P. Automated mound detection using lidar and object-based image analysis in Beaufort County, South Carolina. Southeast. Archaeol. 2019, 38, 23–37. [Google Scholar] [CrossRef]
  8. Wilkinson, T.J. Archaeological Landscapes of the Near East; The University of Arizona Press: Tucson, AZ, USA, 2003; ISBN 9780816521739. [Google Scholar]
  9. Menze, B.H.; Ur, J.A.; Sherratt, A.G. Detection of ancient settlement mounds: Archaeological survey based on the SRTM terrain model. Photogramm. Eng. Remote Sens. 2006, 72, 321–327. [Google Scholar] [CrossRef]
  10. Takaku, J.; Tadono, T.; Tsutsui, K. Generation of high resolution global DSM from ALOS PRISM. In International Archives of the Photogrammetry, Remote Sensing and Spatial Information Sciences-ISPRS Archives, Proceedings of the ISPRS Technical Commission IV Symposium, Suzhou, China, 14–16 May 2014; ISPRS: Hannover, Germany; Volume XL-4. [CrossRef]
  11. Tadono, T.; Ishida, H.; Oda, F.; Naito, S.; Minakawa, K.; Iwamoto, H. Precise Global DEM Generation by ALOS PRISM. ISPRS Ann. Photogramm. Remote Sens. Spat. Inf. Sci. 2014, II 4, 71–76. [Google Scholar] [CrossRef]
  12. Tachikawa, T.; Hato, M.; Kaku, M.; Iwasaki, A. Characteristics of ASTER GDEM version 2. In Proceedings of the International Geoscience and Remote Sensing Symposium (IGARSS), Vancouver, BC, Canada, 24–29 July 2011; Institute of Electrical and Electronics Engineers: Vancouver, BC, Canada, 2011. [Google Scholar] [CrossRef]
  13. Sherratt, A. Spotting tells from space. Antiq. Proj. Gallery 2004, 78, 301. [Google Scholar]
  14. Erasmi, S.; Rosenbauer, R.; Buchbach, R.; Busche, T.; Rutishauser, S. Evaluating the quality and accuracy of TanDEM-X digital elevation models at archaeological sites in the Cilician Plain, Turkey. Remote Sens. 2014, 6, 9475–9493. [Google Scholar] [CrossRef] [Green Version]
  15. Rutishauser, S.; Erasmi, S.; Rosenbauer, R.; Buchbach, R. SARchaeology—Detecting Palaeochannels Based on High Resolution Radar Data and Their Impact of Changes in the Settlement Pattern in Cilicia (Turkey). Geosciences 2017, 7, 109. [Google Scholar] [CrossRef]
  16. Orengo, H.A.; Petrie, C.A. Multi-scale relief model (MSRM): A new algorithm for the visualization of subtle topographic change of variable size in digital elevation models. Earth Surf. Process. Landf. 2018, 43, 1361–1369. [Google Scholar] [CrossRef] [PubMed]
  17. Salvini, R.; Carmignani, L.; Francioni, M.; Casazza, P. Elevation modelling and palaeo-environmental interpretation in the Siwa area (Egypt): Application of SAR interferometry and radargrammetry to COSMO-SkyMed imagery. Catena 2015, 129, 46–62. [Google Scholar] [CrossRef]
  18. Gupta, E.; Rajani, M.B.; Menon, S. Remote sensing investigation of the Buddhist archaeological landscape around Sannati, India. J. Archaeol. Sci. Rep. 2019, 25, 294–307. [Google Scholar] [CrossRef]
  19. CartoSat-1 Archive and Euro-Maps 3D Digital Surface Model-Earth Online. Available online: https://earth.esa.int/eogateway/catalog/cartosat-1-archive-and-euro-maps-3d-digital-surface-model (accessed on 27 June 2022).
  20. Zanaga, D.; Van De Kerchove, R.; De Keersmaecker, W.; Souverijns, N.; Brockmann, C.; Quast, R.; Wevers, J.; Grosu, A.; Paccini, A.; Vergnaud, S.; et al. ESA WorldCover 10 m 2020 v100 [Dataset]. Zenodo 2021. [Google Scholar] [CrossRef]
  21. Marchetti, N.; Al-Hussainy, A.; Valeri, M.; Zaina, F. Assessing Endangered Cultural Heritage in Central Iraq. Methods and Perspectives of the QADIS Survey Project. Sumer. J. Archaeol. Iraq Arab World 2018, 64, 11–34. [Google Scholar]
  22. Adams, R.M. Heartland of Cities: Surveys of Ancient Settlement and Land Use on the Central Floodplain of the Euphrates|The Oriental Institute of the University of Chicago; University of Chicago Press: Chicago, IL, USA, 1981. [Google Scholar]
  23. Pedersén, O. Ancient Near East on Google Earth: Problems, Preliminary Results, and Prospects. In Proceedings of the 7th International Congress on the Archaeology of the Ancient Near East, the British Museum and UCL. 3, Fieldworks and Recent Research, London, UK, 12–16 April 2010; Matthews, R., Curtis, J., Eds.; Harrassowitz: Wiesbaden, Germany, 2012; pp. 385–393. [Google Scholar]
  24. Guyot, A.; Hubert-Moy, L.; Lorho, T. Detecting Neolithic burial mounds from LiDAR-derived elevation data using a multi-scale approach and machine learning techniques. Remote Sens. 2018, 10, 225. [Google Scholar] [CrossRef]
  25. Niculiță, M. Geomorphometric methods for burial mound recognition and extraction from high-resolution LiDAR DEMs. Sensors 2020, 20, 1192. [Google Scholar] [CrossRef]
  26. Abballe, M.; Cavalazzi, M. Morphometric analysis for geoarchaeological research: From testing different methods to results verification in the Romagna plain. Archeol. Calc. 2021, 32, 117–136. [Google Scholar] [CrossRef]
  27. Emberling, G.; Hanson, K. Catastrophe! The Looting and Destruction of Iraq’s Past; Oriental Institute Museum Publications No. 28; The Oriental Institute: Chicago, IL, USA, 2008; ISBN 9781885923561. [Google Scholar]
  28. Zaina, F. A Risk Assessment for Cultural Heritage in Southern Iraq: Framing Drivers, Threats and Actions Affecting Archaeological Sites. Conserv. Manag. Archaeol. Sites 2019, 21, 184–206. [Google Scholar] [CrossRef]
  29. Barner, F.; Haydn, R.; Maass, H.; Remilla, M.L.N. Contribution of the Indian IRS program to European data requirements through Euromap. In ESA Living Planet Symposium, 28 Jun–2 Jul 2010, Bergen, Norway, ESA Special Publication SP-686; European Space Agency (ESA): Frascati, Italy, 2010; p. 6. [Google Scholar]
  30. D’Angelo, P.; Uttenthaler, A.; Carl, S.; Barner, F.; Reinartz, P. Automatic Generation of High Quality DSM Based on IRS-P5 Cartosat-1 Stereo Data. In ESA Living Planet Symposium, 28 Jun–2 Jul 2010, Bergen, Norway, ESA Special Publication SP-686; European Space Agency (ESA): Frascati, Italy, 2010; p. 5. [Google Scholar]
  31. Krishnaswamy, M.; Kalyanaraman, S. Indian Remote Sensing Satellite Cartosat-1: Technical Features and Data Products. Geospatial World. 9 January 2009. Available online: https://www.geospatialworld.net/article/indian-remote-sensing-satellite-cartosat-1-technical-features-and-data-products/ (accessed on 1 August 2022).
  32. GAF-AG. Euro-Maps 3D Product Description, Version 3.1; GAF AG: Munich, Germany, 2020; p. 3. [Google Scholar]
  33. Euro-Maps 3D, GAF AG. Available online: https://www.euromap.de/products/prod_008.html (accessed on 29 June 2022).
  34. Caltagirone, F.; Capuzi, A.; Coletta, A.; De Luca, G.F.; Scorzafava, E.; Leonardi, R.; Rivola, S.; Fagioli, S.; Angino, G.; Labbate, M.; et al. The COSMO-SkyMed dual use earth observation program: Development, qualification, and results of the commissioning of the overall constellation. IEEE J. Sel. Top. Appl. Earth Obs. Remote Sens. 2014, 7, 2754–2762. [Google Scholar] [CrossRef]
  35. Rodríguez, E.; Morris, C.S.; Belz, J.E. A global assessment of the SRTM performance. Photogramm. Eng. Remote Sens. 2006, 72, 249–260. [Google Scholar] [CrossRef]
  36. NASA Shuttle Radar Topography Mission (SRTM) Global [Dataset]. Distributed by OpenTopography. 2013. Available online: https://www2.jpl.nasa.gov/srtm/cbanddataproducts.html (accessed on 4 July 2022). [CrossRef]
  37. JAXA ALOS World 3D-30m Ellipsoidal [Dataset]. Distributed by OpenTopography. 2021. Available online: https://portal.opentopography.org/raster?opentopoID=OTALOS.082017.4326.1 (accessed on 4 July 2022). [CrossRef]
  38. Day, D.A.; Logsdon, J.M.; Latell, B. Eye in the Sky: The Story of the Corona Spy Satellites; Smithsonian History of Aviation Series; Smithsonian Institution Press: Washington, DC, USA, 1998; ISBN 9781560987734. [Google Scholar]
  39. Corona @ CAST UA. Available online: https://corona.cast.uark.edu/ (accessed on 7 May 2020).
  40. Tapete, D.; Cigna, F. Appraisal of opportunities and perspectives for the systematic condition assessment of heritage sites with copernicus Sentinel-2 high-resolution multispectral imagery. Remote Sens. 2018, 10, 561. [Google Scholar] [CrossRef]
  41. Tapete, D.; Cigna, F. Detection of archaeological looting from space: Methods, achievements and challenges. Remote Sens. 2019, 11, 2389. [Google Scholar] [CrossRef]
  42. Zaina, F.; Tapete, D. Satellite-Based Methodology for Purposes of Rescue Archaeology of Cultural Heritage Threatened by Dam Construction. Remote Sens. 2022, 14, 1009. [Google Scholar] [CrossRef]
  43. Luo, L.; Wang, X.; Guo, H.; Lasaponara, R.; Shi, P.; Bachagha, N.; Li, L.; Yao, Y.; Masini, N.; Chen, F.; et al. Google Earth as a Powerful Tool for Archaeological and Cultural Heritage Applications: A Review. Remote Sens. 2018, 10, 1558. [Google Scholar] [CrossRef]
  44. Shibanov, F.A. The essence and content of the history of cartography and the results of fifty years of work by Soviet scholars. Cartogr. Int. J. Geogr. Inf. Geovis. 1975, 12, 141–145. [Google Scholar] [CrossRef]
  45. Nikishov, M.I.; Terekhov, N.M. 50 Years Of Soviet Cartography. Cartogr. Int. J. Geogr. Inf. Geovis. 1968, 5, 122–132. [Google Scholar] [CrossRef]
  46. Gallant, J.C.; Wilson, J.P. (Eds.) Primary topographic attributes. In Terrain Analysis: Principles and Applications; Wiley: New York, NY, USA, 2000; pp. 51–85. [Google Scholar]
  47. Weiss, A.D. Topographic Position and Landforms Analysis. 2001, p. 1. Available online: http://www.jennessent.com/downloads/tpi-poster-tnc_18x22.pdf (accessed on 1 August 2022).
  48. Argyriou, A.V.; Teeuw, R.M.; Sarris, A. GIS-based landform classification of Bronze Age archaeological sites on Crete Island. PLoS ONE 2017, 12, e0170727. [Google Scholar] [CrossRef] [Green Version]
  49. Lippolis, C. L’area Archeologica di Tūlūl al-Baqarat. Gli Scavi della Missione Italiana. Interim Report (2013–2019); Apice Libri: Sesto Fiorentino, Italy, 2020; ISBN 978-88-99176-98-3. [Google Scholar]
  50. UNESCO. UNESCO World Heritage Centre-List of Factors Affecting the Properties. Available online: https://whc.unesco.org/en/factors/ (accessed on 3 July 2022).
  51. Tapete, D.; Cigna, F. COSMO-SkyMed SAR for detection and monitoring of archaeological and cultural heritage sites. Remote Sens. 2019, 11, 1326. [Google Scholar] [CrossRef]
  52. Ur, J. CORONA satellite photography and ancient road networks: A northern Mesopotamian case study. Antiquity 2003, 77, 102–115. [Google Scholar] [CrossRef]
  53. Beck, A.; Philip, G.; Abdulkarim, M.; Donoghue, D. Evaluation of Corona and Ikonos high resolution satellite imagery for archaeological prospection in western Syria. Antiquity 2007, 81, 161–175. [Google Scholar] [CrossRef] [Green Version]
Figure 1. (a) Location of Al-Ahrar, Al-Nu’maniya, Wasit (Iraq) and indication of the zoomed area in subfigures (b,c). (b) Land cover according to the WorldCover 10 m dataset (©ESA WorldCover project 2020/Contains modified Copernicus Sentinel data 2020, processed by ESA WorldCover consortium [20]). (c) Surface elevation (hC1) above reference WGS84 ellipsoid, derived from CartoSat-1 Euro-Maps 3D Digital Surface Model (DSM) product (©GAF AG, Munich, Germany. Includes material ©Antrix, Bangalore, India, distributed by GAF AG), overlapped onto high resolution satellite imagery (contains Copernicus Sentinel-2 data, 2019).
Land 11 01406 g001
Figure 2. Sketch of archaeological tells and identification of their main dimensional parameters: planar view of (a) irregular and (b) elliptical tells, and (c) cross-section. Notation: Fmax and Fmin, maximum and minimum Feret diameters; H, height; hmax and hmin, top and base elevation, respectively.
Land 11 01406 g002
Figure 3. Zoomed view of the high resolution CartoSat-1 DSM product (©GAF AG. Includes material ©Antrix, distributed by GAF AG) enhancing the anthropogenic topographic relieves of Tūlūl al-Baqarat tells from the surrounding agricultural fields in the eastern sector of the test area (see location in Figure 1c).
Land 11 01406 g003
Figure 4. Distribution of the observed elevation differences (Δhi) between the CartoSat-1 DSM and the three reference DEMs: (a) COSMO-SkyMed, (b) SRTM 30 m and (c) AW3D30.
Land 11 01406 g004
Figure 5. Spatial distribution of the mapped tells within the test area, onto high resolution satellite imagery (contains Copernicus Sentinel-2 data, 2019), compared to (a) Ancient Near East (ANE) sites as mapped by [23] and (b) tells investigated and reported by [49].
Land 11 01406 g005
Figure 6. Relationship between (a) maximum diameter (dmax) and area (A), and (b) minimum (Fmin) and maximum (Fmax) Feret diameters of the 344 tells mapped within the test area.
Land 11 01406 g006
Figure 7. Distribution of height (H) values estimated from CartoSat-1 DSM dataset vs. the reference datasets: COSMO-SkyMed, SRTM 30 m and AW3D30.
Land 11 01406 g007
Figure 8. Comparison of (ac) height (Hi) and (df) volume (Vi) estimates between CartoSat-1 DSM (i = C1) and the three reference DEM datasets: COSMO-SkyMed (i = CSK), SRTM 30 m (i = SRTM) and AW3D30 (i = AW3D30).
Land 11 01406 g008
Figure 9. Relationships between height (Hi), area (A) and volume (Vi), for: (ac) CartoSat-1 DSM, and (df) COSMO-SkyMed, (gi) SRTM and (jl) AW3D30 DEMs.
Land 11 01406 g009
Figure 10. Relationship between maximum diameter (dmax) and height (HC1) estimated from CartoSat-1 DSM, for the whole sample of tells mapped within the test area.
Land 11 01406 g010
Figure 11. Spatial distribution of the mapped tells by the mostly impacting threats due to anthropogenic actions: (a) reworking and reshaping, (b) leveling and flattening, (c) looting, (d) agriculture, (e) building construction, (f) fire, (g) modern canals, (h) road, (i) disturbance by heavy vehicles, and (j) change of use.
Land 11 01406 g011
Figure 12. Example of tell (precise location undisclosed for security concerns) affected by ‘reworking and reshaping’ and ‘looting’ incidents, as documented by multi-temporal analysis of: (a) CORONA imagery, (b) CartoSat-1 DSM (©GAF AG. Includes material ©Antrix, distributed by GAF AG) and (c) COSMO-SkyMed DEM (COSMO-SkyMed®® Products ©ASI, Italian Space Agency, Rome, Italy, 2018. All rights reserved) products, as well as contextual information from Google Earth images (©2021 Maxar Technologies, Westminster, CO, USA) collected on: (d) 18 January 2015, (e) 7 January 2018 and (f) 26 July 2018. (g,h) Insets highlight the presence of looting pits. White and red arrows, respectively, point to trenches and the southern portion of the tell that was ultimately leveled and converted to crop field.
Land 11 01406 g012
Figure 13. Example of tells (precise location undisclosed for security concerns) where ‘leveling and flattening’ led to conversion to crop fields and further damage due to ‘agriculture’, as documented by multi-temporal analysis of (a) CORONA imagery and (b) CartoSat-1 DSM (©GAF AG. Includes material ©Antrix, distributed by GAF AG), and contextual information from (c) Google Earth image (©2021 Maxar Technologies) collected on 9 April 2002.
Land 11 01406 g013
Figure 14. Example of tells (labeled “i” and “ii”; precise location undisclosed for security concerns) affected by ‘change of use’ and ‘modern canals’, respectively, as documented by multi-temporal analysis of: (a) CORONA imagery and (b) CartoSat-1 DSM (©GAF AG. Includes material ©Antrix, distributed by GAF AG), as well as contextual information from Google Earth images (©2021 Maxar Technologies) collected on: (c) 9 April 2002, (d) 5 January 2016 and (e) 22 December 2020, with (fh) zoomed views highlighting the transformation of tell “i” and its change of use in connection to very recently built farm dwellings.
Land 11 01406 g014
Figure 15. (a) Overview of the tells located in the eastern part of the test area (see also Figure 11f; precise location undisclosed for security concerns) that were affected by fire incidents, with indication of (be) zoomed views highlighting the burning patterns and scars, as captured by Google Earth image (©2021 Maxar Technologies) collected on 7 October 2013.
Land 11 01406 g015
Figure 16. Zoomed view of the northernmost part of the test area as depicted in (a) CORONA imagery, (b) Sentinel-2 false-colored image (contains Copernicus Sentinel-2 data, 2019), (c) CartoSat-1 DSM (©GAF AG. Includes material ©Antrix, distributed by GAF AG), and its derivatives: (d) Topographic Position Index (TPI) and (e) DEViation from mean elevation (DEV).
Land 11 01406 g016
Figure 17. Zoomed views of tells (a,b) Bismaya H882 and (ce) Tūlūl al-Baqarat TB1 and TB6 showcasing the benefits of ground-truth and archaeological interpretation to verify, and even revise/refine, tell boundaries that are drawn via desk-based assessment of features and topographic relieves visible in CORONA imagery and a high resolution DEM product. Pictures (b,d) contain the CartoSat-1 DSM product (©GAF AG. Includes material ©Antrix, distributed by GAF AG); picture (e) contains Google Earth image (©2021 Maxar Technologies) collected on 3 October 2020.
Land 11 01406 g017
Figure 18. Validation of height (Hi) values derived from (a) CartoSat-1 DSM and (b) COSMO-SkyMed DEM against in situ measurements. The latter are according to the values in [49].
Land 11 01406 g018
Table 1. Comparison of the CartoSat-1 DSM with the three reference DEM datasets. Notation: Δhi, elevation difference; Min., minimum; Max. maximum; Av., average; StD., standard deviation; RMSE, root mean square error.
Reference DatasetResolution [m]Δhi [m]
Min.Max.Av. ± StD.RMSE
COSMO-SkyMed DEM10−11.1+13.6−0.29 ± 1.191.09
SRTM-GL1 DEM30−14.0+16.0−0.12 ± 1.481.46
ALOS AW3D30 DEM30−12.0+12.0−0.08 ± 1.251.16
Table 2. Comparison of tell height (H) and volume (V) ranges between the analyzed DEM datasets. Notation: Min., minimum; Max. maximum.
DEM DatasetH [m]V [hm3]
Min.Max.Min.Max.
CartoSat-1 DSM0.021.00.05.8
COSMO-SkyMed DEM0.314.10.03.5
SRTM-GL1 DEM0.014.00.04.3
ALOS AW3D30 DEM0.014.00.03.2
Table 3. Number of incidents for each most impacting anthropogenic action and relative abundance expressed in percentage over the total number of mapped tells.
Anthropogenic ActionNo. of IncidentsRelative Abundance
Reworking & reshaping12135.2%
Leveling & flattening4011.6%
Looting13840.1%
Agriculture5917.2%
Building construction236.7%
Fire164.7%
Modern canals236.7%
Road174.9%
Disturbance by heavy vehicles267.6%
Change of use288.1%
Publisher’s Note: MDPI stays neutral with regard to jurisdictional claims in published maps and institutional affiliations.

