Article

Sustainable Urban Development for Heat Adaptation of Small and Medium Sized Communities

Department of Urban and Environmental Sociology, Helmholtz Centre for Environmental Research-UFZ, Permoserstraße 15, D-04318 Leipzig, Germany
*
Author to whom correspondence should be addressed.
Land 2022, 11(9), 1385; https://doi.org/10.3390/land11091385
Submission received: 11 July 2022 / Revised: 8 August 2022 / Accepted: 8 August 2022 / Published: 24 August 2022
(This article belongs to the Special Issue Urban Land Development in the Process of Urbanization)

Abstract

:
Due to climate change, urban populations will be affected by worsening heat stress. The use of blue–green infrastructure can be an effective countermeasure for urban planners. In this study, the ENVI-met modelling system is used to investigate the impacts of different heat adaptation strategies, such as additional urban trees, irrigation policies, and the use of high reflective surface materials. However, under certain local conditions, these measures can have conflicting effects, e.g., trees can provide shadow but also reduce the cooling ventilation. To address such conflicts, we developed an online tool visualising urban climate simulation data and applying a new decomposition algorithm that translates the biophysical processes (i.e., radiation, ventilation, evapotranspiration, and heat storage) into surface temperature changes during heat wave events. This approach allows us to (1) identify factors responsible for heat, (2) comparatively evaluate heat mitigation of different land development scenarios, and (3) find trade-offs for conflicting adaptation measures. This online tool can support the decision-making of local stakeholders.

1. Introduction

Climate change is one of the greatest challenges of the 21st century and already influencing many weather extremes in all regions of the world. With increasing temperatures, the probability of the occurrence of heavy rainfall events, floods as well as droughts, and heat waves, among others, is growing [1]. In particular, heat waves, which are extended periods of unusually high atmospheric temperatures, are expected to become more frequent and severe, as well as longer-lasting in the future [1,2,3]. This may lead to adverse health effects and increased heat-related mortality [4,5,6].
The climate of urban areas is strongly influenced by building development and sealing. The increase in absorbing surfaces due to vertical walls, the heat release from the more concentrated combustion of fossil fuels, the decrease in latent heat loss due to the sealing of the surface, and the increased heat absorption by urban materials can be identified as reasons for a change in the urban energy balance [7]. As a result, phenomena such as the urban heat island (UHI) effect arise, which describes the occurrence of higher temperatures in urban areas compared to the rural surrounding during nighttime [8]. Hot weather periods are exacerbated by the UHI effect, making cities more vulnerable to heat waves [2]. Thus, the urban population experiences a reduced quality of life, and negative impacts on human health [9]. The risk of heat stress also notably increases in regions experiencing demographic change with a growing proportion of elderly people since the thermophysiological adaptability to heat decreases with age [10].
Small and medium-sized communities in Germany, which often have very dense and compact town centres, are particularly vulnerable to heat waves, as demographic change is more pronounced there. Surveys conducted in representative municipalities as part of the project showed that climatic changes are perceived in the region, with the rise in summer temperatures being mentioned in particular. However, such cities often do not have the financial resources to employ staff to handle issues concerning climate change and climate adaptation.
Therefore, effective and cost-efficient concepts to increase urban resilience and adapt urban structures to the heat need to be developed and evaluated. Against this background, urban green spaces have gained importance. The effect of street trees on the urban climate in different urban environments as well as in different climate zones is described in various studies worldwide [4,11,12,13,14,15]. Foliaged trees are very effective in reducing direct shortwave radiation and lower surface and radiant temperatures in their shade [16]. Therefore, they can contribute to a significant improvement of thermal heat load since human thermal sensation is mainly affected by radiant temperatures [17,18]. In addition, cooling by trees can be achieved through evapotranspiration. Due to evapotranspiration processes, solar energy is increasingly converted into the latent rather than sensible turbulent heat flux [5]. This moderates air temperature and increases humidity [19]. However, the efficiency of evapotranspirative cooling depends on the availability of water, which is often limited due to sealing and the rapid runoff of rainwater in urban areas [20]. Furthermore, green spaces can provide additional ecosystem services as well [21].
Another approach to reduce urban heat involves an increase of the surface albedo of typical urban structures to diminish the energy input available for warming the urban climate [22,23].
The urban climate and the respective influencing factors to heat stress can be considered at different scales (city level, neighborhood level and individual buildings). Thus, climate adaptation concepts must not only take into account climatic effects at the city level, but have to recognize the fine-structure of urban heat at very small scales inside of urban quarters [24].
In this study, we present an online visualization tool utilizing simulations of the micrometeorological model ENVI-met, which can be used by local stakeholders to explore the effects of several local climate adaptation measures on a neighborhood scale. To explain the causes of the variations in urban temperatures, we applied a decomposition algorithm that converts the components of the energy balance into the respective temperature increments. In this way, strategies targeted at heat mitigation can be developed based on scientific findings.

2. Materials and Methods

2.1. The Microscale Urban Climate Model ENVI-Met
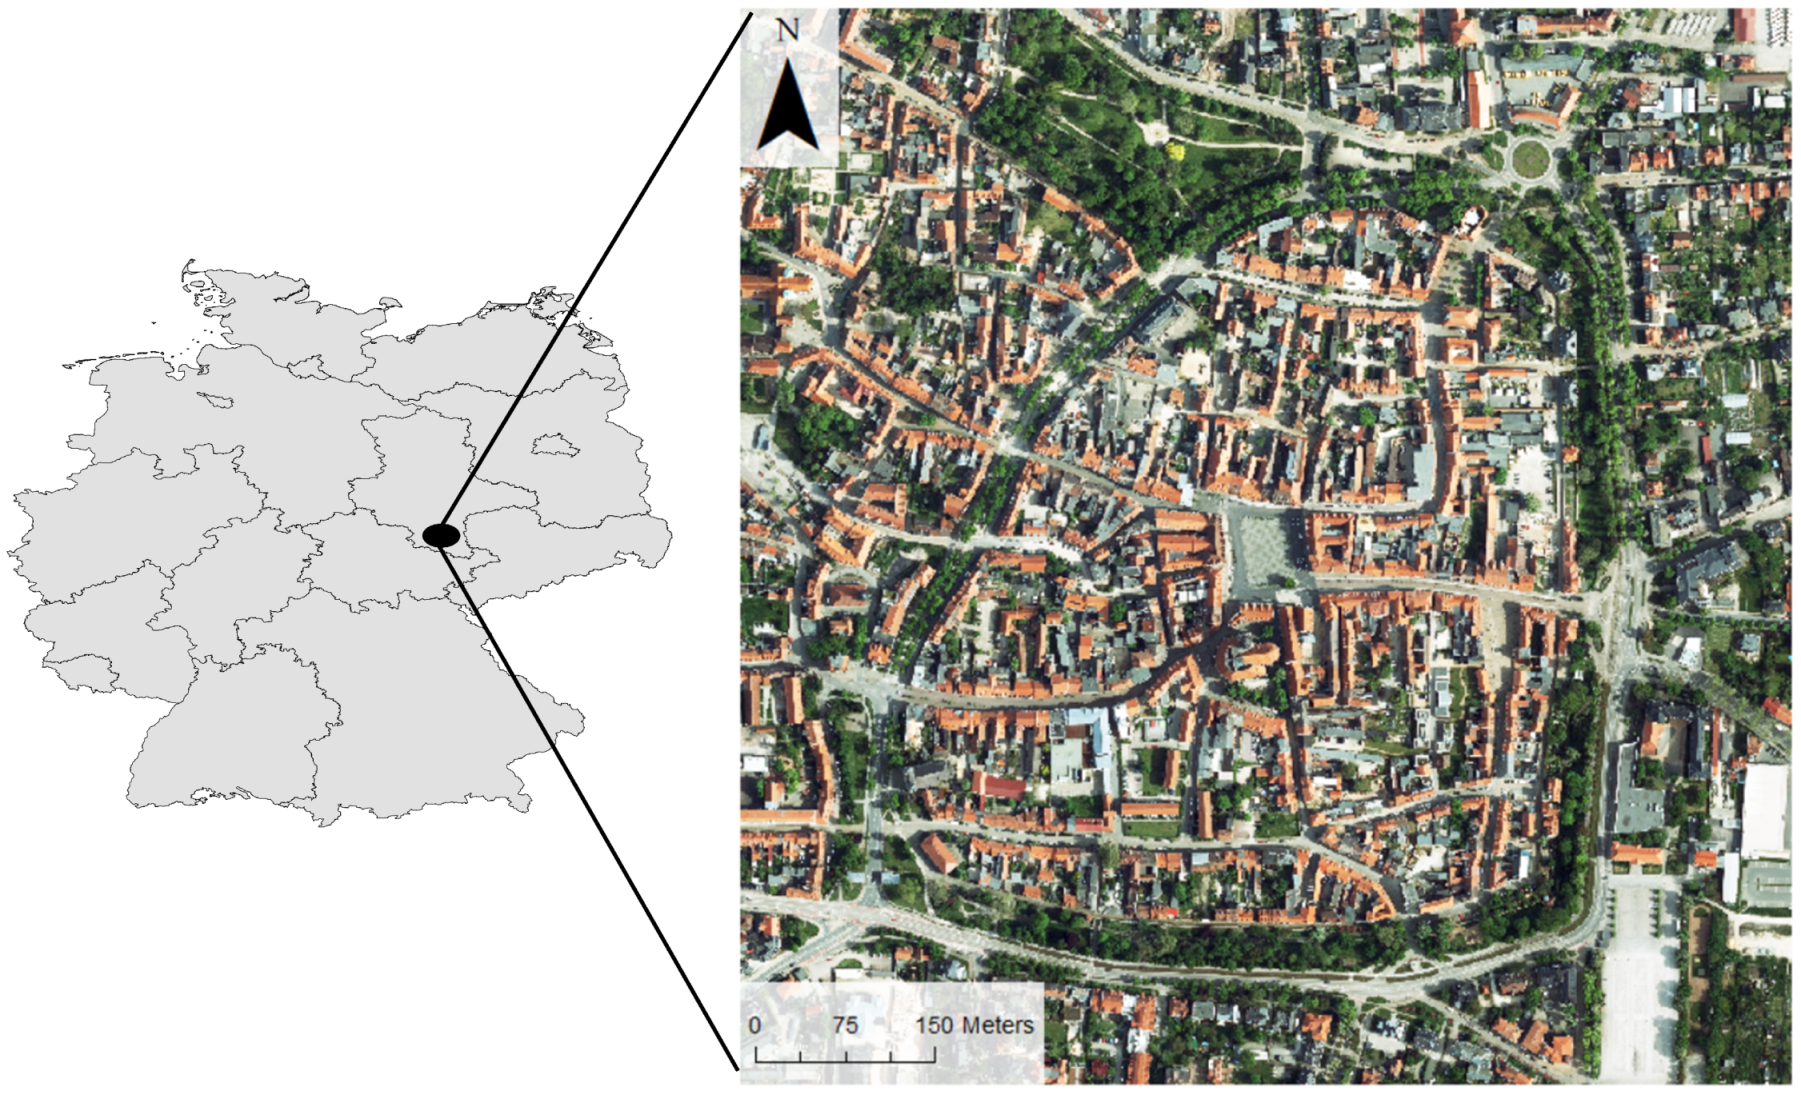
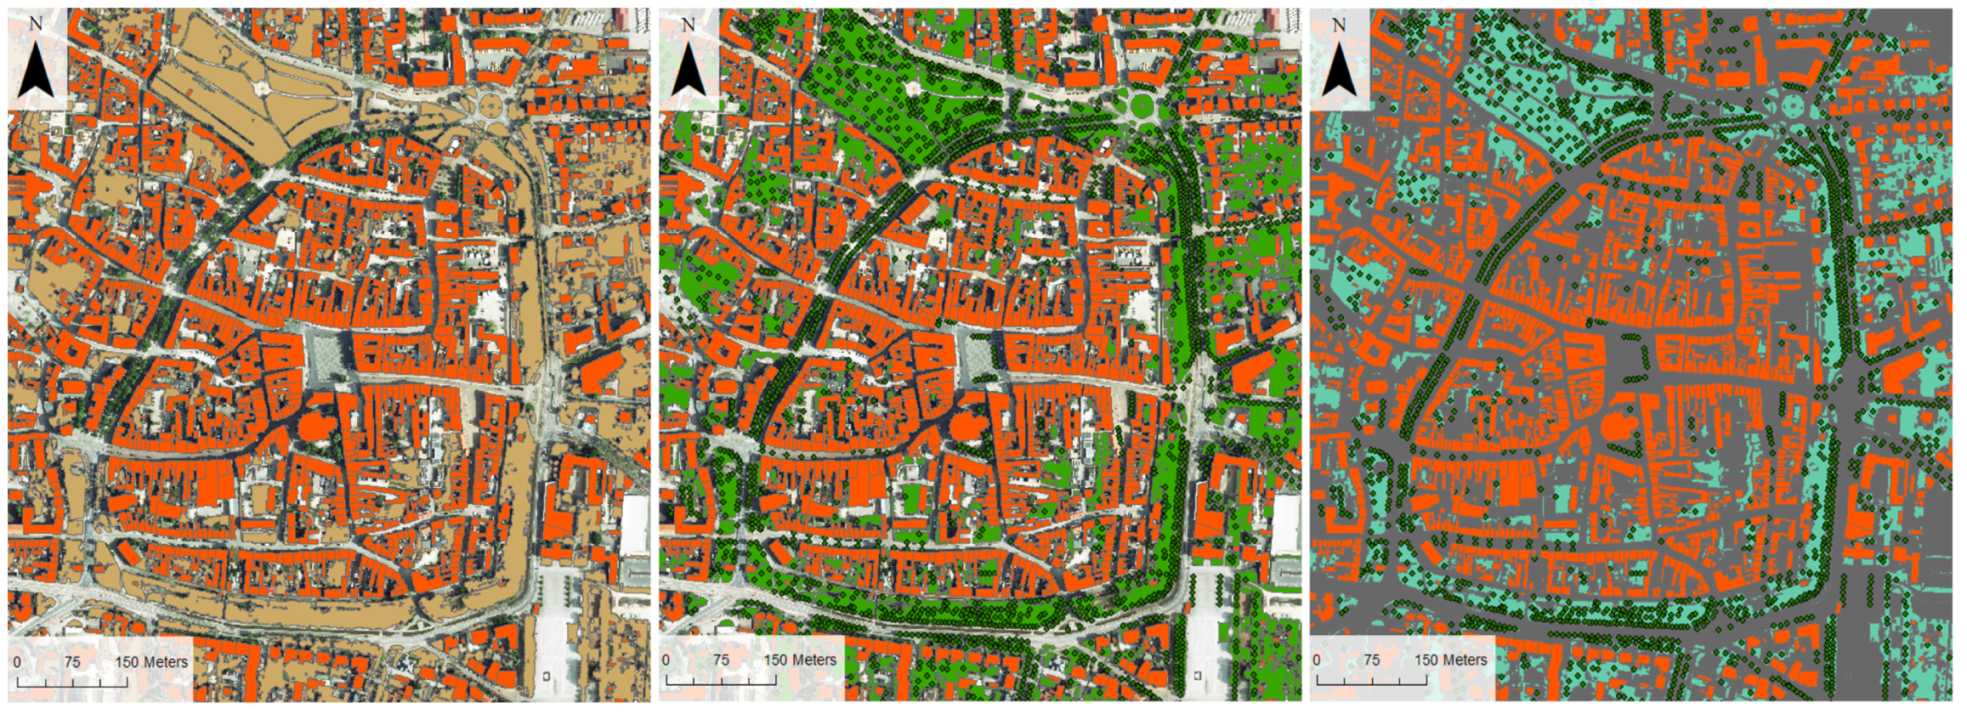
All simulations in this study were performed with the three-dimensional microscale model ENVI-met, version 4.4.6, which enables the calculation and simulation of climate variables in urban areas [25]. The model consists of three components: an atmospheric model, a soil model, and a vegetation model, which are used to simulate the interactions between urban surfaces, vegetation, and the atmosphere [26]. The typical resolution of the model ranges from 0.5 m to 10 m in space and up to 2 s in time, which makes it suitable for micrometeorological investigations in complex urban environments [24]. Numerous studies have evaluated the accuracy of the model and it has been successfully applied to simulate the meteorological and human-biometeorological impacts of urban geometry, surface materials as well as urban greening [10,27,28,29].

2.2. Study Area

The case study was conducted for Naumburg, a Central-European small-size city which is situated in eastern Germany (51°9.37 N, 11°48.5 E, 130 m asl) and is classified according to Köppen-Geiger as Cfb (warm temperate with warm summers, fully humid) [30] with mean annual temperature of 9.8 °C and mean annual precipitation of 584.6 mm at the German Weather Service (DWD) station Osterfeld (ID 3821; located 11km south-east of the study site). The spatial extent of the city including the neighbouring districts is 129.9 km 2 [31] with a total of 32,053 people living in this area [32].
The study area, which encompasses a square area of 0.96 km 2 , focuses mainly on the city center of Naumburg (see Figure 1) which is a dense medieval old town characterized by narrow streets and a large proportion of sealed surfaces. The proportion of green spaces and street trees is very low. However, the core of the city is surrounded by small green areas in the south and east. On the western border of the city center, there are many street trees. In the north, the city park is adjacent to the city center.

2.3. Setup for Numerical Simulations

Heat adaptation is particularly important during hot days. Therefore, we browsed the weather data (DWD weather station Osterfeld) for the last 10 years and selected two very hot days (3 and 4 July 2015) representing a heat wave event for the simulations. Half-hourly measured values of air temperature, wind speed, and relative humidity were used for the entire simulation period as input. Wind direction was predominantly south on both days (180°). An overview of the model initialization and the meteorological data used is provided in Table 1.
Dimensions, heights and coordinates of the buildings, as well as zoning, were derived from a vector-based 3D-city model [33] and a land-use plan, which was made available in consultation with the Naumburg municipal administration. Green spaces were detected from othophotos (NDVI > 0.5) [34]. To determine the positions and characteristics of trees within the study site, a tree register provided by the Naumburg city administration was used. Median tree height (10 m), crown diameter (3.5 m), and crown base (3 m) were calculated and applied in the ENVI-met tool Albero to create a corresponding model tree. The default settings for all other tree properties were retained (albedo: 0.18, transmission: 0.30, leaf area density: 1.1 m 2 / m 3 ). This model tree may represent, e.g., a Field Maple (Acer campestre).
As a compromise between sufficient spatial accuracy and a reasonable computing time (circa 2 weeks per scenario), the horizontal resolution was set to 3 × 3 m and the vertical grid cell size to 2 m. Furthermore, the lowest grid cells were vertically divided into five smaller cells, which allowed surface interactions to be calculated more accurately. To reduce the simulation time, the grid cells were enlarged vertically by 20% each from 25 m (5 m above the highest buildings) via telescoping. The simulations were started at 0:00 a.m. (CEST) for a total of 48 h. We excluded the first simulated day from further analyses since we considered it as a tuning phase. All analysed parameters refer to either the surface or a height of 1.4 m, which corresponds approximately to the human biometeorological reference height of 1.1 m [35].

2.4. Climate Adaptation Scenarios

The most acknowledged approaches for climate adaptation in cities include an increase of green infrastructures in the urban environment, the use of high reflective materials for sealed surfaces (scenario 2), and irrigation management of green surfaces (scenario 3). To assess the impact of the climate adaptation scenarios (see Figure 2) on urban heat, we compared them to the current state (Scenario 0; see Figure 1). The simulated scenarios are briefly described in the following:
  • Scenario 0: Current state of the model area with trees and grass areas
  • Scenario 1: Current state of the model area without any vegetation; i.e., only bare soil, buildings, and asphalt surfaces in order to estimate the effect of the existing urban trees since the study shows a rather high amount of the already existing vegetation
  • Scenario 2: Scenario 0 with an increased street albedo (0.6 instead of 0.2) which can be achieved using highly reflective paints applied to the surface material [22,36]
  • Scenario 3: Scenario 0 with an increased soil moisture (90% instead of 50% usable field capacity)
Further information on these scenarios are summarised in Table 2. Additional simulations were performed and integrated in an online tool, which is described in detail in Section 2.6.

2.5. Quantification of the Biophysical Contribution on the Surface Temperature

The thermal impacts of different climate adaptation scenarios are reflected in the surface energy balance (SEB):
R n = Q H + Q E + Q G
with net radiation R n , sensible heat flux Q H , latent heat flux Q E and ground heat flux Q G .
The micrometeorological model ENVI-met is based on the SEB, wherein the turbulent fluxes ( Q H and Q E ) are determined using an E − ϵ 1.5-order model. This is a good compromise between the convenient K-theory and the numerically complex closure of second-order and allows us to appropriately incorporate urban structures as well as advection while ground heat fluxes are determined using Fourier’s law [37,38]. The components of the SEB can be interpreted as the biophysical contributions [39]. The sensible heat flux Q H , which arises from the temperature difference between the surface T SFC and air T a at a height z, warms the atmosphere in the proximity of the surface and can be expressed as:
Q H = ρ c P T SFC T a ( z ) r a
with the density of air ρ , the specific heat of air at constant pressure c P , and the aerodynamic resistance to heat transfer r a . The latent heat flux Q E involves the processes between surface and atmosphere which are related to water exchange and the ground heat flux Q G describes the heat conduction between surface and soil [40,41].
In order to quantify the mechanism of action of the climate adaptation scenarios, we applied and extended a decomposition approach according to [39], who considered the urban heat island on a neighborhood scale. Using the definition of the dimensionless Bowen ratio β = Q H / Q E , inserting Equation (2) in Equation (1) the surface energy balance can be obtained as:
( 1 α ) S + L ϵ σ T SFC 4 = 1 + 1 β ρ c P r a ( T SFC T a ) + Q G
with surface albedo α , incoming short-wave radiation S , incoming longwave radiation L , surface emissivity ϵ .
Since our climate adaptation scenarios mainly affect the atmosphere in the proximity of the surface, the air temperature T a , ref at a reference height ( z ref = 30 m) was not affected by the respective climate adaptation scenario. Thus, the long-wave radiation term can be linearised in Equation (3) which yields after replacing T a in Equation (2) by T a , ref
T SFC T a , ref = λ 1 + f ( R n Q G )
with
f = λ ρ c P r a 1 + 1 β and λ = 1 4 ϵ σ T a , ref 3
with an energy redistribution factor f and a local climate sensitivity parameter λ which translates the heat flux to a corresponding change in temperature [39,42,43].
Considering the difference between the respective climate adaptation scenario (subscipt i = 1,2,3) and the current scenario (subscript 0) regarding Equation (4) leads to
T SFC , i T SFC , 0 = λ 1 + f i ( R n , i Q G , i ) λ 1 + f 0 ( R n , 0 Q G , 0 )
Due to a climate adaptation scenario surface parameters P (i.e., T SFC , R n , β , and Q G ) are altered by a small perturbation Δ compared to the respective parameter of the reference scenario P 0
P i = P 0 + Δ P
Substituting these into Equation (4) and deriving the quantities associated with Δ results in the temperature effect Δ T due to the climate adaptation scenario. After neglecting of higher-order terms, it follows for Δ T :
Δ T = λ 0 1 + f 0 Δ R n + λ 0 ( 1 + f 0 ) 2 ( R n , 0 Q G , 0 ) Δ f 1 + λ 0 ( 1 + f 0 ) 2 ( R n , 0 Q G , 0 ) Δ f 2 + λ 0 1 + f 0 Δ Q G
with
Δ f 1 = λ 0 ρ c P r a , 0 1 + 1 β 0 Δ r a r a , 0
Δ f 2 = λ 0 ρ c P r a , 0 Δ β β 0 2
Using this approach, the energy fluxes of the SEB can be converted to differences in surface temperature due to the biophysical contributions of the climate adaptation scenarios.

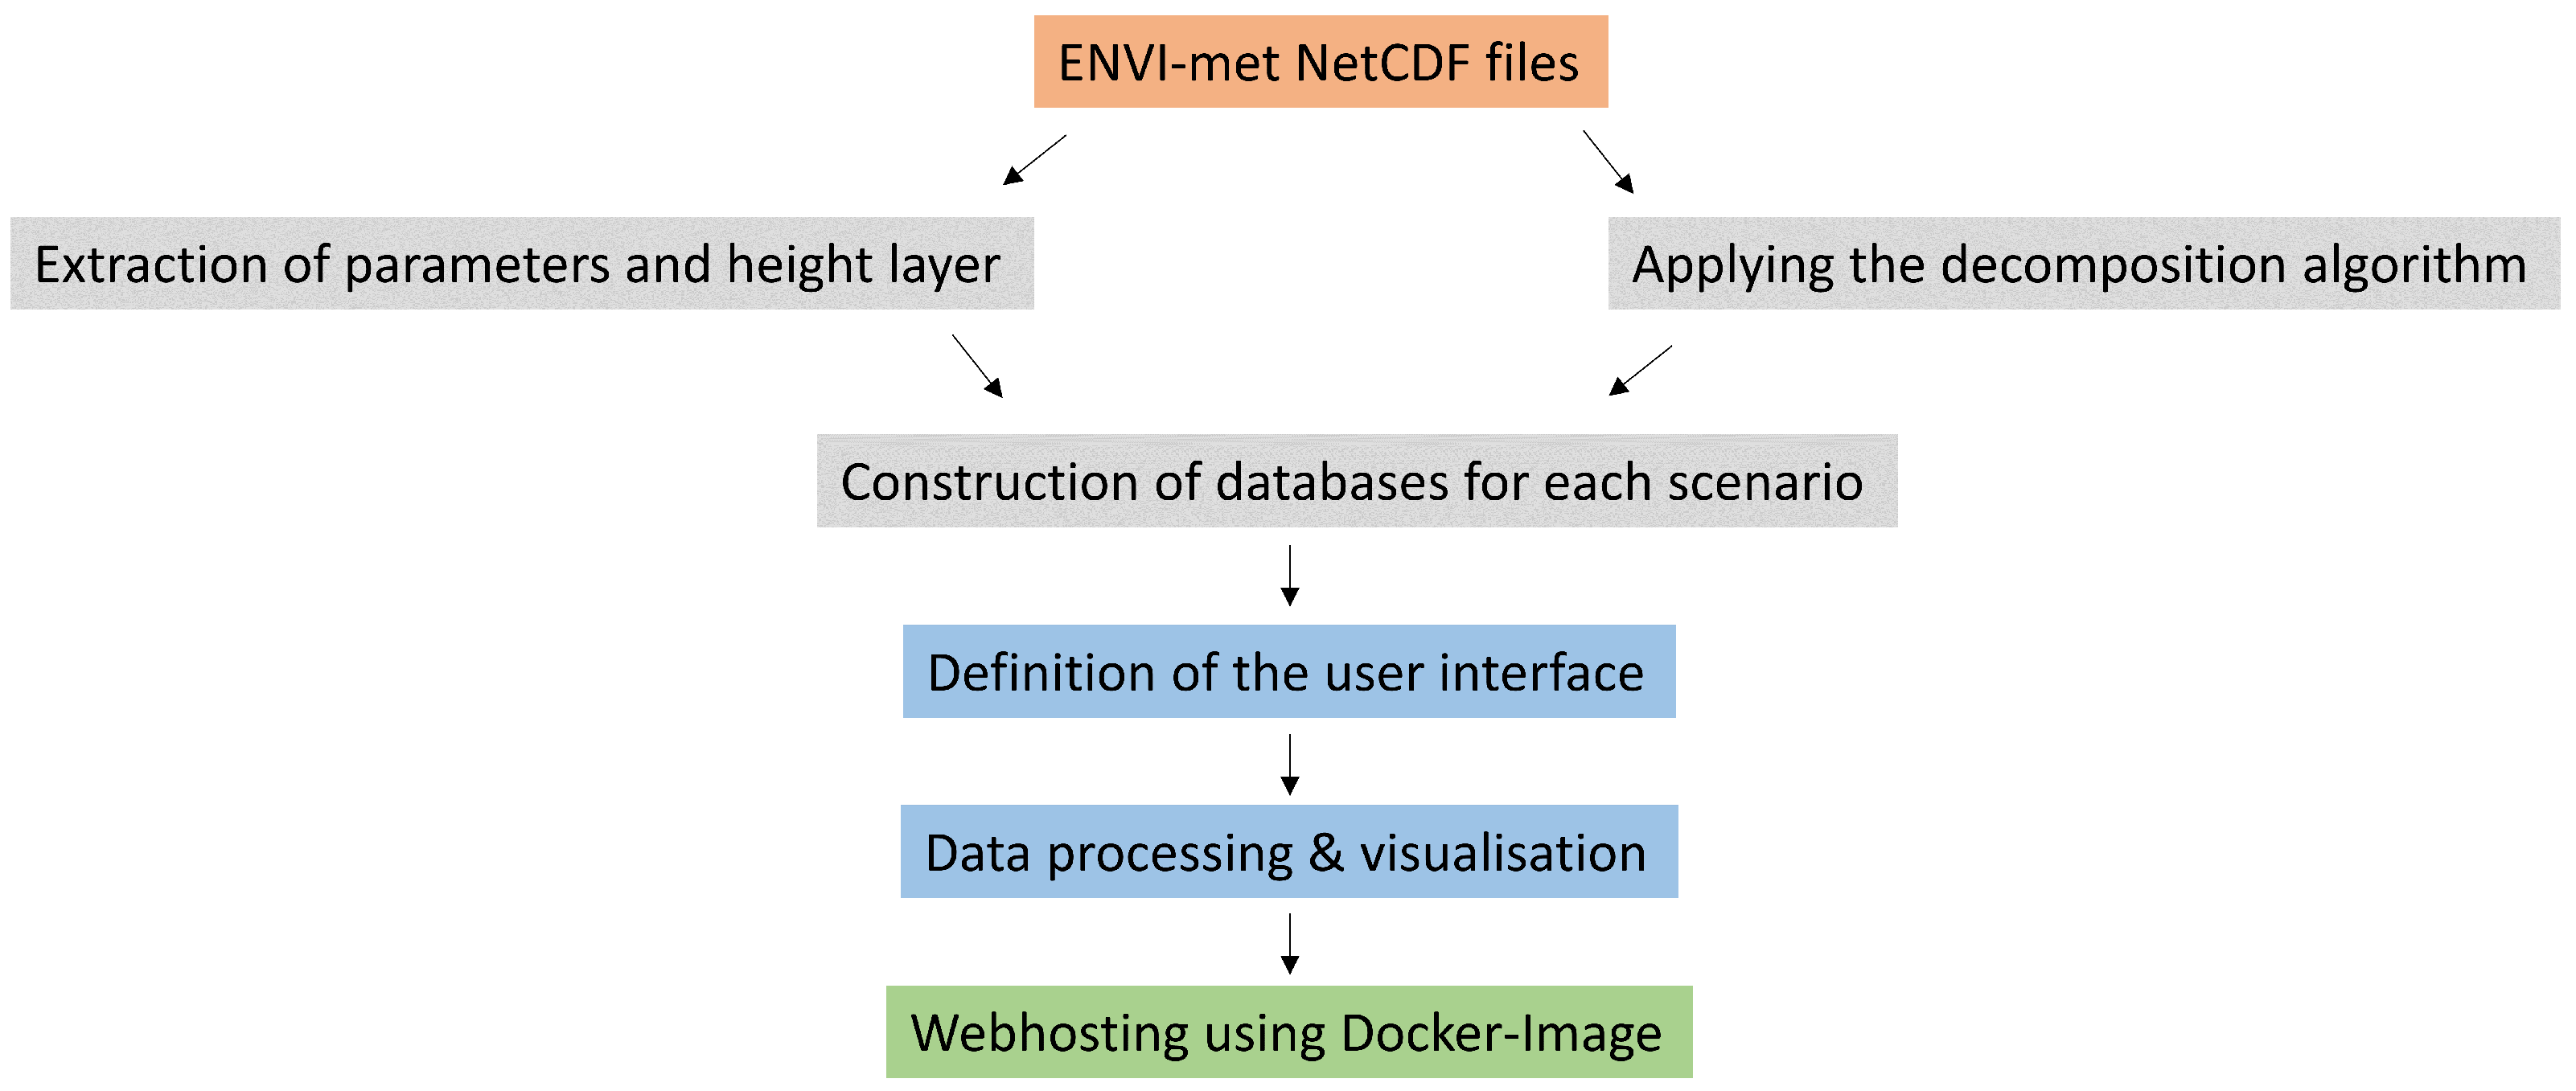
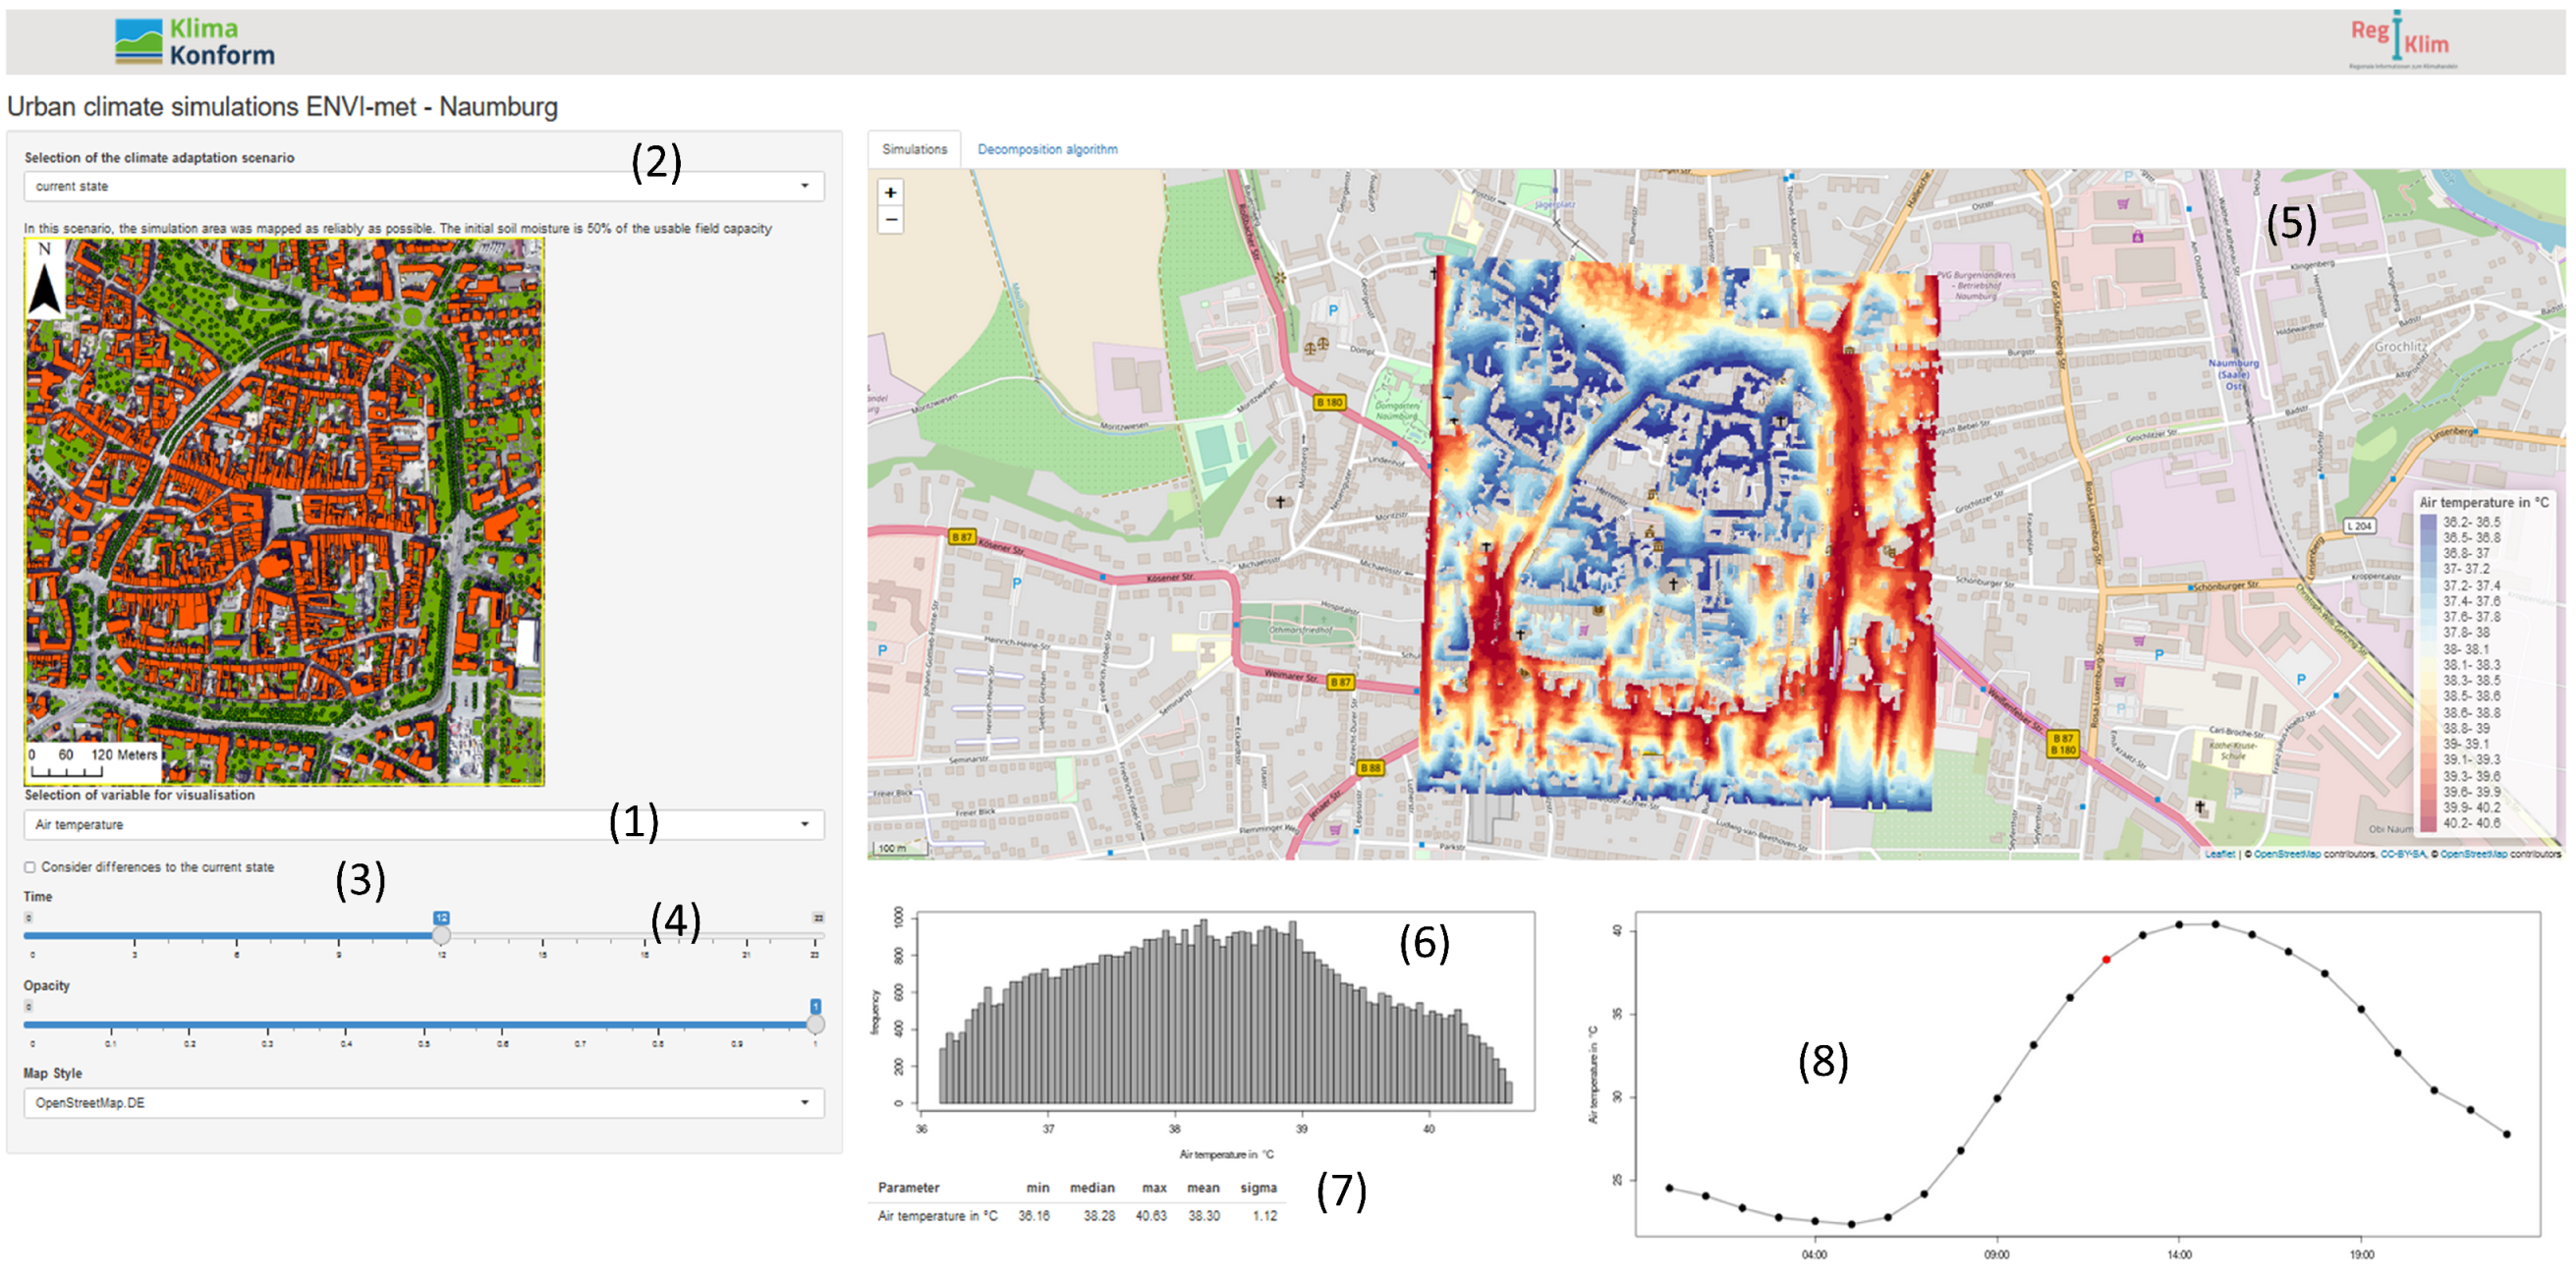
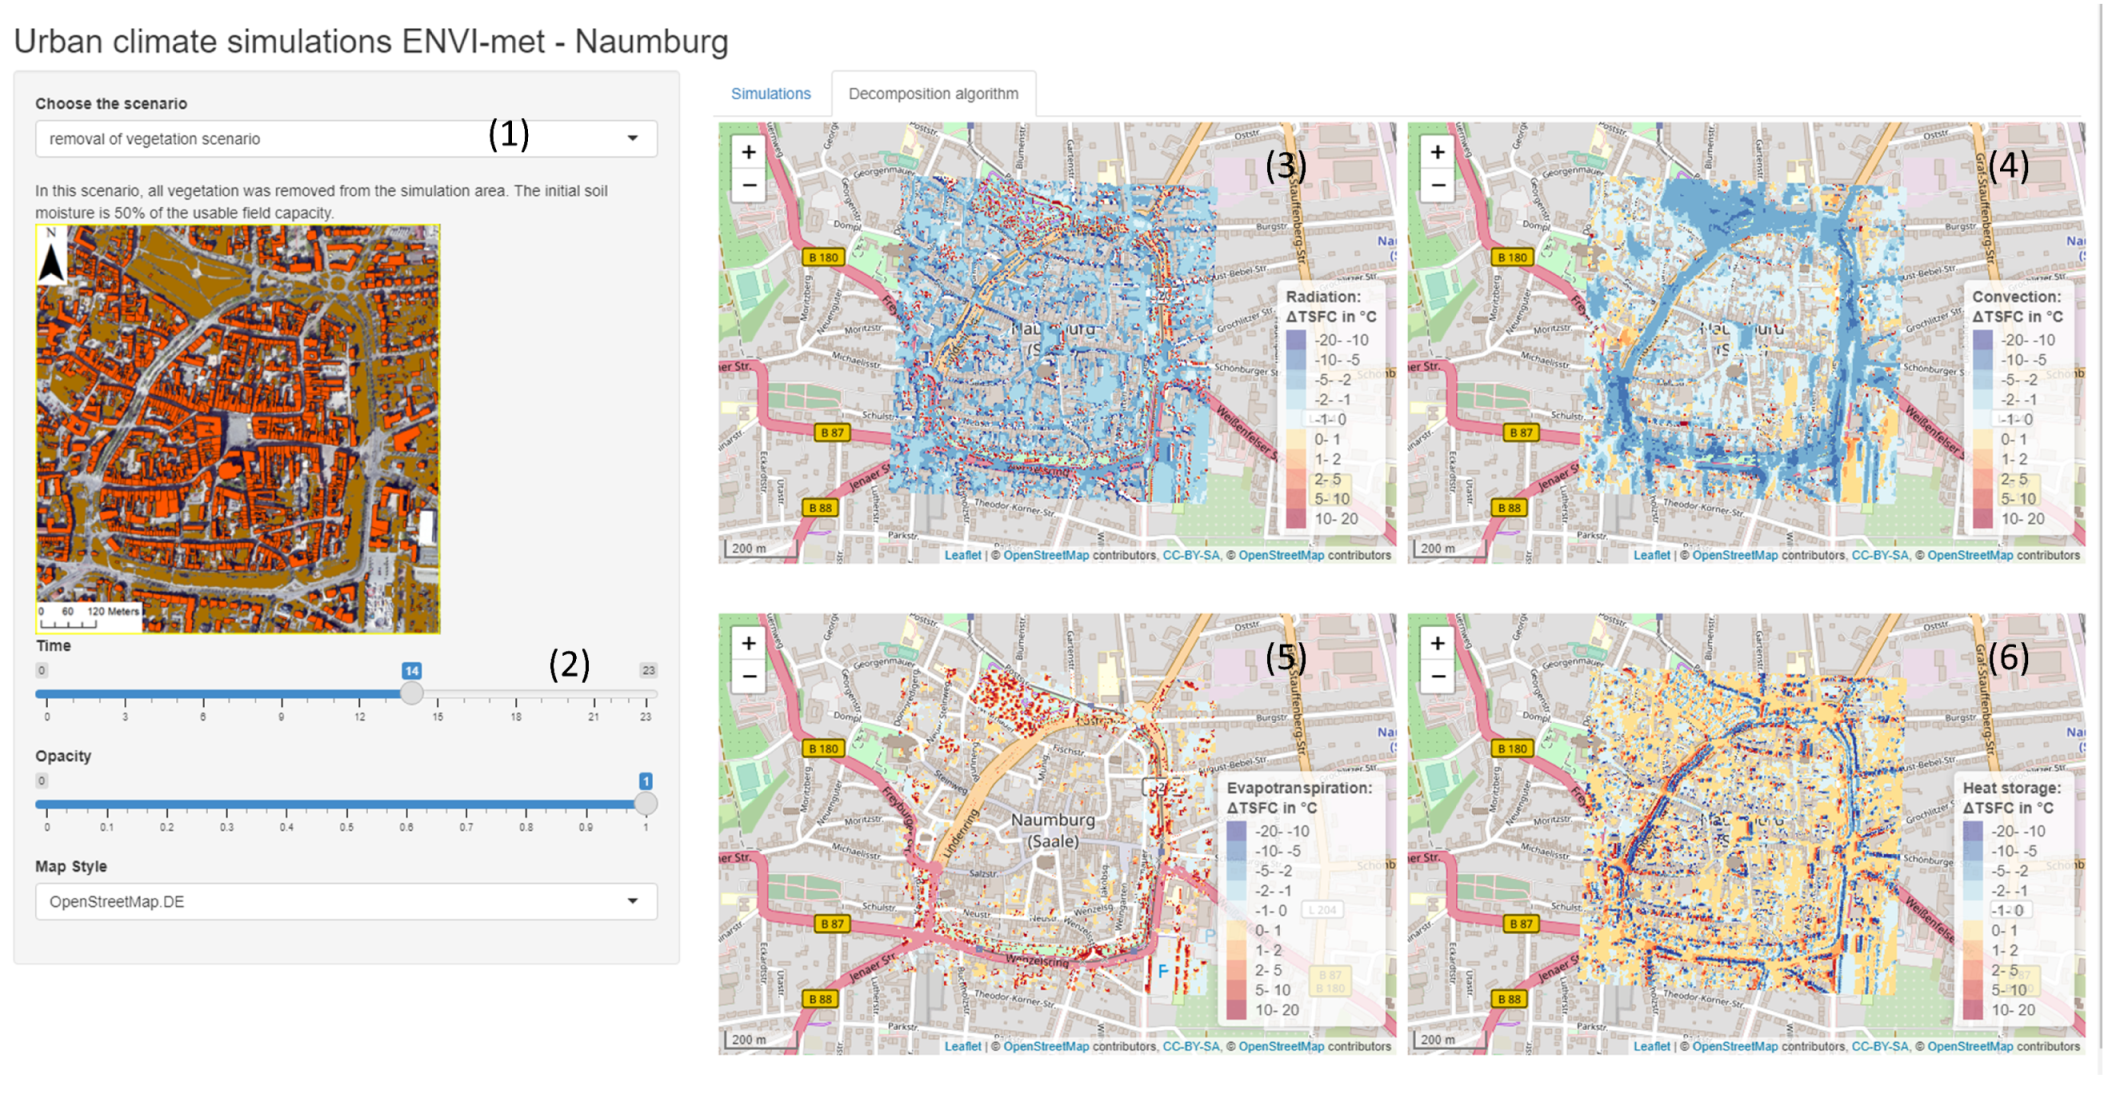
2.6. Description of the Online Tool

Due to the lack of useful public tools which allow local stakeholders to identify the characteristics of such adaptation scenarios, we developed an online tool (in R language [44]) to visualize the effects of adaptation measures (Data flow in Figure 3). Significantly reducing the amount of data and processing time, the entire ENVI-met output (in NetCDF format) was condensed to the relevant parameters, the data were restricted to surface or pedestrian level (z = 1.4 m), and saved as a database in the RData format which serves as the basis for the visualisation tool. A second database was constructed for the results of the decomposition algorithm.
The online tool was constructed with the help of the R-shiny package, which requires the specification of a user interface and a corresponding server component [45]. The user interface consists of drop-down menus for the selection of the meteorological parameters and the simulated scenario. Using a slider, the time of the day can be specified. There is also an option to consider differences between the selected climate adaptation scenario and the current state included.
The server component of the program handles the specified inputs of the user interface and applies them to the database. Thus, the outputs containing a spatial representation of the selected parameter, a time series, a histogram, some basic statistics, and the spatio-temporal outcome of the decomposition algorithm are generated.
Finally, the tool is hosted via a Kubernetes server guided by a Docker file [46].

3. Results

3.1. Online Visualisation Tool

The developed user-friendly, interactive web tool consists of a graphical user interface (GUI) that integrates the data simulated by ENVI-met and allows the exploration of different adaptation strategies regarding their impact on the urban climate at the neighborhood scale. In Figure 4, an example of the air temperature of the current state is shown. By a drop down menu, the meteorological parameters of interest are selected (air temperature, surface temperature, specific humidity factor, sensible heat flux, ground heat flux, latent heat flux, wind direction, wind speed, radiation temperature and physiological equivalent temperature (PET)). Further menus ask for the selection of the time of the pre-simulated day and the choice of the climate adaptation scenario (removed vegetation, current state, green roof scenario, increase in urban trees, irrigation scenario, drought scenario, increase in surface albedo and increase in roof albedo). For an assessment of the impact of a climate adaptation scenario, the difference to the current state can be mapped. For visualization, the meteorological parameters are plotted on a map according to predefined color scales, while the building ground areas are shown in a grey color. The spatial maps offer the possibility to enlarge the area of interest by dragging and zooming. For a deeper understanding, a histogram of the grid values and some basic statistics, as well as the mean diurnal variation, are also shown for the selected parameter and time.
Furthermore, a spatial mapping of biophysical processes (i.e., radiation, convection efficiency, evapotranspiration, and heat storage) contributing to the modified surface temperature is provided in an additional tab (see Figure 5).
The online tool is publicly available at https://webapp.ufz.de//KlimaKonform//urbansimulation//Naumburg. While we focused on climate adaptation strategies for the city center of Naumburg, the tool can easily be applied to the ENVI-met output for any other study areas as well.

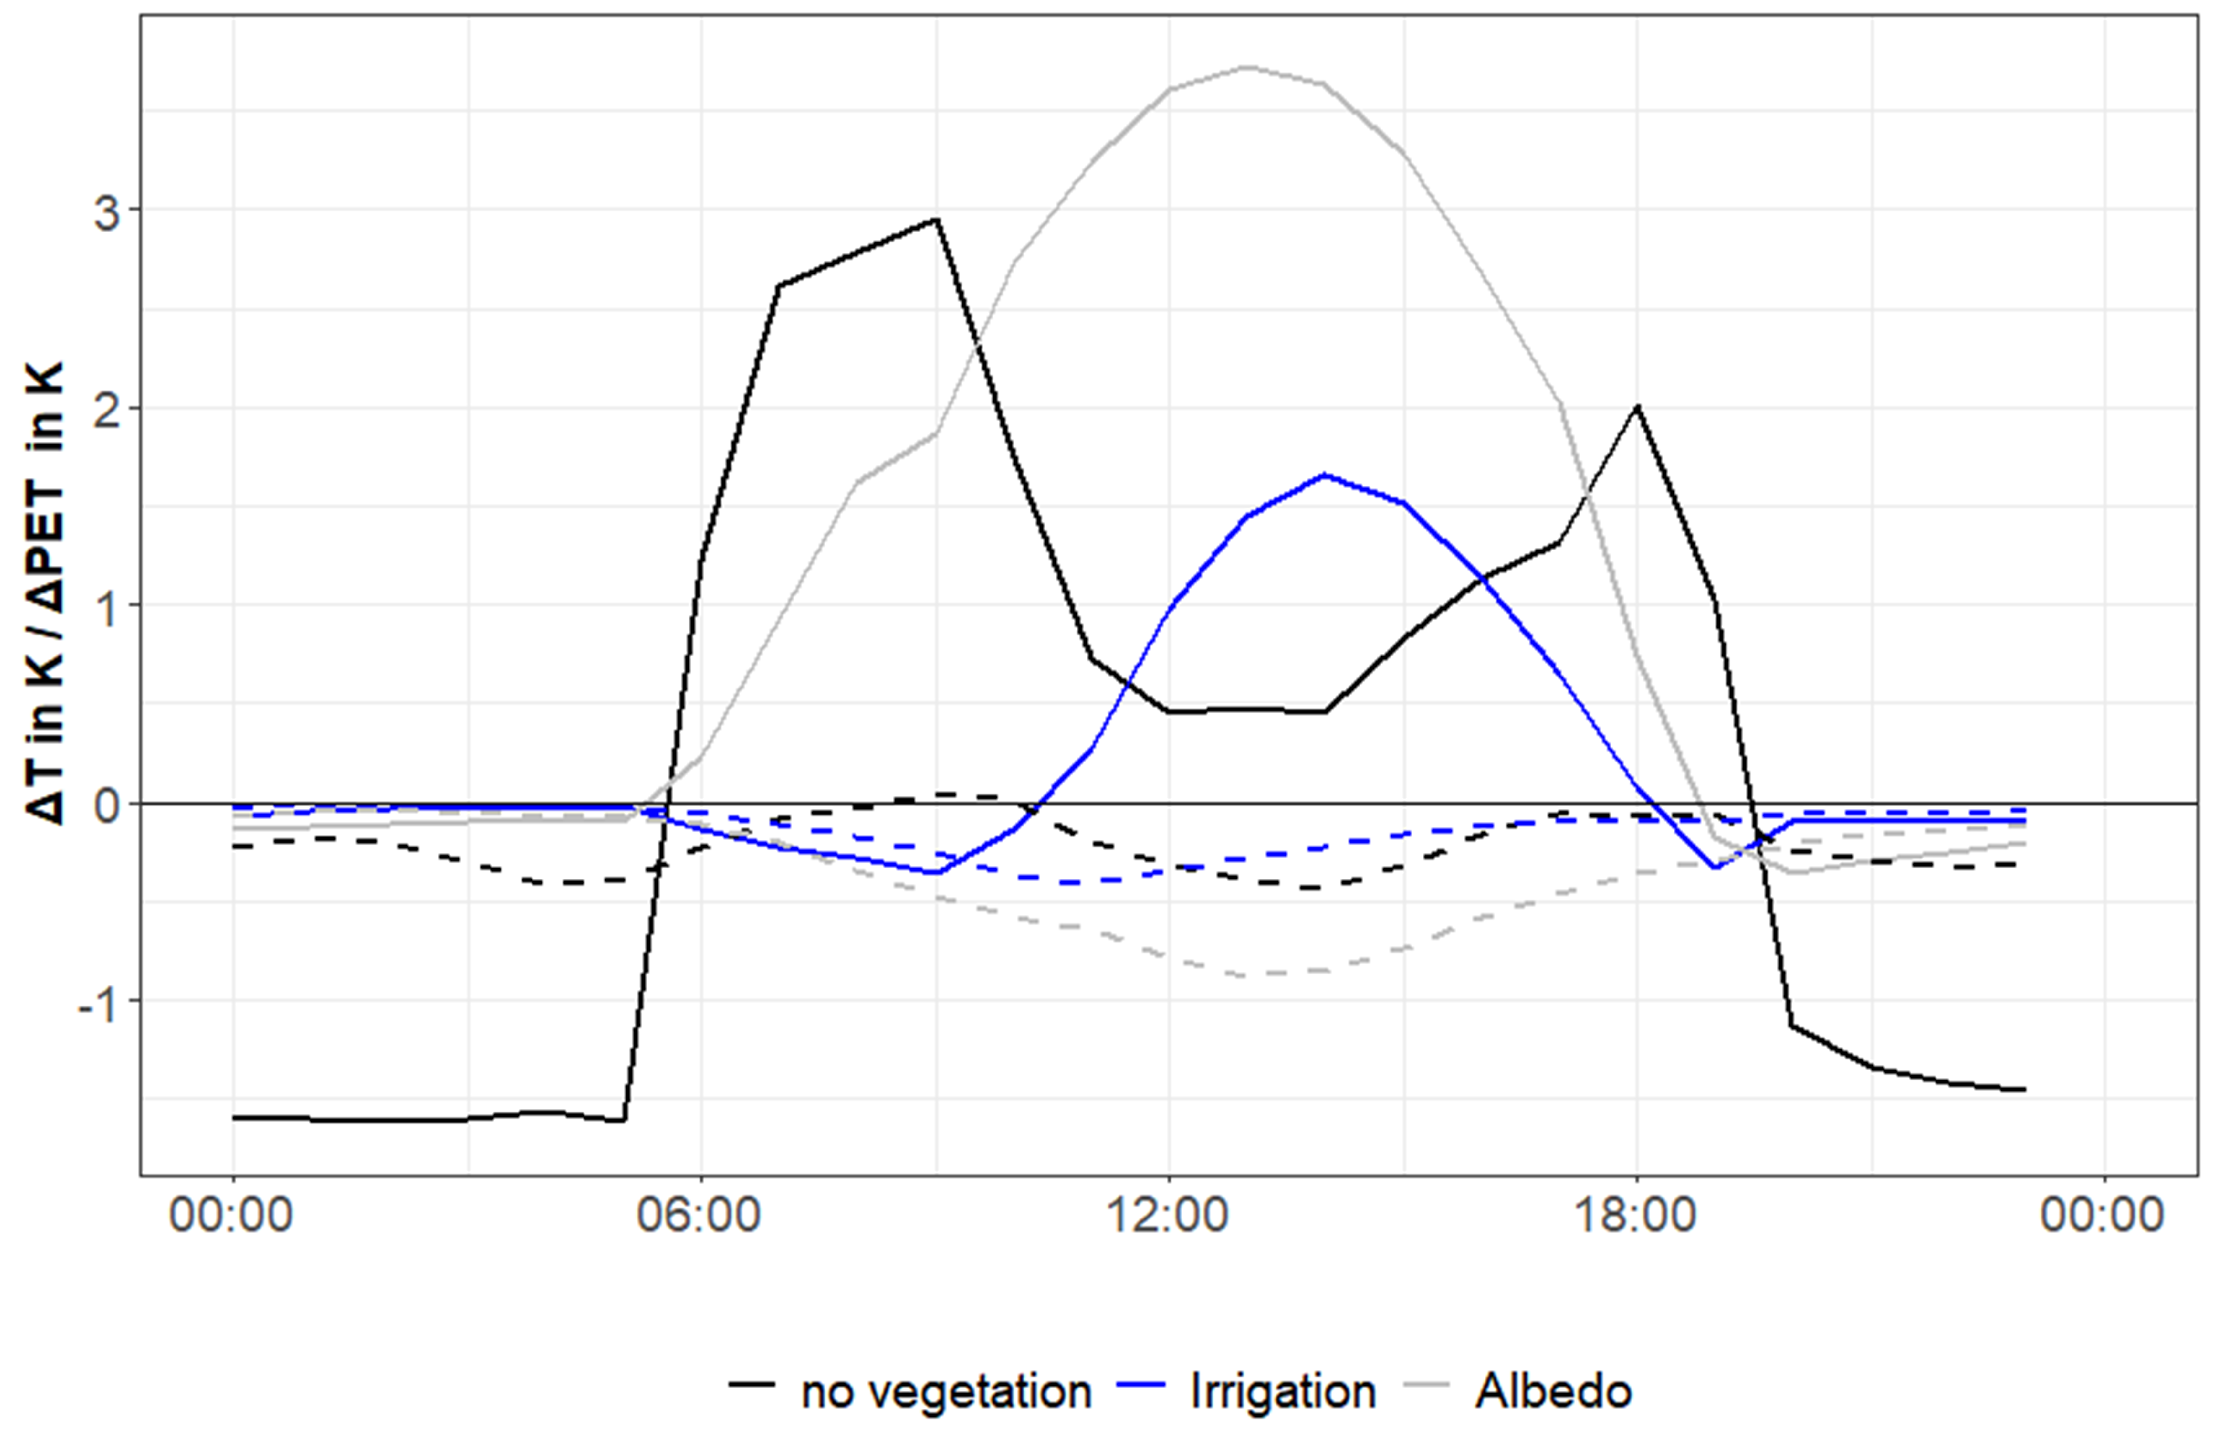
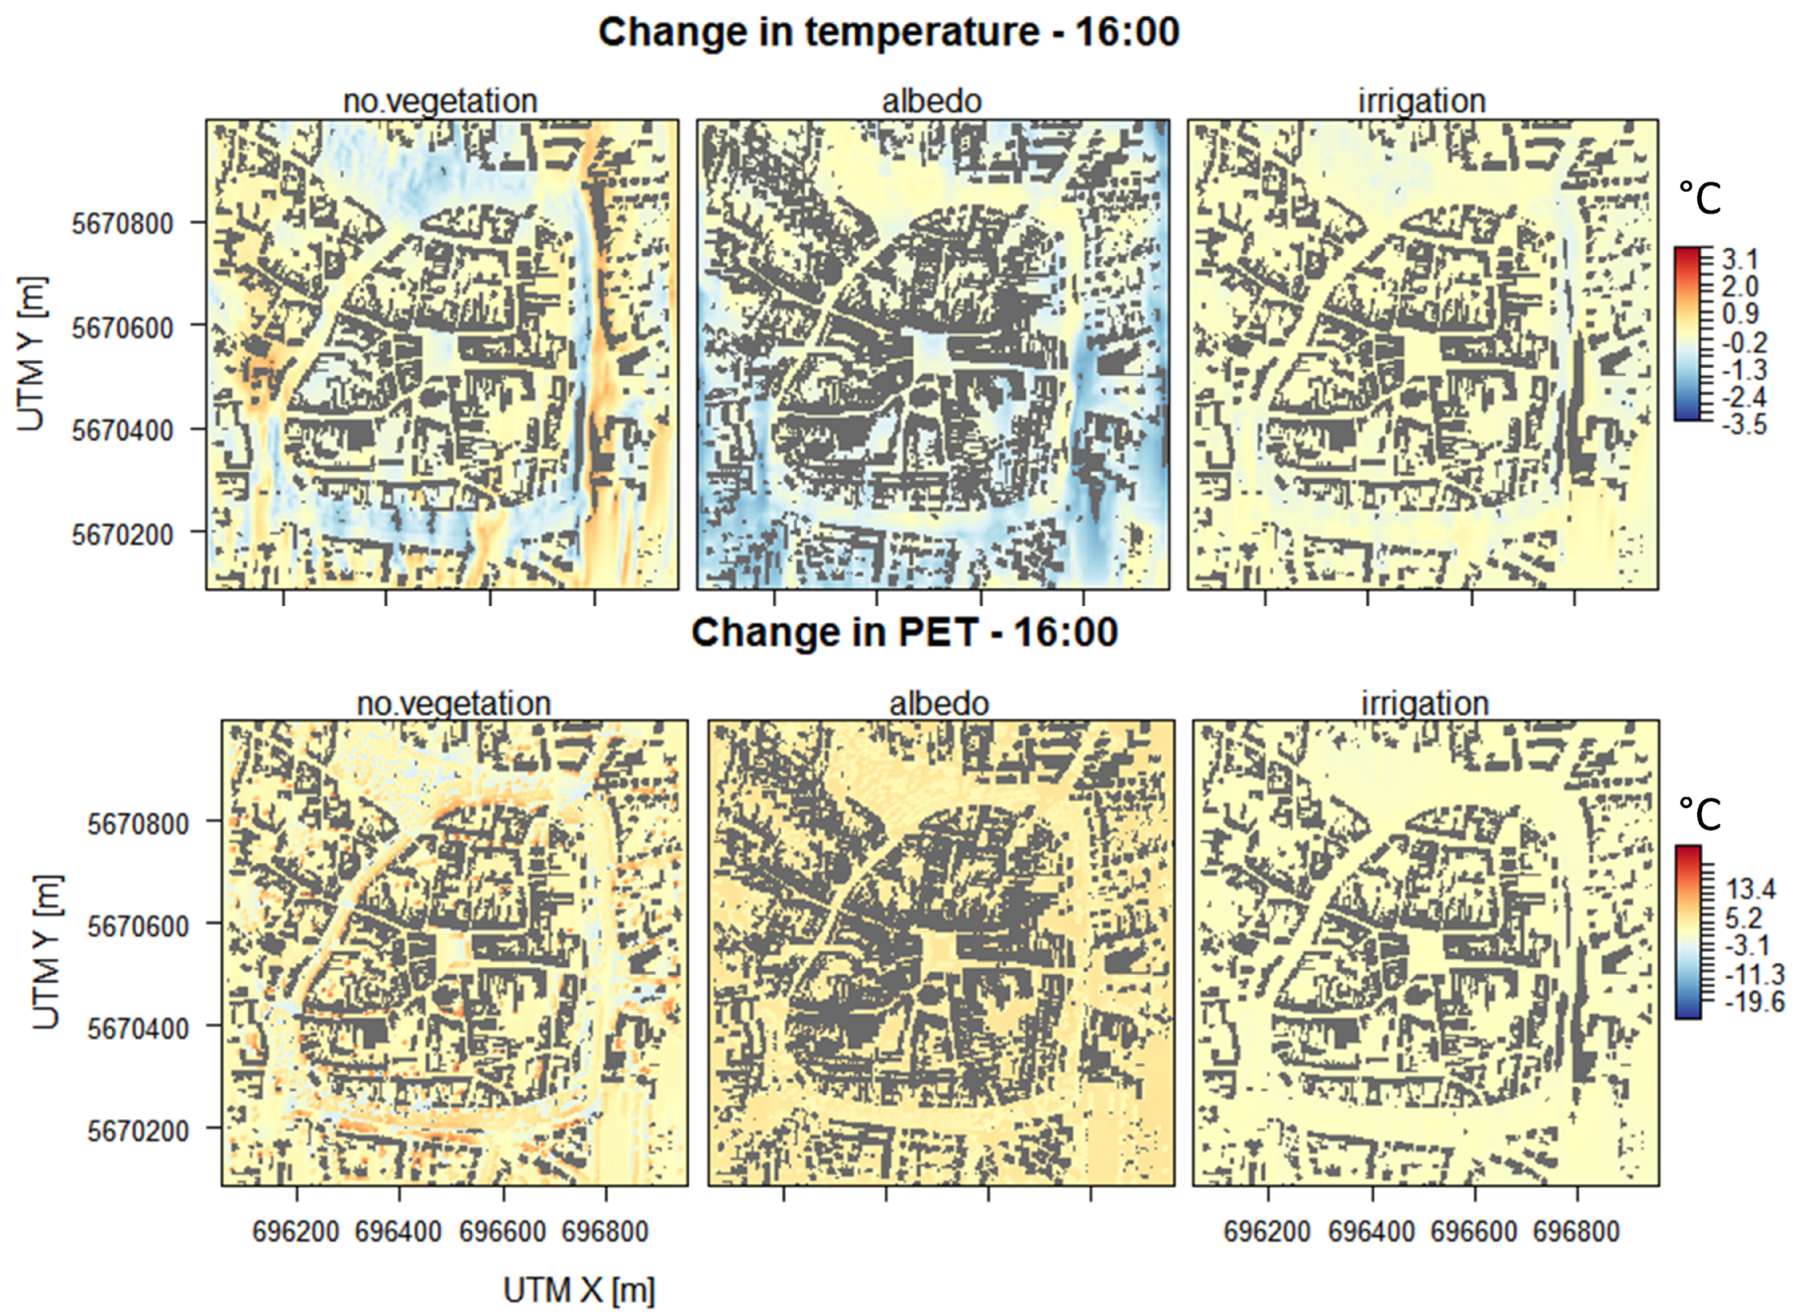
3.2. Effects of Climate Adaptation Scenarios on Local Air Temperature ( T a ) and Thermal Comfort (PET) at Pedestrian Level

During the simulation period, very high temperatures ( T a at a height of 1.4 m above the surface; see Figure 4) accompanied by extreme heat stress conditions (high PET values) were prevalent. However, significant spatial variations in air temperature can be observed in the study area due to the heterogeneity of the urban structures. Differences in the layout and orientation of buildings and streets, locally differentiated proportions of urban vegetation, and differences in surface cover lead to altered radiation, heat, and humidity characteristics of urban areas and thus also to local nuances of T a [8,10,47]. During the day, the least warmed areas are in the shade of buildings while the warmest are found along wide streets and large open spaces, as the influence of urban morphology is lower there [14,48]. In Figure 6, the effects of the studied climate adaptation scenarios (Section 2.4) regarding T a and PET are shown. Both the irrigation of unsealed surfaces and an increase of surface albedo lower T a in the urban environment, whereby the effect is most pronounced at noon since net radiation is highest. In our study area, the reduction of temperature due to the used reflective surface material (maximum reduction of T a = 0.88 K) tends to be more amplified compared to the increased evaporative cooling by the irrigation scenario (maximum reduction of T a = 0.41 K). Rather surprisingly, the removal of vegetation showed a reduction of T a except for a short period in the morning (10:00–11:00). A persistent pattern following the diurnal variation of radiation can not be identified, though. Nevertheless, a warming tendency of urban trees was identified which seems to be less pronounced during the morning and afternoon hours.
For the human perception of heat, the physiologically equivalent temperature (PET), which takes further meteorological variables such as the wind velocity v, the mean radiant temperature T mrt , and the water vapor pressure VP into account, is a suitable index [10,49]. Determined values for PET (using the ENVI-met tool Biomet with the usual default settings for body and clothing characteristics and the metabolic rate of a reference person) can be assigned to a thermal sensation scale based on surveys. In addition to PET, there are several other measures of thermal comfort (e.g., mPET, PMV, UTCI, and PPD). However, PET is the most basic and widely used measure and allows for a thermo-physiologically meaningful assessment of the thermal environment and is sufficient to analyze the potential of various approaches to attenuate urban heat stress [10]. Therefore, we decided to present our results in terms of the PET. Interestingly, the effects of the climate adaptation scenarios with regard to T a are reflected in the change in PET just to a limited extent: Despite reduced T a the albedo scenario increases PET values drastically during daytime since the reflected shortwave radiation contributes to a rise in T mrt and thus in PET. Due to the absence of shortwave radiation, there is almost no alteration of nighttime thermal comfort for this scenario.
Similar to the albedo scenario, the irrigation scenario shows a rise in daytime PET values even though T a was lowered. This worsening of thermal comfort can be observed between noon and the evening while during the night and around dawn time a reduction of PET was found. However, in this scenario, the reason for a worsening of thermal comfort is an increase in air humidity.
The absence of urban trees affects PET differently at night and during the day. At night, there is a reduction of PET since trees increase T a , T mrt (mainly due to downward long-wave radiation), VP and reduce wind speed. However, trees can significantly improve daytime thermal comfort due to shading leading to a reduction of T mrt . The change of elevation and azimuth of the sun affect PET and lead to deviations from the diurnal radiation since shadow areas are reduced at noon.
In Figure 7, the spatial effects of the climate adaptation scenarios on the air temperature and PET are depicted for 16:00. The cooling effect by the removal of the vegetation is particularly pronounced in the wide streets, while the strong cooling due to the increased surface albedo can be observed in the sealed old town center. The reduction of air temperature is notably less distinctive in the case of intensive irrigation management. Regarding the PET, the removal of vegetation is associated with a stark decrease in human thermal comfort, and the effects are on a much smaller scale compared to T a .

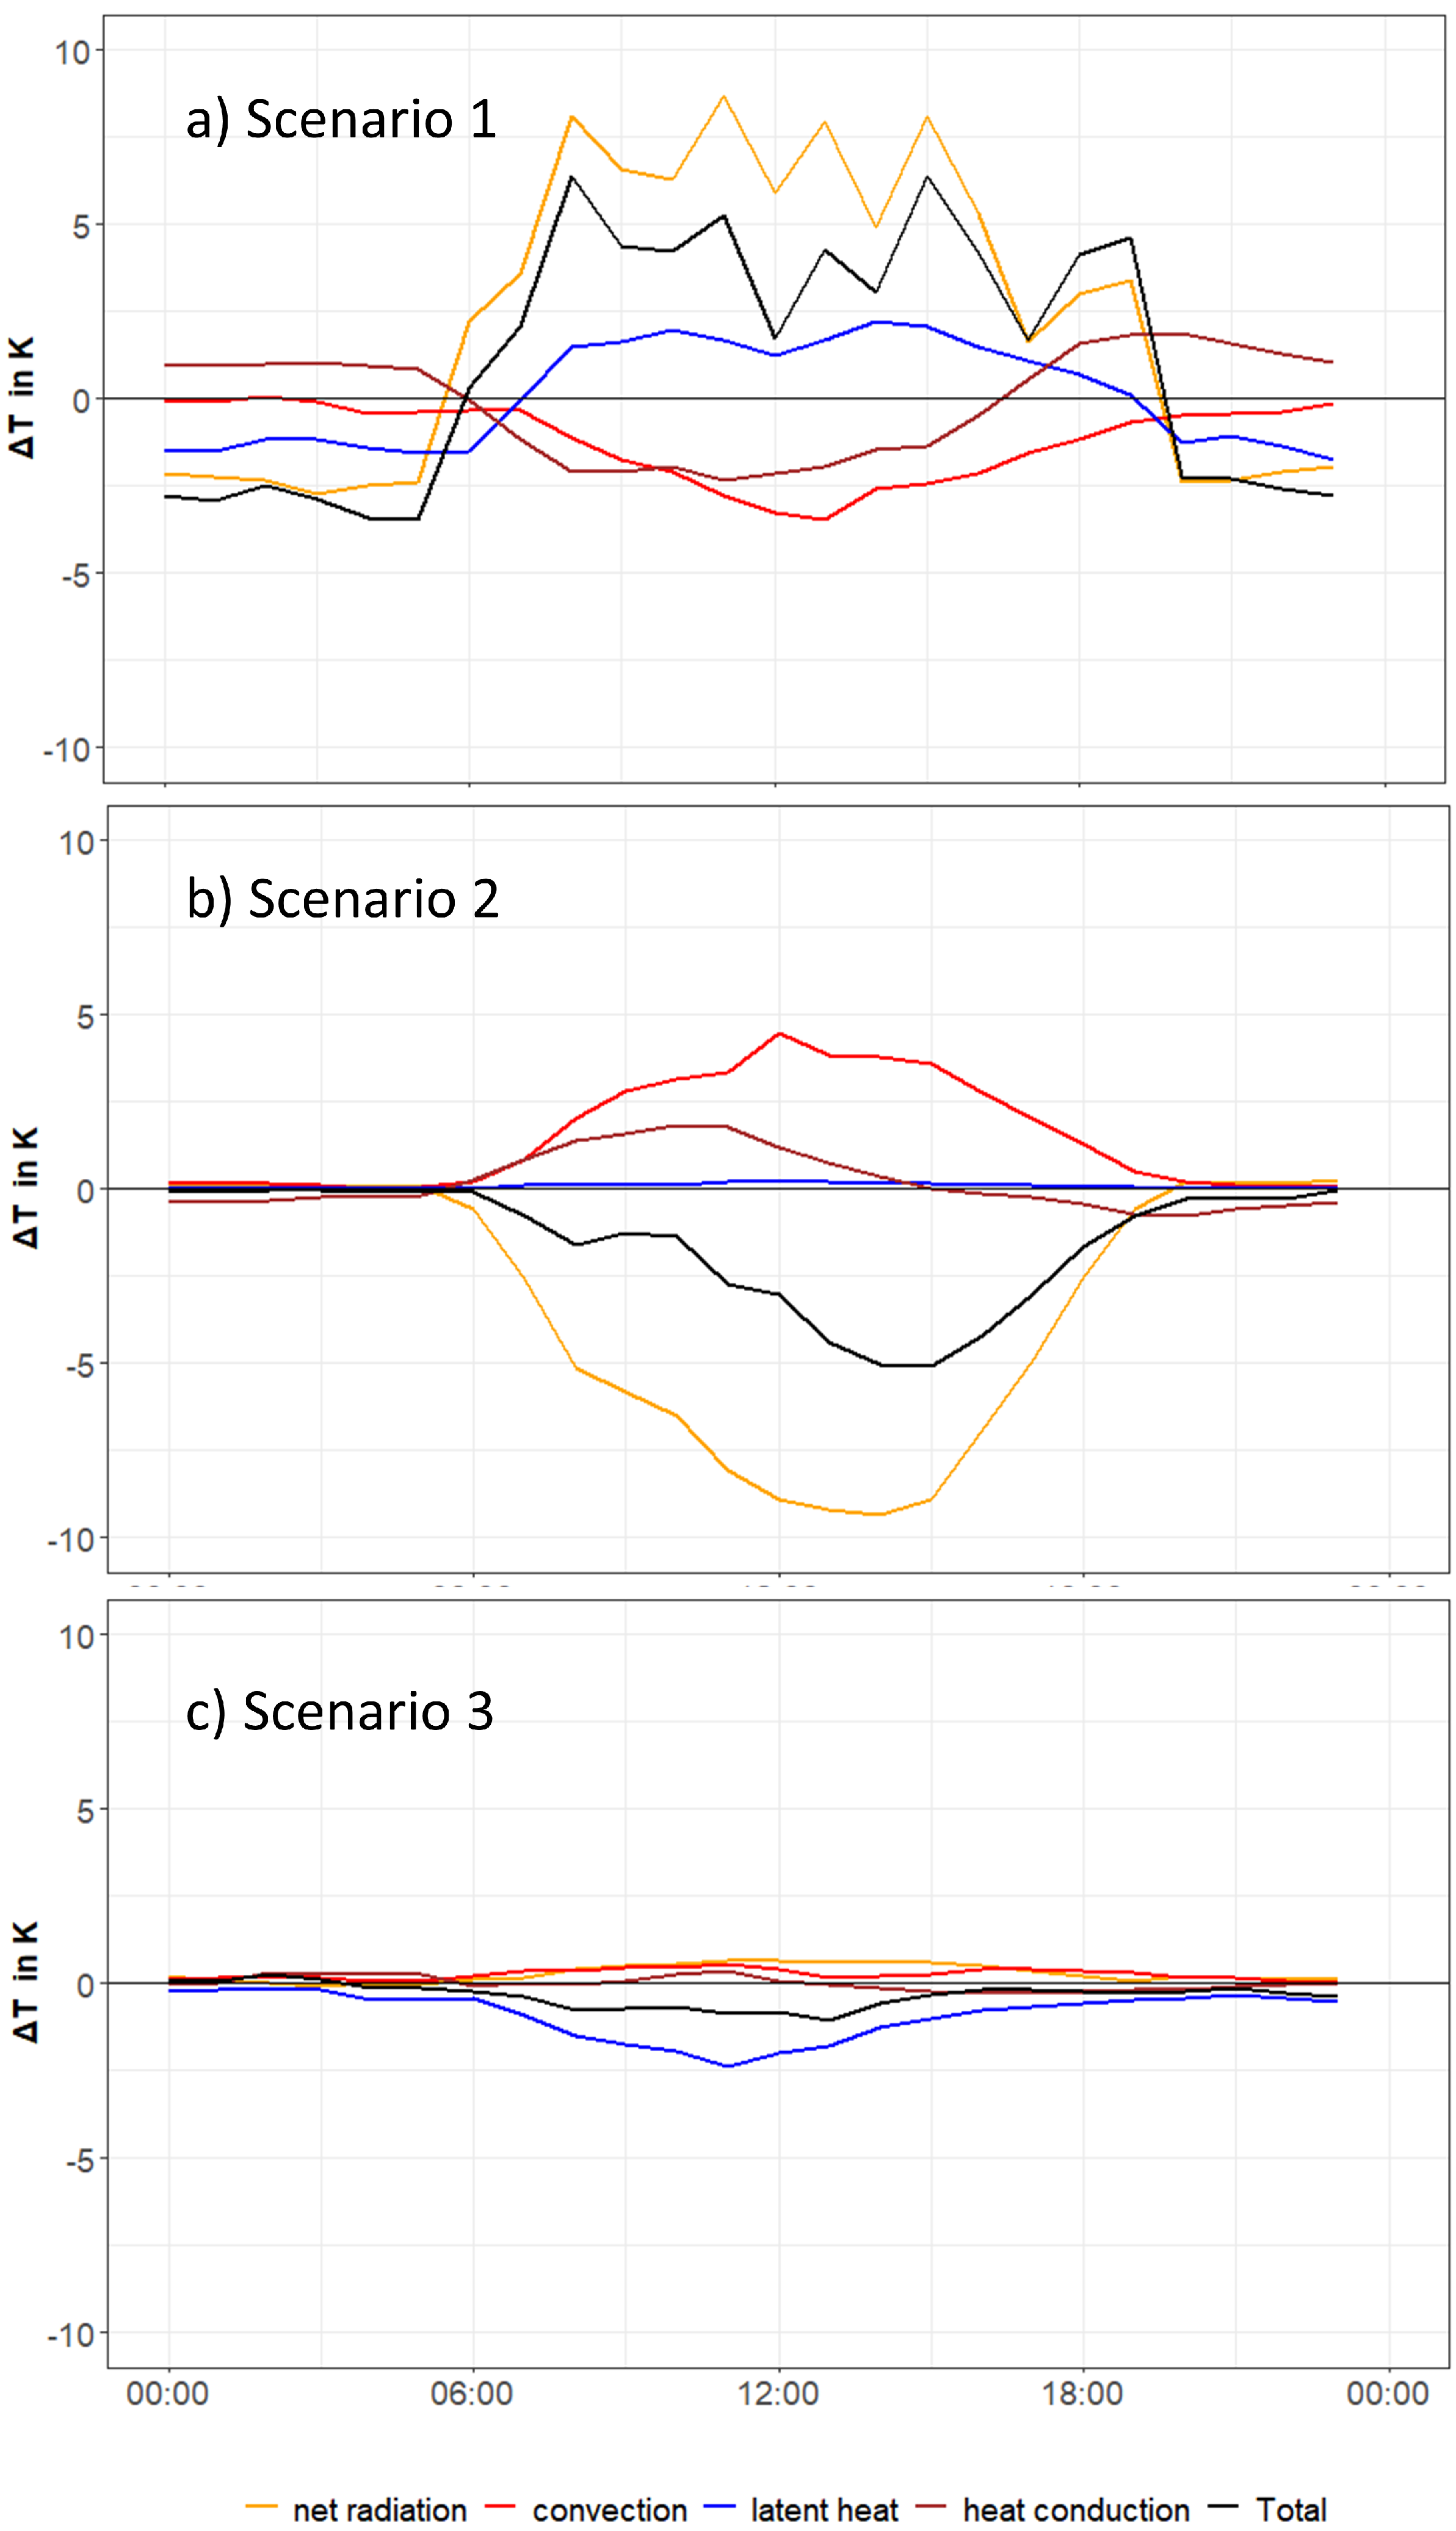
3.3. Temperature Contributions in Terms of Biophysical Processes for Climate Adaptation Scenarios

While considering changes in temperature does not allow the identification of the precise causes of respective alterations, a physically comprehensive assessment can be achieved by examining the surface temperatures in terms of energy fluxes. Using the decomposition approach (Section 2.5), we can quantify the mechanism of action of the respective climate adaptation scenarios. While, in the following, we mainly refer to diurnal changes of spatial mean values (Figure 8), our online tool shows the spatial variation of each time step as well, and, thus, might be able to support the decision-making for local stakeholders.

3.3.1. The Effect of the Absence of Vegetation

The removal of vegetation leads to a reduction in the surface temperature during the night, while the surface temperature increases significantly during the day (black line in Figure 8a).
Changes in radiation are the main contributing factor to this pattern (yellow line in Figure 8a). During the day, vegetation removal is associated with significantly less shading and increasing net radiation at the surface. At night, urban trees prevent cooling due to a significant reduction of the sky-view factor under the tree canopy, as the long-wave radiation emitted from the ground is reflected, absorbed, and also re-emitted [50].
The general trend of the influence of convection shows a daytime cooling effect and thus is reversed compared to the change in radiation balance (red line in Figure 8a). In the absence of vegetation, the sensible heat flux is significantly higher, and due to the lower r a , which is associated with a higher convection efficiency, reduces the difference between surface and air temperature. Furthermore, the turbulent spectrum contains larger convection cells that are more effective at removing heat from the surface than smaller ones [39]. This is because r a , which can be interpreted as the resistance of the interface to the temperature gradient, decreases with increasing wind speed due to the greater mixing of the air masses. The lower r a is, the higher Q H is, which leads to higher heat dissipation. At night, this effect is much less pronounced due to the low Q H .
Since the tree canopies can contribute to evapotranspiration, a warming effect can be observed for the removal of vegetation scenario (blue line in Figure 8a) during the midday period. However, since stomatal resistance of the leaves was very high at noon, the cooling potential due to transpiration was significantly reduced (local minimum of the blue line at noon). This could be attributed to the heat stress conditions of the vegetation resulting in a closing of the stomata [51,52].
Vegetation prevents heat transfer to the soil to some extent, resulting in less heat storage in the soil (brown line in Figure 8a). Therefore, decreased surface temperatures can be observed in the scenario without vegetation, as more heat is transported away from the surface. During the night, the stored heat is released and warms the surface.
Nevertheless, in scenario 1 processes leading to warming tend to dominate during the daytime, wherefore a significant increase of the surface temperature can be observed through the absence vegetation.

3.3.2. The Effect of an Increase of Surface Albedo

A notable daytime decrease of T SFC can be observed (see Figure 8b). Due to an increase in surface albedo, the net radiation at the surface level is significantly reduced. Thus, significantly less energy is absorbed and available at the surface.
The influence of evaporative cooling is almost nonexistent in this scenario. This is plausible since this scenario mainly refers to changes in properties of sealed surfaces where almost no evapotranspiration takes place.
Through significantly reduced net radiation, both the convection of heat and the conduction of heat into the ground are reduced since less energy is available for partitioning into SEB components. Thus, the transport of heat from the surface is prevented, wherefore the surface temperature tends to increase. Nevertheless, the cooling effect of less absorbed radiation still overcompensates the warming tendencies by convection and heat storage.

3.3.3. The Effect of Surface Irrigation

Increased soil moisture leads generally to a slight cooling effect (≤1 K) throughout the day, which is most pronounced at noon but almost diminishes at nighttime (see Figure 8c).
This cooling effect is mainly due to the increased evapotranspiration rates. Notably, the cooling effect still endures during the night due to the existence of the oasis effect. Irrigation of areas lowers the respective surface reflectance (albedo decreases from 0.222 to 0.213). This results in a slightly positive Δ T during daytime; opposite to the radiation effect in the albedo scenario.
The temperature effect due to changes in the storage of heat is not very pronounced for the moisture scenario. Higher water availability tends to increase surface temperatures slightly in the morning, while the trend reverses around noon. The most important factor for this pattern is the very high specific heat capacity of water so that more energy is required to warm the soil in the morning.
Due to the increased evapotranspiration, the Bowen ratio falls while net radiation and heat storage rise just slightly which implies a lowered convection and cooling of the surface.
Even though convection, radiation and heat storage tend to increase the T SFC , the evaporative cooling still prevails.

4. Discussion

4.1. The Role of Street Trees for Urban Climate Adaptation

4.1.1. The Role of Street Trees for Urban Climate Adaptation during Daytime

Numerous studies indicate the potential of trees to reduce air temperature T a through measurements and simulations [53,54,55,56], but the simulation results of this work show an increase of T a by trees during the day. Nevertheless, urban trees have a positive effect on daytime thermal comfort, which is mainly due to the reduction of T mrt associated with shading since mostly the wind speed is relatively low on heat wave days in Central Europe [10,57]. However, urban trees also lead to a densification and an increase in roughness of the urban environment which may attenuate dominant wind flow patterns and hinder turbulent air exchange. Both are decisive for the removal of heat and can lead to higher air temperatures below the tree canopy [15,57].
The mechanisms of action of trees on the urban climate, which could be quantified in terms of biophysical processes (see Section 3.3) which include the provision of shading, an increase in evapotranspiration, and a reduction in ventilation (see Section 3.3). The evapotranspirative cooling is minor, though. Thus, if urban trees are to be used as efficient climate adaptation measures, there is mainly a conflict between shading and ventilation that necessitates finding good compromises [58,59].
Many authors emphasize the importance of specific cold air corridors to improve thermal comfort through advection of cool air masses [59,60,61]. Thus, a too large amount of trees might act as obstacles and hinder an effective ventilation in the urban environment and the selection of the respective locations of the trees needs to be chosen carefully for climate adaptation.

4.1.2. The Role of Street Trees for Urban Climate Adaptation during Nighttime

During nighttime urban vegetation tends to increase both T a and PET, as the long-wave radiation loss is attenuated by the tree crowns and transpiratory cooling no longer occurs. To enable efficient nighttime cooling, a sufficiently large distance between the trees is necessary. However, this increase in nighttime PET is less dramatic than during daytime since outdoor thermal stress conditions are less pronounced. The impact on indoor climate should be evaluated as well, though. Therefore, urban trees, can not be considered as a suitable tool to attenuate effects such as the nocturnal UHI.

4.1.3. Implications

As the impact of trees on the urban climate shows different effects during daytime and nighttime, the goal of the respective climate adaptation scenario needs to be specified. This study focuses on thermal adaptation in small and medium-sized communities where nighttime UHI formation is much less pronounced than in metropolitan areas. Therefore, the improvement in daytime thermal comfort tends to outweigh the nighttime warming effect.
For an improvement of daytime thermal comfort, the optimum tree configuration consists of maximum shading while the attenuation of ventilation should be as low as possible. Since wide, east-west facing streets get exposed to solar radiation for a longer time than narrow north-south facing street canyons, which increases the likelihood of thermal discomfort, the presence of vegetation there is particularly important [62,63]. Furthermore, large open spaces where people are prevailing for longer times need to be shaded as well.
To minimize the disadvantages of vegetation by densification leading to reduced ventilation and reduced heat removal, a site analysis should be performed which accounts, e.g., for flow corridors for cold air advection. Since narrow street canyons are already shaded throughout the most time of the day, additional urban trees tend to warm the environment there.
Finally, urban green areas provide further ecological benefits such as an increase in urban biodiversity, water retention during storm water events, and visual enhancements [64,65].

4.2. Climate Adaptation Using Irrigation Policies and Highly Reflective Materials

Despite a reduction of T a , irrigation worsens thermal comfort because of higher air humidity superimposing the evaporative cooling (Figure 6). Thus, intensive irrigation policies during extreme heat wave events can not be recommended. Nevertheless, irrigation of the plants during dry periods is essential to promote vegetation health and suitable growing conditions. Ref [24] emphasizes the importance of preserving existing trees because newly planted trees are usually young plants with a small crown volume. In addition, new plantings are time-consuming and often associated with high costs, wherefore the loss of large shady trees is not easily compensated.
While an increase in street albedo can reduce T SFC and T a of the overlaying air layers significantly, the implementation can not be recommended since it is accompanied by a substantial increase in T mrt and a worsening of thermal comfort at pedestrian level. Nevertheless, an increase of roof surface albedo might be a promising approach as the increase in T mrt would not affect the inhabitants.

4.3. Limitations of the Study

The performed analysis focuses on an extreme heat wave event with maximum T a > 36 °C which so far occurs not so often (a total of 14 days during the last climatological reference period 1991–2020, according to the DWD weather observation station). However, the likelihood of such heat wave events is going to rise due to climate change, so this could be a typical summer scenario in the coming decades [1,21]. In our simulations, extreme heat stress conditions were predominant, which even prevailed beneath the trees wherefore an improvement in thermal comfort can only be achieved to a limited extent. The need for climate adaptation is particularly required in these periods, though. As the formation of urban heat depends on many factors, other meteorological conditions may alter the results concerning T a , PET and Δ T contributions of the climate adaptation scenarios significantly [66].
The simulation results are representative for urban areas with similar building configurations as those typical for many town centers of small and medium-sized communities in Germany/Europe. The selected days had a relatively constant wind direction (south), which can be observed during enduring heat events. However, mostly the study area is affected by westerly winds, and this might significantly alter the simulation results in terms of ventilation and the removal of heat in the urban environment. Ref [39] found notable and pronounced differences due to the variation of the wind direction on the effects of convection efficiency and heat storage. Therefore, further studies with different wind speeds and directions are recommended to be conducted in order to evaluate the impact of the various scenarios.
Furthermore, the tree register used in this study did not have complete data on the characteristics of the trees. Therefore, trees with unknown properties were defined and digitized with default characteristics (size, diameter, leaf area density, etc.). However, the climatic effectiveness of trees depends, in addition to the location, on these respective plant characteristics as well [67,68]. Ref [69] reported overestimations of T mrt leading to very high values of PET in ENVI-met. Finally, due to the very high computational time required for micrometeorological simulations, only selected scenarios can be considered - an operational forecast for every day would not be feasible at present.

5. Conclusions

This study investigated the potential of various climate adaptation approaches (i.e., urban green spaces, surface albedo, and irrigation of unsealed areas) to improve urban heat resilience in the city center of a medium-sized community. These approaches to climate adaptation are accompanied by undesirable trade-offs requiring compromises by local stakeholders. Therefore, we provided a user-friendly online visualization tool that allows the exploration of the effects of various climate adaptation scenarios. Based on model simulations using the urban climate model ENVI-met, these approaches were compared in terms of T a , PET, and T SFC . Furthermore, we applied a decomposition algorithm in order to quantify the mechanism of action.
The shading provided by urban trees could be identified as the main contribution to the reduction of T SFC and PET as well. Thus, human thermal comfort can be significantly improved by using trees due to the shading effect during the daytime. Evapotranspiration contributes much less to urban cooling compared to other biophysical processes. Reduced ventilation counteracts these cooling effects, though. During the night hours, however, urban trees cause less cooling and an increased heat perception due to the radiation getting trapped under the treetops.
While both an intensive irrigation of the unsealed areas and an increase of surface albedo can reduce T a , and T SFC , they can not be recommended for the improvement of daytime thermal comfort during a heat wave event.
Nevertheless, since an increase of surface albedo can significantly reduce T a of the overlying air layers, the implementation might be a promising approach at roof surfaces as the increase in T mrt would not affect the inhabitants.
As was shown in our discussion, the selection of the most suitable approach for urban climate adaptation varies with time as well as the site characteristics and a generalization is not possible. For that reason, the presented software is a useful tool for climate adaptation of cities.

Author Contributions

Conceptualization: N.W., F.Z. and U.S.; methodology: N.W. and F.Z.; software: N.W.; validation: N.W. and F.Z.; formal analysis: N.W. and F.Z.; writing—original draft preparation: N.W.; writing—review and editing: N.W. and U.S.; visualization: N.W.; supervision: U.S.; project administration: N.W. and U.S.; funding aquisition: U.S. All authors have read and agreed to the published version of the manuscript.

Funding

This work was funded by the project KlimaKonform (01LR2005A) of the German Federal Ministry of Education and Research (BMBF).

Institutional Review Board Statement

Not applicable.

Informed Consent Statement

Not applicable.

Data Availability Statement

A visual representation of the simulation results is available at https://webapp.ufz.de//KlimaKonform//urbansimulation//Naumburg.

Conflicts of Interest

The authors declare no conflict of interest.

References

  1. IPCC. Climate Change 2021: The Physical Science Basis. Contribution of Working Group I to the Sixth Assessment Report of the Intergovernmental Panel on Climate Change; Cambridge University Press: Cambridge, UK; New York, NY, USA, 2021; p. 1535. [Google Scholar] [CrossRef] [Green Version]
  2. Sun, T.; Grimmond, C.S.B.; Ni, G.H. How do green roofs mitigate urban thermal stress under heat waves? J. Geophys. Res. Atmos. 2016, 121, 5320–5335. [Google Scholar] [CrossRef]
  3. Zhang, M.; Yang, X.; Cleverly, J.; Huete, A.; Zhang, H.; Yu, Q. Heat Wave Tracker: A Multi-Method, Multi-Source Heat Wave Measurement Toolkit Based on Google Earth Engine. Environ. Model. Softw. 2022, 147, 105255. [Google Scholar] [CrossRef]
  4. Lee, H.; Holst, J.; Mayer, H. Modification of Human-Biometeorologically Significant Radiant Flux Densities by Shading as Local Method to Mitigate Heat Stress in Summer within Urban Street Canyons. Adv. Meteorol. 2013, 2013, 1–13. [Google Scholar] [CrossRef]
  5. Brown, R.D.; Vanos, J.; Kenny, N.; Lenzholzer, S. Designing urban parks that ameliorate the effects of climate change. Landsc. Urban Plan. 2015, 138, 118–131. [Google Scholar] [CrossRef]
  6. Gilabert, J.; Ventura, S.; Segura, R.; Martilli, A.; Badia, A.; Llasat, M.; Corbera, J.; Villalba, G. Abating heat waves in a coastal Mediterranean city: What can cool roofs and vegetation contribute? Urban Clim. 2021, 37, 100863. [Google Scholar] [CrossRef]
  7. Hertel, D.; Schlink, U. Entropy frameworks for urban heat storage can support targeted adaptation strategies. Urban Clim. 2022, 42, 101129. [Google Scholar] [CrossRef]
  8. Oke, T.; Mills, G.; Christen, A.; Voogt, J. Urban Climates; Cambridge University Press: Cambridge, UK, 2017. [Google Scholar] [CrossRef] [Green Version]
  9. Lin, B.; Ossola, A.; Alberti, M.; Andersson, E.; Bai, X.; Dobbs, C.; Elmqvist, T.; Evans, K.; Frantzeskaki, N.; Fuller, R.; et al. Integrating solutions to adapt cities for climate change. Lancet Planet. Health 2021, 5, e479–e486. [Google Scholar] [CrossRef]
  10. Lee, H.; Mayer, H.; Chen, L. Contribution of trees and grasslands to the mitigation of human heat stress in a residential district of Freiburg, Southwest Germany. Landsc. Urban Plan. 2016, 148, 37–50. [Google Scholar] [CrossRef]
  11. Oke, T.; Crowther, J.; McNaughton, K.; Monteith, J.; Gardiner, B. The Micrometeorology of the Urban Forest [and Discussion]. Philos. Trans. R. Soc. B Biol. Sci. 1989, 324, 335–349. [Google Scholar] [CrossRef]
  12. Ali Toudert, F.; Mayer, H. Effects of asymmetry, galleries, overhanging façades and vegetation on thermal comfort in urban street canyons. Sol. Energy 2007, 81, 742–754. [Google Scholar] [CrossRef]
  13. Shahidan, M.F.; Shariff, M.K.; Jones, P.; Salleh, E.; Abdullah, A.M. A comparison of Mesua ferrea L. and Hura crepitans L. for shade creation and radiation modification in improving thermal comfort. Landsc. Urban Plan. 2010, 97, 168–181. [Google Scholar] [CrossRef]
  14. Erell, E. Urban Greening and Microclimate Modification. In Greening Cities: Forms and Functions; Tan, P., Jim, C., Eds.; Advances in 21st Century Human Settlements; Springer: Singapore, 2017; Chapter 4, pp. 73–93. [Google Scholar] [CrossRef]
  15. Meili, N.; Manoli, G.; Burlando, P.; Carmeliet, J.; Chow, W.T.L.; Coutts, A.M.; Roth, M.; Velasco, E.; Vivoni, E.R.; Fatichi, S. Tree effects on urban microclimate: Diurnal, seasonal, and climatic temperature differences explained by separating radiation, evapotranspiration, and roughness effects. Urban For. Urban Green. 2021, 58, 126970. [Google Scholar] [CrossRef]
  16. Konarska, J.; Lindberg, F.; Larsson, A.; Thorsson, S.; Holmer, B. Transmissivity of solar radiation through crowns of single urban trees—application for outdoor thermal comfort modelling. Theor. Appl. Climatol. 2013, 117, 1–14. [Google Scholar] [CrossRef]
  17. Cohen, P.; Potchter, O.; Matzarakis, A. Daily and seasonal climatic conditions of green urban open spaces in the Mediterranean climate and their impact on human comfort. Build. Environ. 2011, 51, 285–296. [Google Scholar] [CrossRef]
  18. Demuzere, M.; Orru, K.; Heidrich, O.; Olazabal, E.; Geneletti, D.; Orru, H.; Bhave, A.; Mittal, N.; Feliu, E.; Faehnle, M. Mitigating and adapting to climate change: Multi-functional and multi-scale assessment of green urban infrastructure. J. Environ. Manag. 2014, 146C, 107–115. [Google Scholar] [CrossRef]
  19. Rahman, M.A.; Smith, J.G.; Stringer, P.; Ennos, A.R. Effect of rooting conditions on the growth and cooling ability of Pyrus calleryana. Urban For. Urban Green. 2011, 10, 185–192. [Google Scholar] [CrossRef]
  20. Coutts, A.M.; Tapper, N.J.; Beringer, J.; Loughnan, M.; Demuzere, M. Watering our cities: The capacity for Water Sensitive Urban Design to support urban cooling and improve human thermal comfort in the Australian context. Prog. Phys. Geogr. Earth Environ. 2013, 37, 2–28. [Google Scholar] [CrossRef]
  21. Zölch, T.; Pfleiderer, E.; Wagner, G.; Pauleit, S. Designing public squares with green infrastructure to optimize human thermal comfort. Build. Environ. 2018, 149, 640–654. [Google Scholar] [CrossRef]
  22. Santamouris, M. Cooling the cities—A review of reflective and green roof mitigation technologies to fight heat island and improve comfort in urban environments. Sol. Energy 2014, 103, 682–703. [Google Scholar] [CrossRef]
  23. Taleghani, M. Outdoor thermal comfort by different heat mitigation strategies- A review. Renew. Sustain. Energy Rev. 2018, 81, 2011–2018. [Google Scholar] [CrossRef]
  24. Erlwein, S.; Pauleit, S. Trade-Offs between Urban Green Space and Densification: Balancing Outdoor Thermal Comfort, Mobility, and Housing Demand. Urban Plan. 2021, 6, 5–19. [Google Scholar] [CrossRef]
  25. Acero, J.; Herranz-Pascual, K. A comparison of thermal comfort conditions in four urban spaces by means of measurements and modelling techniques. Build. Environ. 2015, 93, 245–257. [Google Scholar] [CrossRef]
  26. Bruse, M.; Fleer, H. Simulating surface-plant-air interactions inside urban environments with a three dimensional numerical model. Environ. Model. Softw. 1998, 13, 373–384. [Google Scholar] [CrossRef]
  27. Srivanit, M.; Hokao, K. Evaluating the cooling effects of greening for improving the outdoor thermal environment at an institutional campus in the summer. Build. Environ. 2013, 66, 158–172. [Google Scholar] [CrossRef]
  28. Acero, J.; Arrizabalaga, J. Evaluating the performance of ENVI-met model in diurnal cycles for different meteorological conditions. Theor. Appl. Climatol. 2018, 131, 455–469. [Google Scholar] [CrossRef]
  29. Tsoka, S.; Tsikaloudaki, A.; Theodosiou, T. Analyzing the ENVI-met microclimate model’s performance and assessing cool materials and urban vegetation applications—A review. Sustain. Cities Soc. 2018, 43, 55–76. [Google Scholar] [CrossRef]
  30. Kottek, M.; Grieser, J.; Beck, C.; Rudolf, B.; Rubel, F. World Map of the Köppen-Geiger climate classification updated. Meteorol. Z. 2006, 15, 259–263. [Google Scholar] [CrossRef]
  31. Müller, A. Das Territorium der Stadt Naumburg, 2022. Available online: https://www.naumburg.de/de/gebiet/das-territorium-der-stadt-naumburg.html (accessed on 16 August 2022).
  32. Nadler, H.; Streufert, F. Statistischer Bericht—Bevölkerungsstand, Natürliche Bevölkerungs-Bewegung, Wanderungen; Technical Report; Statistisches Landesamt Sachsen-Anhalt: Magdeburg, Germany, 2021. [Google Scholar]
  33. Landesamt für Vermessung und Geoinformation Sachsen-Anhalt. 3D-Gebäudemodell; Landesamt für Vermessung und Geoinformation Sachsen-Anhalt: Magdeburg, Germany, 2021. [Google Scholar]
  34. Mansor, S.B.; Shafri, H.Z.M.; Al-doski, J. NDVI Differencing and Post-classification to Detect Vegetation Changes in Halabja City, Iraq. IOSR J. Appl. Geol. Geophys. 2013, 1, 1–10. [Google Scholar]
  35. Mayer, H.; Holst, J.; Dostal, P.; Imbery, F.; Schindler, D. Human thermal comfort in summer within an urban street canyon in Central Europe. Meteorol. Z. 2008, 17, 241–250. [Google Scholar] [CrossRef]
  36. Santamouris, M. Using cool pavements as a mitigation strategy to fight urban heat island—A review of the actual developments. Renew. Sustain. Energy Rev. 2013, 26, 224–240. [Google Scholar] [CrossRef]
  37. Bruse, M. Die Auswirkungen Kleinskaliger Umweltgestaltung auf das Mikroklima. Ph.D. Thesis, Ruhr-Universität Bochum, Universitätsbibliothek, Bochum, Germany, 2000. [Google Scholar]
  38. Ali Toudert, F. Dependence of Outdoor Thermal Comfort on Street Design in Hot and Dry Climate. Ph.D. Thesis, Universität Freiburg, Freiburg, Germany, 2005. [Google Scholar]
  39. Hertel, D.; Schlink, U. Decomposition of urban temperatures for targeted climate change adaptation. Environ. Model. Softw. 2018, 113, 20–28. [Google Scholar] [CrossRef]
  40. Dhungel, R.; Allen, R.; Trezza, R.; Robison, C. Comparison of Latent Heat Flux Using Aerodynamic Methods and Using the Penman–Monteith Method with Satellite-Based Surface Energy Balance. Remote Sens. 2014, 6, 8844–8877. [Google Scholar] [CrossRef] [Green Version]
  41. Foken, T. Micrometeorology. Clean Air J. 2017, 27, 6–7. [Google Scholar] [CrossRef]
  42. Roe, G. Feedbacks, Timescales, and Seeing Red. Annu. Rev. Earth Planet. Sci. 2009, 37, 93–115. [Google Scholar] [CrossRef] [Green Version]
  43. Hertel, D.; Schlink, U. How to convert urban energy balance into contributions to urban excess temperatures? MethodsX 2018, 6, 132–142. [Google Scholar] [CrossRef]
  44. R Core Team. R: A Language and Environment for Statistical Computing; R Foundation for Statistical Computing: Vienna, Austria, 2020. [Google Scholar]
  45. Chang, W.; Cheng, J.; Allaire, J.; Sievert, C.; Schloerke, B.; Xie, Y.; Allen, J.; McPherson, J.; Dipert, A.; Borges, B. shiny: Web Application Framework for R; R Package Version 1.7.1; Free Software Foundation: Boston, MA, USA, 2021. [Google Scholar]
  46. Merkel, D. Docker: Lightweight linux containers for consistent development and deployment. Linux J. 2014, 2014, 2. [Google Scholar]
  47. Núñez-Peiró, M.; Sánchez-Guevara Sánchez, C.; Neila González, F.J. Hourly evolution of intra-urban temperature variability across the local climate zones. The case of Madrid. Urban Clim. 2021, 39, 100921. [Google Scholar] [CrossRef]
  48. Johansson, E. Influence of urban geometry on outdoor thermal comfort in a hot dry climate: A study in Fez, Morocco. Build. Environ. 2006, 41, 1326–1338. [Google Scholar] [CrossRef]
  49. Höppe, P. The physiological equivalent temperature - A universal index for the biometeorological assessment of the thermal environment. Int. J. Biometeorol. 1999, 43, 71–75. [Google Scholar] [CrossRef]
  50. Coutts, A.; White, E.; Tapper, N.; Beringer, J.; Livesley, S. Temperature and human thermal comfort effects of street trees across three contrasting street canyon environments. Theor. Appl. Climatol. 2015. [Google Scholar] [CrossRef]
  51. Schulze, E.; Lange, O.L.; Kappen, L.; Buschbom, U.; Evenari, M. Stomatal responses to changes in temperature at increasing water stress. Planta 2004, 110, 29–42. [Google Scholar] [CrossRef]
  52. Marchin, R.M.; Backes, D.; Ossola, A.; Leishman, M.R.; Tjoelker, M.G.; Ellsworth, D.S. Extreme heat increases stomatal conductance and drought-induced mortality risk in vulnerable plant species. Glob. Chang. Biol. 2022, 28, 1133–1146. [Google Scholar] [CrossRef]
  53. Shashua-Bar, L.; Pearlmutter, D.; Erell, E. The cooling efficiency of urban landscape strategies in a hot dry climate. Landsc. Urban Plan. 2009, 92, 179–186. [Google Scholar] [CrossRef]
  54. Middel, A.; Chhetri, N.; Quay, R. Urban forestry and cool roofs: Assessment of heat mitigation strategies in Phoenix residential neighborhoods. Urban For. Urban Green. 2015, 14, 178–186. [Google Scholar] [CrossRef]
  55. Konarska, J.; Holmer, B.; Lindberg, F.; Thorsson, S. Influence of vegetation and building geometry on the spatial variations of air temperature and cooling rates in a high-latitude city. Int. J. Climatol. 2016, 36, 2379–2395. [Google Scholar] [CrossRef] [Green Version]
  56. Ziter, C.D.; Pedersen, E.J.; Kucharik, C.J.; Turner, M.G. Scale-dependent interactions between tree canopy cover and impervious surfaces reduce daytime urban heat during summer. Proc. Natl. Acad. Sci. USA 2019, 116, 7575–7580. [Google Scholar] [CrossRef] [Green Version]
  57. Goldberg, V.; Kurbjuhn, C.; Bernhofer, C. How relevant is urban planning for the thermal comfort of pedestrians? Numerical case studies in two districts of the City of Dresden (Saxony/Germany). Meteorol. Z. 2013, 22, 739–751. [Google Scholar] [CrossRef]
  58. Ng, E. Policies and technical guidelines for urban planning of high-density cities—Air ventilation assessment (AVA) of Hong Kong. Build. Environ. 2009, 44, 1478–1488. [Google Scholar] [CrossRef]
  59. Yahia, M.; Johansson, E.; Thorsson, S.; Lindberg, F.; Rasmussen, M. Effect of urban design on microclimate and thermal comfort outdoors in warm-humid Dar es Salaam, Tanzania. Int. J. Biometeorol. 2017, 62. [Google Scholar] [CrossRef] [Green Version]
  60. Hsieh, C.M.; Chiao Hsin, H. Mitigating urban heat islands: A method to identify potential wind corridor for cooling and ventilation. Comput. Environ. Urban Syst. 2016, 57, 130–143. [Google Scholar] [CrossRef]
  61. Fang, Y.; Gu, K.; Qian, Z.; Sun, Z.; Wang, Y.; Wang, A. Performance evaluation on multi-scenario urban ventilation corridors based on least cost path. J. Urban Manag. 2021, 10, 3–15. [Google Scholar] [CrossRef]
  62. Ali Toudert, F.; Mayer, H. Numerical Study on the effects of aspect ratio and orientation on an urban street canyon on outdoor thermal comfort in hot and dry climate. Build. Environ. 2006, 41, 94–108. [Google Scholar] [CrossRef]
  63. Sanusi, R.; Johnstone, D.; May, P.; Livesley, S.J. Microclimate benefits that different street tree species provide to sidewalk pedestrians relate to differences in Plant Area Index. Landsc. Urban Plan. 2017, 157, 502–511. [Google Scholar] [CrossRef]
  64. Keeler, B.L.; Hamel, P.; McPhearson, T.; Hamann, M.; Donahue, M.L.; Prado, K.M.; Arkema, K.K.; Bratman, G.N.; Brauman, K.A.; Finlay, J.C.; et al. Social-ecological and technological factors moderate the value of urban nature. Nat. Sustain. 2019, 2, 29–38. [Google Scholar] [CrossRef]
  65. Berglihn, E.C.; Gómez-Baggethun, E. Ecosystem services from urban forests: The case of Oslomarka, Norway. Ecosyst. Serv. 2021, 51, 101358. [Google Scholar] [CrossRef]
  66. Schlink, U.; Mohamdeen, A.; Armin, R. Temporal modes and spatial patterns of urban air temperatures and limitations of heat adaptation. Environ. Model. Softw. 2020, 132, 104773. [Google Scholar] [CrossRef]
  67. Rahman, M.A.; Moser, A.; Rötzer, T.; Pauleit, S. Within canopy temperature differences and cooling ability of Tilia cordata trees grown in urban conditions. Build. Environ. 2017, 114, 118–128. [Google Scholar] [CrossRef]
  68. Rahman, M.A.; Stratopoulos, L.M.; Moser-Reischl, A.; Zölch, T.; Häberle, K.H.; Rötzer, T.; Pretzsch, H.; Pauleit, S. Traits of trees for cooling urban heat islands: A meta-analysis. Build. Environ. 2020, 170, 106606. [Google Scholar] [CrossRef]
  69. Bande, L.; Afshari, A.; Al Masri, D.; Jha, M.; Norford, L.; Tsoupos, A.; Marpu, P.; Pasha, Y.; Armstrong, P. Validation of UWG and ENVI-Met Models in an Abu Dhabi District, Based on Site Measurements. Sustainability 2019, 11, 4378. [Google Scholar] [CrossRef] [Green Version]
Figure 1. Orthophoto of the study area (right part) and the location within Germany.
Land 11 01385 g001
Figure 2. Schematic visualisation of the climate adaptation scenarios: These include the removal of all vegetation in the study area leading to bare soil surfaces (left panel), an increase of albedo for sealed surfaces (middle panel), and an increase in soil humidity (right panel).
Land 11 01385 g002
Figure 3. Data flow for the online visualisation tool.
Land 11 01385 g003
Figure 4. Screenshot of the online visualization tool: This example shows the spatial distribution of the air temperature (z = 1.4 m) for the current state at noon. The tool is accessible at https://webapp.ufz.de//KlimaKonform//urbansimulation//Naumburg. This dashboard consists of a user interface (left—greyish shaded part) and the corresponding output (right). The selection options include (1) the meteorological parameter (2) the simulation scenario, (3) the option to consider the difference compared to the current state and (4) the selection of the time. The output consists of representations for the selected input parameters which covers (5) a spatial map display, (6) a histogram of the grid values, (7) a table of some summary statistics and (8) a diurnal plot.
Land 11 01385 g004
Figure 5. Screenshot of the online visualization tool for the output of the decomposition algorithm: This dashboard consists of a user interface (left—greyish shaded part) and the corresponding output (right). The selection options include the simulation scenario (1) and the selection of the time (2). The output consists of spatial representations of the temperature contributions by the surface energy balance components, i.e., radiation (3), convection efficiency (4), evapotranspiration (5) and heat storage (6). This example shows the temperature contributions for scenario 1 (removal of vegetation) at 14:00. The tool is accessible at https://webapp.ufz.de//KlimaKonform//urbansimulation//Naumburg.
Land 11 01385 g005
Figure 6. Diurnal variations of the total differences of the spatial mean values of PET (solid lines) and T a (dashed lines) for the climate adaptation scenarios compared to the current state.
Land 11 01385 g006
Figure 7. Differences in T a (upper panel) and PET (lower panel) between the scenarios 1, 2, and 3 and the current state at a height of 1.4 m above the ground on 04.07.2015 at 16:00. (Grey areas: buildings).
Land 11 01385 g007
Figure 8. Diurnal variation of the total differences of the spatial mean values of T SFC in terms of the biophysical processes for the absence of vegetation (a—Scenario 1), an increase in surface albedo (b—Scenario 2), and surface irrigation (c—Scenario 3) compared to the current state.
Land 11 01385 g008
Table 1. Input parameters specified in the ENVI-met input file and guiding the performed simulations.
Start of simulation2015-07-03 00:00
Duration48 h
Temporal resolution1 h
Spatial resolution3 × 3 × 2 m
Total amount of grid cells288 × 288 × 22
Air temperature20.5–36.5 °C
Relative humidity25.4–74.3%
Wind speed1.5–3.85 m s 1
Wind direction180°
Cloud coverCloud free
Initial albedoRoofs: 0.5; Walls: 0.4; Asphalt: 0.2; Grass: 0.2, Trees: 0.18
Initial soil temperature0–20 cm: 25.1 °C, 20–50 cm: 22.5 °C,
50–200 cm: 18.5 °C, below 200 cm: 16.0 °C
Initial soil moisture0–20 cm: 50%, 20–50 cm: 60%, 50–200 cm: 60%, below 200 cm: 60%
Table 2. Area fractions of the total area for the individual model compartments in % as well as the number of trees in the respective scenarios.
Scenario0 (Current)1 (no veg.)2 (Albedo)3 (Irrigation)
Buildungs26%26%26%26%
Asphalt (albedo: 0.2)50%50%0%50%
Asphalt (albedo: 0.6)0%0%50%0%
Grass areas24%0%24%24%
Unsealed soil0%24%0%0%
Number of trees3855038553855
Initial soil moisture50%50%50%90%
Publisher’s Note: MDPI stays neutral with regard to jurisdictional claims in published maps and institutional affiliations.

