Article

Model-Based Yield Gap Assessment in Nepal’s Diverse Agricultural Landscape

Research Unit Sustainability and Climate Risks, Center for Earth System Research and Sustainability, Universität Hamburg, Grindelberg 5, 20144 Hamburg, Germany
*
Author to whom correspondence should be addressed.
Land 2022, 11(8), 1355; https://doi.org/10.3390/land11081355
Submission received: 25 July 2022 / Revised: 7 August 2022 / Accepted: 16 August 2022 / Published: 19 August 2022
(This article belongs to the Special Issue Modelling Land Use in Challenging Terrains)

Abstract

:
Rice, wheat, maize, millet, and barley are the five major staple cereal crops in Nepal. However, their yields are low, and imports are needed to meet domestic demand. In this study, we quantify the gap between current and potentially attainable yields in Nepal, estimate how much additional fertilizer and irrigation are required to close the gap, and assess if self-sufficiency can thus be achieved. For this, we first test the ability of the crop model EPIC to reproduce reported yields in 1999–2014 accurately. On average, simulated and reported yields at the national level were in the same range, but at the district level, the error was large, as the resolutions of the available climate and soil input data were not high enough to depict the heterogenic conditions in Nepal adequately. In the main study, we show that average yield gaps in Nepal amount to 3.0 t/ha (wheat), 2.7 t/ha (rice), 2.9 t/ha (maize), 0.4 t/ha (barley), and 0.5 t/ha (millet). With additional irrigation and fertilization, yields can be increased by 0.1/2.3 t/ha (wheat), 0.4/1.3 t/ha (rice), 1.6/1.9 t/ha (maize), 0.1/0.3 t/ha (barley), and 0.1/0.4 t/ha (millet), respectively. The results show that providing reliable and affordable access to fertilizer should be a priority for closing yield gaps in Nepal.

1. Introduction

The global food demand is predicted to increase by 35% to 56% between 2010 and 2050 [1]. Meeting increased demands for food and feed without over-exploiting agricultural systems and encroaching on natural ecosystems will be a challenge for humans in the coming decades, especially considering the projected effects of climate change [2]. Intensification of current agricultural systems is one way toward increasing crop yields and strengthening food security [3]. Currently, yields on a considerable proportion of global agricultural land do not attain their full potential [4]. Significant yield variations exist even among regions with similar agro-climatic conditions, signifying the presence of yield gaps [5]. These yield gaps are defined as the differences between the potential yields of a specific crop under optimal management and the actual yields attained by farmers [6]. The main causes for the yield gaps are insufficient nutrient and water supply and inadequate pest and disease management [4]. By addressing these impediments, crop yields in low-yielding regions could be increased without changing crop varieties, resulting in enhanced food supply, improved food self-sufficiency, and higher food security at regional, national and global scales [7].
Increasing food production is a priority in low-yielding regions worldwide, and Nepal is one such example. Nepal’s agricultural sector provides livelihoods to over 80% of Nepal’s population, employs almost 68% of the labor force, and contributes 35% to Nepal’s gross domestic product (GDP) [8]. Although agriculture is the main contributor to GDP, the average yields of cereal crops are much lower in Nepal than in neighboring countries, mainly because of poor infrastructure and a high proportion of subsistence farming with its dependency on rainfall and low fertilizer application rates [9]. The average fertilizer use in Nepal in 2014 was 67.4 kg per ha, while in the same year, 464.8 kg/ha were used in China, 163.5 kg/ha in India, 279.2 kg/ha in Bangladesh, and 134.9 kg/ha in Pakistan [10]. Furthermore, only 36% of the agricultural area in Nepal is irrigated, and the lack of irrigation and the low application of fertilizer is a significant impediment to increasing agricultural productivity [11].
Due to the low productivity of the agricultural sector in Nepal, national production cannot meet the national food demand, and food imports are necessary to close the gap. Cereals are the most vital food for providing caloric and nutritional requirements and are the main low-cost source of energy and protein in Nepal. Figure 1 shows the import rates of the five main cereal crops in Nepal. The country went from being a net food exporter in the 80s to becoming an importer, with increasing import rates of on average 39% per annum for rice, 26% for maize, and 126% for wheat [12,13].
In order to address these issues, Nepal’s Ministry of Agriculture Development (MOAD) proposed an Agriculture Development Strategy (ADS) with the goal of transforming the agricultural sector over the next 20 years [15]. The ADS comprises measures to raise agricultural productivity, including efficient use of fertilizers, an expansion of the irrigated area, and an improvement of irrigation efficiency. It also includes measures to strengthen the agricultural sector and improve its sustainability and resilience in the longer term, such as an expansion of its agricultural research and extension services, and the development and promotion of efficient and sustainable farming practices and sustainable use of natural resources to increase the resilience to climate change.
The first step toward increasing agricultural productivity is a robust, spatially explicit estimation of the potentially attainable crop yields, followed by an analysis of how the gap between the attainable and the actual yields can be closed most efficiently [16]. Previous studies on the yield gap in Nepal focused only on specific households, places, basins, regions, or crops [17,18,19,20]. In this paper, we present a spatially explicit, country-level assessment of intensification scenarios for the five major cereal crops grown in Nepal. We want to answer the following questions:
(i)
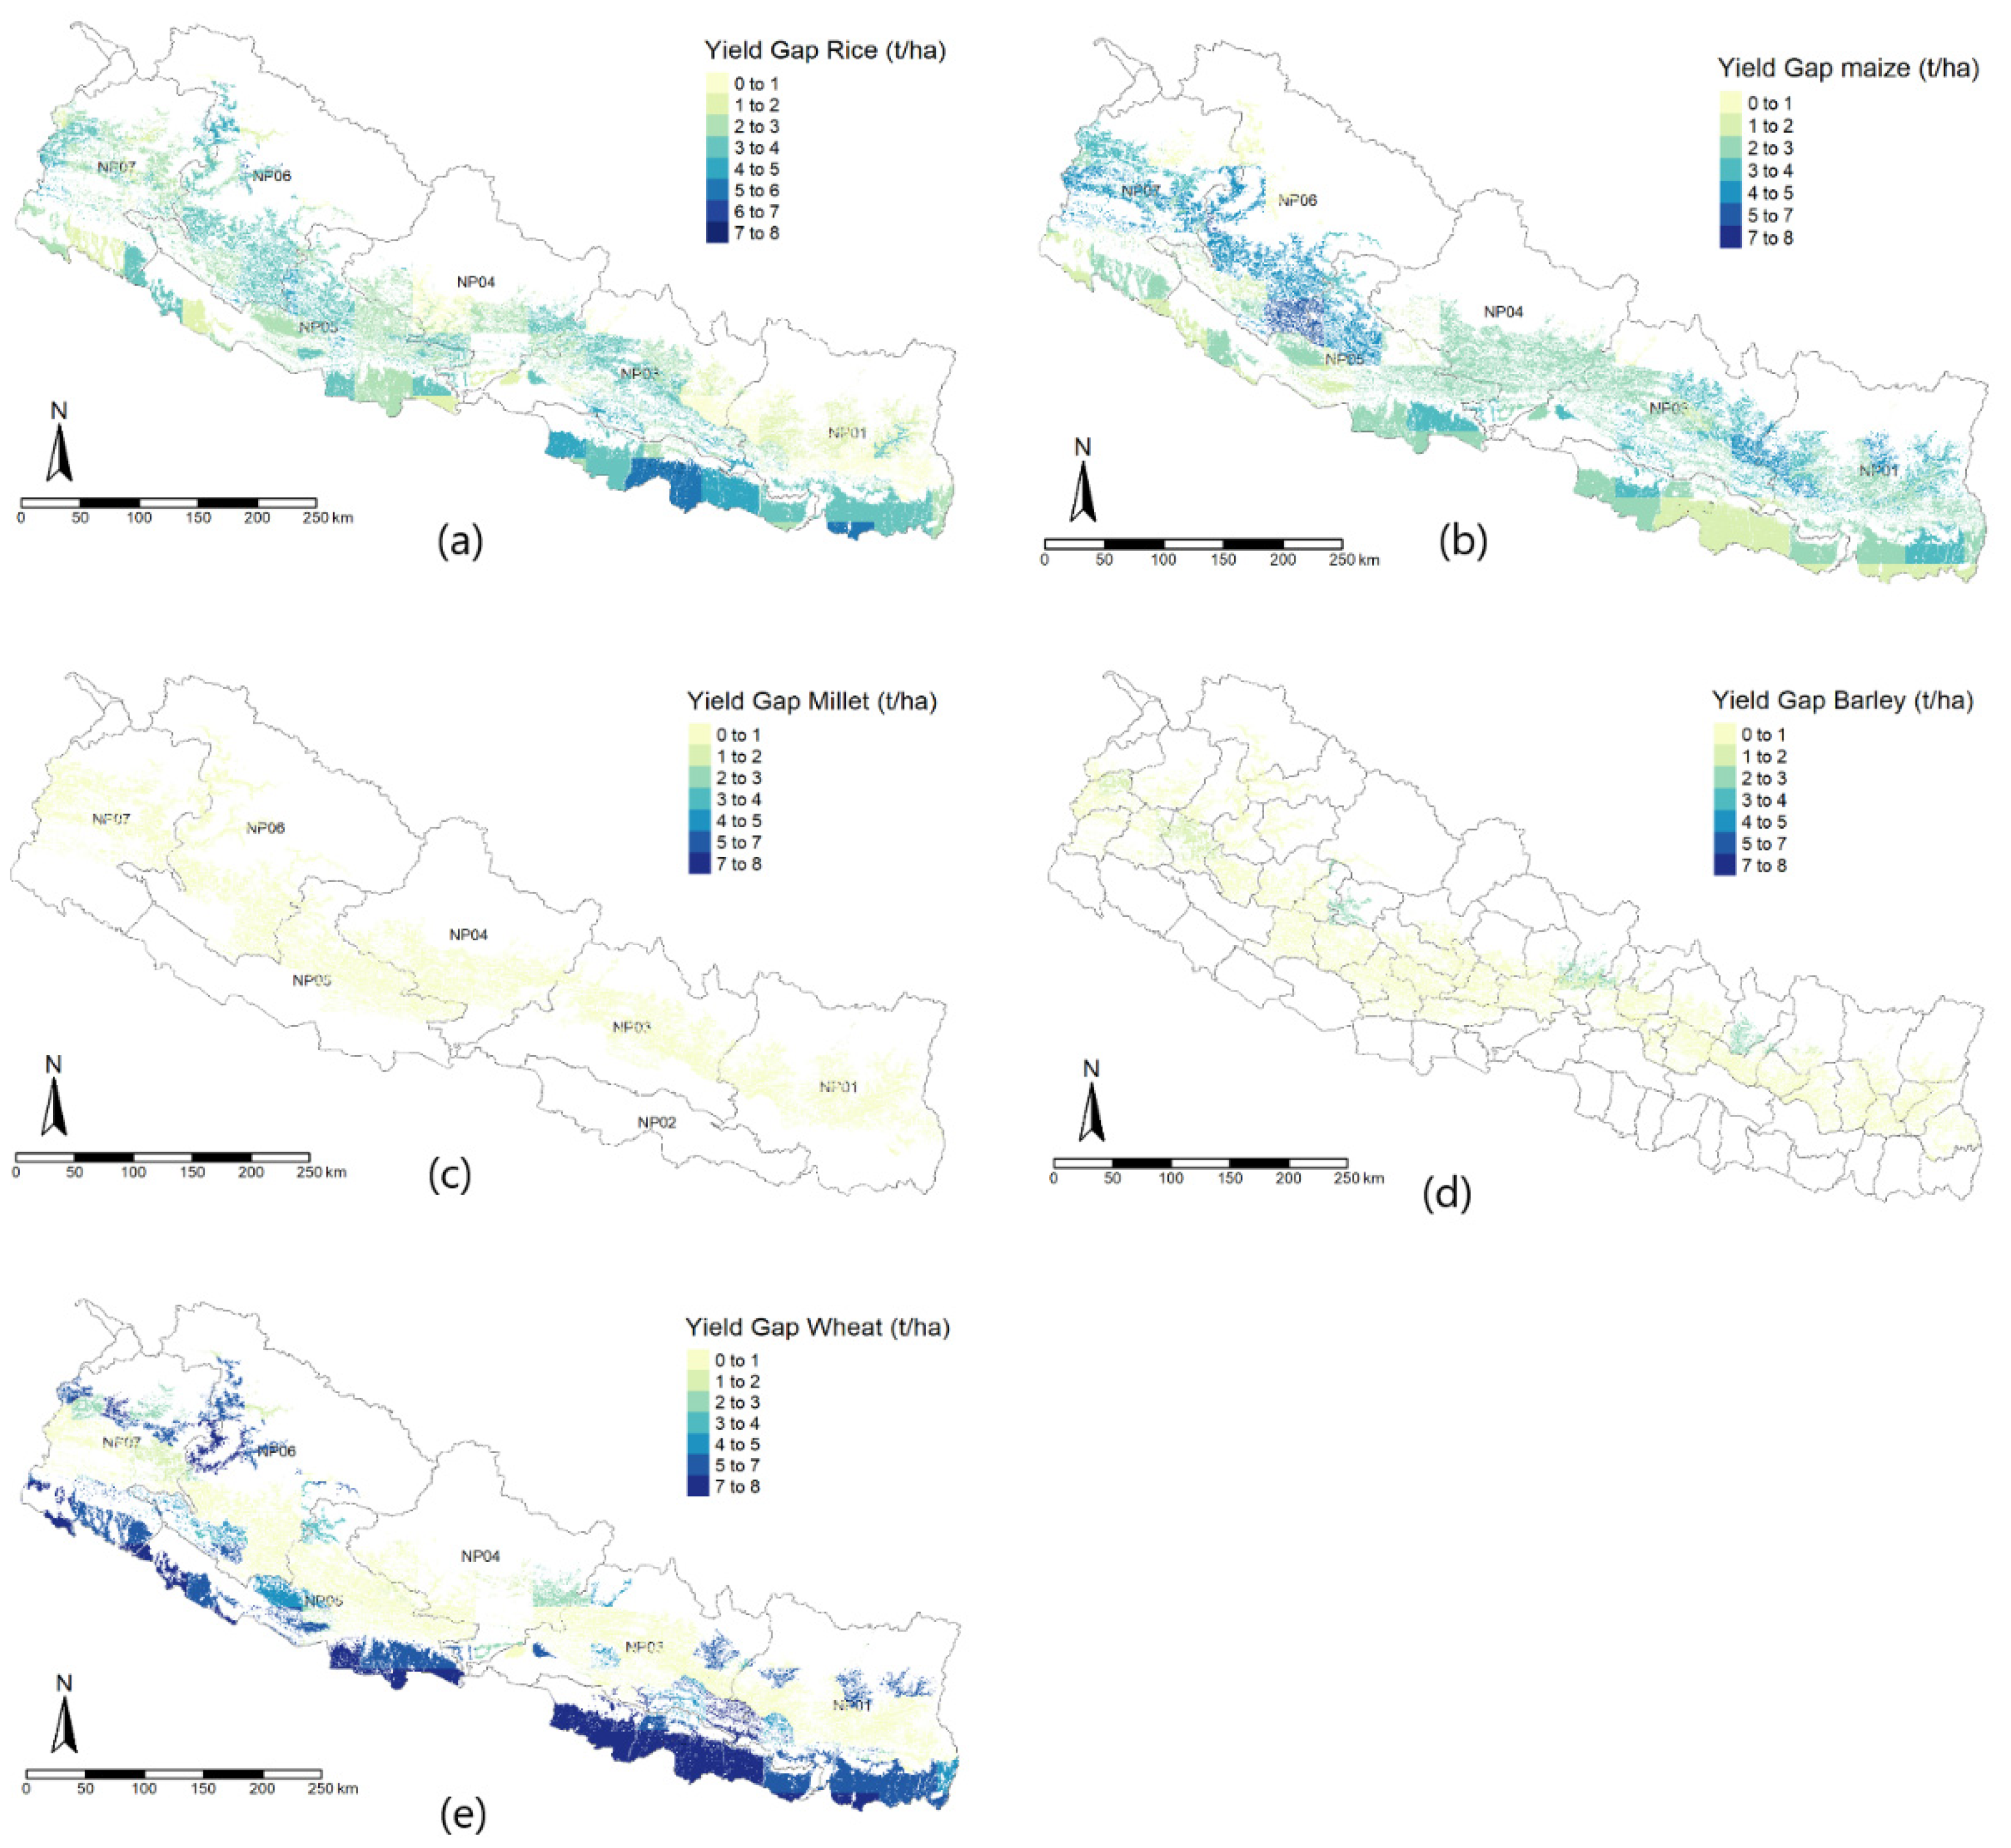
  How large is the current yield gap for the five key arable crops grown in the country (rice, wheat, maize, millet, and barley)?
(ii)
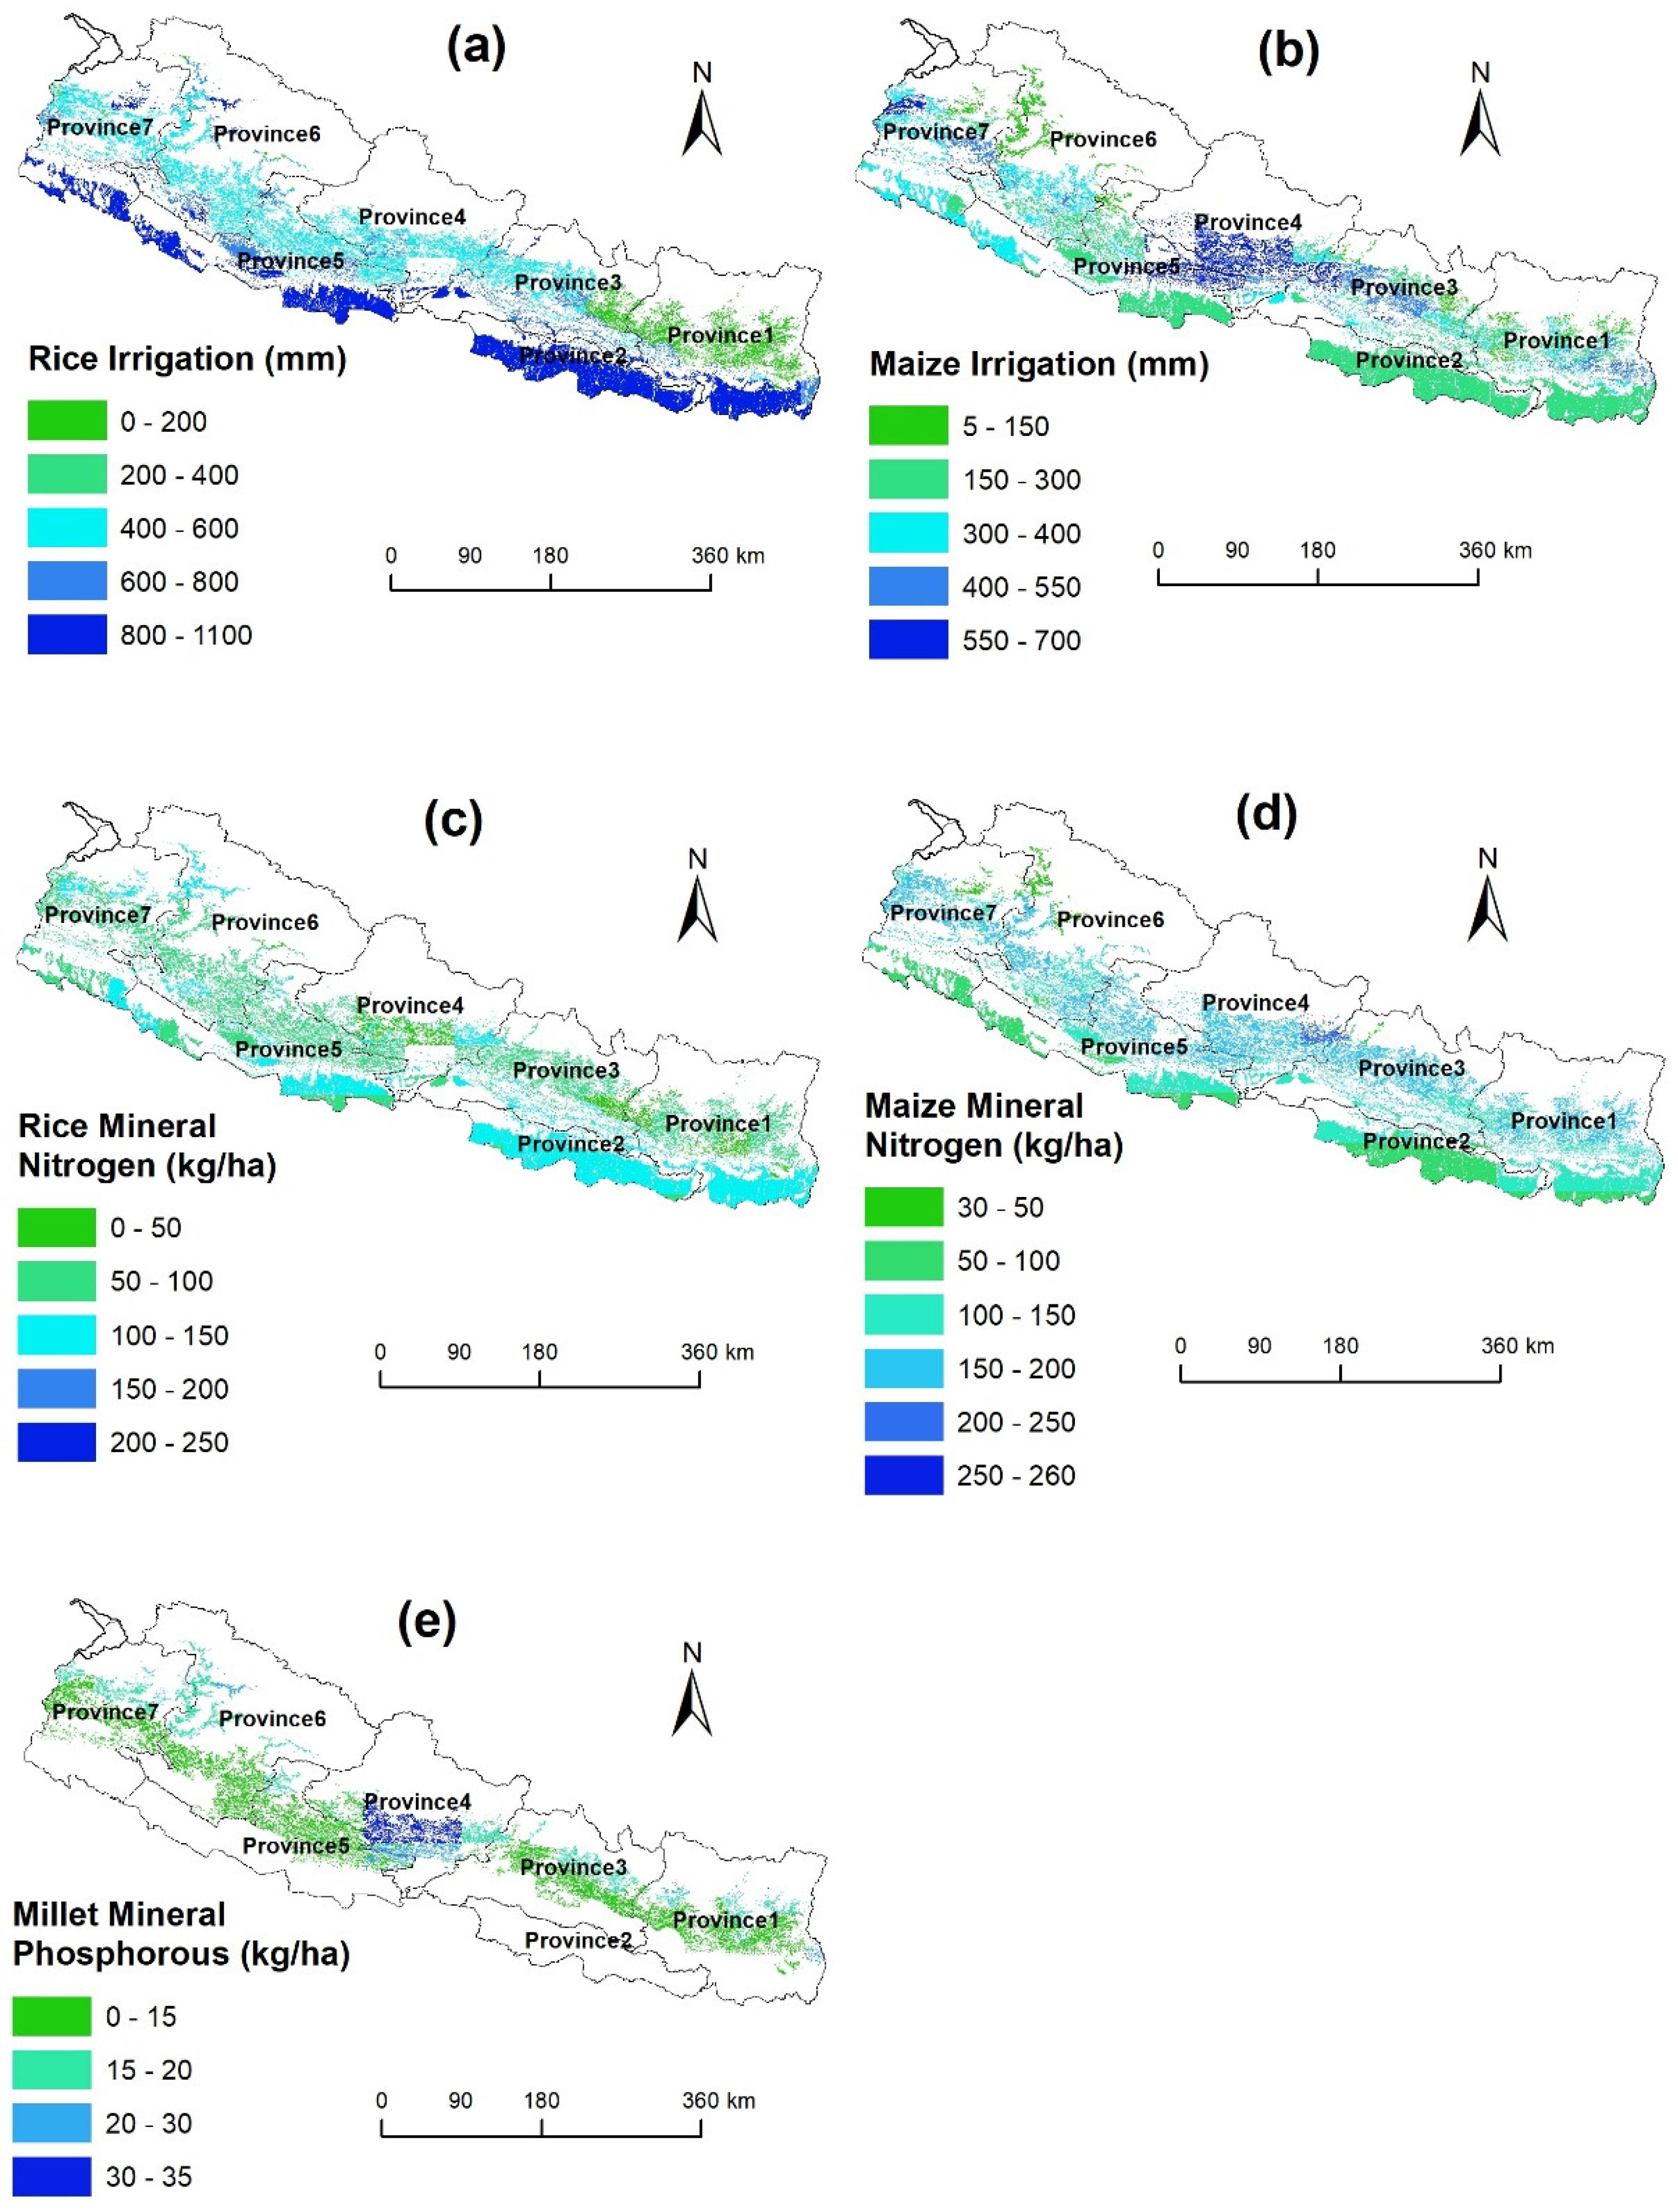
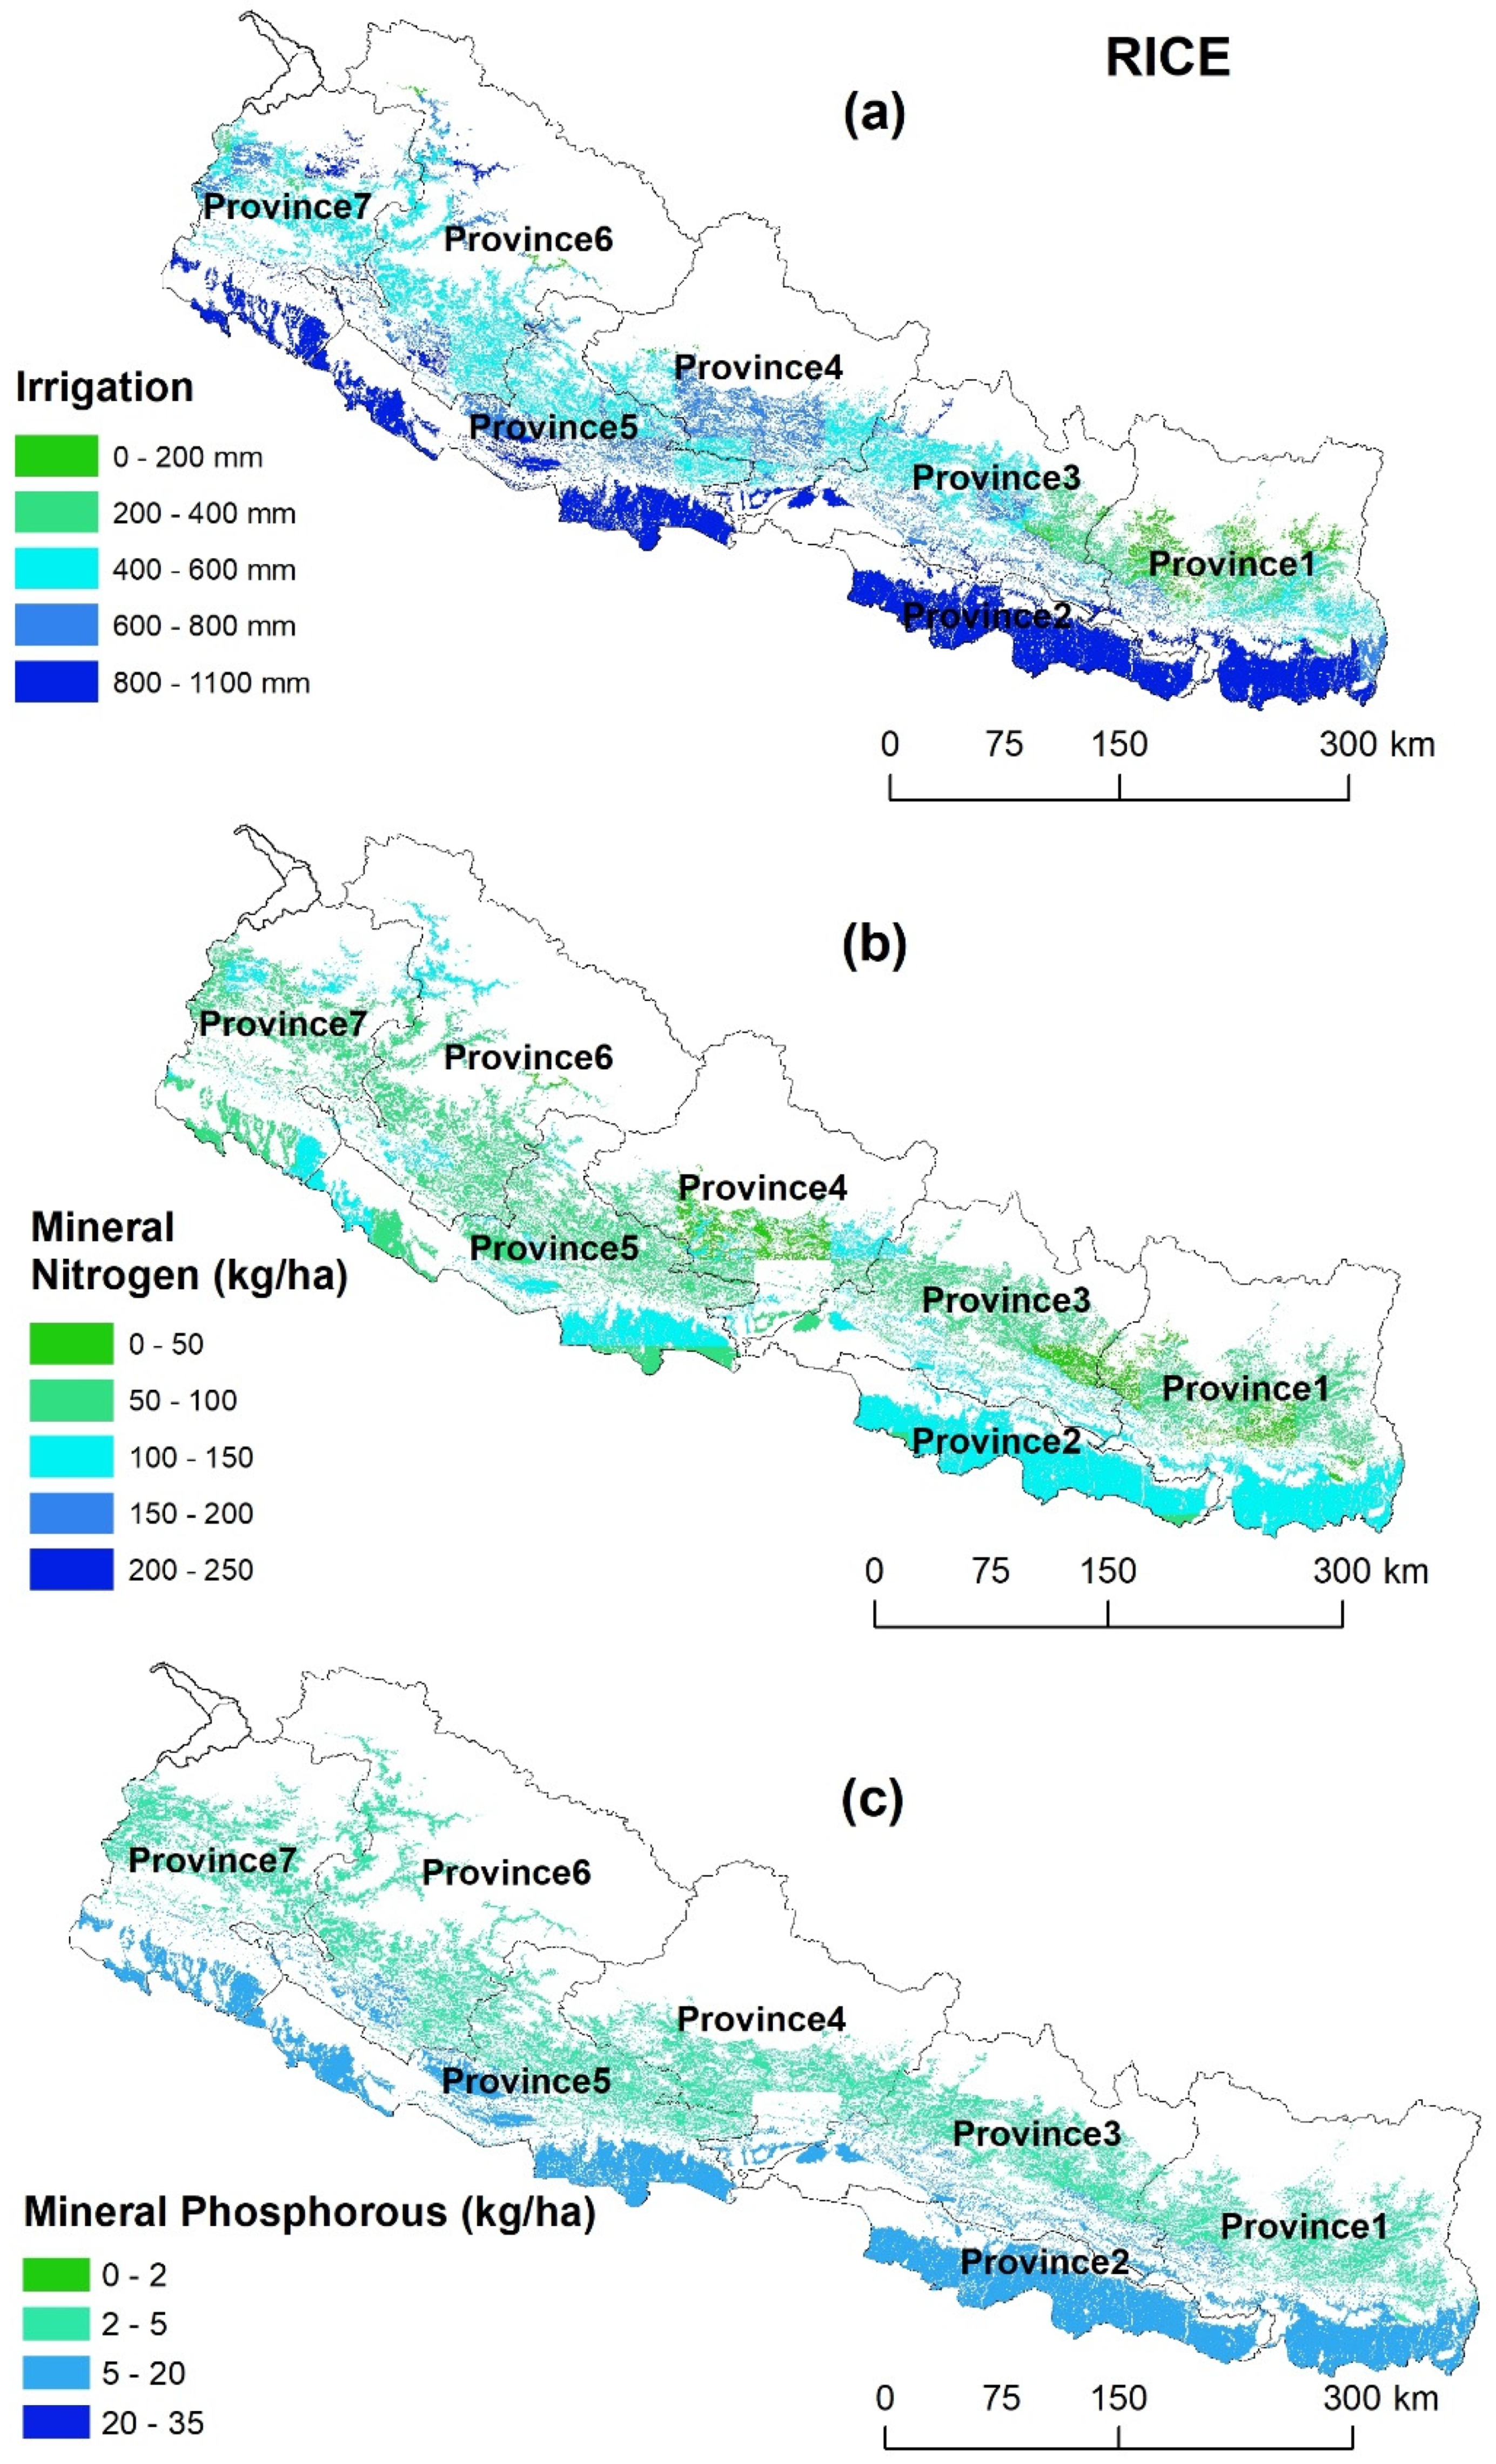
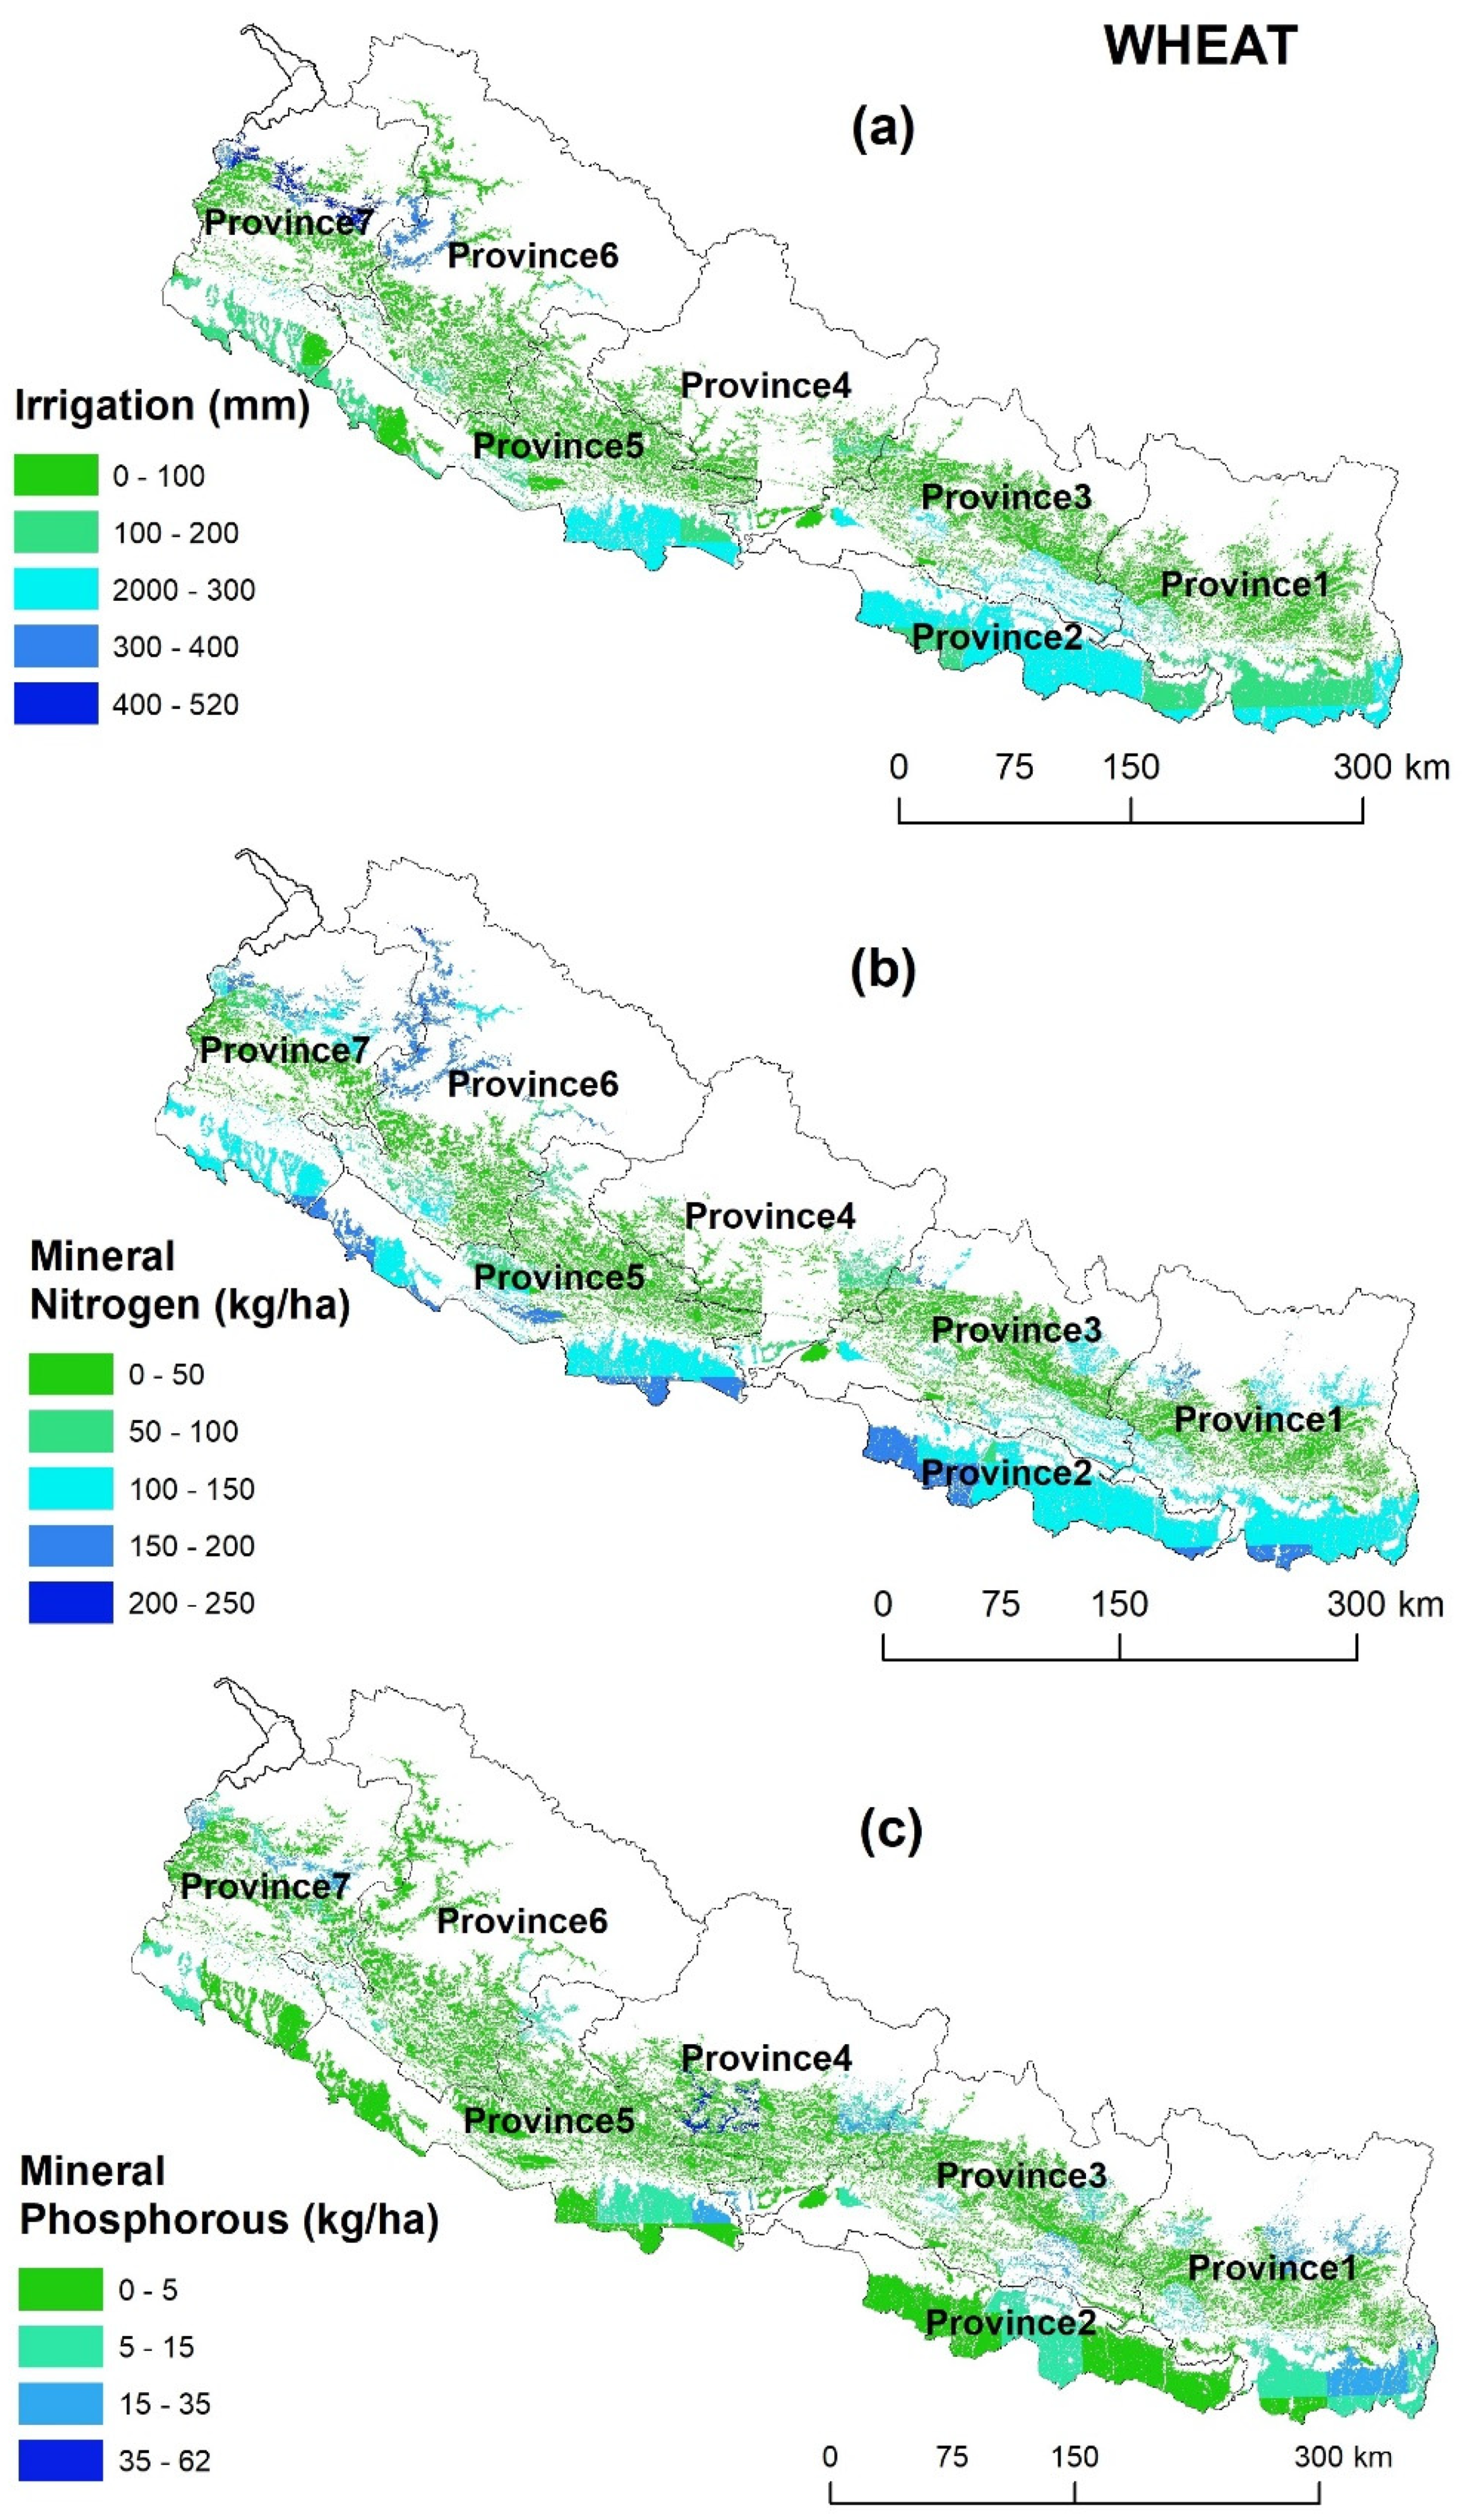
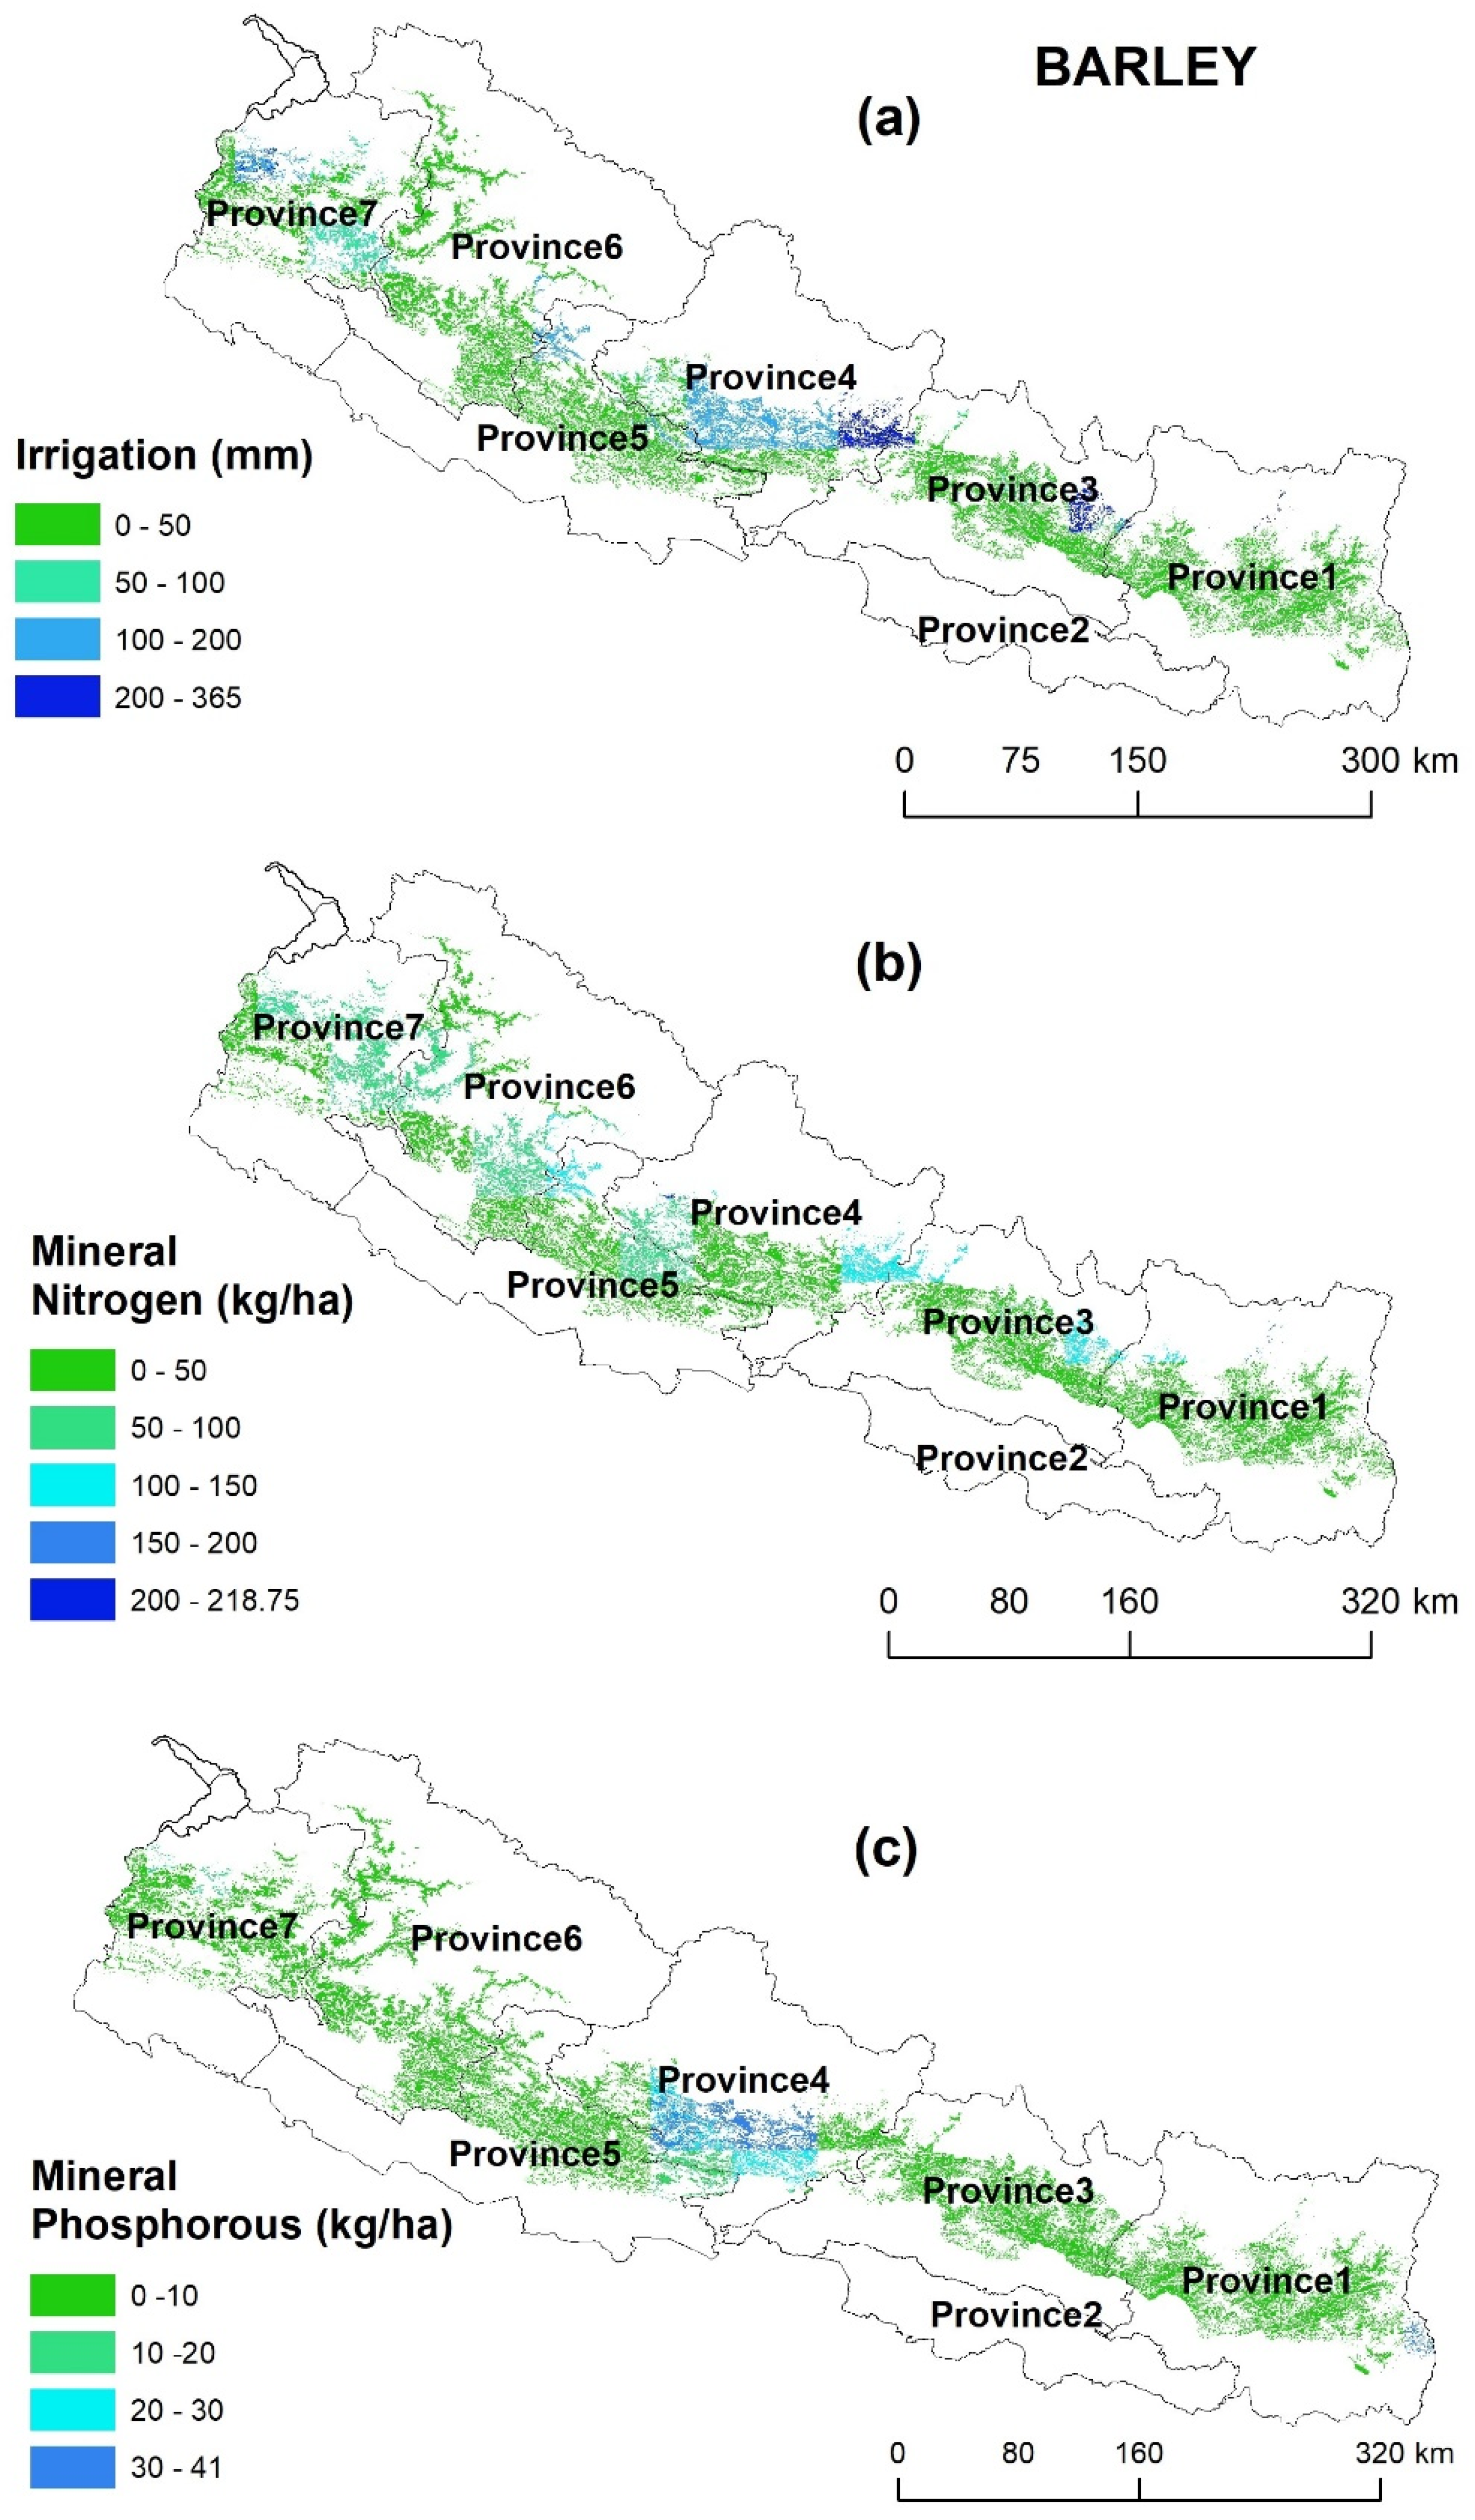
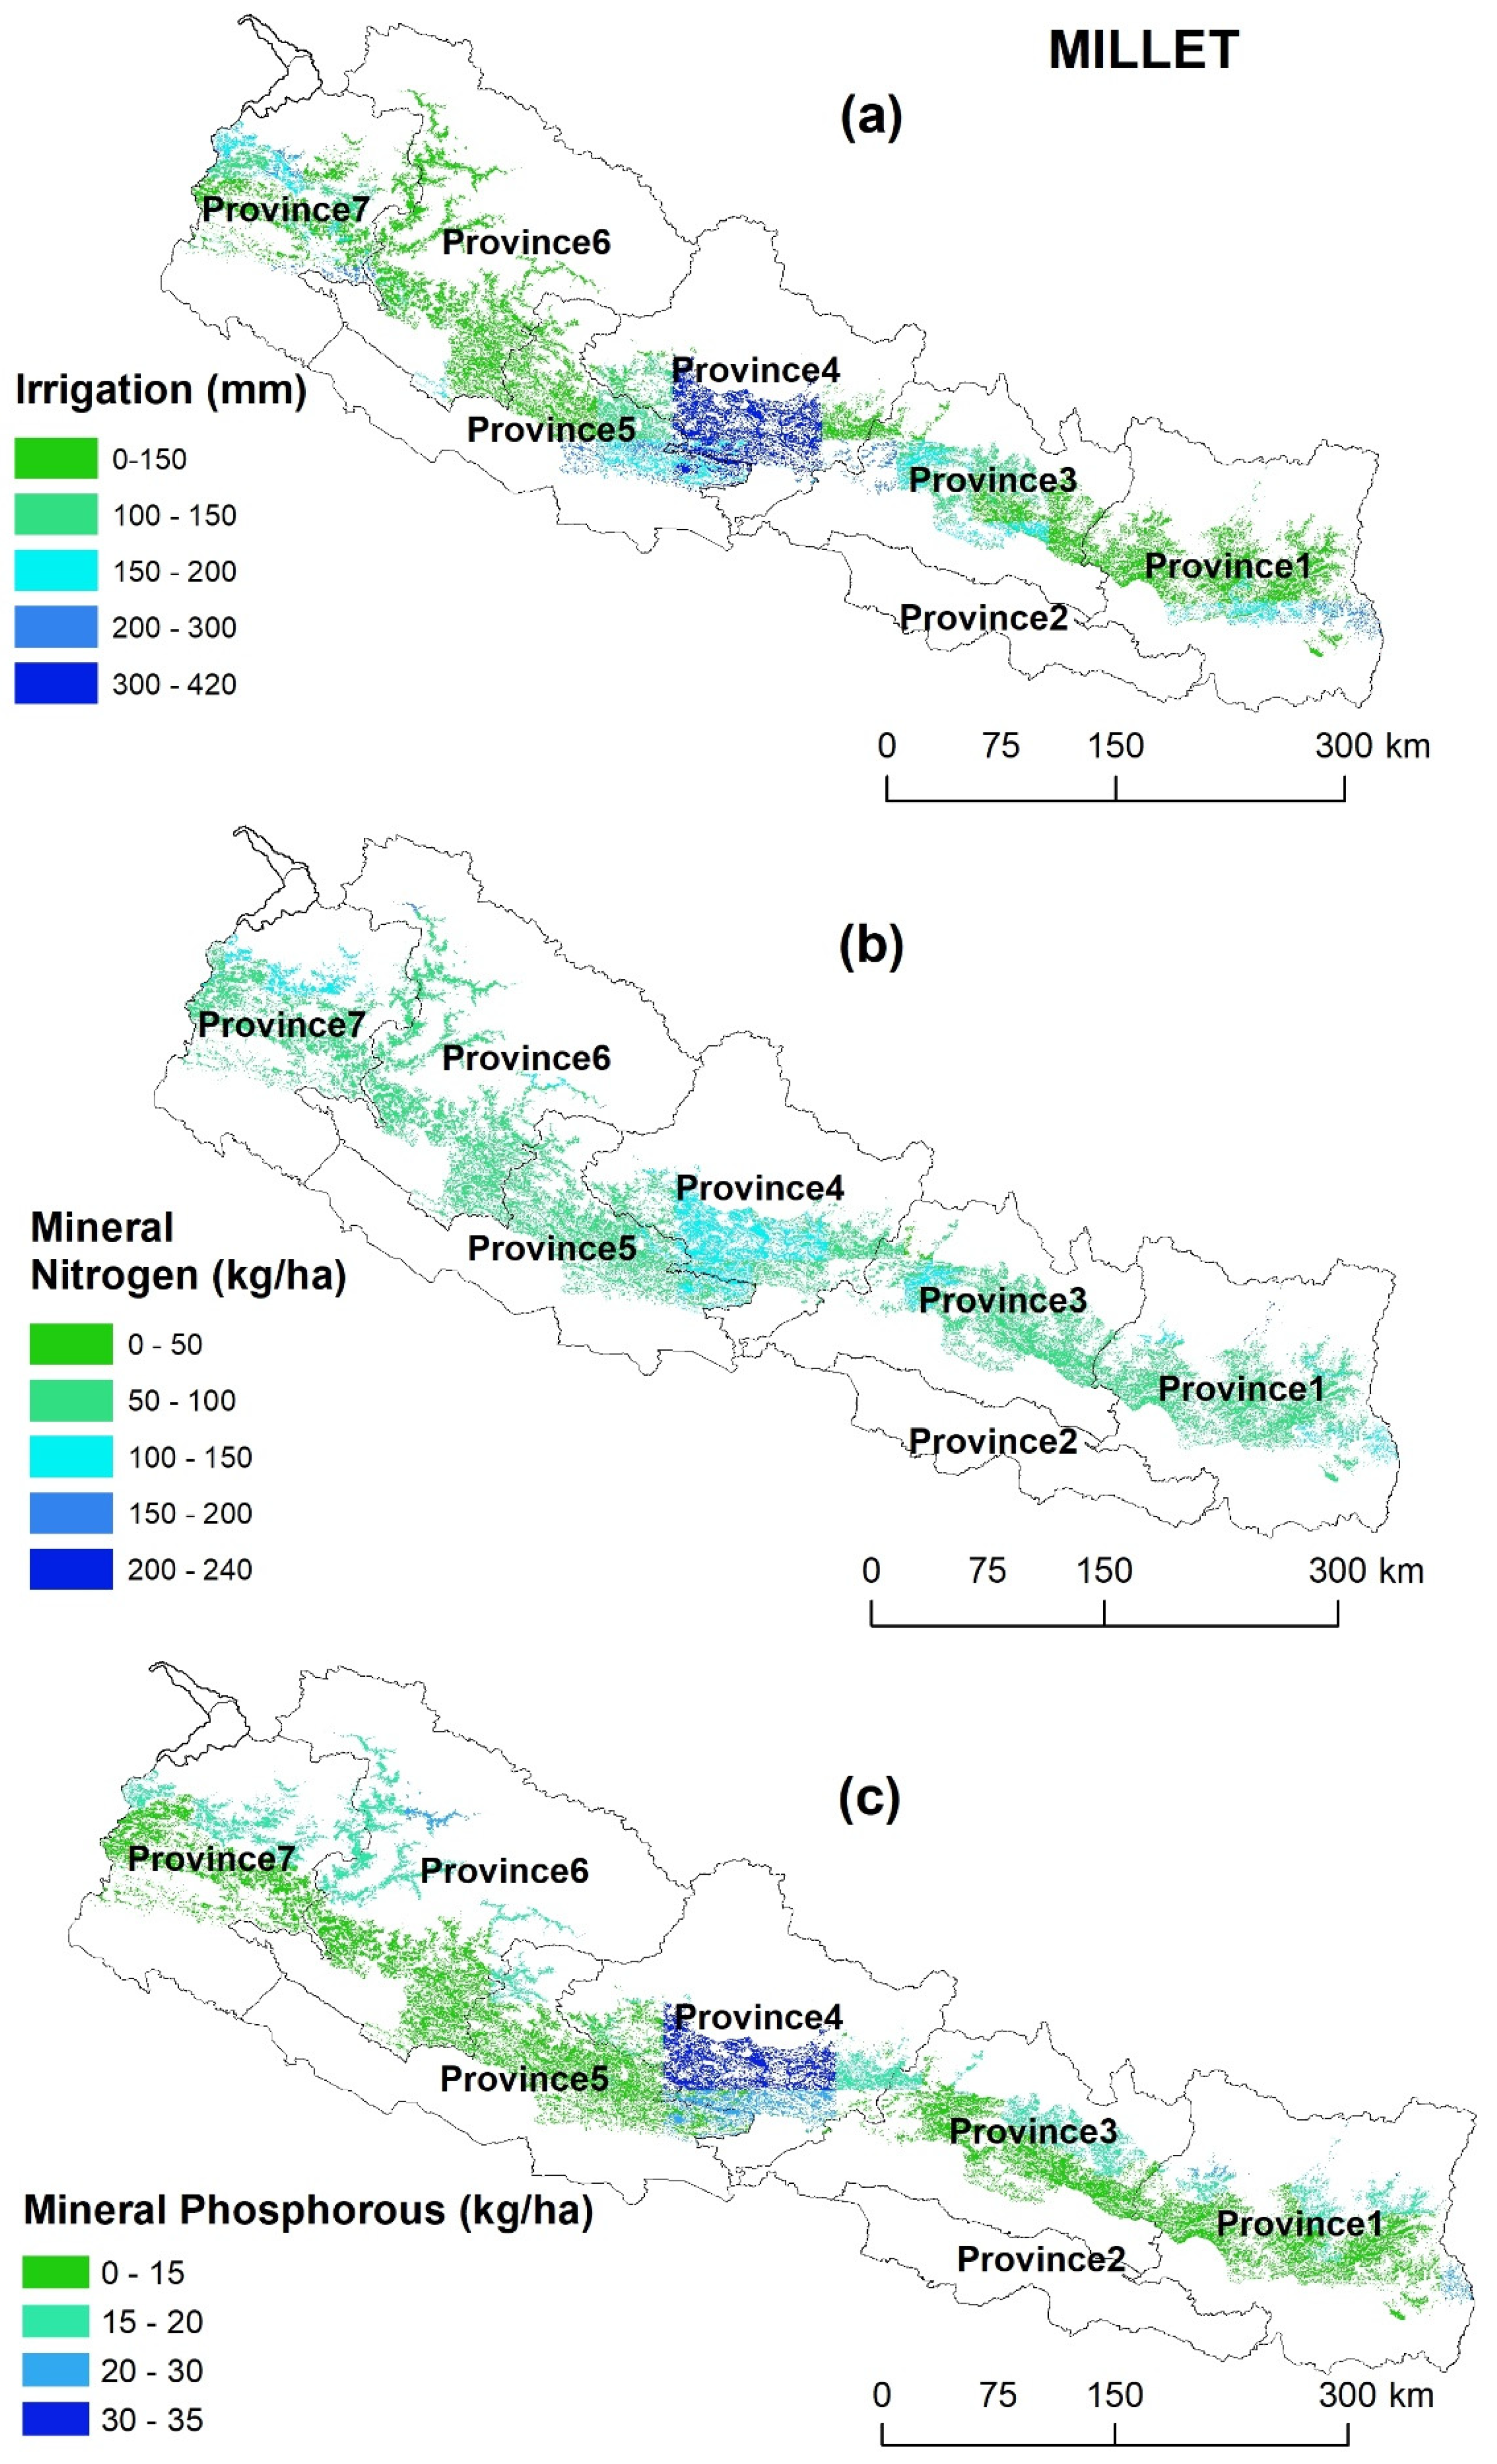
 How much fertilizer is needed to close the yield gap, and where should it be applied?
(iii)
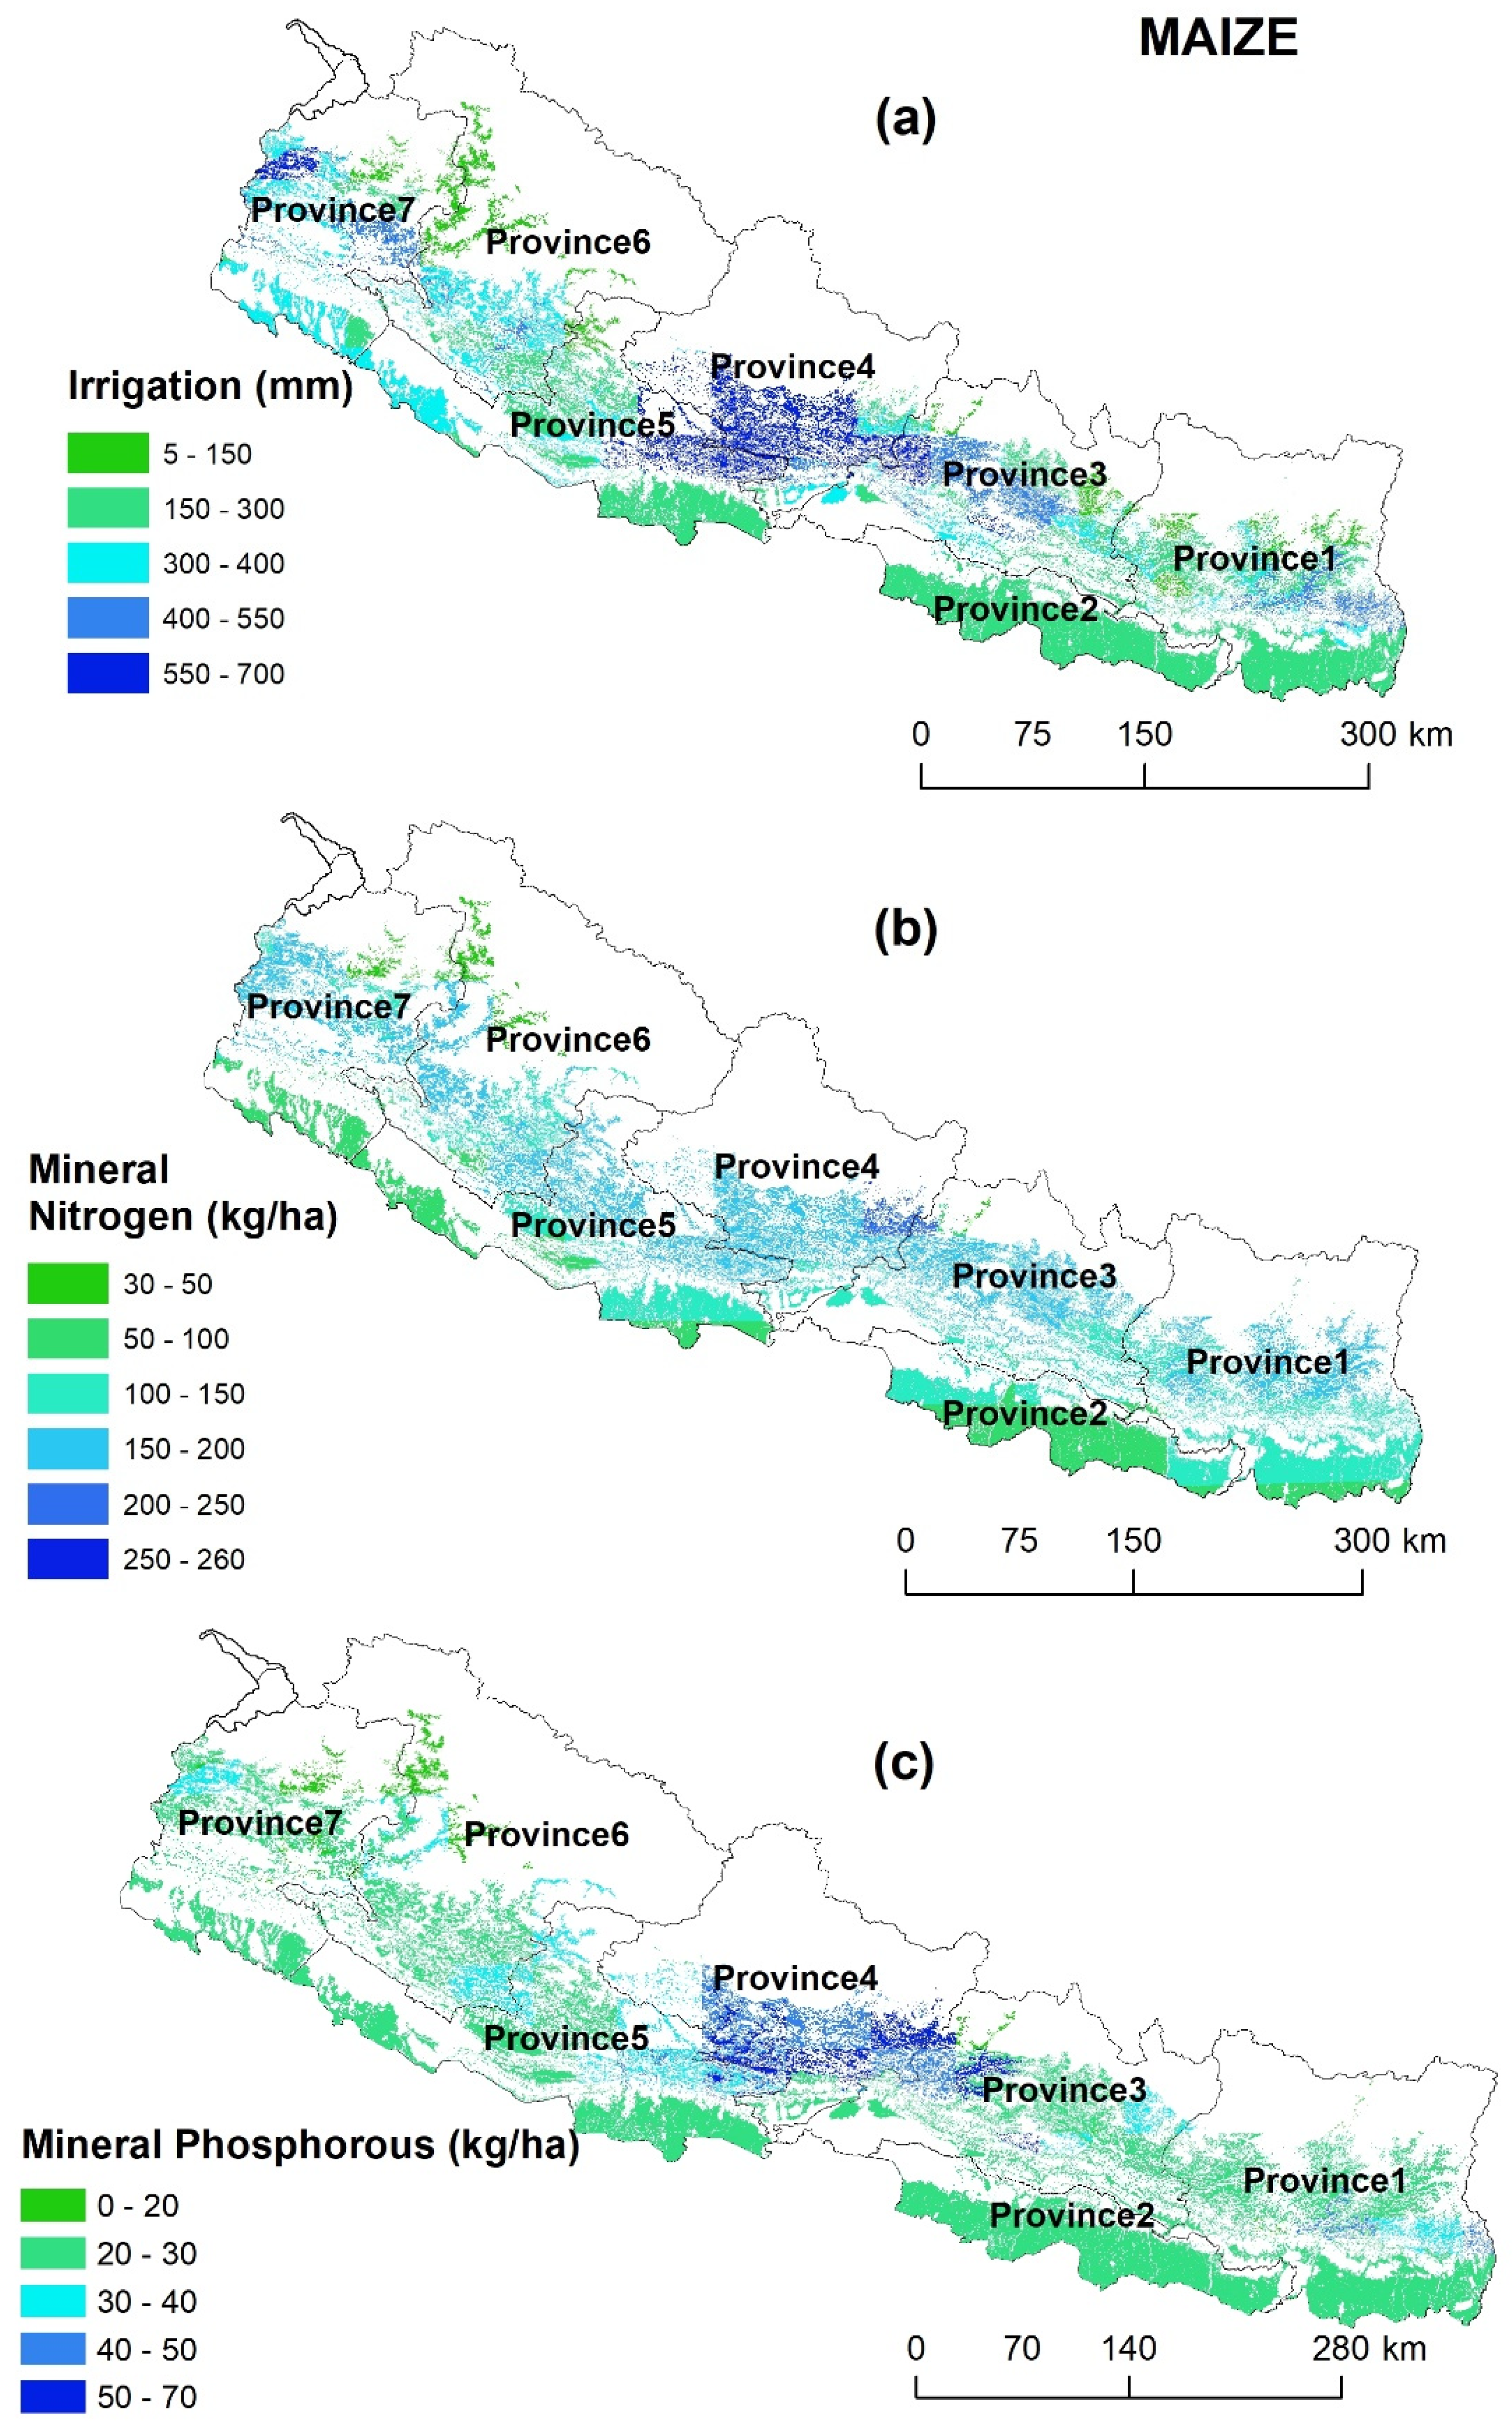
How much irrigation water is needed to close the yield gap, and which are the priority regions where irrigated areas should be increased?
To answer these questions, we use the bio-geophysical crop model EPIC to simulate crop production on 3430 simulation units covering all of Nepal’s agricultural area and aggregate results to district levels. In the first step, we calibrate the model to reproduce the observed historical crop yield from 1999 to 2014, and then simulate current agricultural practices with this calibrated model to identify spatial variations of crop yields. In the second step, we simulate crop growth without nutrient or water stress to estimate attainable yields for every spatial unit and thus identify the current yield gap between attainable and actual yields. In the third step, we quantify the nutrient and water management changes that are necessary to close this gap. We also discuss the difficulties of obtaining the spatially explicit, high-quality input data necessary for running the model in a country such as Nepal.

2. Materials and Methods
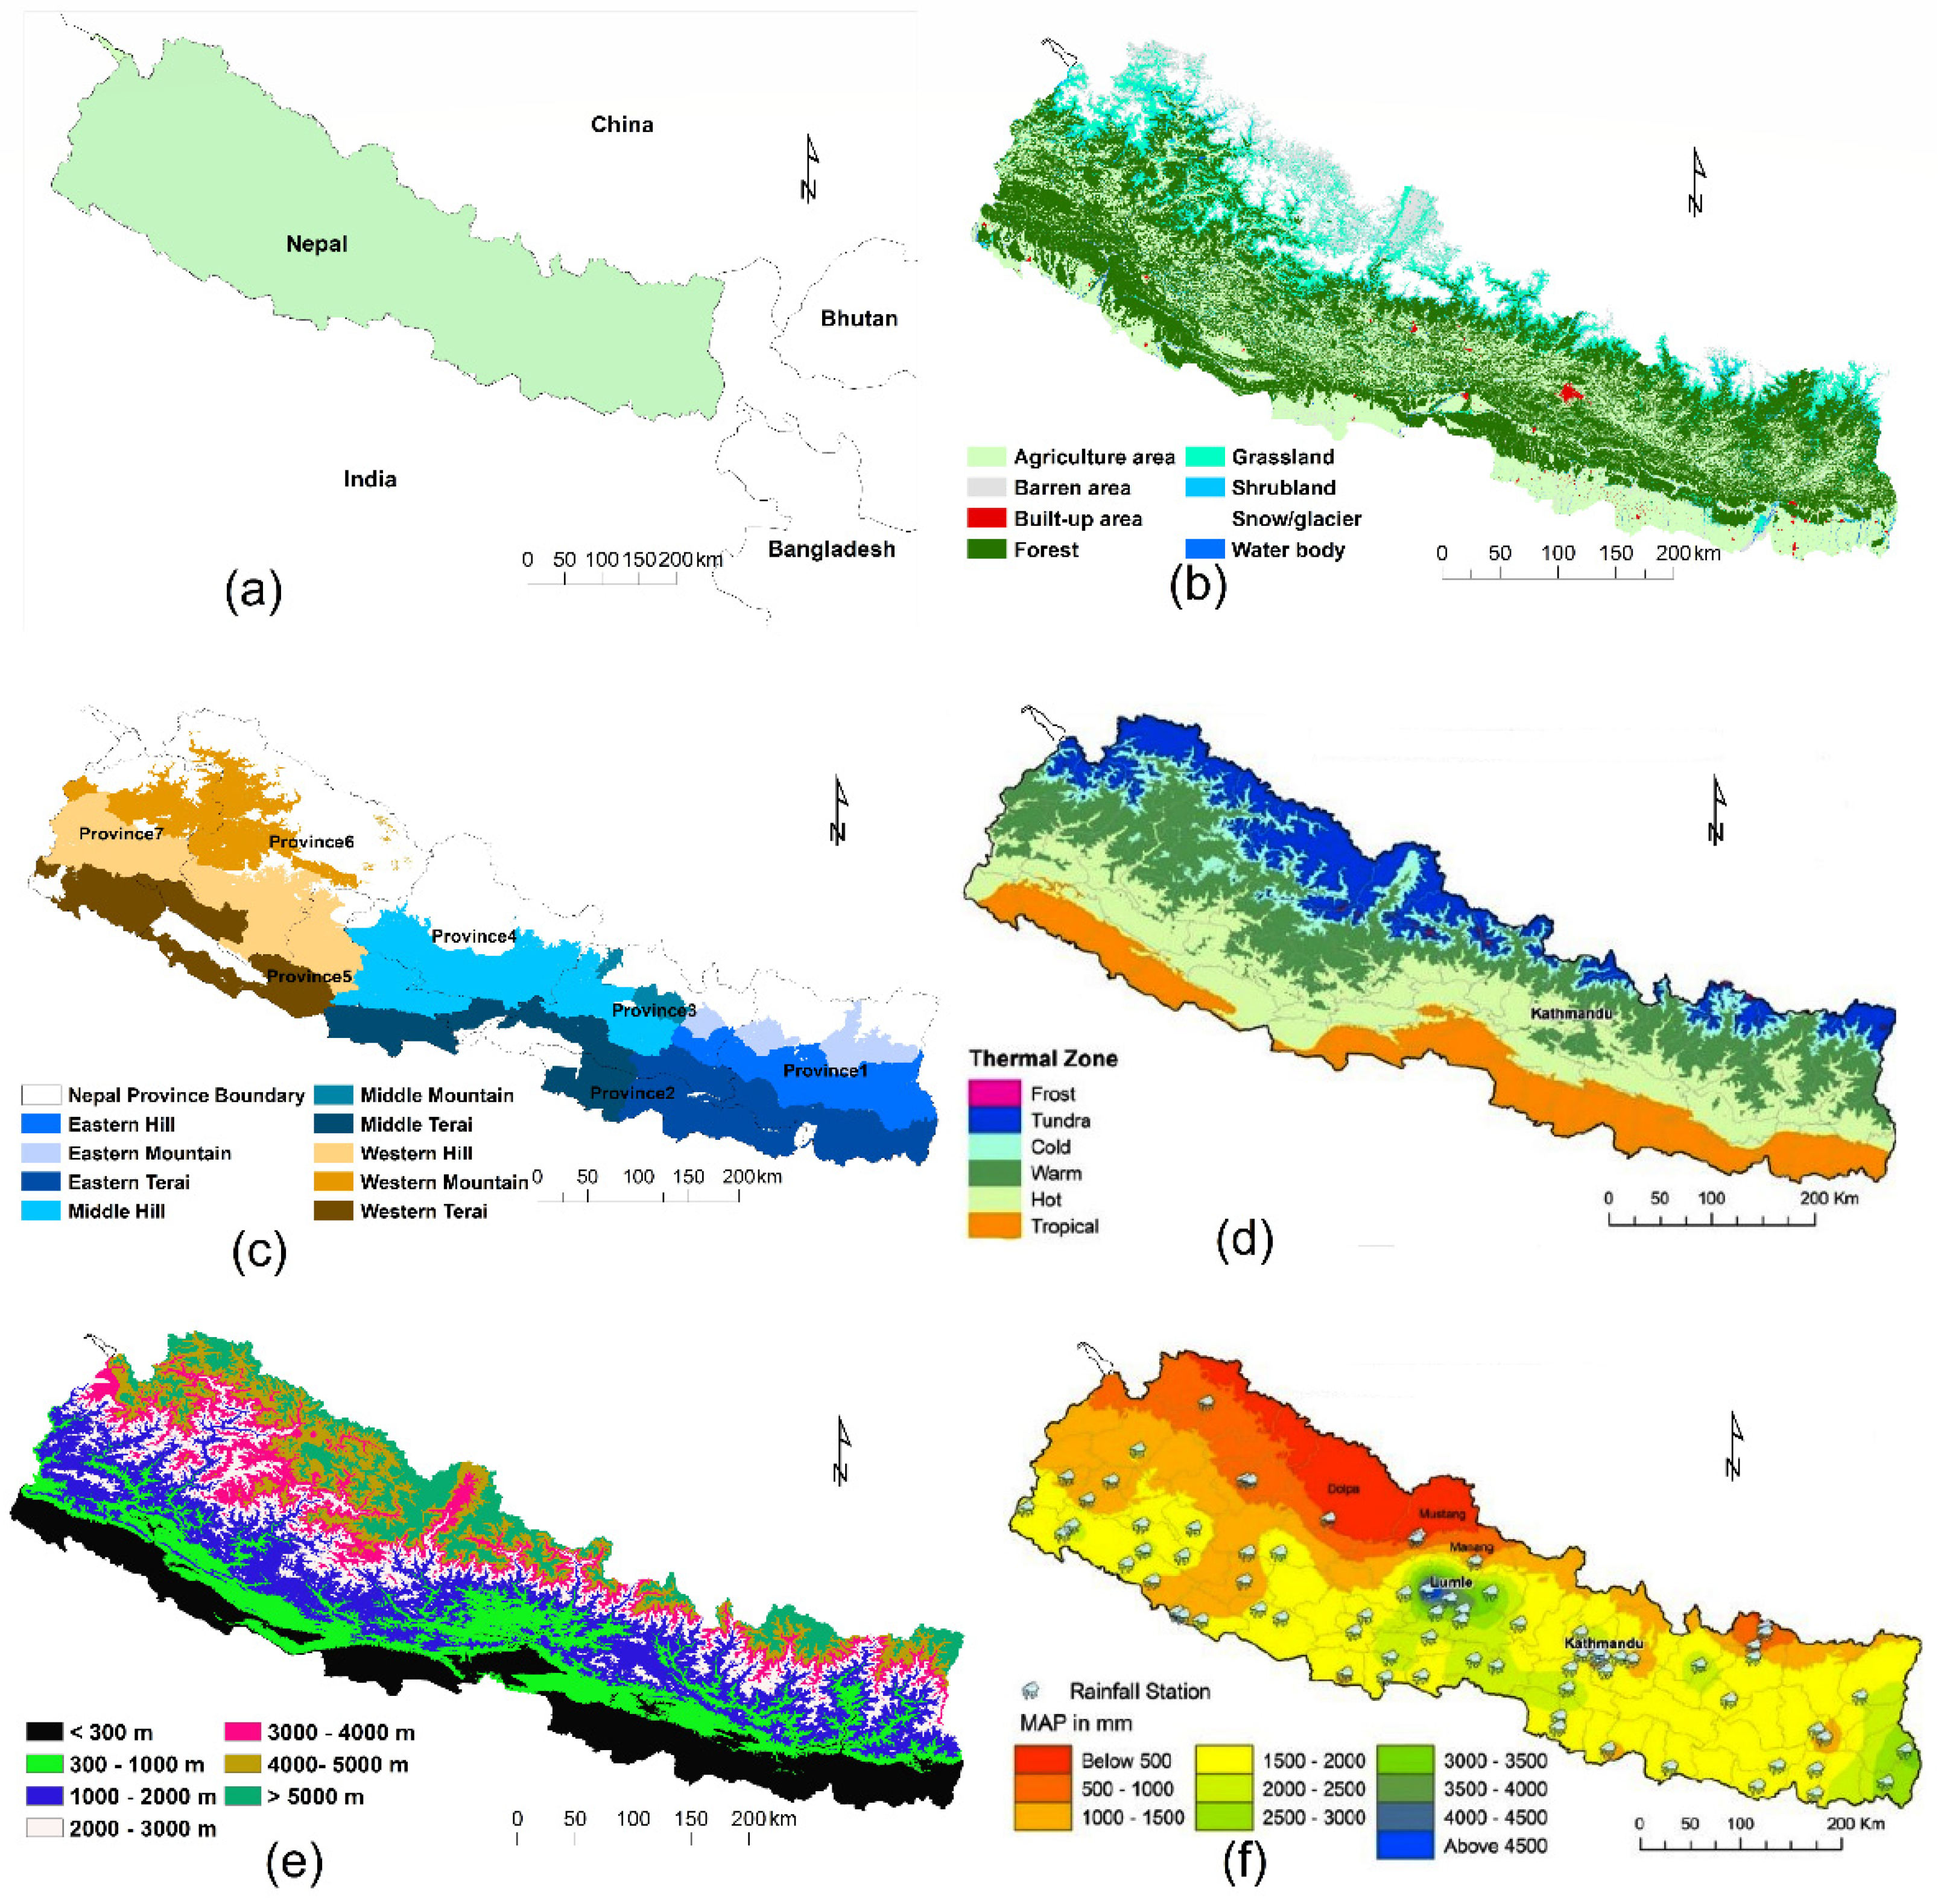
2.1. Study Area

Nepal is a Himalayan landlocked country in South Asia with an area of 147,181 km2 (Figure 2a) and a population of 29.13 million in 2020 [21]. The country is poor—the annual per capita income was USD 1155 in 2020—with 68% of the population depending mostly on agriculture. The total cultivated area is 41,210 km2 (28% of the total land area), most of which is located in the south of the country (Figure 2b), where the land is flat (“Terai”, Figure 2c). The middle hill region consists of numerous hilly peaks, fertile valleys, and river basins, of which one-tenth of the land is cultivable. The northern mountain region consists of only two percent of cultivable land. In 2015, 52% of the agricultural land was irrigated, but year-round irrigation is only available on 36% of the cultivated land [22]. Altitudes in the country vary from 60 m above the mean sea level in the South to 8848 m at the peak of Mount Everest in the North. Areas below 1000 m are part of the tropical zone, followed by the subtropical zone (1000–2000 m), the temperate zone (2000–3000 m), the subalpine zone (3000–4000 m), the alpine zone (4000–5000 m), and the nival zone (above 5000 m) (Figure 2d,e) [23]. The large altitudinal range and the topography containing several river basins, ridges, and valleys give rise to multiple microclimate sub-pockets within the hills and mountains [22]. The mean annual rainfall in Nepal varies from place to place due to the sharp topographical variations and ranges from less than 150 mm to above 5000 mm (Figure 2f). Monsoonal precipitation contributes around 80% of the annual precipitation, whereas precipitation during the winter and pre- and post-monsoon seasons contributes only 3.5%, 12.5%, and 4.0%, respectively [24]. Since monsoon precipitation is the largest contributor to annual precipitation, the spatial pattern of annual precipitation follows monsoon precipitation patterns [25]. Annual temperatures are increasing in the high-elevation areas of the country (North and Central Region); in the Southern regions, the increase is less pronounced. It is projected that the yearly average temperature may increase in Nepal by 1.2 °C by 2030, 1.7 °C by 2050, and 3 °C by 2100 [26].

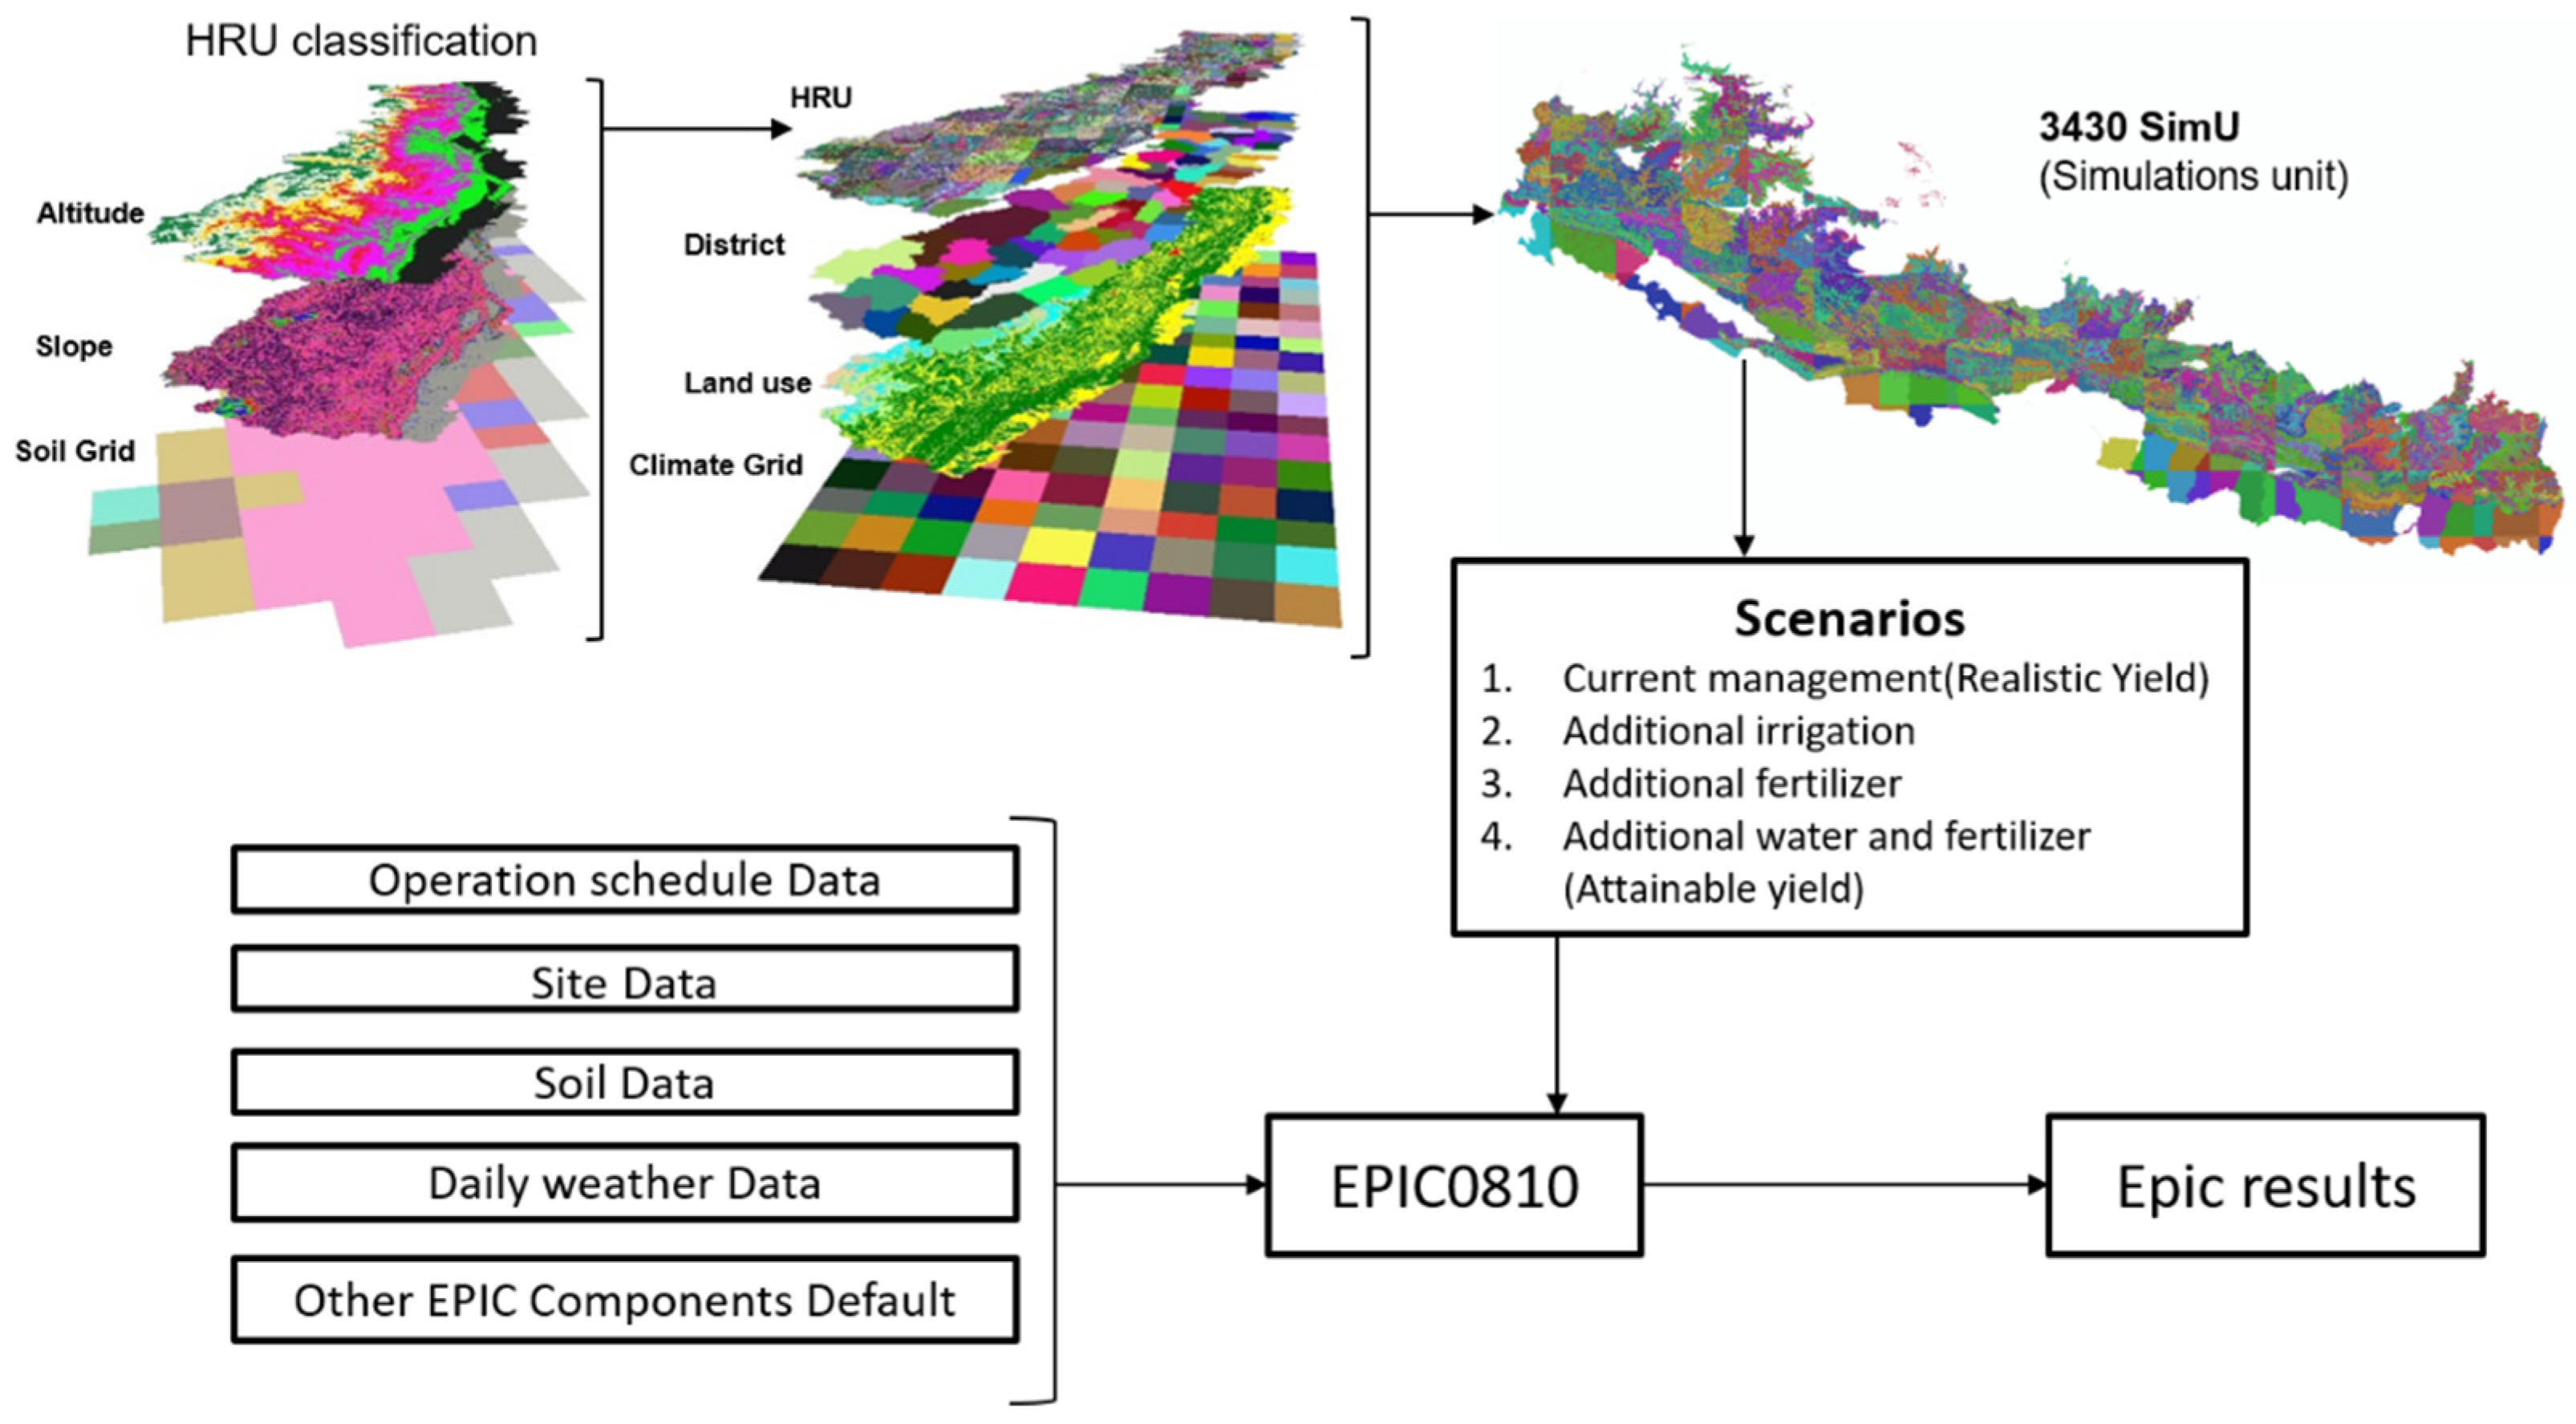
2.2. Derivation of Simulation Units

For the simulation of Nepal’s agricultural area, we first classified the territory into Homogeneous Response Units (HRUs), following a similar methodology as used in the development of the Global Earth Observation-Benefit Assessment (GEOBENE) database [28]. We used seven elevations, seven slopes, and ten soil classes (Table 1).
The elevation raster was obtained from the NASA Shuttle Radar Topographic Mission (SRTM) 90 m Digital Elevation Database (v4.1), accessible through the Consortium for Spatial Information (CGIAR-CSI) of the Consultative Group for International Agricultural Research (CGIAR) [29], with a resolution of 90 m at the equator. Soil typological units (STU) were derived from the global dominant soil typological units contained in the GEOBENE database [28]. STU characterizes distinct soil types described by attributes specifying the nature and properties of the soils [30].
Table 1. Classes of elevation, slope, and soil texture used for the delimitation of the homogeneous response units in this study.
Elevation Classes Slope ClassesSoil Typological Units
Elevation [m]Classification [31]ClassSlope [%]ClassDominant Soil
<300Lower Tropical1<31Eutric Cambisols (Be)
300–1000Upper Tropical23–62Eutric Fluvisols (Je)
1000–2000Subtropical36–103Calcic Cambisols (Bk)
2000–3000Temperate410–154Dystric Regosols (Rd)
3000–4000Subalpine515–305Dystric Cambisols (Bd)
4000–5000Alpine630–506Humic Acrisols (Ah)
>5000Trans Himalayan7>507Humic Acrisols (Ah)
8Rankers (U)
9No soils (RK2)
10Lithosols (I)
After the HRU delineation, we further divided the units based on district boundaries, land use and land cover, and the climate data raster. The district boundaries were obtained from the Global Administrative areas database [32]. The land use mask was obtained from the Land Cover of Nepal 2010 dataset developed by the International Center for Integrated Mountain Development (ICIMOD) [33]. The climate data that were used for this study were created in phase 3b of the Inter-Sectoral Impact Model Intercomparison Project (ISIMIP3b), which is based on the output of phase 6 of the Coupled Model Intercomparison Project [34]. The spatial resolution of this dataset is 0.44 degrees. In the last step, we identified cropland and non-cropland areas using the land use mask and only included units with cropland presence in the list of simulation units. The final count of simulation units was 3430 (Figure 3).

2.3. Simulation Framework and Input Data

For the simulations, we used the Environmental Policy Integrated Climate (EPIC) model [35]. EPIC is a field-level biophysical process-based model which can simulate crop growth and crop yield, soil nutrient cycling, soil erosion, and the effects of agro-ecological practices for climate change mitigation and adaptation [36,37]. The plant biophysical processes simulated by EPIC include interception of photosynthetically active solar radiation dependent on LAI, conversion to biomass based on radiation use efficiency and crop growth stresses (nutrient and water availability, temperature), partitioning of the daily biomass increase into the root and aboveground biomass, and adaption of the harvest index to drought conditions [38]. The soil submodel consists of several soil pools tracking the amount of organic nitrogen and carbon, mineral nitrogen, organic phosphorous, and mineral phosphorous in the soil. Only the labile pools contain nutrients available for plant uptake; nitrogen and phosphorous in the other pools are assumed to be sorbed to organic or inorganic soil particles. If mineral fertilizer is applied, the nutrients are added to the plant-available pool but may quickly be immobilized. The user can choose between five potential evapotranspiration equations [39] and simulate a wide range of crop rotations, tillage systems, and management practices.
The EPIC model has been effectively employed to study crop yields and yield gaps [40,41], climate change impacts on crop yields [42], environmental impacts [43,44], soil degradation [45], soil erosion and nutrient leaching [46], and crop management operations [47]. The model has been validated across scales from the field to continental [45,48] and global studies [49]. We chose to use the EPIC model in this study due to this proven robust performance in a variety of settings, cognizant of the fact that the environmental conditions in Nepal make crop simulations a challenge. The model output of EPIC comprises detailed information on crop growth, water, nutrient, and carbon fluxes in daily, monthly, and yearly steps. For this study, we focus on the estimated annual yield (Yd, t/ha), the growing season evapotranspiration (GSET, mm), and the amount of water provided by irrigation annually (IR, mm). We use the Hargreaves method in the EPIC Model for estimating evapotranspiration [50].
EPIC requires detailed input data on management, soil, topography, and weather. Data related to crop area and crop yields of rice, wheat, maize, millet, and barley for the fiscal years from 1979/80 to 2013/14 were obtained from agricultural statistics of cereal crops in Nepal [15]. The amount of fertilizer and irrigation water applications per hectare as well as application times were derived from CBS Nepal decadal agriculture census data published in the years 1981, 1991, 2001, and 2011 and from Takeshima [51] (Table 2).
District-wise crop calendar data for Nepal’s major crops were taken from an FAO/WFP food security assessment mission to Nepal (Table 3). Soil data were taken from the GEOBENE database [28]. The latitude and longitude of the centroid of each simulation unit were extracted from the administrative boundary dataset of Nepal downloaded from GADM. Elevation and slope for every simulation unit were derived from the SRTM 90 m Digital Elevation Database (v4.1), and daily values for the weather variables solar radiation, maximum and minimum temperature, relative humidity, and wind speed were taken from the ISIMIP3b database.

2.4. Model Calibration

For the testing of the performance of the EPIC model in Nepal, we used district-wise yield data for the crops rice, wheat, maize, millet, and barley provided in the agricultural statistics of cereal crops in Nepal [15] for the years 1999–2014. We first ran the model for the years 1999–2014 with default parameters, aggregated the crop yields to the district level (using the crop areas provided in the agricultural statistics [15]) and compared reported to simulated yields. We then iteratively calibrated the crop-specific parameters potential heat units, radiation use efficiency, harvest index, and optimal and base temperature to decrease the difference. We were not able to identify one set of crop parameters that could be applied to all regions of Nepal and decided to derive a separate crop parameter set for each of the nine ecoregions (Figure 2c) instead. We calculated the percent bias (PBIAS, Equation (1)) to identify the average tendency of the simulated data to be larger or smaller than the observed data. Positive values indicate an underestimation, negative values an overestimation bias, and zero no bias at all. Generally, PBIAS values 0–10 are considered very good, 10–15 good, 15–25 fair, and values >25 unsatisfactory [52].
PBIAS = 1 i = 1 n ( Y i X i ) 100 i = 1 n Y i
where X i is the reported crop yield in district i, Y i simulated crop yield in district i, and n is the total number of districts.
We also calculated the relative error RE (Equation (2)) to examine systematic errors in the simulated data. Considering the versatility of agro-ecological zones and the scale of this study, we assume an RE of ≤30% to be an acceptable result, whereas RE > 50% should be considered to be extreme error [39,53].
RE i = ( Y ¯ i X i ) X i 100
where X i is the reported crop yield in district i, Y i simulated crop yield in district i, and Y ¯ i is the simulated average crop yield in district i.
The calibration was considered successful once the acceptable ranges for PBIAS and RE were achieved.

2.5. Simulation Scenarios
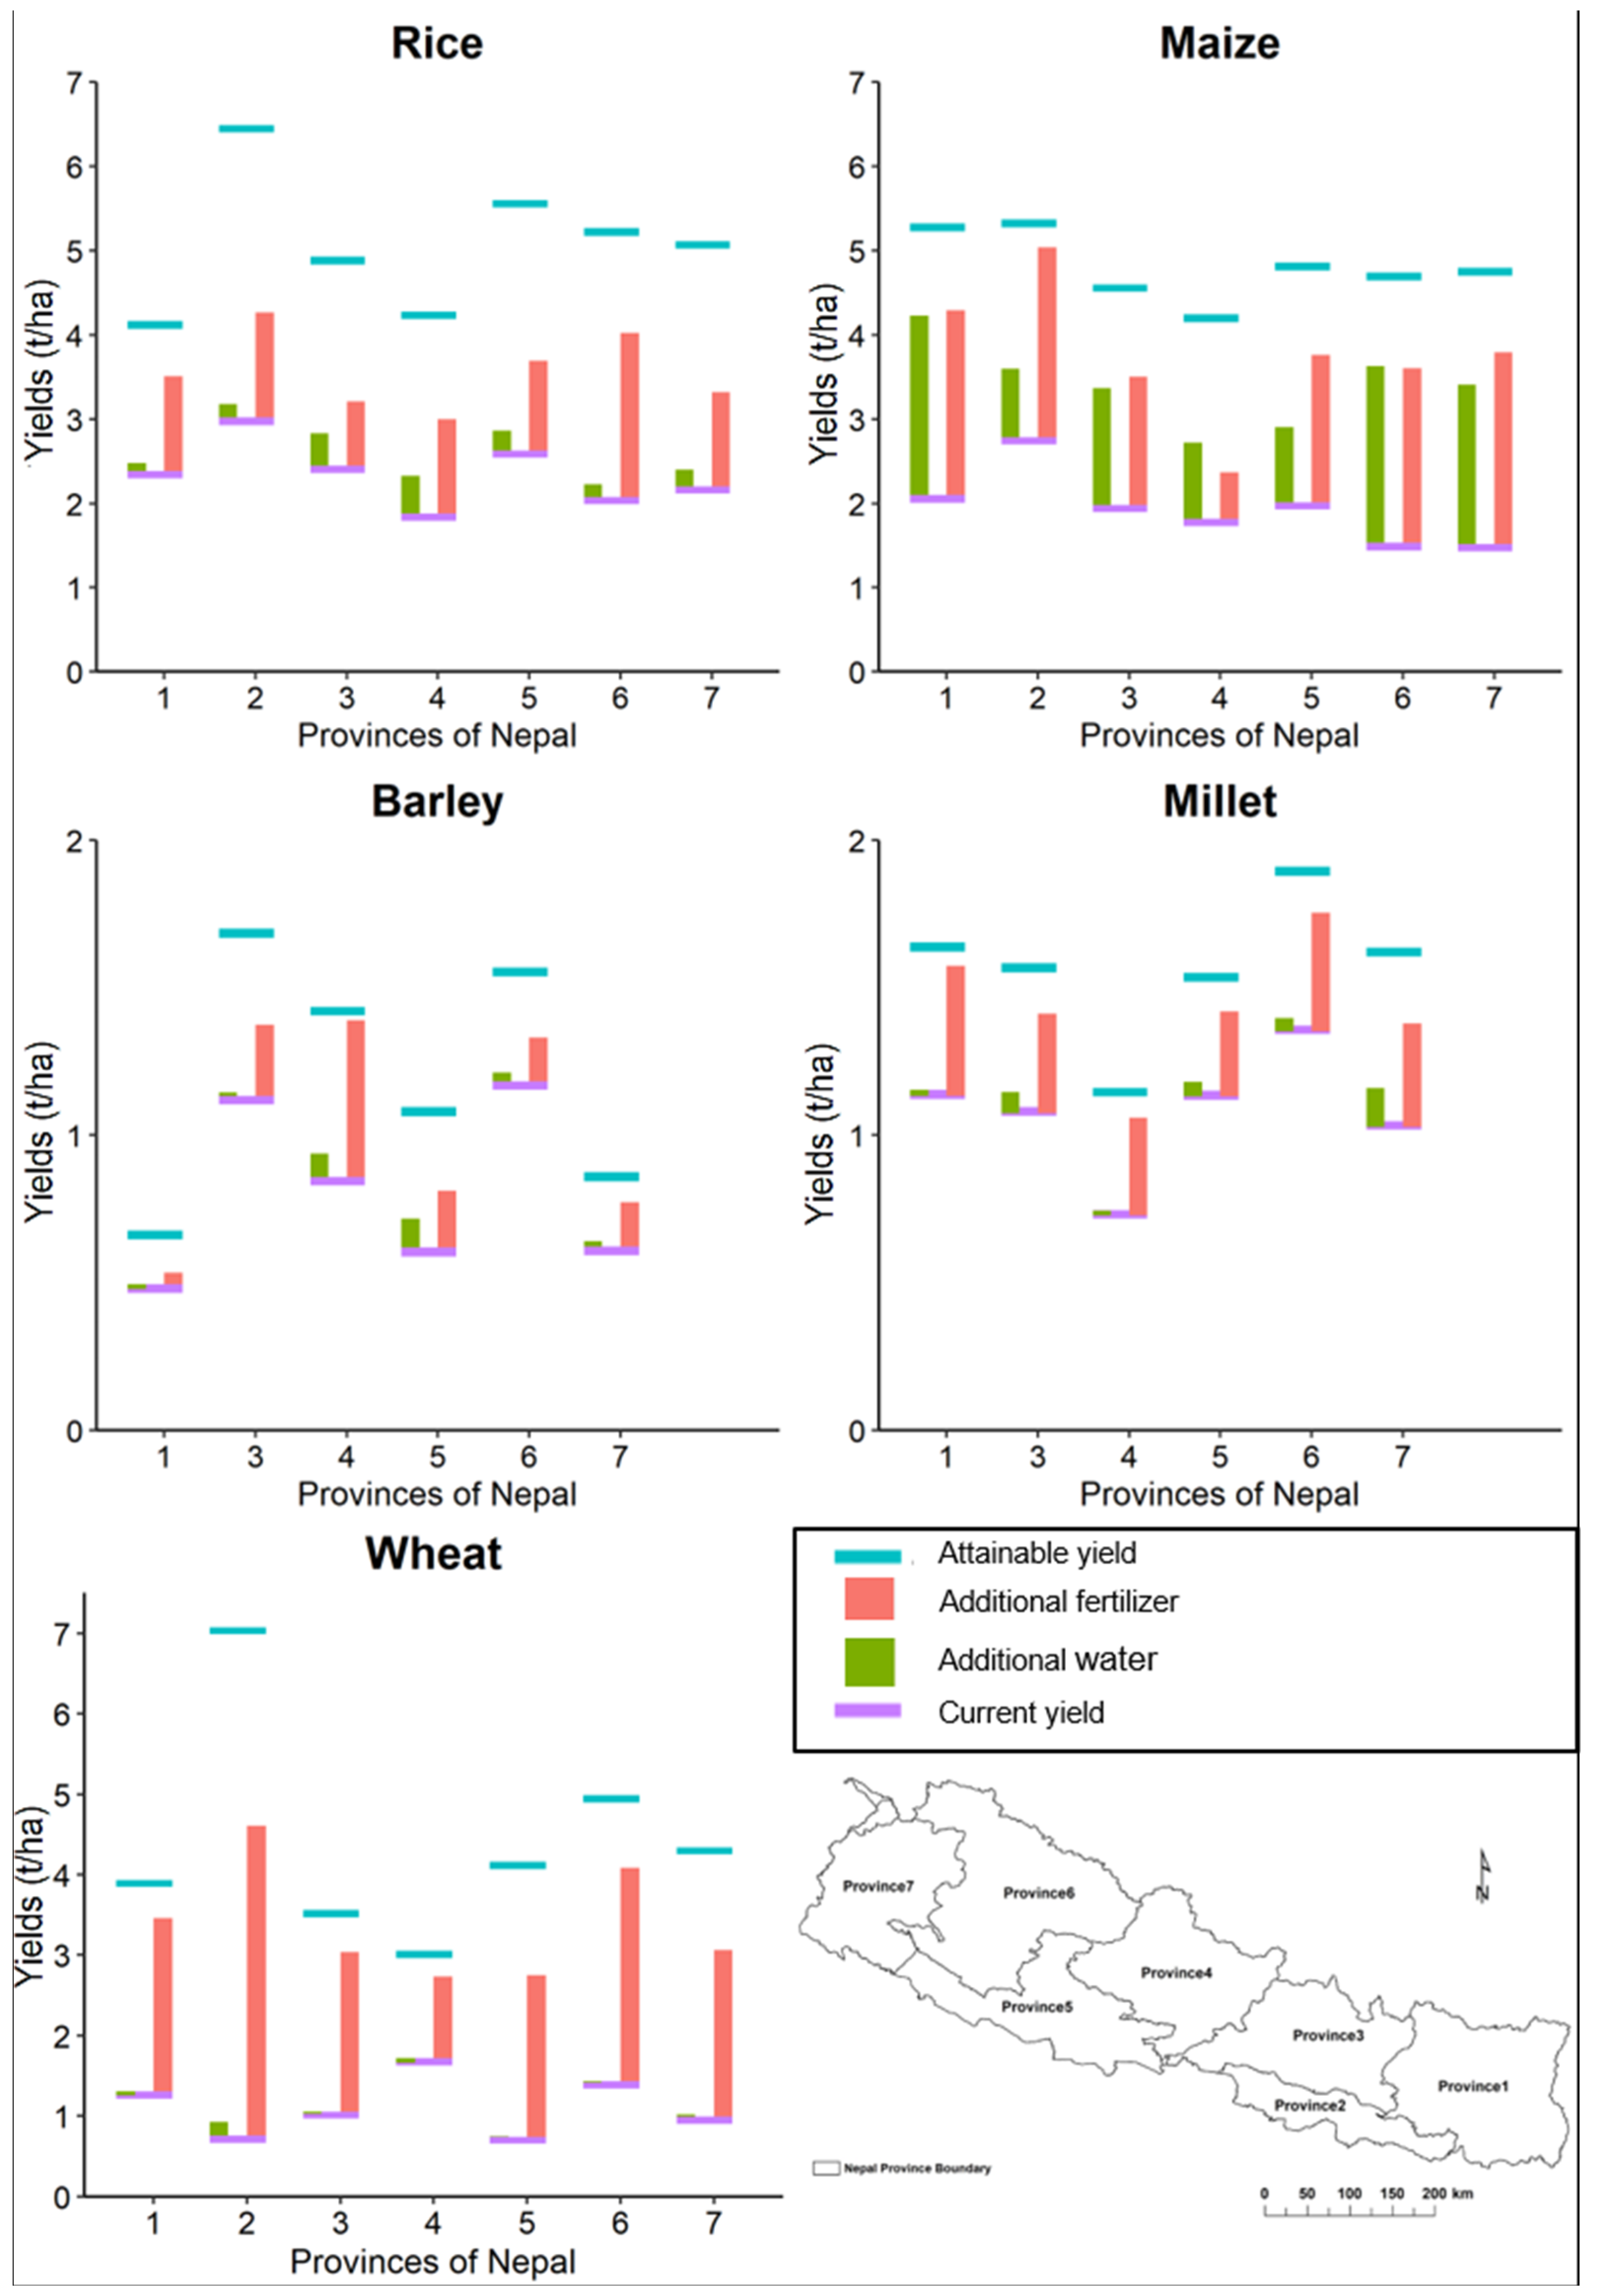
Irrigation and fertilizer applications explain 60–80% of the global yield variability for most major crops [54], which is why we only consider these two factors explicitly in our scenarios and ignore other factors such as changes in tillage, mulching, pest control, or cultivar development. Our four scenarios are:
(1)
Current management practices (current yield);
(2)
Current management practices with additional fertilizer applications up to a maximum of 300 kg/ha per year (additional fertilizer);
(3)
Current management practices with additional irrigation of up to 2000 mm per year (additional irrigation);
(4)
Current management practices with additional fertilizer and irrigation applications with the same maxima as in (2) and (3) (attainable yield).
The additional irrigation and fertilizer applications were triggered automatically during the simulation if the plant experienced a moderate amount of water or nutrient stress on a specific day (stress factor higher or equal to 15%). Each scenario was run for all 3430 simulation units covering Nepal for the period from 1999 to 2014 (Figure 3).

3. Results

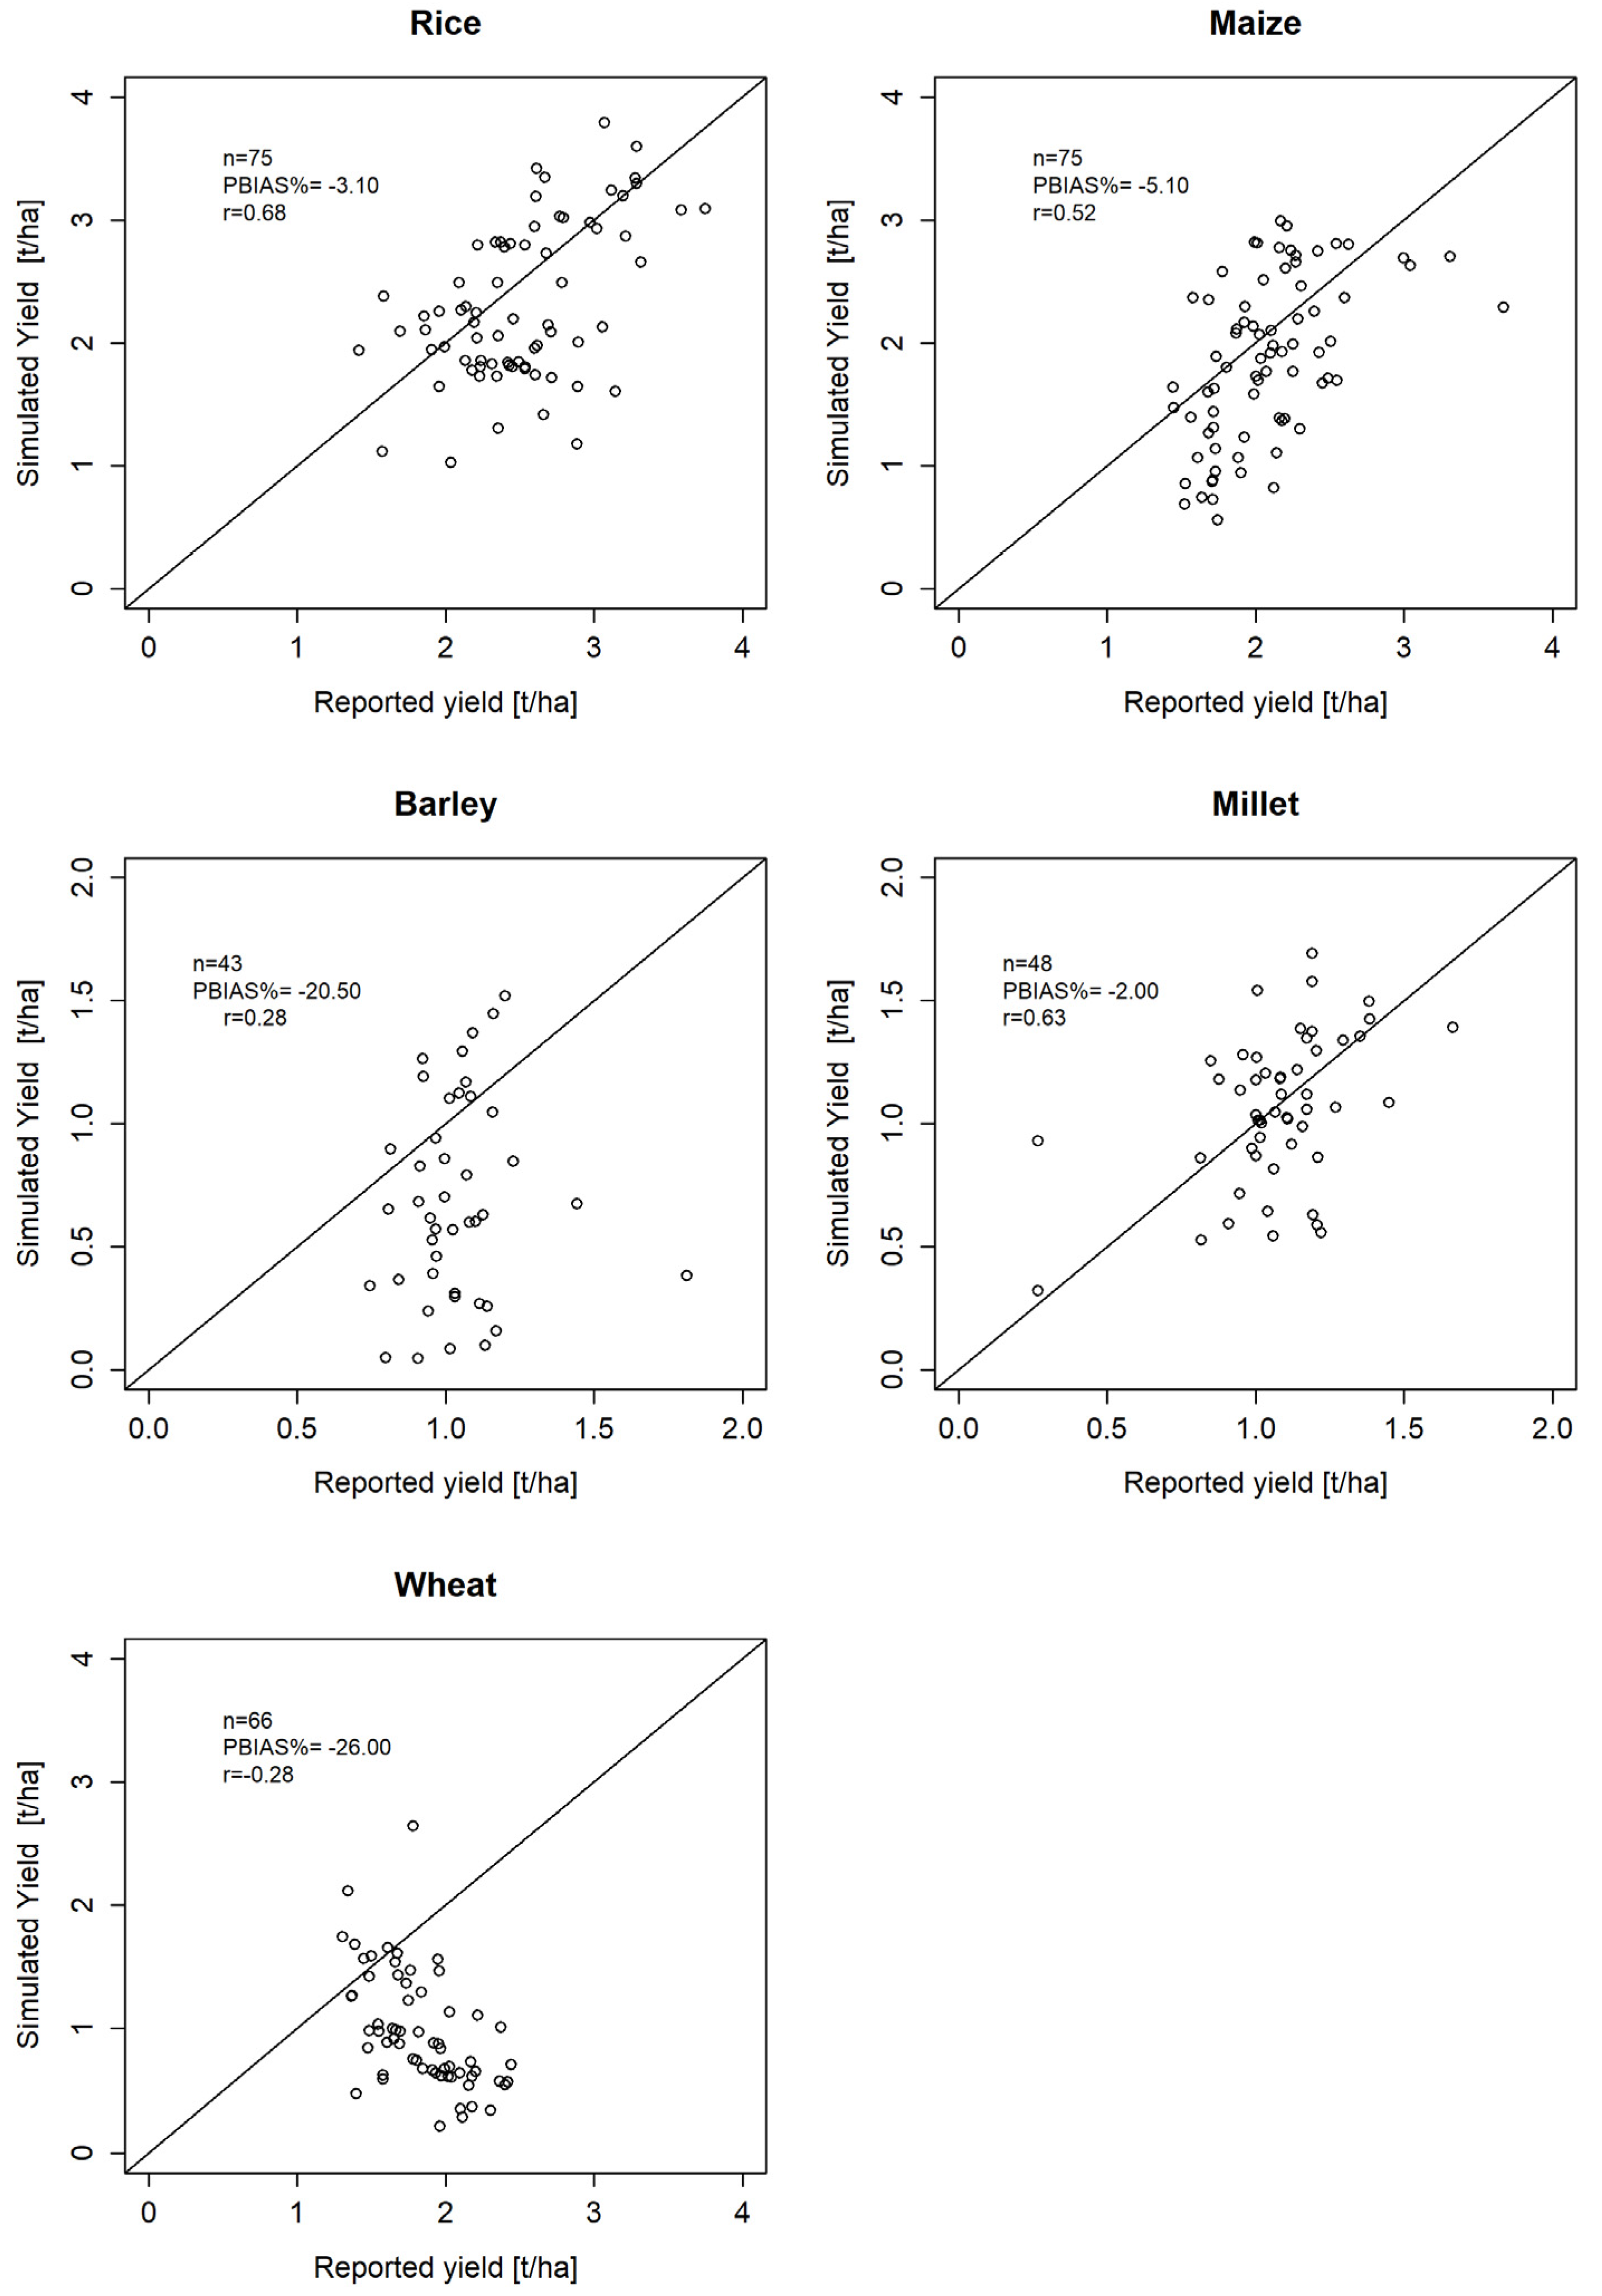
3.1. Calibration of Crop Yields

We simulated crop yields under reported management for the period from 1999 to 2014 on all simulation units. District, province, and national level crop yields were determined by aggregating the yields of all simulation units contained in the specific spatial boundaries. The simulated mean crop yields at the country level were lower than reported mean crop yields but in the same range: rice 2.3 vs. 2.59 t/ha (simulated/reported), wheat 1.07 vs. 1.94 t/ha, maize 1.87 vs. 2.15 t/ha, millet 1.06 vs. 1.08 t/ha, and barley 0.84 vs. 1.02 t/ha. At the district level, the same pattern was visible, with simulated yields slightly lower than reported yields in many cases but overall in the same range. PBIAS between reported and simulated mean annual yields was −3.1% for rice, −5.1% for maize, −20.5% for barley, −2% for millet, and 26% for wheat. According to these values, the calibration of millet, rice, and maize can be considered very good, and the calibration of barley and wheat unsatisfactory. The RE values vary between −33.02 and 36.8% (mean −14.08%) for rice, between −58.87% and 48.85% (mean −41.86%) for wheat, between −37.43 and 40.04% (mean −10.43%) for maize, between −48.37 and 48.29% (mean −1.90%) for millet, and between −58.95% and 37.12% (mean −22.62%) for barley. Except for wheat, all mean RE values fall into the range for ‘good’ RE values, but the range over the different districts shows that many RE values exceed this range, indicating unsatisfactory results. These outliers are also visible in the scatterplot of Figure 4, where we compare reported and simulated mean annual yields at the district level. The plot shows that there is a moderate agreement between simulated and reported values, with many outliers on both sides. For wheat and barley, a clear systematic underestimation of yields by the model is apparent.
Even though the statistics show that the calibration is not satisfactory for some crops, we nevertheless decided to accept it. The main reason for this is data constraints. The resolution of 50 km of the bias-adjusted modeled climate data appears to be too coarse for a country such as Nepal, where the geographic heterogeneity is high, and there are many areas with microclimates. Another source of uncertainty is the global gridded soil data we used, whose resolution is also too coarse to depict the spatial variations of soil conditions in Nepal well. In the absence of soil and weather data with a higher resolution, we would have needed to further increase the number of crop parameter sets to compensate for the input data issues. Furthermore, there is a considerable range of reported yields in the district-wise dataset (Table A1 in Appendix A). We assume that agronomic practices vary more across districts than we simulate in the model and that we would need district-wise fertilizer application and irrigation data to increase the quality of the calibration. In addition, there is no information on the difference in yield levels under irrigated and rainfed conditions in the dataset, and there is no spatial information on the location of irrigated fields. We had to rely on percentage shares of irrigated area per district to calculate mean crop yields, which adds another source of uncertainty and difficulty in calibrating the crop parameters. Hence, instead of continuing with the calibration and potentially overcalibrating the model, we decided to accept the results and proceed with the study. Since we only use the simulated data for the yield gap analysis, the negative effects of the unsatisfactory calibration can be considered negligible for this specific study.

3.2. Yield Gaps in Nepal

The yield gaps in Nepal are different for the different crops. The gap is smallest for millet and barley with 0–1 t/ha and 0–1.85 t/ha, respectively, and largest for wheat with up to 7 t/ha. Rice and maize show yield gaps between 3 and 4 t/ha. There is a clear spatial pattern in the gaps, with the largest yield gaps present in the tropical Terai and the lower part of the subtropical hill region (Figure 5). The highest yield gaps for rice and wheat can be observed in Province 2, which is part of the Eastern/middle Terai. Aggregated to national level, the yield gaps amount to 3.01 t/ha (wheat), 2.7 t/ha (rice), 2.9 t/ha (maize), 0.44 t/ha (barley), and 0.49 t/ha (millet).
The attainable yield (scenario 4) was simulated using additional irrigation and fertilizer applications. To identify priority areas for investment, we simulated two scenarios with only additional irrigation water (scenario 3) and only additional fertilizer applications (scenario 2). With the addition of irrigation water (scenario 3), yields can on average be increased by 0.1 t/ha (wheat), 0.4 t/ha (rice), 1.6 t/ha (maize), 0.1 t/ha (barley), and 0.1 t/ha (millet). Irrigation is thus especially effective for maize. Figure 6 shows that additional irrigation water alone can close the yield gaps to a large degree for maize. The yields of the other four crops, rice, barley, millet, and wheat, are only marginally improved by additional irrigation. For rice, there is a larger effect in provinces three and four, which are located mostly in the middle hill ecoregion. For wheat, with additional irrigation water alone, yields do not or only marginally increase beyond current levels.
With the addition of fertilizer (scenario 2), yields can be increased by 2.3 t/ha (wheat), 1.3 t/ha (rice), 1.9 t/ha (maize), 0.3 t/ha (barley), and 0.4 t/ha (millet) at national level. Additional fertilizer has a more pronounced effect on crop yields than irrigation for all crops and in all provinces. For wheat, millet, and barley, only additional fertilizer is enough in many provinces to close the yield gap almost entirely or to a large degree. For rice, even though fertilizer has a pronounced effect on crop yields, a combination of fertilizer and irrigation water is necessary to reach attainable yields. For maize, additional fertilizer applications close the yield gap by more than 50% in most provinces.

3.3. Additional Irrigation and Fertilizer Requirements for Closing the Yield Gaps in Nepal

Rice is the most water-consuming crop grown in Nepal. Robust estimations of the water volumes required to irrigate this crop can thus serve as a base for future irrigation infrastructure planning in Nepal. Aggregated to the district level, the irrigation requirement for rice ranges from 0 to 958 mm (see online supplementary material for a table of the data). At the level of single simulation units, the required supplemental irrigation ranges from 0 to 1100 mm annually, with the highest requirements in the tropical Terai regions and decreasing with increasing altitude (Figure 7a). The tropical Terai regions require on average 785 mm of irrigation, the subtropical hill regions 540 mm, and the mountain areas 384 mm. Maize is the crop with the second highest water requirements after rice, varying from 0 to 700 mm. The highest water demands are simulated in the hilly and mountainous province 4, the lowest in the Terai regions of provinces 1, 2, and 5 (Figure 7b). This is a reverse of the pattern observed for rice. For wheat, the irrigation requirement varies from 0 to 520 mm, for millet from 0 to 420 mm, and for barley from 0 to 365 mm.
The mineral N requirements to achieve attainable yields vary from 12.1 to 205.2 kg/ha for rice, from 30.5 kg/ha to 260.5 kg/ha for maize, from 0 to 245.4 kg/ha for wheat, from 39.3 to 239.85 kg/ha for millet, and from 0 to 218.75 kg/ha for barley. The mineral P requirement to achieve attainable yields varies from 1.75 to 31.2 kg/ha for rice, from 6.4 to 69.7 kg/ha for maize, from 0 to 24.57 kg/ha for wheat, from 10.4 kg/ha to 34.4 kg/ha for millet, and from 0 to 5 kg/ha for barley. Spatially, the patterns observed for irrigation are also visible for nutrients: for rice and wheat, more fertilizer and irrigation water is required in the warmer provinces, while the hilly and mountains regions require less to close the yield gap (Figure 7c). For maize, more nitrogen is required in the hill and mountainous regions than in the Terai regions (Figure 7d), which is also apparent for barley and millet (Figure 7e).
A list of district-wise irrigation requirements for each crop is provided in the online supplementary material. Maps of all crops not shown in Figure 7 are provided in Figure A1, Figure A2, Figure A3, Figure A4 and Figure A5 in the Appendix A.

3.4. Effects of Closing the Yield Gaps on Food Self-Sufficiency in Nepal

The simulations of attainable yields show that an additional 4316.85 metric kilotons of rice, 2625.30 metric kilotons of wheat, 2870.30 metric kilotons of maize, 110.96 metric kilotons of millet, and 8.19 metric kilotons of barley can be produced with increased fertilizer and irrigation applications, which is sufficient for Nepal to achieve self-sufficiency. Especially province 2, located in the middle and Eastern Terai ecoregion, may play an important role in increasing rice and wheat yields (Table 4). For wheat, closing the yield gap in this province alone would be enough to replace all imports. For rice, the yield gap in province 5 would have to be closed as well to achieve self-sufficiency. For maize, closing the yield gap in province 1 (covering the ecozones Eastern Terai/hill/mountain) would be sufficient to entirely meet domestic demand. The yields of millet and barley, grown primarily in the more Northern mountain provinces, can only be increased to a small degree, which is still sufficient to replace all imports with domestic production.

4. Discussion

Cereals are an important cheap source of calories and protein in Nepal, but domestic production is low, and import rates are rising to meet the increasing demand. In this study, we show that it would be possible to increase domestic production by closing the gap between current yields and yields attainable with additional irrigation water and fertilizer applications. Yields could even reach levels where it is possible for Nepal to achieve self-sufficiency for the five cereals considered in this study, which would reduce the economic burden on the country. The government of Nepal is aware of this potential. In the fiscal year 2021/22, it has announced a budget of NPR 45.09 billion for the development of the agricultural and livestock sector; NPR 12 billion have been allocated to manage chemical fertilizers [55]. The plan is to make the country fully self-reliant in agriculture within five years through modernization, commercialization, and mechanization of the agricultural sector. However, even though a budget was allocated to increase crop and livestock production, in reality, farmers are still struggling to buy fertilizers. There is a shortage almost every year during the peak season [56]. Recently, there was even an incident of looting, where farmers took fertilizers from trucks headed for the capital [57]. The timely and regular availability of fertilizer thus must be guaranteed; otherwise, a steady increase in the productivity of Nepal’s agricultural sector is in jeopardy, and food self-sufficiency cannot be achieved.
To support smallholder farmers and encourage more resource-intensive agriculture, the government has also attempted to subsidize chemical fertilizer use and reduce prices. However, these measures primarily benefited larger commercial farmers and not smallholders [51]; more direct support is needed to reach these farmers. Increasing the use of fertilizers could also be achieved by improving the quantity and quality of organic farmyard manure fertilizers [58]. In the municipality of Bhaktapur, for example, organic compost manure is produced from the biodegradable waste collected from households [59]. Since 77% of the typical household waste in Bhaktapur is organic, this represents an abundant source of compost manure [60]. The composition of wastes in other cities follows similar trends, indicating a considerable source of raw materials for making compost manure.
It has been shown many times before that increasing fertilizer and irrigation will increase crop yields. However, for policy and infrastructure planning purposes, it is important to know where the resources should be allocated, in which order, and in which quantity. For example, the Nepalese government is currently investing considerable resources in the irrigation infrastructure of the country. Our results show that they should be focusing on the issue of fertilizer availability first, as providing crops with adequate nutrients contributes more towards closing the yield gap than irrigation. The only exception is maize, where the roles of irrigation and fertilizer are equal in closing the yield gap. In contrast to wheat and rice, where the irrigated area share is already higher than 25%, maize is mostly grown under rainfed conditions. Increasing the area under irrigation, especially in dry regions, can thus increase yields considerably. Spatially, the regions that would benefit most from additional agricultural inputs are the warm regions of the South, where mainly the crops rice, wheat, and maize are grown. In the mountainous areas of Nepal, the growing season is shorter, and more hardy crops such as barley and millet are cultivated. In these regions, the climatic conditions and not input shortages limit yields, which is why additional fertilizer and irrigation water applications do not increase yields markedly in most places. The development of new varieties could be an option to improve productivity in these areas.
Beyond investments in irrigation infrastructure and fertilizer availability, rural and infrastructure development policies are needed to stimulate overall growth and development in the agricultural sector. A good infrastructure is key to linking rural farmers to markets and institutions where they can buy and sell products and inputs, and access services. Furthermore, trade-related policy measures discouraging foreign crop imports could strengthen the domestic market and production.
There are some limitations to this study. First, we had to simplify crop management practices. Farmers in Nepal choose the crops and the dates of fieldwork based on a number of factors such as weather, seed availability, input availability, market prices, available subsidies, and demand. For the simulations, we assume that cropping schedules are annually static for all scenarios. Farmers also practice intercropping, whereas in EPIC, usually only one crop is grown at a time on a simulation unit. Furthermore, there is the issue of data. As we discuss in Section 3.1. (Calibration of crop yields), weather and soil data would need to have a higher resolution to adequately cover all microclimatic conditions in Nepal and thus allow a more accurate simulation of actual crop yields. Furthermore, there was also limited availability of aggregated and joined data for agricultural productivity, resource use, and management in Nepal; the data had to be combined from various sources of different quality. The situation was aggravated by the fact that data acquisition in countries such as Nepal can be a challenge. Organization webpages were not up to date, so we had to contact authorities directly. The data we received were in parts in Nepalese, in parts in English, and often not in a format that was easily machine-readable and had to be retyped, such as scanned or photographed books.
Even though our calibration was not perfect, our estimated yield gaps and estimated attainable yields fall into the range of values reported in the literature. The national level yield gap of the prevailing rice varieties was estimated to range from 1.7 to 3.0 t/ha in 2000–2016, as reported in the proceedings of a stakeholder workshop organized by the Nepal Agricultural Research Council [61]. In our study, the rice yield gap amounts to 2.7 t/ha at the national level, and a simulation study on the attainable yield of maize in Nepal showed that the average simulated maize yields with high fertilization rates (180:60:60 N:P:K kg/ha) ranged from 3.9 to 7.5 t/ha across districts [62]. In our study, attainable maize yields have a similar range of 1.4–6.6 t/ha. The same study recommended N fertilizer rates between 65 and 208 kg/ha to reach attainable yields, which is also similar to our values of 30.5–260.5 kg/ha. This shows that even though the calibration was not perfect, the results of the main simulation study appear to be robust.

5. Conclusions

Our analysis of the current yield gaps of the five major cereal crops in Nepal showed that there are considerable differences between attainable and current yields. By increasing productivity on the existing cropland with additional nutrient and water inputs, Nepal could potentially increase the yields of these crops to the degree that domestic demand can be met entirely by domestic production. Even though increasing the share of irrigated areas enhances crop yields, additional fertilizer applications have a higher potential for closing the yield gaps in Nepal. The priority of the Nepalese government should therefore be to ensure a steady and sufficient supply of affordable fertilizer and develop efficient organic fertilization schemes before investing in additional irrigation infrastructure projects on a larger scale. The results of this analysis can be used by policymakers to prioritize further research and to identify regions with a potential for higher crop production. The methodology applied in this study can also be relevant for other regions of the world where the population is increasing, cropland area expansion is not possible, and climate change impacts are projected to be substantial.

Supplementary Materials

The following supporting information can be downloaded at https://www.fdr.uni-hamburg.de/record/10340#.YtmldrdBxaQ: Table with the district-wise simulated current and attainable yields, yields simulated with additional water and irrigation applications, yield gaps, nitrogen, phosphorous and irrigation requirements, agricultural area, and total attainable yields per district can be downloaded.

Author Contributions

Both authors conceived of the study and wrote and edited the manuscript. A.K.B. prepared the input data and ran the model. All authors have read and agreed to the published version of the manuscript.

Funding

This research is funded by the Deutsche Forschungsgemeinschaft (DFG, German Research Foundation) under Germany’s Excellence Strategy—EXC 2037 ‘CLICCS—Climate, Climatic Change, and Society’—Project Number: 390683824, contribution to the Center for Earth System Research and Sustainability (CEN) of Universität Hamburg.

Data Availability Statement

The data that support the findings of this study can be downloaded at https://www.fdr.uni-hamburg.de/record/10340#.YtmldrdBxaQ.

Acknowledgments

We would like to thank Prajal Pradhan and Stefan Lange (PIK) for facilitating and providing access to the ISIMIP3b climate data. We would like to thank Indira Kandel and Sujan Subedi from the Department of Hydrology and Meteorology Nepal for their support regarding the weather station data of Nepal. We would like to thank Dhiraj Gyawali (Universität Stuttgart, Institute for Modelling Hydraulic and Environmental Systems) for his help in sharing his experience with the CRAFTS crop modeling work in Nepal. We are grateful to Shova Shrestha (Nepal Agricultural Research Council), Jeet Bahadur Chand (Prime Minister Agriculture Modernization Project), and Umesh Sujakhu (Department of Irrigation Nepal) for providing the agriculture information on Nepal. We extend our gratitude to Ajay Adhikari (Department of Water Resources and Irrigation) for his kind help regarding the irrigation data related to Nepal. We are also grateful to Ruth Sos Del Diego for her support in GIS-related matters.

Conflicts of Interest

The authors declare no conflict of interest.

Appendix A

Table A1. District-wise simulated (Sim.) and reported (Rep.) crop yields (t/ha) for rice, maize, wheat, barley, and millet. The reported crop yields were provided by the Ministry of Agriculture Development Nepal. The data were used to evaluate the quality of the crop model calibration.
RiceMaizeWheatBarleyMillet
DistrictSim.Rep.Sim.Rep.Sim.Rep.Sim.Rep.Sim.Rep.
Achham1.862.131.071.610.981.491.311.091.351.17
Arghakhanchi2.252.202.141.990.891.610.261.031.051.07
Baglung1.982.622.612.201.371.730.581.441.061.17
Baitadi1.651.960.751.641.261.370.040.911.221.14
Bajhang1.951.911.481.450.841.480.741.000.720.95
Bajura2.111.861.631.721.681.391.11.041.140.95
Banke3.032.772.121.870.572.42
Bara3.093.752.372.600.632.89
Bardiya3.243.122.301.930.432.47
Bhaktapur2.335.742.703.311.042.930.741.231.071.27
Bhojpur2.22.451.922.101.561.950.231.141.211.03
Chitawan3.793.072.022.500.622.45
Dadeldhura1.832.310.871.711.271.37 0.971.180.88
Dailekh1.812.451.071.881.031.541.061.011.381.19
Dang3.23.192.812.010.372.18
Darchula1.032.030.961.730.481.400.440.840.530.82
Dhading1.722.710.941.900.971.822.030.911.280.96
Dhankuta1.962.601.732.001.471.950.11.131.181.00
Dhanusha2.732.682.812.540.692.03
Dolakha2.172.192.171.931.591.500.920.811.021.11
Dolpa1.121.570.881.711.421.480.930.970.860.81
Doti1.822.430.731.710.991.670.510.951.031.10
Gorkha2.092.711.392.200.741.810.671.130.821.06
Gulmi1.732.341.801.800.881.690.251.110.631.19
Humla1.941.420.691.522.060.911.220.921.260.85
Ilam1.852.491.392.161.132.030.320.740.900.99
Jajarkot1.732.231.141.730.841.181.341.161.501.38
Jhapa2.663.312.472.300.532.47
Jumla2.381.581.641.442.361.091.171.071.421.38
Kabhrepalanchok2.133.061.992.250.881.920.521.020.941.01
Kailali3.352.672.351.680.292.11
Kalikot2.11.692.371.581.741.301.121.081.301.20
Kanchanpur3.422.612.581.780.352.10
Kapilbastu2.812.431.932.180.662.20
Kaski1.182.881.772.250.841.970.191.170.591.21
Kathmandu2.265.362.692.991.012.370.751.001.041.00
Khotang2.042.212.072.031.611.670.390.971.271.00
Lalitpur1.735.051.682.450.712.440.011.510.861.21
Lamjung2.062.351.372.180.881.950.880.910.871.00
Mahottari2.822.372.772.160.661.91
Makawanpur2.982.972.202.280.342.30
Morang2.873.212.712.270.542.16
Mugu2.221.851.112.142.121.341.170.921.391.66
Myagdi1.422.661.302.302.641.781.461.201.001.02
Nawalparasi East3.63.291.932.430.552.40
Nawalparasi West3.33.292.293.670.552.40
Nuwakot1.613.140.822.121.102.212.20.941.361.35
Okhaldhunga1.842.422.081.871.651.610.530.971.341.29
Palpa2.152.691.882.030.641.93 1.060.651.04
Panchthar2.32.131.401.561.431.680.620.911.091.45
Parbat1.312.351.772.070.981.690.260.940.600.91
Parsa3.083.582.633.040.672.67
Pyuthan1.862.240.861.530.761.780.271.811.181.08
Ramechhap1.812.231.982.121.471.760.630.811.191.08
Rasuwa2.82.220.561.741.231.752.291.101.021.02
Rautahat3.192.612.522.050.622.18
Rolpa1.782.181.271.680.921.650.541.101.541.01
Rukum East1.812.531.441.710.591.582.211.011.691.19
Rukum West1.792.531.321.710.631.581.91.011.581.19
Rupandehi3.343.282.262.400.582.60
Salyan1.742.601.241.931.001.640.460.961.391.15
Sankhuwasabha2.261.951.891.731.291.830.370.961.011.01
Saptari2.82.532.992.170.732.17
Sarlahi2.952.602.802.630.642.09
Sindhuli2.492.352.752.240.622.02
Sindhupalchok2.822.342.102.100.981.550.951.160.921.12
Siraha2.782.392.662.270.681.99
Solukhumbu1.971.991.581.991.571.451.291.061.121.17
Sunsari2.933.022.752.420.582.36
Surkhet3.022.792.952.210.221.96
Syangja1.652.891.702.550.621.970.11.020.561.22
Tanahu2.012.891.712.490.681.840.050.800.551.06
Taplejung2.492.091.702.021.522.760.541.080.991.16
Terhathum2.272.101.601.681.541.660.281.031.121.09
Udayapur2.492.782.821.990.612.04
Figure A1. (a) Annual irrigation (mm), (b) maximum mineral nitrogen (kg/ha), and (c) maximum mineral phosphorous (kg/ha) fertilizer requirements to achieve attainable yields at simulation unit level for rice.
Land 11 01355 g0a1
Figure A2. (a) Annual irrigation (mm), (b) maximum mineral nitrogen (kg/ha), and (c) maximum mineral phosphorous (kg/ha) fertilizer requirements to achieve attainable yields at simulation unit level for maize.
Land 11 01355 g0a2
Figure A3. (a) Annual irrigation (mm), (b) maximum mineral nitrogen (kg/ha), and (c) maximum mineral phosphorous (kg/ha) fertilizer requirements to achieve attainable yields at simulation unit level for wheat.
Land 11 01355 g0a3
Figure A4. (a) Annual irrigation (mm), (b) maximum mineral nitrogen (kg/ha), and (c) maximum mineral phosphorous (kg/ha) fertilizer requirements to achieve attainable yields at simulation unit level for barley.
Land 11 01355 g0a4
Figure A5. (a) Annual irrigation (mm), (b) maximum mineral nitrogen (kg/ha), and (c) maximum mineral phosphorous (kg/ha) fertilizer requirements to achieve attainable yields at simulation unit level for millet.
Land 11 01355 g0a5

References

  1. Van Dijk, M.; Morley, T.; Rau, M.L.; Saghai, Y. A meta-analysis of projected global food demand and population at risk of hunger for the period 2010–2050. Nat. Food 2021, 2, 494–501. [Google Scholar] [CrossRef]
  2. Cassman, K.G.; Grassini, P. A global perspective on sustainable intensification research. Nat. Sustain. 2020, 3, 262–268. [Google Scholar] [CrossRef]
  3. Struik, P.C.; Kuyper, T. Sustainable intensification in agriculture: The richer shade of green. A review. Agron. Sustain. Dev. 2017, 37, 39. [Google Scholar] [CrossRef]
  4. Foley, J.A.; Ramankutty, N.; Brauman, K.A.; Cassidy, E.S.; Gerber, J.S.; Johnston, M.; Mueller, N.D.; O’Connell, C.; Ray, D.K.; West, P.C.; et al. Solutions for a cultivated planet. Nature 2011, 478, 337–342. [Google Scholar] [CrossRef] [PubMed]
  5. Licker, R.; Johnston, M.; Foley, J.A.; Barford, C.; Kucharik, C.J.; Monfreda, C.; Ramankutty, N. Mind the gap: How do climate and agricultural management explain the ‘yield gap’ of croplands around the world? Glob. Ecol. Biogeogr. 2010, 19, 769–782. [Google Scholar] [CrossRef]
  6. Van Ittersum, M.K.; Cassman, K.G.; Grassini, P.; Wolf, J.; Tittonell, P.; Hochman, Z. Yield gap analysis with local to global relevance—A review. Field Crops Res. 2013, 143, 4–17. [Google Scholar] [CrossRef]
  7. Pradhan, P.; Fischer, G.; van Velthuizen, H.; Reusser, D.E.; Kropp, J.P. Closing Yield Gaps: How Sustainable Can We Be? PLoS ONE 2015, 10, e0129487. [Google Scholar] [CrossRef]
  8. International Centerfor Tropical Agriculture; World Bank; CGIAR Research Program on Climate Change Agriculture and Food Security; Local Initiatives for Biodiversity Research and Development. Climate-Smart Agriculture in Nepal. CSA Country Profiles for Asia Series; CIAT World Bank: Rome, Italy; CCAFS: New Delhi, India; LI-BIRD: Pokhara, Nepal, 2017; Volume 26. [Google Scholar]
  9. Hussain, A.; Rasul, G.; Mahapatra, B.; Wahid, S.; Tuladhar, S. Climate change-induced hazards and local adaptations in agriculture: A study from Koshi River Basin, Nepal. Nat. Hazards 2018, 91, 1365–1383. [Google Scholar] [CrossRef]
  10. World Bank. Fertilizer Consumption (Kilograms per Hectare of Arable Land); World Bank: Washington, DC, USA, 2014. [Google Scholar]
  11. Department of Water Resources and Irrigation. Irrigation Master Plan Preparation through Integrated River Basin Planning (Dataset); Water Resources Project Preparatory Facility, Department of Water Resources and Irrigation, Ministry of Energy, Water Resources and Irrigation (MoEWRI): Kathmandu, Nepal, 2019.
  12. Bigyan, K.C.; Pandit, R.; Kandel, B.P.; Kumar, K.C.K.; Arpana, K.C.; Poudel, M.R. Scenario of Plant Breeding in Nepal and Its Application in Rice. Int. J. Agron. 2021, 2021, 5520741. [Google Scholar] [CrossRef]
  13. Sharma, R. The scale and drivers of informal trade in agricultural products across the Nepal–India borders. In Proceedings of the SAARC Agricultural Trade Forum, Organized by SAARC Agriculture Centre and FAO, Dhaka, Bangladesh, 22–23 May 2017; pp. 22–23. [Google Scholar]
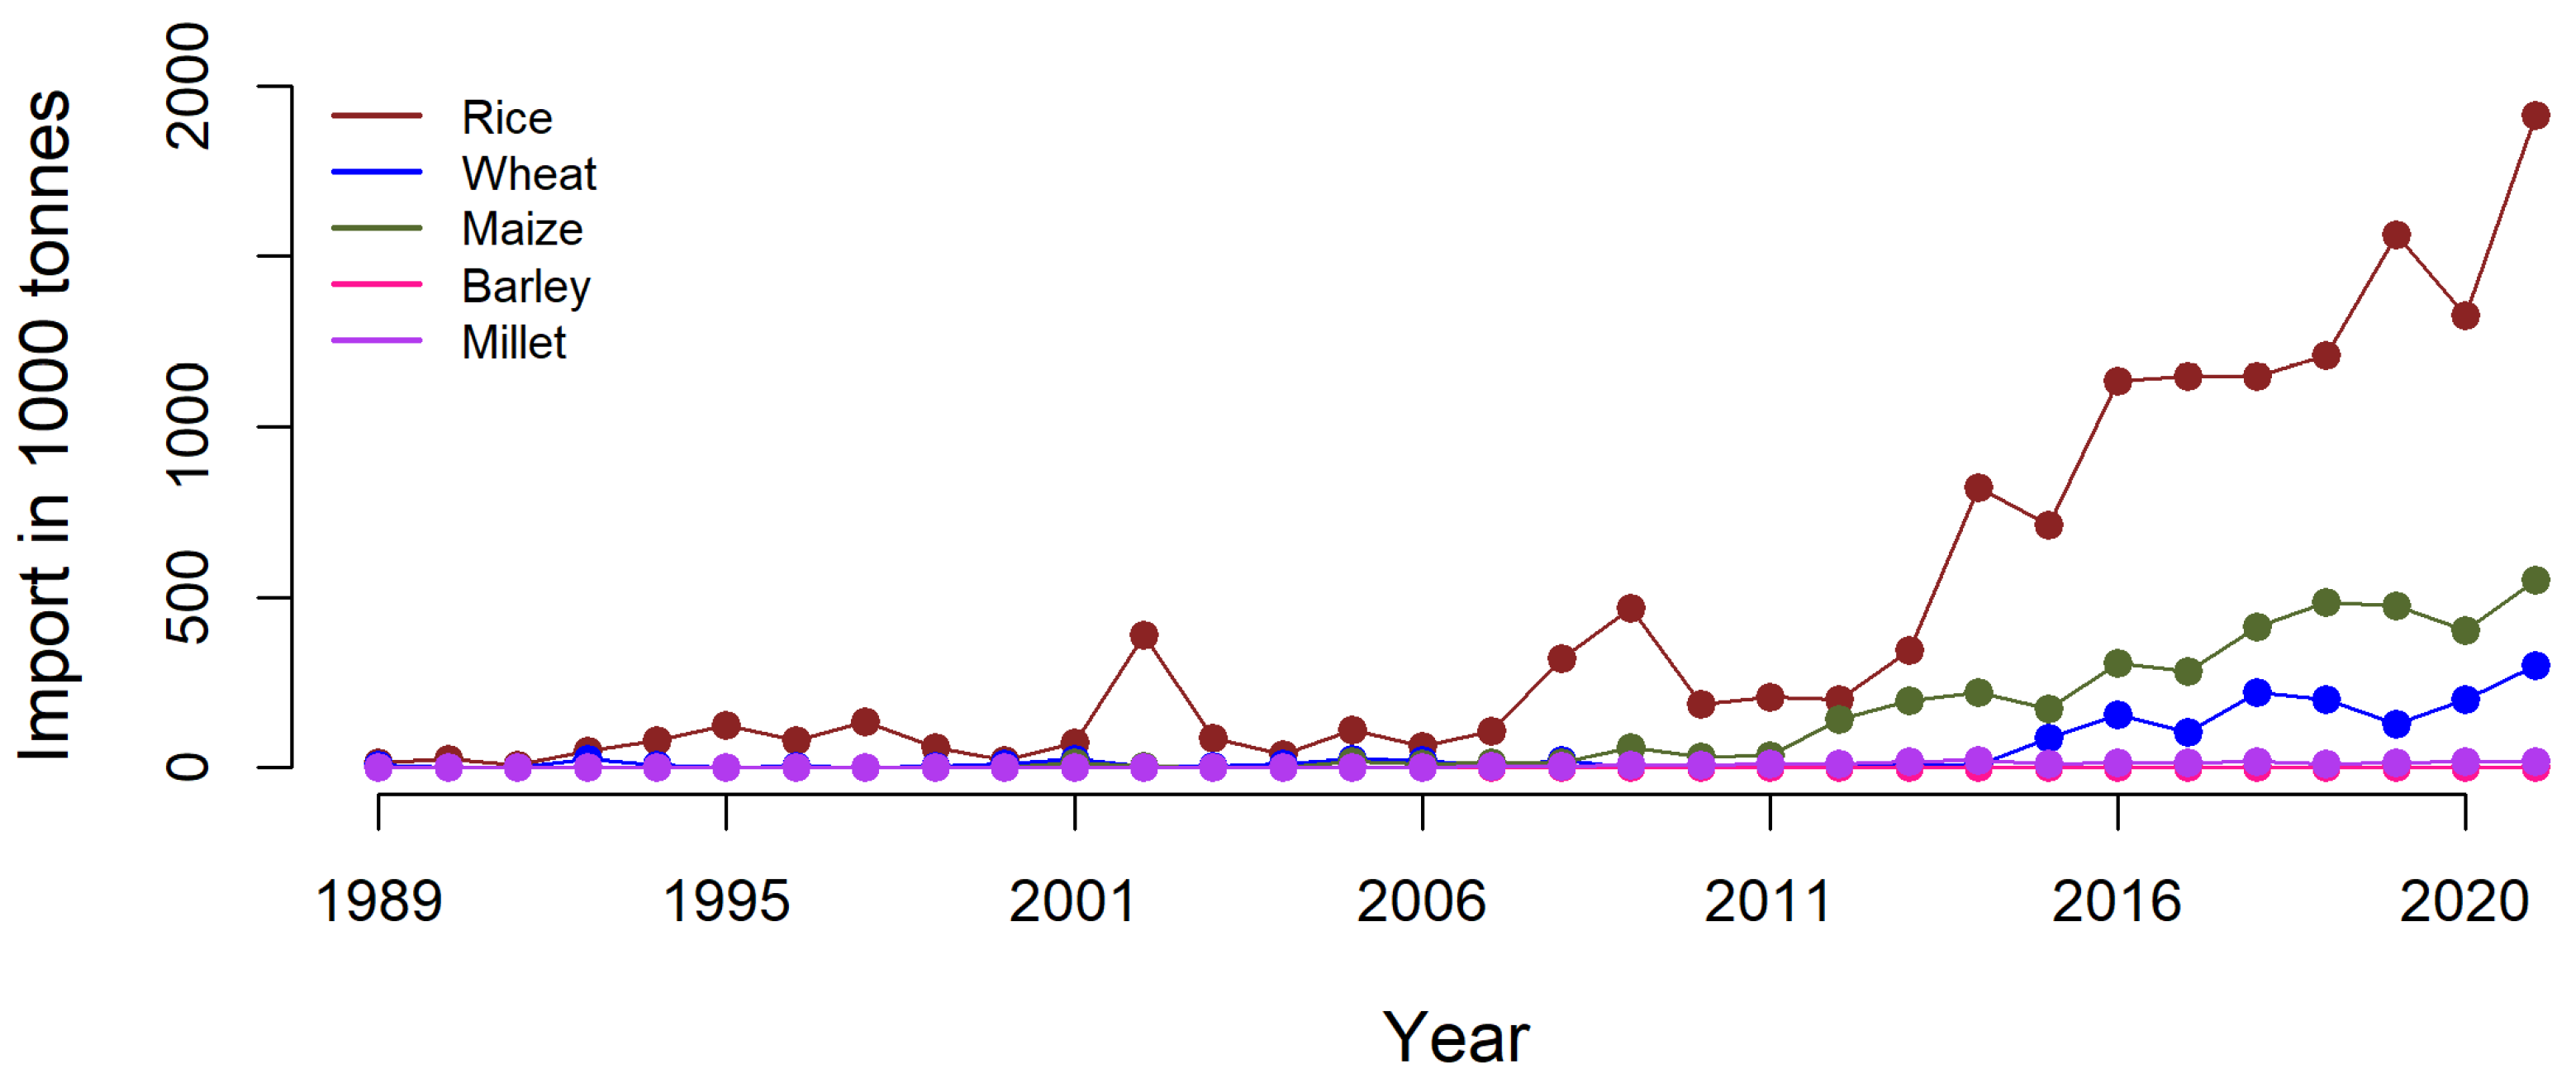
  14. FAOSTAT. Cereals Import in Nepal. 1989 to 2020; FAOSTAT: Rome, Italy, 2020. [Google Scholar]
  15. Ministry of Agricultural Development (MOAD). Agricultural Statistics of Cereal Crops in Nepal (1979 to 2014). Available online: http://rds.icimod.org/Home/DataDetail?metadataId=17200 (accessed on 12 June 2021).
  16. Cortner, O.; Garrett, R.D.; Valentim, J.F.; Ferreira, J.; Niles, M.T.; Reis, J.; Gil, J. Perceptions of integrated crop-livestock systems for sustainable intensification in the Brazilian Amazon. Land Use Policy 2019, 82, 841–853. [Google Scholar] [CrossRef]
  17. Gyawali, D.R.; Shirsath, P.B.; Kanel, D.; Burja, K.; Khatri-Chhetri, A.; Aggarwal, P.K.; Hansen, J.; Rose, A. In-season crop yield forecasting using CCAFS Regional Agricultural Forecasting Toolbox (CRAFT) in Nepal. In CCAFS Working Paper No. 227; CGIAR Research Program on Climate Change, Agriculture and Food Security (CCAFS): Wageningen, The Netherlands, 2018. [Google Scholar]
  18. Campolo, J.; Güereña, D.; Maharjan, S.; Lobell, D.B. Evaluation of soil-dependent crop yield outcomes in Nepal using ground and satellite-based approaches. Field Crops Res. 2021, 260, 107987. [Google Scholar] [CrossRef]
  19. Matthews, R.B.; Pilbeam, C. Modelling the long-term productivity and soil fertility of maize/millet cropping systems in the mid-hills of Nepal. Agric. Ecosyst. Environ. 2005, 111, 119–139. [Google Scholar] [CrossRef]
  20. Jha, P.K.; Athanasiadis, P.; Gualdi, S.; Trabucco, A.; Mereu, V.; Shelia, V.; Hoogenboom, G. Using daily data from seasonal forecasts in dynamic crop models for yield prediction: A case study for rice in Nepal’s Terai. Agric. For. Meteorol. 2019, 265, 349–358. [Google Scholar] [CrossRef]
  21. World Bank. Nepal in Data; World Bank: Washington, DC, USA, 2020. [Google Scholar]
  22. Pokhrel, C. Agriculture Diversification in Nepal. In Agriculture Transformation in Nepal; Thapa, G., Kumar, A., Joshi, P.K., Eds.; Springer Nature Singapore pte Ltd.: Singapore, 2019; p. 323. [Google Scholar]
  23. Paudel, B.; Panday, D.; Dhakal, K. Climate. In The Soils of Nepal; Ojha, R.B., Panday, D., Eds.; Springer International Publishing: Cham, Switzerland, 2021; pp. 15–27. [Google Scholar]
  24. Karki, R.; Hasson, S.; Schickhoff, U.; Scholten, T.; Bohner, J. Rising Precipitation Extremes across Nepal. Climate 2017, 5, 4. [Google Scholar] [CrossRef]
  25. Department of Hydrology and Meteorology (DHM). Climate and Climatic variability of Nepal-2015. Tech. Rep. 2015, 1, 41. [Google Scholar]
  26. Khadka, D.; Pathak, D. Climate change projection for the marsyangdi river basin, Nepal using statistical downscaling of GCM and its implications in geodisasters. Geoenviron. Disasters 2016, 3, 15. [Google Scholar] [CrossRef]
  27. Talchabhadel, R.; Karki, R.; Yadav, M.; Maharjan, M.; Aryal, A.; Thapa, B.R. Spatial distribution of soil moisture index across Nepal: A step towards sharing climatic information for agricultural sector. Theor. Appl. Climatol. 2019, 137, 3089–3102. [Google Scholar] [CrossRef]
  28. Skalský, R.; Tarasovicová, Z.; Balkovic, J.; Schmid, E.; Fuchs, M.; Moltchanova, E.; Kindermann, G.; Scholtz, P. Geo-bene global database for bio-physical modeling v. 1.0. Concepts, methodologies and data. GEO-BENE Database Rep. 2008, 1, 58. [Google Scholar]
  29. Jarvis, A.; Reuter, H.I.; Nelson, A.; Guevara, E. Hole-Filled SRTM for the Globe Version 4. The CGIAR-CSI SRTM 90m Database. 2008; Volume 15, pp. 25–54. Available online: http://srtm.csi.cgiar.org (accessed on 12 June 2021).
  30. Jones, P.G.; Thornton, P.K. Representative soil profiles for the Harmonized World Soil Database at different spatial resolutions for agricultural modelling applications. Agric. Syst. 2015, 139, 93–99. [Google Scholar] [CrossRef]
  31. Barnekow Lillesø, J.-P.; Shrestha, T.B.; Dhakal, L.P.; Nayaju, R.P.; Shrestha, R. The map of potential vegetation of Nepal: A forestry/agro-ecological/biodiversity classification system. Dev. Environ. 2005, 2, 76. [Google Scholar]
  32. GADM. GADM Database of Global Administrative Areas, Version 2.8. 2015. 2018. Available online: http://www.gadm.org (accessed on 12 June 2021).
  33. Uddin, K.; Shrestha, H.L.; Murthy, M.; Bajracharya, B.; Shrestha, B.; Gilani, H.; Pradhan, S.; Dangol, B. Development of 2010 national land cover database for the Nepal. J. Environ. Manag. 2015, 148, 82–90. [Google Scholar] [CrossRef] [PubMed]
  34. Eyring, V.; Bony, S.; Meehl, G.A.; Senior, C.A.; Stevens, B.; Stouffer, R.J.; Taylor, K.E. Overview of the Coupled Model Intercomparison Project Phase 6 (CMIP6) experimental design and organization. Geosci. Model Dev. 2016, 9, 1937–1958. [Google Scholar] [CrossRef]
  35. Williams, J.R.; Jones, C.A.; Kiniry, J.R.; Spanel, D.A. The Epic Crop Growth-Model. Trans. ASAE 1989, 32, 497–511. [Google Scholar] [CrossRef]
  36. Di Bene, C.; Diacono, M.; Montemurro, F.; Testani, E.; Farina, R. EPIC model simulation to assess effective agro-ecological practices for climate change mitigation and adaptation in organic vegetable system. Agron. Sustain. Dev. 2022, 42, 7. [Google Scholar] [CrossRef]
  37. Gaiser, T.; de Barros, I.; Sereke, F.; Lange, F.M. Validation and reliability of the EPIC model to simulate maize production in small-holder farming systems in tropical sub-humid West Africa and semi-arid Brazil. Agric. Ecosyst. Environ. 2010, 135, 318–327. [Google Scholar] [CrossRef]
  38. Zhang, J.; Balkovic, J.; Azevedo, L.B.; Skalsky, R.; Bouwman, A.F.; Xu, G.; Wang, J.; Xu, M.; Yu, C. Analyzing and modelling the effect of long-term fertilizer management on crop yield and soil organic carbon in China. Sci. Total Environ. 2018, 627, 361–372. [Google Scholar] [CrossRef]
  39. Balkovič, J.; van der Velde, M.; Schmid, E.; Skalský, R.; Khabarov, N.; Obersteiner, M.; Stürmer, B.; Xiong, W. Pan-European crop modelling with EPIC: Implementation, up-scaling and regional crop yield validation. Agric. Syst. 2013, 120, 61–75. [Google Scholar] [CrossRef]
  40. Schierhorn, F.; Faramarzi, M.; Prishchepov, A.V.; Koch, F.J.; Muller, D. Quantifying yield gaps in wheat production in Russia. Environ. Res. Lett. 2014, 9, 084017. [Google Scholar] [CrossRef]
  41. Lu, C.; Fan, L. Winter wheat yield potentials and yield gaps in the North China Plain. Field Crops Res. 2013, 143, 98–105. [Google Scholar] [CrossRef]
  42. Xiong, W.; Skalsky, R.; Porter, C.H.; Balkovic, J.; Jones, J.W.; Yang, D. Calibration-induced uncertainty of the EPIC model to estimate climate change impact on global maize yield. J. Adv. Model. Earth Syst. 2016, 8, 1358–1375. [Google Scholar] [CrossRef]
  43. Liu, J.; You, L.; Amini, M.; Obersteiner, M.; Herrero, M.; Zehnder Alexander, J.B.; Yang, H. A high-resolution assessment on global nitrogen flows in cropland. Proc. Natl. Acad. Sci. USA 2010, 107, 8035–8040. [Google Scholar] [CrossRef] [PubMed]
  44. Liu, W.; Yang, H.; Liu, J.; Azevedo, L.B.; Wang, X.; Xu, Z.; Abbaspour, K.C.; Schulin, R. Global assessment of nitrogen losses and trade-offs with yields from major crop cultivations. Sci. Total Environ. 2016, 572, 526–537. [Google Scholar] [CrossRef] [PubMed]
  45. Balkovic, J.; Skalsky, R.; Folberth, C.; Khabarov, N.; Schmid, E.; Madaras, M.; Obersteiner, M.; van der Velde, M. Impacts and Uncertainties of+2 degrees C of Climate Change and Soil Degradation on European Crop Calorie Supply. Earths Future 2018, 6, 373–395. [Google Scholar] [CrossRef] [PubMed]
  46. Bouraoui, F.; Grizzetti, B. An integrated modelling framework to estimate the fate of nutrients: Application to the Loire (France). Ecol. Model. 2008, 212, 450–459. [Google Scholar] [CrossRef]
  47. Thomson, A.M.; Izaurralde, R.C.; Rosenberg, N.J.; He, X.X. Climate change impacts on agriculture and soil carbon sequestration potential in the Huang-Hai Plain of China. Agric. Ecosyst. Environ. 2006, 114, 195–209. [Google Scholar] [CrossRef]
  48. Folberth, C.; Gaiser, T.; Abbaspour, K.C.; Schulin, R.; Yang, H. Regionalization of a large-scale crop growth model for sub-Saharan Africa: Model setup, evaluation, and estimation of maize yields. Agric. Ecosyst. Environ. 2012, 151, 21–33. [Google Scholar] [CrossRef]
  49. Muller, C.; Elliott, J.; Chryssanthacopoulos, J.; Arneth, A.; Balkovic, J.; Ciais, P.; Deryng, D.; Folberth, C.; Glotter, M.; Hoek, S.; et al. Global gridded crop model evaluation: Benchmarking, skills, deficiencies and implications. Geosci. Model Dev. 2017, 10, 1403–1422. [Google Scholar] [CrossRef]
  50. Hargreaves, G.H.; Samani, Z.A. Reference Crop Evapotranspiration from Temperature. Appl. Eng. Agric. 1985, 1, 96–99. [Google Scholar] [CrossRef]
  51. Takeshima, H. Use of Chemical Fertilizers in Nepal-Issues and Implications. In Agricultural Transformation in Nepal: Trends, Prospects, and Policy Options; Springer: Singapore, 2019; pp. 231–260. [Google Scholar] [CrossRef]
  52. de Salis, H.H.C.; da Costa, A.M.; Vianna, J.H.M.; Schuler, M.A.; Kunne, A.; Fernandes, L.F.S.; Pacheco, F.A.L. Hydrologic Modeling for Sustainable Water Resources Management in Urbanized Karst Areas. Int. J. Environ. Res. Public Health 2019, 16, 2542. [Google Scholar] [CrossRef]
  53. Niu, X.; Easterling, W.; Hays, C.J.; Jacobs, A.; Mearns, L. Reliability and input-data induced uncertainty of the EPIC model to estimate climate change impact on sorghum yields in the U.S. Great Plains. Agric. Ecosyst. Environ. 2009, 129, 268–276. [Google Scholar] [CrossRef]
  54. Mueller, N.D.; Gerber, J.S.; Johnston, M.; Ray, D.K.; Ramankutty, N.; Foley, J.A. Closing yield gaps through nutrient and water management. Nature 2012, 490, 254–257. [Google Scholar] [CrossRef] [PubMed]
  55. Government of Nepal: Ministry of Finance. Public Announcement of Income-Expenditure Details of Fiscal Year 2021/22; Ministry of Finance: Kathmandu, Nepal, 2021; p. 88.
  56. Cosic, D.; Dahal, S.; Kitzmuller, M. Climbing Higher: Toward a Middle-Income Nepal; World Bank: Washington, DC, USA, 2017. [Google Scholar]
  57. Shrestha, S. Desperate Farmers Seize Fertilisers in Dhading. Available online: https://kathmandupost.com/national/2022/06/18/farmers-in-dhading-seize-fertilisers-smuggled-from-india (accessed on 22 June 2022).
  58. Dhakal, C.; Escalante, C.L. The Productivity Effects of Adopting Improved Organic Manure Practices in Nepal. Front. Environ. Sci. 2022, 10, 912860. [Google Scholar] [CrossRef]
  59. Rai, S. Bhaktapur Does Not Send Garbage to the Sisdole Landfill Site, Rather Sells the Compost from Garbage. Available online: https://nepalsamaya.com/samaj/2022-06-20-163727 (accessed on 22 June 2022).
  60. Ranjit, A.S.; Shakya, R.; Gwachha, S.; Ganesh, R.; Prajapati, M.; Bhaila, P.; Duwal, I. Assessment of Solid Waste Management in Bhaktapur Municipality. J. Sci. Eng. 2019, 7, 10–19. [Google Scholar] [CrossRef]
  61. KC, R.B.; Ghimire, T.B.; Joshi, B.K.; Gotame, T.P.; Paneru, P. Proceedings of Stakeholders Workshop on Hybrid Variety Development in Nepal; Directorate of Agricultural Research, Gandaki Province: Lumle, Nepal, 2020.
  62. Devkota, K.P.; McDonald, A.J.; Khadka, A.; Khadka, L.; Paudel, G.; Devkota, M. Decomposing maize yield gaps differentiates entry points for intensification in the rainfed mid-hills of Nepal. Field Crops Res. 2015, 179, 81–94. [Google Scholar] [CrossRef]
Figure 1. Import rates of the five main cereals consumed in Nepal (rice, wheat, maize, barley, and millet) from 1989 to 2020 [14].
Land 11 01355 g001
Figure 2. (a) Location of Nepal in South Asia; (b) land use in Nepal; (c) the nine different agro-ecological zones of Nepal; (d) thermal zone classification of Nepal [27]; (e) elevation classes of Nepal; (f) mean annual precipitation in mm [27].
Land 11 01355 g002
Figure 3. Flow chart of the methodological framework used for the yield gap analysis in Nepal, including homogeneous response unit (HRU) and simulation unit delineation, scenario portfolio, and input data to the EPIC crop model.
Land 11 01355 g003
Figure 4. Comparison of mean simulated crop yields (t/ha) to mean reported crop yields from the Ministry of Agriculture Development (MOAD) Nepal. Each data point represents a long-term average yield (from 1999 to 2014). The line indicates x = y (perfect agreement). PBIAS represents percentage bias, n the number of districts, and r the Pearson correlation coefficient.
Land 11 01355 g004
Figure 5. Simulated yield gaps of (a) rice, (b) maize, (c) millet, (d) barley, and (e) wheat in tons per hectare.
Land 11 01355 g005
Figure 6. Current yields, attainable yields, and yields produced under current management plus additional irrigation water and current management plus additional fertilizer at province level.
Land 11 01355 g006
Figure 7. Annual irrigation and fertilizer requirements to achieve attainable yields at simulation unit level. (a) annual irrigation (mm) for rice; (b) annual irrigation (mm) for maize; (c) mineral nitrogen (kg/ha) for rice; (d) mineral nitrogen (kg/ha) for maize; (e) mineral phosphorous (kg/ha) for millet. The missing maps are provided in the Appendix A in Figure A1, Figure A2, Figure A3, Figure A4 and Figure A5.
Land 11 01355 g007
Table 2. Annual inorganic and organic fertilizer use in Nepal based on data from CBS Nepal decadal agricultural census data and Takeshima et al. [51].
Fertilizer TypeTeraiHillMountain
Urea28 kg/ha18 kg/ha12 kg/ha
Complex3 kg/ha4 kg/ha2 kg/ha
DAP17 kg/ha3 kg/ha1 kg/ha
Organic N fertilizer22 kg/ha16 kg/ha13 kg/ha
Organic P fertilizer11 kg/ha4 kg/ha2 kg/ha
Other inorganic0 kg/ha0 kg/ha0 kg/ha
Table 3. Crop calendar for the main cereal crops cultivated in Nepal split by ecological zone and irrigation management. P—planting; TP—transplanting; H—harvesting.
CropEcological ZoneIrrigationJan.Feb.Mar.Apr.MayJun.Jul.Aug.Sep.Oct.Nov.Dec.
RiceHillRainfed TPTP HH
Irrigated TPTP HH
TeraiRainfed TPTP HHH
Irrigated TPTP HHH
MaizeMountainRainfed PP HHH
HillRainfed PP HH
TeraiRainfed PP HH
WheatMountainRainfed HH PP
HillRainfed HHH PPP
TeraiRainfed HH PP
MilletMountainRainfed PP HH
HillRainfed PP HH
BarleyMountainRainfed HH PP
HillRainfed HH PPP
Table 4. Additional yields [1000 tons] that can be produced in Nepal if irrigation and fertilizer applications are increased at provincial and national levels. The import rates in the last line show that Nepal could achieve self-sufficiency for all five crops if the yield gaps were closed.
ProvinceRiceWheatMaizeMilletBarley
Province 1859.46157.33890.6030.270.33
Province 21329.261084.56136.67
Province 3348.05140.71559.7120.351.31
Province 4311.3870.50344.2638.301.52
Province 5896.57651.71397.263.721.50
Province 6124.60225.96362.979.302.48
Province 7447.54533.09178.819.011.05
Nepal (sum)4316.852863.872870.30110.968.19
2020 Imports1912300550180
Publisher’s Note: MDPI stays neutral with regard to jurisdictional claims in published maps and institutional affiliations.

