
Analysis of the Spatial Adaptability of Gross Ecosystem Production, Gross Domestic Production, and Population Density in Chinese Mainland


Abstract
:1. Introduction
2. Data and Methods
2.1. Data
2.1.1. Data Sources
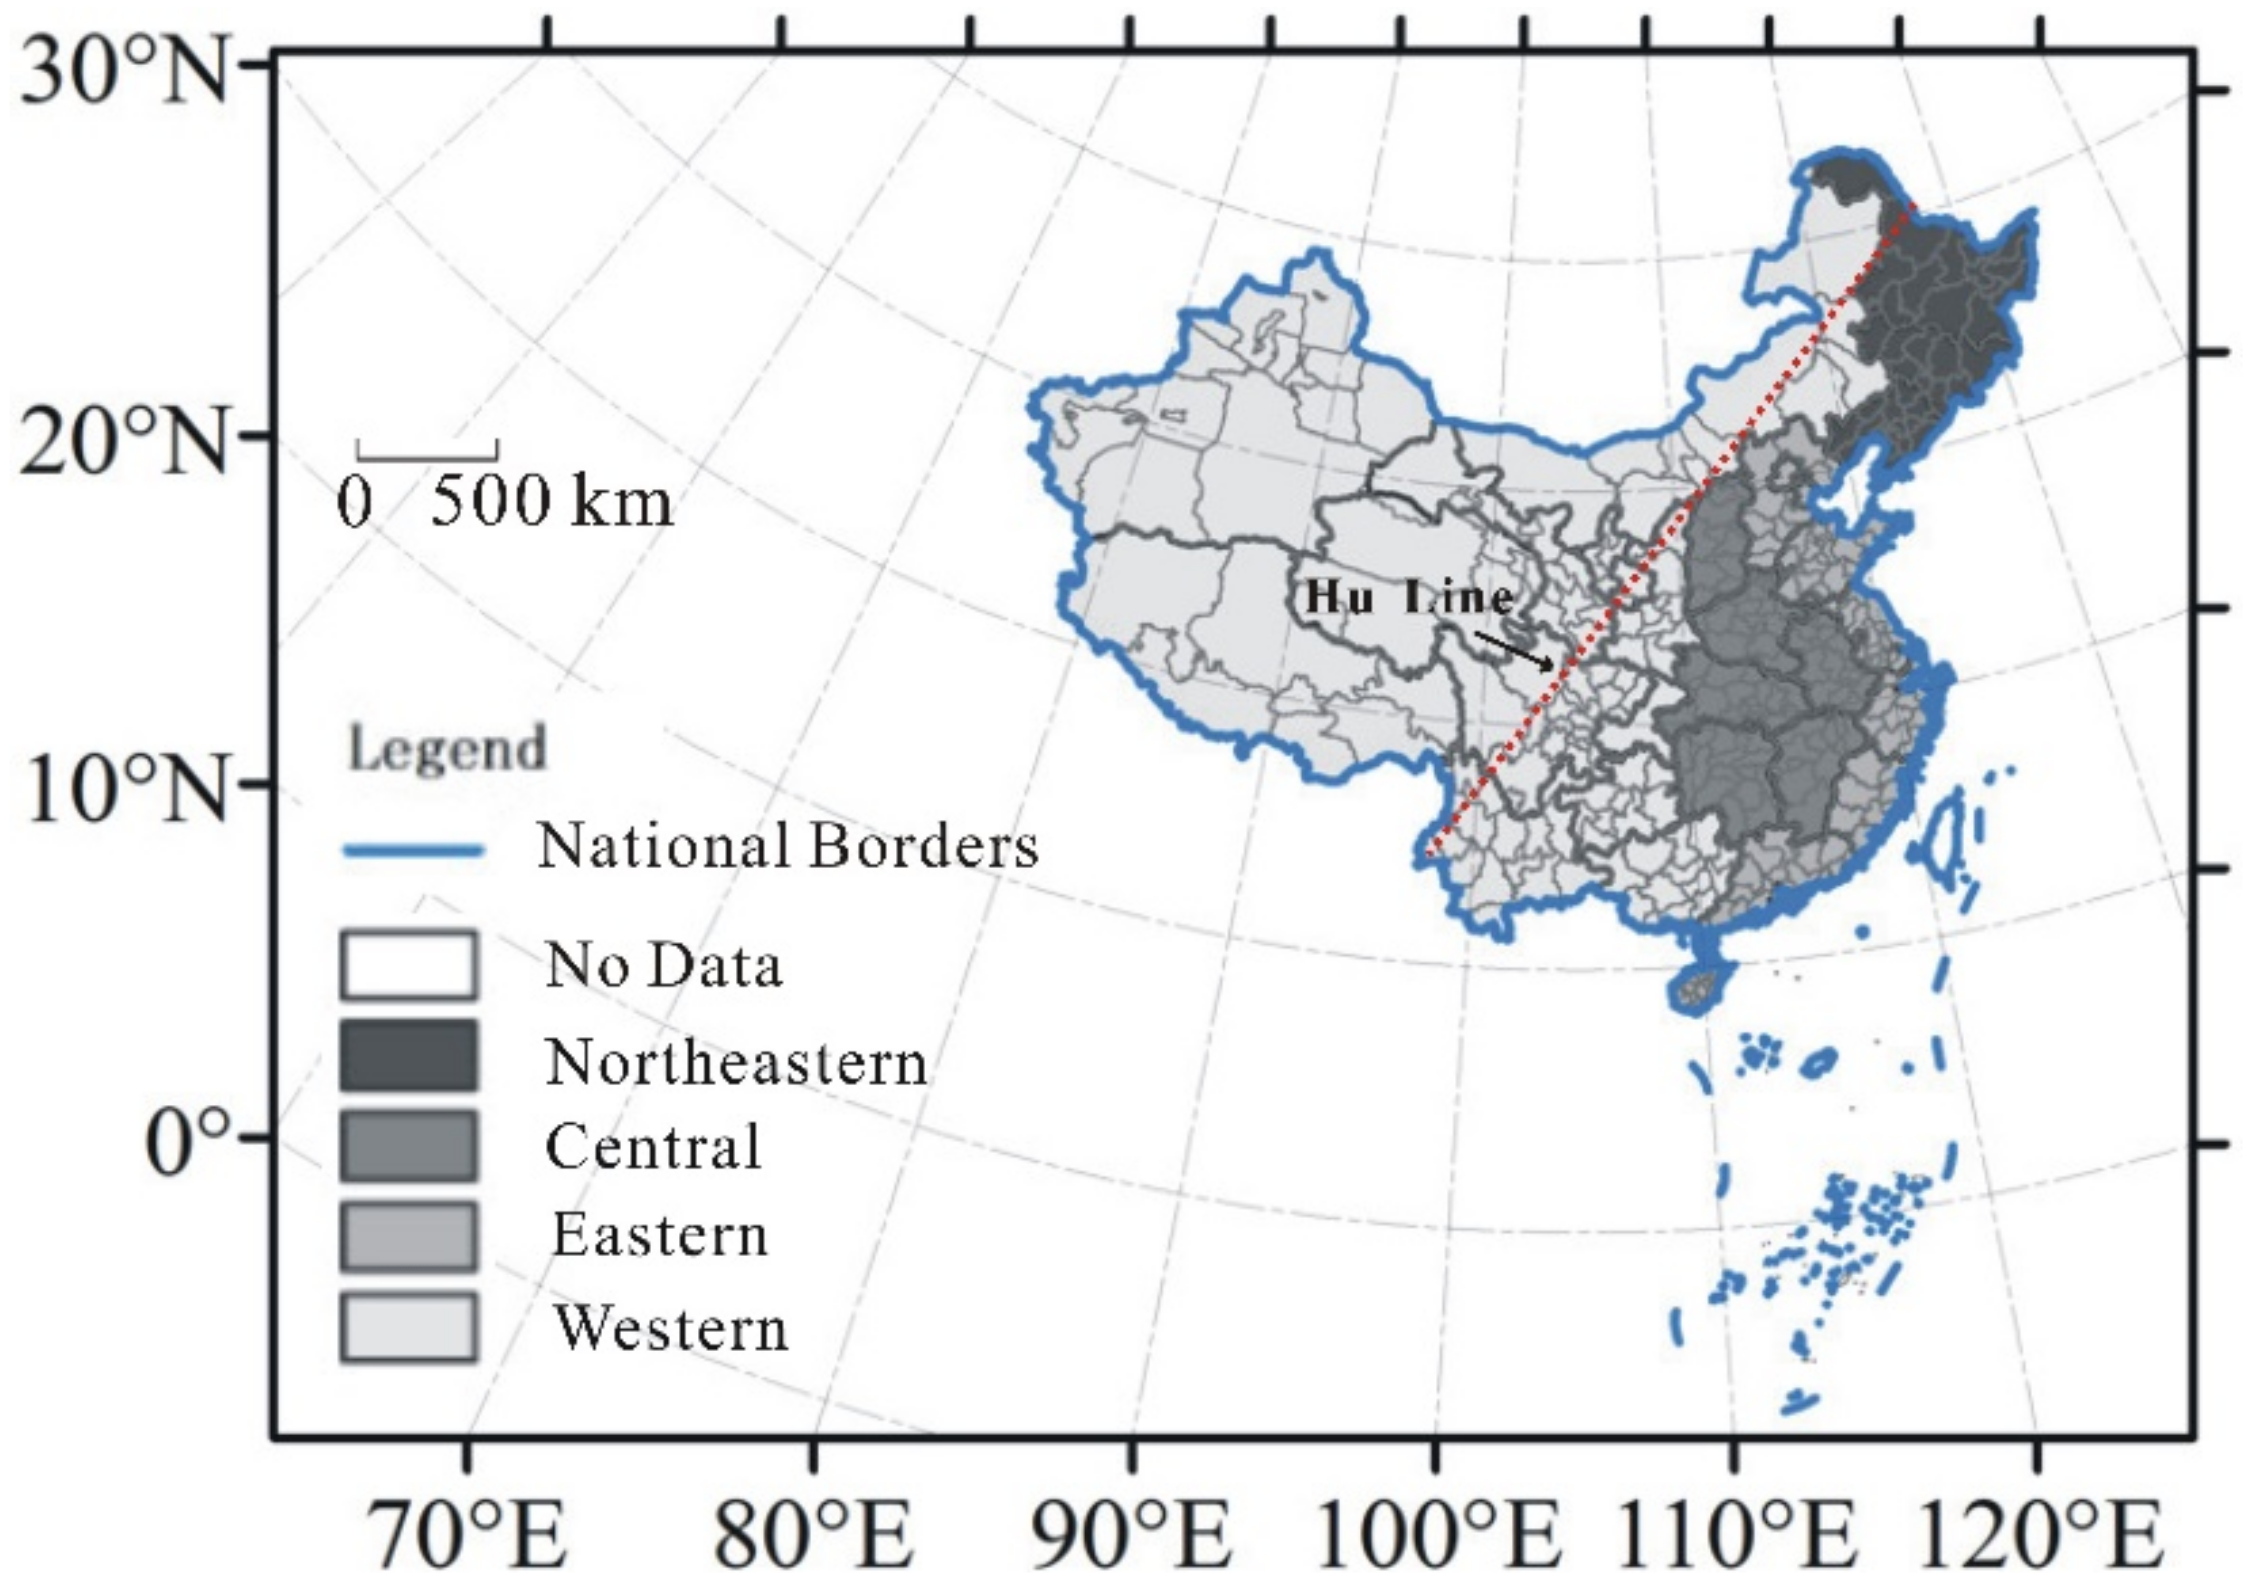
2.1.2. Study Subject
2.2. Methods
2.2.1. Connotation and Characterization of Adaptability
2.2.2. Computational Model of Center of Gravity Trajectory
3. Results
3.1. Spatial Distribution Characteristics of PD, ED, and GD
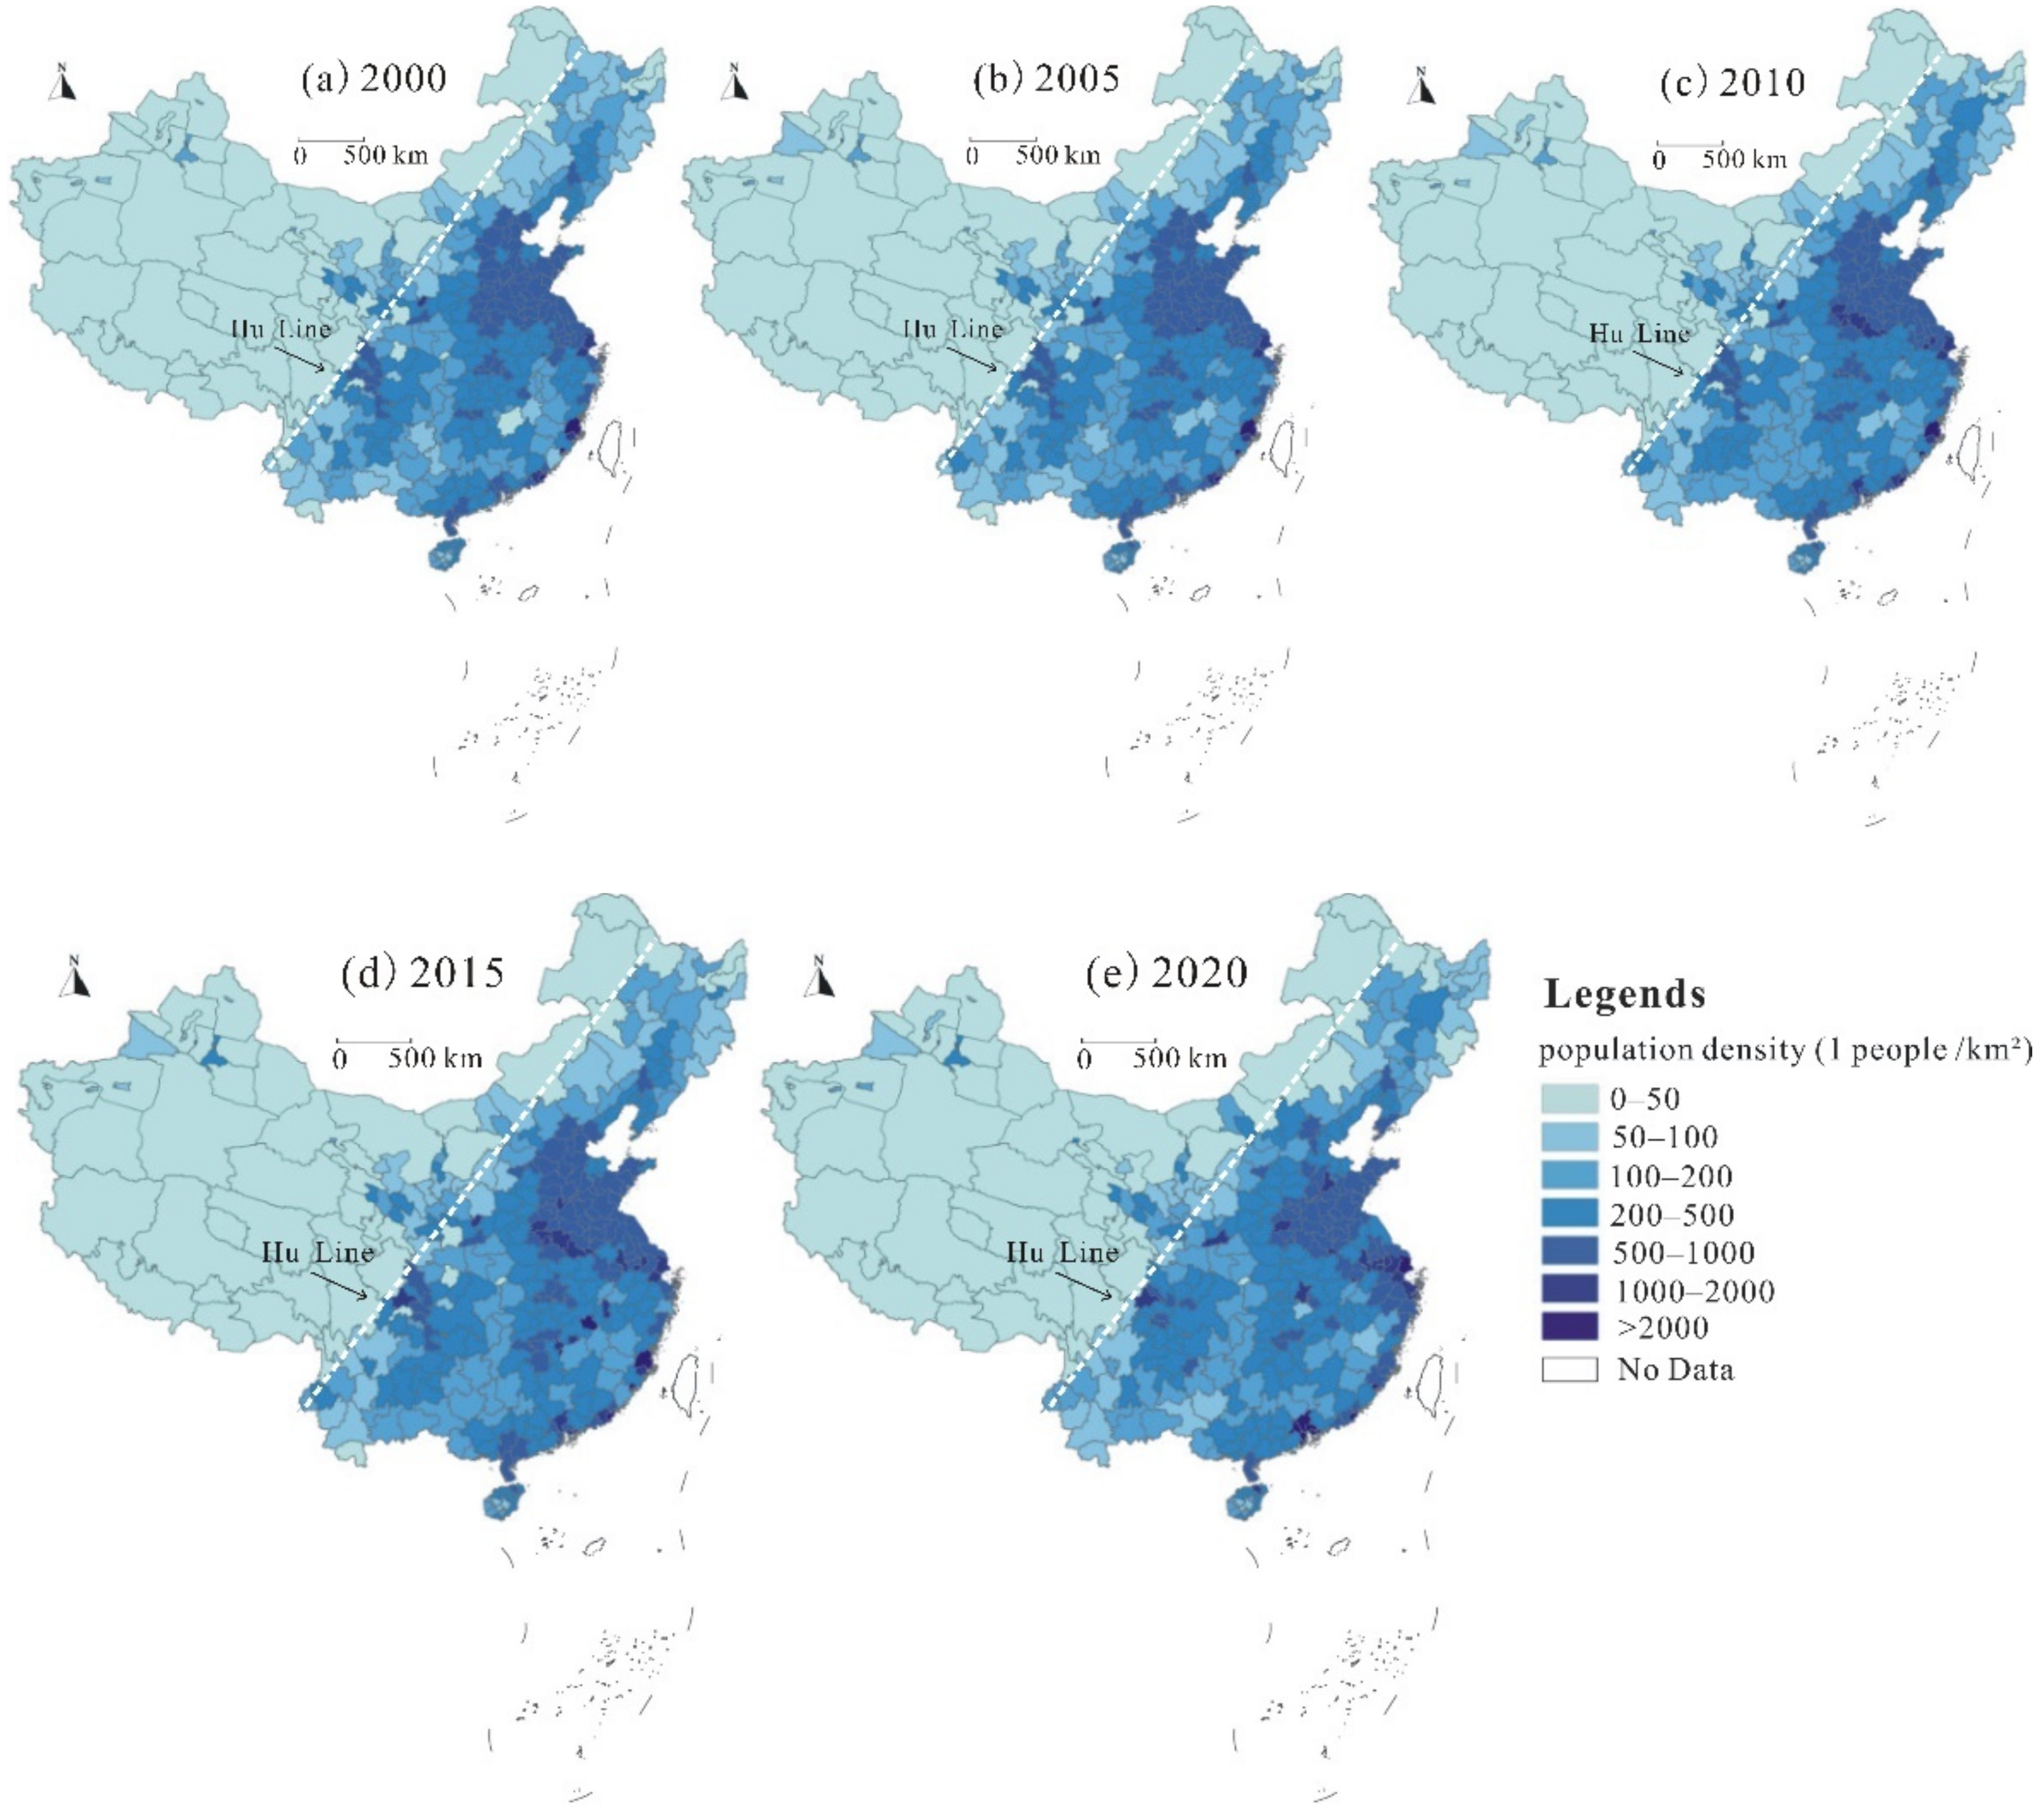
3.1.1. Population Density
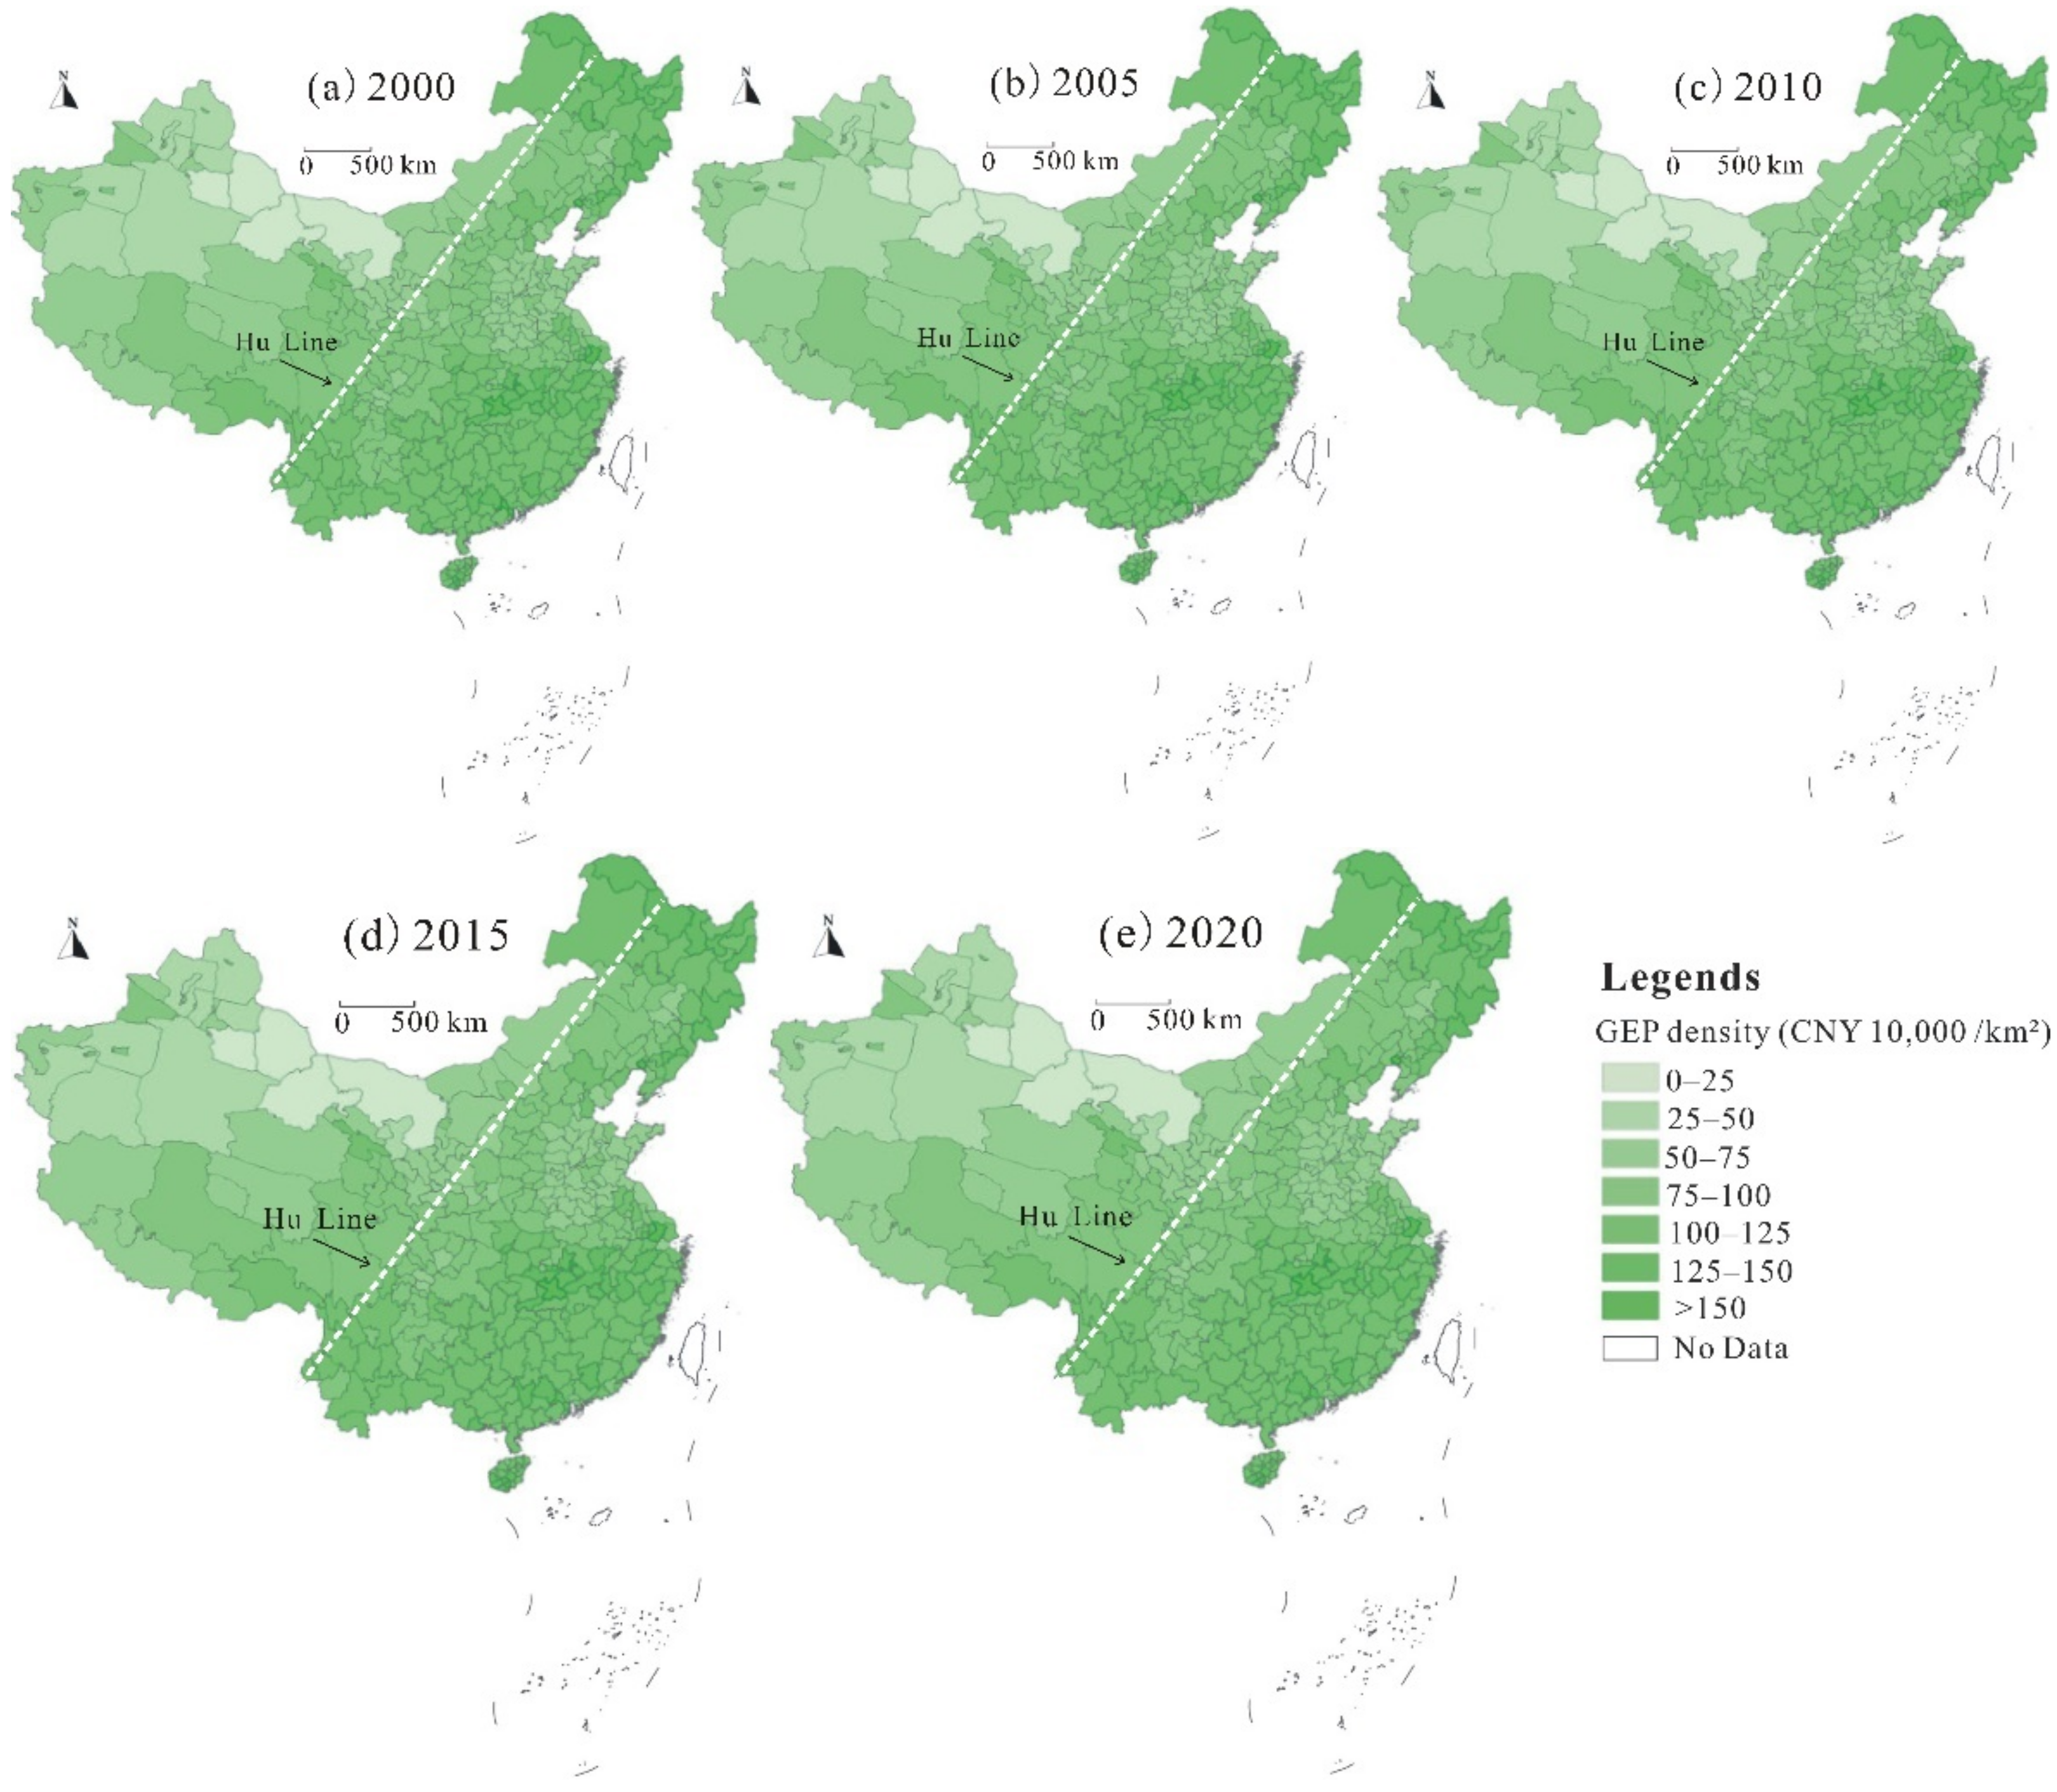
3.1.2. GEP Density
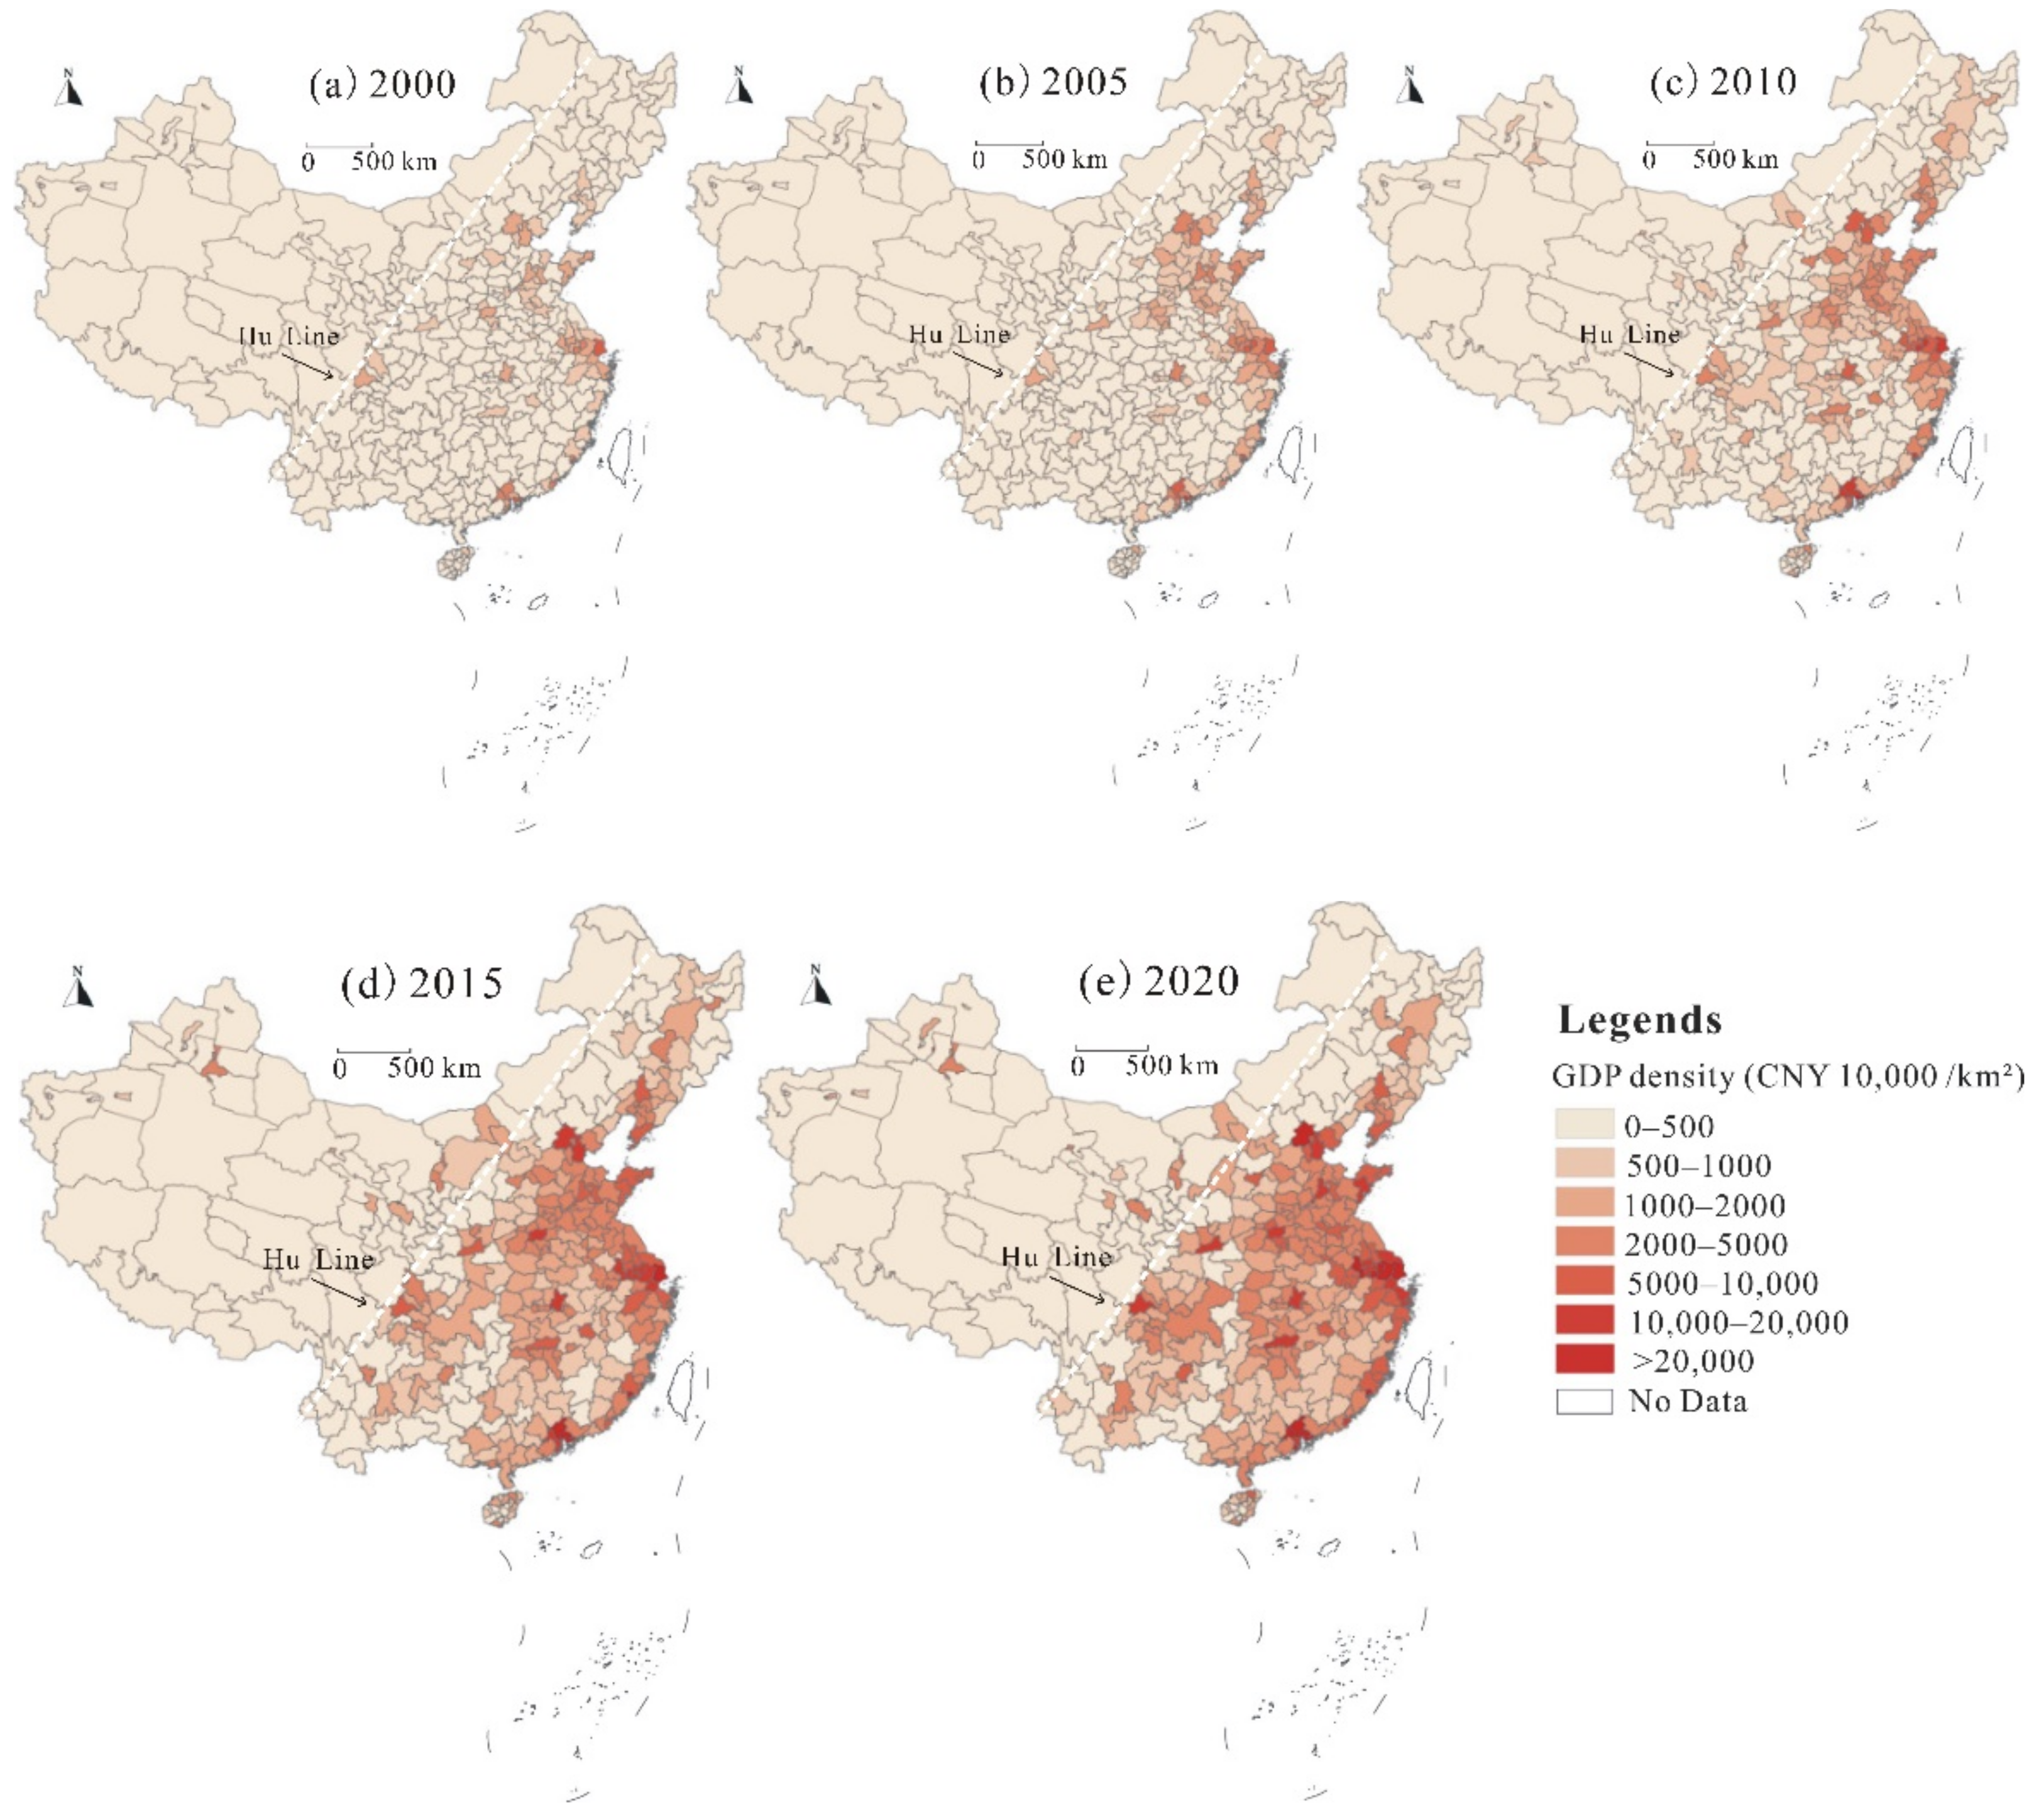
3.1.3. GDP Density
3.2. Spatial Adaptability between PD, ED, and GD
3.2.1. Location of the Center of Gravity and Its Moving Trajectory
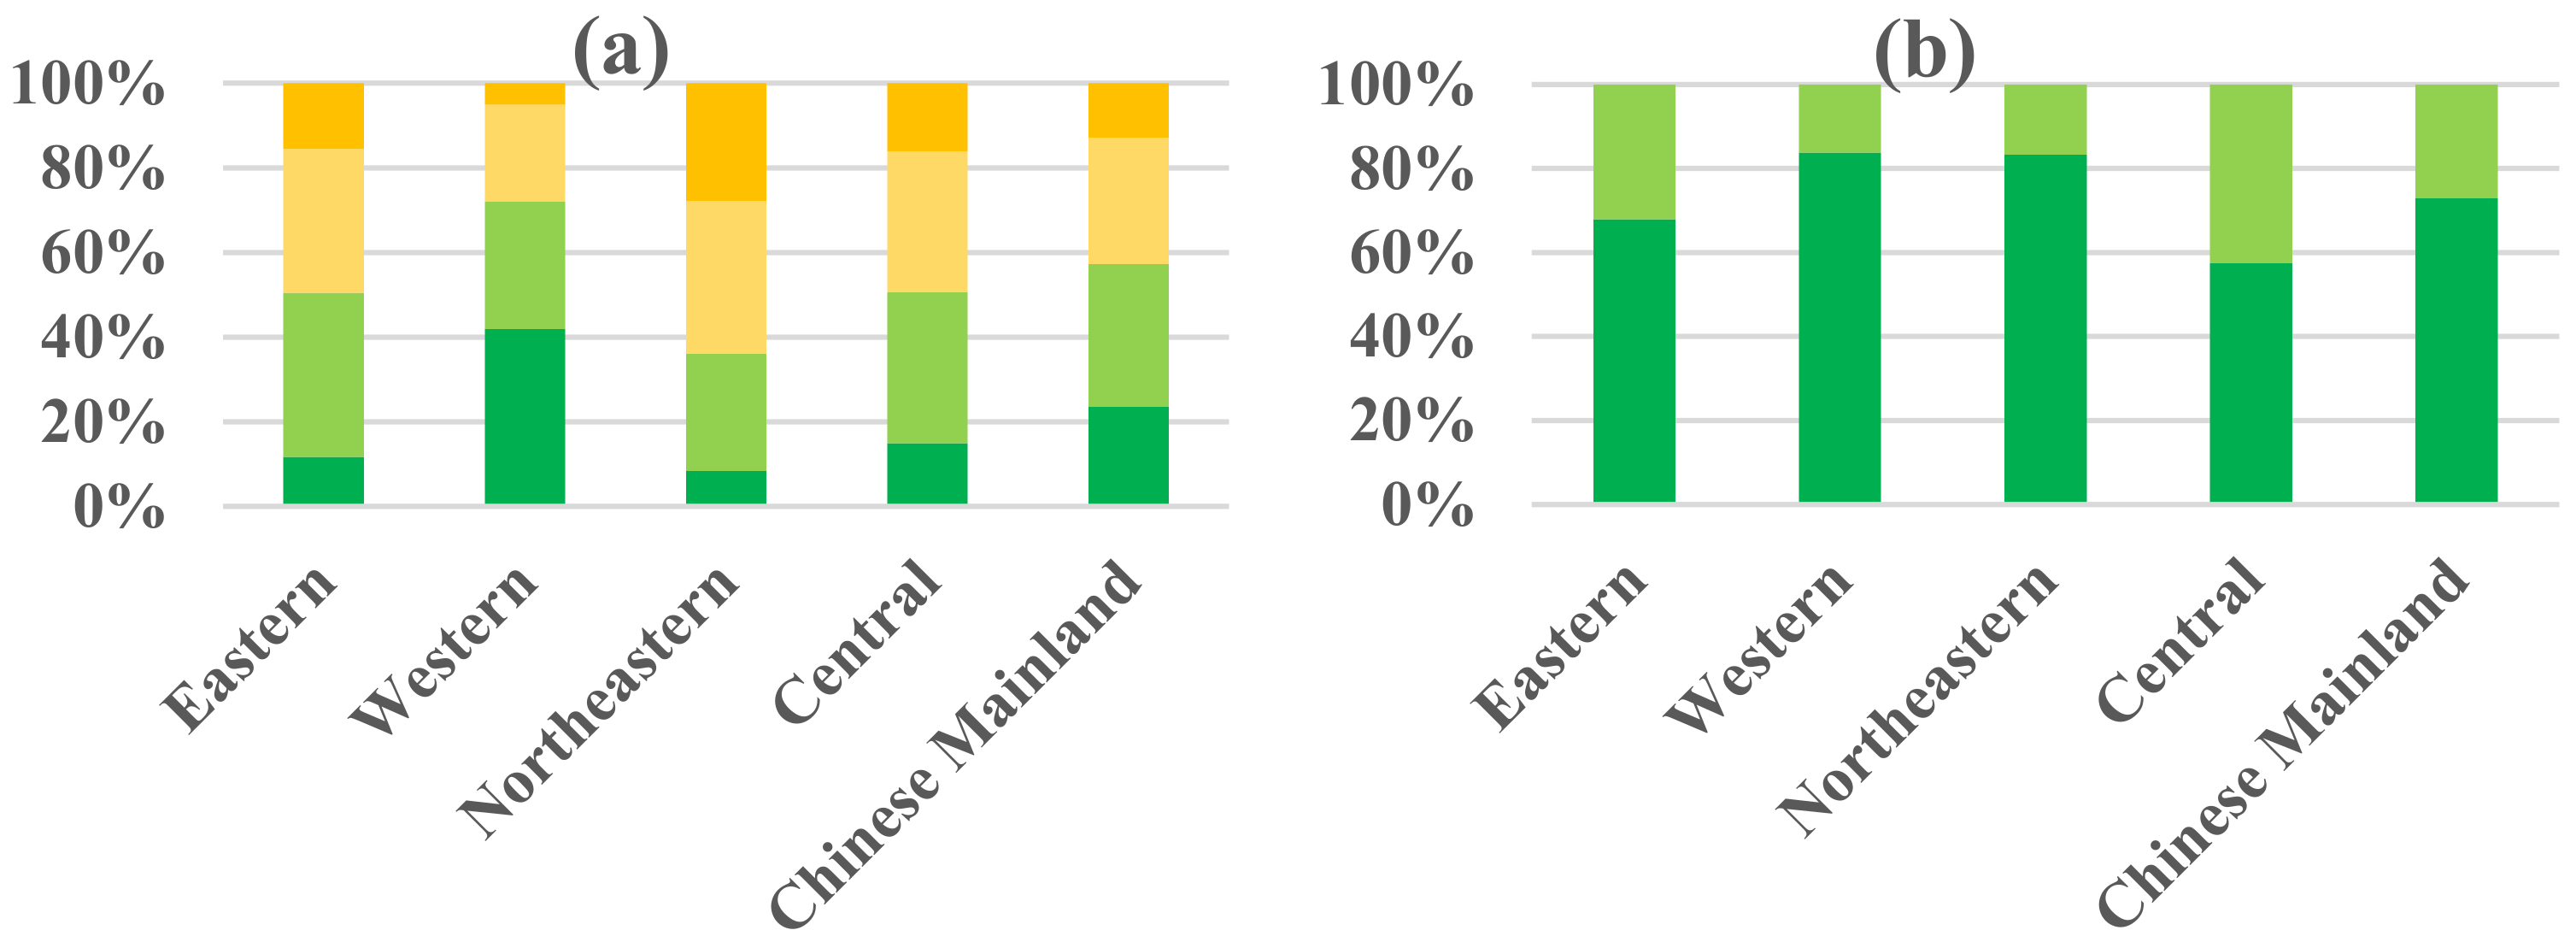
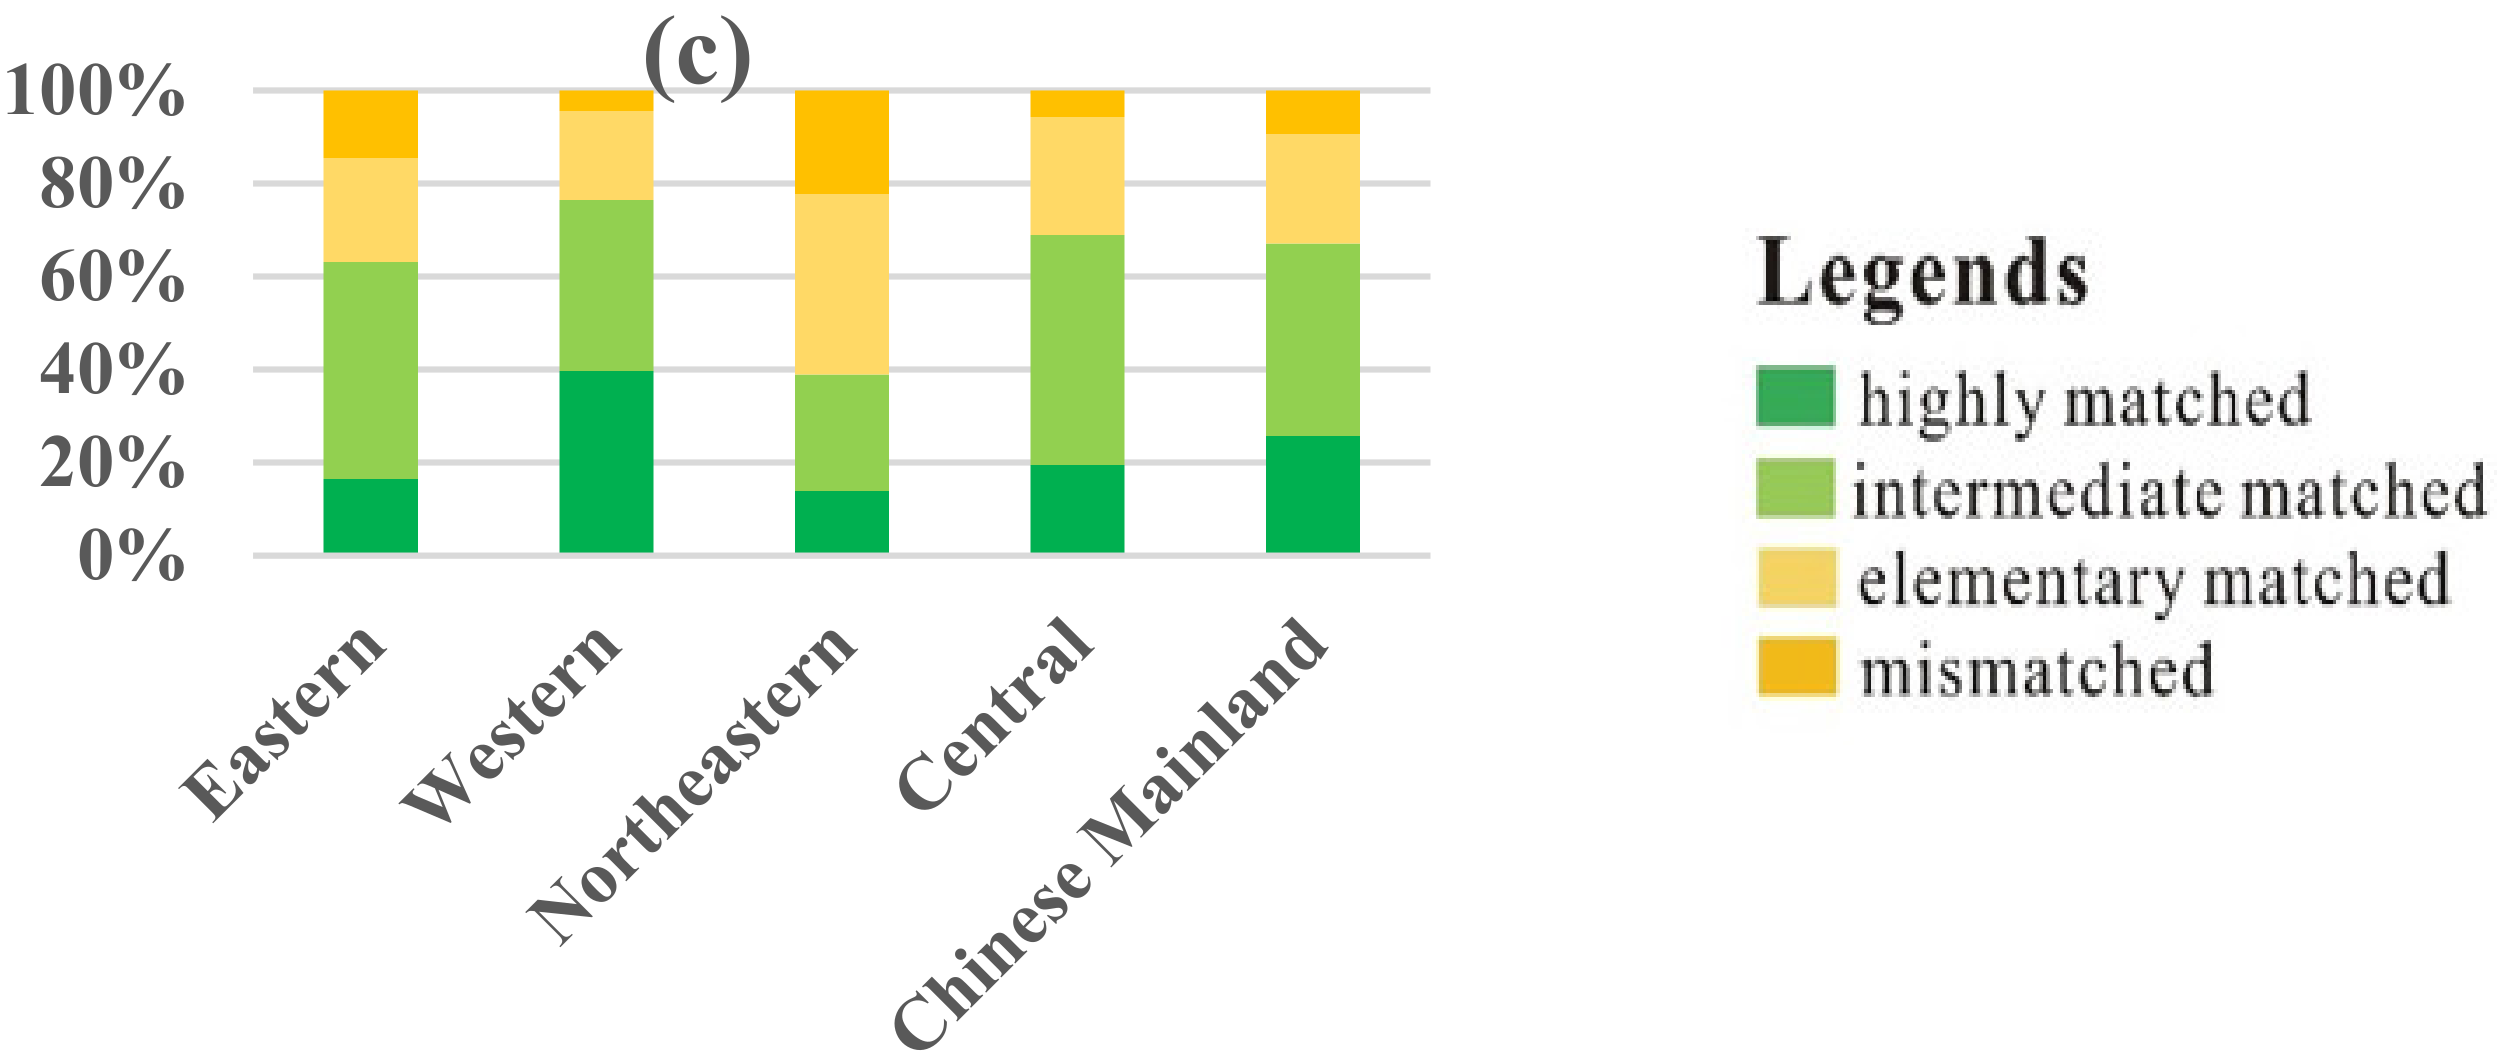
3.2.2. Matching Comparison of Different Regions
4. Discussion
4.1. Comparison with Previous Studies
4.2. Study Limitations
5. Conclusions and Policy Implications
Author Contributions
Funding
Institutional Review Board Statement
Informed Consent Statement
Data Availability Statement
Acknowledgments
Conflicts of Interest
References
- Zhang, J.P.; Huan, X.J.; Lü, H.Y.; Wang, C.; Shen, C.M.; He, K.Y.; Lü, Y.; Wu, N.Q. Crossing of the Hu line by Neolithic population in response to seesaw precipitation changes in China. Sci. Bull. 2022, 67, 844–852. [Google Scholar] [CrossRef]
- Henderson, J.V.; Nigmatulina, D.; Kriticos, S. Measuring Urban Economic Density; World Bank: Washington, DC, USA, 2018. [Google Scholar]
- Lei, W.Q.; Jiao, L.M.; Xu, Z.B.; Zhou, Z.Z.; Xu, G. Scaling of urban economic outputs: Insights both from urban population size and population mobility. Comput. Environ. Urban Syst. 2021, 88, 101657. [Google Scholar] [CrossRef]
- Tikoudis, I.; Farrow, K.; Mebiam, E.R.M.; Oueslati, W. Beyond average population density: Measuring sprawl with density-allocation indicators. Land Use Policy 2022, 112, 105832. [Google Scholar] [CrossRef]
- Wu, S.S.; Cheng, J.; Lo, S.M.; Chen, C.C.; Bai, Y.X. Coordinating urban construction and district-level population density for balanced development: An explorative structural equation modeling analysis on Shanghai. J. Clean. Prod. 2021, 312, 127646. [Google Scholar] [CrossRef]
- Hanberry, B.B. Global population densities, climate change, and the maximum monthly temperature threshold as a potential tipping point for high urban densities. Ecol. Indic. 2022, 135, 108512. [Google Scholar] [CrossRef]
- Szilárd, E.; Kornél, E. Application of North European characterisation factors, population density and distance-to-coast grid data for refreshing the Swedish human toxicity and ecotoxicity footprint analysis. Environ. Impact Assess. Rev. 2022, 92, 106686. [Google Scholar]
- Drechsel, P.; Gyiele, L.; Kunze, D.; Cofie, O. Population density, soil nutrient depletion, and economic growth in sub-Saharan Africa. Ecol. Econ. 2001, 38, 251–258. [Google Scholar] [CrossRef]
- Correia Filho, W.L.F.; de Oliveira-Júniorb, J.F.; dos Santos, C.T.B.; Batista, B.A.; de Barros Santiago, D.; da Silva Junior, C.A.; Teodoro, P.E.; da Costa, C.E.S.; da Silva, E.B.; Freire, F.M. The influence of urban expansion in the socio-economic, demographic, and environmental indicators in the City of Arapiraca-Alagoas, Brazil. Remote Sens. Appl. Soc. Environ. 2022, 25, 100662. [Google Scholar] [CrossRef]
- Rahman, M.M. Do population density, economic growth, energy use and exports adversely affect environmental quality in Asian populous countries? Renew. Sustain. Energy Rev. 2017, 77, 506–514. [Google Scholar] [CrossRef]
- Rahman, M.M.; Saidi, K.; Mbarek, M.B. Economic growth in South Asia: The role of CO2 emissions, population density and trade openness. Heliyon 2020, 6, e03903. [Google Scholar] [CrossRef]
- Rahman, M.M.; Alam, K. Clean energy, population density, urbanization and environmental pollution nexus: Evidence from Bangladesh. Renew. Energy 2021, 172, 1063–1072. [Google Scholar] [CrossRef]
- Willy, D.K.; Muyanga, M.; Jayne, T. Can economic and environmental benefts associated with agricultural intensifcation be sustained at high population densities? A farm level empirical analysis. Land Use Policy 2019, 81, 100–110. [Google Scholar] [CrossRef] [PubMed]
- Song, G.B.; Li, Z.H.; Bao, Y.Y.; Lu, H.Y.; Gao, J.X.; Wang, H.M.; Xu, T.; Cheng, Y. Spatial distribution regularity and influence factors of population density in the LRGR. Chin. Sci. Bull. 2007, S2, 90–97. [Google Scholar] [CrossRef]
- Liu, H.Y. It is difficult for China’s greening through large-scale afforestation to cross the Hu Line. Sci. China Earth Sci. 2019, 62, 1662–1664. [Google Scholar] [CrossRef]
- Chen, D.S.; Zhang, Y.T.; Yao, Y.; Hong, Y.; Guan, Q.F.; Tu, W. Exploring the spatial differentiation of urbanization on two sides of the Hu Huanyong Line—Based on nighttime light data and cellular automata. Appl. Geogr. 2019, 112, 102081. [Google Scholar] [CrossRef]
- Wang, F.H.; Liu, C.L.; Xu, Y.P. Analyzing Population Density Disparity in China with GIS-automated Regionalization: The Hu Line Revisited. Chin. Geogr. Sci. 2019, 29, 541–552. [Google Scholar] [CrossRef]
- Deng, W.; Cheng, Y.F.; Yu, H.; Peng, L.; Kong, B.; Hou, Y.T. Spatio-temporal characteristics of population and economy in transitional geographic space at the southern end of “Hu Huan-yong Line”. J. Mt. Sci. 2022, 19, 350–364. [Google Scholar] [CrossRef]
- Liang, L.W.; Chen, M.X.; Luo, X.Y.; Xian, Y. Changes pattern in the population and economic gravity centers since the Reform and Opening up in China: The widening gaps between the South and North. J. Clean. Prod. 2021, 310, 127379. [Google Scholar] [CrossRef]
- Zang, Z.; Zhang, Y.; Xi, X. Analysis of the Gross Ecosystem Product—Gross Domestic Product Synergistic States, Evolutionary Process, and Their Regional Contribution to the Chinese Mainland. Land 2022, 11, 732. [Google Scholar] [CrossRef]
- Ouyang, Z.Y.; Zheng, H.; Xiao, Y.; Polasky, S.; Liu, J.G.; Xu, W.H.; Wang, Q.; Zhang, L.; Xiao, Y.; Rao, E.M.; et al. Improvements in ecosystem services from investments in natural capital. Science 2016, 352, 1455–1459. [Google Scholar] [CrossRef]
- Chen, C.; Park, T.; Wang, X.; Piao, S.; Xu, B.; Chaturvedi, R.K.; Fuchs, R.; Brovkin, V.; Ciais, P.; Fensholt, R.; et al. China and India lead in greening of the world through land-use management. Nat. Sustain. 2019, 2, 122–129. [Google Scholar] [CrossRef] [PubMed]
- Liu, D.; Feng, Q.; Zhang, J.; Zhang, K.; Tian, J.J.; Xie, J. Ecosystem services analysis for sustainable agriculture expansion: Rice-fishco-culture system breaking through the Hu Line. Ecol. Indic. 2021, 133, 108385. [Google Scholar] [CrossRef]
- Liu, J.J.; Wang, J.; Zhai, T.L.; Li, Z.H.; Huang, L.Y.; Yuan, S.H. Gradient characteristics of China’s land use patterns and identifcation of the east-west natural-socio-economic transitional zone for national spatial planning. Land Use Policy 2021, 109, 105671. [Google Scholar] [CrossRef]
- Kong, X.S.; Fu, M.X.; Zhao, X.; Wang, J.; Jiang, P. Ecological effects of land-use change on two sides of the Hu Huanyong Line in China. Land Use Policy 2022, 113, 105895. [Google Scholar] [CrossRef]
- Jiang, H.Q.; Wu, W.J.; Wang, J.N.; Yang, W.S.; Gao, Y.M.; Duan, Y.; Ma, G.X.; Wu, C.S.; Shao, J.C. Mapping global value of terrestrial ecosystem services by countries. Ecosyst. Serv. 2021, 52, 101361. [Google Scholar] [CrossRef]
- Boons, F.A.A.; Baas, L.W. Types of industrial ecology: The problem of coordination. J. Clean. Prod. 1997, 5, 79–86. [Google Scholar] [CrossRef]
- Bennett, R.J.; Chorley, R.J. Environmental Systems: Philosophy, Analysis and Control; Princeton University Press: Princeton, NJ, USA, 1979. [Google Scholar]
- Shipp, A.J.; Jansen, K.J. Reinterpreting time in fit theory: Crafting and recrafting narratives of fit in medias res. Acad. Manag. Rev. 2011, 36, 76–101. [Google Scholar] [CrossRef]
- Zhang, G.L.; Zhang, N.; Liao, W.M. How do population and land urbanization affect CO2 emissions under gravity center change? A spatial econometric analysis. J. Clean. Prod. 2018, 202, 510–523. [Google Scholar] [CrossRef]


| Matching Levels | Distinguishing | Connotation Explanation |
|---|---|---|
| highly-matched | Grade difference = 0 | No grade difference and extremely high adaptability between the two |
| intermediate-matched | Grade difference = 1 | Small grade difference and high adaptability between the two |
| elementary-matched | Grade difference = 2 | Medium grade difference and general adaptability between the two |
| mismatched | Grade difference = 3 | Large grade difference and low adaptability between the two |
| Region | Index | Position | 2000 | 2005 | 2010 | 2015 | 2020 |
|---|---|---|---|---|---|---|---|
| eastern | population density | Longitude | 117°08′ E | 117°00′ E | 116°58′ E | 116°56′ E | 116°22′ E |
| Latitude | 29°55′ N | 29°45′ N | 29°41′ N | 29°39′ N | 28°49′ N | ||
| GEP density | Longitude | 115°37′ E | 115°37′ E | 115°37′ E | 115°37′ E | 115°37′ E | |
| Latitude | 27°40′ N | 27°41′ N | 27°40′ N | 27°40′ N | 27°41′ N | ||
| GDP density | Longitude | 116°56′ E | 116°53′ E | 116°43′ E | 116°41′ E | 116°39′ E | |
| Latitude | 29°19′ N | 29°17′ N | 29°10′ N | 29°05′ N | 28°39′ N | ||
| central | population density | Longitude | 114°18′ E | 114°19′ E | 114°19′ E | 114°22′ E | 114°03′ E |
| Latitude | 31°05′ N | 31°06′ N | 31°07′ N | 31°08′ N | 31°56′ N | ||
| GEP density | Longitude | 113°42′ E | 113°41′ E | 113°41′ E | 113°41′ E | 113°41′ E | |
| Latitude | 31°05′ N | 31°06′ N | 31°06′ N | 31°06′ N | 31°06′ N | ||
| GDP density | Longitude | 113°47′ E | 113°49′ E | 113°52′ E | 113°55′ E | 113°59′ E | |
| Latitude | 31°51′ N | 31°58′ N | 31°56′ N | 31°42′ N | 31°45′ N | ||
| northeastern | population density | Longitude | 124°08′ E | 124°10′ E | 124°10′ E | 124°08′ E | 123°51′ E |
| Latitude | 43°01′ N | 43°03′ N | 43°03′ N | 43°01′ N | 42°40′ N | ||
| GEP density | Longitude | 125°21′ E | 125°20′ E | 125°20′ E | 125°20′ E | 125°20′ E | |
| Latitude | 44°33′ N | 44°32′ N | 44°32′ N | 44°31′ N | 44°31′ N | ||
| GDP density | Longitude | 123°46′ E | 123°42′ E | 123°41′ E | 123°45′ E | 123°36′ E | |
| Latitude | 42°35′ N | 42°42′ N | 42°30′ N | 42°33′ N | 42°23′ N | ||
| western | population density | Longitude | 103°40′ E | 103°25′ E | 103°23′ E | 103°30′ E | 103°08′ E |
| Latitude | 32°03′ N | 32°04′ N | 32°06′ N | 31°57′ N | 32°07′ N | ||
| GEP density | Longitude | 102°45′ E | 102°46′ E | 102°47′ E | 102°50′ E | 102°50′ E | |
| Latitude | 32°06′ N | 32°06′ N | 32°05′ N | 32°03′ N | 32°04′ N | ||
| GDP density | Longitude | 101°42′ E | 101°52′ E | 102°49′ E | 103°18′ E | 102°24′ E | |
| Latitude | 33°26′ N | 33°44′ N | 34°06′ N | 33°02′ N | 33°30′ N | ||
| Chinese Mainland | population density | Longitude | 114°15′ E | 114°06′ E | 114°04′ E | 114°05′ E | 113°54′ E |
| Latitude | 31°24′ N | 31°18′ N | 31°17′ N | 31°11′ N | 30°47′ N | ||
| GEP density | Longitude | 111°59′ E | 111°59′ E | 111°58′ E | 111°59 E′ | 111°59′ E | |
| Latitude | 31°56′ N | 31°56′ N | 31°56′ N | 31°55′ N | 31°55′ N | ||
| GDP density | Longitude | 115°05′ E | 115°10′ E | 115°02′ E | 114°55′ E | 114°36′ E | |
| Latitude | 31°05′ N | 31°01′ N | 30°58′ N | 30°47′ N | 30°13′ N |
| Region | Index | PD | ED | GD |
|---|---|---|---|---|
| eastern | direction | southwest | southwest | southwest |
| Distance (km) | 148.84 | 1.53 | 79.61 | |
| northeastern | direction | southwest | southwest | southwest |
| Distance (km) | 50.18 | 3.62 | 37.42 | |
| central | direction | northwest | northwest | southeast |
| Distance (km) | 99.28 | 1.96 | 24.7 | |
| western | direction | northwest | southeast | northeastern |
| Distance (km) | 59.87 | 10.04 | 90.65 | |
| Chinese Mainland | direction | southwest | - | southwest |
| Distance (km) | 79.39 | - | 109.72 |
Publisher’s Note: MDPI stays neutral with regard to jurisdictional claims in published maps and institutional affiliations. |
© 2022 by the authors. Licensee MDPI, Basel, Switzerland. This article is an open access article distributed under the terms and conditions of the Creative Commons Attribution (CC BY) license (https://creativecommons.org/licenses/by/4.0/).
Share and Cite
Zang, Z.; Ren, Q.; Zhang, Y. Analysis of the Spatial Adaptability of Gross Ecosystem Production, Gross Domestic Production, and Population Density in Chinese Mainland. Land 2022, 11, 1295. https://doi.org/10.3390/land11081295
Zang Z, Ren Q, Zhang Y. Analysis of the Spatial Adaptability of Gross Ecosystem Production, Gross Domestic Production, and Population Density in Chinese Mainland. Land. 2022; 11(8):1295. https://doi.org/10.3390/land11081295
Chicago/Turabian StyleZang, Zheng, Qilong Ren, and Yuqing Zhang. 2022. "Analysis of the Spatial Adaptability of Gross Ecosystem Production, Gross Domestic Production, and Population Density in Chinese Mainland" Land 11, no. 8: 1295. https://doi.org/10.3390/land11081295