
Land Use Change and Prediction for Valuating Carbon Sequestration in Viti Levu Island, Fiji

 , , , ,
  ,
,  and
and
Abstract
:1. Introduction
2. Materials and Methods
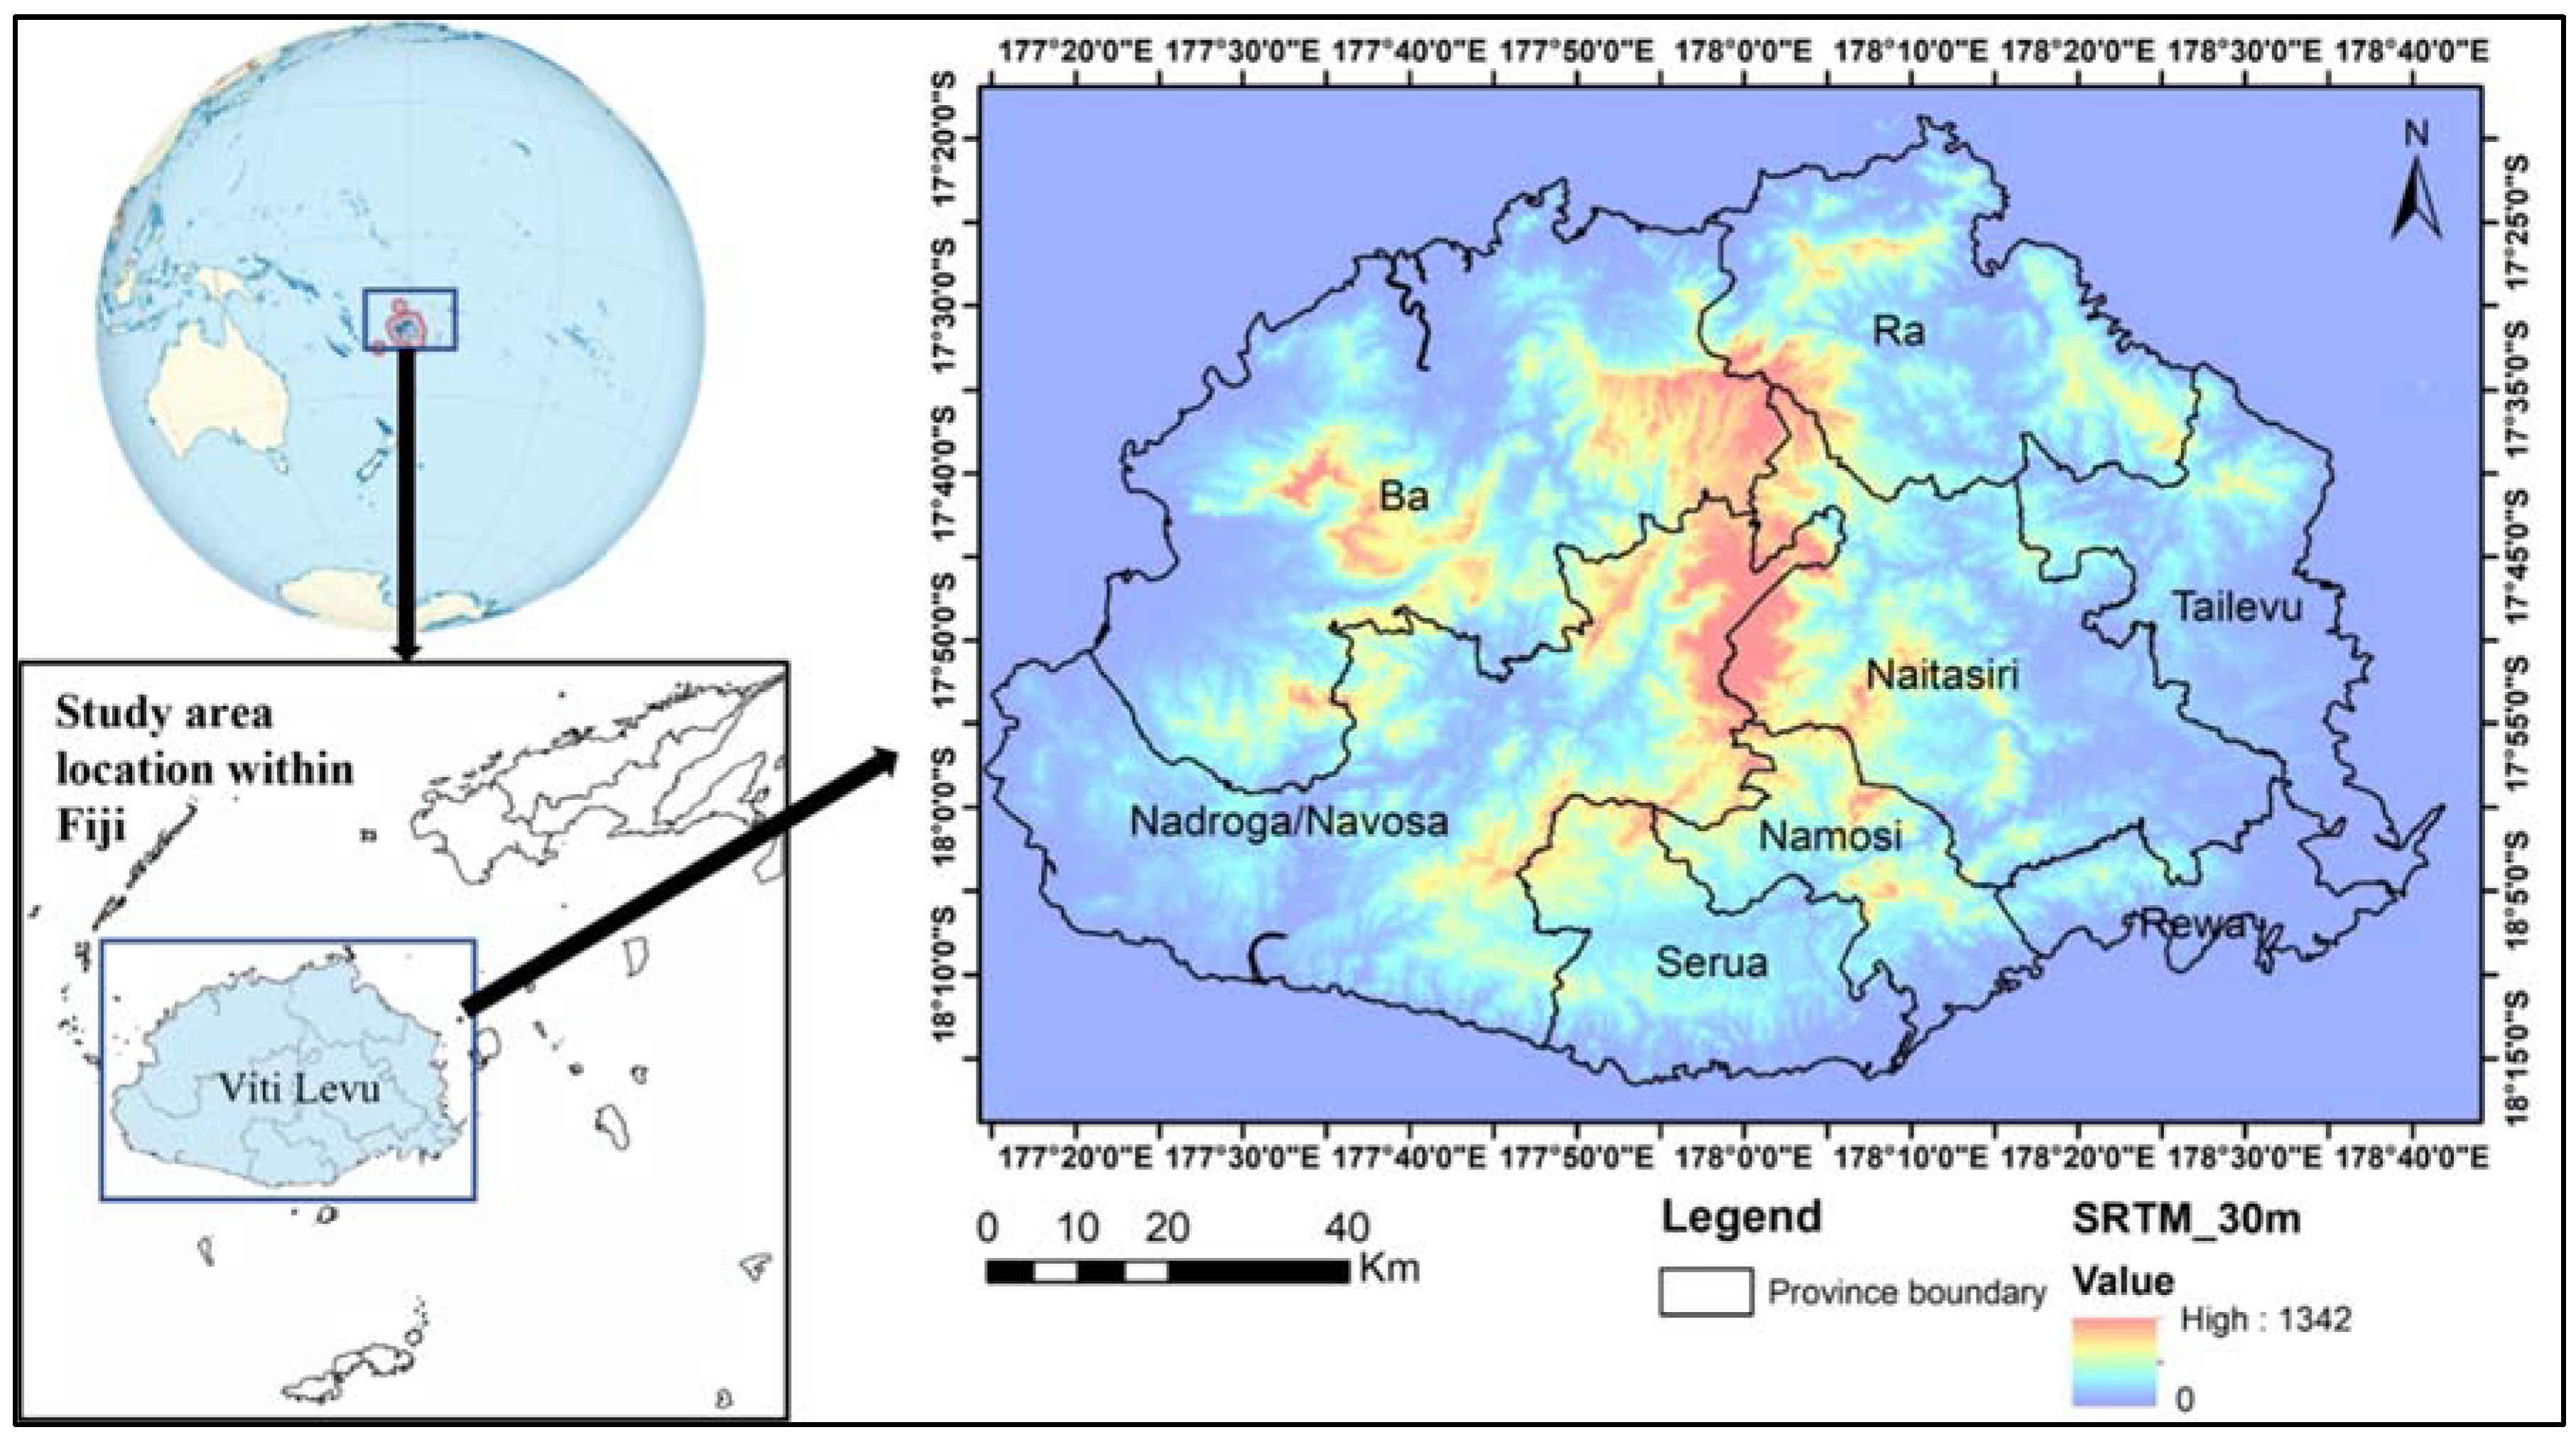
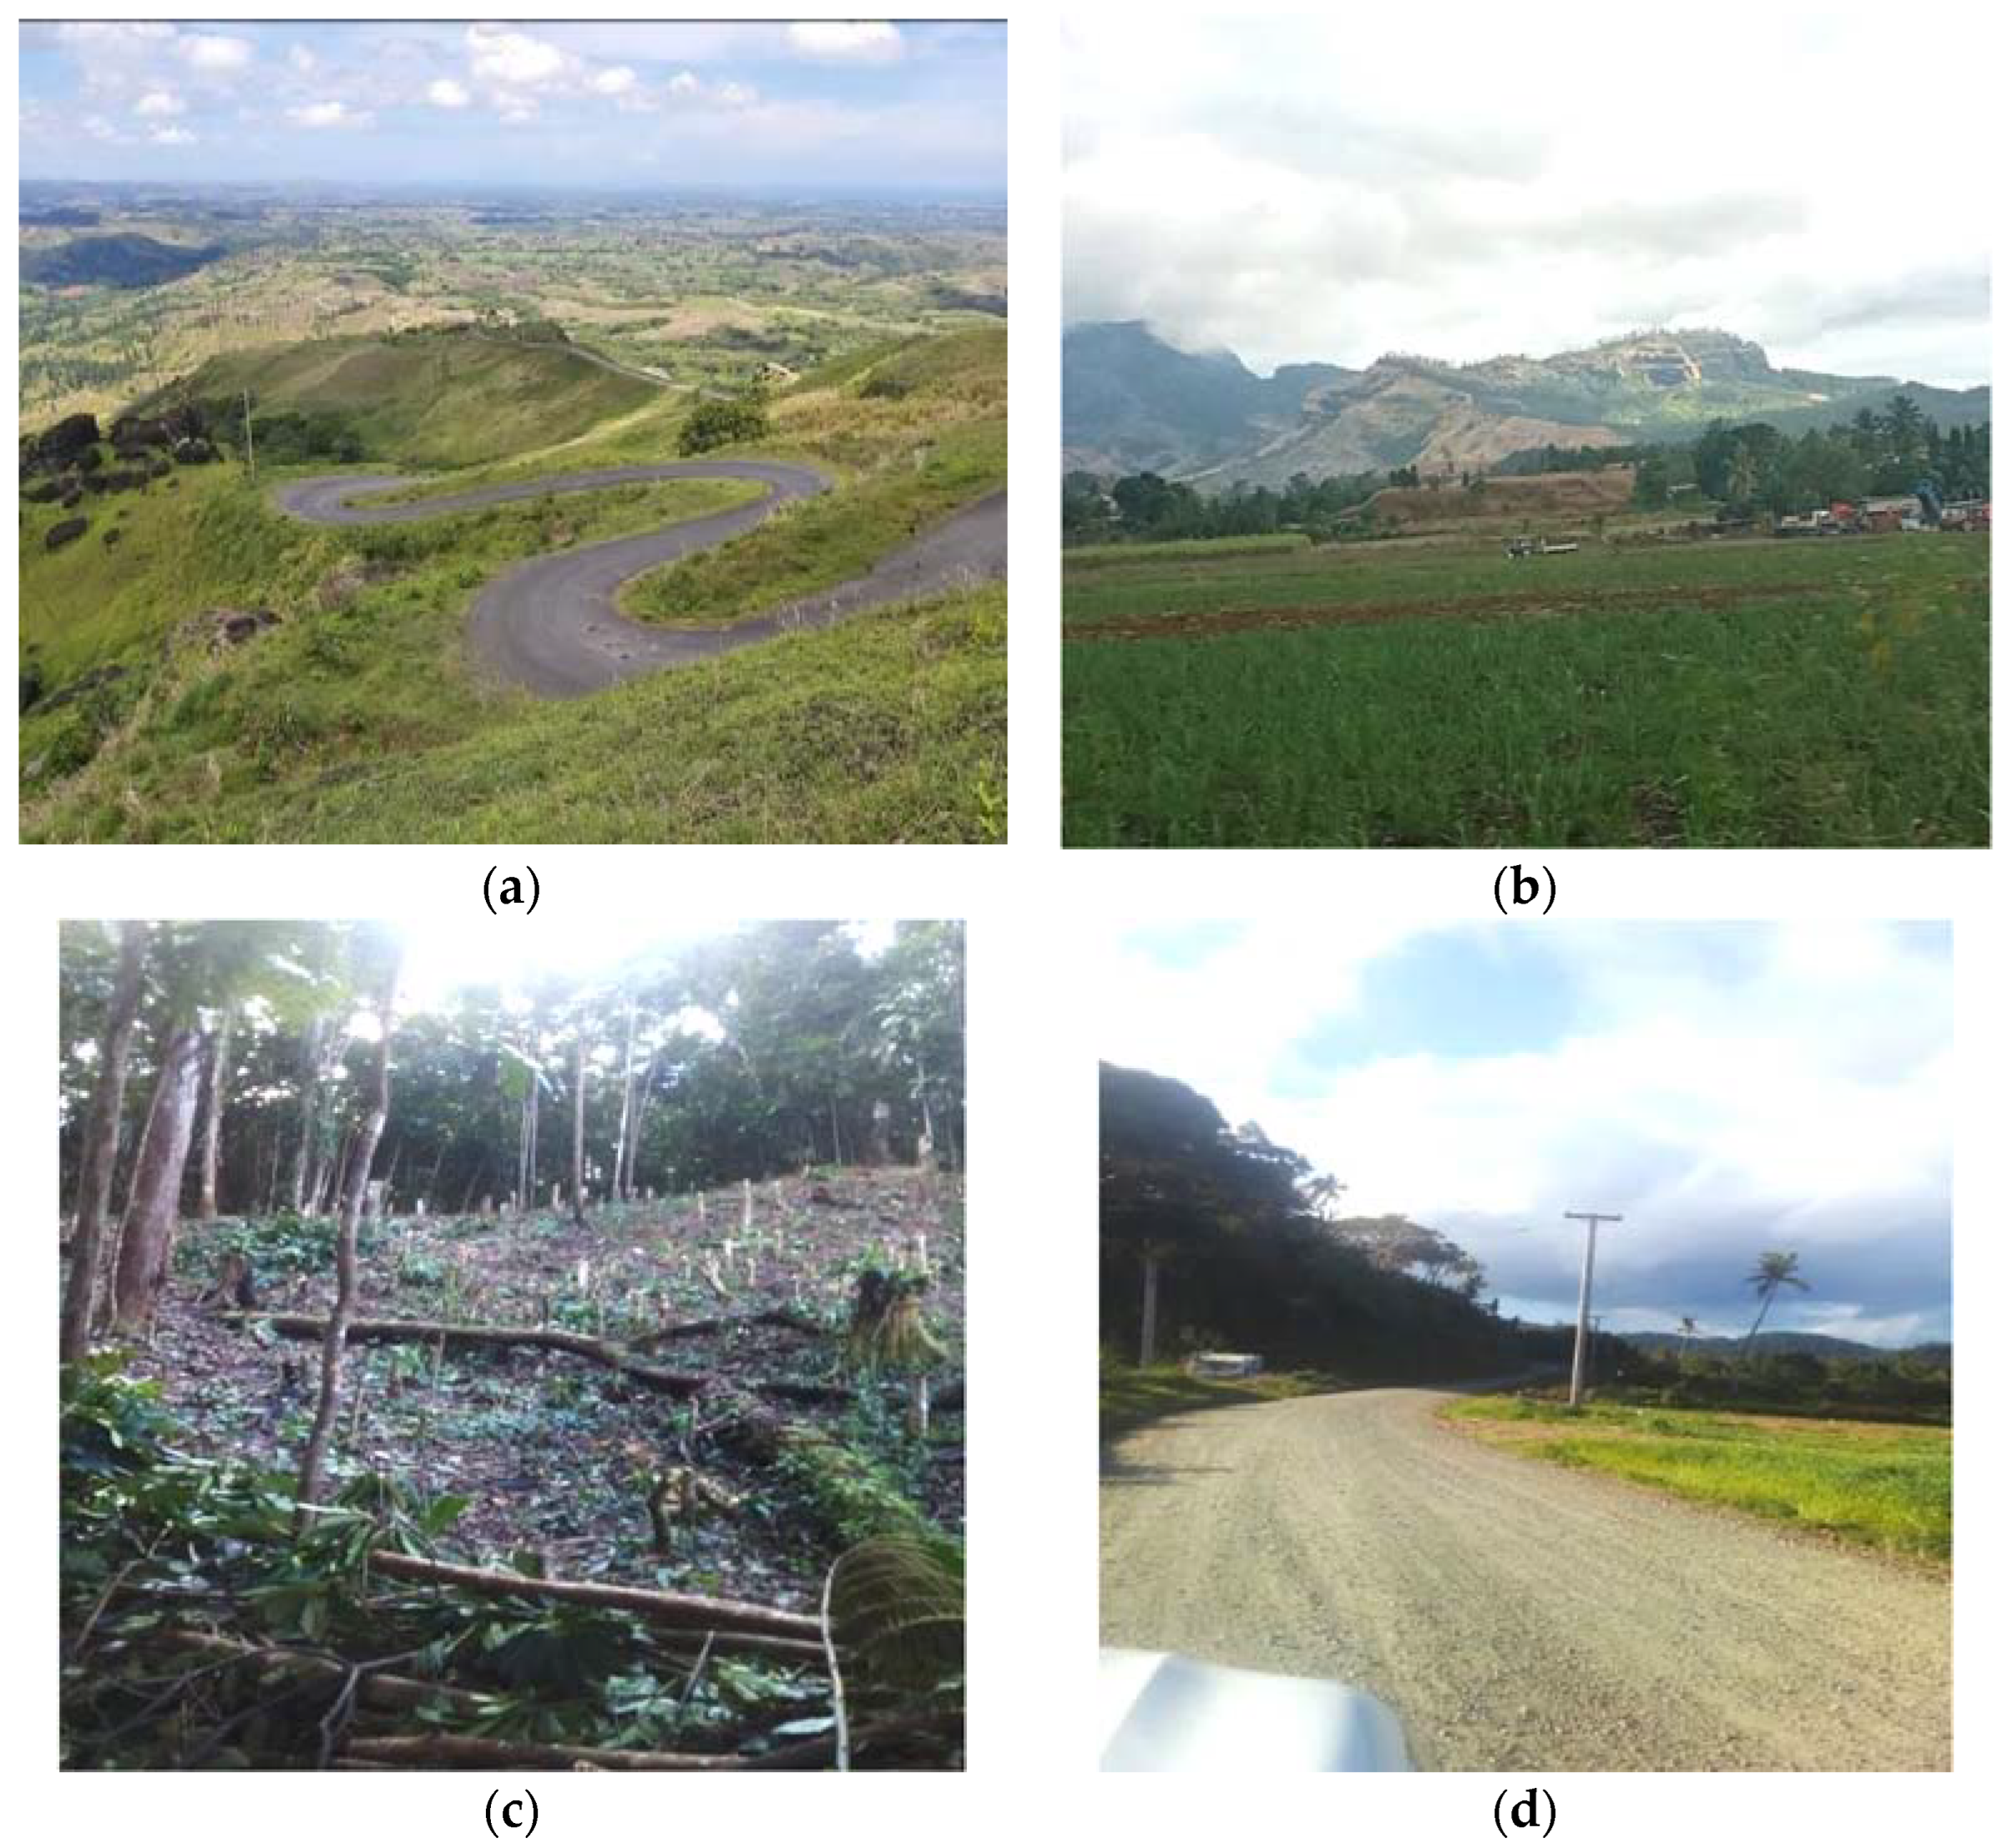
2.1. Study Area
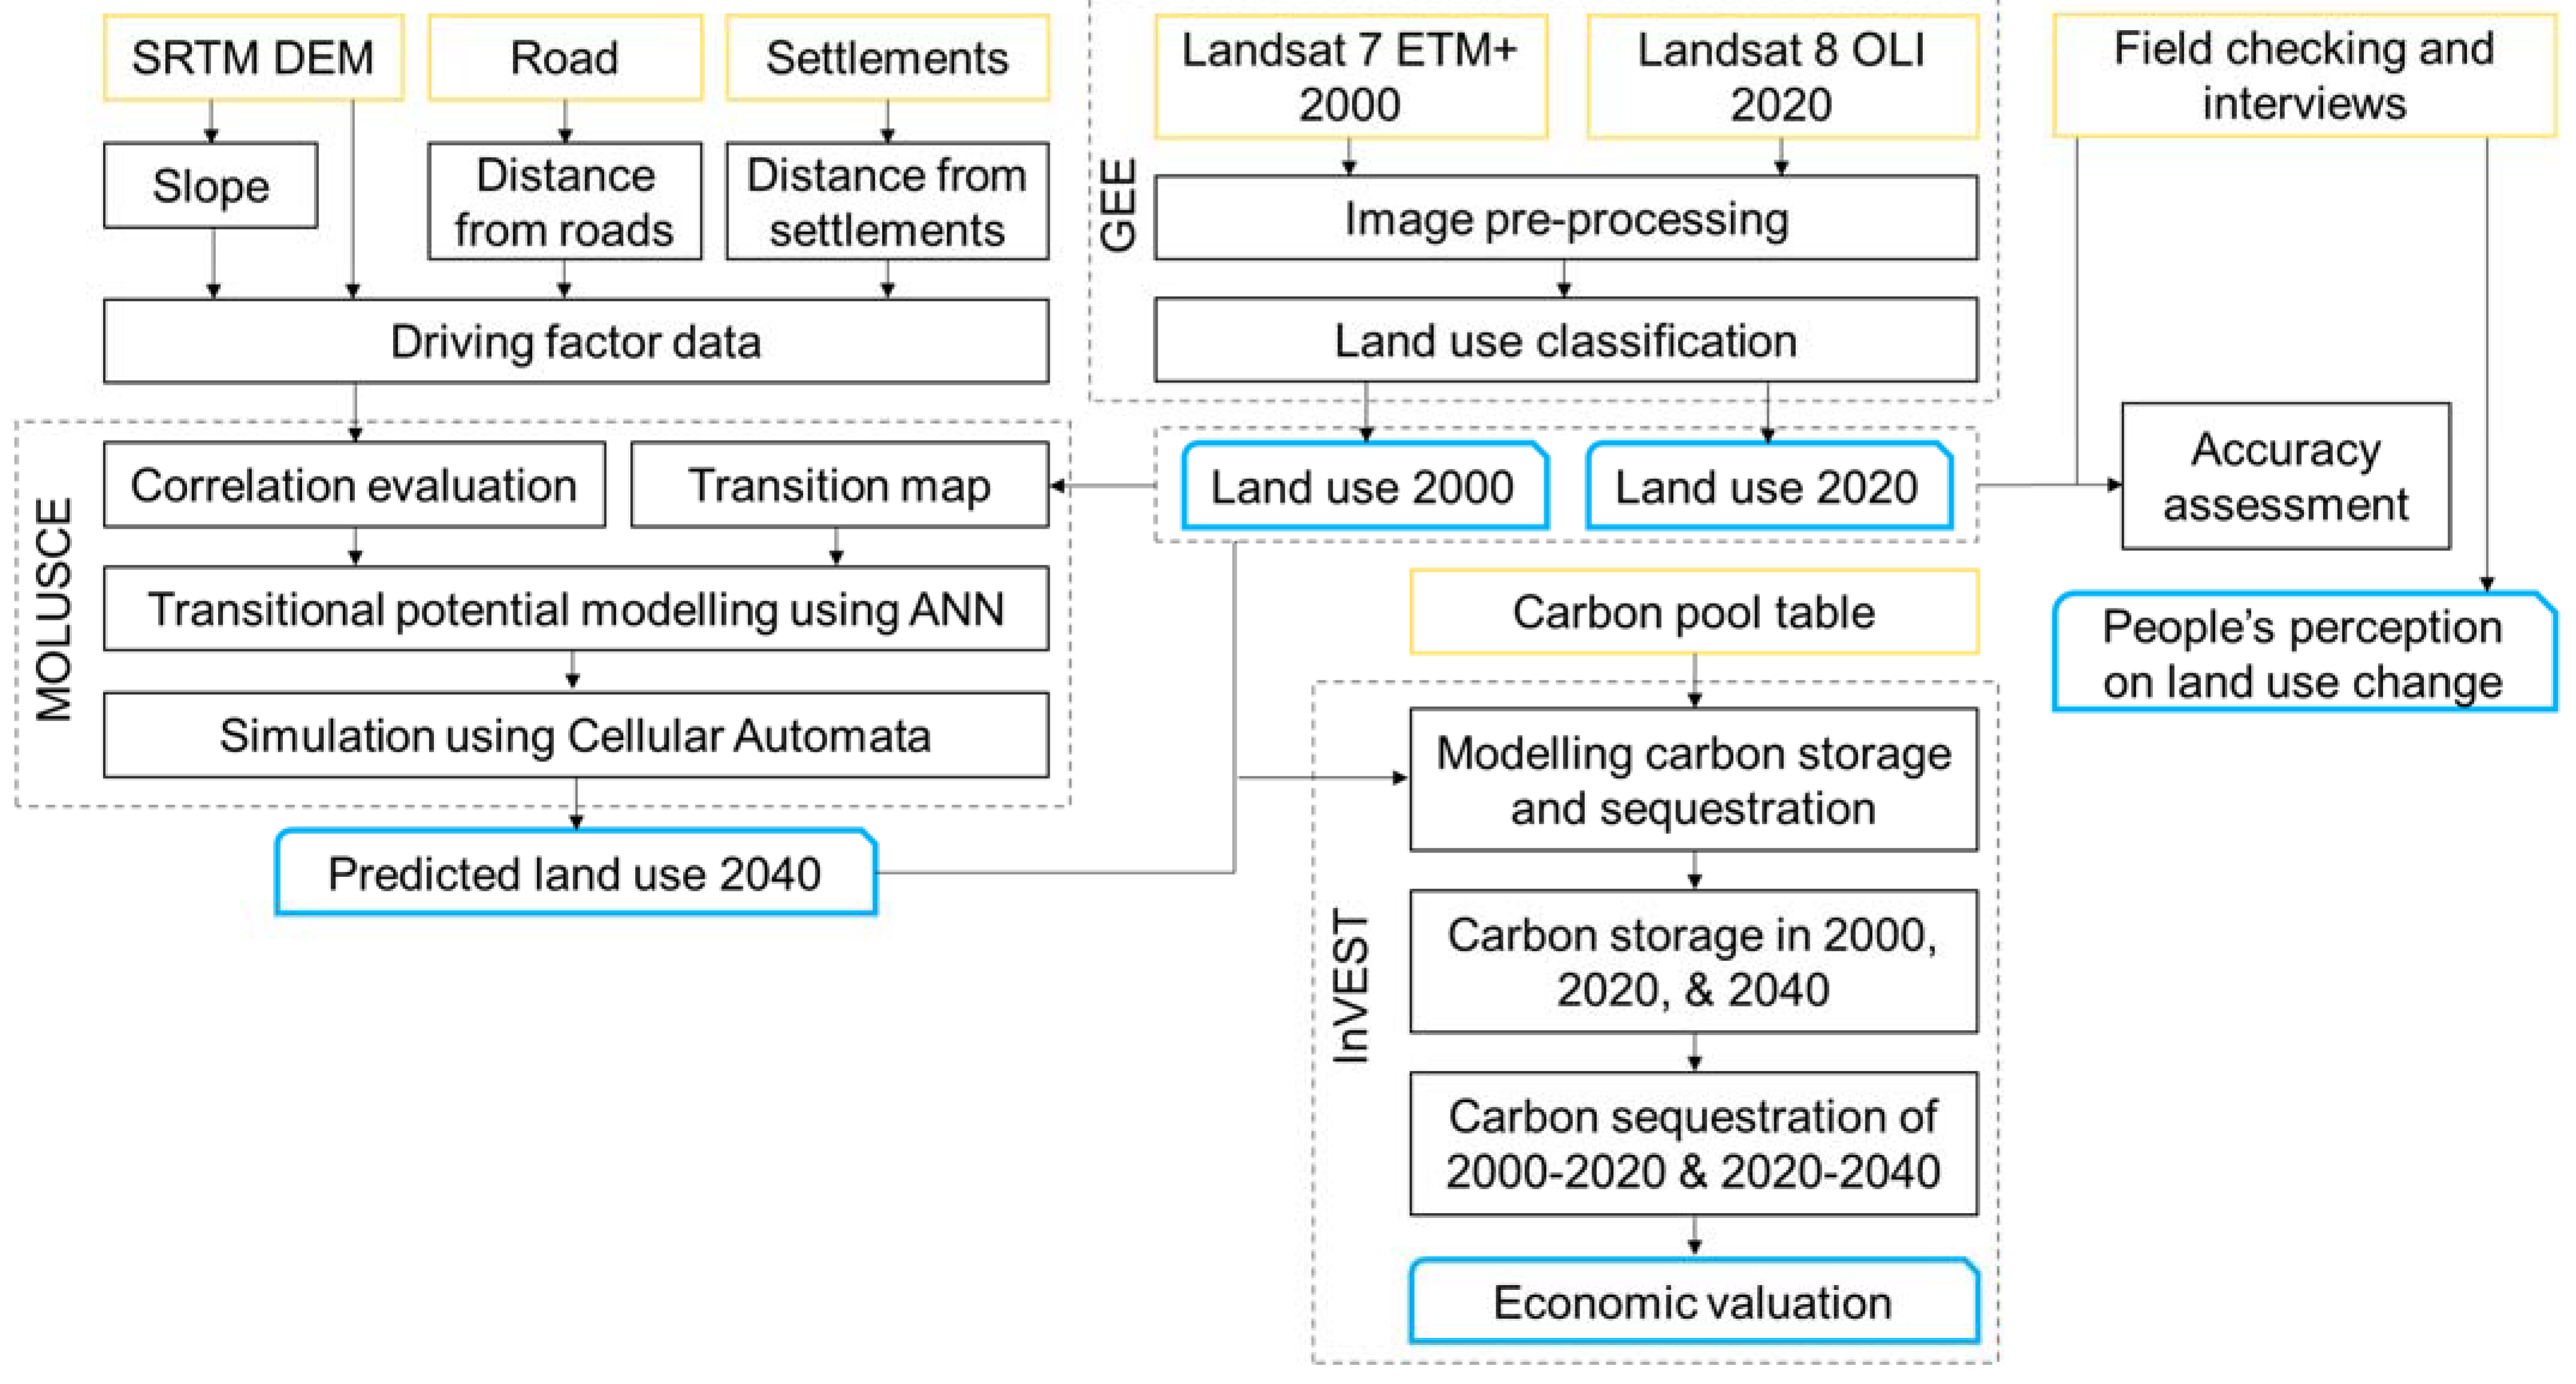
2.2. Methods
2.2.1. Land Use Classification
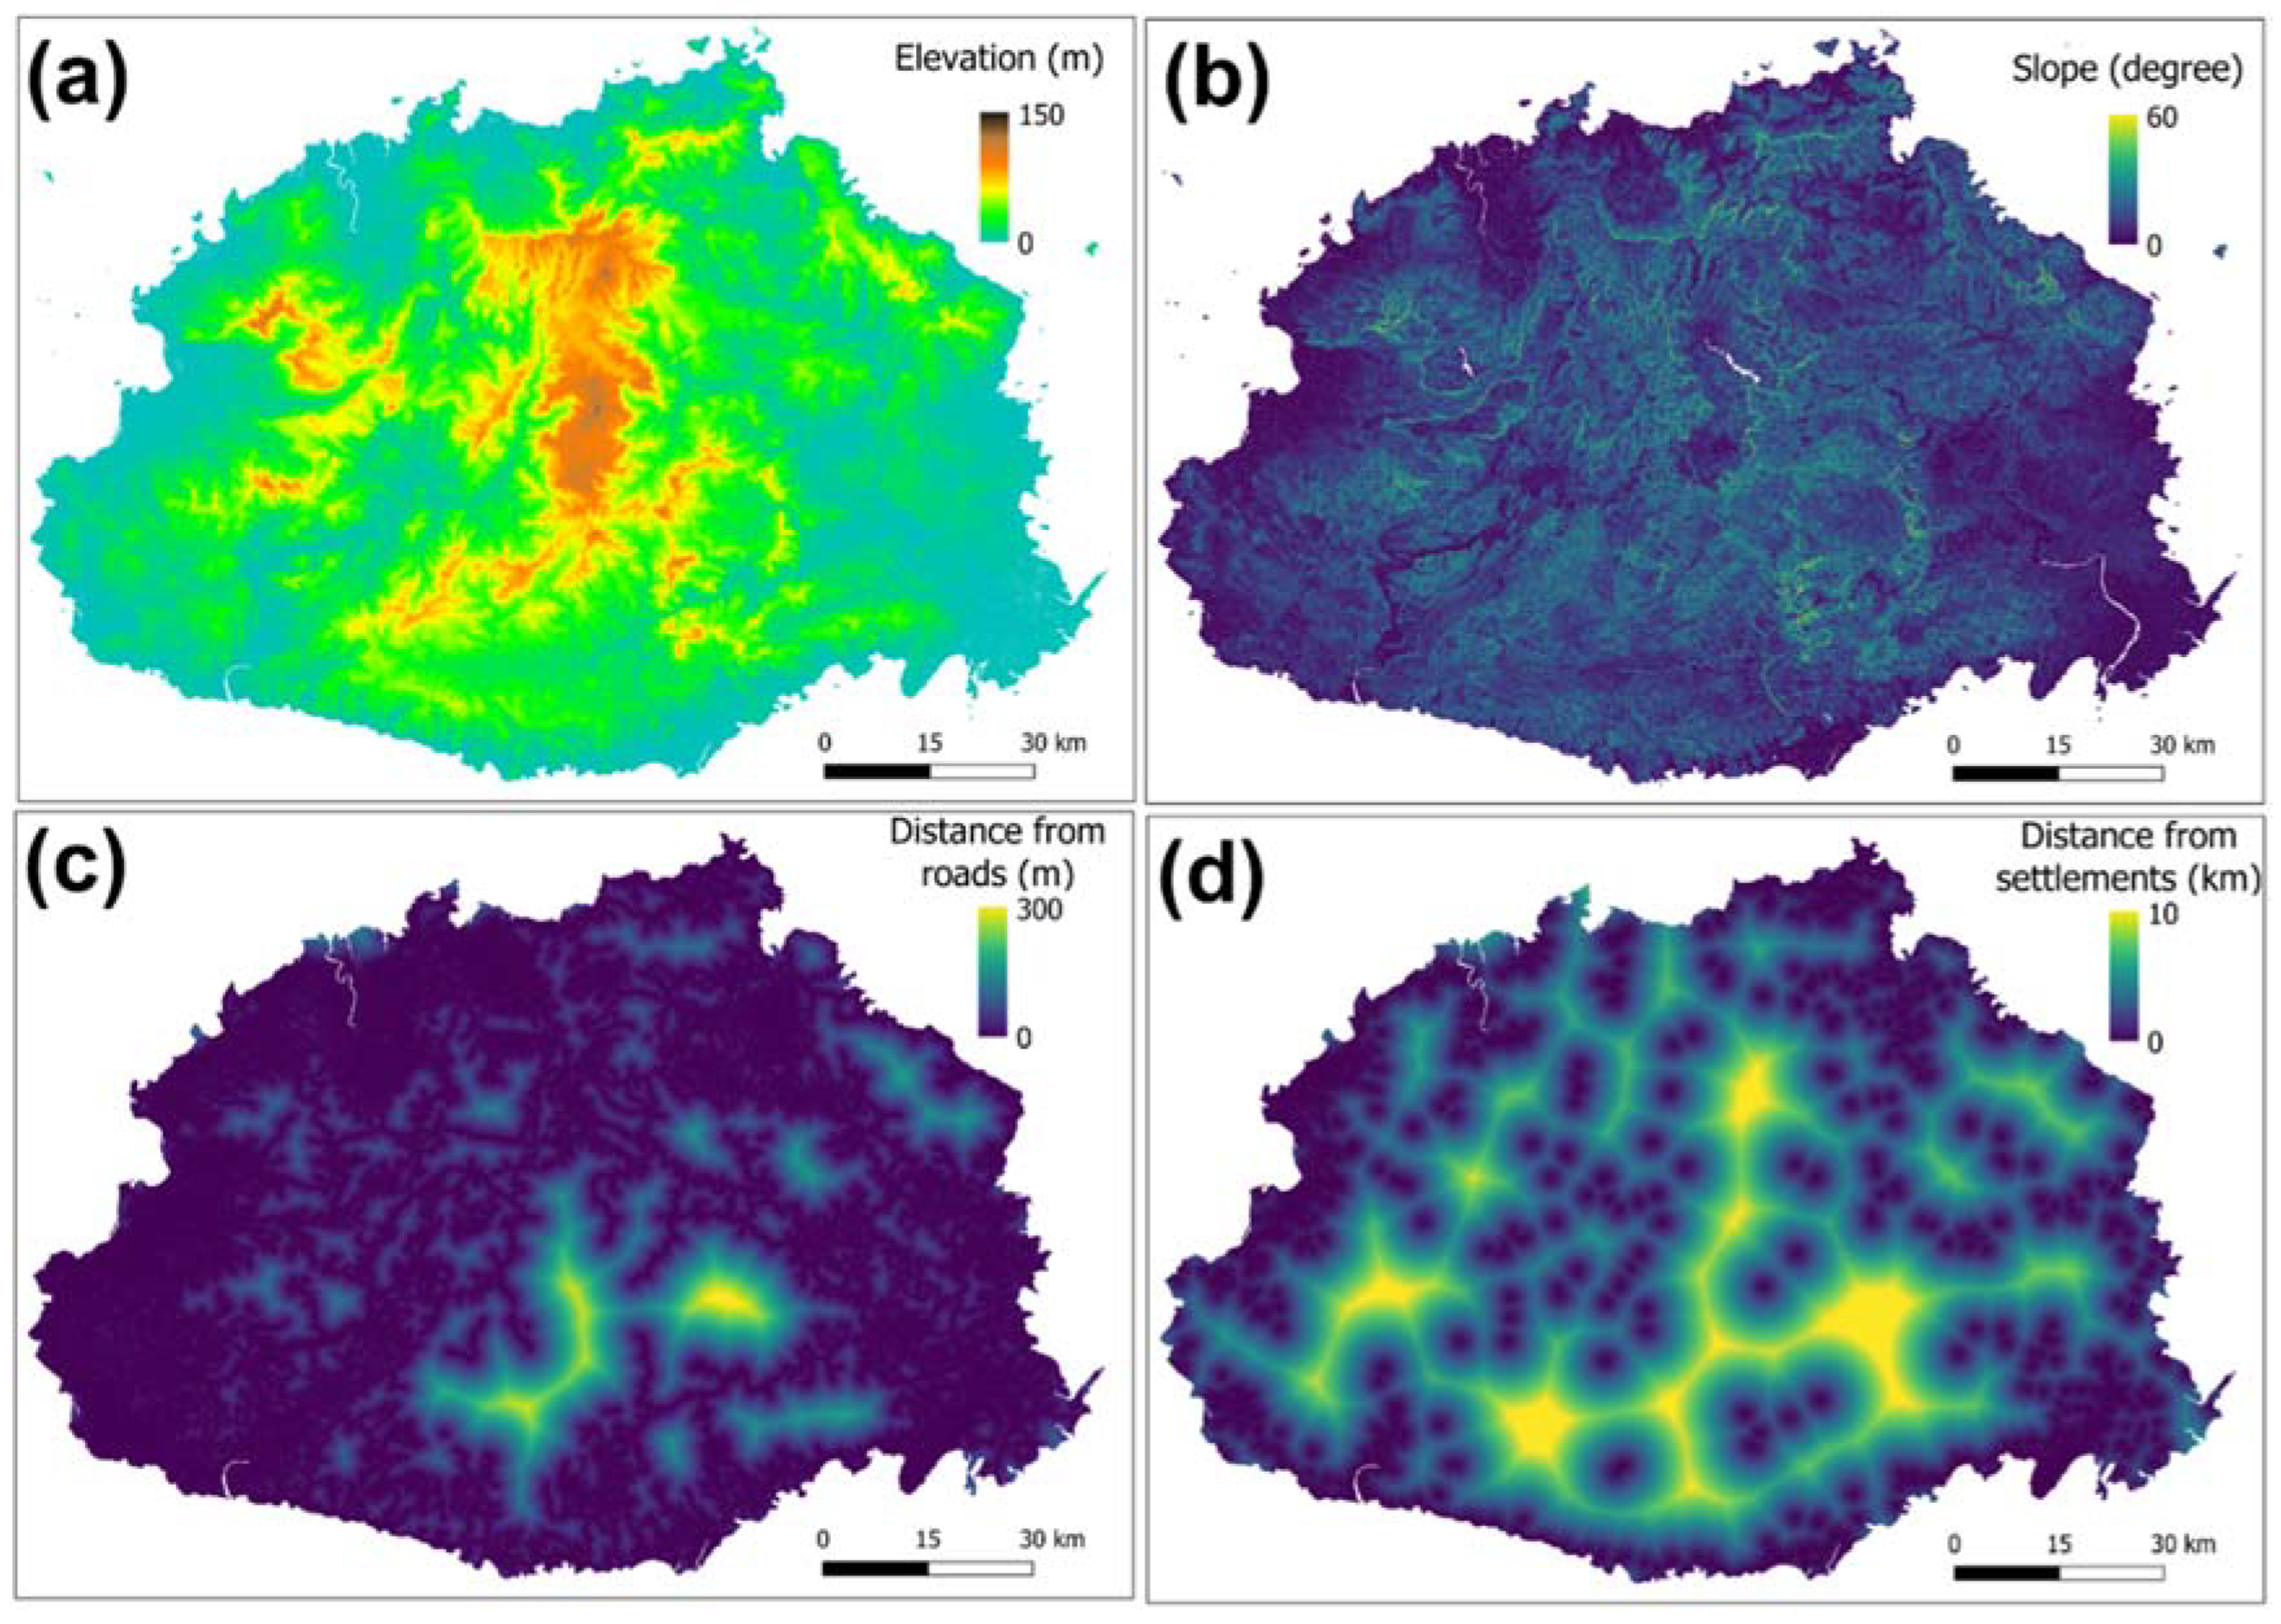
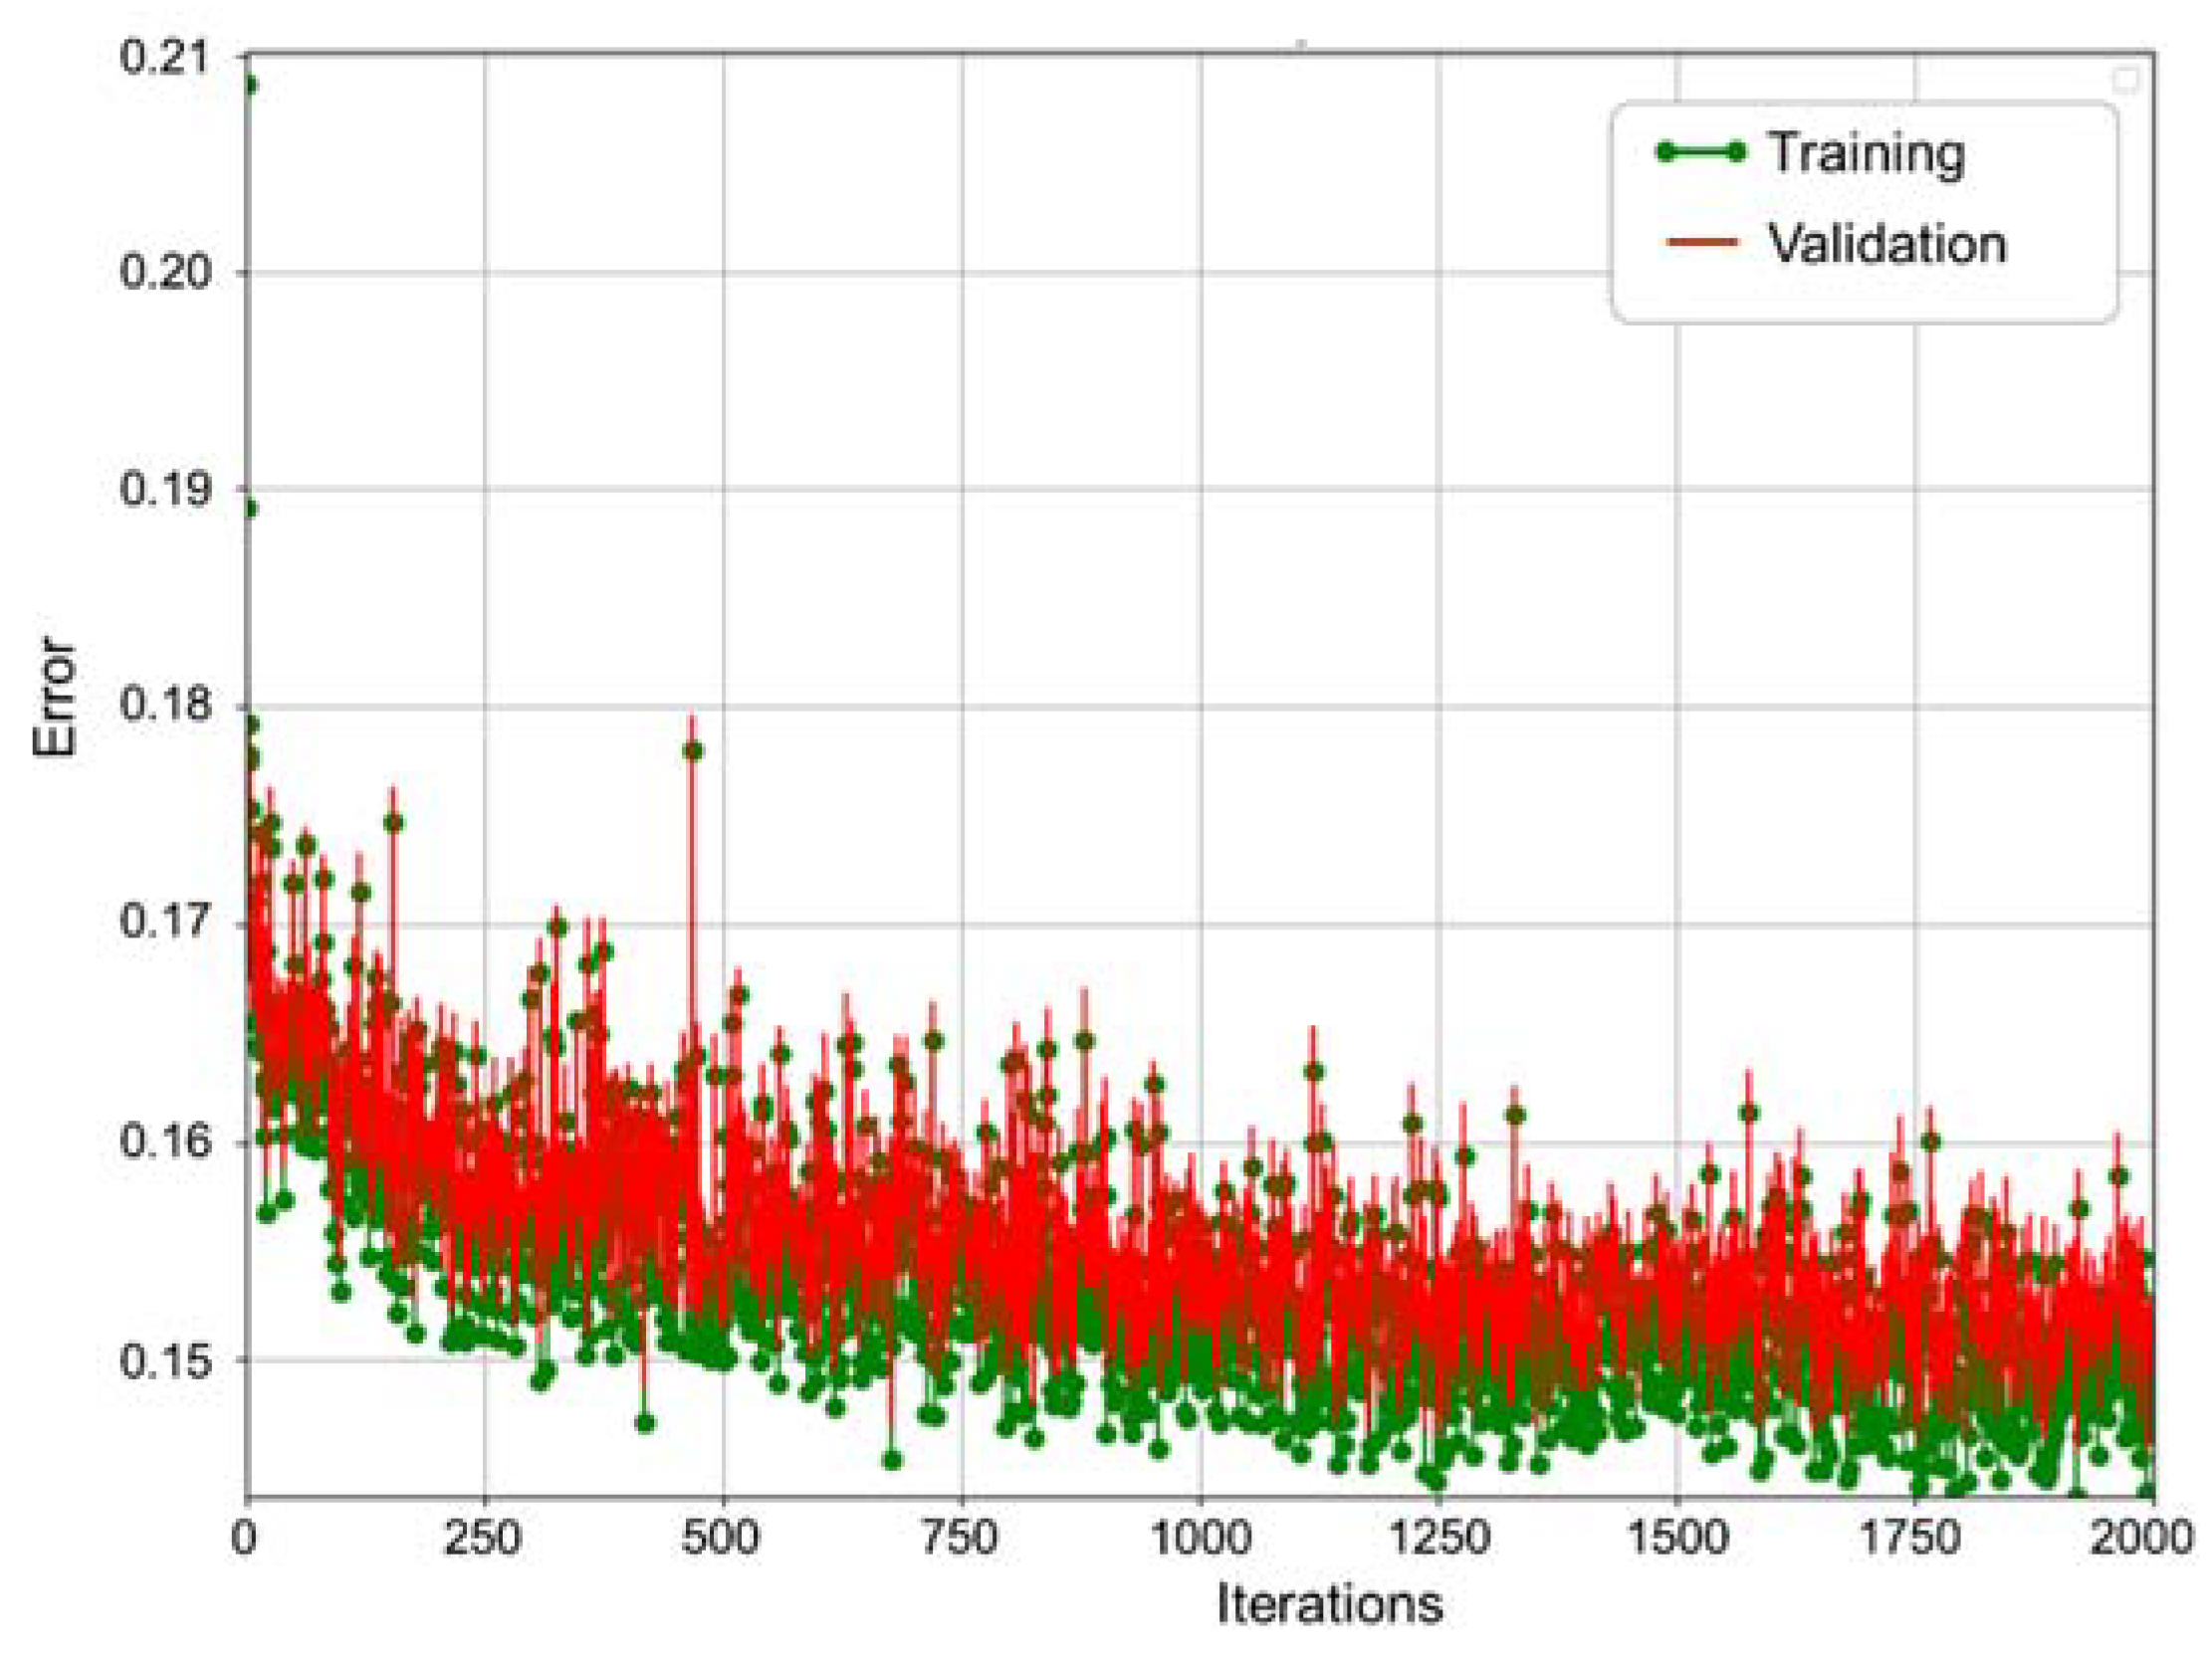
2.2.2. Land Use Prediction
2.2.3. Carbon Storage and Economic Valuation
2.2.4. Accuracy Assessment and Interviews
3. Results
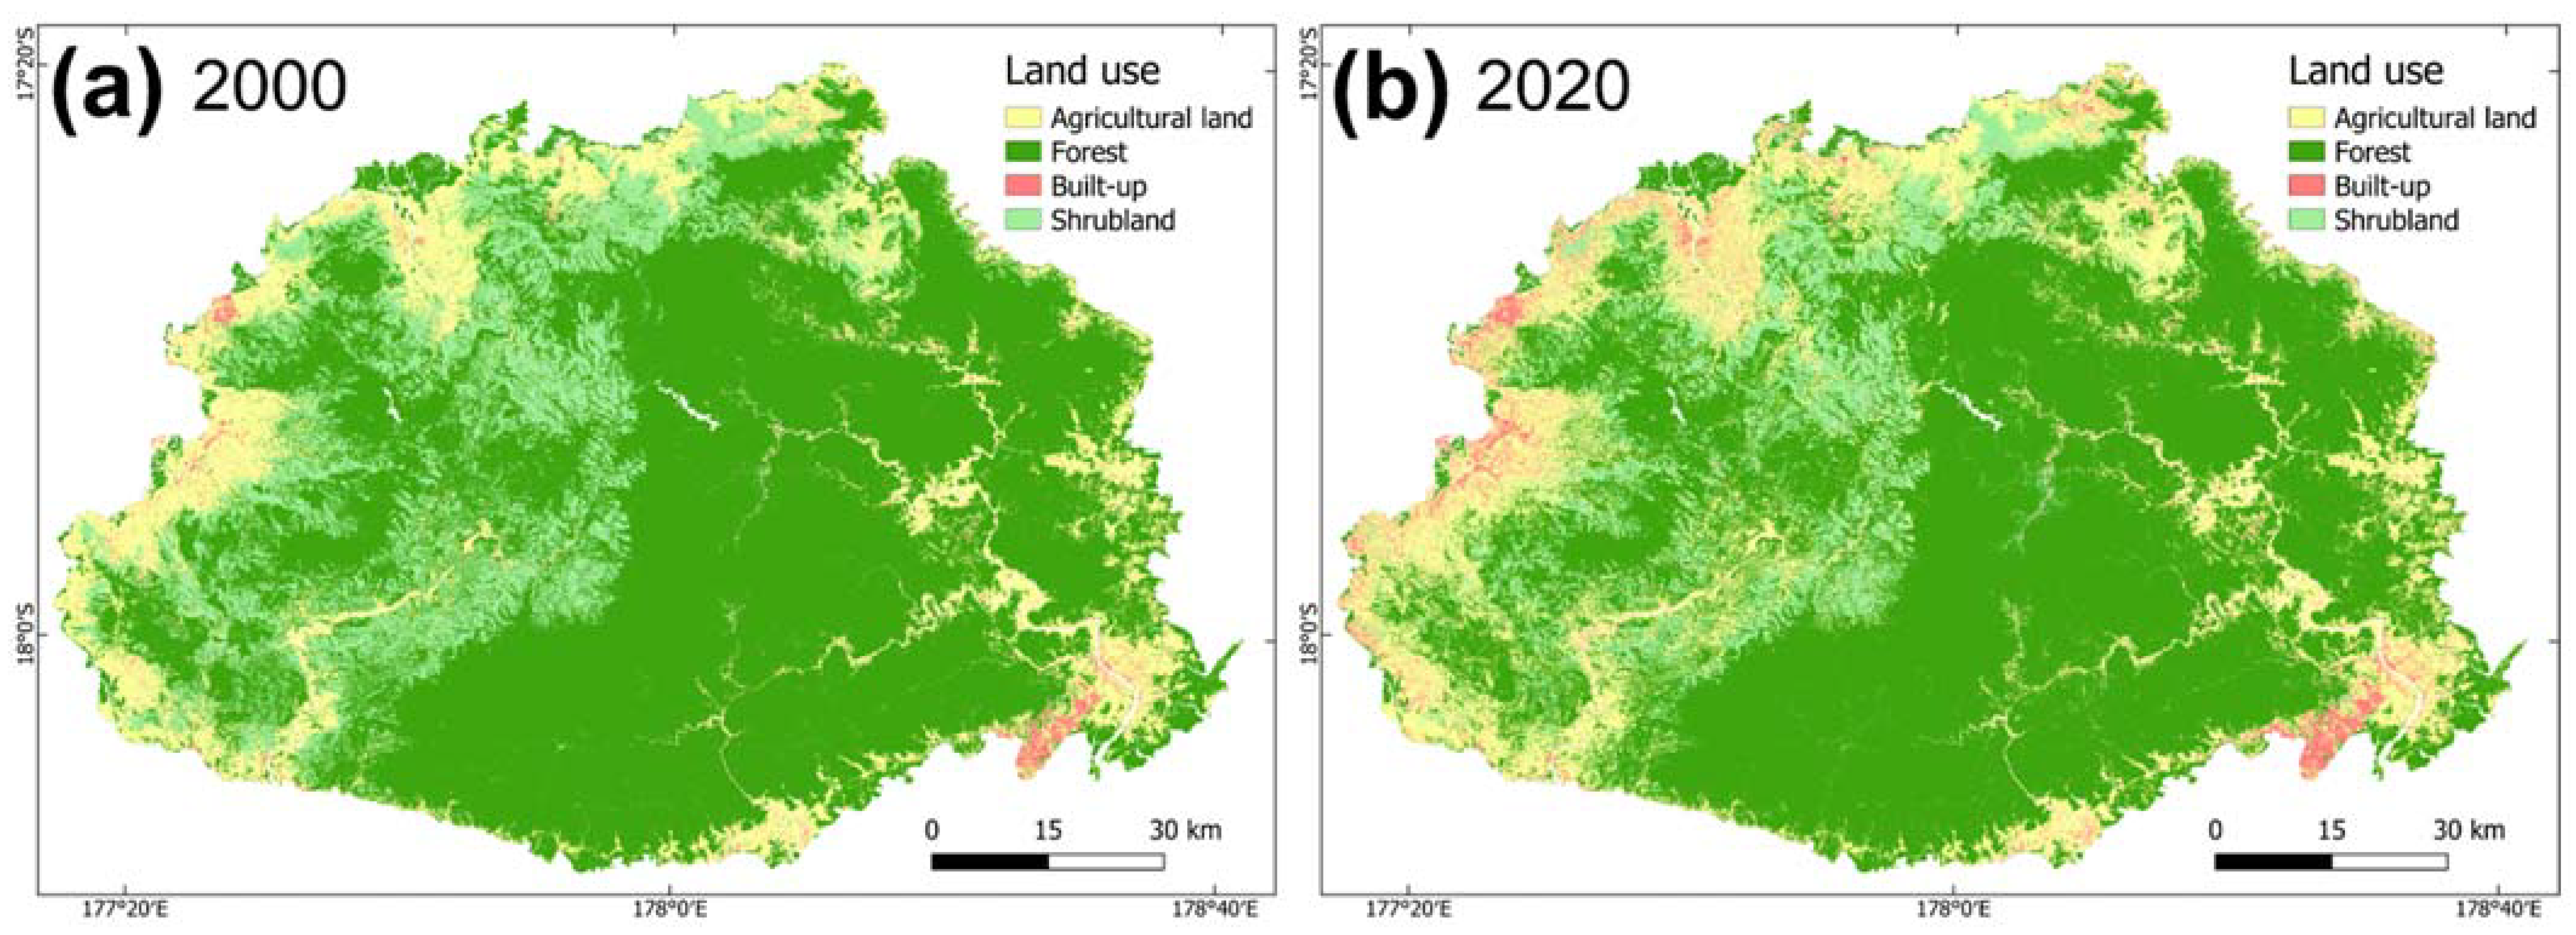
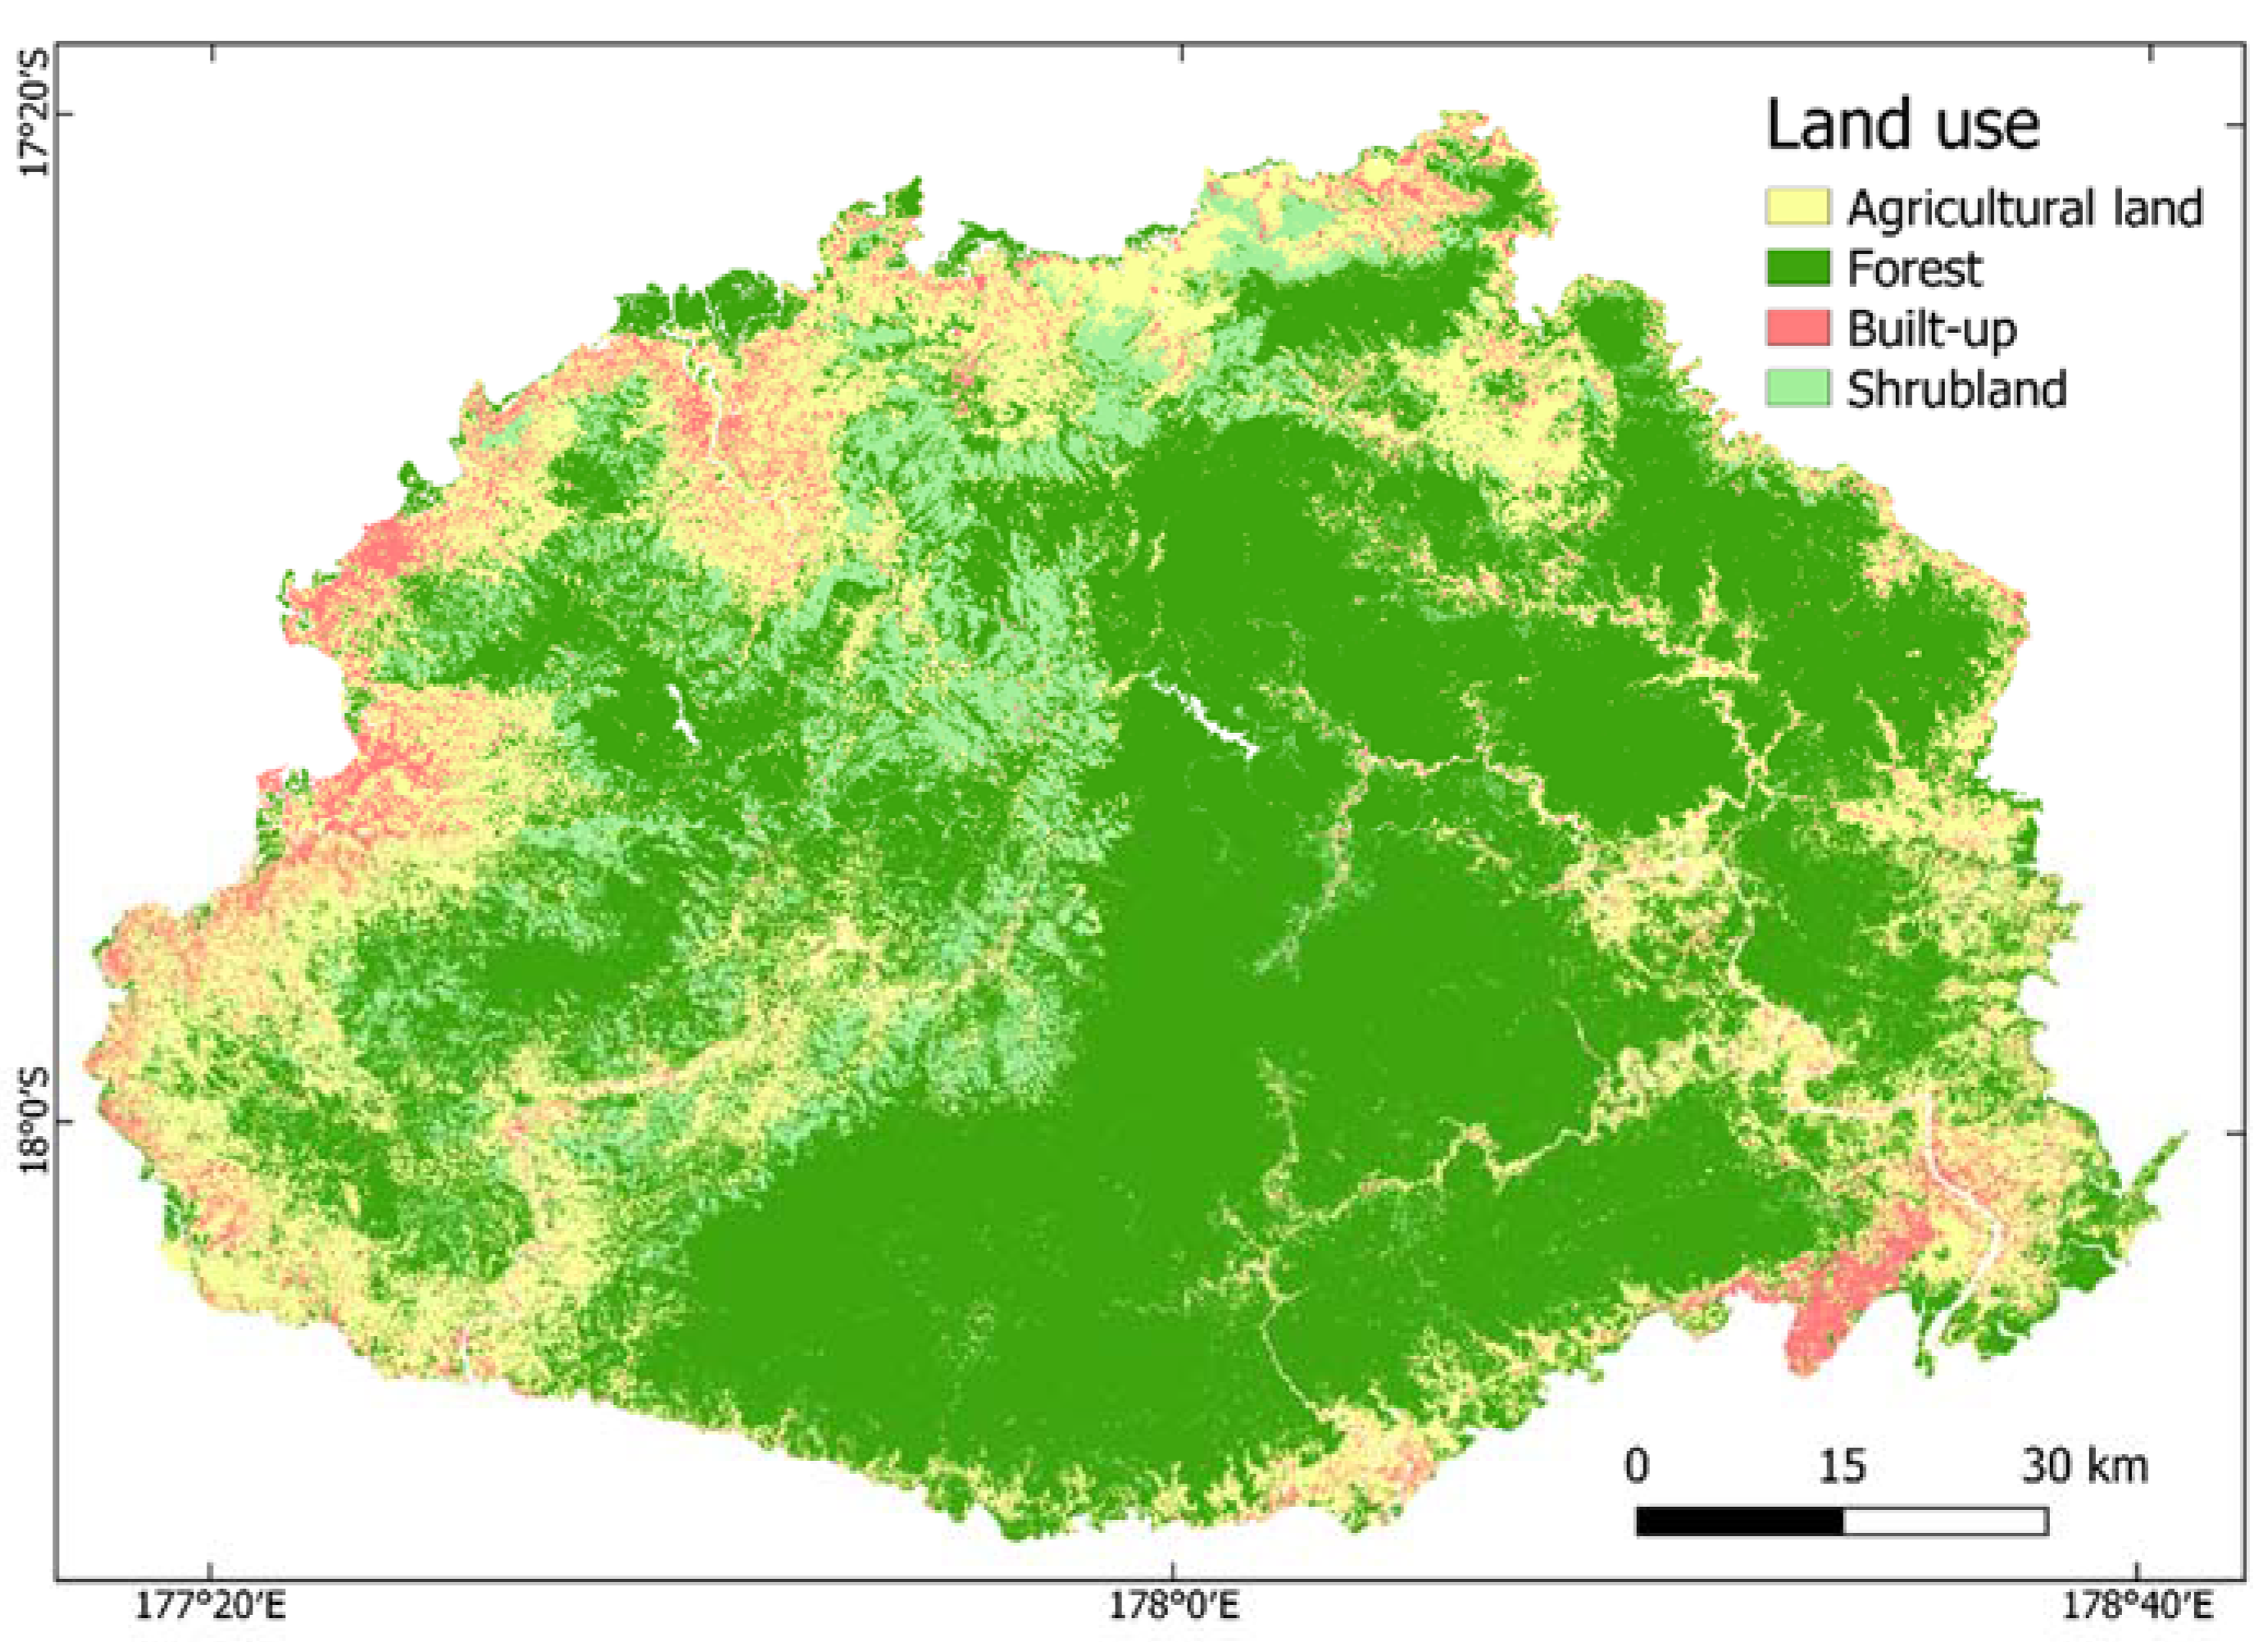
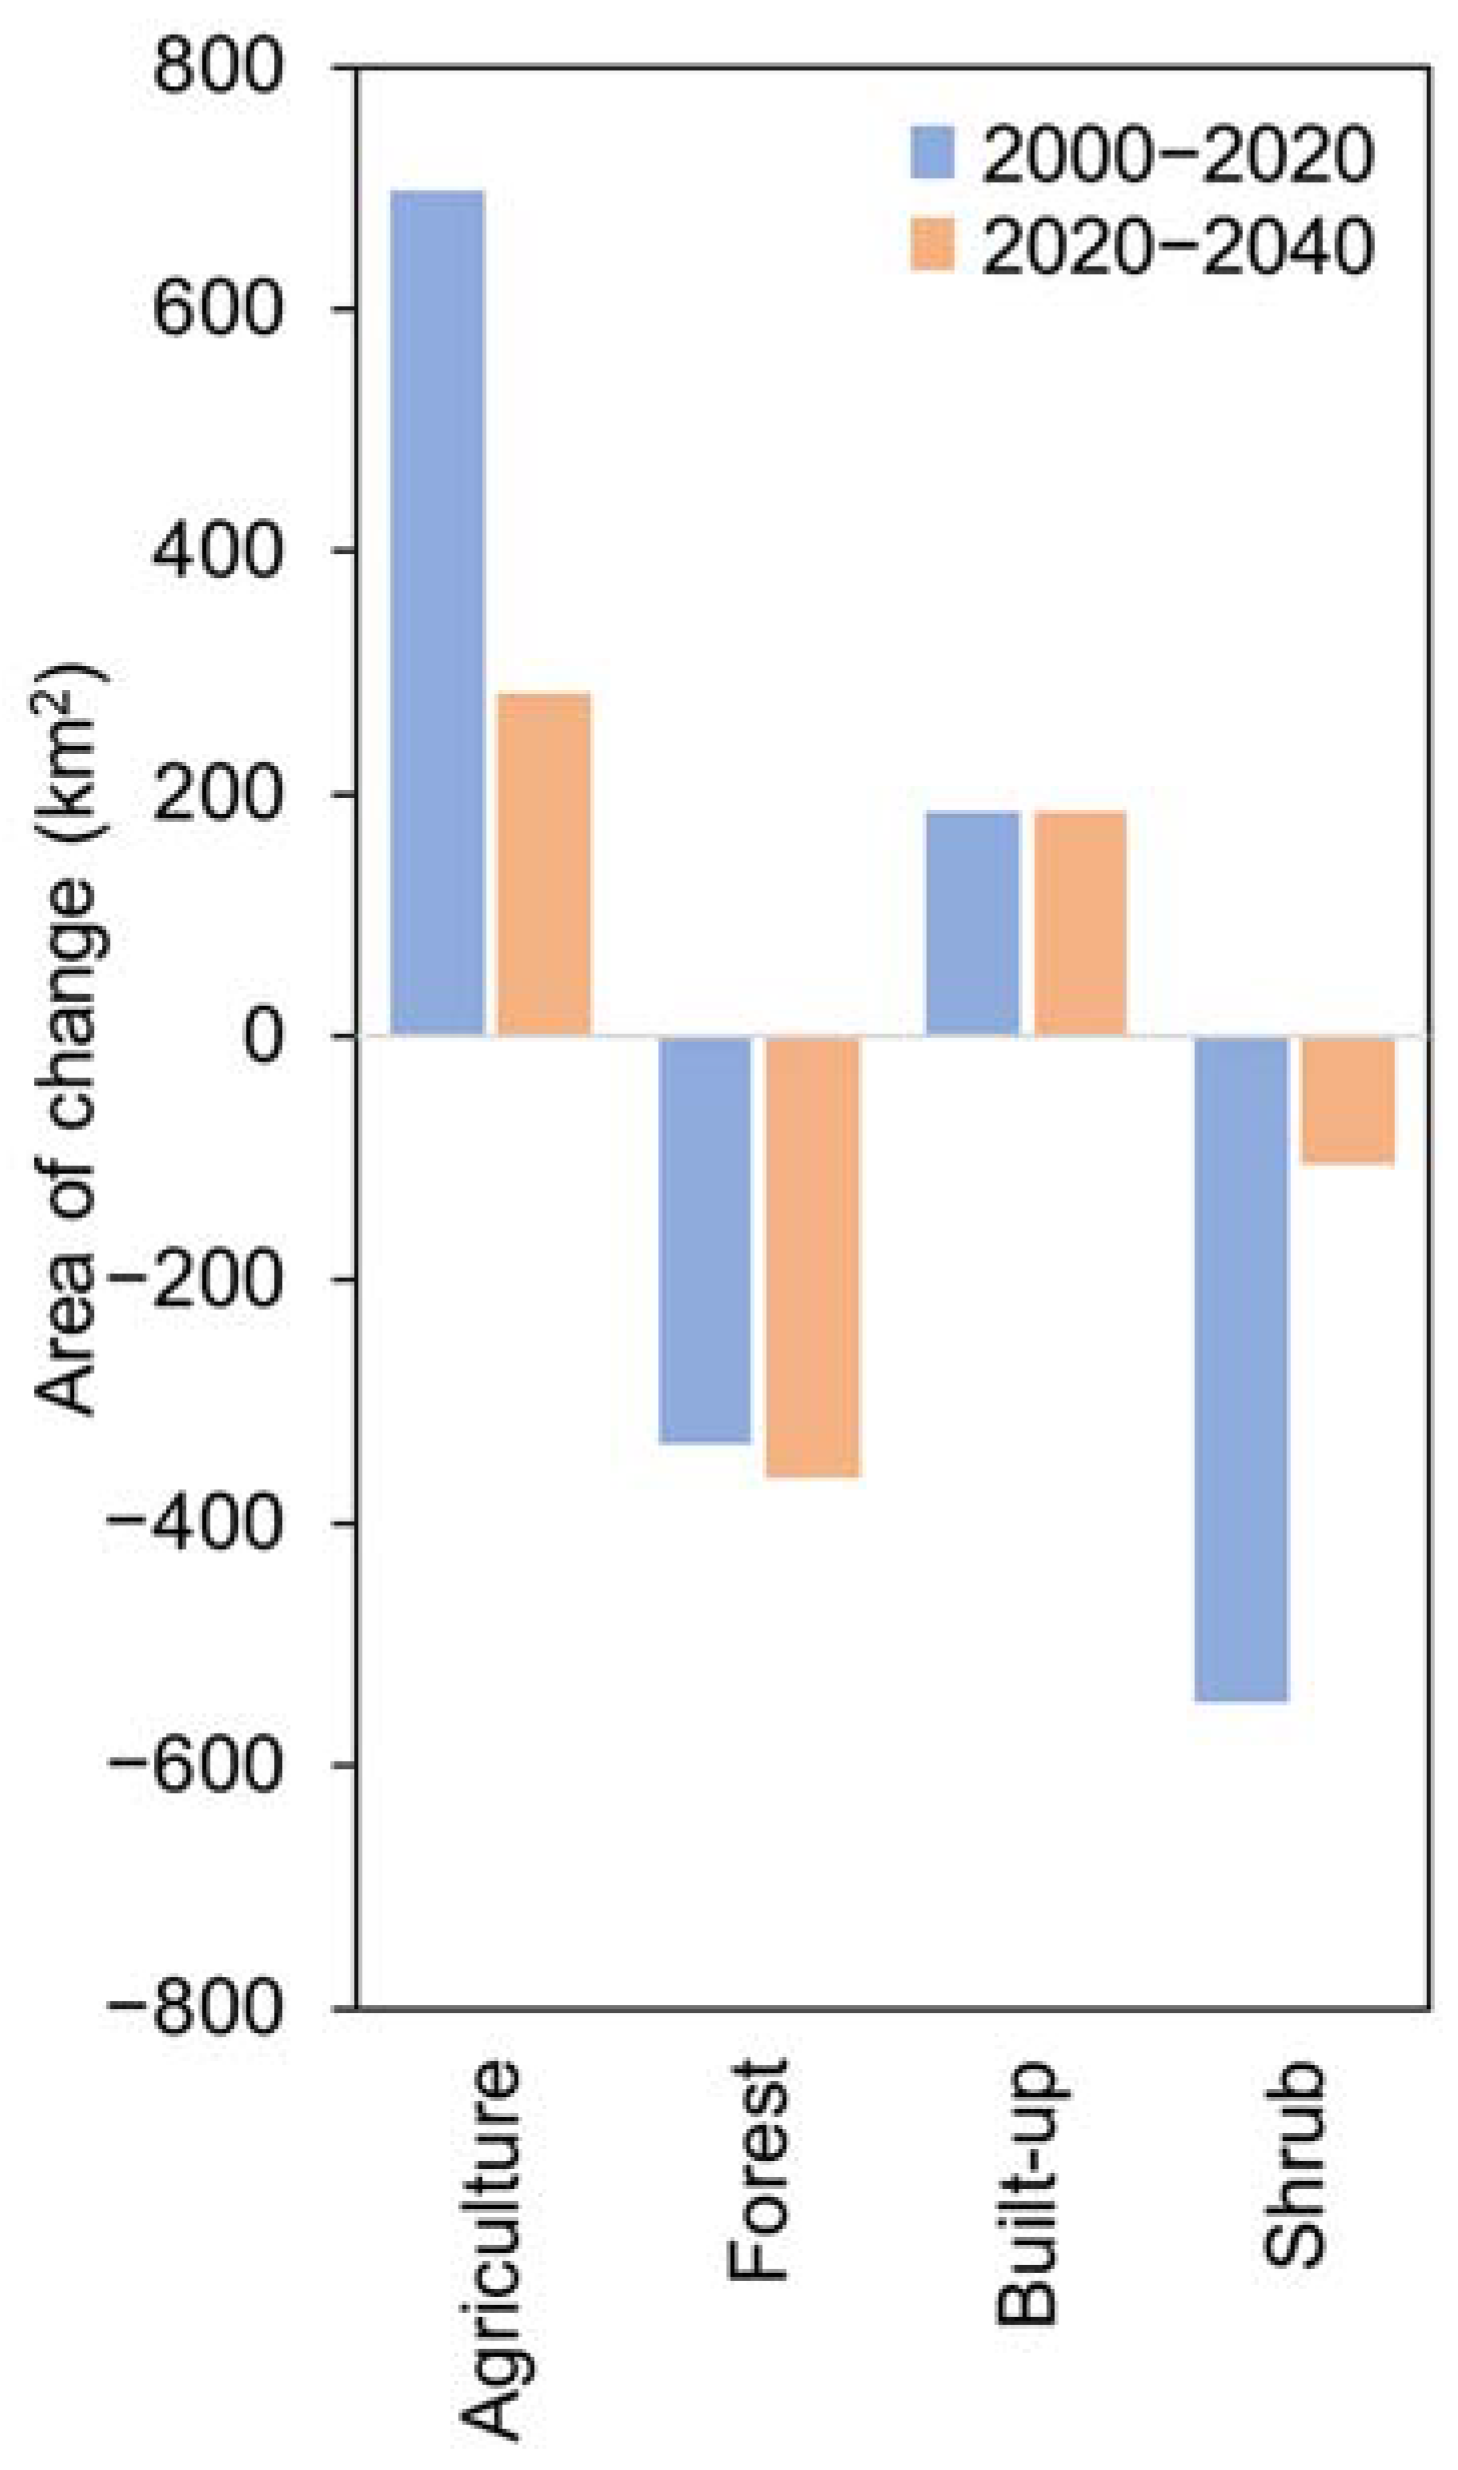
3.1. Land Use Maps and the Changes in 2000 and 2020
3.2. Land Use Prediction of 2040
3.3. Accuracy Assessment
3.4. Valuation of Carbon Sequestration
3.5. Questionnaire Survey Results
4. Discussion
4.1. Land Use Changes and Prediction of Future Maps
4.2. Monitoring and Prediction of Carbon Sequestration and Its Economic Valuation
5. Conclusions
Author Contributions
Funding
Institutional Review Board Statement
Informed Consent Statement
Data Availability Statement
Acknowledgments
Conflicts of Interest
References
- IPCC Summary for Policymakers. In Climate Change 2021: The Physical Science Basis. Contribution of Working Group I to the Sixth Assessment Report of the Intergovernmental Panel on Climate Change; Masson-Delmotte, V.; Zhai, P.; Pirani, A.; Connors, S.L.; Péan, C.; Berger, S.; Caud, N.; Chen, Y.; Goldfarb, L.; Gomis, M.I.; et al. (Eds.) IPCC: Geneva, Switzerland, 2021; ISBN 978-92-9169-158-6. [Google Scholar]
- IPCC Summary for Policymakers. In Climate Change and Land: An IPCC Special Report on Climate Change, Desertification, Land Degradation, Sustainable Land Management, Food Security, and Greenhouse Gas Fluxes in Terrestrial Ecosystems; Shukla, P.R.; Skea, J.; Calvo Buendia, E.; Masson-Delmotte, V.; Pörtner, H.-O.; Roberts, D.C.; Zhai, P.; Slade, S.; Connors, S.; van Diemen, R.; et al. (Eds.) Intergovernmental Panel on Climate Change: Geneva, Switzerland, 2019; ISBN 978-92-9169-154-8. [Google Scholar]
- Lal, R. Carbon sequestration. Philos. Trans. R. Soc. B Biol. Sci. 2007, 363, 815–830. [Google Scholar] [CrossRef] [PubMed]
- Bar-On, Y.M.; Phillips, R.; Milo, R. The Biomass Distribution on Earth. Proc. Natl. Acad. Sci. USA 2018, 115, 6506–6511. [Google Scholar] [CrossRef] [Green Version]
- Spawn, S.A.; Sullivan, C.C.; Lark, T.J.; Gibbs, H.K. Harmonized Global Maps of above and Belowground Biomass Carbon Density in the Year 2010. Sci. Data 2020, 7, 112. [Google Scholar] [CrossRef] [PubMed]
- Scharlemann, J.P.; Tanner, E.V.; Hiederer, R.; Kapos, V. Global Soil Carbon: Understanding and Managing the Largest Terrestrial Carbon Pool. Carbon Manag. 2014, 5, 81–91. [Google Scholar] [CrossRef]
- Dixon, R.K.; Winjum, J.K.; Andrasko, K.J.; Lee, J.J.; Schroeder, P.E. Integrated Land-Use Systems: Assessment of Promising Agroforest and Alternative Land-Use Practices to Enhance Carbon Conservation and Sequestration. Clim. Change 1994, 27, 71–92. [Google Scholar] [CrossRef]
- Maraseni, T.N.; Poudyal, B.H.; Rana, E.; Chandra Khanal, S.; Ghimire, P.L.; Subedi, B.P. Mapping National REDD+ Initiatives in the Asia-Pacific Region. J. Environ. Manag. 2020, 269, 110763. [Google Scholar] [CrossRef] [PubMed]
- Sedjo, R.; Sohngen, B. Carbon Sequestration in Forests and Soils. Annu. Rev. Resour. Econ. 2012, 4, 127–144. [Google Scholar] [CrossRef]
- Gibbs, H.K.; Brown, S.; Niles, J.O.; Foley, J.A. Monitoring and Estimating Tropical Forest Carbon Stocks: Making REDD a Reality. Environ. Res. Lett. 2007, 2, 045023. [Google Scholar] [CrossRef]
- Angelsen, A.; Brockhaus, M.; Center for International Forestry Research (Eds.) Realising REDD+: National Strategy and Policy Options; Center for International Forestry Research: Bogor, Indonesia, 2009; ISBN 978-602-8693-03-5. [Google Scholar]
- Angelsen, A. REDD+ as Result-Based Aid: General Lessons and Bilateral Agreements of Norway. Rev. Dev. Econ. 2017, 21, 237–264. [Google Scholar] [CrossRef] [Green Version]
- Ploton, P.; Pélissier, R.; Proisy, C.; Flavenot, T.; Barbier, N.; Rai, S.; Couteron, P. Assessing Aboveground Tropical Forest Biomass Using Google Earth Canopy Images. Ecol. Appl. A Publ. Ecol. Soc. Am. 2012, 22, 993–1003. [Google Scholar] [CrossRef] [Green Version]
- Payton, I.; Weaver, S. Fiji National Forest Carbon Stock Assessment Version 1; Carbon Partnership Ltd. for SPC/GIZ Regional Programme-Coping with Climate Change in the Pacific Island Region and the Fiji Forestry Department: Chūō, Tokyo, 2011. [Google Scholar]
- Mundhenk, P.; Neupane, P.R.; Köhl, M. Fiji’s Forest Reference Level: Reference Period 2006–2016; Institute of World Forestry, Hamburg: Consultancy Report, 102 Pp; University of Hamburg: Hamburg, Germany, 2018. [Google Scholar]
- Ministry of Forestry. Ministry of Forestry Emission Reductions Program Document (ER-PD); Ministry of Forestry, Republic of Fiji: Fiji, Japan, 2019.
- Avtar, R.; Sahu, N.; Aggarwal, A.K.; Chakraborty, S.; Kharrazi, A.; Yunus, A.P.; Dou, J.; Kurniawan, T.A. Exploring Renewable Energy Resources Using Remote Sensing and GIS—A Review. Resources 2019, 8, 149. [Google Scholar] [CrossRef] [Green Version]
- Kumar, L.; Mutanga, O. Remote Sensing of Above-Ground Biomass. Remote Sens. 2017, 9, 935. [Google Scholar] [CrossRef] [Green Version]
- Lu, D. The Potential and Challenge of Remote Sensing-based Biomass Estimation. Int. J. Remote Sens. 2006, 27, 1297–1328. [Google Scholar] [CrossRef]
- Das, N.; Mondal, A.; Saha, N.C.; Ghosh, S.; Mandal, S. Decadal loss of above-ground biomass and subsequent potential CO2 emission from the Sundarbans mangrove ecosystem, India. Acta Ecol. Sin. 2021, in press. [Google Scholar] [CrossRef]
- Masud-Ul-Alam, M.; Sarker, S.; Khan, M.A.I.; Rahman, S.M.M.; Mahmud, S.S. The Decadal Response of Vegetation in the Sundarbans Mangrove Forest to the Climate Variabilities: Observing from the Space. Remote Sens. Earth Syst. Sci. 2021, 4, 141–157. [Google Scholar] [CrossRef]
- Umarhadi, D.A.; Widyatmanti, W.; Kumar, P.; Yunus, A.P.; Khedher, K.M.; Kharrazi, A.; Avtar, R. Tropical peat subsidence rates are related to decadal LULC changes: Insights from InSAR analysis. Sci. Total Environ. 2021, 816, 151561. [Google Scholar] [CrossRef] [PubMed]
- Xiao, J.; Watanabe, T.; Lu, X.; Chand, M.B.; Umarhadi, D.A.; Chen, X.; Avtar, R. Integrating land use/land cover change with change in functional zones’ boundary of the East Dongting Lake National Nature Reserve, China. Phys. Chem. Earth, Parts A/B/C 2021, 126, 103041. [Google Scholar] [CrossRef]
- Hu, Z.; Lo, C. Modeling urban growth in Atlanta using logistic regression. Comput. Environ. Urban Syst. 2007, 31, 667–688. [Google Scholar] [CrossRef]
- Deep, S.; Saklani, A. Urban Sprawl Modeling Using Cellular Automata. Egypt. J. Remote Sens. Space Sci. 2014, 17, 179–187. [Google Scholar] [CrossRef] [Green Version]
- Mishra, V.N.; Rai, P.K. A remote sensing aided multi-layer perceptron-Markov chain analysis for land use and land cover change prediction in Patna district (Bihar), India. Arab. J. Geosci. 2016, 9, 249. [Google Scholar] [CrossRef]
- Rahman, M.T.U.; Tabassum, F.; Rasheduzzaman, M.; Saba, H.; Sarkar, L.; Ferdous, J.; Uddin, S.Z.; Zahedul Islam, A.Z.M. Temporal Dynamics of Land Use/Land Cover Change and Its Prediction Using CA-ANN Model for Southwestern Coastal Bangladesh. Environ. Monit. Assess 2017, 189, 565. [Google Scholar] [CrossRef] [PubMed]
- Babbar, D.; Areendran, G.; Sahana, M.; Sarma, K.; Raj, K.; Sivadas, A. Assessment and Prediction of Carbon Sequestration Using Markov Chain and InVEST Model in Sariska Tiger Reserve, India. J. Clean. Prod. 2021, 278, 123333. [Google Scholar] [CrossRef]
- Gupta, S.; Ii, A.N.; Anand, S.; Singh, S. Valuation of carbon sequestration in bidhalna microwatershed, uttarakhand, india using invest model. Int. J. Adv. Earth Environ. Sci. 2017, 5, 10–15. [Google Scholar] [CrossRef]
- Li, J.; Gong, J.; Guldmann, J.-M.; Li, S.; Zhu, J. Carbon Dynamics in the Northeastern Qinghai–Tibetan Plateau from 1990 to 2030 Using Landsat Land Use/Cover Change Data. Remote Sens. 2020, 12, 528. [Google Scholar] [CrossRef] [Green Version]
- Chu, X.; Zhan, J.; Li, Z.; Zhang, F.; Qi, W. Assessment on Forest Carbon Sequestration in the Three-North Shelterbelt Program Region, China. J. Clean. Prod. 2019, 215, 382–389. [Google Scholar] [CrossRef]
- Lyu, R.; Mi, L.; Zhang, J.; Xu, M.; Li, J. Modeling the effects of urban expansion on regional carbon storage by coupling SLEUTH-3r model and InVEST model. Ecol. Res. 2019, 34, 380–393. [Google Scholar] [CrossRef]
- Zhang, F.; Zhan, J.; Zhang, Q.; Yao, L.; Liu, W. Impacts of Land Use/Cover Change on Terrestrial Carbon Stocks in Uganda. Phys. Chem. Earth Parts A/B/C 2017, 101, 195–203. [Google Scholar] [CrossRef]
- Lele, S.; Springate-Baginski, O.; Lakerveld, R.; Deb, D.; Dash, P. Ecosystem Services: Origins, Contributions, Pitfalls, and Alternatives. Conserv. Soc. 2013, 11, 343. [Google Scholar] [CrossRef] [Green Version]
- Fiji Bureau of Statistics. Fiji Bureau of Statistics 2017 Population and Housing Census, Release 1. In Age, Sex, Geography and Economic ActivityAge, Sex, Geography and Economic Activity; Fiji Bureau of Statistics: Fiji, Japan, 2018. [Google Scholar]
- FAO. Global Forest Resources Assessment 2015—Country Report—Fiji; Food and Agriculture Organisation (FAO): Rome, Italy, 2015. [Google Scholar]
- Schmidt, G.L.; Jenkerson, C.B.; Masek, J.; Vermote, E.; Gao, F. Landsat Ecosystem Disturbance Adaptive Processing System (LEDAPS) Algorithm Description; U.S. Geological Survey: Reston, VI, USA, 2013; p. 17.
- Vermote, E.; Justice, C.; Claverie, M.; Franch, B. Preliminary Analysis of the Performance of the Landsat 8/OLI Land Surface Reflectance Product. Remote Sens. Environ. 2016, 185, 46–56. [Google Scholar] [CrossRef]
- Baloloy, A.B.; Blanco, A.C.; Sta Ana, R.R.C.; Nadaoka, K. Development and Application of a New Mangrove Vegetation Index (MVI) for Rapid and Accurate Mangrove Mapping. ISPRS J. Photogramm. Remote Sens. 2020, 166, 95–117. [Google Scholar] [CrossRef]
- McFEETERS, S.K. The Use of the Normalized Difference Water Index (NDWI) in the Delineation of Open Water Features. Int. J. Remote Sens. 1996, 17, 1425–1432. [Google Scholar] [CrossRef]
- Pal, M. Random Forest Classifier for Remote Sensing Classification. Int. J. Remote Sens. 2005, 26, 217–222. [Google Scholar] [CrossRef]
- NextGIS. Molusce Modules for Land Use Change Evaluation—Quick Help; Asia Air Survey and NextGIS: Kanagawa, Japan, 2014. [Google Scholar]
- Hazani, S.N.; Damayanti, A.; Indra, T.L.; Dimyati, M. CA-Markov Model for Predicting Paddy-Field Land in Babulu Subdistrict, North Penajam Paser Regency, East Kalimantan. J. Phys. Conf. Ser. 2021, 1811, 012073. [Google Scholar] [CrossRef]
- Muhammad, R.; Zhang, W.; Abbas, Z.; Guo, F.; Gwiazdzinski, L. Spatiotemporal Change Analysis and Prediction of Future Land Use and Land Cover Changes Using QGIS Molusce Plugin and Remote Sensing Big Data: A Case Study of Linyi, China. Land 2022, 11, 419. [Google Scholar] [CrossRef]
- Pijanowski, B.C.; Brown, D.G.; Shellito, B.A.; Manik, G.A. Using Neural Networks and GIS to Forecast Land Use Changes: A Land Transformation Model. Comput. Environ. Urban Syst. 2002, 26, 553–575. [Google Scholar] [CrossRef]
- Gardner, M.W.; Dorling, S.R. Artificial Neural Networks (the Multilayer Perceptron)—A Review of Applications in the Atmospheric Sciences. Atmos. Environ. 1998, 32, 2627–2636. [Google Scholar] [CrossRef]
- Santé, I.; García, A.M.; Miranda, D.; Crecente, R. Cellular Automata Models for the Simulation of Real-World Urban Processes: A Review and Analysis. Landsc. Urban Plan. 2010, 96, 108–122. [Google Scholar] [CrossRef]
- Li, T.; Li, W. Multiple Land Use Change Simulation with Monte Carlo Approach and CA-ANN Model, a Case Study in Shenzhen, China. Environ. Syst. Res. 2015, 4, 1. [Google Scholar] [CrossRef] [Green Version]
- Bagstad, K.J.; Semmens, D.J.; Waage, S.; Winthrop, R. A Comparative Assessment of Decision-Support Tools for Ecosystem Services Quantification and Valuation. Ecosyst. Serv. 2013, 5, 27–39. [Google Scholar] [CrossRef]
- Daily, G.C.; Polasky, S.; Goldstein, J.; Kareiva, P.M.; Mooney, H.A.; Pejchar, L.; Ricketts, T.H.; Salzman, J.; Shallenberger, R. Ecosystem Services in Decision Making: Time to Deliver. Front. Ecol. Environ. 2009, 7, 21–28. [Google Scholar] [CrossRef] [Green Version]
- Goldstein, J.H.; Caldarone, G.; Duarte, T.K.; Ennaanay, D.; Hannahs, N.; Mendoza, G.; Polasky, S.; Wolny, S.; Daily, G.C. Integrating Ecosystem-Service Tradeoffs into Land-Use Decisions. Proc. Natl. Acad. Sci. USA 2012, 109, 7565–7570. [Google Scholar] [CrossRef] [PubMed] [Green Version]
- Qiu, J.; Turner, M.G. Spatial Interactions among Ecosystem Services in an Urbanizing Agricultural Watershed. Proc. Natl. Acad. Sci. USA 2013, 110, 12149–12154. [Google Scholar] [CrossRef] [PubMed] [Green Version]
- FAO. Global Forest Resources Assessments 2020 Report, Fiji; Food and Agriculture Organisation (FAO), United Nations: Rome, Italy, 2020. [Google Scholar]
- FAO. Global Forest Resources Assessment 2020: Main Report; Food and Agriculture Organization of the United Nations: Rome, Italy, 2020; ISBN 978-92-5-132974-0. [Google Scholar]
- United States Government. Interagency Working Group on Social Cost of Greenhouse Gases Technical Support Document: Social Cost of Carbon, Methane, and Nitrous Oxide; Interim Estimates under Executive Order 13990; United States Government: Washington, DC, USA, 2021.
- Benz, U.C.; Hofmann, P.; Willhauck, G.; Lingenfelder, I.; Heynen, M. Multi-Resolution, Object-Oriented Fuzzy Analysis of Remote Sensing Data for GIS-Ready Information. ISPRS J. Photogramm. Remote Sens. 2004, 58, 239–258. [Google Scholar] [CrossRef]
- Zhou, L.; Dickinson, R.E.; Dirmeyer, P.; Dai, A.; Min, S.-K. Spatiotemporal Patterns of Changes in Maximum and Minimum Temperatures in Multi-Model Simulations: DTR and climate change. Geophys. Res. Lett. 2009, 36, L02702. [Google Scholar] [CrossRef] [Green Version]
- Raji, S.A.; Fasona, M.; Odunuga, S. Simulating Future Ecosystem Services of the Sokoto-Rima Basin as Influenced by Geo-Environmental Factors. Turk. J. Remote Sens. GIS 2020, 1, 106–124. [Google Scholar]
- Cameron, C.; Maharaj, A.; Kennedy, B.; Tuiwawa, S.; Goldwater, N.; Soapi, K.; Lovelock, C.E. Landcover Change in Mangroves of Fiji: Implications for Climate Change Mitigation and Adaptation in the Pacific. Environ. Chall. 2021, 2, 100018. [Google Scholar] [CrossRef]
- Syngellakis, K.; Anastasia, O.; Schulz, A.; Sagar, A.; Kang, J.S.-C.; Johnston, P.; Raturi, A.; Prasad, R.; Wairui, M.; Mani, F.; et al. Fiji Low Emission Development Strategy 2018–2050; Ministry of Economy, Government of the Republic of Fiji: Fiji, 2018.
- Government of The Sovereign Democratic Republic of Fiji. Forest Decree No. 31 of 1992. Available online: https://www.forestry.gov.fj/docs/legis/FORESTDECREE1992.pdf (accessed on 27 July 2022).
- Areendran, G.; Raj, K.; Sharma, A.; Bora, P.J.; Sarmah, A.; Sahana, M.; Ranjan, K. Documenting the Land Use Pattern in the Corridor Complexes of Kaziranga National Park Using High Resolution Satellite Imagery. Trees For. People 2020, 2, 100039. [Google Scholar] [CrossRef]


| Land Use 2000 | Land Use 2020 | Total | |||
|---|---|---|---|---|---|
| Agriculture | Forest | Built-Up | Shrub | ||
| Agriculture | 1511.21 | 0.04 | 152.32 | 1.74 | 1665.31 |
| Forest | 340.13 | 6653.11 | 10.84 | 186.01 | 7190.09 |
| Built-up | 3.46 | 0.10 | 138.48 | 0.16 | 142.2 |
| Shrub | 507.19 | 202.27 | 26.50 | 812.25 | 1548.21 |
| Total | 2361.99 | 6855.52 | 328.14 | 1000.16 | 10,545.81 |
| Spatial Variables | DEM | Distance from Roads | Slope | Distance from Settlements |
|---|---|---|---|---|
| DEM | - | 0.524 | 0.619 | 0.505 |
| Distance from roads | - | 0.413 | 0.525 | |
| Slope | - | 0.259 | ||
| Distance from settlements | - |
| LULC Classes | Reference Data | User’s Accuracy (%) | |||||
|---|---|---|---|---|---|---|---|
| Agriculture | Forest | Built-Up | Shrub | Total | |||
| Classified data | Agriculture | 49 | 4 | 4 | 5 | 62 | 79.0 |
| Forest | 9 | 238 | 5 | 18 | 270 | 88.2 | |
| Built-up | 5 | 5 | 100.0 | ||||
| Shrub | 1 | 5 | 1 | 51 | 58 | 87.9 | |
| Total | 59 | 247 | 15 | 74 | 395 | ||
| Producer’s accuracy (%) | 83.1 | 96.4 | 33.3 | 51.0 | |||
| Overall accuracy (%) | 86.8 | ||||||
| Kappa Coefficient (T) | 0.747 | ||||||
| LULC Classes | Reference Data | User’s Accuracy (%) | |||||
|---|---|---|---|---|---|---|---|
| Agriculture | Forest | Built-Up | Shrub | Total | |||
| Classified data | Agriculture | 71 | 7 | 9 | 87 | 81.6 | |
| Forest | 15 | 237 | 5 | 257 | 92.2 | ||
| Built-up | 7 | 3 | 2 | 12 | 25.0 | ||
| Shrub | 2 | 4 | 33 | 39 | 84.6 | ||
| Total | 95 | 248 | 3 | 49 | 395 | ||
| Producer’s accuracy (%) | 74.7 | 95.5 | 100 | 67.4 | |||
| Overall accuracy (%) | 87.1 | ||||||
| Kappa Coefficient (T) | 75.5 | ||||||
| Year | Total Carbon (Mt C) | Carbon Sequestration (Mt C) | Net Present Value (Million USD) |
|---|---|---|---|
| 2000 | 157.673 | n/a | n/a |
| 2020 | 150.336 | −7.337 | −1369.382 |
| 2040 | 142.376 | −7.959 | −1485.490 |
Publisher’s Note: MDPI stays neutral with regard to jurisdictional claims in published maps and institutional affiliations. |
© 2022 by the authors. Licensee MDPI, Basel, Switzerland. This article is an open access article distributed under the terms and conditions of the Creative Commons Attribution (CC BY) license (https://creativecommons.org/licenses/by/4.0/).
Share and Cite
Avtar, R.; Rinamalo, A.V.; Umarhadi, D.A.; Gupta, A.; Khedher, K.M.; Yunus, A.P.; Singh, B.P.; Kumar, P.; Sahu, N.; Sakti, A.D. Land Use Change and Prediction for Valuating Carbon Sequestration in Viti Levu Island, Fiji. Land 2022, 11, 1274. https://doi.org/10.3390/land11081274
Avtar R, Rinamalo AV, Umarhadi DA, Gupta A, Khedher KM, Yunus AP, Singh BP, Kumar P, Sahu N, Sakti AD. Land Use Change and Prediction for Valuating Carbon Sequestration in Viti Levu Island, Fiji. Land. 2022; 11(8):1274. https://doi.org/10.3390/land11081274
Chicago/Turabian StyleAvtar, Ram, Apisai Vakacegu Rinamalo, Deha Agus Umarhadi, Ankita Gupta, Khaled Mohamed Khedher, Ali P. Yunus, Bhupendra P. Singh, Pankaj Kumar, Netrananda Sahu, and Anjar Dimara Sakti. 2022. "Land Use Change and Prediction for Valuating Carbon Sequestration in Viti Levu Island, Fiji" Land 11, no. 8: 1274. https://doi.org/10.3390/land11081274