Article

Composted Sewage Sludge Sustains High Maize Productivity on an Infertile Oxisol in the Brazilian Cerrado

by
Adrielle Rodrigues Prates
1,
Karen Cossi Kawakami
1,
Aline Renée Coscione
2,
Marcelo Carvalho Minhoto Teixeira Filho
1,
Orivaldo Arf
3,
Cassio Hamilton Abreu-Junior
4,
Fernando Carvalho Oliveira
5,
Adônis Moreira
6,
Fernando Shintate Galindo
4,
Zhenli He
7,
Arun Dilipkumar Jani
8,
Gian Franco Capra
9,10,*,
Antonio Ganga
9 and
Thiago Assis Rodrigues Nogueira
1,11
1
Department of Plant Protection, Rural Engineering, and Soils, São Paulo State University, Av. Brazil Sul n◦ 56, Ilha Solteira 15385-000, SP, Brazil
2
Center of Soils and Environmental Resources, Campinas Agronomic Institute, Av. Barão de Itapura n◦ 1481, Campinas 13020-902, SP, Brazil
3
Department of Plant Technology, Food Technology and Partner Economics, São Paulo State University, Av. Brazil Sul n◦ 56, Ilha Solteira 15385-000, SP, Brazil
4
Center for Nuclear Energy in Agriculture, Universidade de São Paulo, Av. Centenário n◦ 303, Piracicaba 13416-000, SP, Brazil
5
Tera Ambiental Ltda. Estrada Municipal do Varjão n◦ 4.520, Jundiaí 13212-590, SP, Brazil
6
Department of Soil Science, Embrapa Soja, Rodovia Carlos João Strass, Londrina 86001-970, PR, Brazil
7
Indian River Research and Education Center, Institute of Food and Agricultural Sciences, University of Florida, Fort Pierce, FL 34945, USA
8
Department of Biology and Chemistry, California State University, Monterey Bay, Seaside, CA 93955, USA
9
Dipartimento di Architettura, Design e Urbanistica, Università degli Studi di Sassari, Polo Bionaturalistico, Via Piandanna n◦ 4, 07100 Sassari, Italy
10
Desertification Research Centre, Università degli Studi di Sassari, Viale Italia n◦ 39, 07100 Sassari, Italy
11
School of Agricultural and Veterinarian Sciences, São Paulo State University, Via de acesso Prof. Paulo Donato Castellane, s/n, Jaboticabal 14884-900, SP, Brazil
*
Author to whom correspondence should be addressed.
Land 2022, 11(8), 1246; https://doi.org/10.3390/land11081246
Submission received: 1 June 2022 / Revised: 11 July 2022 / Accepted: 2 August 2022 / Published: 5 August 2022
(This article belongs to the Special Issue Soil Management for Sustainable Agriculture and Ecosystem Services)

Abstract

:
Mato Grosso do Sul State in Brazil is characterized by the ‘Cerrado’ ecoregion, which is the most biologically rich Savannah globally. In agricultural terms, the region produces several commodities that are exported around the world. This level of productivity has been achieved through the large-scale use of synthetic fertilizers, which has created several economic and environmental concerns. New approaches in soil fertility management are required to avoid environmental degradation, pollution, and socio-environmental damages. A field experiment, lasting two years, was conducted to investigate the composted sewage sludge (CSS) effects on an infertile acidic soil (Oxisol) planted to maize (Zea mays L.). The following complete randomized complete block design with a 4 × 2 + 2 factorial scheme (four replications) was applied: four CSS increasing rates (from 5.0 to 12.5 Mg ha−1, w.b.) following two application methods (whole area and between crop rows). A control, without CSS or synthetic fertilizers, and conventional synthetic fertilization without CSS were also investigated. Evaluated parameters were: (i) soil and leaf micronutrient concentrations; (ii) maize development, yield, and production. The CSS application increased: (i) the concentration of micronutrients in both soil and leaves; and (ii) the crop yield. Both were particularly true at the higher CSS applied rates. Such organic fertilizer can be safely used as a source of micronutrients for crops as an important low-cost and environmentally friendly alternative to mineral fertilizers, thus safeguarding soil health.

1. Introduction

Savannahs cover approximately 20% of the global land surface and provide several ecosystem services, including storage of over 15% of terrestrial above-ground carbon [1] and support of the livelihoods of millions of people through agriculture, resource extraction, and tourism. Consequently, research aiming to improve soil use and management is critically important from an environmental and socio-economic perspective.
The Cerrado is a vast tropical Savannah ecoregion of Brazil, accounting for 23.3% of the country’s land area. With approximately 10,000 plant species, it is classified as the most biologically rich Savannah globally [2]. Despite the presence of highly weathered soils, with low natural fertility in terms of both macro- and micronutrients [3], the efforts of researchers (from the beginning of the 90 s) to develop well-adapted cultivars for several tropical commodity crops have resulted in the Cerrado today providing more than 70% of beef in Brazil, in addition to large amounts of coffee (Coffea spp.), soybean (Glycine max (L.) Merr.), beans (Phaseolus sp.), and rice (Oryza sativa L.). In fact, the Cerrado is one of the most productive agroecosystems in the world [2].
Maize (Zea mays L.) yield in Brazil set a record of 87,000 thousand tons in 2020, making Brazil the third (after the US and China) and second (after the US) largest maize producing and exporting country in the world, respectively [4]. There are several reasons for this rise, including new maize varieties, increased demand for ethanol, and the expansion of production in Mato Grosso do Sul State [4], a region considered pivotal for the agricultural development of the entire world. The amounts of nutrients required for maize growth depend, in part, on soil and environmental conditions as well as yield expectations [5]. Consequently, all these factors must be considered when estimating nutrient needs for maize. For instance, Simão et al. [6] and Dias Borges et al. [7] claimed that B, Cu, Fe, Mn, and Zn are all indispensable for maize growth in the Cerrado ecoregion; however, the amounts and importance of these micronutrients at different growth stages depend on the aforementioned factors as well the maize variety.
One of the greatest challenges facing growers in the Cerrado is the low fertility status of soils in the region, thus strongly limiting crop productivity. Most of these soils are Oxisols and Ultisols low in SOM and plant available nutrients, limiting crop productivity [8]. Consequently, there is a strong reliance on synthetic fertilizers as well as in Cerrado cropping systems [9]. This management paradigm is responsible for several environmental and socio-economic concerns [10]. New approaches should be proposed that consider a circular economy perspective, i.e., the possible reuse of unconventional sources of fertilizers, such as by-products, leading to a change in the paradigm from a waste problem to a resource solution.
The inappropriate handling, storage, and disposal of human-produced waste generate severe environmental and human health concerns. Among these wastes, sewage sludge (SS) has garnered serious interest among scientists, policymakers, and the public because it supplies considerable amounts of organic matter [9,11] and both macro- [9,12] as well as micronutrients [13]. When used in agriculture, it has been shown to successfully replace commercial NPK mineral fertilizers by [14]: (i) maintaining soil fertility; (ii) enhancing microbial biomass and soil enzymatic activities; and (iii) preventing contamination and degradation of water resources [15,16].
Composting SS is a technique that significantly decreases pathogenic concentration, increases organic matter stabilization, and thus reduces the mobility of potentially toxic elements (PTE). Additionally, composted sewage sludge (CSS) is safer than SS in both agricultural and forestry applications [14,15] and is applied by many wastewater treatment plant (WTP) companies since it can reduce SS management costs [17]. The CSS can significantly improve the chemical quality of tropical soils [9,15]. In Brazil, CSS is considered an organic fertilizer if it meets the standards imposed by the national Normative [18].
We conducted a two-year field experiment on a low-fertility intensively cultivated Cerrado Oxisol with the aim of understanding how and to what extent CSS can influence soil properties and maize performance. The relationship and feedback between soil and plants were investigated as well through the application of multivariate statistics.

2. Materials and Methods
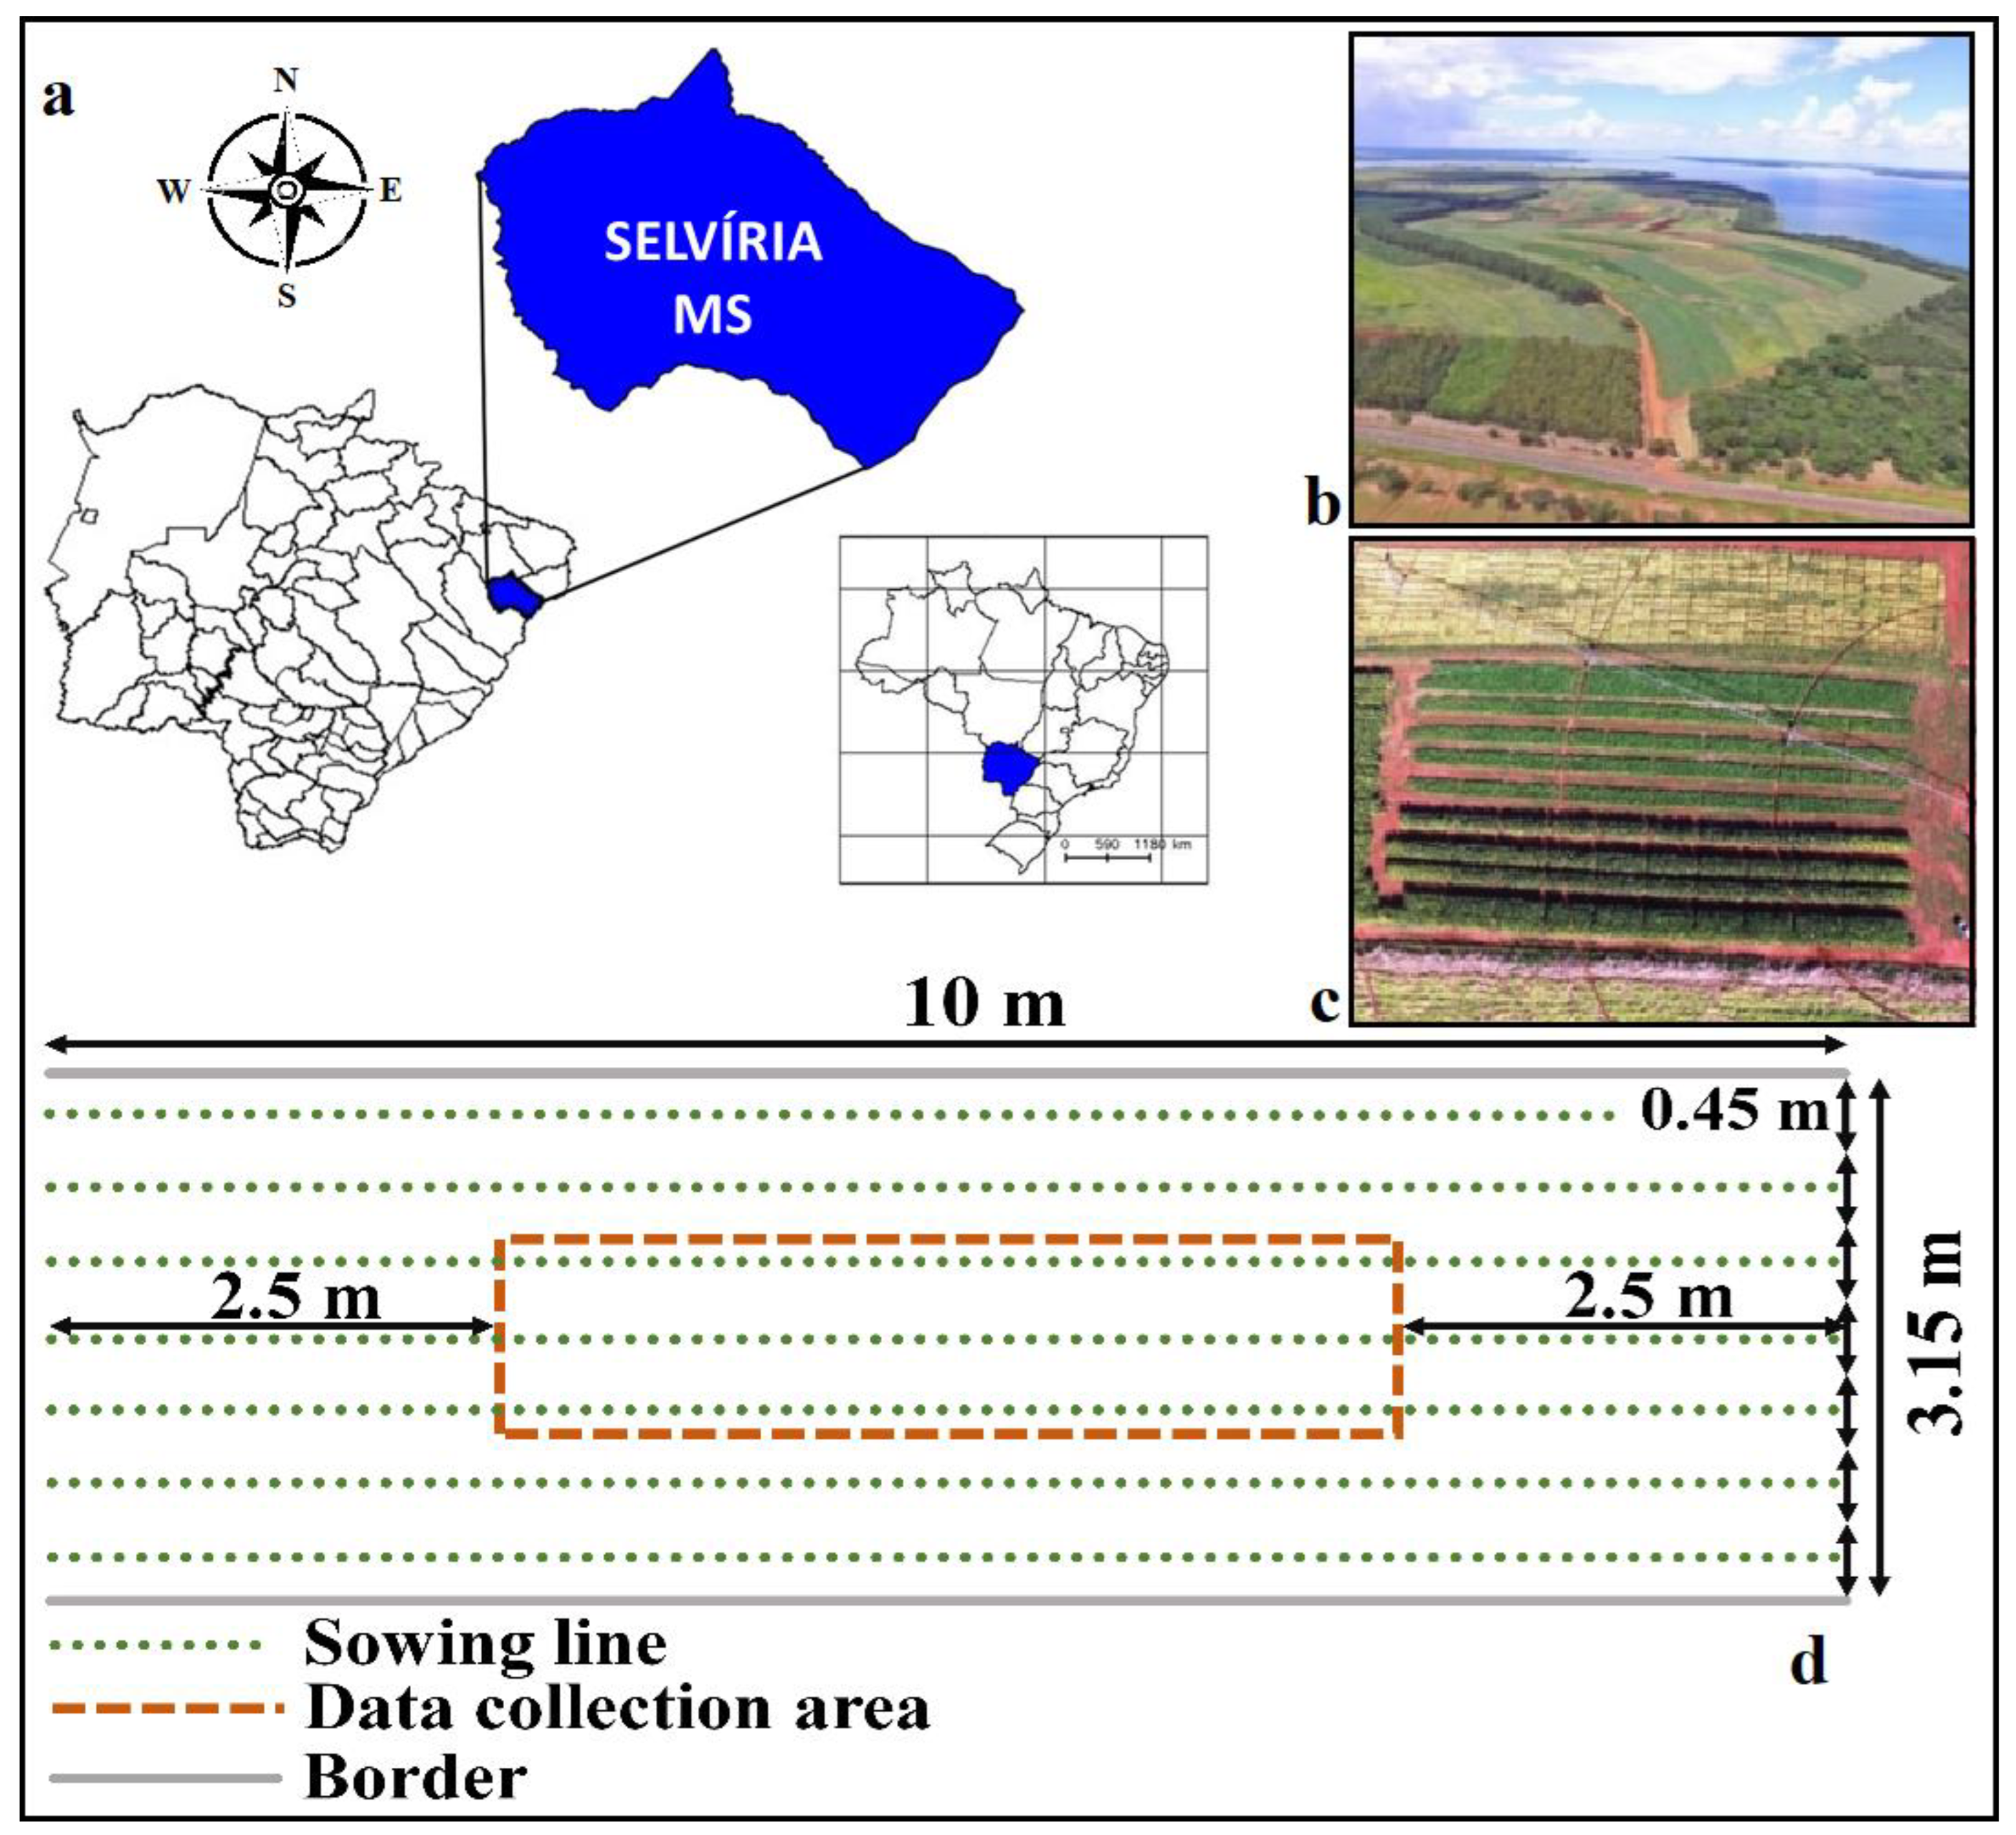
2.1. Study Area

The research (Figure 1a) was conducted for two consecutive crop seasons in 2017/18 and 2018/19 (Figure 1b,c). Investigated soil was a Rhodic Hapludox [19] with physical-chemical properties, as reported in Supplementary Material Table S1. Analyses were conducted on Ø ≤ 2.0 mm soil samples collected in the Ap horizon (0.0–0.2 m); Brazilian official procedures were applied [20,21].
Experimental units were 3.15 × 10 m, with each maize row spaced at 0.45 m (Figure 1d). The three central rows were used to collect soil and plant data (Figure 1d). Before the experiment, maize was the only crop for ten consecutive years; during that period, conventional mineral fertilization and agronomic management were applied.

2.2. Field Experiment

The experimental design was set up according to a randomized complete block design following a 4 × 2 + 2 factorial arrangement: 1. CSS application rates: 5.0, 7.5, 10.0, and 12.5 Mg ha−1 on a wet basis; 2. application method: whole area (WA, hereafter) or between rows (BR); 3. two additional treatments: (a) a control where neither CSS nor mineral fertilizers were applied, (b) an area treated with conventional fertilization (CF) only (i.e., N, P, K, B, and Zn).
Soil was tilled to 0.30 m depth, and maize was planted in plots with four replications (Figure 1c).

2.3. Sewage Sludge Features

Sewage sludge was generated, during a process lasting approximately one year, in a common municipal wastewater treatment plant of the São Paulo State (Brazil). It was composted to reduce the pathogenic agent concentration and increase solid biomass by up to 25%. The whole process is made up of (i) periodic mixing and air drying, through a forced aeration system, for three consecutive months; (ii) a plaster and limestone addition to increase porosity and pH, respectively; (iii) a mixture cleaning to reach approximately 40% in moisture content. Finally, it was carefully sieved, and maturation was achieved during the final 15 days. Thus, it was fully characterized from a bio-physico-chemical viewpoint, as required by the Brazilian legislation [22]. For the sake of brevity, the following features are here reported (mean ± SE, n = 3): pH-CaCl2: 7.0 ± 0.1; total moisture (%): 45.5 ± 0.2%; SOM: 309 ± 10 g kg−1; total N: 139.0 ± 0.3 g kg−1; C/N: 12.0 ± 0.8; CEC: 520 ± 20 mmolc kg−1; total P: 12.3 ± 1.4 g kg−1; total K: 6.0 ± 2.2 g kg−1; B: 94.0 ± 4.5 mg kg−1; Cu: 237.0 ± 16.5 mg kg−1; Fe: 16400 ± 1300 mg kg−1; Mn: 246 ± 37 mg kg−1; Zn: 456 ± 8 mg kg−1. Based on its chemical and biological properties, CSS was permitted for use as an amendment/fertilizer in agriculture, according to CONAMA [18].

2.4. Soil and Plant Preparation

Before the experiment began, 2.2 Mg ha−1 of lime (base saturation increased to 70%) and 1.8 Mg ha−1 of gypsum were applied [23].
Weed control was conducted by using 1.8 kg ha−1 (a.i.) of Glyphosate and 0.67 kg ha−1 (a.i.) of 2,4-Dichlorophenoxyacetic acid were applied; thus, CSS was applied seven days before and after sowing for WA and BR methods, respectively.
Maize seed (hybrid AG 7098, treated with insecticides and fungicides) was sown at approximately 73,333 plants per ha−1 (recommended rates; [24]).
Conventional fertilizer was applied at maize planning, with rates based on soil features, climatic conditions, maize hybrid, and research experience in the area. The following amounts were applied: 26 kg ha−1 of N (urea, 42% N), 90 kg ha−1 of P2O5 (triple superphosphate), 51 kg ha−1 of K2O (KCl, 60% of K2O), 1.0 kg ha−1 of B (boric acid), 2.0 kg ha−1 of Zn (zinc sulfate). An automatized irrigation system was designed for the whole investigated area to mitigate nutrient losses (volatilization processes) starting after the first CF application.
Weather conditions were recorded using a permanent daily-recording weather station installed in the field. The monthly rainfall, humidity, and temperature were recorded daily during all experimental periods (from November 2017 to October 2019). The highest rainfall (>300 mm per month) was observed in November and February, while lowest in June–July (<50 mm). Temperatures reached the highest values in September–October (>35 °C), while minimum values were observed in July–August (15 °C).
Before the experiment began, the soil was fully characterized for baseline conditions (Supplementary Material Table S1).

2.5. Soil and Plant Analysis

Five samples, collected at the end of the crop cycle, were randomly selected from the surface horizon (0–0.2 m) from each investigated plot. Micronutrient (bio)available concentrations were then assessed. In particular, Cu, Fe, Mn, and Zn were extracted with the DTPA-TEA method [20] and then analyzed by ICP–OES (inductively coupled plasma atomic emission spectroscopy). The barium chloride extraction method was used for B, with its concentration quantified by ultraviolet-visible (UV-Vis) spectroscopy. Analyses were performed in triplicates with blank samples to ensure accuracy. A standard reference material (SRM 2709a—San Joaquim) was used to test the precision of the applied analytical methods.
Ten different leaves were randomly collected from each investigated plot during the full bloom (R1) period [25]. Leaf micronutrient concentrations were determined according to Malavolta et al. [25]; HNO3 and HClO4 were used for dry material wet digestion. The azomethine-H colorimetric method for B determination. Atomic absorption spectrometry for Cu, Fe, Mn, and Zn.

2.6. Plant Development

The following plant parameters were assessed: plant height (PH), height from ear insertion (HEI), stem diameter (SD, all evaluated during the (R4) pasty grains phase), grain per ear (NGE), number of rows (NRE), and 1000 seed weight (SW, evaluated during the (R6) harvest period). Maize was harvested 143 days after seedling emergence and was reported at 13% moisture.

2.7. Statistical Analysis

The R statistical software [26] was used for univariate and multivariate statistics. The analysis of variance (ANOVA) for testing differences among mean values for both CSS rates and application method (WA or BR). In particular, in the case of F-test significance, a Tukey’s test (p ≤ 0.05) was applied. Significant differences (p ≤ 0.05) among CSS vs. Control and CF were tested by the Dunnett test. Interactions or effects of CSS applied rates were evaluated through polynomial regression analysis. Bivariate and multivariate relationships were investigated by means of a Pearson’s correlation matrix (CM) and factor analysis (FA), respectively. Before entering the multivariate statistic data, they were pretreated according to the method proposed by Capra et al. [27].

3. Results and Discussion

3.1. Soils

There was a CSS application rate by method interaction on soil micronutrient concentration, except for Cu and Mn after the first harvest year (Supplementary Material Table S2; Table 1). Specifically, at the end of the 2018 and 2019 harvests, CSS application in the WA showed a linear increase in Zn and B soil concentration, while the same held true only for B with CSS application under BR (Supplementary Material Table S2). For the 2018/2019 crop, a linear decrease was observed for Mn for CSS applied in the WA. Applications under BR promoted a B quadratic adjustment, while the peak (0.36 mg dm−3) reached the highest (12.5 Mg ha−1) CSS application rate (Table 1). This increase in B and Zn concentration with increasing CSS application rates was expected since this by-product was characterized by a higher concentration of both elements (vide supra).
There was a significant increase in soil concentrations of Mn-Zn and Cu-Fe-Zn after the first and second crop years, respectively, when CSS was applied along WA (Table 1). In general, applying increasing CSS rates, particularly 12.5 Mg ha−1, resulted in an increase in most soil micronutrients for both years (Table 1), regardless of the application method. By the end of 2018, soil B, Cu, and Fe concentrations were higher than in control plots. At an application rate of 12.5 Mg ha−1, these elements reached their highest values. Most micronutrient concentrations were lower or statistically similar to CF plots. Additionally, soil in plots treated with CF received supplemental B and Zn and were thus already enriched with these elements. Additionally, CSS application resulted in an increase in B in these infertile Oxisols of the Cerrado ecoregion, which is noteworthy since these soils are usually poor in B due to their low SOM content [3,6].
In terms of “interpretation limits” (Table 1; [21]), we observed a significant increase in (bio)available concentration of all investigated micronutrients from the control (usually characterized by “low” and “medium” values) vs. CF and CSS treated soils (“high” values).
Our findings strongly support the application of CSS in maize cultivation since it increased soil micronutrient concentration, following both WA and BR methods. We also demonstrated that the WA method should be preferred, as it is more practical and cost-effective than BR, while resulting in strong crop performance.

3.2. Plant

3.2.1. Leaf

When the CSS application method was compared with the CSS applied rate, several interactions on leaf micronutrient concentrations at the end of both years of maize cultivation (Supplementary Material Table S3) were observed. Particularly, at the end of the first agronomic year, as CSS rates increased, a linear decrease of Cu concentrations in maize leaves (R2 = 0.95) was observed if the WA method was applied. Iron showed a negative quadratic adjustment (ŷ = 208.825 − 23.030x − 1.260x2; R2 = 0.47 **) at the end of the first year using the WA method. Conversely, B, Cu, and Mn concentrations showed a negative quadratic adjustment, in both agronomic years, by using the BR method. A linear increase in leaf Zn levels was only observed at the end of the first year. The reduction in B, Cu, and Mn concentrations with a concomitant increase in Zn concentration, may be attributed to well-known competitive/inhibition processes among these nutrients [28].
No significant differences were observed in micronutrient concentrations in maize leaves sampled in the plots treated with CSS, CF, or the control, regardless of application method (Table 2).
When such values were compared with those (optimal concentration range, OCR; Table 2) suggested by Raij et al. [21], we observed that for all micronutrients, there were neither deficiencies nor toxicities, as all concentrations were within the proposed ranges. In fact, no visual symptoms of deficiencies or toxicities were observed in maize during the study.
Overall, the CSS application method by rate interactions on leaf micronutrient concentrations was micronutrient-dependent, suggesting that soil-plant feedbacks and micronutrient interactions through competitive/inhibition processes play a pivotal role in investigated micronutrient uptake. Most of the investigated micronutrients were within the adequate range [21], indicating that maize was not negatively influenced even at 12.5 Mg ha−1 CSS rate. Our findings suggest that CSS application promotes: (i) an adequate concentration of micronutrients, thus avoiding their deficiencies while (ii) avoiding toxicity problems. As for soils, few significant differences between application methods were observed in terms of maize micronutrient concentrations; thus, the WA application method must be recommended since it is the most cost-effective and less time-consuming to be implemented relative to BR.

3.2.2. Plant Parameters

A clear interaction between CSS rate and WA application method on the number of rows per ear (NRE) and crop yield (Supplementary Material Table S4) was observed at the end of the first year. A positive quadratic adjustment and a linear increase were respectively observed. Conversely, the BR method did not show significant residual effects.
We found that with CSS application, regardless of application method, mean values for all investigated parameters (PH, HEI, SD, NRE, NGE, SW, and Yield) were significantly higher than means under the control or similar means with CF (Table 3).
These results demonstrated that infertile, dystrophic, acidic Tropical Oxisols could receive several benefits when CSS is applied. As a matter of fact, it can be a possible alternative to conventional fertilizers for maize production in the Cerrado ecoregion. While previous research has demonstrated higher maize productivity with SS [29,30], this research firstly demonstrated how maize productivity could be positively influenced after just two years.
It must be emphasized that even low CSS rates positively impacted maize performance. Our results indicate that CSS could be used in infertile Oxisols for maize, even at low rates, with several benefits. Barbosa et al. [31] observed a positive residual effect on maize yields when 36 Mg ha−1 of SS was applied; however, we observed more positive results at lower application rates.

3.3. Multivariate Statistics

The CM revealed the following results (Table 4): (i) only leaf B concentration (vide infra) seems to have a negative effect on most of the investigated plant parameters, confirming that with an increase, especially with the BR method (vide supra), a negative effect on plants occurred; (ii) most of the other investigated elements in leaves did not affect plant parameters, with the exception of Zn, in which an increase resulted in elevated values for most plant parameters; (iii) an increase in most soil parameters (Fe excluded) favored an increase in all of the investigated plant parameters, particularly for B, Cu, and Zn.
The aforementioned results should be interpreted in the context of soil–plant relationships and feedbacks. Such mechanisms are not always easily explainable without additional analyses, such as scanning electron microscopy-based energy-dispersive X-ray spectroscopy, particle-induced X-ray emission, X-ray fluorescence microscopy, laser ablation inductively coupled plasma-mass spectrometry, nanoscale secondary ion mass spectroscopy, etc. [32]. Thus, further investigations will need to investigate such specific aspects, which are beyond the scope of the current research. However, some early outcomes can be outlined. First, looking at nutrient plant concentration and behavior, the reduction in B, Cu, and Mn concentrations with a concomitant increase in Zn, may be attributed, as previously reported, to well-known competitive/inhibition processes among these nutrients [33]. For example, Zn is extremely active in biochemical processes with other elements [34]. In plants, it can interfere with the control of ion absorption, causing a decrease in plant accumulation of other elements. This was particularly true, among other elements, for B, Cu, and Mn, whose uptake was especially depressed in the case of Zn presence in leaves. Such antagonistic interactions, in which the uptake of one element was competitively inhibited by the other, might indicate the same carrier sites in the absorption mechanisms of these metals. Thus, Zn presence in plants would be expected to reduce uptake of most nutrients, Fe and P included. Indeed, Zn vs. Fe antagonism is widely known, with its mechanism similar to the depressing effects of other trace metals [33]. There are two possible mechanisms for this interaction [35]: (i) the competition between Zn and Fe in uptake processes; (ii) the interference in chelation processes during the Fe-uptake and roots to shoots translocation. On the other hand, Zn–Fe can be featured by a synergistic interaction in the cases of adequate P supply; indeed, a relatively high accumulation of P and Zn in roots could promote the precipitation of FePO4 in root tissue, thus accounting for Fe uptake [36]. In terms of micronutrient behavior in the soil, it is well-known that the addition of sewage sludge to soil modifies the distribution pattern of several nutrients (e.g., B, Cu, and Zn), with a significant increase in easily assimilable and exchangeable forms [33]. This seems to be a major reason why improvements in most plant parameters (PH, HEI, SD, NRE, NGE, and SW) were observed (Table 4).
Through the factor analyses (FA; Table 5), five significant (eigenvalues > 1) factors were produced. The obtained five-component model accounts for more than 65% of all data variation. The F1 (variance: 19%) showed that most soil micronutrients were positively related to each other, confirming that these elements increased in the soil at increasing rates of their main sources with particular reference to CSS. This factor clearly showed that an increase in soil micronutrient concentrations was mainly due to CSS sources. Factors from F2 up to F5, even of minor importance, reported important correlations that: (i) were already explained through CM (F2, F4, and F5); (ii) emphasized the soil Zn role in increasing maize yield (F3). Overall, these four factors underline the pivotal role of some soil/plant micronutrient concentrations on selected plant parameters (for example, F3 represents the key role of soil Zn in increasing maize yield).
Overall, the factor analysis confirmed the pivotal role played by some specific micronutrients in the observed variability. These elements, which were more concentrated in CSS treatments and more effective with the WA method, exert a strong influence on plant parameters; in particular, they improved plant performance with specific reference to crop yield. Our results showed that low fertility Tropical Oxisols, cultivated with maize and treated with CSS following the WA application method, had higher B, Cu, and Zn concentrations than commercial treatments with mineral fertilizers.
Our outcomes warrant further investigation from a soil health perspective, too. Soil health, i.e., the continued capacity of soil to function as a vital living ecosystem that sustains plants, animals, and humans [36], is dramatically under threat, in part due to the misuse of synthetic fertilizers. As recently well summarized by Pahalvi et al. [37], managing soil health is a pivotal way of improving sustainable agricultural productions, thus safeguarding the overall biodiversity and ecosystem quality. Soil health is regulated and can be monitored by investigating physical-chemical properties. Thus, comparing soil physical-chemical properties in areas cultivated for maize production and treated with synthetic fertilizers vs. the same areas treated with increasing application of CSS provides important information on how soil health can be affected. Modern agriculture as practices in Brazil is largely dependent on the massive use of synthetic fertilizers [38]. Indeed, even if increasing soil crop productivity, their continuous application can bring (i) a decline in SOM; (ii) crust formation and pH alteration with particular emphasis for acidification; (iii) increase in pests, microbial activity, and diversity decrease; (iv) soil, air, and water pollution as well as greenhouse gas emissions. Thus, as demonstrated in the present research, a net decrease in the use of synthetic fertilizer application can be achieved by applying low-cost, environmentally friendly by-products that align with a circular-economy perspective [39,40,41]. By using CSS instead of CF, we obtained statistically comparable maize yields (Table 3) of c.a. 7400–7700 kg ha−1; however, and extremely important, this is true also at the lowest CSS applied rate (5.0 Mg ha−1; Table 3), meaning that even if a low amount of CSS is applied the same crop yield observed in soils treated with the common amount of CF used for the Cerrado unfertile soils, can be achieved. Additionally, using CSS instead of CF, we reached maize yields ranging from 6300 (by applying 5.0 Mg ha−1 of CSS) to 10,200 kg ha−1 (10.0 Mg ha−1), meaning an increase ranging from +18% to +88% in maize yield when compared with the mean productivity for Brazilian agricultural areas treated with conventional commercial fertilizers (~5400 kg ha−1; 2019–2020 harvest period [4]). Overall, this has been achieved without neither negatively affecting soil physical-chemical properties or creating soil pollution issues (vide supra). Substituting CF with CSS can enable economic benefits, while also enhancing soil health in the Cerrado.

4. Conclusions

Considering the global agricultural importance of the Cerrado, improving soil fertility while safeguarding its health represent a key socio-economic strategy for the entire world. This is particularly true for an area suffering from natural unfertile soils that have been intensively cultivated in part due to the availability of synthetic fertilizers, thus creating important environmental concerns. We demonstrated that CSS could efficiently replace conventional mineral fertilizers for the growth of a pivotal crop, such as maize. Our results demonstrated that CSS application led to excellent plant and agronomic performance without creating soil pollution issues, thus additionally safeguarding soil health.

Supplementary Materials

The following supporting information can be downloaded at: https://www.mdpi.com/article/10.3390/land11081246/s1, Supplementary Material Table S1. Soil surface (Ap; 0.0–0.25 m) main physical and chemical properties before the experiment started (mean ± SE, n = 3); Supplementary Material Table S2. Equation for micronutrient behavior in soils; function was obtained considering soil elements concentration after 2 years of maize cultivation vs. CSS applied rates. Supplementary Material Table S3. Equation for investigated micronutrient behavior in leaves; function was obtained considering leaf element concentration after 2 years of maize cultivation vs. CSS applied rates; Supplementary Material Table S4. Equation for investigated plant parameters; function was obtained considering investigated plant parameters after 2 years of maize cultivation vs. CSS applied rates.

Author Contributions

Conceptualization, A.R.P. and T.A.R.N.; data curation, A.M., F.S.G., G.F.C. and T.A.R.N.; formal analysis, A.R.P. and K.C.K.; funding acquisition, T.A.R.N.; investigation, A.R.P. and K.C.K.; methodology, A.R.P., A.R.C., M.C.M.T.F., O.A. and T.A.R.N.; project administration, T.A.R.N.; resources, T.A.R.N.; software, G.F.C. and A.G.; supervision, T.A.R.N.; validation, C.H.A.-J. and F.C.O.; visualization, G.F.C.; writing—original draft, A.R.P., Z.H., A.D.J., G.F.C. and T.A.R.N.; writing—review and editing, Z.H., A.D.J., G.F.C. and T.A.R.N. All authors have read and agreed to the published version of the manuscript.

Funding

This research was funded by the São Paulo Research Foundation (FAPESP), grant numbers 18/15152-4 and 19/02198-9.

Data Availability Statement

The information and database for this research are currently not on a platform or website. They can be provided by the corresponding author.

Acknowledgments

We thank the GENAFERT (Grupo de Estudo em Nutrição, Adubação e Fertilidade do Solo) for technical support. We also would like to thank the companies Biossolo Agricultura e Ambiente Ltda and Tera Ambiental Ltda, for compost supplying. The authors acknowledge the National Council for Scientific and Technological Development (CNPq) for the Research Grant to the last author (Grant Number 308374/2021-5).

Conflicts of Interest

The authors declare no conflict of interest.

References

  1. Moncrieff, G.R.; Scheiter, S.; Langan, L.; Trabucco, A.; Higgins, S.I. The future distribution of the savannah biome: Model-based and biogeographic contingency. Phil. Trans. R. Soc. B 2016, 371, 20150311. [Google Scholar] [CrossRef] [Green Version]
  2. Lima, F.F.; Lescano, C.H.; Oliveira, I.P. Fruits of The Brazilian Cerrado. Composition and Functional Benefits; Springer: Amsterdam, The Netherlands, 2021. [Google Scholar]
  3. Demattê, J.A.M.; Giasson, E.; Couto, E.G.; Samuel-Rosa, A.; de Castro, S.S.; Dalmolin, R.S.D.; Brilha, J.; Botelho, R.G.M.; Azevedo, A.C.; Cerri, C.E.P.; et al. The Soils of Brazil. Geoderma Reg. 2022, 29, e00503. [Google Scholar] [CrossRef]
  4. FAO. Food Outlook. In Biannual Report on Global Food Markets; FAO: Rome, Italy, 2021; Available online: http://www.fao.org/3/cb4479en/cb4479en.pdf (accessed on 24 May 2022).
  5. Gebrehiwot, K. Soil Management for Food Security. In Natural Resources Conservation and Advances for Sustainability; Jhariya, M.K., Meena, R.S., Banerjee, A., Meena, S.N., Eds.; Elsevier: Amsterdam, The Netherlands, 2022; pp. 61–71. [Google Scholar]
  6. Simão, E.P.; Resende, A.V.; Neto, M.M.G.; Silva, A.F.; Godinho, V.P.C.; Galvão, J.C.C.; Borghi, E.; Oliveira, A.C.; Giehl, J. Nitrogen fertilization in off-season corn crop in different Brazilian Cerrado environments. Pesqui. Agropec. Bras. 2020, 55, e01551. [Google Scholar] [CrossRef]
  7. Borges, I.D.; von Pinho, R.G.; de Andrade Pereira, J.L. Micronutrients accumulation at different maize development stages. Ciênc. Agrotecnol. 2009, 33, 1018–1025. [Google Scholar] [CrossRef] [Green Version]
  8. Lopes, A.S.; Guimarães, G.L.R. A career perspective on soil management in the Cerrado region of Brazil. Adv. Agron. 2016, 1–72. [Google Scholar] [CrossRef]
  9. Prates, A.R.; Coscione, A.R.; Teixeira Filho, M.C.M.; Miranda, B.G.; Arf, O.; Abreu-Junior, C.H.; Oliveira, F.C.; Moreira, A.; Galindo, F.S.; Sartori, M.M.P.; et al. Composted sewage sludge enhances soybean production and agronomic performances in naturally infertile soils (Cerrado region, Brazil). Agronomy 2020, 10, 1677. [Google Scholar] [CrossRef]
  10. Jankowski, K.; Neill, C.; Davidson, E.A.; Macedo, M.N.; Costa, C.; Galford, G.L.; Santos, L.M.; Lefebvre, P.; Nunes, D.; Cerri, C.E.P.; et al. Deep soils modify environmental consequences of increased nitrogen fertilizer use in intensifying Amazon agriculture. Sci. Rep. 2019, 8, 13478. [Google Scholar] [CrossRef] [Green Version]
  11. Abreu-Junior, C.H.; Brossi, M.J.L.; Monteiro, R.T.; Cardoso, P.H.S.; Mandu, T.S.; Nogueira, T.A.R.; Ganga, A.; Filzmoser, P.; Oliveira, F.C.; Firme, L.P.; et al. Effects of sewage sludge application on unfertile tropical soils evaluated by multiple approaches: A field experiment in a commercial Eucalyptus plantation. Sci. Total Environ. 2018, 655, 1457–1467. [Google Scholar] [CrossRef]
  12. Jakubus, M.; Graczyk, M. Microelement variability in plants as an effect of sewage sludge compost application assessed by different statistical methods. Agronomy 2020, 10, 642. [Google Scholar] [CrossRef]
  13. Jakubus, M. Sewage Sludge Origin and Administration, 1st ed.; Poznan University of Life Sciences Press: Poznań, Poland, 2012; pp. 1–56. (In Polish) [Google Scholar]
  14. Abreu-Junior, C.H.; Firme, L.P.; Maldonado, C.A.B.; Moraes Neto, S.P.; Alves, M.C.; Muraoka, T.; Boaretto, A.E.; Gava, J.L.; He, Z.; Nogueira, T.A.R.; et al. Fertilization using sewage sludge in unfertile tropical soils increased wood production in Eucalyptus plantations. J. Environ. Manag. 2017, 203, 51–58. [Google Scholar] [CrossRef] [Green Version]
  15. Florentino, A.L.; Ferraz, A.V.; De Moraes Gonçalves, J.L.; Asensio, V.; Muraoka, T.; Dos Santos Dias, C.T.; Abreu-Junior, C.H.; Nogueira, T.H.R.; Capra, G.F. Long-term effects of residual sewage sludge application in tropical soils under Eucalyptus plantations. J. Clean. Prod. 2019, 220, 177–187. [Google Scholar] [CrossRef]
  16. Bloem, E.; Albihn, A.; Elving, J.; Hermann, L.; Lehmann, L.; Sarvi, M.; Schaaf, T.; Schick, J.; Turtola, E.; Ylivainio, K. Contamination of organic nutrient sources with potentially toxic elements, antibiotics and pathogen microorganisms in relation to P fertilizer potential and treatment options for the production of sustainable fertilizers: A review. Sci. Total Environ. 2017, 607–608, 225–242. [Google Scholar] [CrossRef] [PubMed]
  17. Hamdi, H.; Hechmi, S.; Khelil, M.N.; Zoghlami, I.R.; Benzarti, S.; Monkni-Tlili, S.; Hassen, A.; Jedidi, N. Repetitive land application of urban sewage sludge: Effect of amendment rates and soil texture on fertility and degradation parameters. Catena 2019, 172, 11–20. [Google Scholar] [CrossRef]
  18. CONAMA–Conselho Nacional do Meio Ambiente. Resolução n° 375, de 29 de Agosto de 2006; Springer: Berlin/Heidelberg, Germany, 2020. Available online: http://www.mma.gov.br/port/conama/res/res06/res37506.pdf (accessed on 24 May 2022).
  19. Soil Survey Staff. Keys to Soil Taxonomy, 12th ed.; USDA; Natural Resources Conservation Service: Washington, DC, USA, 2014.
  20. Teixeira, P.C.; Donagemma, G.K.; Fontana, A.; Teixeira, W.G. Manual de Métodos de Análise de Solo, 3rd ed.; Embrapa Informação Tecnológica: Brasília, Brazil, 2017. [Google Scholar]
  21. Van Raij, B.; Andrande, J.C.; Cantarella, H.; Guaggio, J.A. Análise Química Para Avaliação da Fertilidade de Solos Tropicais; Instituto Agronômico: Campinas, Brazil, 2001.
  22. MAPA–Ministério da Agricultura, Pecuária e Abastecimento. Limites Máximos de Contaminantes Admitidos em Fertilizantes Orgânicos e Condicionadores de Solo. Instrução Normativa N° 7, de 12 de Abril de 2016. 2016. Available online: https://www.gov.br/agricultura/pt-br/assuntos/insumos-agropecuarios/insumos-agricolas/fertilizantes/legislacao/in-sda-27-de-05-06-2006-alterada-pela-in-sda-07-de-12-4-16-republicada-em-2-5-16.pdf (accessed on 24 May 2022).
  23. Van Raij, B.; Cantarella, H.; Quaggio, J.A.; Furlani, A.M.C. Recomendações de Adubação e Calagem Para o Estado de São Paulo, 2nd ed.; Instituto Agronômico de Campinas: Campinas, Brazil, 1997. [Google Scholar]
  24. Raij, B.V. Fertilidade do Solo e Manejo de Nutrientes; International Plant Nutrition Institute: Piracicaba, Brazil, 2011. [Google Scholar]
  25. Malavolta, E.; Vitti, G.C.; Oliveira, S.A. Avaliação do Estado Nutricional das Plantas: Princípios e Aplicações, 2nd ed.; POTAFOS: Piracicaba, Brazil, 1997. [Google Scholar]
  26. RStudio Team. RStudio: Integrated Development for R. RStudio; PBC: Boston, MA, USA, 2020; Available online: http://www.rstudio.com/ (accessed on 24 May 2022).
  27. Capra, G.F.; Coppola, E.; Odierna, P.; Grilli, E.; Vacca, S.; Buondonno, A. Occurrence and distribution of key potentially toxic elements (PTEs) in agricultural soils: A paradigmatic case study in an area affected by illegal landfills. J. Geochem. Explor. 2014, 145, 169e180. [Google Scholar] [CrossRef]
  28. He, M.M.; Tian, G.M.; Liang, X.Q. Phytotoxicity and speciation of copper, zinc and lead during the aerobic composting of sewage sludge. J. Hazard. Mater. 2009, 163, 671–677. [Google Scholar] [CrossRef] [PubMed]
  29. Simonete, M.A.; Kiehl, J.C.; Andrade, C.A.; Teixeira, C.F.A. Efeito do lodo de esgoto em um Argissolo e no crescimento e nutrição de milho. Pesq. Agropec. Bras. 2003, 38, 1187–1195. [Google Scholar] [CrossRef]
  30. Nascimento, C.W.A.; Barros, D.A.S.; Melo, E.E.C.; Oliveira, A.B. Alterações químicas em solos e crescimento de milho e feijoeiro após aplicação de lodo de esgoto. Rev. Ciênc. Agron. 2004, 28, 385–392. [Google Scholar] [CrossRef] [Green Version]
  31. Barbosa, G.M.C.; Tavares Filho, J.; Brito, O.R.; Fonseca, I.C.B. Efeito residual do lodo de esgoto na produtividade do milho safrinha. Rev. Bras. Ciênc. Solo 2007, 31, 601–605. [Google Scholar] [CrossRef]
  32. Kopittke, P.M.; Lombi, E.; van der Ent, A.; Wang, P.; Laird, J.S.; Moore, K.L.; Persson, D.P.; Husted, S. Methods to visualize elements in plants. Plant Physiol. 2020, 182, 1869–1882. [Google Scholar] [CrossRef] [Green Version]
  33. Kabata-Pendias, A.; Pendias, H. Trace Elements in Soils and Plants, 4th ed.; CRC Press: Boca Raton, FL, USA, 2011. [Google Scholar]
  34. Balafrej, H.; Bogusz, D.; Abidine Triqui, Z.E.; Guedira, A.; Bendaou, N.; Smouni, A.; Fahr, M. Zinc hyperaccumulation in plants: A review. Plants 2020, 9, 562. [Google Scholar] [CrossRef]
  35. Mousavi, S.R.; Galavi, M.; Rezaei, M. The interaction of zinc with other elements in plants: A review. Int. J. Agric. Crop Sci. 2012, 4, 1881–1884. [Google Scholar]
  36. Rudani, K.; Patel, V.; Kalavati, P. The importance of zinc in plant growth-A review. Int. Res. J. Nat. App. Sci. 2018, 5, 38–48. [Google Scholar]
  37. Lehmann, J.; Bossio, D.A.; Kögel-Knabner, I.; Rillig, M.C. The concept and future prospects of soil health. Nat. Rev. Earth Environ. 2020, 1, 544–553. [Google Scholar] [CrossRef] [PubMed]
  38. Pahalvi, H.N.; Rafiya, L.; Rashid, S.; Nisar, B.; Kamili, A.N. Chemical Fertilizers and Their Impact on Soil Health. In Microbiota and Biofertilizers; Dar, G.H., Bhat, R.A., Mehmood, M.A., Hakeem, K.R., Eds.; Springer: Cham, Switzerland, 2021; Volume 2. [Google Scholar] [CrossRef]
  39. Colussi, J.; Schnitkey, G.; Zulauf, C.; Department of Agricultural and Consumer Economics, University of Illinois at Ur-bana-Champaign. Rising Fertilizer Prices to Affect Brazil’s Largest Corn Crop. Farmdoc Dly. 2021, 11, 154. Available online: https://farmdocdaily.illinois.edu/2021/11/rising-fertilizer-prices-to-affect-brazils-largest-corn-crop.html (accessed on 8 July 2022).
  40. Guerrini, I.A.; Croce, C.G.G.; Bueno, O.C.; Jacon, C.P.R.P.; Nogueira, T.A.R.; Fernandez, D.M.; Ganga, A.; Capra, G.F. Composted sewage sludge and steel mill slag as potential amendments for urban soils involved in afforestation programs. Urban For. Urban Green 2017, 22, 93–104. [Google Scholar] [CrossRef]
  41. Silva, R.S.; Jalal, A.; Nascimento, R.E.N.; Elias, N.C.; Kawakami, K.C.; Abreu-Junior, C.H.; Oliveira, F.C.; Jani, A.D.; He, Z.; Zhao, F.; et al. Composted sewage sludge application reduces mineral fertilization requirements and improves soil fertility in sugarcane seedling nurseries. Sustainability 2022, 14, 4684. [Google Scholar] [CrossRef]
Figure 1. Experimental area at the Selvíria County (a: 20°20′35″ S, 51° 24′04″ W; 358 m asl; Mato Grosso do Sul State—MS, Brazil); (b) aerial view of the entire experimental area and (c) randomized plots; (d) schematic representation of a single plot with the individuation of the “useful area” for soil and plant data collection.
Land 11 01246 g001
Table 1. Boron, Cu, Fe, Mn, and Zn concentration (mg dm−3) in soils at the end of the investigated crop seasons.
Treatment BCuFeMnZn
WABRWABRWABRWABRWABR
______________________________________________________________2018___________________________________________________________________
Control0.27 ϰ1.9 ϰ20 ϰ18.7 ϰ0.7 ϰ
CF0.47 #2.1 ϰ#19 ϰ#21.0 ϰ#1.7 #
5.0 CSS0.33 abA ϰ0.27 bB ϰ2.3 aA #2.4 aA22 abB ϰ25 aA20.4 ϰ#21.8 ϰ#1.5 abA #1.3 aA #
7.5 CSS0.32 bA ϰ0.35 aA2.3 aA #2.1 aA ϰ# 21 abA ϰ#21 bA ϰ#22.1 ϰ#21.6 ϰ#1.0 bA ϰ1.2 aA ϰ#
10.0 CSS0.34 abA0.31 abA ϰ2.4 aA2.5 aA20 bB ϰ#25 aA19.4 ϰ#23.3 #1.7 aA #1.1 aA ϰ
12.5 CSS0.38 aA0.36 aA2.3 aA2.4 aA25 aA20 bB ϰ#21.4 ϰ#23.1 #1.7 aA #1.1 aA ϰ
F-test
AM3.82 NS1.08 NS0.76 NS6.84 *8.38 **
CSS rates 8.61 **4.11 *2.32 NS0.71 NS2.73 NS
(AM) × (CSS)3.21 *1.94 NS13.55 **2.22 NS3.86 *
CV (%)8.56.07.48.121.3
___________________________________________________________________2019____________________________________________________________________
Control0.17 ϰ1.1 ϰ13.7 ϰ12.0 ϰ0.4 ϰ
CF0.40 #1.2 #12.0 ϰ#12.7 ϰ#1.1 #
5.0 CSS0.28 cA0.28 bA1.3 bB #1.4 bA17.0 aA14.7 bB ϰ13.7 aA ϰ#13.7 aA ϰ#1.2 cA #1.2 cA #
7.5 CSS0.24 cB0.35 aA1.7 aA1.2 cB ϰ#18.5 aA11.0 cB ϰ#12.4 abA ϰ# 10.6 bB ϰ1.9 bA1.1 cB #
10.0 CSS0.39 bA#0.37 aA #1.4 bB1.6 aA14.3 bB ϰ17.7 aA11.1 bB ϰ#15.1 aA2.0 bA2.0 aA
12.5 CSS0.49 aA0.34 aB1.6 aA #1.3 bcB #18.0 aA10.5 cB #10.7 bA ϰ#8.2 cB3.1 aA1.6 bB
F-test
AM2.30 NS29.41 **90.83 **0.08 NS74.93 **
CSS rates61.52 **7.06 **4.75 **32.93 **59.21 **
(AM) × (CSS)41.90 **51.37 **52.96 **19.27 **30.28 **
CV (%)7.04.86.9 7.811.7
Interpretation limits(1)
Low0–0.200–0.20–40–1.20–0.5
Medium0.21–0.600.3–0.85–121.3–5.00.6–1.2
High>0.60>0.8>12>5.0>1.2
*, ** for p ≤ 0.05, ≤ 0.01, respectively; NS = not significant; WA = whole area; BR = between rows. Different lowercase and uppercase letters indicate significant differences between CSS rates (see from 5.0 till to 12.5 Mg ha−1, wet basis) or application methods (WA vs. BR), respectively. The absence of letters is for non-significant differences (p < 0.05). Different ϰ and # symbols along the same column show significant differences among treatments. wb = wet basis. (1) [21].
Table 2. Boron, Cu, Fe, Mn, and Zn concentration (mg dm−3) in leaves (1).
Treatment BCuFeMnZn
WABRWABRWABRWABRWABR
_______________________________________________________________2018________________________________________________________________________
Control23 ϰ19 ϰ115 ϰ66 ϰ35 ϰ
CF18 #16 ϰ#118 ϰ76 #39 #
5.0 CSS14 aB17 aA #23 aA ϰ21 aA ϰ#121 aA ϰ113 bcB ϰ71 ϰ#66 a ϰ41 #39 ab #
7.5 CSS16 aA #14 aA21 abA ϰ#14 bB ϰ#119 aA ϰ120 abA ϰ73 ϰ#66 a ϰ40 #36 b ϰ#
10.0 CSS16 aA #14 aA16 bcA ϰ#13 bA #93 bB108 cA ϰ67 ϰ57 b39 #39 ab #
12.5 CSS17 aA #16 aA #15 cA ϰ#18 abA ϰ#122 aA ϰ125 aA71 ϰ#68 a ϰ#41 #42 a #
F-test
AM0.24 NS7.24 *4.48 *20.54 **3.43 NS
CSS rates 1.77 NS9.84 **57.59 **7.25 **4.52 *
(AM) × (CSS)4.34 *4.95 **12.97 **1.38 NS2.85 NS
CV (%)11.415.13.25.74.6
___________________________________________________________________2019____________________________________________________________________
Control5 ϰ6 ϰ87 ϰ36 ϰ28 ϰ
CF6 ϰ7 ϰ90 ϰ37 ϰ#24 ϰ#
5.0 CSS5 aB ϰ13 aA6 aA ϰ6 bA ϰ99 bA #88 bB ϰ#28 aA22 cB24 ϰ#27 ϰ#
7.5 CSS5 aA ϰ5 cA ϰ7 aA ϰ7 bA ϰ90 bB ϰ#104 aA29 aA30 abA ϰ27 ϰ#26 ϰ#
10.0 CSS4 aB ϰ9 bA6 aB ϰ11 aA117 aA102 aB27 aB35 aA ϰ#29 ϰ#29 ϰ#
12.5 CSS5 aA ϰ5 cA ϰ7 aA ϰ6 bA ϰ89 bB ϰ#99 abA #29 aA25 bcA28 ϰ#27 ϰ
F-test
AM37.77 **6.33 *0.06 NS0.03 NS0.07 NS
CSS rates11.78 **7.46 **14.08 **6.94 **3.78 *
(AM) × (CSS)13.03 **8.22 **13.51 **9.11 **1.15 NS
CV (%)24.616.45.810.18.4
OCR(2)10–256–2030–25020–20015–100
For letters and symbols after mean values, see legend in Table 1; (1) Collection: full bloom (R1) period); OCR = optimal concentration range according to (2) Raij et al. [21].
Table 3. Plant parameters and yield at the end of the investigated crop seasons.
TreatmentsPHHEISDNRENGESWYield
WABRWABRWABRWABRWABRWABRWABR
_______________________ cm _______________________ _______ g _______________ kg ha−1 ________
______________________________________________________________2018______________________________________________________________________
Control187 ϰ114 ϰ2,0 ϰ17 ϰ465 ϰ233 ϰ5304 ϰ
CF215 #131 #2,5 #17 #621 #267 #7767 #
5.0 CSS211 #207 #128 #125 #2.32.317 bB ϰ18 aA #581 #608 #266 #264 #6359 bB ϰ7493 aA #
7.5 CSS212 #205 #129 #130 #2.4 #2.4 #17 aA #17 aA #631 #633 #267 #269 #7466 aA #7523 aA #
10.0 CSS214 #212 #128 #131 #2.32.4 #17 aA #18 aA #621 #614 #270 #266 #7706 aA #7424 aA #
12.5 CSS209 #213 #131 #129 #2.4 #2.4 #17 aB #18.0 aA #616 #646 #277 #273 #7921 aA #7717 aA #
F-test
AM1.10 NS0.00 NS0.95 NS18.51 **1.30 NS0.21 NS0.86 NS
CSS rates (wb) 0.98 NS1.42 NS2.27 NS3.32 *2.26 NS1.14 NS3.93 *
(AM) × (CSS)1.43 NS0.85 NS0.72 NS4.86 **0.62 NS0.12 NS2.97 *
CV (%)2.73.22.42.05.44.17.4
___________________________________________________________________2019____________________________________________________________________
Control214 ϰ128 ϰ1.8 ϰ16 ϰ523 ϰ256 ϰ8143 ϰ
CF232 #143 #2.2 ϰ16 ϰ550 ϰ290 #9524 ϰ#
5.0 CSS221 ϰ#224 ϰ#135 ϰ#138 #2.1 ϰ2.0 ϰ16 ϰ16 ϰ524 ϰ555 ϰ287 #284 ϰ#9722 ϰ#8707 ϰ#
7.5 CSS222 ϰ#229 ϰ#138 #138 #2.2 ϰ2.2 ϰ17 ϰ17 ϰ540 ϰ563 ϰ282 ϰ#294 #9373 ϰ#10176 #
10.0 CSS228 ϰ#227 ϰ#136 ϰ#137 #2.1 ϰ2.0 ϰ17 ϰ16 ϰ553 ϰ529 ϰ302 #290 #9473 ϰ#10224 #
12.5 CSS228 ϰ#230 ϰ#139 #139 #2.1 ϰ2.1 ϰ16 ϰ16 ϰ556 ϰ663 ϰ294 #299 #9696 ϰ#9963 #
F-test
AM1.16 NS0.34 NS1.04 NS0.07 NS0.51 NS0.01 NS0.42 NS
CSS rates (wb) 1.72 NS0.62 NS1.06 NS1.06 NS0.57 NS1.33 NS0.94 NS
(AM) × (CSS)0.49 NS0.18 NS0.13 NS1.06 NS0.91 NS1.18 NS1.84 NS
CV (%)6.53.08.73.96.64.79.3
For letters and symbols after mean values, see legend in Table 1; PH = plant height; HEI = height from ear insertion; SD = stem diameter; NRE = number of rows per ear; NGE = number of grains per ear; SW = 1000 seed weight; wb = wet basis.
Table 4. Correlation matrix according to Pearson’s correlations coefficients.
B_LCu_LFe_LMn_LZn_LB_SCu_SFe_SMn_SZn_S
PH−0.53 ***NSNSNS0.58 ***0.45 **0.51 ***NSNS0.53 ***
HEI−0.54 ***NSNSNS0.36 *0.36 *0.33 *NSNS0.40 *
SD−0.46 **NSNSNS0.53 ***0.55 ***0.47 **NSNS0.49 **
NRENSNSNSNSNSNS0.46 **NSNSNS
NGE−0.46 **NSNSNS0.45 **0.38 *0.44 **NSNS0.38 *
SW−0.55 ***NSNSNS0.41 **0.39 *0.49 **NS0.37 *0.37 *
Yield−0.38 *−0.40 *NSNSNS0.52 ***NSNS0.34 *0.37 *
*, **, *** for p ≤ 0.05, ≤0.01, ≤0.001, respectively; NS = not significant; _L, green = micronutrients concentration in leaf; _S, orange = micronutrients concentration in soils; Plant parameters are reported in grey: PH = plant height; HEI = height from ear insertion; SD = stem diameter; NRE = number of rows per ear; NGE = number of grains per ear; SW = 1000 seed weight.
Table 5. Factor analysis (FA) was extracted through the principal factor analysis (PFA) and rotation method (bold loadings > 0.5).
ParametersFactors
F1F2F3F4F5
PH−0.029−0.010−0.0800.132−0.872
HFP0.140−0.2610.0350.840−0.063
NPP−0.106−0.8490.0500.128−0.081
NGP−0.014−0.9170.070−0.067−0.054
SW0.2140.1870.3760.103−0.225
FPP−0.1840.3740.3160.6950.072
Yield0.126−0.1080.889−0.0930.077
B_L−0.1290.1350.1340.3070.634
Cu_L0.1320.035−0.2990.7060.047
Fe_L0.1180.156−0.0930.0900.126
Mn_L0.1310.340−0.2680.1290.510
Zn_L0.1260.0050.2250.104−0.078
B_S0.878−0.0390.1220.0980.016
Cu_S0.8840.1070.1410.0310.055
Fe_S0.6950.125−0.3440.018−0.269
Mn_S0.3130.159−0.482−0.0320.014
Zn_S0.613−0.0360.6360.0380.127
Variance (%)191414108
Cumulative variance (%)1933465765
Eigenvalues3.1802.3872.3061.7781.405
Plant parameters are reported in grey (see Legend in Table 4); leaf micronutrient concentration in green; and soil micronutrient concentration in orange.
Publisher’s Note: MDPI stays neutral with regard to jurisdictional claims in published maps and institutional affiliations.

