
The Influence of Socio-Demographic Factors on Preference and Park Usage in Guangzhou, China


Abstract
:1. Introduction
2. Methodology
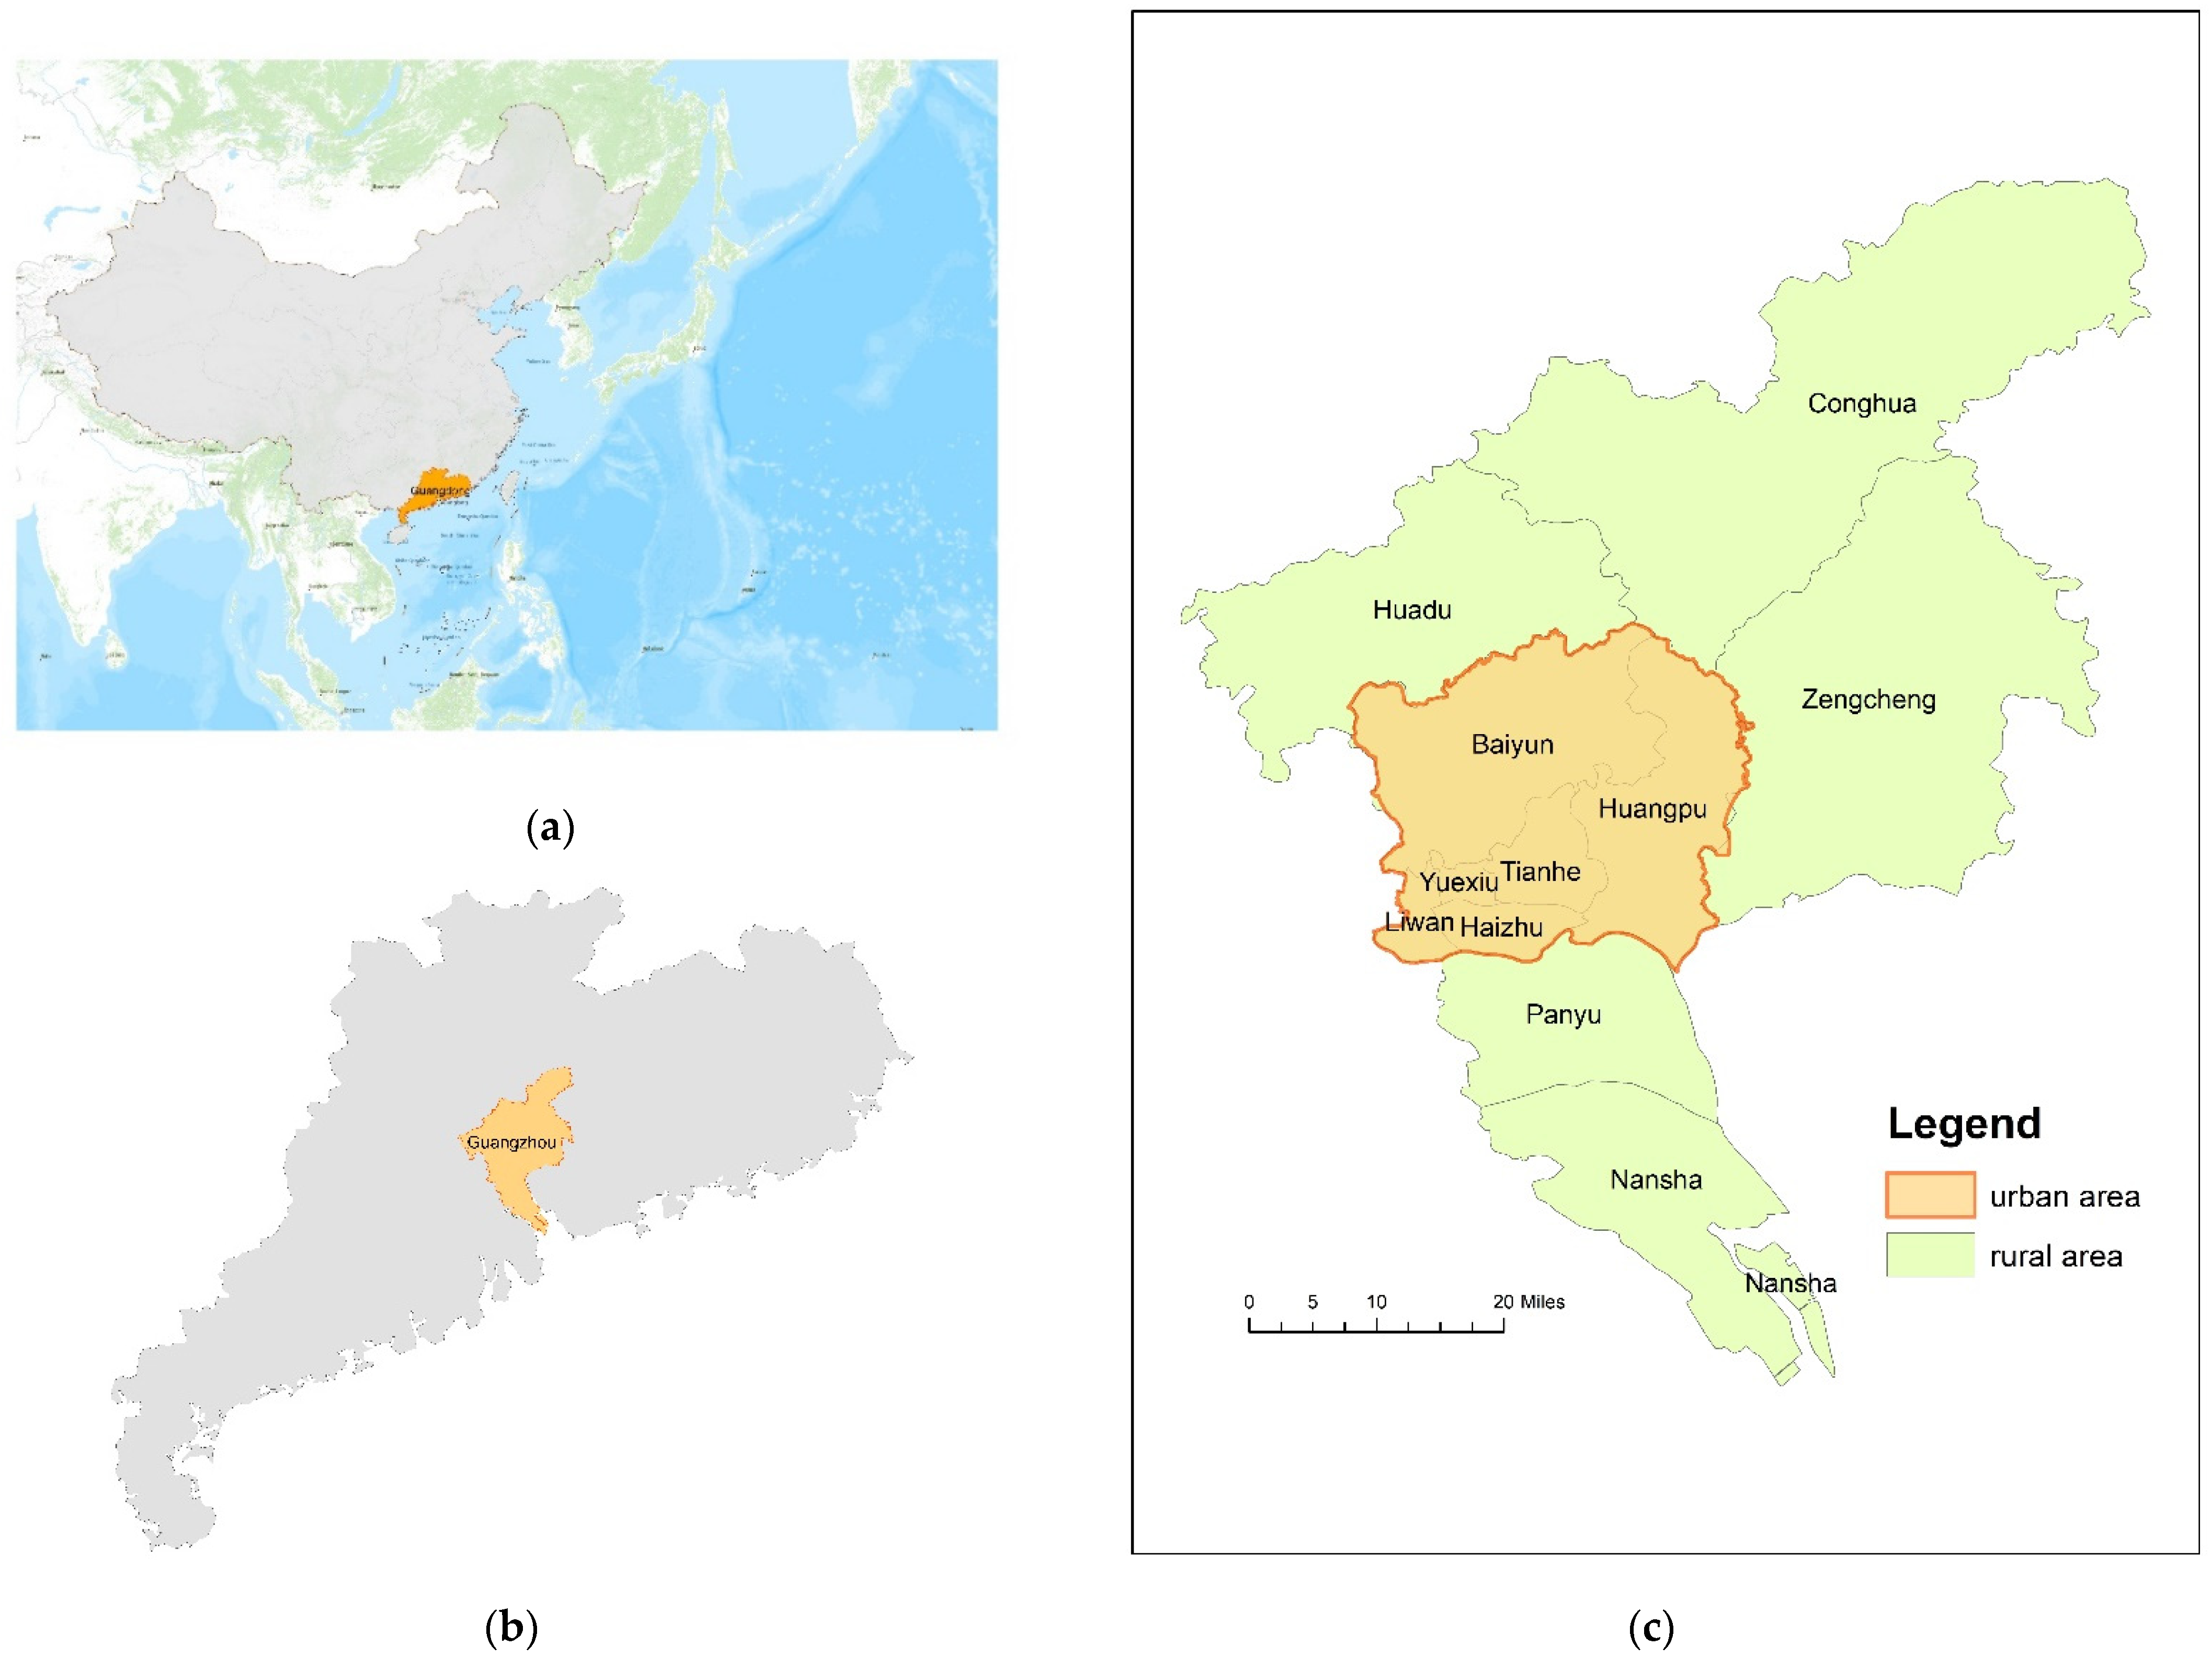
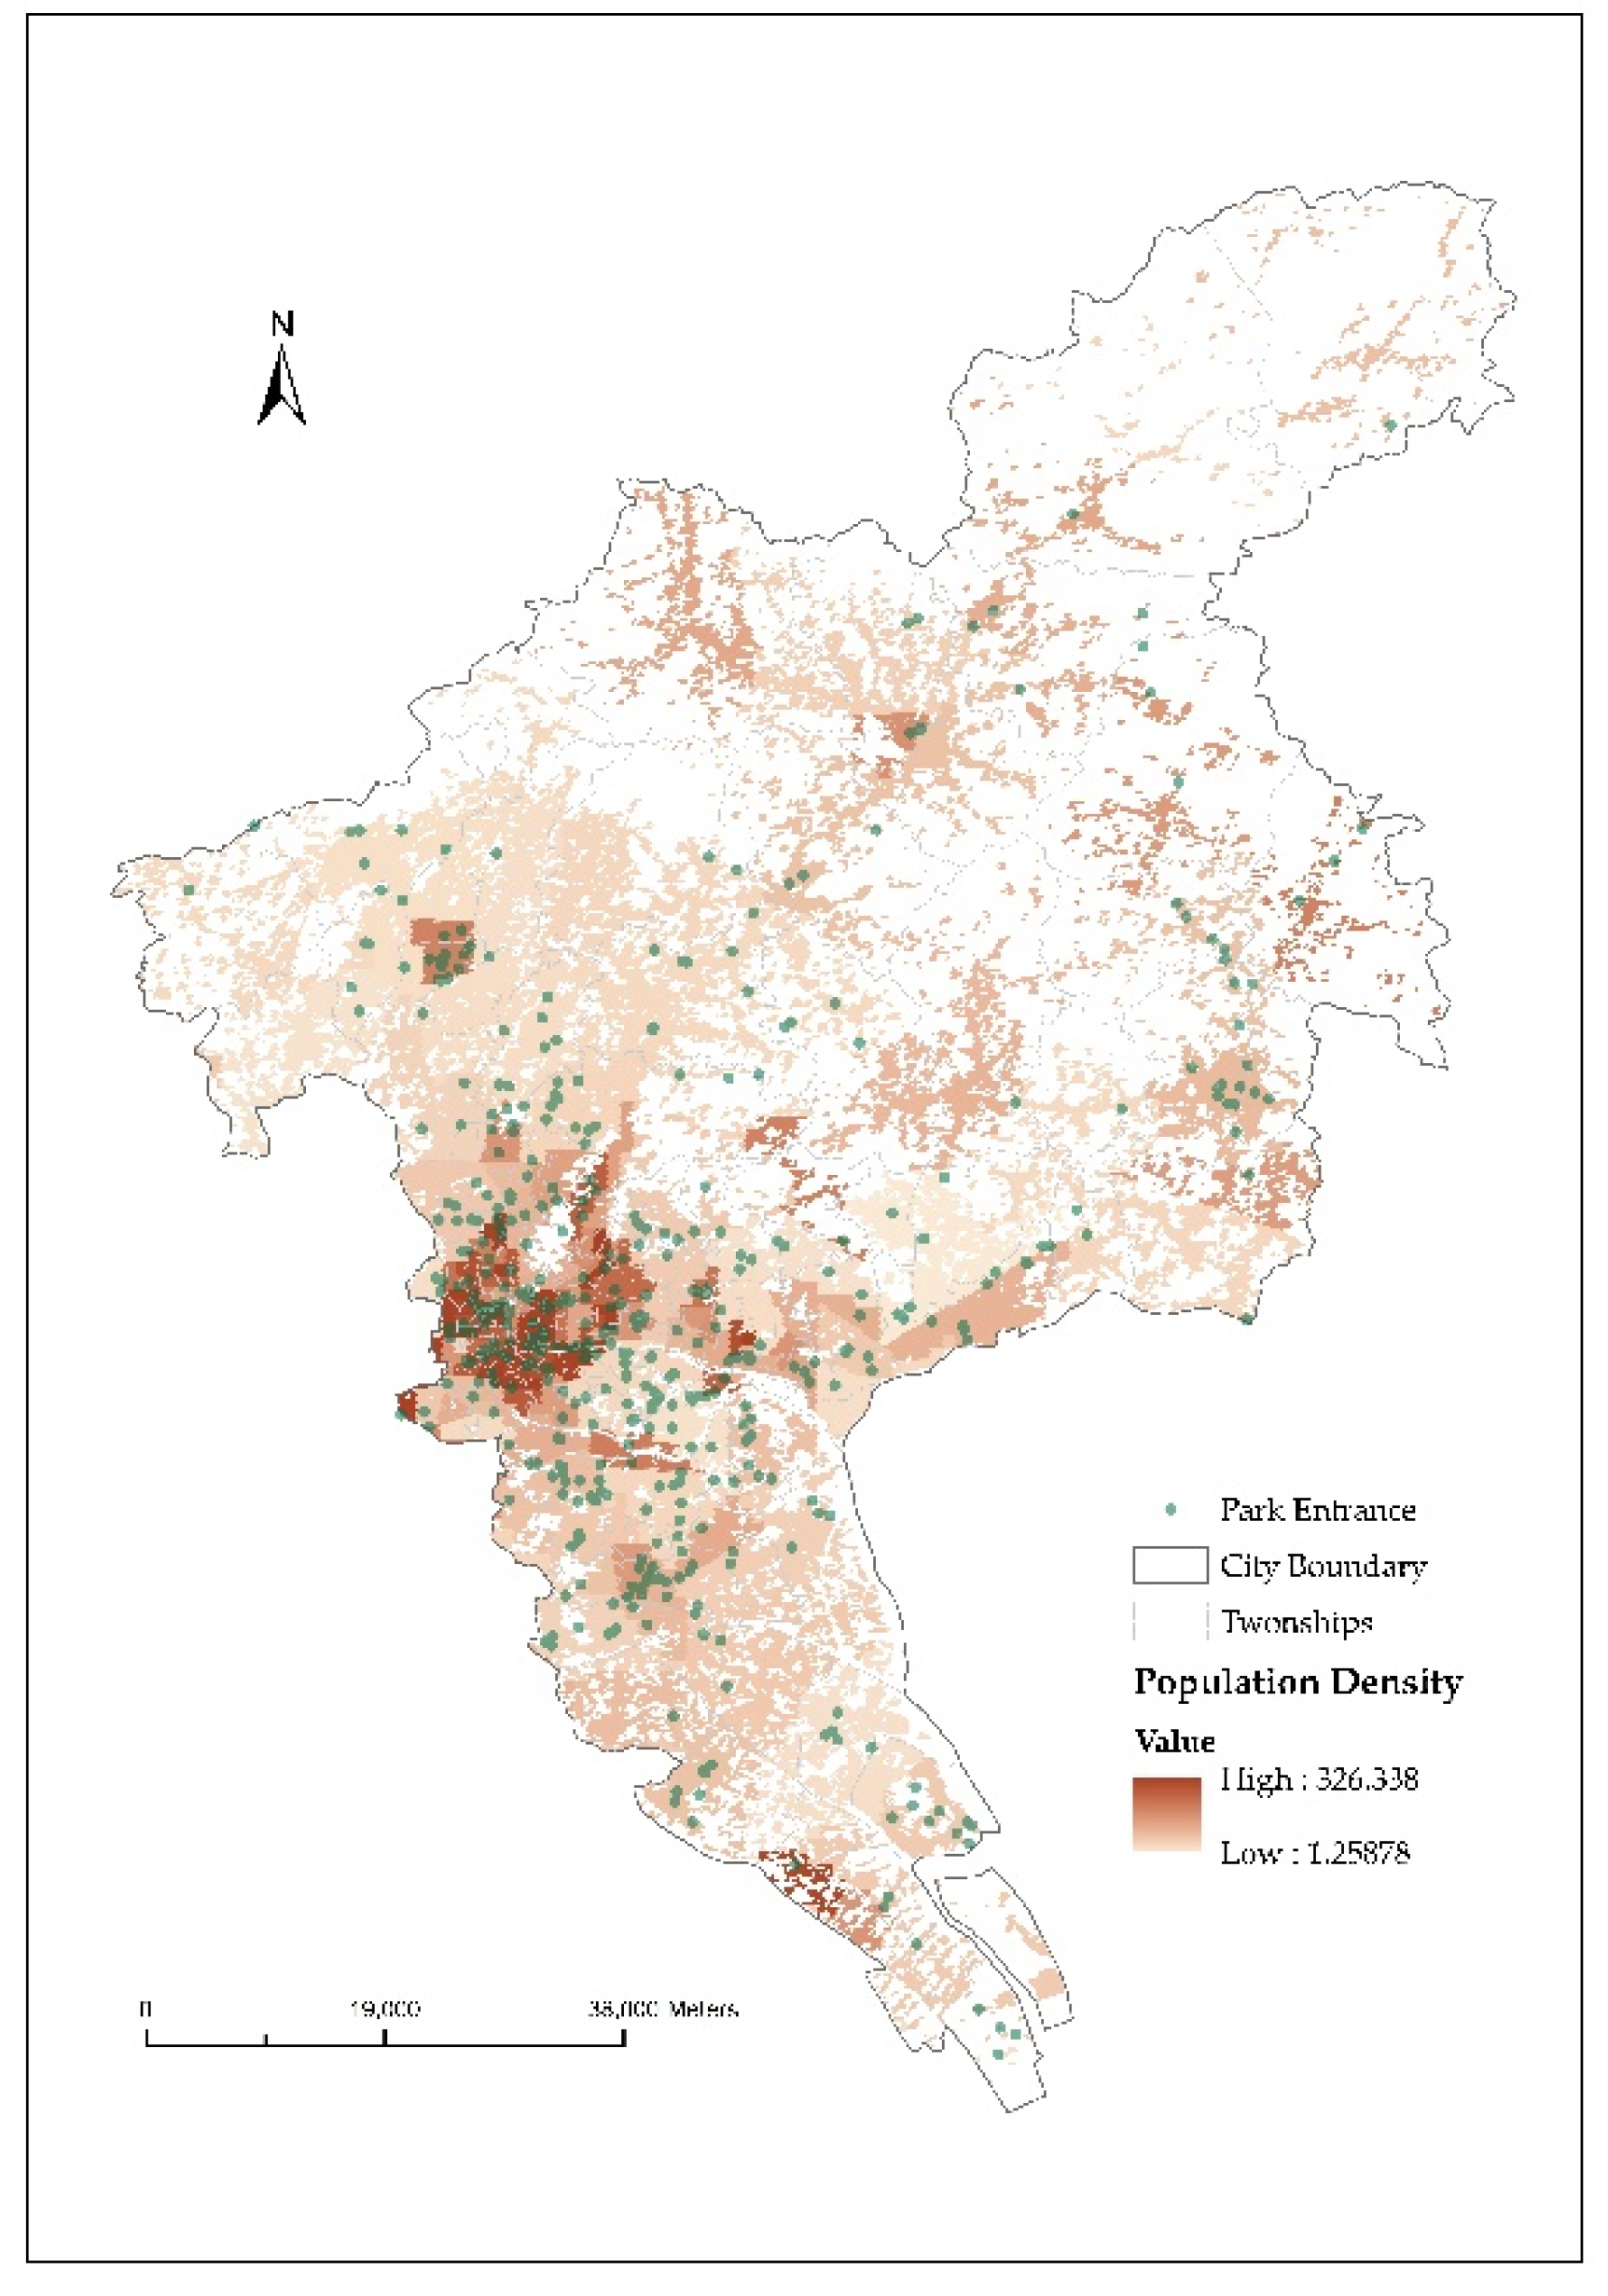
2.1. Study Area
2.2. Data Collection and Measures
3. Results
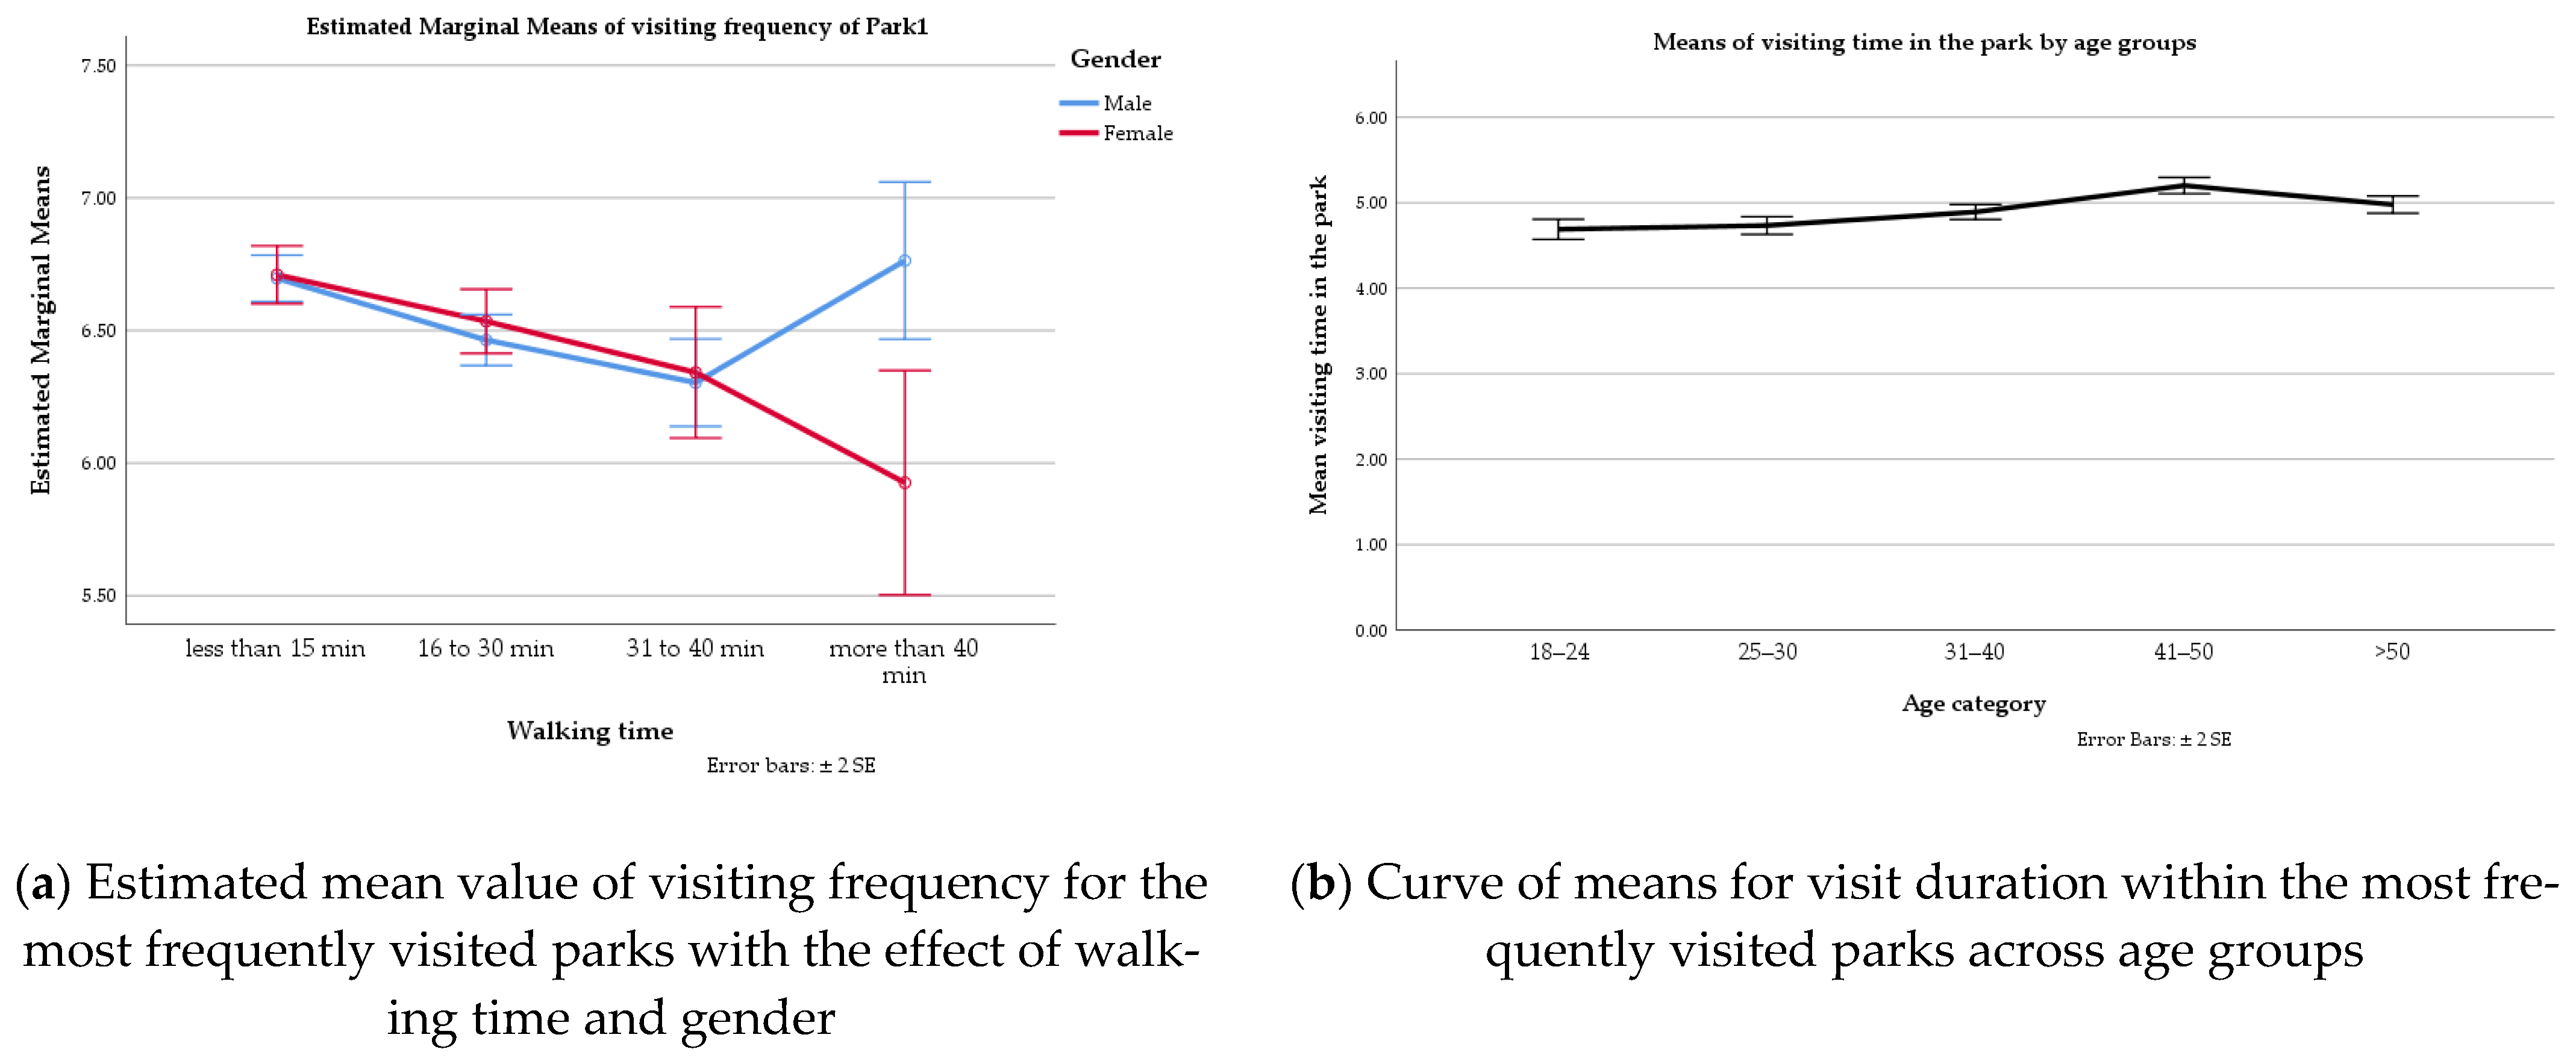
3.1. Visiting Preferences across Demographic Groups for Parks Visited on Foot
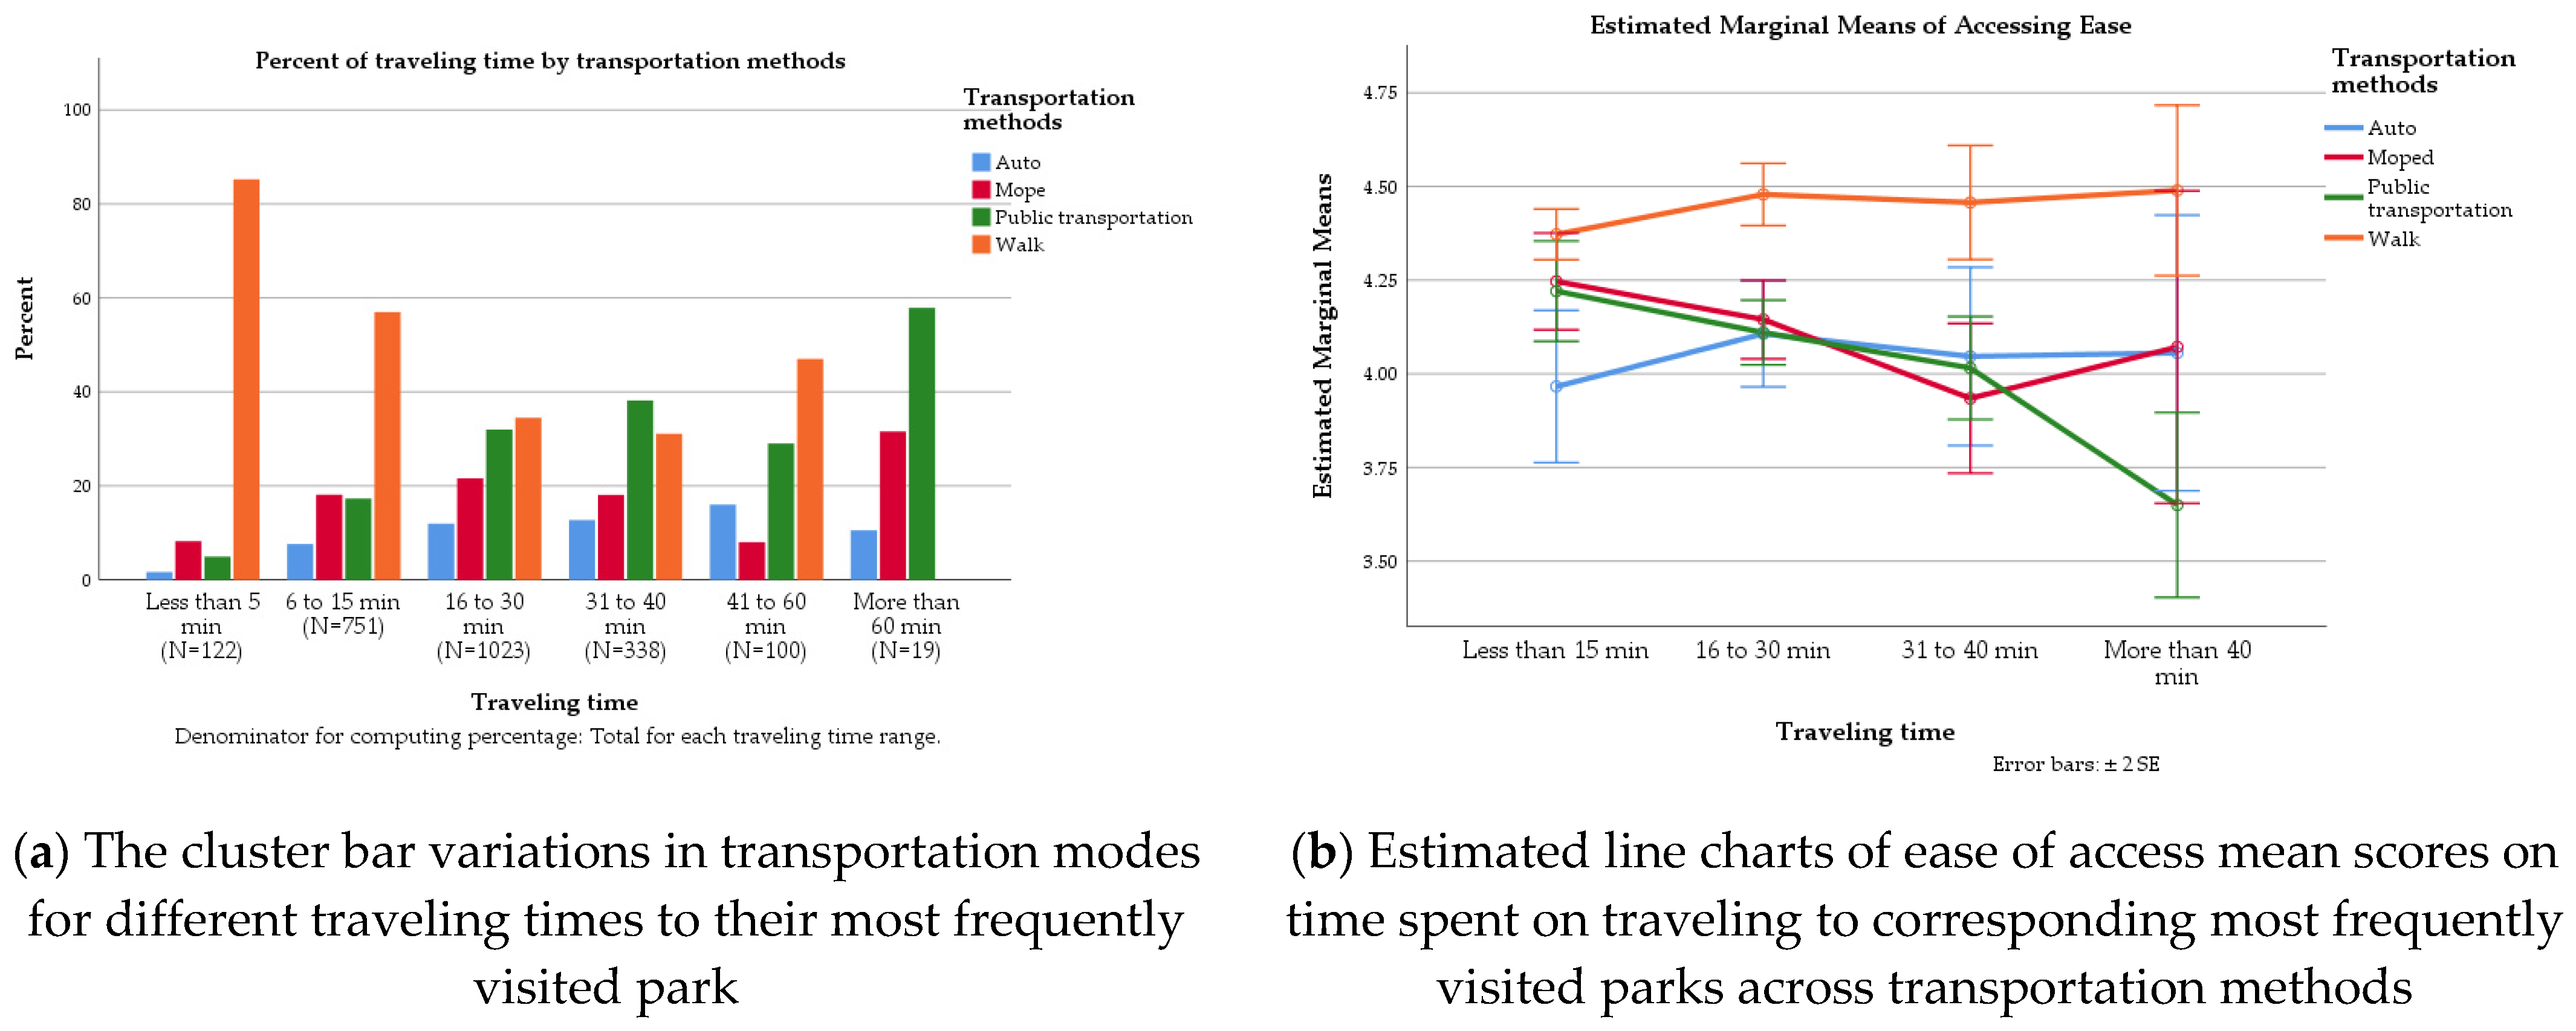
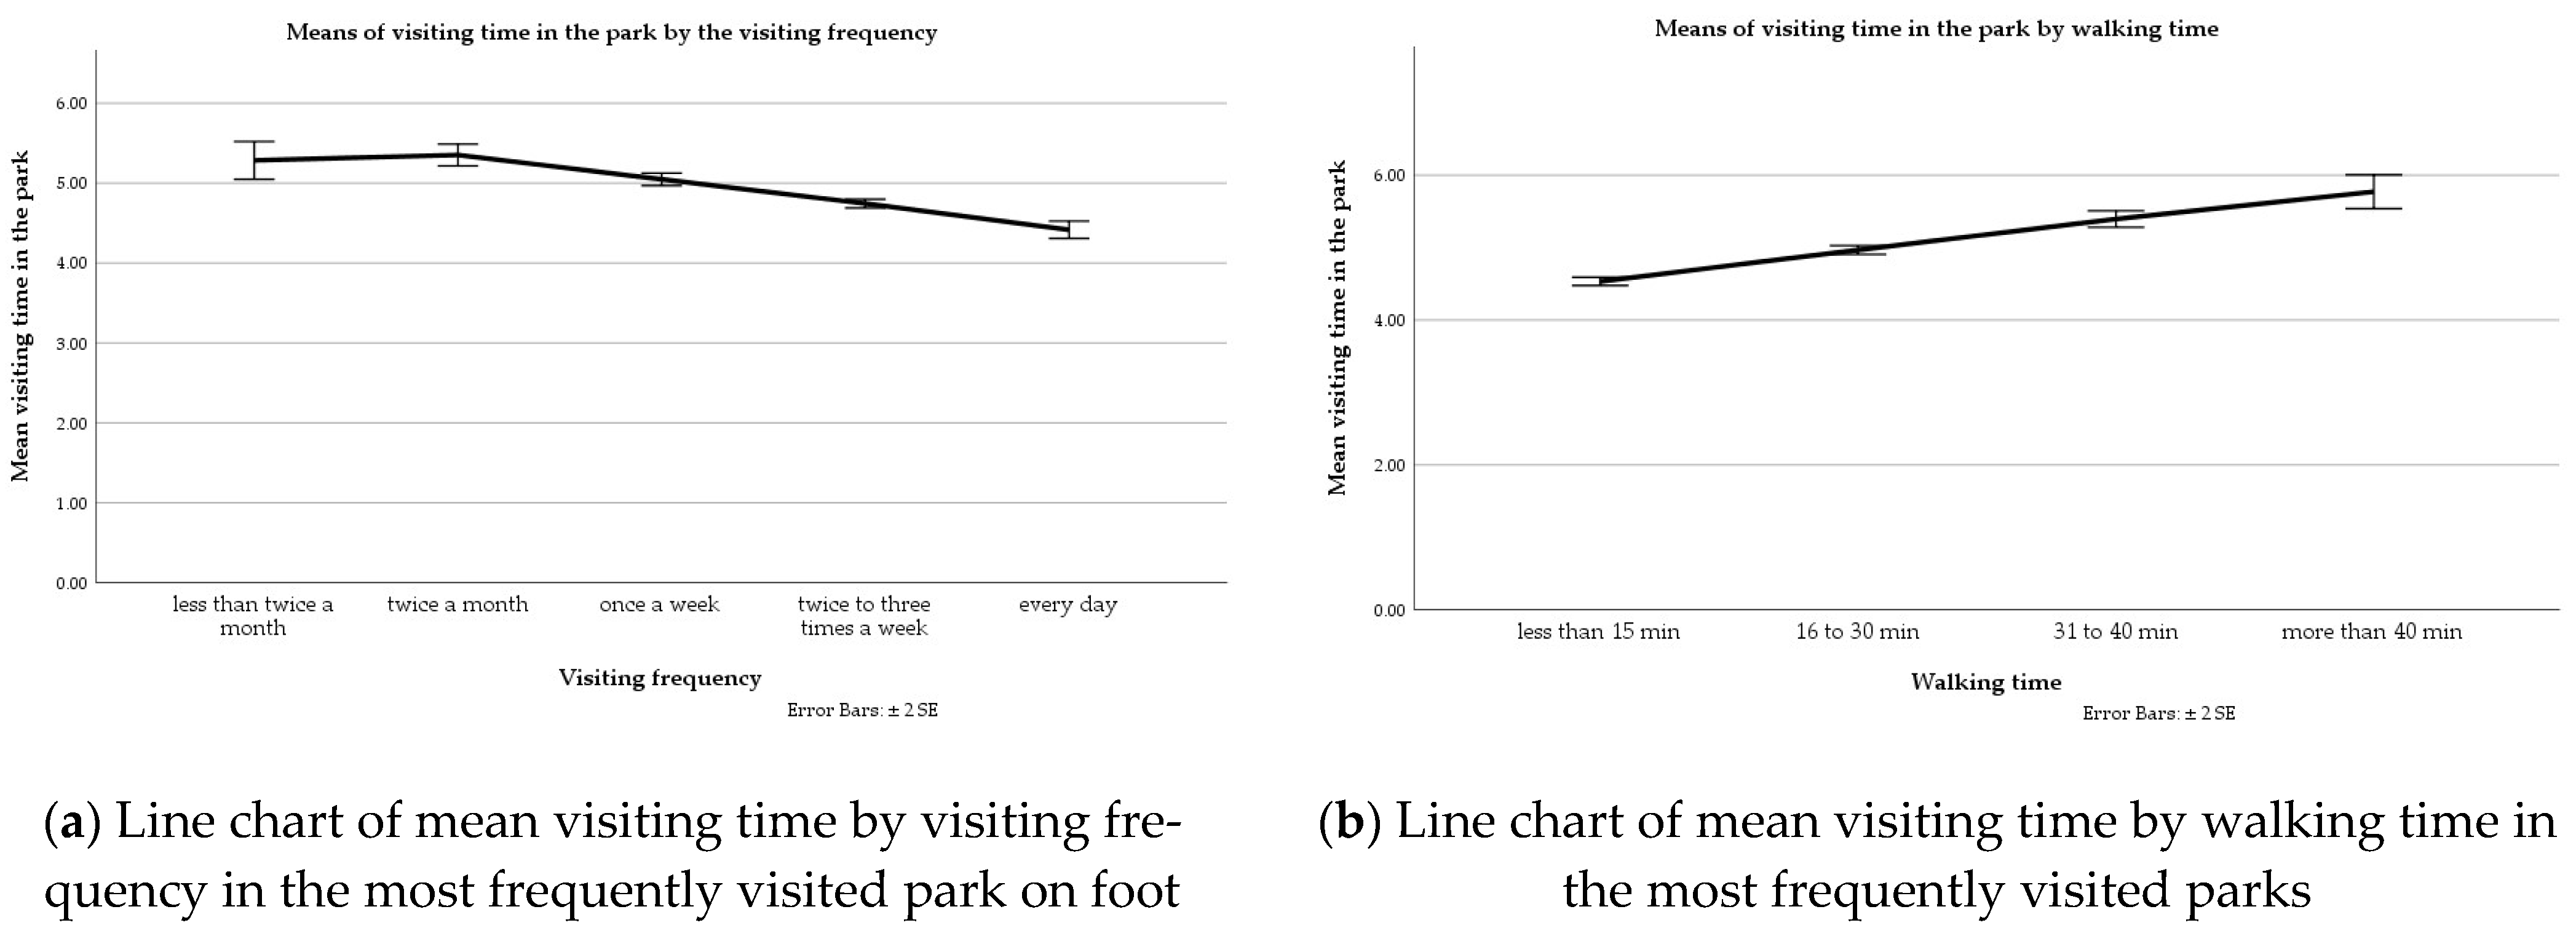
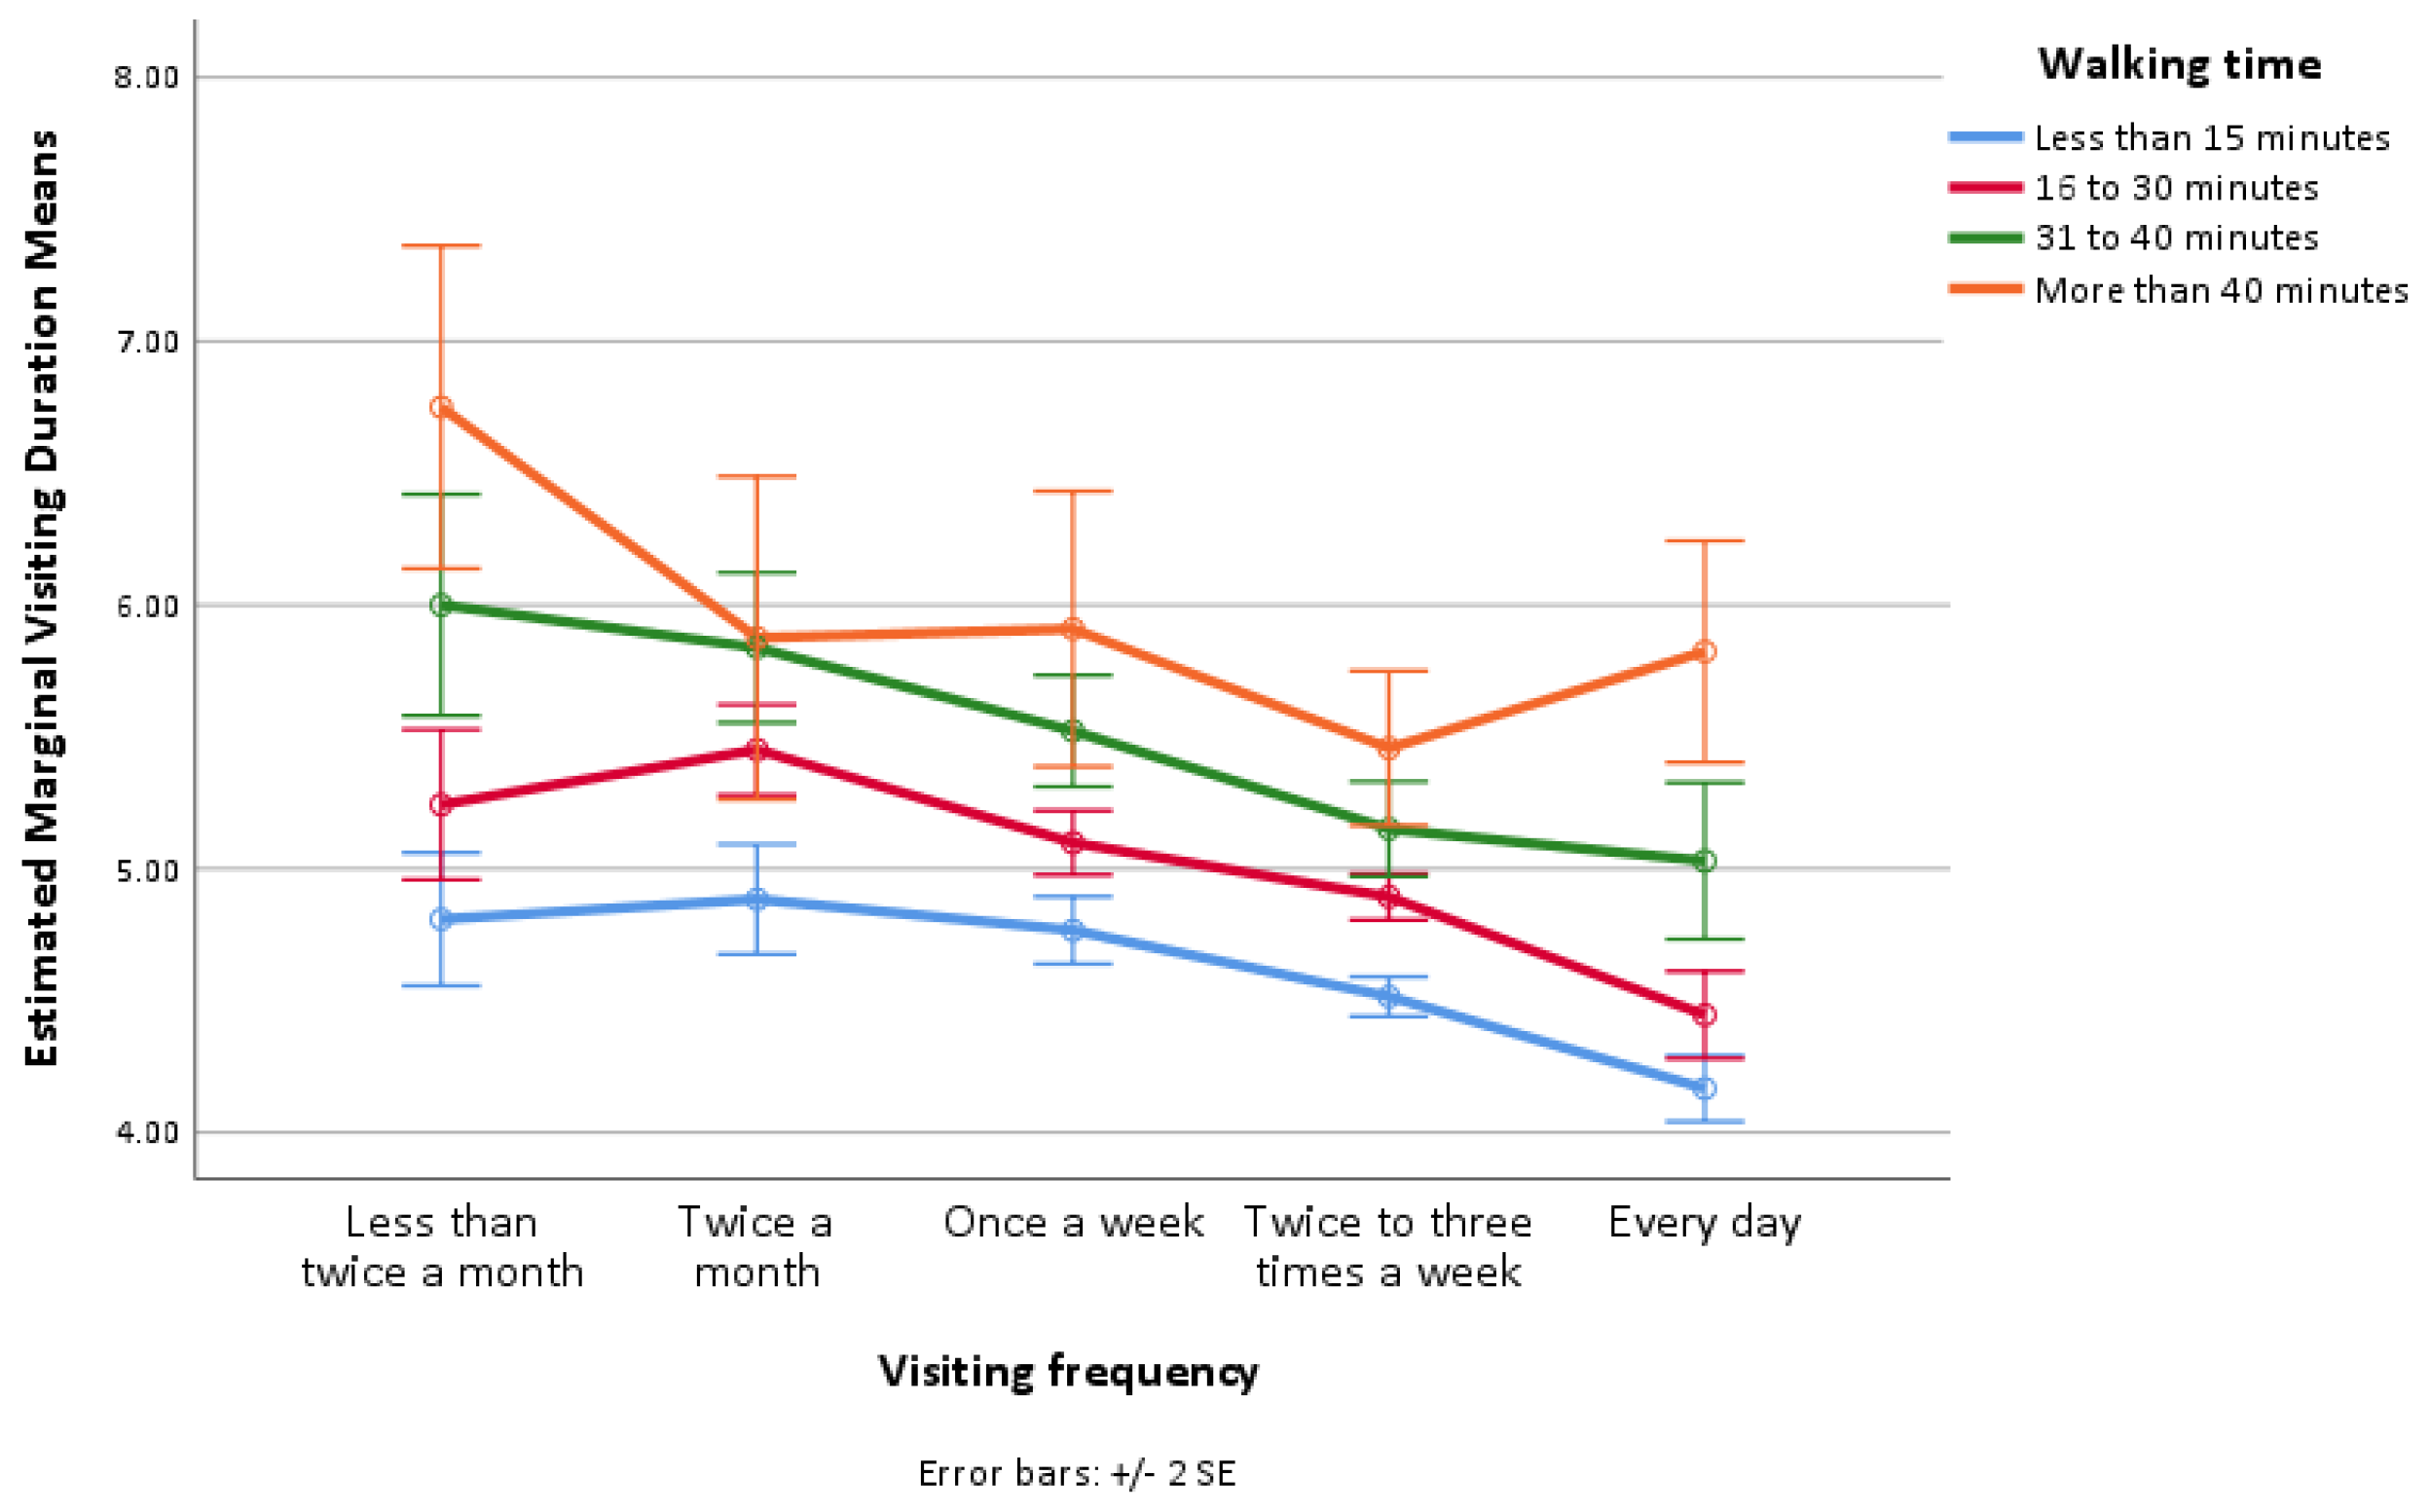
3.2. Effect of Factors on Park Usage
3.3. Motivations for and Barriers to Park Visitation among Different Visitor Groups
4. Discussion
4.1. Public Preferences and Park Usage
4.2. Differences across Population Groups
4.3. Limitations and Outlook
5. Conclusions
Supplementary Materials
Author Contributions
Funding
Institutional Review Board Statement
Informed Consent Statement
Data Availability Statement
Conflicts of Interest
References
- United Nations. Department of Economic and Social Affairs, Population Division. World Urbanization Prospects: The 2018 Revision (ST/ESA/SER.A/420). New York: United Nations. 2019. Available online: https://population.un.org/wup/Publications/Files/WUP2018-Report.pdf (accessed on 1 June 2022).
- Tian, X.Y.; Zhao, G.M.; Li, Y.H.; Wang, L.; Shi, Y. Overweight and obesity difference of Chinese population between different urbanization levels. J. Rural Health 2014, 30, 101–112. [Google Scholar] [CrossRef] [PubMed]
- Hartig, T., Jr.; Kahn, P.H. Living in cities, naturally. Science 2016, 352, 938–940. [Google Scholar] [CrossRef]
- Datzmann, T.; Markevych, I.; Trautmann, F.; Heinrich, J.; Schmitt, J.; Tesch, F. Outdoor air pollution, green space, and cancer incidence in Saxony: A semi-individual cohort study. BMC Public Health 2018, 18, 715. [Google Scholar] [CrossRef] [PubMed]
- Ghimire, R.; Ferreira, S.; Green, G.; Poudyal, N.; Cordell, H.; Thapa, J. Green Space and Adult Obesity in the United States. Ecol. Econ. 2017, 136, 201–212. [Google Scholar] [CrossRef]
- Manandhar, S.; Suksaroj, T.; Rattanapan, C. The Association between Green Space and the Prevalence of Overweight/Obesity among Primary School Children. Int. J. Occup. Environ. Med. 2019, 10, 1–10. [Google Scholar] [CrossRef] [PubMed] [Green Version]
- Knobel, P.; Maneja, R.; Bartoll, X.; Alonso, L.; Bauwelinck, M.; Valentin, A.; Zijlema, W.; Borrell, C.; Nieuwenhuijsen, M.; Dadvand, P. Quality of urban green spaces influences residents’ use of these spaces, physical activity, and overweight/obesity. Environ. Pollut. 2021, 271, 116393. [Google Scholar] [CrossRef]
- Bratman, G.N.; Daily, G.C.; Levy, B.J.; Gross, J.J. The benefits of nature experience: Improved affect and cognition. Landsc. Urban Plan 2015, 138, 41–50. [Google Scholar] [CrossRef]
- Xie, B.; An, Z.; Zheng, Y.; Li, Z. Healthy aging with parks: Association between park accessibility and the health status of older adults in urban China. Sustain. Cities Soc. 2018, 43, 476–486. [Google Scholar] [CrossRef]
- Müller-Riemenschneider, F.; Petrunoff, N.; Yao, J.; Ng, A.; Sia, A.; Ramiah, A.; Wong, M.; Han, J.; Tai, B.C.; Uijtdewilligen, L. Effectiveness of prescribing physical activity in parks to improve health and wellbeing-the park prescription randomized controlled trial. Int. J. Behav. Nutr. Phys. Act. 2020, 17, 42. [Google Scholar] [CrossRef]
- Zhu, X.; Gao, M.; Zhang, R.; Zhang, B. Quantifying emotional differences in urban green spaces extracted from photos on social networking sites: A study of 34 parks in three cities in northern China. Urban For. Urban Green. 2021, 62, 127133. [Google Scholar] [CrossRef]
- Plunz, R.A.; Zhou, Y.; Vintimilla, M.I.C.; McKeown, K.; Yu, T.; Uguccioni, L.; Sutto, M.P. Twitter sentiment in New York City parks as measure of well-being. Landsc. Urban Plan. 2019, 189, 235–246. [Google Scholar] [CrossRef]
- Bedimo-Rung, A.L.; Mowen, A.J.; Cohen, D.A. The significance of parks to physical activity and public health: A conceptual model. Am. J. Prev. Med. 2015, 28, 159–168. [Google Scholar] [CrossRef]
- Van Herzele, A.; Wiedemann, T. A monitoring tool for the provision of accessible and attractive urban green spaces. Landsc. Urban Plan. 2003, 63, 109–126. [Google Scholar] [CrossRef]
- Wang, P.; Zhou, B.; Han, L.; Mei, R. The motivation and factors influencing visits to small urban parks in Shanghai, China. Urban For. Urban Green 2021, 60, 127086. [Google Scholar] [CrossRef]
- Liu, H.; Li, F.; Xu, L.; Han, B. The impact of socio-demographic, environmental, and individual factors on urban park visitation in Beijing, China. J. Clean. Prod. 2017, 163, S181–S188. [Google Scholar] [CrossRef]
- Azagew, S.; Worku, H. Socio-demographic and physical factors influencing access to urban parks in rapidly urbanizing cities of Ethiopia: The case of Addis Ababa. J. Outdoor Recreat. Tour. 2020, 31, 100322. [Google Scholar] [CrossRef]
- Zhang, S.; Zhou, W. Recreational visits to urban parks and factors affecting park visits: Evidence from geotagged social media data. Landsc. Urban Plan. 2018, 180, 27–35. [Google Scholar] [CrossRef]
- Gundersen, V.; Mehmetoglu, M.; Vistad, O.I.I.; Andersen, O. Linking visitor motivation with attitude towards management restrictions on use in a national park. J. Outdoor Recreat. Tour. 2015, 9, 77–86. [Google Scholar] [CrossRef] [Green Version]
- Gibson, S.C. “Let’s go to the park.” An investigation of older adults in Australia and their motivations for park visitation. Landsc. Urban Plan. 2018, 180, 234–246. [Google Scholar] [CrossRef]
- Vierikko, K.; Gonçalves, P.; Haase, D.; Elands, B.; Ioja, C.; Jaatsi, M.; Pieniniemi, M.; Lindgren, J.; Grilo, F.; Santos-Reis, M.; et al. Biocultural diversity (BCD) in European cities—Interactions between motivations, experiences and environment in public parks. Urban For. Urban Green. 2020, 48, 126501. [Google Scholar] [CrossRef]
- Dinda, S.; Ghosh, S. Perceived benefits, aesthetic preferences and willingness to pay for visiting urban parks: A case study from the city of Kolkata, India. Int. J. Geoherit. Parks 2021, 9, 36–50. [Google Scholar] [CrossRef]
- Wang, D.; Brown, G.; Zhong, G.; Liu, Y.; Mateo-Babiano, I. Factors influencing perceived access to urban parks: A comparative study of Brisbane (Australia) and Zhongshan (China). Habitat Int. 2015, 50, 335–346. [Google Scholar] [CrossRef]
- Marquet, O.; Hipp, J.A.; Alberico, C.; Huang, J.H.; Fry, D.; Mazak, E.; Lovasi, G.S.; Floyd, M.F. Park use preferences and physical activity among ethnic minority children in low-income neighborhoods in New York City. Urban For. Urban Green. 2019, 38, 346–353. [Google Scholar] [CrossRef]
- Gu, X.; Li, Q.; Chand, S. Factors influencing residents’ access to and use of country parks in Shanghai, China. Cities 2020, 97, 102–501. [Google Scholar] [CrossRef]
- Maller, C.; Townsend, M.; Pryor, A.; Brown, P.; Leger, L.S. Healthy nature healthy people: ‘Contact with nature’ as an upstream health promotion intervention for populations. Health Promot. Int. 2006, 21, 45–54. [Google Scholar] [CrossRef] [Green Version]
- Wu, W.; Dong, G.; SUN, Y.; Yun, Y. Contextualized effects of Park access and usage on residential satisfaction: A spatial approach. Land Use Policy 2020, 94, 104532. [Google Scholar] [CrossRef]
- Haaland, C.; van den Bosch, C.K. Challenges and strategies for urban green-space planning in cities undergoing densification: A review. Urban For. Urban Green. 2015, 14, 760–771. [Google Scholar] [CrossRef]
- Zhang, X.; Ni, Z.; Wang, Y.; Chen, S.; Xia, B. Public perception and preferences of small urban green infrastructures: A case study in Guangzhou, China. Urban For. Urban Green. 2020, 53, 126700. [Google Scholar] [CrossRef]
- Guangzhou Forestry and Park Bureau and Guangzhou Garden Architecture Planning and Design Institute. Special planning of park construction and protection in Guangzhou 2018; p. 17 (In Chinese). Available online: http://lyylj.gz.gov.cn/attachment/0/75/75903/5875414.pdf (accessed on 29 November 2019).
- Shan, X.Z. The socio-demographic and spatial dynamics of green space use in Guangzhou, China. Appl. Geogr. 2014, 51, 26–34. [Google Scholar] [CrossRef]
- Zhan, P.; Hu, G.; Han, R.; Kang, Y. Factors influencing the visitation and revisitation of urban parks: A case study from Hangzhou, China. Sustainability 2021, 13, 10450. [Google Scholar] [CrossRef]
- Biernacka, M.; Kronenberg, J.; Edyta, Ł. An integrated system of monitoring the availability, accessibility and attractiveness of urban parks and green squares. Appl. Geogr. 2020, 116, 102152. [Google Scholar] [CrossRef]
- McCormack, G.R.; Rock, M.; Toohey, A.M.; Hignell, D. Characteristics of urban parks associated with park use and physical activity: A review of qualitative research. Health Place 2010, 16, 712–726. [Google Scholar] [CrossRef] [PubMed]
- Taylor, L.; Hochuli, D.F. Defining greenspace: Multiple uses across multiple disciplines. Landsc. Urban Plan. 2017, 158, 25–38. [Google Scholar] [CrossRef] [Green Version]
- Ledraa, T.; Aldegheishem, A. What Matters Most for Neighborhood Greenspace Usability and Satisfaction in Riyadh: Size or Distance to Home? Sustainability 2022, 14, 6216. [Google Scholar] [CrossRef]
- Mak, B.K.L.; Jim, C.Y. Linking park users’ socio-demographic characteristics and visit-related preferences to improve urban parks. Cities 2019, 92, 97–111. [Google Scholar] [CrossRef]
- Li, Z.; Chen, H.; Yan, W. Exploring spatial distribution of urban park service areas in Shanghai based on travel time estimation: A method combining multi-source data. ISPRS Int. J. Geo-Inf. 2021, 10, 608. [Google Scholar] [CrossRef]
- Guangzhou Districts Census Office. Guangzhou Districts 2010 Census; Guangdong Economic Press: Guangzhou, China, 2011. (In Chinese) [Google Scholar]
- Guangzhou Statistical Bureau. Guangzhou Statistical Yearbook; China Statistical Press: Beijing, China, 2018. (In Chinese) [Google Scholar]
- Zhu, Z.; Lang, W.; Tao, X.; Feng, J.; Liu, K. Exploring the quality of urban green spaces based on urban neighborhood green index-a case study of Guangzhou city. Sustainability 2019, 11, 5507. [Google Scholar] [CrossRef] [Green Version]
- Bateman, I.J.; Langford, I.H.; Turner, R.K.; Willis, K.G.; Garrod, G.D. Elicitation and truncation effects in contingent valuation studies. Ecol. Econ. 1995, 12, 161–179. [Google Scholar] [CrossRef]
- Guangzhou Statistics Bureau. T1-08 Population Aged 6 and over by Gender and Education. Available online: http://tjj.gz.gov.cn/gzstats/rkpc6/t1-08.htm (accessed on 22 April 2019).
- Scott, M.M.; Evenson, K.R.; Cohen, D.A.; Cox, C.E. Comparing perceived and objectively measured access to recreational facilities as predictors of physical activity in adolescent girls. J. Urban Health 2007, 84, 346–359. [Google Scholar] [CrossRef] [Green Version]
- Chiesura, A. The role of urban parks for the sustainable city. Landsc. Urban Plan. 2004, 68, 129–138. [Google Scholar] [CrossRef]
- Peschardt, K.K.; Schipperijn, J.; Stigsdotter, U.K. Use of small public urban green spaces (SPUGS). Urban For. Urban Green. 2012, 11, 235–244. [Google Scholar] [CrossRef]
- Schipperijn, J.; Stigsdotter, U.K.; Randrup, T.B.; Troelsen, J. Influences on the use of urban green space e a case study in Odense, Denmark. Urban For. Urban Green. 2010, 9, 25–32. [Google Scholar] [CrossRef]
- Ward Thompson, C.; Aspinall, P.; Bell, S.; Findlay, C. “It gets you away from everyday life”: Local woodlands and community usedwhat makes a difference? Landsc. Res. 2005, 30, 109–146. [Google Scholar] [CrossRef]
- Tu, X.; Huang, G.; Wu, J.; Guo, X. How Do Travel Distance and Park Size Influence Urban Park Visits? Urban For. Urban Green 2020, 52, 126689. [Google Scholar] [CrossRef]
- Wong, K.K. Urban park visiting habits and leisure activities of residents in Hong Kong, China. Manag. Leis. 2009, 14, 125–140. [Google Scholar] [CrossRef]
- Coombes, E.; Jones, A.P.; Hillsdon, M. The relationship of physical activity and overweight to objectively measured green space accessibility and use. Soc. Sci. Med. 2010, 70, 816–822. [Google Scholar] [CrossRef] [Green Version]
- Swanwick, C. Society’s attitudes to and preferences for land and landscape. Land Use Policy 2009, 26, S62–S75. [Google Scholar] [CrossRef]
- Tyrväinen, L.; Mäkinen, K.; Schipperijn, J. Tools for mapping social values of urban woodlands and other green areas. Landsc. Urban Plan. 2007, 79, 5–19. [Google Scholar] [CrossRef]
- van Herzele, A.; de Clercq, E.M.; Wiedemann, T. Strategic planning for new woodlands in the urban periphery: Through the lens of social inclusiveness. Urban For. Urban Green. 2005, 3, 177–188. [Google Scholar] [CrossRef]
- Wang, F.; Tang, M. China’s soccer field development status and countermeasures. Sports Cult. Guide 2017, 8, 109–114. (In Chinese) [Google Scholar]
- Scott, D.; Jackson, E.L. Factors that limit and strategies that might encourage people’s use of public parks. J. Park Recreat. Adm. 1996, 14, 1–17. [Google Scholar]
- Payne, L.L.; Mowen, A.J.; Orsega-Smith, E. An examination of park preferences and behaviors among urban residents: The role of residential location, race and age. Leis. Sci. 2002, 24, 181–198. [Google Scholar] [CrossRef]
- Pincetl, S.; Gearin, E. The reinvention of public green space. Urban Geogr. 2005, 26, 365–384. [Google Scholar] [CrossRef]
- Raymore, L.; Scott, D. The characteristics and activities of older adult visitors to a metropolitan park district. J. Park Recreat. Adm. 1998, 16, 1–21. [Google Scholar]
- Reed, J.A.; Price, A.E.; Grost, L.; Mantinan, K. Demographic characteristics and physical activity behaviors in sixteen Michigan parks. J. Community Health 2012, 37, 507–512. [Google Scholar] [CrossRef] [PubMed]
- Sreetheran, M. Exploring the urban park use, preference and behaviours among the residents of Kuala Lumpur, Malaysia. Urban For. Urban Green. 2017, 25, 85–93. [Google Scholar] [CrossRef]
- Sanesi, G.; Chiarello, F. Residents and urban green spaces: The case of Bari. Urban For. Urban Green. 2006, 4, 125–134. [Google Scholar] [CrossRef]
- Jim, C.Y.; Shan, X. Socioeconomic effect on perception of urban green spaces in Guangzhou, China. Cities 2013, 31, 123–131. [Google Scholar] [CrossRef]
- Wendel, H.E.W.; Zarger, R.K.; Mihelcic, J.R. Accessibility and usability: Green space preferences, perceptions, and barriers in a rapidly urbanizing city in Latin America. Landsc. Urban Plan. 2012, 107, 272–282. [Google Scholar] [CrossRef]
- Yilmaz, S.; Zengin, M.; Yildiz, N.D. Determination of user profile at city parks: A sample from Turkey. Build. Environ. 2007, 42, 2325–2332. [Google Scholar] [CrossRef]


| Factors | Variables | Definition Value | Mean | St.d | Median |
|---|---|---|---|---|---|
| Walking time | Less than 15 min | 4 | 4.72 | 0.81 | 5.00 |
| 16 to 30 min | 5 | ||||
| 31 to 40 min | 6 | ||||
| More than 40 min | 7 | ||||
| Visit duration | Less than 15 min | 3 | 4.84 | 0.96 | 5.00 |
| 16 to 30 min | 4 | ||||
| 31 to 45 min | 5 | ||||
| 46 to 75 min | 6 | ||||
| More than 75 min | 7 | ||||
| Visiting frequency | Less than once a month | 3 | 6.57 | 1.11 | 7.00 |
| Once a month | 4 | ||||
| Twice a month | 5 | ||||
| Once a week | 6 | ||||
| Twice to three times a week | 7 | ||||
| Every day or more often | 8 |
| Item | Category | Survey % | Observed Count | Census % | Expected Count | Difference | Weight | Chi-Square |
|---|---|---|---|---|---|---|---|---|
| Age | 18–24 | 11.99 | 283 | 18.13 | 1,862,543 | −6.14 | 1.51 | 7030.874 *** |
| 25–30 | 35.97 | 849 | 14.29 | 1,468,606 | 21.68 | 0.40 | ||
| 31–40 | 50.21 | 949 | 24.33 | 2,499,930 | 25.88 | 0.48 | ||
| 41–50 | 9.66 | 228 | 19.48 | 2,001,680 | −9.82 | 2.02 | ||
| 51 and over | 2.16 | 51 | 23.77 | 2,442,389 | −21.61 | 11.00 | ||
| Gender | Male | 61.40 | 1449 | 51.88 | 5,331,127 | 9.52 | 0.84 | 85.560 *** |
| Female | 38.60 | 911 | 48.12 | 4,944,021 | −9.52 | 1.25 | ||
| Education | Primary and below | 1.36 | 32 | 17.70 | 2,142,853 | −16.34 | 13.01 | 1649.74 *** |
| Junior high school/High school | 9.92 | 234 | 61.71 | 7,469,316 | −51.79 | 6.22 | ||
| College | 50.08 | 1182 | 10.09 | 1,221,764 | 39.99 | 0.20 | ||
| Undergraduate | 31.48 | 743 | 9.23 | 1,116,627 | 22.25 | 0.29 | ||
| Postgraduate and above | 7.16 | 169 | 1.27 | 153,297 | 5.89 | 0.18 |
| Socio-Demographic Characteristics | Visiting Preferences for Their Most Frequently Visited Parks on Foot | Values | Sig. |
|---|---|---|---|
| Gender | Walking time | 7.852 a | 0.049 * |
| Visit duration | 1.023 a | 0.906 | |
| Visiting frequency | 12.124 a | 0.033 * | |
| Age | Walking time | 109.673 a | 0.000 *** |
| Visit duration | 150.295 a | 0.000 *** | |
| Visiting frequency | 139.513 a | 0.000 *** | |
| Education | Walking time | 50.076 b | 0.000 *** |
| Visit duration | 236.100 b | 0.000 ** | |
| Visiting frequency | 183.991 b | 0.000 *** |
| Visit Duration | Statistic Index | Educated Groups | Total | ||
|---|---|---|---|---|---|
| High School and below | High School to College | Undergraduate and above | |||
| Less than 15 min | Count | 298 a | 10 b | 12 b | 320 |
| % within Education level | 17.5% | 4.4% | 5.4% | 14.9% | |
| 16 to 30 min | Count | 444 a | 78 b | 68 a,b | 590 |
| % within Education level | 26.1% | 34.7% | 30.8% | 27.5% | |
| 31 to 45 min | Count | 538 a | 88 a | 84 a | 710 |
| % within Education level | 31.6% | 39.1% | 38.0% | 33.1% | |
| 46 to 75 min | Count | 314 a | 38 a | 45 a | 397 |
| % within Education level | 18.4% | 16.9% | 20.4% | 18.5% | |
| More than 75 min | Count | 108 a | 11 a | 12 a | 131 |
| % within Education level | 6.3% | 4.9% | 5.4% | 6.1% | |
| Total | Count | 1702 | 225 | 221 | 2148 |
| % within Education level | 100.0% | 100.0% | 100.0% | 100.0% | |
| Reasons for Visiting Parks (N = 2263) | |||||||
|---|---|---|---|---|---|---|---|
| Visitor Groups | Walking/Exercise | Relieve Stress | Gain Inspiration | Socialize with Strangers | Enjoy Views | Meet with Friends or Family | Passing by during Commute |
| Age | 0.000 *** | 0.000 *** | 0.000 *** | 0.005 ** | 0.000 *** | 0.000 *** | 0.936 |
| Gender | 0.124 | 0.005 ** | 0.010 * | 0.000 *** | 0.000 *** | 0.690 | 0.406 |
| Education | 0.186 | 0.000 *** | 0.006 ** | 0.558 | 0.000 *** | 0.884 | 0.129 |
| Frequency | 0.086 | 0.432 | 0.000 *** | 0.000 *** | 0.09 | 0.767 | 0.712 |
| Visit preferences | |||||||
| Traveling time | 0.306 | 0.427 | 0.409 | 0.949 | 0.259 | 0.292 | 0.741 |
| Visit duration | 0.000 *** | 0.009 ** | 0.000 *** | 0.084 | 0.000 *** | 0.113 | 0.001 ** |
| Barriers to Visiting Parks (N = 53) | |||||||
| Visitor Groups | Lack of Time | Prefer Other Places | Poor Quality of Park | Long Walking Time | No Interest | Lack of Time | Prefer Other Places |
| Age | 0.000 *** | 0.001 ** | 0.000 *** | 0.000 *** | 0.477 | Age | 0.000 *** |
| Gender | 0.304 | 0.557 | 0.390 | 0.830 | 0.454 | Gender | 0.304 |
| Education | 0.280 | 0.000 *** | 0.290 | 0.820 | 0.110 | Education | 0.280 |
Publisher’s Note: MDPI stays neutral with regard to jurisdictional claims in published maps and institutional affiliations. |
© 2022 by the authors. Licensee MDPI, Basel, Switzerland. This article is an open access article distributed under the terms and conditions of the Creative Commons Attribution (CC BY) license (https://creativecommons.org/licenses/by/4.0/).
Share and Cite
Ma, Y.; Brindley, P.; Lange, E. The Influence of Socio-Demographic Factors on Preference and Park Usage in Guangzhou, China. Land 2022, 11, 1219. https://doi.org/10.3390/land11081219
Ma Y, Brindley P, Lange E. The Influence of Socio-Demographic Factors on Preference and Park Usage in Guangzhou, China. Land. 2022; 11(8):1219. https://doi.org/10.3390/land11081219
Chicago/Turabian StyleMa, Yueshan, Paul Brindley, and Eckart Lange. 2022. "The Influence of Socio-Demographic Factors on Preference and Park Usage in Guangzhou, China" Land 11, no. 8: 1219. https://doi.org/10.3390/land11081219