
Measuring Gross Ecosystem Product (GEP) in Guangxi, China, from 2005 to 2020

 , ,
, ,
Abstract
:1. Introduction
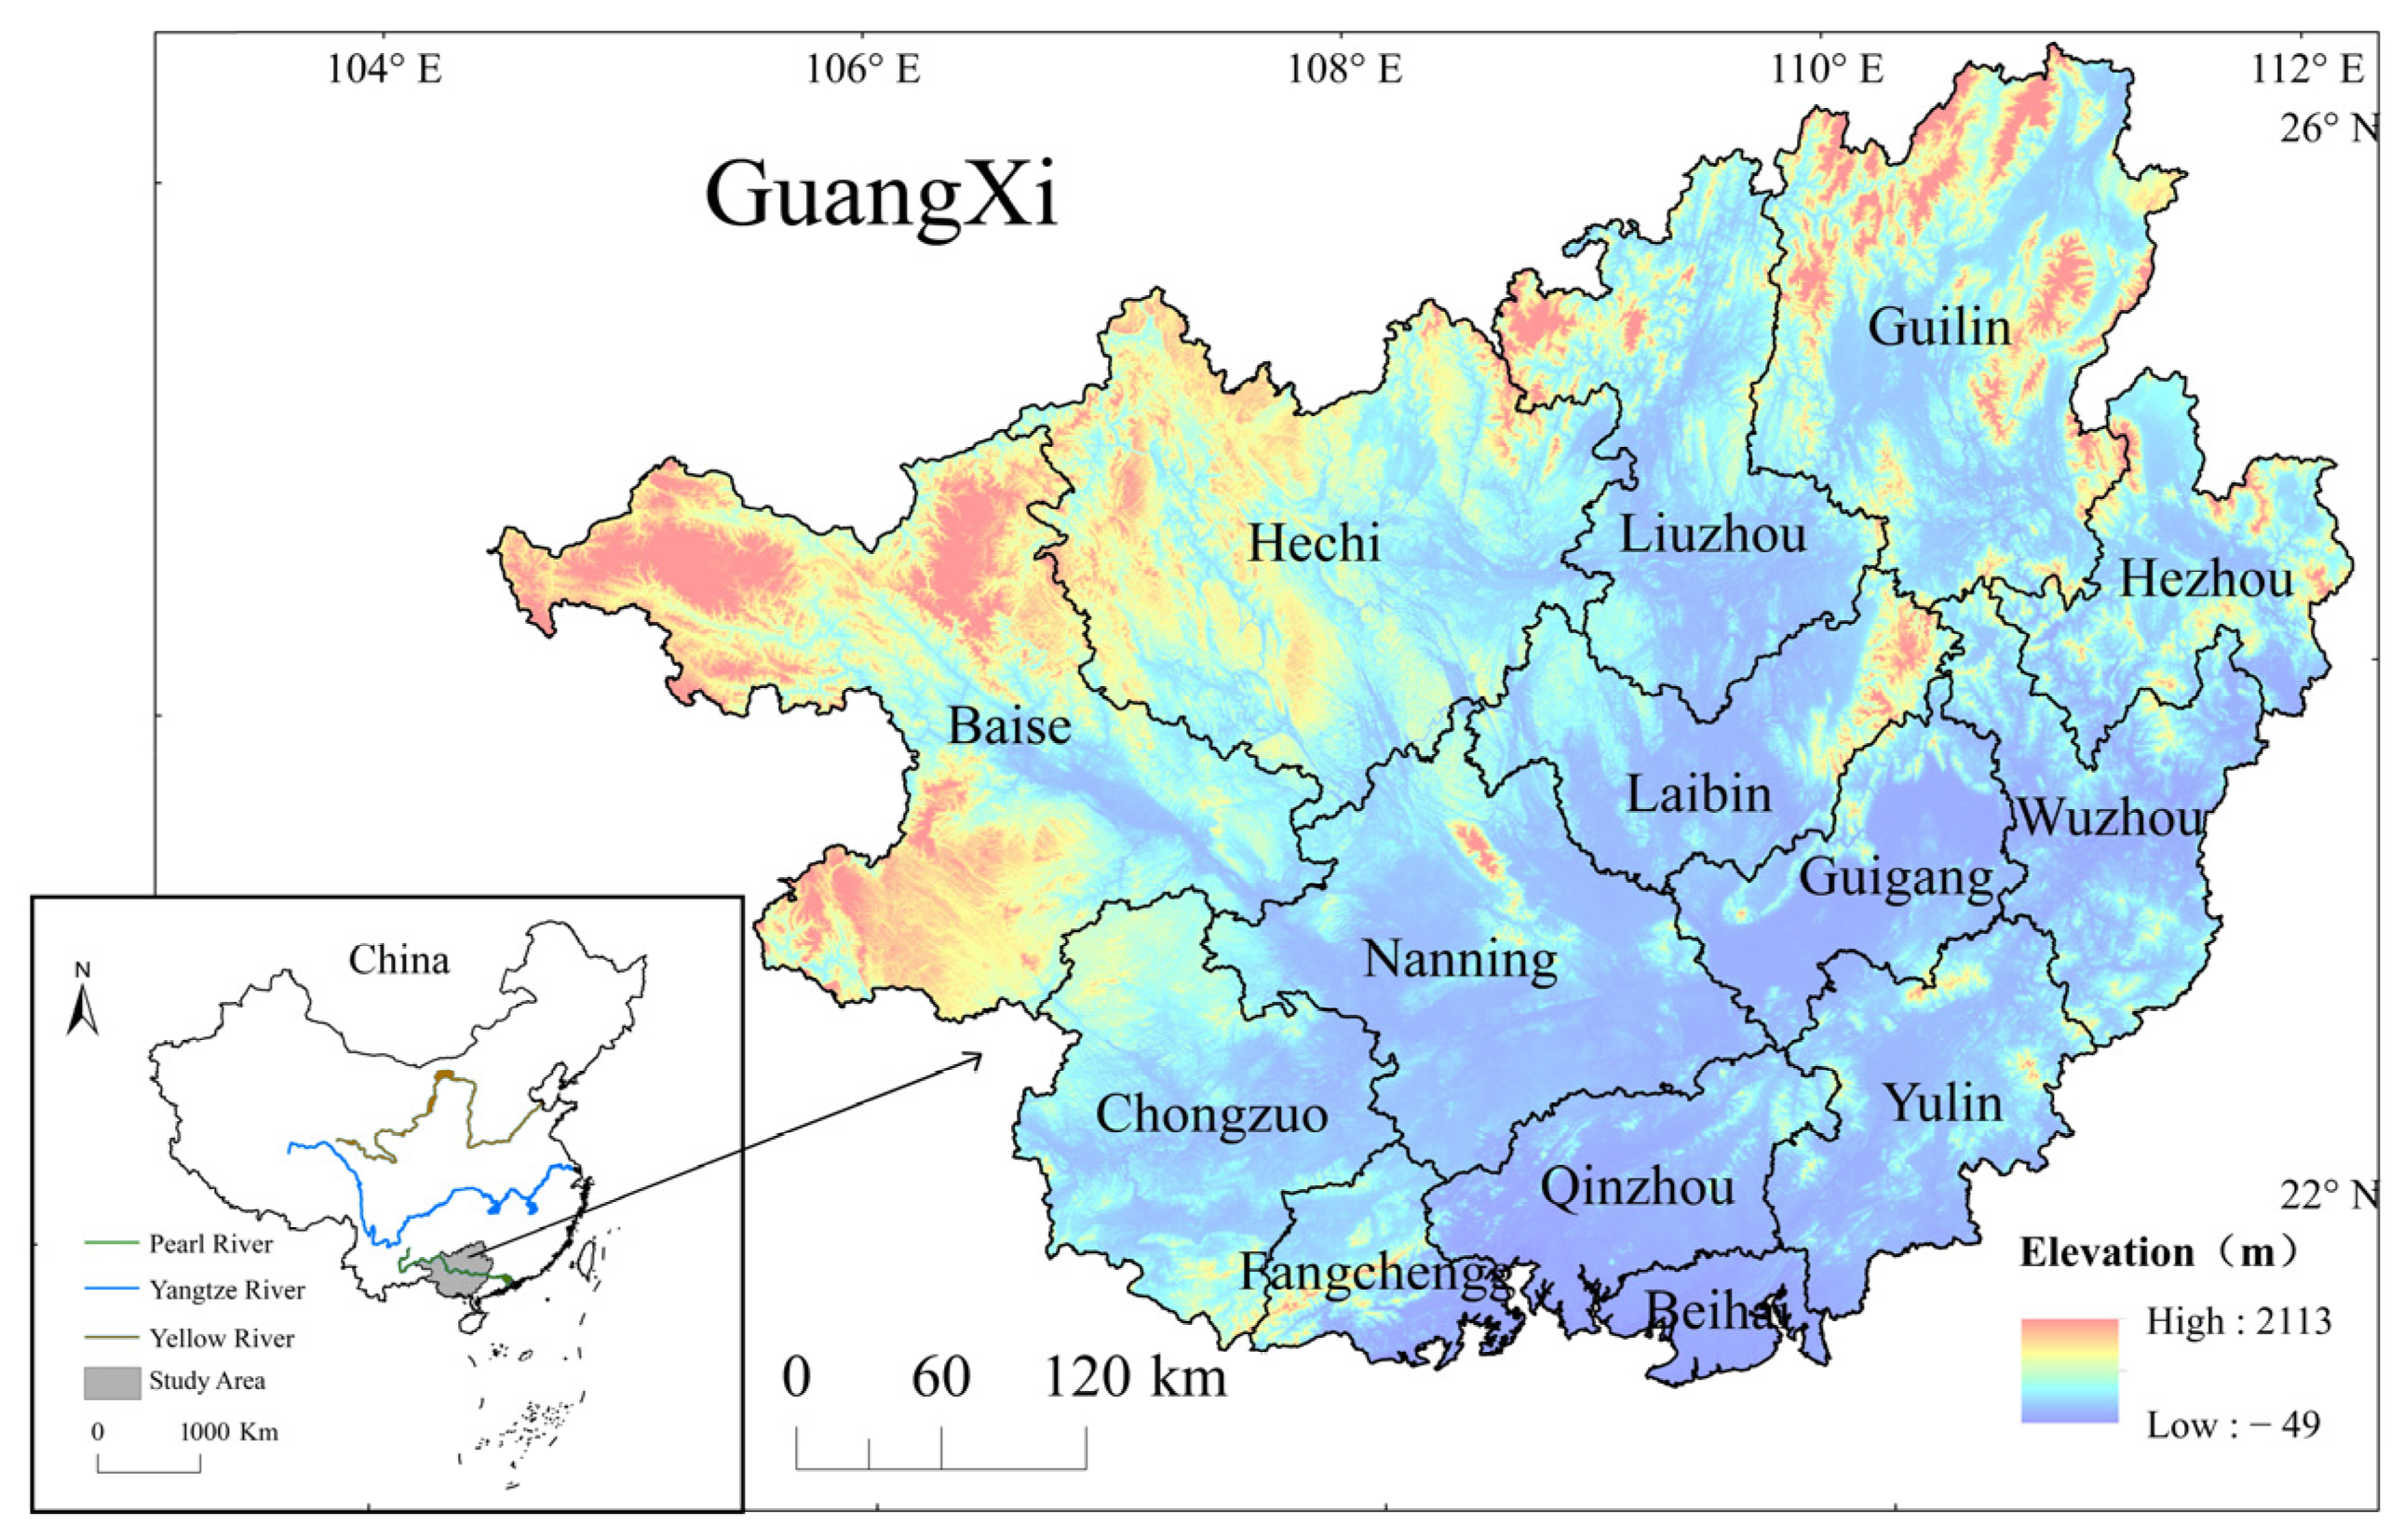
2. Study Area
3. Materials and Methods
3.1. Index Selection for GEP Accounting
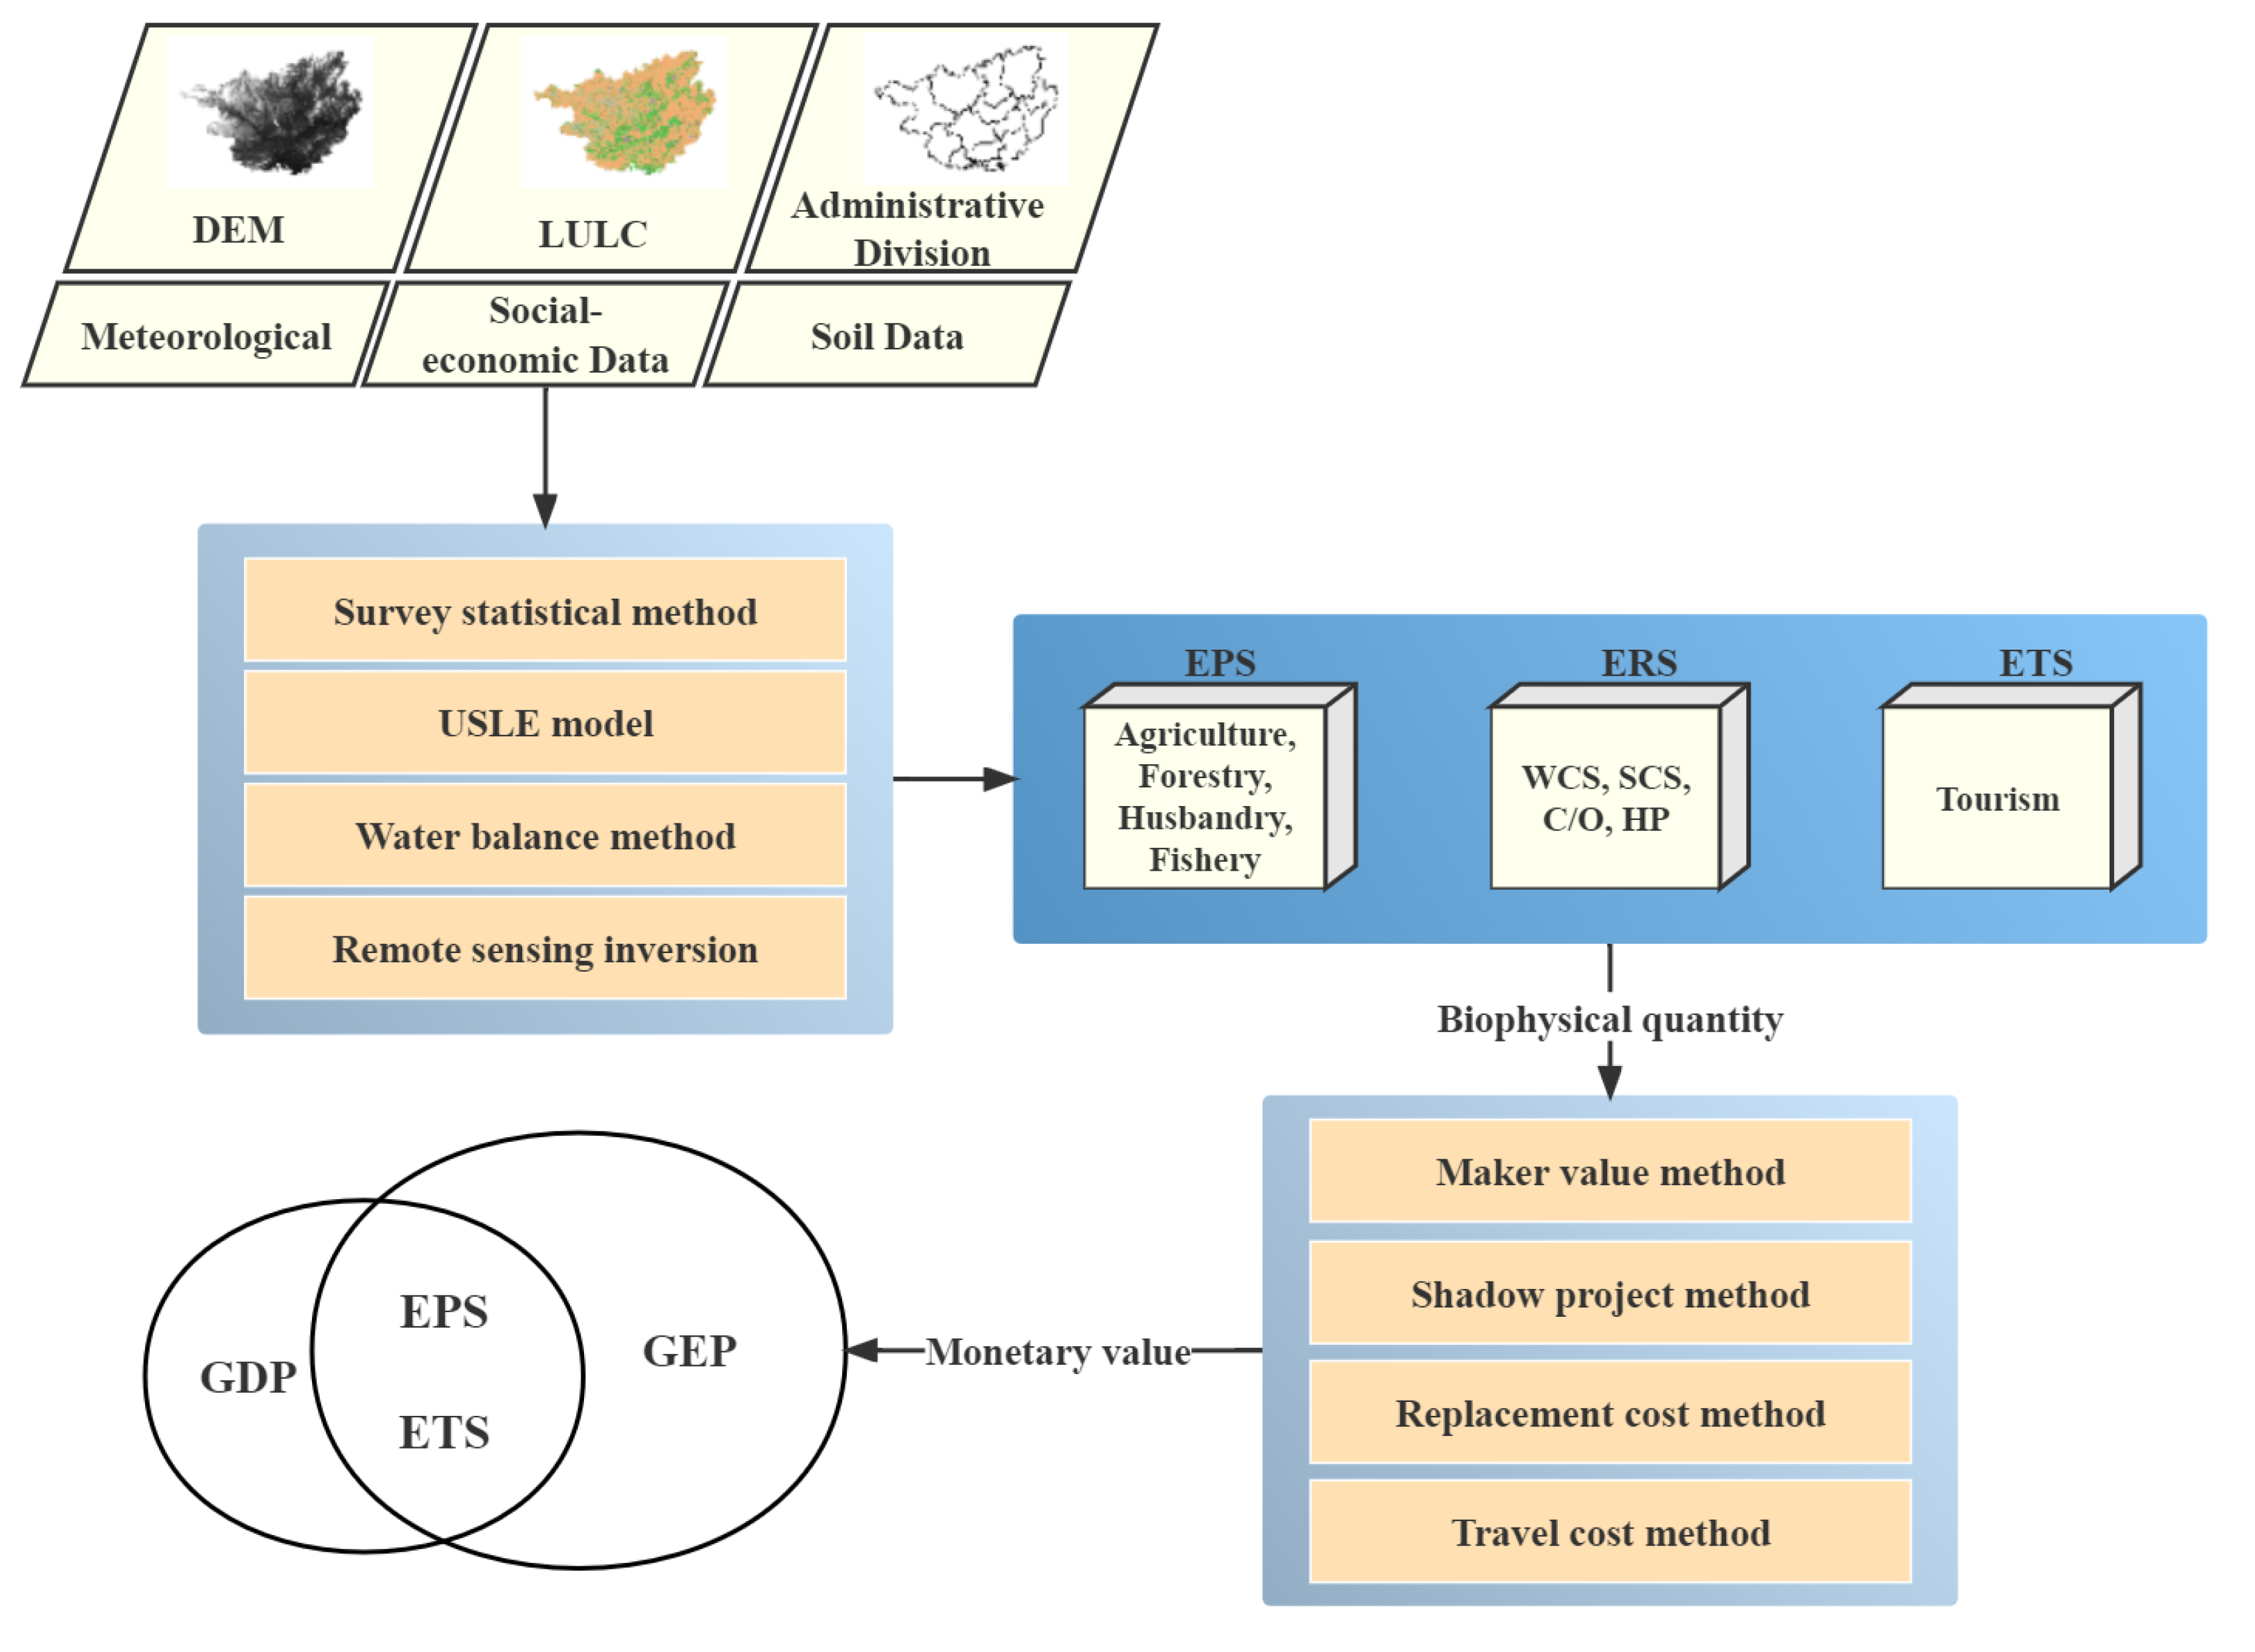
3.2. Framework for Accounting GEP
3.3. Accounting for Biophysical Quantities
3.3.1. Provision of Ecological Products
3.3.2. Water Conservation Service
3.3.3. Soil Conservation Service
3.3.4. Carbon Sequestration and Oxygen Release Service
3.3.5. Habitat Provision Service
- ①
- Habitat qualitywhere is the total stress level of raster in LULC or habitat type ; is the weight of stress factors, indicating the relative destructive power of a stress factor to all habitats; is the accessibility level of grid ; and is the sensitivity of habitat type to stress factor . If , is not a function of threat r, is the stress factor in raster y, is the stress effect of stress factor r in raster x on raster y, and the stress effect is divided into a linear attenuation and an exponential attenuation. is the linear distance between raster x and y and is the maximum range of threat r [53].
- ②
- Habitat scarcitywhere is the scarcity of raster x; is the scarcity index of LULC type j; is the number of rasters of current land use and land cover j; is the number of rasters of LULC type j in the baseline landscape pattern; and is a binary number, with = 1 when raster x is of LULC type j, otherwise .
3.3.6. Cultural Services
3.4. Accounting for the Value of Monetary
3.4.1. Provision of Ecological Products
3.4.2. Water Conservation Service
3.4.3. Soil Conservation Service
3.4.4. Carbon Sequestration Service and Oxygen Release Service
3.4.5. Habitat Provision Service
3.4.6. Cultural Services
4. Results
4.1. GEP Assessment in Guangxi
4.1.1. 2020 GEP
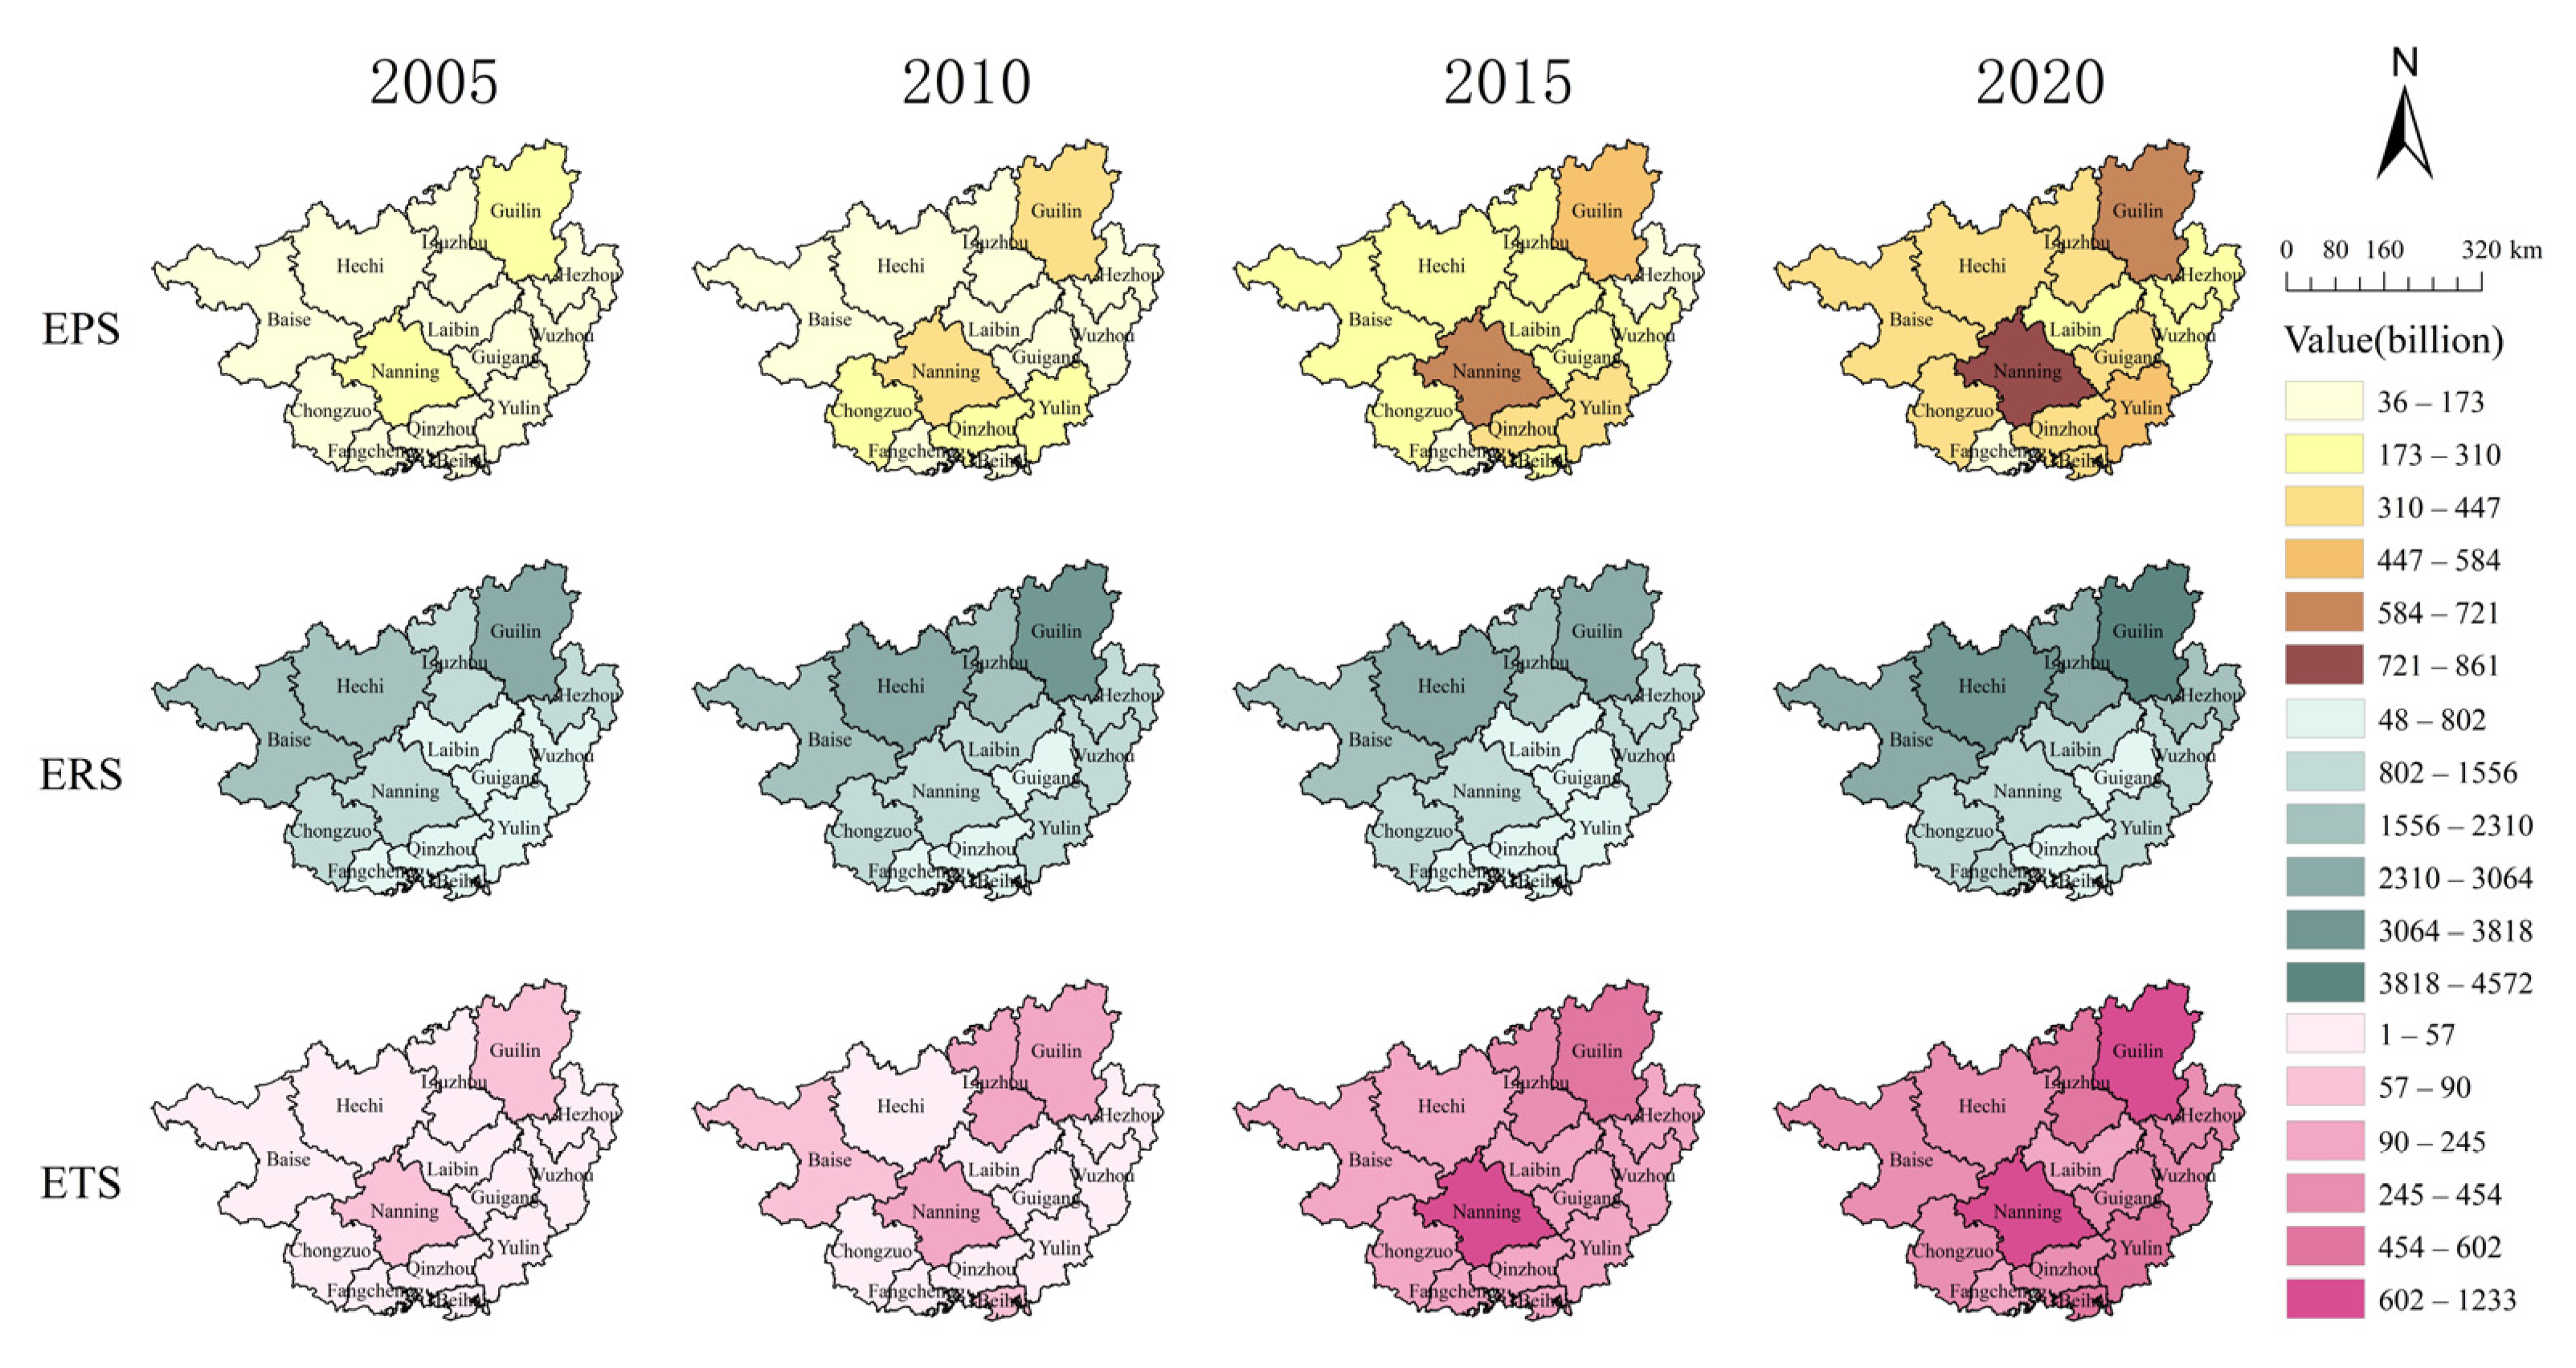
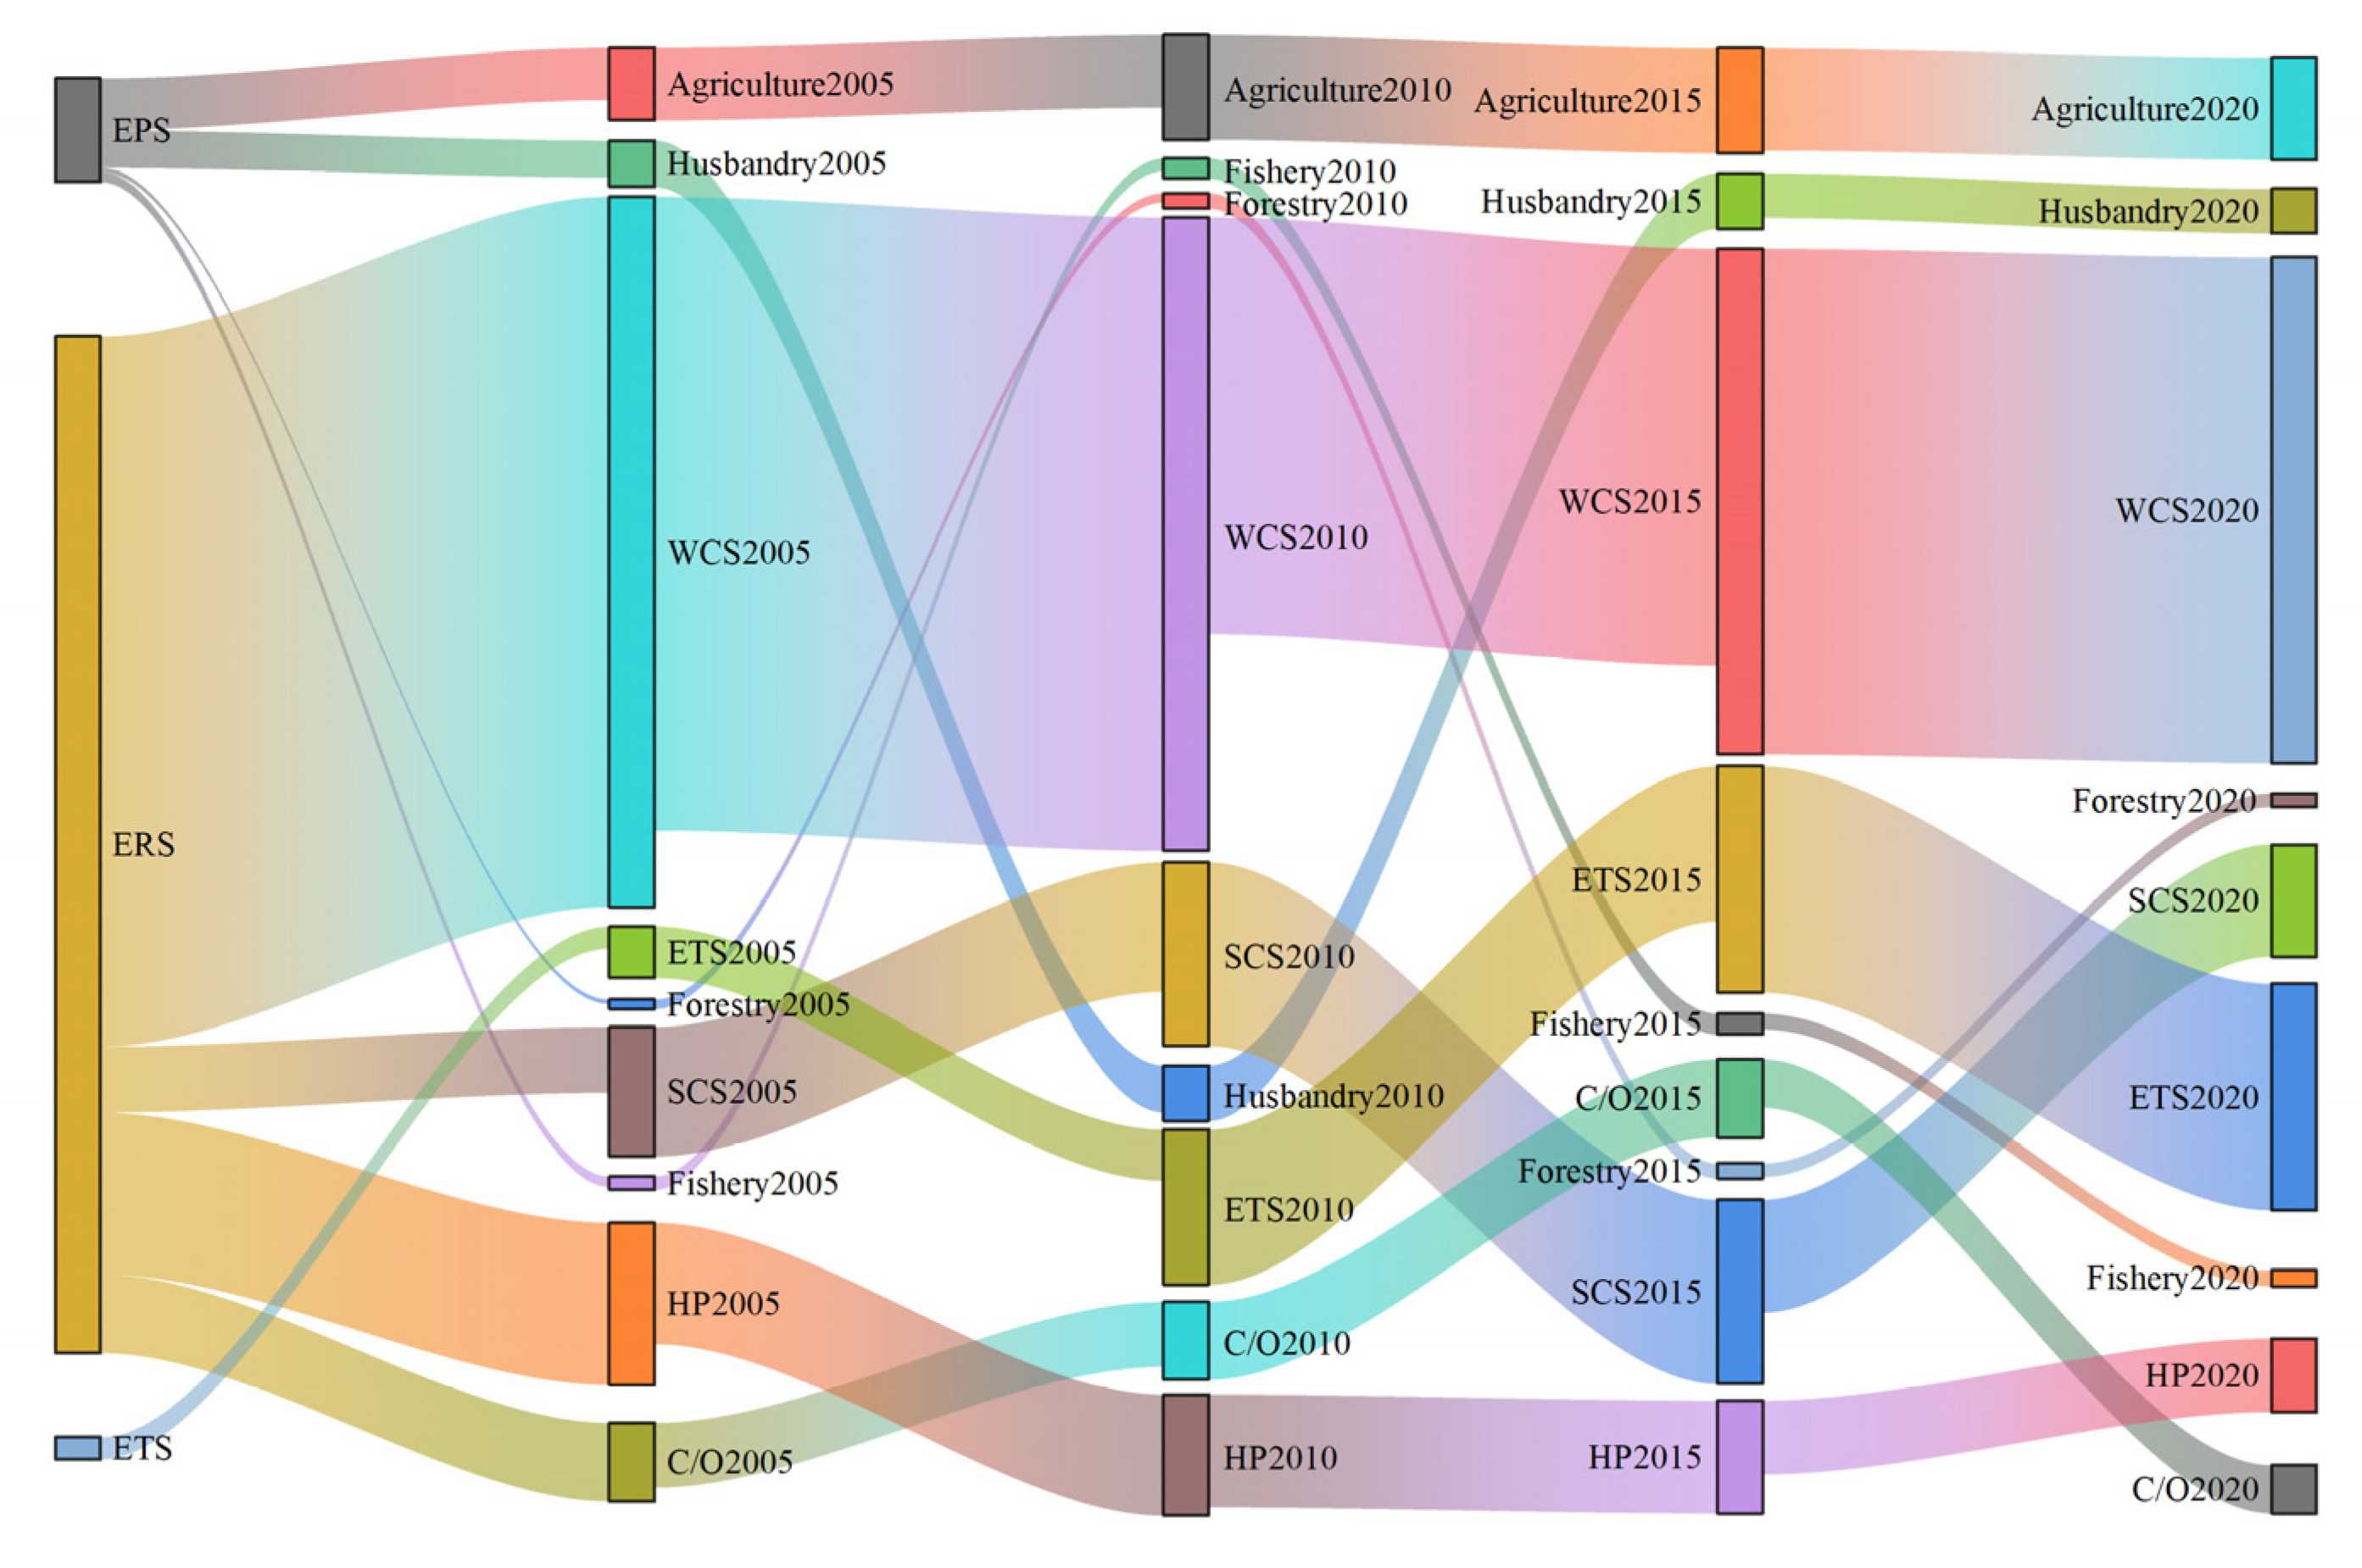
4.1.2. Temporal and Spatial Changes of GEP from 2005 to 2020
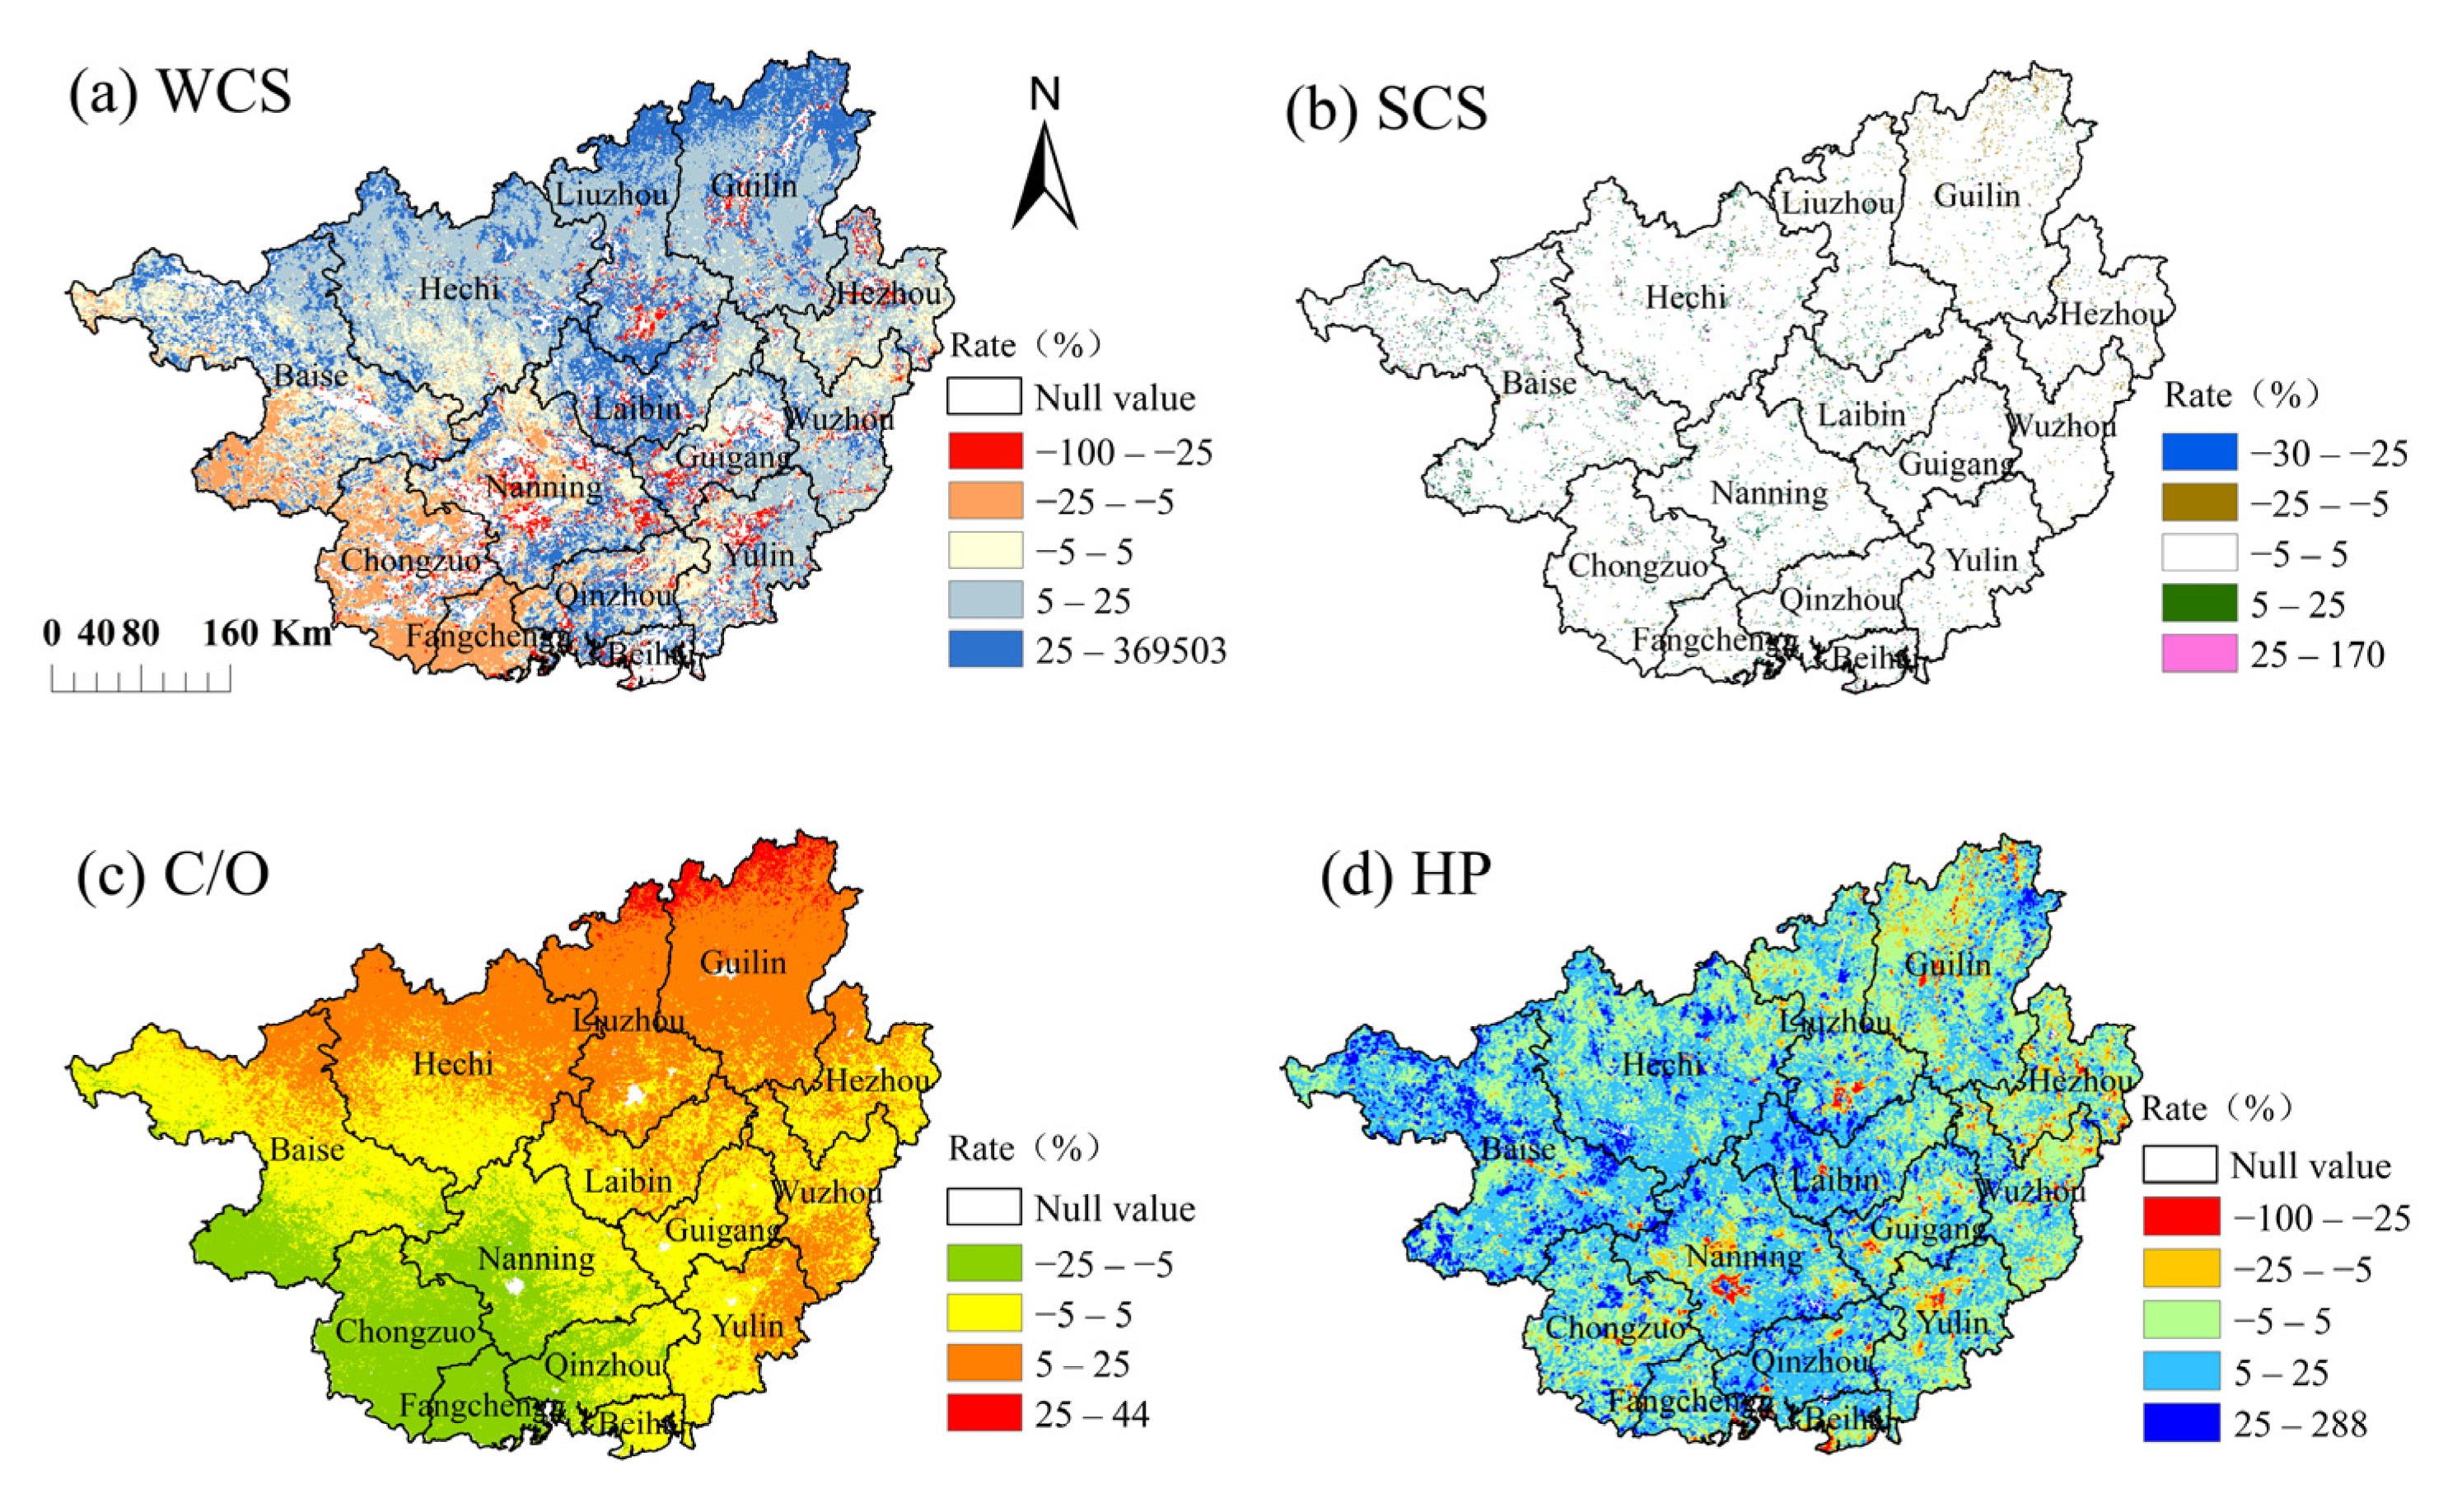
4.2. Trends of Ecosystem Regulation Services from 2005 to 2020
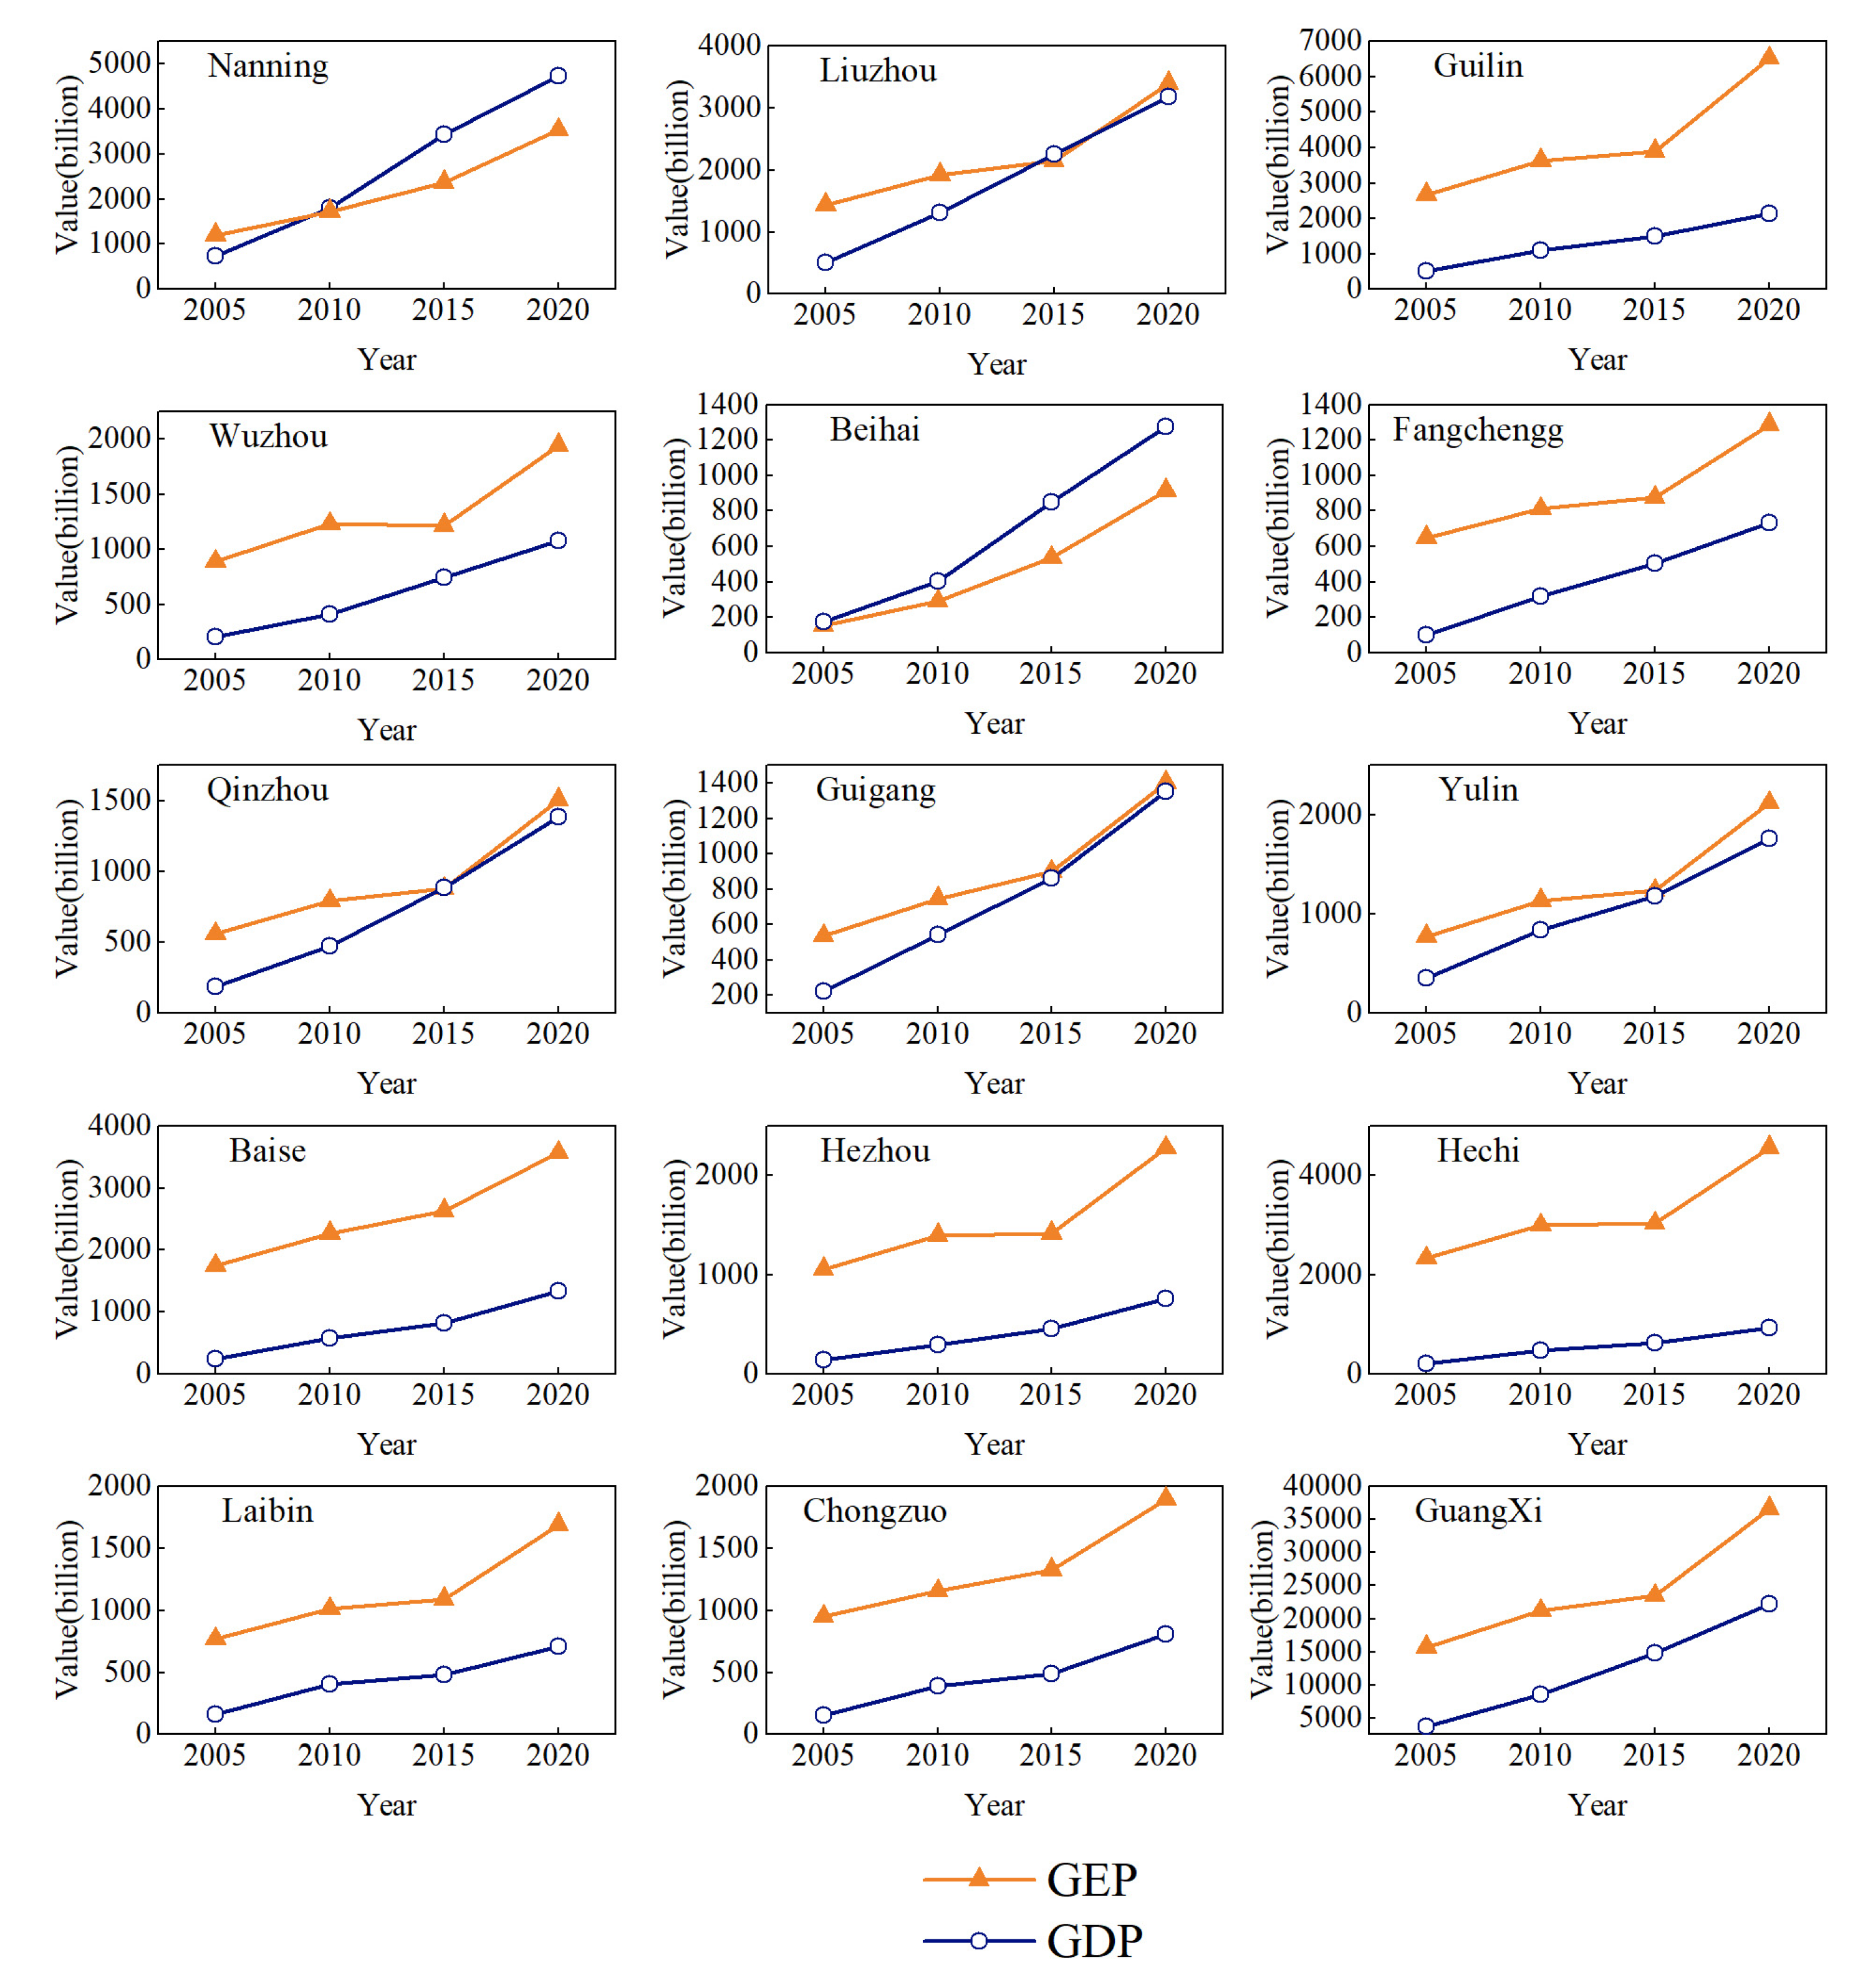
4.3. Comparison between GEP and GDP
5. Discussion
6. Conclusions
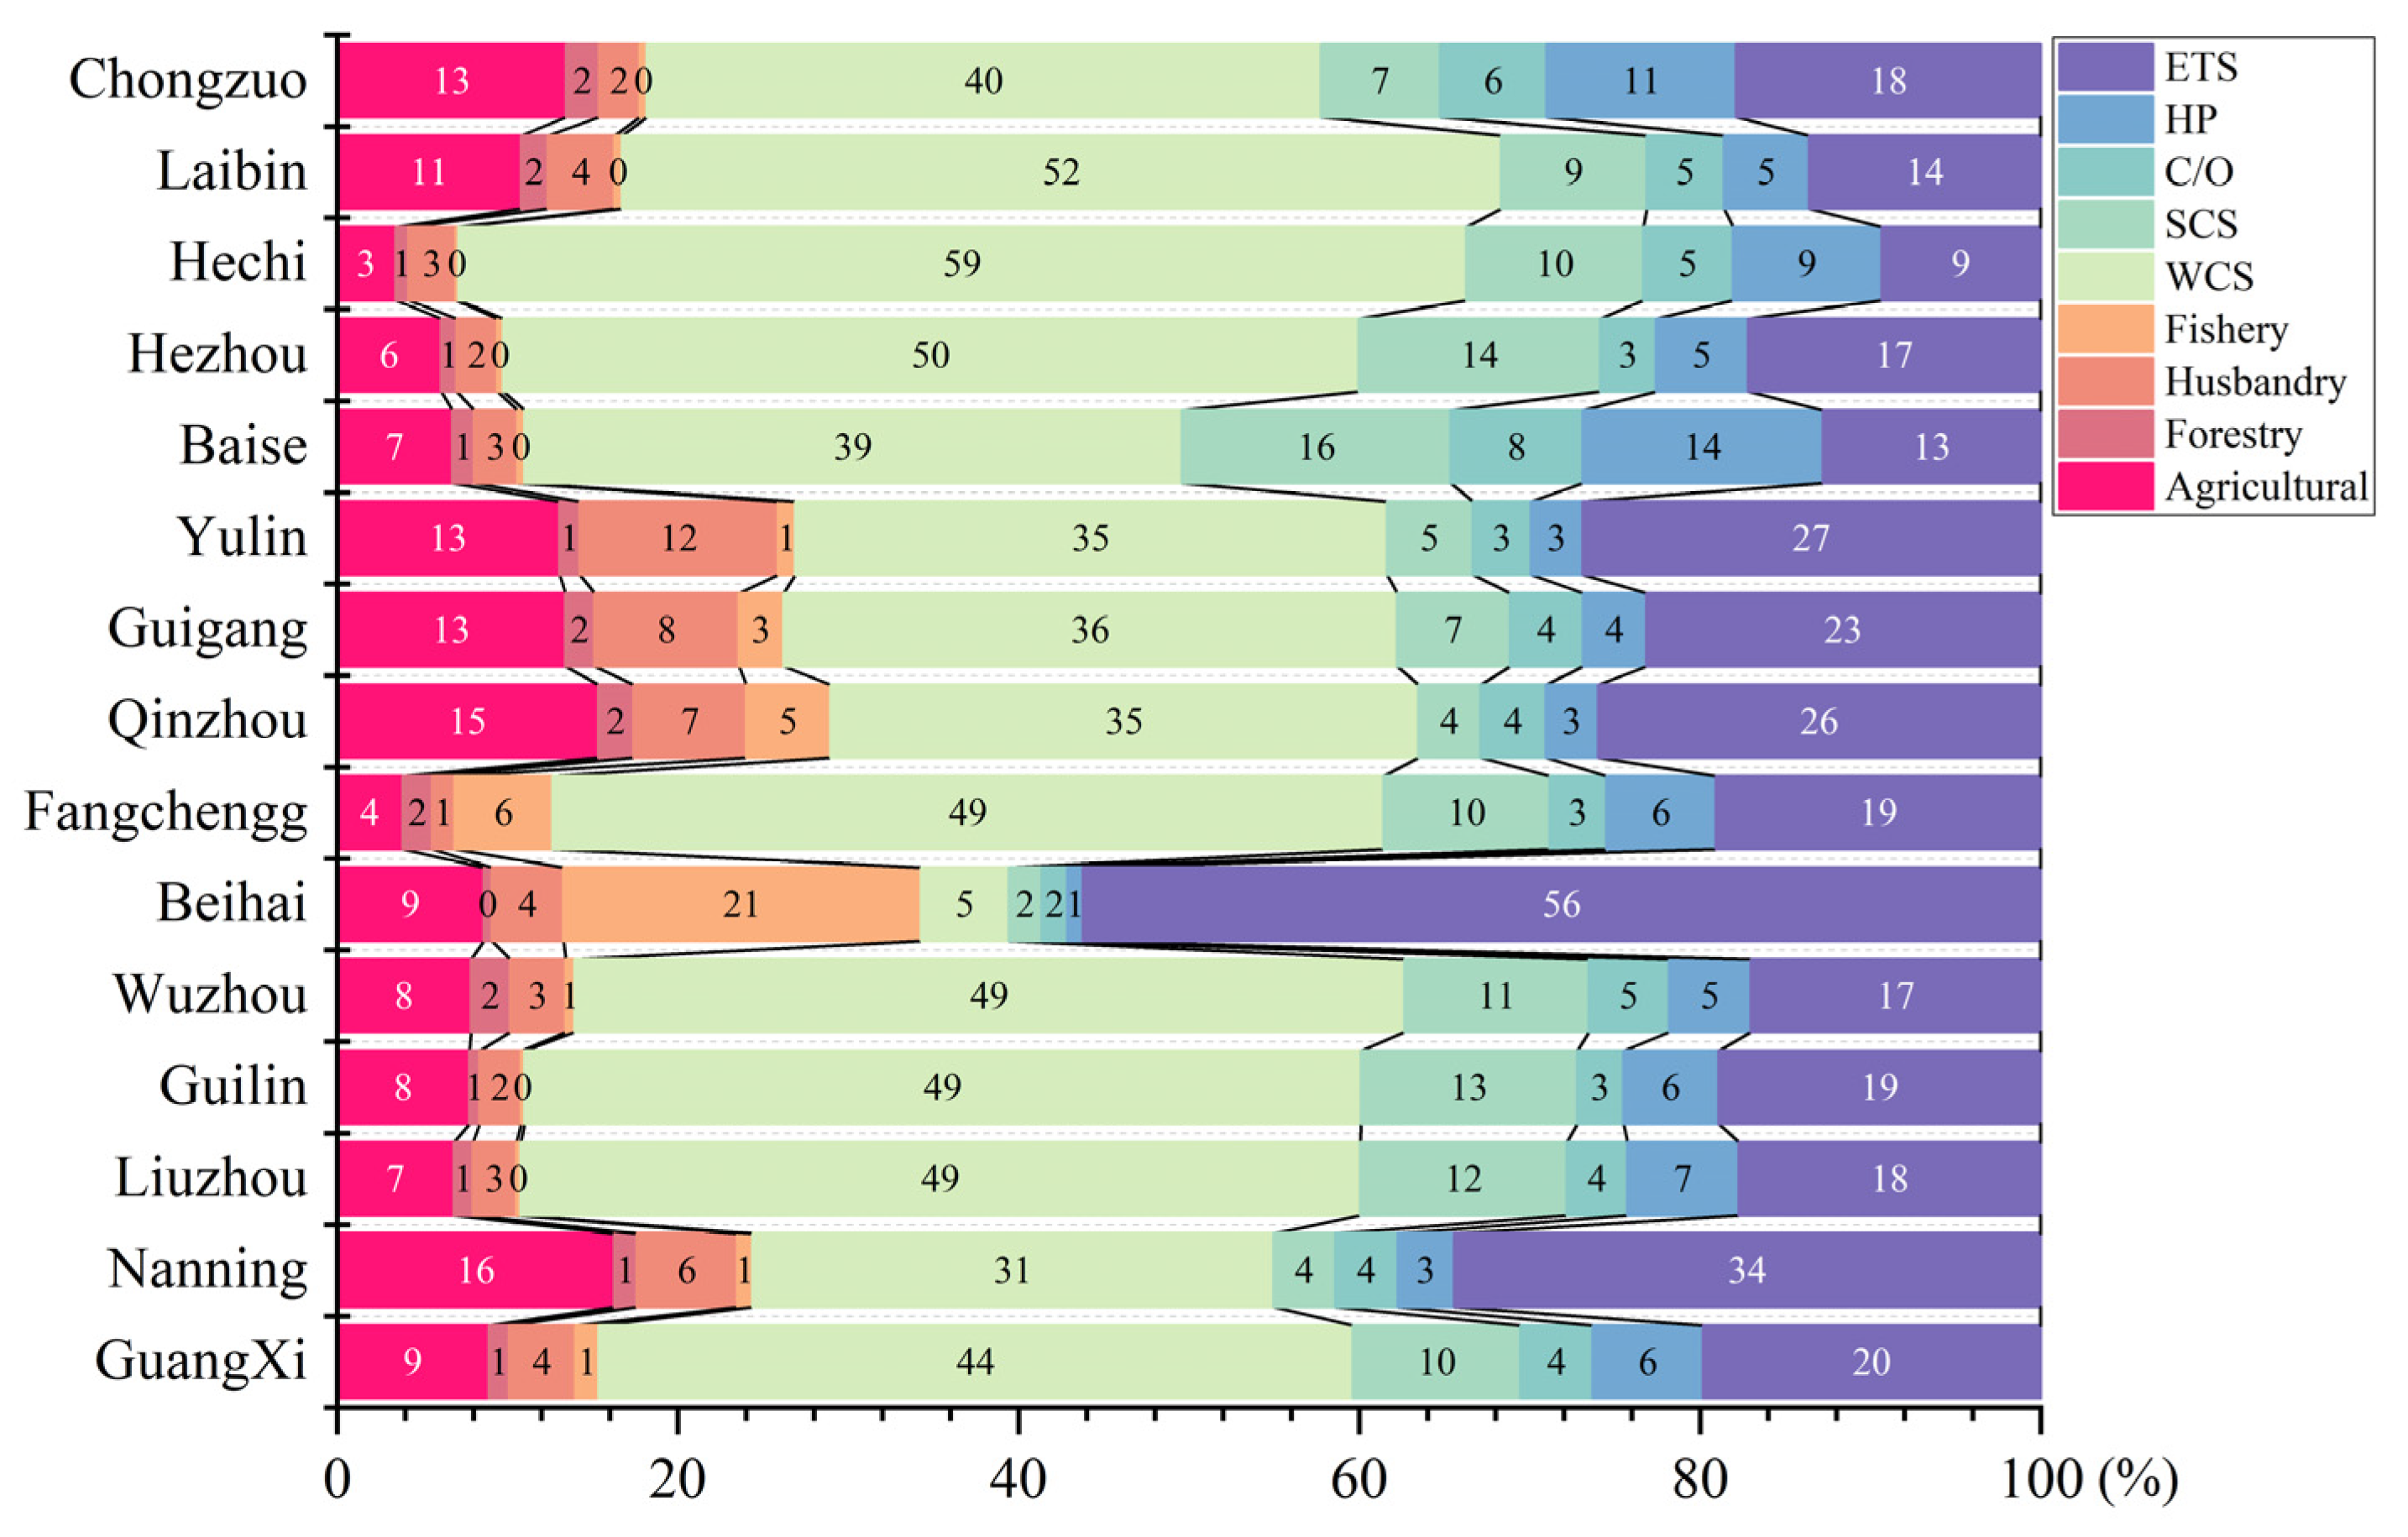
- Guangxi’s natural ecosystem has a considerable value. In 2020, GEP reached CNY 36,677.04 billion, about 1.66 times the GDP. Among the many accounting indicators, the value of water conservation service was the largest, at CNY 16,233.79 billion, accounting for about 44% of GEP. From 2005 to 2020, GEP increased significantly, with the GEP increasing by 134% in 15 years. However, the proportions of the values of provisioning services, regulation services, and tourism services were obviously different among cities.
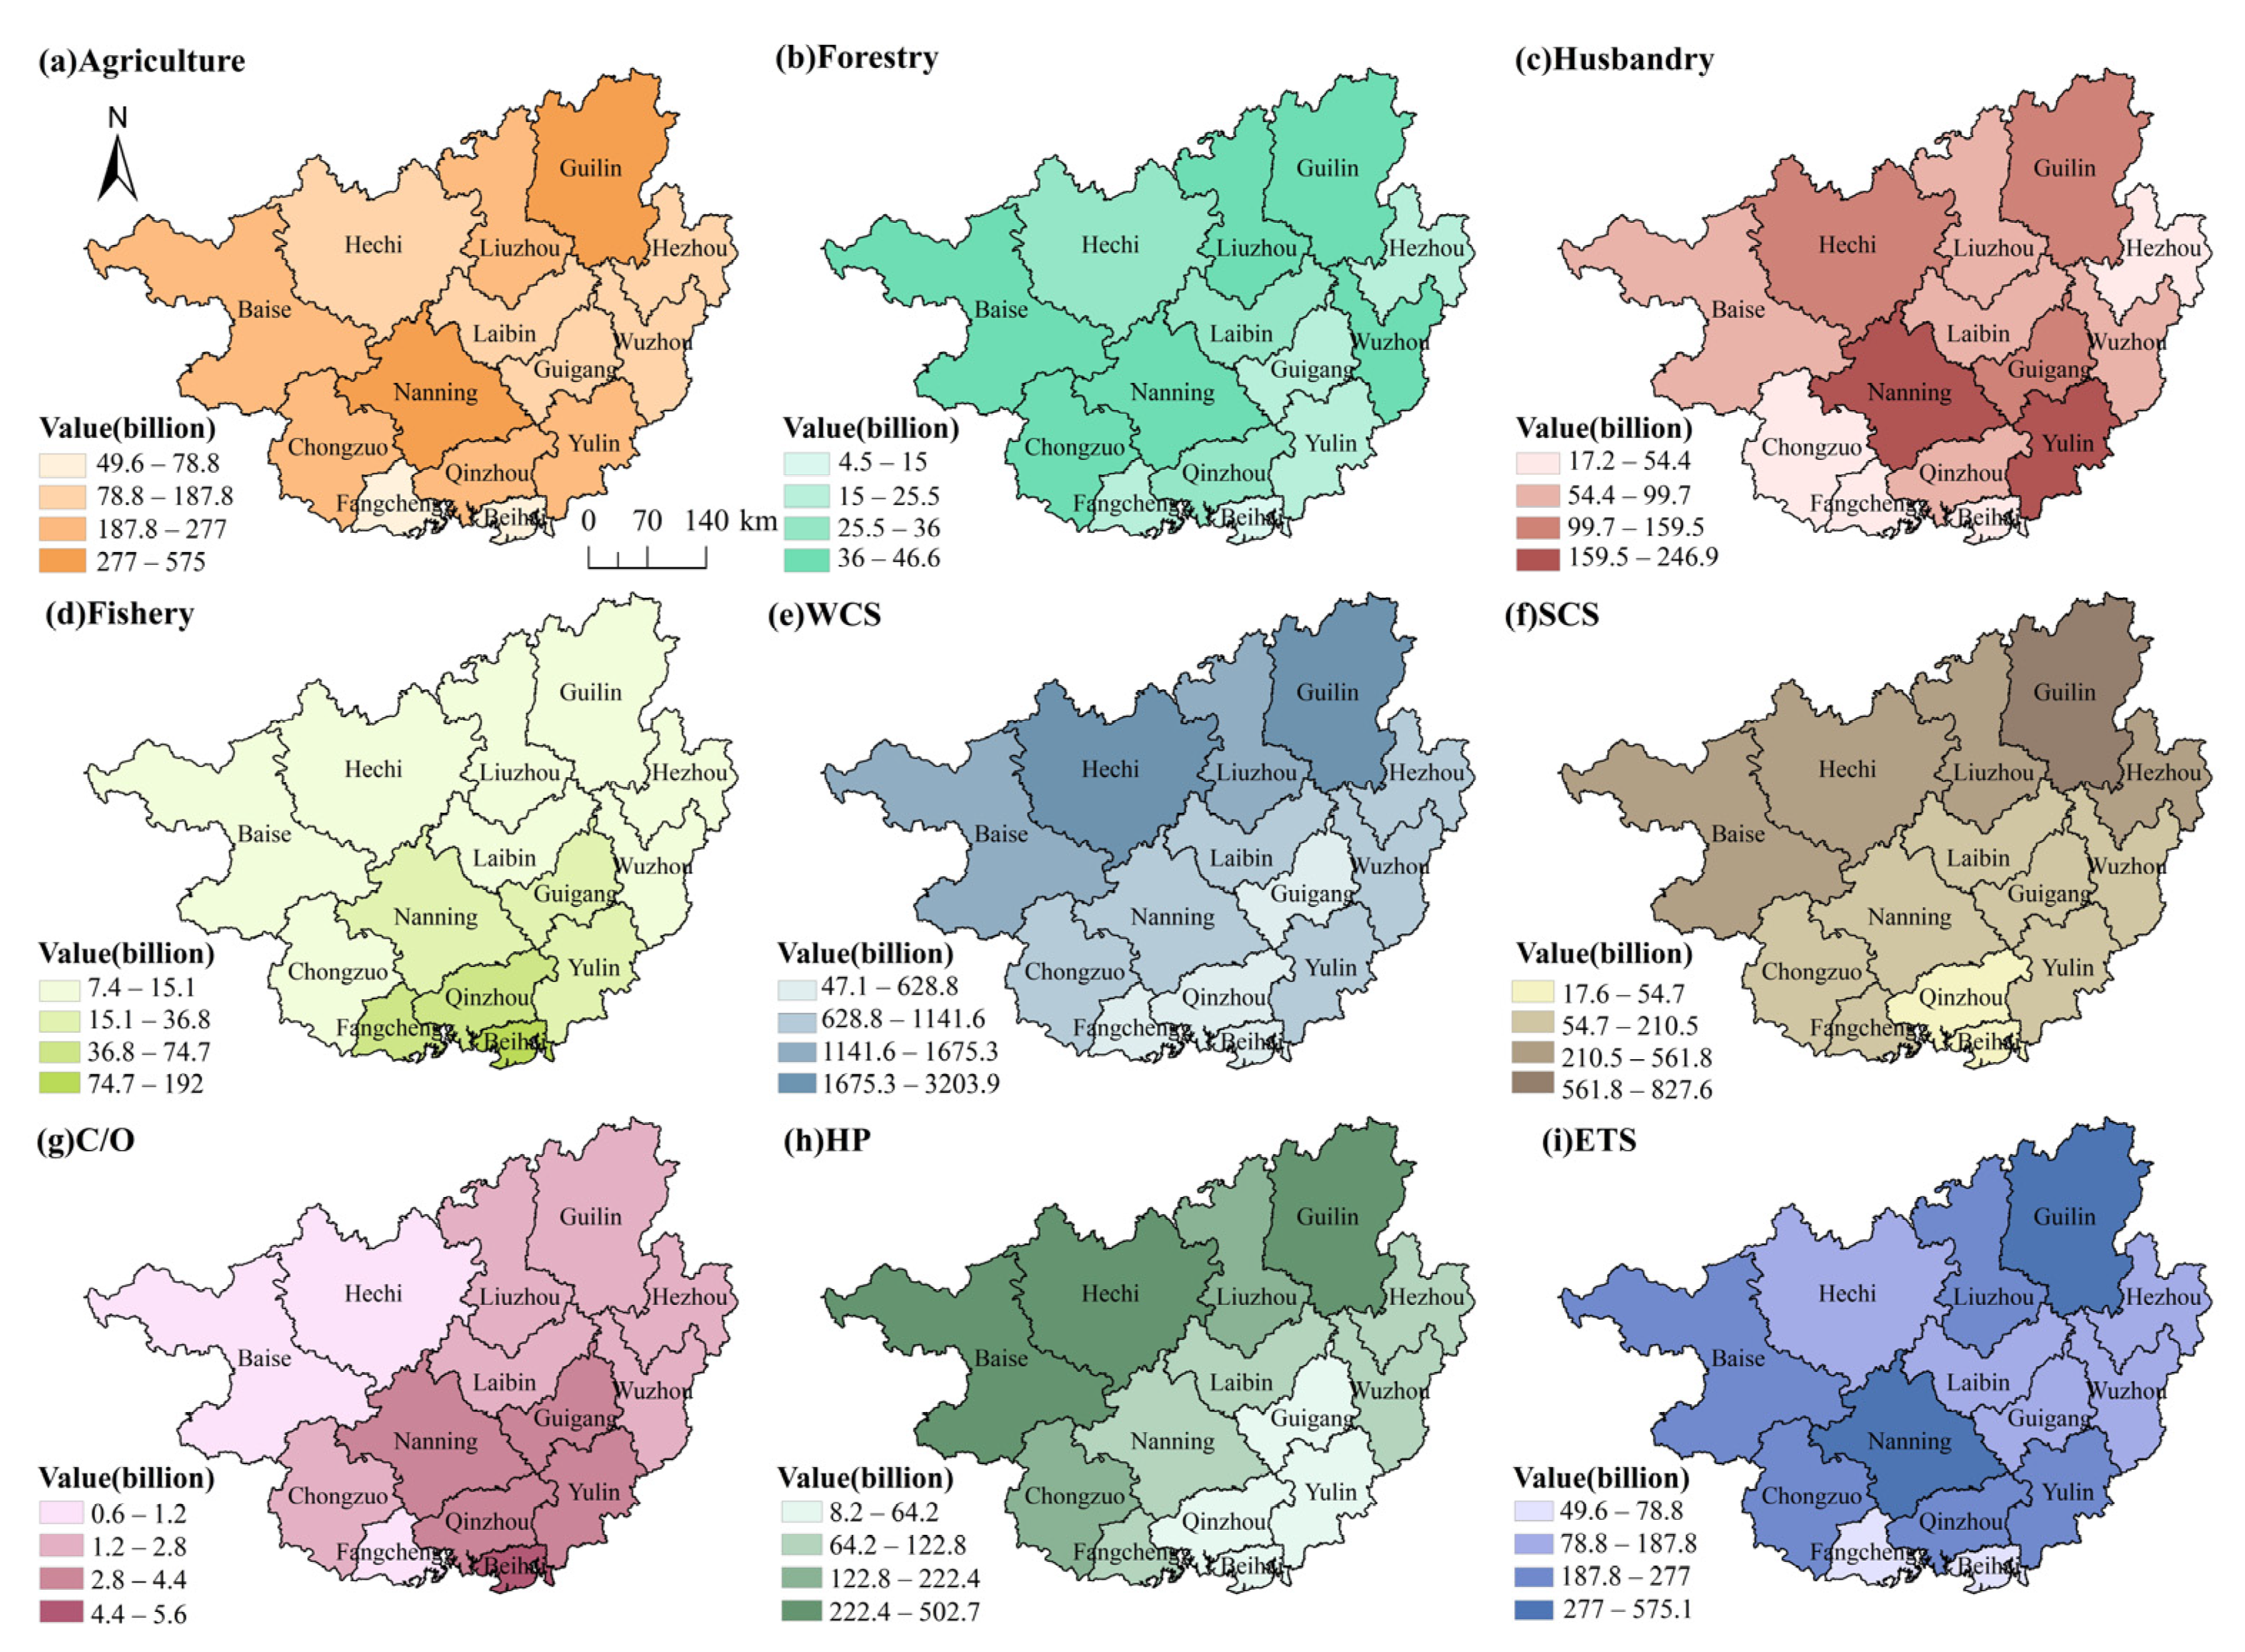
- ERS was the main component of GEP, showing a spatial distribution pattern that was high in the north and low in the south. From 2005 to 2020, ERS generally showed an increasing trend. Among the four ESs, the water conservation service accounted for more than 52% of ERS, followed by the soil conservation service, which accounted for about 15% on average.
- From 2005 to 2020, GEP and GDP showed a synergistic upward trend, but there were differences among prefecture-level cities. Due to their location in the remote inland area, BS and HC were relatively backward economically but had extremely high GEPs. Through rational development and utilization of ecosystems, as in LZ, QZ and GG, ecological advantages could be transformed into economic advantages to promote economic development.
Author Contributions
Funding
Institutional Review Board Statement
Informed Consent Statement
Data Availability Statement
Conflicts of Interest
References
- Sintayehu, D.W. Impact of climate change on biodiversity and associated key ecosystem services in Africa: A systematic review. Ecosyst. Health Sustain. 2018, 4, 225–239. [Google Scholar] [CrossRef]
- Schowalter, T.D.; Noriega, J.A.; Tscharntke, T. Insect effects on ecosystem services—Introduction. Basic Appl. Ecol. 2018, 26, 1–7. [Google Scholar] [CrossRef]
- Machnik, A. Natural Capital and Ecological Ecosystem Services: Methods of Measuring Socio-economic Value of Nature. In Responsible Consumption and Production; Leal Filho, W., Azul, A.M., Brandli, L., Özuyar, P.G., Wall, T., Eds.; Springer International Publishing: Cham, Germany, 2020; pp. 511–523. [Google Scholar]
- Hickel, J.; Hallegatte, S. Can we live within environmental limits and still reduce poverty? Degrowth or decoupling? Dev. Policy Rev. 2022, 40, e12584. [Google Scholar] [CrossRef]
- Hickel, J.; Kallis, G. Is green growth possible? New Political Econ. 2020, 25, 469–486. [Google Scholar] [CrossRef]
- Edens, B.; Maes, J.; Hein, L.; Obst, C.; Siikamaki, J.; Schenau, S.; Javorsek, M.; Chow, J.; Chan, J.Y.; Steurer, A.; et al. Establishing the SEEA Ecosystem Accounting as a global standard. Ecosyst. Serv. 2022, 54, 101413. [Google Scholar] [CrossRef]
- Ouyang, Z.; Zhu, C.; Yang, G.; Xu, W.; Zheng, H.; Zhang, Y.; Xiao, Y. Gross ecosystem product: Concept, accounting framework and case study. Acta Ecol. Sin. 2013, 33, 6747–6761. [Google Scholar] [CrossRef]
- He, J.; Wan, Y.; Feng, L.; Ai, J.; Wang, Y. An integrated data envelopment analysis and emergy-based ecological footprint methodology in evaluating sustainable development, a case study of Jiangsu Province, China. Ecol. Indic. 2016, 70, 23–34. [Google Scholar] [CrossRef]
- Obst, C.; Hein, L.; Edens, B. National Accounting and the Valuation of Ecosystem Assets and Their Services. Environ. Resour. Econ. 2016, 64, 1–23. [Google Scholar] [CrossRef]
- Wu, C.; Ma, G.; Yang, W.; Zhou, Y.; Peng, F.; Wang, J.; Yu, F. Assessment of Ecosystem Service Value and Its Differences in the Yellow River Basin and Yangtze River Basin. Sustainability 2021, 13, 3822. [Google Scholar] [CrossRef]
- Jiang, H.; Wu, W.; Wang, J.; Yang, W.; Gao, Y.; Duan, Y.; Ma, G.; Wu, C.; Shao, J. Mapping global value of terrestrial ecosystem services by countries. Ecosyst. Serv. 2021, 52, 101361. [Google Scholar] [CrossRef]
- Bagstad, K.J.; Ingram, J.C.; Shapiro, C.D.; La Notte, A.; Maes, J.; Vallecillo, S.; Casey, C.F.; Glynn, P.D.; Heris, M.P.; Johnson, J.A.; et al. Lessons learned from development of natural capital accounts in the United States and European Union. Ecosyst. Serv. 2021, 52, 101359. [Google Scholar] [CrossRef]
- Zang, Z.; Zhang, Y.; Xi, X. Analysis of the Gross Ecosystem Product—Gross Domestic Product Synergistic States, Evolutionary Process, and Their Regional Contribution to the Chinese Mainland. Land 2022, 11, 732. [Google Scholar] [CrossRef]
- Ouyang, Z.; Zheng, H.; Xiao, Y.; Polasky, S.; Liu, J.; Xu, W.; Wang, Q.; Zhang, L.; Xiao, Y.; Rao, E.; et al. Improvements in ecosystem services from investments in natural capital. Science 2016, 352, 1455–1459. [Google Scholar] [CrossRef]
- Jiang, W.; Wu, T.; Fu, B. The value of ecosystem services in China: A systematic review for twenty years. Ecosyst. Serv. 2021, 52, 101365. [Google Scholar] [CrossRef]
- Ma, G.; Yu, F.; Wang, J.; Zhou, X.; Yuan, J.; Mou, X.; Zhou, Y.; Yang, W.; Peng, F. Measuring gross ecosystem product (GEP) of 2015 for terrestrial ecosystems in China. China Environ. Sci. 2017, 37, 1474–1482. [Google Scholar]
- Ouyang, Z.; Song, C.; Zheng, H.; Polasky, S.; Xiao, Y.; Bateman, I.J.; Liu, J.; Ruckelshaus, M.; Shi, F.; Xiao, Y.; et al. Using gross ecosystem product (GEP) to value nature in decision making. Proc. Natl. Acad. Sci. USA 2020, 117, 14593–14601. [Google Scholar] [CrossRef]
- Wu, N.; Chen, H.; Ge, J. The Accounting of Anhui’s Gross Ecosystem Product within the “Green GDP2.0” Framework. J. Anhui Agric. Univ. 2018, 27, 39–49. [Google Scholar] [CrossRef]
- Liang, L.-N.; Siu, W.S.; Wang, M.-X.; Zhou, G.-J. Measuring gross ecosystem product of nine cities within the Pearl River Delta of China. Environ. Chall. 2021, 4, 100105. [Google Scholar] [CrossRef]
- Zou, Z.; Wu, T.; Xiao, Y.; Song, C.; Wang, K.; Ouyang, Z. Valuing natural capital amidst rapid urbanization: Assessing the gross ecosystem product (GEP) of China’s Chang-Zhu-Tan’ megacity. Environ. Res. Lett. 2020, 15, 124019. [Google Scholar] [CrossRef]
- Ouyang, Z.; Lin, Y.; Song, C. Research on Gross Ecosystem Product(GEP): Case study of Lishui City, Zhejiang Province. Environ. Sustain. Dev. 2020, 45, 80–85. [Google Scholar] [CrossRef]
- Dolkar, P.; Yi, X.; Zhiyun, O.; Liyan, W. Assessment of ecological conservation effect in Xishui county based on gross ecosystem product. Acta Ecol. Sin. 2020, 40, 499–509. [Google Scholar]
- Li, F.; Yan, B.; Lu, G.; Li, Z.; Zhu, X. Research on the Premise of Ecological Product Value Realization Mechanism: A Case Study of Gaochun District, Nanjing. Environ. Prot. 2021, 49, 51–58. [Google Scholar] [CrossRef]
- Wu, Z.; Zeng, H. Evaluation of forest ecosystem services value in China based on meta-analysis. Acta Ecol. Sin. 2021, 41, 5533–5545. [Google Scholar]
- Zhang, J.; Zou, Z. Research on calculation and application of GEP in Brahmaputra River Basin. Ecol. Econ. 2022, 1–14. Available online: http://kns.cnki.net/kcms/detail/53.1193.F.20220219.0838.002.html (accessed on 1 June 2022).
- Jin, D.; Watson, C.; Kite-Powell, H.; Kirshen, P. Evaluating Boston Harbor cleanup: An ecosystem valuation approach. Front. Mar. Sci. 2018, 5, 478. [Google Scholar] [CrossRef]
- Escobedo, F.J.; Giannico, V.; Jim, C.Y.; Sanesi, G.; Lafortezza, R. Urban forests, ecosystem services, green infrastructure and nature-based solutions: Nexus or evolving metaphors? Urban For. Urban Green. 2019, 37, 3–12. [Google Scholar] [CrossRef]
- Raum, S.; Hand, K.L.; Hall, C.; Edwards, D.M.; O’Brien, L.; Doick, K.J. Achieving impact from ecosystem assessment and valuation of urban greenspace: The case of i-Tree Eco in Great Britain. Landsc. Urban Plan. 2019, 190, 103590. [Google Scholar] [CrossRef]
- Bateman, I.J.; Harwood, A.R.; Abson, D.J.; Andrews, B.; Crowe, A.; Dugdale, S.; Fezzi, C.; Foden, J.; Hadley, D.; Haines-Young, R.; et al. Economic Analysis for the UK National Ecosystem Assessment: Synthesis and Scenario Valuation of Changes in Ecosystem Services. Environ. Resour. Econ. 2014, 57, 273–297. [Google Scholar] [CrossRef]
- Raymond, C.M.; Bryan, B.A.; MacDonald, D.H.; Cast, A.; Strathearn, S.; Grandgirard, A.; Kalivas, T. Mapping community values for natural capital and ecosystem services. Ecol. Econ. 2009, 68, 1301–1315. [Google Scholar] [CrossRef]
- Sannigrahi, S.; Pilla, F.; Basu, B.; Basu, A.S.; Zhang, Q.; Wang, Y.; Joshi, P.K.; Chakraborti, S.; Coscieme, L.; Keesstra, S.; et al. Identification of Conservation Priority Zones Using Spatially Explicit Valued Ecosystem Services: A Case from the Indian Sundarbans. Integr. Environ. Assess. Manag. 2020, 16, 773–787. [Google Scholar] [CrossRef]
- Vačkářů, D.; Grammatikopoulou, I. Toward development of ecosystem asset accounts at the national level. Ecosyst. Health Sustain. 2019, 5, 36–46. [Google Scholar] [CrossRef]
- Wei, J.; Yang, Y.; Xie, X.; Liao, L.; Tian, Y.; Zhou, J. Quantifying Ecosystem Service Trade-offs and Synergies in Nanning City Based on Ecosystem Service Bundles. J. Ecol. Rural. Environ. 2022, 38, 21–31. [Google Scholar] [CrossRef]
- Fan, h.; Zhang, Y.; Zou, L.; Pan, L. A study on the baseline value of the Chinese mangrove services and allocation of the value to individual tree. Acta Ecol. Sin. 2022, 42, 1262–1275. [Google Scholar]
- Gao, M.; Hu, Y.; Li, X.; Song, R. Construction of ecological security pattern based on the importance of ecosystem services and environmental sensitivity in karst mountainous areas: A case study in Hechi, Guangxi. Acta Ecol. Sin. 2021, 41, 2596–2608. [Google Scholar]
- Wu, B.; Li, Y.; Zhao, Q.; Zhang, W.; Lu, R. The Service Value and Driving Mechanism of Coastal Wetland Ecosystem in Beibu Gulf of Guangxi. Ecol. Econ. 2020, 36, 151–157. [Google Scholar]
- Guangxi Zhuang Autonomous Region Bureau of Statistics. Guangxi Statistical Yearbook; China Statistics Press: Beijing, China, 2006. [Google Scholar]
- Guangxi Zhuang Autonomous Region Bureau of Statistics. Guangxi Statistical Yearbook; China Statistics Press: Beijing, China, 2011. [Google Scholar]
- Guangxi Zhuang Autonomous Region Bureau of Statistics. Guangxi Statistical Yearbook; China Statistics Press: Beijing, China, 2016. [Google Scholar]
- Guangxi Zhuang Autonomous Region Bureau of Statistics. Guangxi Statistical Yearbook; China Statistics Press: Beijing, China, 2021. [Google Scholar]
- Wang, Z.; Zhang, Z.; Suo, Y. A new water balance equation introducing dew amount in arid area. J. Hydraul. Eng. 2019, 50, 710–720. [Google Scholar] [CrossRef]
- Wu, X.; Hu, T.; Wang, X.; Jiang, Y.; Li, X. Review of estimating and measuring regional evapotran spiration. Trans. CSAE 2006, 22, 257–262. [Google Scholar]
- Zhang, M.; Mao, R. The Simplified model of salt-water regimes in farmland soil under the processing of evaportranspiration. Chin. Acad. Sci. 2003, 03, 108–111. [Google Scholar]
- Zhao, L.; Zhao, W. Water balance and migration for summer maize in an oasis farmland of northwest China. Chin. Sci. Bull. 2014, 59, 3430. [Google Scholar]
- Montanarella, L.; Panagos, P. The relevance of sustainable soil management within the European Green Deal. Land Use Policy 2021, 100, 104950. [Google Scholar] [CrossRef]
- Renison, D.; Hensen, I.; Suarez, R.; Cingolani, A.; Marcora, P.; Giorgis, M. Soil conservation in Polylepis mountain forests ofCentral Argentina: Is livestock reducing our natural capital? Austral Ecol. 2009, 35, 435–443. [Google Scholar] [CrossRef]
- Verma, S.; Singh, P.; Mishra, S.; Singh, V.; Singh, V.; Singh, A. Activation soil moisture accounting (ASMA) for runoff estimation using soil conservation service curve number (SCS-CN) method. J. Hydrol. 2020, 589, 125114. [Google Scholar] [CrossRef]
- Eckert, S.; Ghebremicael, S.; Hurni, H.; Kohler, T. Identification and classification of structural soil conservation measures basedon very high resolution stereo satellite data. Environ. Manag. 2017, 193, 592–606. [Google Scholar]
- Kong, L.; Zheng, H.; Rao, E.; Xiao, Y.; Ouyang, Z.; Li, C. Evaluating indirect and direct effects of eco-restoration policy on soil conservation service in Yangtze River Basin. Total Environ. 2018, 631, 887–894. [Google Scholar] [CrossRef]
- Deng, Y.; Yao, S.; Hou, M.; Zhang, T.; Lu, Y.; Gong, Z.; Wang, Y. Assessing the effects of the Green for Grain Program on ecosystem carbon storage service by linking the InVEST and FLUS models: A case study of Zichang county in hilly and gully region of Loess Plateau. J. Nat. Resour. 2020, 35, 826–844. [Google Scholar] [CrossRef]
- Ouyang, Z.; Xiao, S.; Zhu, C.; Zheng, H.; Zou, Z.; Song, C.; Bo, W.; Huang, B. Theory and Methodology of Gross Ecosystem Product (GEP) Accounting; Beijing Publishing House: Beijing, China, 2021. [Google Scholar]
- Yan, L.; Xi, W.; Zhang, Z. Analysis of the Habitat Quality Changes and Influencing Factors in Chuxiong Prefecture under the Background of Landscape Pattern Changes. Int. J. Ecol. 2021, 10, 655. [Google Scholar] [CrossRef]
- Baixue, W.; Weiming, C.; Shengxin, L. Impact of land use changes on habitat quality in Altay region. J. Resour. Ecol. 2021, 12, 715–728. [Google Scholar] [CrossRef]
- Hu, X.; Song, C.; Fan, X.; Xiao, y.; Xu, W.; Ouyang, Z. Main Regulation Services and Value Assessment of Shrub Ecosystem in China. J. Beijing For. Univ. (Soc. Sci.) 2021, 20, 58–64. [Google Scholar]
- Duan, X.; Bai, Z.; Rong, L.; Li, Y.; Ding, J.; Tao, Y.; Li, J.; Li, J.; Wang, W. Investigation method for regional soil erosion based on the Chinese Soil Loss Equation and high-resolution spatial data: Case study on the mountainous Yunnan Province, China. Catena 2020, 184, 104237. [Google Scholar] [CrossRef]
- Economics, V. State and Trends of Carbon Pricing 2016; World Bank: Washington, DC, USA, 2016. [Google Scholar]
- Santikarn, M.; Churie Kallhauge, A.N.; Bozcaga, M.O.; Sattler, L.; Mccormick, M.S.; Ferran Torres, A.; Conway, D.; Mongendre, L.; Inclan, C.; Mikolajczyk, S. State and Trends of Carbon Pricing 2021; World Bank: Washington, DC, USA, 2021. [Google Scholar]
- Capoor, K.; Ambrosi, P. State and Trends of the Carbon Market 2006; World Bank: Washington, DC, USA, 2006. [Google Scholar]
- Linacre, N.; Kossoy, A.; Ambrosi, P. State and Trends of the Carbon Market 2011; World Bank: Washington, DC, USA, 2011. [Google Scholar]
- Wang, B.; Song, Q. Value assessing methods of species diversity conservation in forest ecosystem. J. Beijing For. Univ. 2012, 34, 155–160. [Google Scholar] [CrossRef]
- Wang, B.; Zhen, G.; Guo, H. Economic Value Assessment of Forest Species Diversity Conservation in China Based on the Shannon-Wiener Index. For. Res. 2008, 21, 268–274. [Google Scholar]
- Chinese Academy of Environmental Planning; Research Center for Eco-Environmental Sciences. The Technical Guideline on Gross Ecosystem Product (GEP); Ministry of Ecology Environment of the People’s Republic of China: Beijing, China, 2020. [Google Scholar]
- Himes-Cornell, A.; Pendleton, L.; Atiyah, P. Valuing ecosystem services from blue forests: A systematic review of the valuation of salt marshes, sea grass beds and mangrove forests. Ecosyst. Serv. 2018, 30, 36–48. [Google Scholar] [CrossRef]
- Qiu, H.; Hu, B.; Zhang, Z. Study on ecosystem service value of Guangxi in the past 20 years based on land use change. J. Environ. Eng. Technol. 2021, 1–15. Available online: http://kns.cnki.net/kcms/detail/11.5972.X.20211028.1931.009.html (accessed on 1 June 2022).
- Auffhammer, M. Quantifying economic damages from climate change. J. Econ. Perspect. 2018, 32, 33–52. [Google Scholar] [CrossRef]


| ES | Accounting Items | Contents | Data Source |
|---|---|---|---|
| EPS | Agricultural | Agricultural products | Annual Statistical Yearbooks |
| Forestry | Forestry products | ||
| Husbandry | Husbandry products | ||
| Fishery | Fishery products | ||
| ERS | WCS | Annual precipitation, annual evapotranspiration, annual storm water production | China National Environmental Monitoring Centre |
| SCS | Soil erosion | National Soil Information Service Platform of China | |
| C | Aboveground carbon stocks in terrestrial ecosystems, total ecosystem types, biomass | Resource and Environmental Science Data Center of Chinese Academy of Sciences | |
| O | Carbon sequestration, oxygen emissions | ||
| HP | Habitat quality, habitat scarcity | NASA | |
| ETS | Tourism | Domestic and inbound tourism arrivals and tourism receipts | Annual Statistical Yearbooks |
| ZONE | WCS | SCS | C/O | Unit: billion t/a |
|---|---|---|---|---|
| HP | ||||
| Guangxi | 2585.13 | 5509.52 | 3950.39 | 155.09 |
| NN | 54.22 | 198.63 | −525.77 | 7.76 |
| LZ | 354.69 | 164.19 | 897.07 | 7.39 |
| GL | 1020.05 | −461.76 | 2357.85 | 6.98 |
| WZ | 53.31 | −12.80 | 177.05 | 1.15 |
| BH | 0.96 | 6.67 | −3.05 | 0.05 |
| FCG | −27.96 | 6.05 | −95.67 | 1.13 |
| QZ | 16.37 | 38.98 | −115.53 | 1.83 |
| GG | 30.23 | 31.88 | 53.22 | 1.38 |
| YL | 45.91 | 40.17 | 103.64 | 1.54 |
| BS | 246.60 | 4091.41 | −373.67 | 77.03 |
| HZ | 51.43 | −60.45 | 141.80 | 0.56 |
| HC | 690.02 | 1290.98 | 1909.42 | 35.78 |
| LB | 109.09 | 85.03 | 131.20 | 3.41 |
| CZ | −59.80 | 90.55 | −707.18 | 9.10 |
Publisher’s Note: MDPI stays neutral with regard to jurisdictional claims in published maps and institutional affiliations. |
© 2022 by the authors. Licensee MDPI, Basel, Switzerland. This article is an open access article distributed under the terms and conditions of the Creative Commons Attribution (CC BY) license (https://creativecommons.org/licenses/by/4.0/).
Share and Cite
Wang, L.; Su, K.; Jiang, X.; Zhou, X.; Yu, Z.; Chen, Z.; Wei, C.; Zhang, Y.; Liao, Z. Measuring Gross Ecosystem Product (GEP) in Guangxi, China, from 2005 to 2020. Land 2022, 11, 1213. https://doi.org/10.3390/land11081213
Wang L, Su K, Jiang X, Zhou X, Yu Z, Chen Z, Wei C, Zhang Y, Liao Z. Measuring Gross Ecosystem Product (GEP) in Guangxi, China, from 2005 to 2020. Land. 2022; 11(8):1213. https://doi.org/10.3390/land11081213
Chicago/Turabian StyleWang, Luying, Kai Su, Xuebing Jiang, Xiangbei Zhou, Zhu Yu, Zhongchao Chen, Changwen Wei, Yiming Zhang, and Zhihong Liao. 2022. "Measuring Gross Ecosystem Product (GEP) in Guangxi, China, from 2005 to 2020" Land 11, no. 8: 1213. https://doi.org/10.3390/land11081213