Article

Assessment on the Urbanization Quality of China’s Main Grain-Producing Areas under the SDGs

1
Key Research Institute of Yellow River Civilization and Sustainable Development & Collaborative Innovation Center on Yellow River Civilization Jointly Built by Henan Province and Ministry of Education, Henan University, Kaifeng 475001, China
2
College of Geography and Environmental Science, Henan University, Kaifeng 475004, China
3
School of Economics, Henan University, Kaifeng 475004, China
*
Author to whom correspondence should be addressed.
Land 2022, 11(8), 1163; https://doi.org/10.3390/land11081163
Submission received: 21 June 2022 / Revised: 22 July 2022 / Accepted: 23 July 2022 / Published: 27 July 2022
(This article belongs to the Special Issue Rural Land Management Interaction with Urbanization)

Abstract

:
The Sustainable Development Goals (SDGs) adopted by the United Nations in 2015 guide the important direction of high-quality urbanization in China’s main grain-producing areas (MGPAs), and improving the quality of urbanization is also crucial to achieve the SDGs. China’s MGPAs not only undertake the task of promoting urbanization but also of ensuring food security. The establishment of an index system based on SDGs can more effectively measure the urbanization quality of MGPAs. For the specific targets of the SDGs, this study established two sets of multidimensional indicator systems, whether including the goals of food and agriculture, and tracked the progress toward improving urbanization quality of China’s MGPAs, including 128 prefecture-level cities, during 2010–2018. We found that the comprehensive urbanization quality and the index of economic efficiency, urbanization level, and environmental quality showed an upward trend with significant regional differences and spatial agglomeration distributions, but the level of agricultural development and urban–rural co-ordination have declined in recent years; the ranking and distribution of urbanization quality, including agricultural development, varied significantly, and the number of cities belonging to the good co-ordination mode decreased as some cities changed to a lower level; and urbanization that does not sacrifice the agricultural capabilities of MGPAs could improve urbanization quality and implement the SDGs.

1. Introduction

The contribution of urbanization to land-use change has become an important sustainability issue [1], especially for China, where rapid urbanization has exacerbated the conflict between agricultural and urban land. Urbanization has developed rapidly in the 20th and 21st centuries and has been regarded as an important development strategy [2]. With increasing global urbanization, the Earth is gradually becoming an urban planet [3,4]. China’s urbanization has shown unprecedented speed and scale in recent decades, and has become an important force to promote global sustainable development. However, urban land expansion modifies habitats, biogeochemistry, hydrology, land cover, and surface energy balance [5]. More than 60% of the world’s irrigated croplands are located near urban areas [6], but main grain-producing areas (MGPAs) are also being eroded by rapid urbanization [7,8], and this is demonstrated in numerous cases in China, the USA, Egypt, Turkey, India, and other countries [1]. The Food and Agriculture Organization of the United Nations pointed out that the current global food crisis is further worsening [9]. Deciphering how to scientifically measure the urbanization quality of MGPAs and co-ordinate the relationship between food production and urbanization has become an urgent problem to be solved. SDGs have become the consensus of the international community and guide the direction of economic development in various countries [10]. The MGPAs’ urbanization should follow the SDGs and focus on improving the quality of urbanization.
Urbanization embodies the process of population and land use transfer from rural areas to cities and towns. It is also the transformation process and improvement of people’s lifestyle, productivity level, and quality of life [11]. By the end of 2021, the urbanization rate of China’s permanent population had reached 64.72% [12], of which the urbanization rate of Shanghai, Beijing, and Tianjin had exceeded 80%. However, at the same time, the urban–rural imbalance in economic and social development has become increasingly prominent, and food security is the most unstable and vulnerable problem [13].
Most scholars agree that agricultural development is inversely related to industrialization and urbanization [14]. Especially for MGPAs, because of the constraints on available cultivated land, it seems that there is always a contradiction between ensuring national food security and promoting urbanization.
Knowing how to measure the development level of urbanization has always been the first problem in the stage of rapid urbanization [15]. Previous studies were mostly based on single or comprehensive indicators such as population, economy, and land. In recent years, the fusion of multisource data such as nighttime lighting and land use have also been widely used [15,16]. However, most studies rarely use agriculture and food security as the indicator system; only MGPAs consider agriculture as one of the indicators of the urbanization development [13,17].
In China, the most important way to solve the contradiction between urbanization and cultivated land protection is to implement the strategy of major function zoning, which is defined by an area’s specific, core function based on its environment, social and economic strength, and development potential [18,19]. It is mainly divided into four types of optimized, prioritized, restricted, and prohibited zones [20]. The MGPAs belong to the restricted zones, and undertake the dual tasks of promoting urbanization and ensuring food security, mainly including Heilongjiang, Henan, Shandong, Sichuan, Jiangsu, Hebei, Jilin, Anhui, Hunan, Hubei, Inner Mongolia, Jiangxi, and Liaoning [21].
Although China has controlled MGPAs through spatial planning, there are still many problems under rapid urbanization. First, the phenomenon of nonagricultural utilization of cultivated land such as occupying cultivated land for constructing high-speed railways, highways and roads, digging lakes and canals, and occupying permanent basic farmland for greening and afforestation has intensified [22], resulting in a sharp decrease in arable land and weakening the food-production capacity. Second, the development of urbanization has attracted young and middle-aged labor from rural areas to flow into cities on a large scale, resulting in widespread abandonment of farmland in rural areas and the conversion of double-cropping rice to single-cropping rice, which has a serious negative impact on food production [23,24,25,26]. Third, urbanization also causes soil quality degradation and soil erosion [27], intensifying water competition in food production [28]. Fourth, most of China’s MGPAs have long been in the embarrassing situation of “large grain province/county and financially poor province/county”, and the phenomenon of “grain and wealth upside down” is serious [29], resulting in increasingly prominent contradictions between grain production and urbanization. Therefore, it is urgent to solve the problem of sustainable development of urbanization in China’s MGPAs.
The United Nations proposed 17 Sustainable Development Goals (no poverty, zero hunger, good health and well-being, clean water and sanitation, affordable and clean energy, decent work and economic growth, industry, innovation and infrastructure, reduced inequalities, and sustainable cities and communities, etc.) in 2015 and most countries had committed to solve their toughest sustainable development challenges by 2030 [30,31]. Since then, many studies built a theoretical framework based on the SDGs and established an index system to finally measure the level of sustainable development, but the index system and measurement method varied with research needs [10,30]. However, we find that the SDGs cover a lot of content and are very comprehensive, but lack goal orientation, which makes it difficult to apply them to other research issues. Some scholars have gradually recognized this problem and began to clarify their own research questions, and then selected some indicators to establish a theoretical framework based on the SDGs [32]. Therefore, we believe that it is necessary to closely follow the research question itself and selectively apply the theoretical framework of the SDGs to make it more valuable.
SDGs are the best guidelines to high-quality urbanization, so urbanization is increasingly integrated with the SDGs [31,33]. To begin with, sustainable cities (Goal 11) put forward specific requirements for urbanization and are widely embedded in a high-quality urbanization measurement index system. Scholars not only emphasized the traditional three indicators of society, economy, and environment, but also further attention indicators such as urban resilience, health and well-being, and poverty eradication. Some studies analyzed the difficulties and evaluated the practice of specific cities in achieving Goal 11 [32,34,35,36,37]. Next, urbanization has played an important role in economic growth and poverty reduction, and is the main driving force and way to achieve the SDGs [38]. Eliminating urban diseases induced by urbanization is a common and sustainable development issue in the world during this period. In addition, the relationship between the different SDGs is also valued. Some studies have focused on the relationship between Goal 11 and other goals, such as the impact of poverty and urbanization on sustainable development [37], the challenges posed by urbanization to food security [39], and urban–rural linkages [36]. Meanwhile, other studies have also constructed evaluation systems that take into account various subgoals of the SDGs [40,41]. Finally, determining how to formulate urbanization policies according to the sustainable development goals has also become a research hotspot [42,43,44].
Existing research results are rich, but the following problems still exist. Firstly, most studies are only focused on Goal 11, which failed to fully reflect the high-quality development of urbanization. More attention should be paid to the other goals related to urbanization, and the evaluation indicators need to be further in line with the specific targets of the SDGs. Secondly, we should focus on the change trend of urbanization quality to examine its improvement degree and SDGs’ realization progress. Thirdly, China’s urbanization presents significant regional differences. It is necessary to consider the heterogeneity of urbanization background and process among different regions, and strengthen the research on different types of regions. More importantly, the research with regard to MGPAs has generally failed to combine urbanization quality with the SDGs, and also failed to consider the role of agricultural development in urbanization process [45,46]. SDGs provide a good multidimensional framework for exploring the high-quality urbanization of MGPAs without sacrificing agriculture and grain security. Therefore, MGPAs’ urbanization should be oriented toward the SDGs. It is critical need to embed the specific targets of the SDGs in the process of improving urbanization quality.
Above all, this paper innovatively included the agricultural development in the discussion of MGPAs’ urbanization quality, and established two sets of multidimensional indicator systems corresponding to sustainable cities (Goal 11), food security (Goal 2), and other related goals. We tracked MGPAs’ progress toward improving urbanization quality during 2010–2018. This study is essential in regards to formulating urbanization policies and exploring sustainable urbanization modes, and also provides a reference for other developing countries.

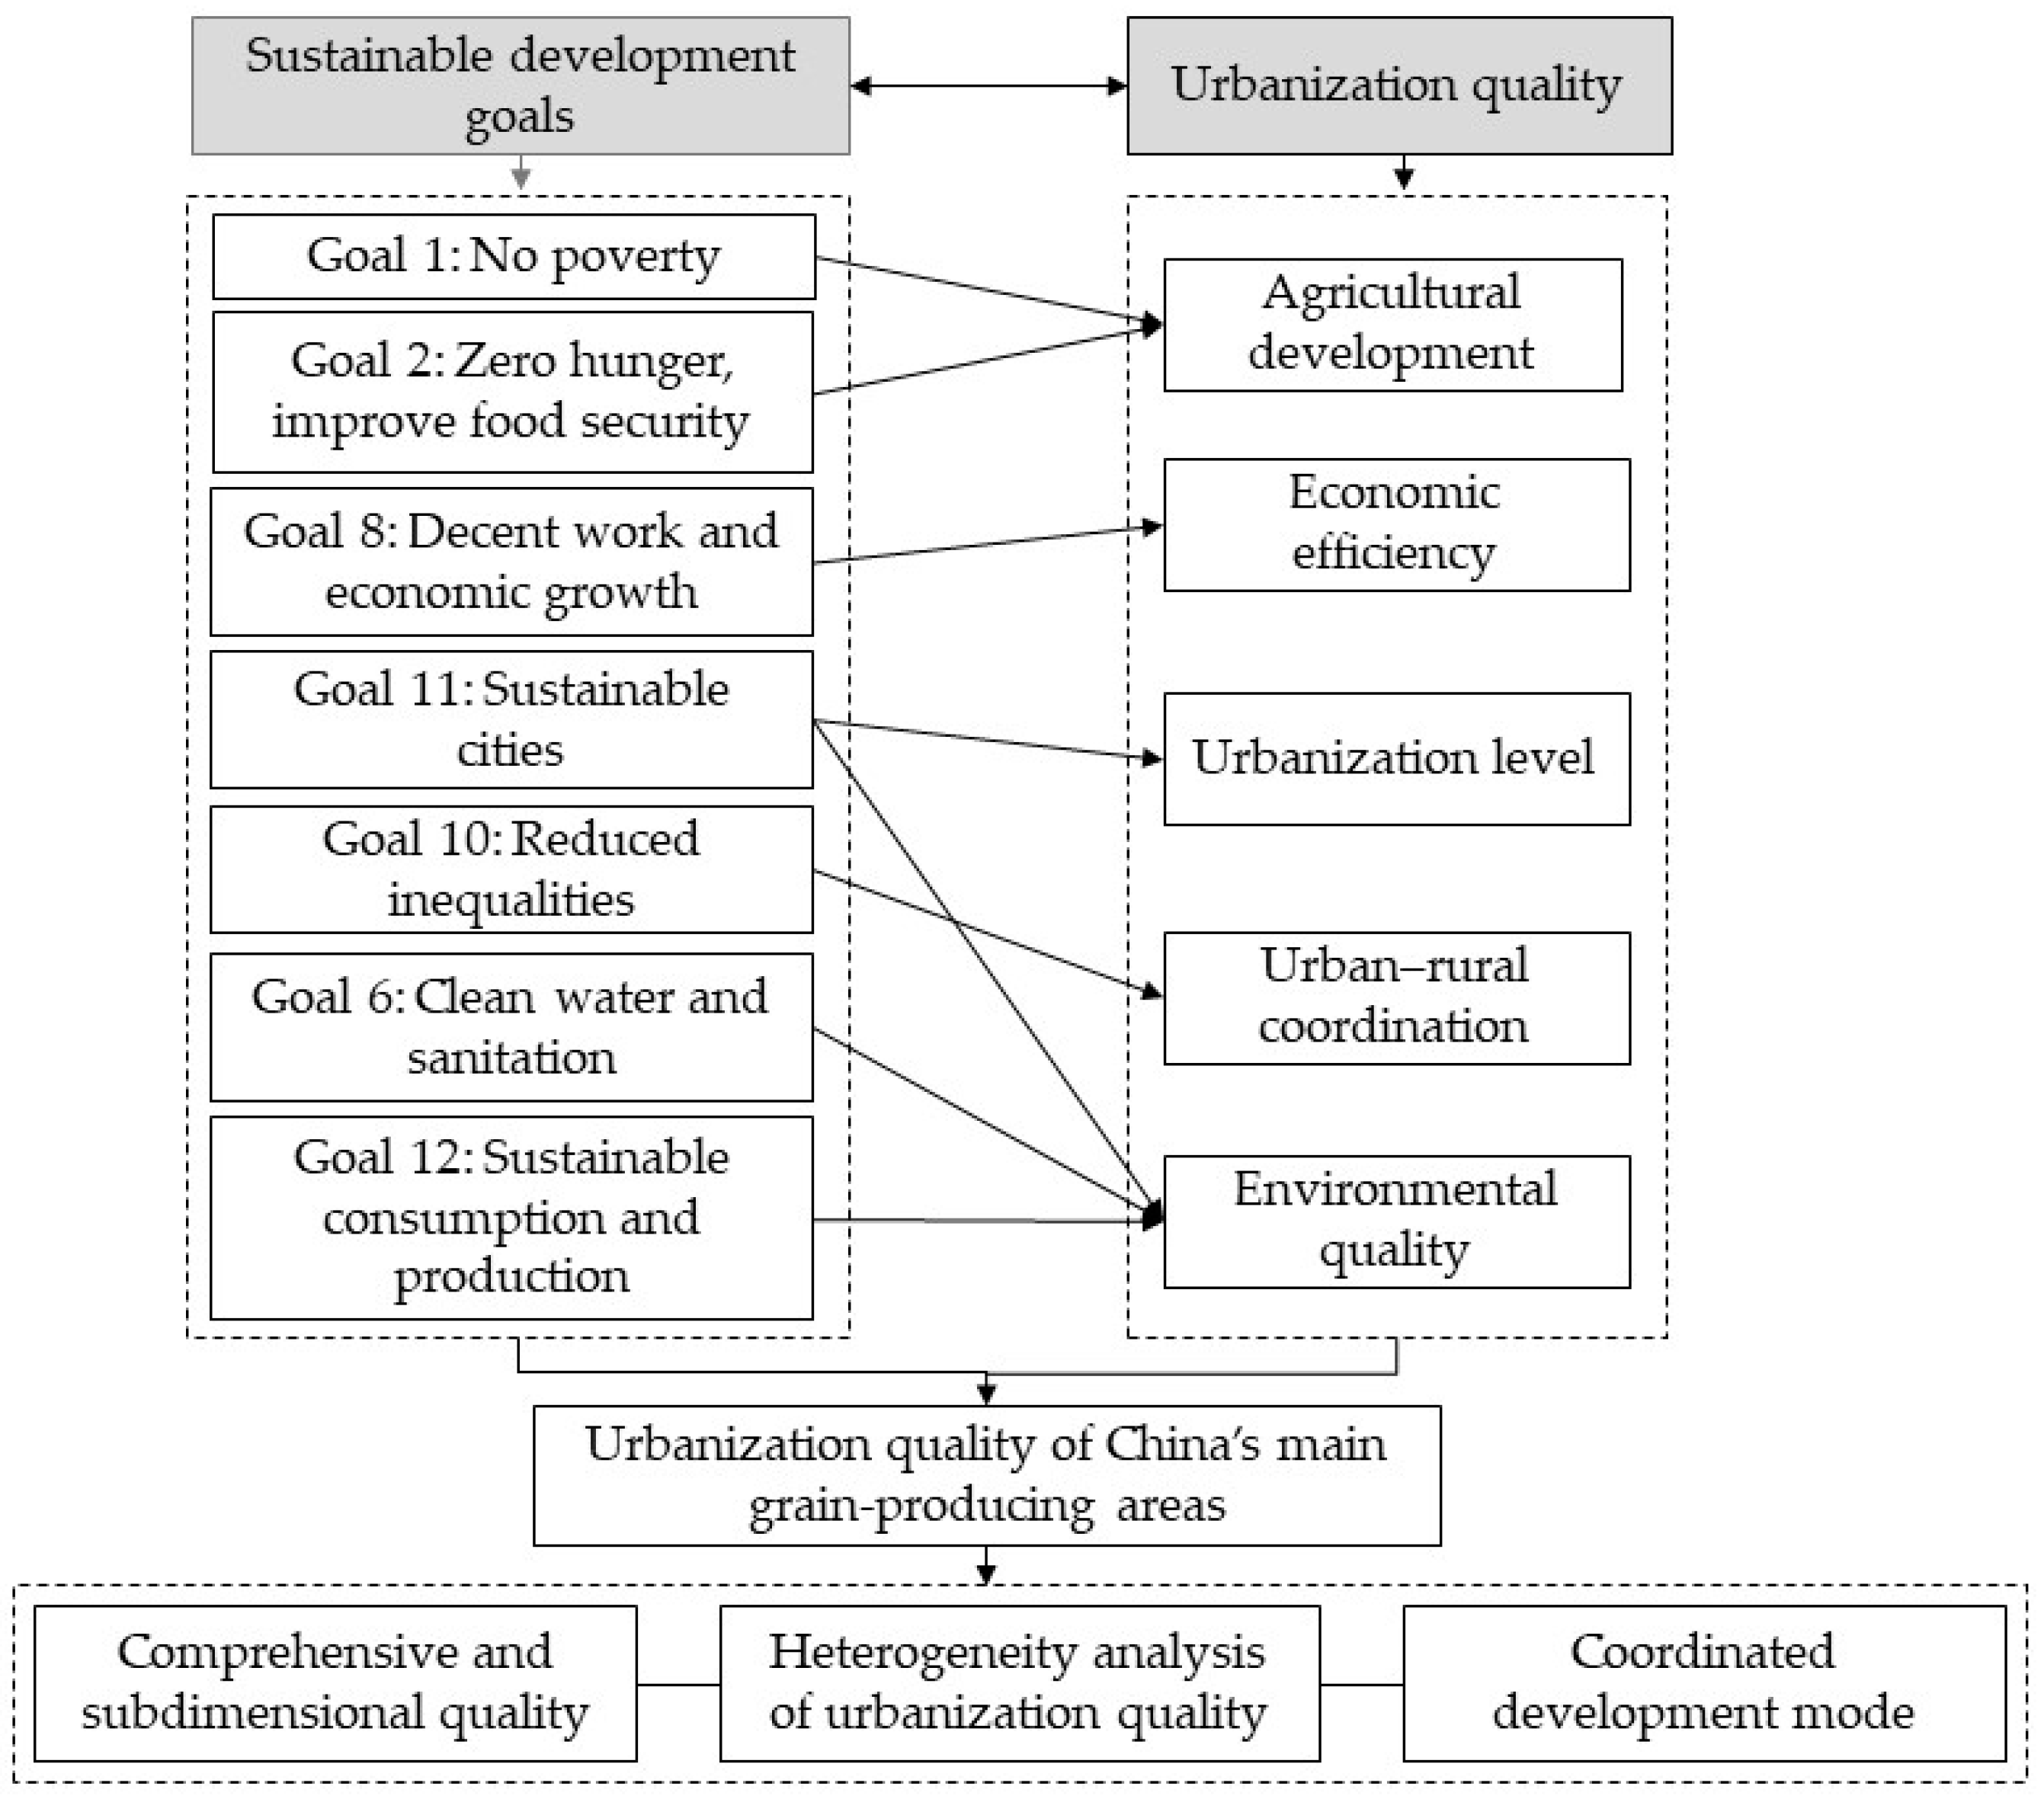
2. Analysis Framework

SDGs provide clear guidelines for all countries to clarify their future development priorities according to resource conditions and development backgrounds [32]. This study combined the SDGs with the status and tasks of MGPAs to explore urbanization quality. We built an analysis framework, as depicted in Figure 1.
(a) Construction of multidimensional evaluation indicator system. Among the 17 SDGs, the goals related to MGPAs’ urbanization quality included Goals 1, 2, 6, 8, 10, 11, and 12. In line with these goals, we constructed the following indicator system for evaluating urbanization quality.
In the beginning, the sustainable development of agriculture and urbanization are effective ways to achieve Goal 1 (no poverty) and Goal 2 (zero hunger, improve food security) [47]. Agriculture provides important resource support for economic development, and is the foundation for ensuring national food security and social stability. The improvement of agricultural production capacity plays an important role in solving the problem of food and increasing farmers’ income. At the same time, the continuous advancement of urbanization drives the aggregation and optimal allocation of resource elements, which is conducive to improving production efficiency and promoting the development of poverty-stricken areas [48]. MGPAs face the dual pressure of improving urbanization quality while increasing grain yield. Therefore, it is important to highlight the role of agricultural development in urbanization and introduce the constraint condition of agricultural development into the analysis framework.
Moreover, economic efficiency reflects the economic growth mode and operation quality, and is the internal driving force of urbanization and an important factor in decent work and economic growth (Goal 8) [49]. In this regard, the mode of economic development should be changed from an extensive one focused on rapid development to an intensive one focused on efficiency. In addition, the improvement of economic efficiency is conducive to sustainable economic growth and supports the further adjustment of the urbanization development mode.
Furthermore, sustainable cities (Goal 11) provide guidance for the assessment of urbanization level. Urbanization rate directly reflects the urbanization process and is an important indicator of urbanization level. Considering the characteristic of semiurbanization under China’s dual household registration system, the urbanization level should consider the structure of urban population [50]. Therefore, we should also pay attention to the migrant agricultural population. It is necessary to promote their urban citizenship status and ensure the access to public services to achieve inclusive and sustainable development of urbanization.
Additionally, co-ordinated urban–rural development is an inherent requirement for high-quality urbanization, and also an important part of reducing inequality (Goal 10). Urban–rural co-ordination includes urban and rural politics, economy, ecological environment, population, culture, income and space, etc. [51]. The rural–urban relationship is the most important interdependent aspect in a region [52]. However, the current unequal spatial development mode focusing on urban development has caused significant gaps between urban and rural areas, and the interests of rural areas have been damaged to a certain extent. Thus, a good relationship between urban and rural areas should be established, and cities should give full play to the driving role in the regional development, so as to gradually narrow the urban–rural development gap and achieve a greater degree of equality.
Last but not least, a good environment is an important guarantee for high-quality urbanization, and Goal 6 (clean water and sanitation), Goal 11, and Goal 12 (sustainable consumption and production) set requirements for the improvement of environmental quality during urbanization. Production and construction inevitably have negative environmental effects. Among them, water pollution and air-quality degradation are particularly prominent [53,54]. Relevant measures, such as reducing pollutant discharge intensity and strengthening pollution control, should be actively implemented to improve environmental quality. Thus, we focused on the improvement process of water and air quality to analyze the environmental sustainability.
(b) Heterogeneity analysis of urbanization quality. Urbanization development has a high degree of spatial heterogeneity [31] because there are differences in resource endowments and development levels in different regions. Therefore, we focus on the temporal and spatial dynamics of urbanization quality at the provincial and municipal levels, and consider regional differences in comprehensive and subdimensional qualities. Clarifying the multiscale pattern of urbanization quality can help MGPAs to formulate targeted policies.
(c) The co-ordinated development model of urbanization. High-quality urbanization attaches great importance to the co-ordinated development among all the elements [55]. Accordingly, based on our measurement of urbanization quality, we further examined the co-ordinated development modes of urbanization quality.

3. Study Areas

China’s MGPAs have significant agricultural production advantages and perform the important task of ensuring China’s food security. Considering regional population density and the proportion of agricultural population, we select nine provinces (excluding Liaoning, Heilongjiang, Jilin, and Inner Mongolia) as research objects, including 128 cities (Table 1 and Figure 2).
In 2018, MGPAs had a population of 670 million people, accounting for 48% of China’s total population (Table 1). The GDP and grain output accounted for 46% and 53% of China’s total, respectively. The urbanization rate was 57.58%. It can be seen that the population, economy, and grain output of MGPAs account for relatively high proportions of the national totals, and urbanization is in a stage of accelerated development. Therefore, promoting high-quality urbanization without sacrificing agriculture has great practical significance for MGPAs.
To further analyze urbanization quality, we divide cities into two types. Specifically, we compare the average grain production of each city with the national average during 2010–2018, and employ the standard of 400 kg per capita as the criterion for whether food production reaches a well-off level [56]. Cities with both indicators higher than the baselines are classified as densely populated agricultural areas; other cities are classified as nondensely populated agricultural areas. Table 1 and Figure 2 show the division results and relevant indicators, respectively. Sixty-one cities belong to densely populated agricultural areas; these are mainly gathered in the central and northern plains of MGPAs. Sixty-seven cities belong to nondensely populated agricultural areas.

4. Materials and Methods

4.1. Construction of Multidimensional Evaluation Indicator System and Weight Settings

Considering the SDGs, data availability, and the goal of being scientific, systematic, and representative, we established evaluation indicators for each dimension and determined their weights based on the Delphi method.
We used the Delphi method in two stages. At the first stage, we invited 15 professors, associate professors, and postdoctoral fellows to determine the indicator system. They have high standards and rich research experience in China’s MGPAs, urbanization, and regional development. Experts believe that the selection of indicators should be closely combined with the development characteristics of the study area to enhance the pertinence of indicators. First, we initially characterized the dimension of agricultural development in terms of per labor agricultural output value, per capita grain output, and the level of agricultural mechanization. Experts believed that this paper should focus on agricultural output, but agricultural mechanization represents the level of agricultural modernization to a greater extent. Thus, we finally eliminated the level of agricultural mechanization and kept the remaining two indicators. Second, data envelopment analysis (DEA) was used to measure economic efficiency, including scale efficiency and technical efficiency [57,58]. Employees, built-up area, and fixed-asset investment are the input indicators, and GDP and fiscal revenue are the output indicators. This dimension was more recognized by experts and had not been modified. Third, in the dimension of urbanization level, we initially only selected a single indicator of the proportion of urban population. However, experts believe that with the influx of a large number of people into cities, the degree of urbanization of the population is also an important issue in the process of urbanization in recent years. Therefore, we added the degree of civicization as one of the indicators. Fourth, we measured the urban–rural per capita income gap, per capita consumption gap, and per capita medical gap in terms of urban–rural overall planning. However, experts believe that the urban–rural per capita income gap and per capita consumption gap can largely reflect the urban–rural development gap. Although the urban–rural medical gap can reflect the gap in public resources between urban and rural areas to a certain extent, it is difficult to obtain data on the urban–rural medical gap in some cities, so this indicator is excluded. Fifth, in terms of environmental quality, we initially used PM2.5, sewage discharge, and comprehensive utilization rate of industrial solid waste to measure [49]. PM2.5 is one of the most important pollutants in air pollution in China, but it is rarely included in the existing evaluation system [59]. However, experts believe that the indicators should be comparable, and the total sewage discharge needs to be changed to sewage discharge intensity. At the same time, the dimension of environmental quality should reflect the pollution situation in the process of urbanization. In addition, due to the limitation of data, the comprehensive utilization rate of industrial solid waste is excluded, so we finally chose PM2.5 and sewage discharge intensity as indicators. Further, we also constructed two sets of indicator systems. One is a four-dimensional indicator system without the agricultural development dimension. The other is a five-dimensional indicator system that includes the agricultural development dimension. These were used to compare evaluation rankings before and after adding the agricultural development indicator and explore urbanization quality characteristics on the premise of not sacrificing agriculture. Table 2 and Table 3 show the primary and secondary indicators.
In the second stage, we held a symposium with 15 experts to determine the indicator weights. In the existing literature, objective weighting methods, such as the entropy method, are often used [60,61]. However, they relied too much on the statistical data of indicators, ignoring the importance of the indicators themselves in the research content. In contrast, indicator weights obtained on the basis of research area characteristics and experts’ experience are more in line with the connotation of MGPAs’ urbanization quality under the SDGs, and are conducive to the comparability among indicators. First, economic efficiency, urbanization level, urban–rural co-ordination, and environmental quality are of equal importance for improving urbanization quality of MGPAs, and these four indicators were given the same weight. In addition, agricultural development is the basis and a prerequisite for urbanization and is an important process accompanying urbanization. Thus, its weight was 0.12, which was relatively lower than the weights of other dimensions. Second, specifically for agricultural development, as core indicators reflecting agricultural output, per labor agricultural output value and per capita grain output are of the same weight. For economic efficiency, the improvement of urban economic efficiency is more influenced by technical efficiency. The weight of technical efficiency was slightly higher than scale efficiency. For urbanization level, urbanization rate is still the most prominent and representative, and the citizenization degree has gradually become an important part in improving urbanization level. Thus, urbanization rate was of a higher weight than the citizenization. Moreover, the urban–rural income and consumption gap play an equally important role in measuring urban–rural co-ordination. Similarly, PM2.5 and sewage discharge intensity are of the same weight.
The above socioeconomic data were compiled from the China City Statistical Yearbooks and Urban Construction Yearbooks. We took the Statistical Yearbooks and the statistical bulletins of nine provinces as supplemental materials.

4.2. Calculation of Urbanization Quality

First, the original data were preprocessed by the extreme value normalization method to ensure the comparability of different indicators. The normalized scores were used to evaluate the relative performance of urbanization quality improvement over time. The negative and positive indicators were preprocessed by Formula (1) and Formula (2), respectively:
X ij = ( max   x j   -   x ij ) / ( max   x j   -   min   x j )
  X ij = ( x ij   -   min   x j ) / ( max   x j   -   min   x j ) ,
where x ij refers to the j th indicator’s value in the i th city. max   x j   and   min   x j represent the maximum and minimum values, respectively. X ij is the normalized value.
Second, we aggregated the subdimensional and comprehensive quality scores. A higher score indicates better progress in improving urbanization quality. Specifically, the calculation of subdimensional and comprehensive qualities of i th depends on the following formulas:
U ik = j = 1 m ( X ij * λ j ) ,
T 1   = 0 . 25 U i 1 + 0 . 25 U i 2 + 0 . 25 U i 3 + 0 . 25 U i 4 ,
T 2 = 0 . 22 U i 1 + 0 . 22 U i 2 + 0 . 22 U i 3 + 0 . 22 U i 4 + 0 . 12 U i 5 ,
where k   = 1, 2 …… 5. λ j and m represent the corresponding indicator weight and the indicator numbers of each dimension, respectively. U 1 , U 2 , U 3 , U 4 , and U 5 represent the value of economic efficiency, urbanization level, urban–rural co-ordination, environmental quality, and agricultural development, respectively. T 1 is the comprehensive quality of urbanization under the four-dimensional indicator system, and T 2 is the comprehensive quality of urbanization under the five-dimensional indicator system.

4.3. Exploratory Spatial Data Analysis

Global Moran’s I was used to measure whether the factors have agglomeration characteristics in space and is defined as Formula (6) [62]:
I = n i = 1 n j = 1 n W i j ( x i x ¯ ) ( x j x ¯ ) i = 1 n j = 1 n W i j i = 1 n ( x i x ¯ ) 2 ,
where x i and x j refer to the attribute values of region i and j , respectively. x ¯ denotes the average of attribute values. n is the number of study units. W ij denotes the spatial weight matrix and is used to define the adjacency relationship between spatial units. The value of I ranges between −1 and 1. There is a positive or negative spatial autocorrelation when it is greater than 0 or less than 0. When the value is equal to 0, it means the random distribution.
Since spatial-autocorrelation changes in regions are not necessarily stable, local Moran’s I was introduced to analyze agglomeration characteristics of factors from a local level and is defined as Formula (7) [62,63]:
I i = n ( x i x ¯ ) j = 1 n W i j ( x j x ¯ ) i = 1 n ( x i x ¯ ) 2
We created maps of the local indicators of spatial association (LISA), and distinguished cluster types with different legends. High–high indicates that both the region and its neighbors have high values while low–low means the region and its neighbors have low values. High–low denotes that region with high values have low-value neighbors. Low–high is the opposite. When the indicator is not significant, it indicates there is no correlation among adjacent regions.

4.4. Coupling Co-Ordination Degree Model

We employed the coupling co-ordination degree to analyze whether urbanization quality in various regions had achieved co-ordinated development. Its calculation was based on coupling degree, which was calculated by the following:
C = 5 U i 1 * U i 2 * U i 3 * U i 4 * U i 5 5 U i 1 + U i 2 + U i 3 + U i 4 + U i 5 ,
Coupling degree reflects the correlation level among subdimensions but fails to judge whether the subdimensions are co-ordinated. Thus, to evaluate the overall co-ordination effect more objectively and reasonably, the coupling co-ordination degree model was introduced and calculated by Formula (9):
D = C * T 2 ,  
To more clearly and intuitively analyze the coupling co-ordination status of urbanization quality in various regions, we employed the Jenks function in ArcGIS 10.5 to divide the co-ordination degree to achieve the statistical effect with the largest difference between groups and the smallest difference within groups [64]. Based on the data characteristics, co-ordination mode was classified into three categories: good, basic, and low.

5. Results

5.1. Regional Differences in Comprehensive Urbanization Quality

The comprehensive urbanization quality of MGPAs presented an upward trend during 2010–2018. (The analysis of comprehensive urbanization quality was based on the results of five-dimensional evaluation indicator system. The conclusions drawn based on the results of four-dimensional indicator system were similar.) The mean value increased from 0.560 in 2010 to 0.578 in 2015 and then increased to 0.585 in 2018. Between 2010 and 2018, the urbanization quality in 96 cities improved, accounting for 75% of the cities in MGPAs.
Urbanization quality showed obvious regional differences. In terms of provinces, except for Hebei and Henan, the other provinces’ urbanization quality improved from 2010 to 2018. Jiangsu’s urbanization quality continued to rank first over the study period; its mean value reached 0.703 in 2018, which was 0.12 higher than the average for MGPAs. However, the urbanization quality of Anhui, Hebei, and Henan continued to be lower than the average (Table 4). In terms of prefecture-level cities, urbanization quality in cities of different scales improved over time. Megacities and large cities had higher urbanization quality scores than small- and medium-sized cities. In 2018, the mean value of megacities and large cities was 0.662 and 0.598, respectively. Meanwhile, the mean value of small and medium-sized cities was 0.577.
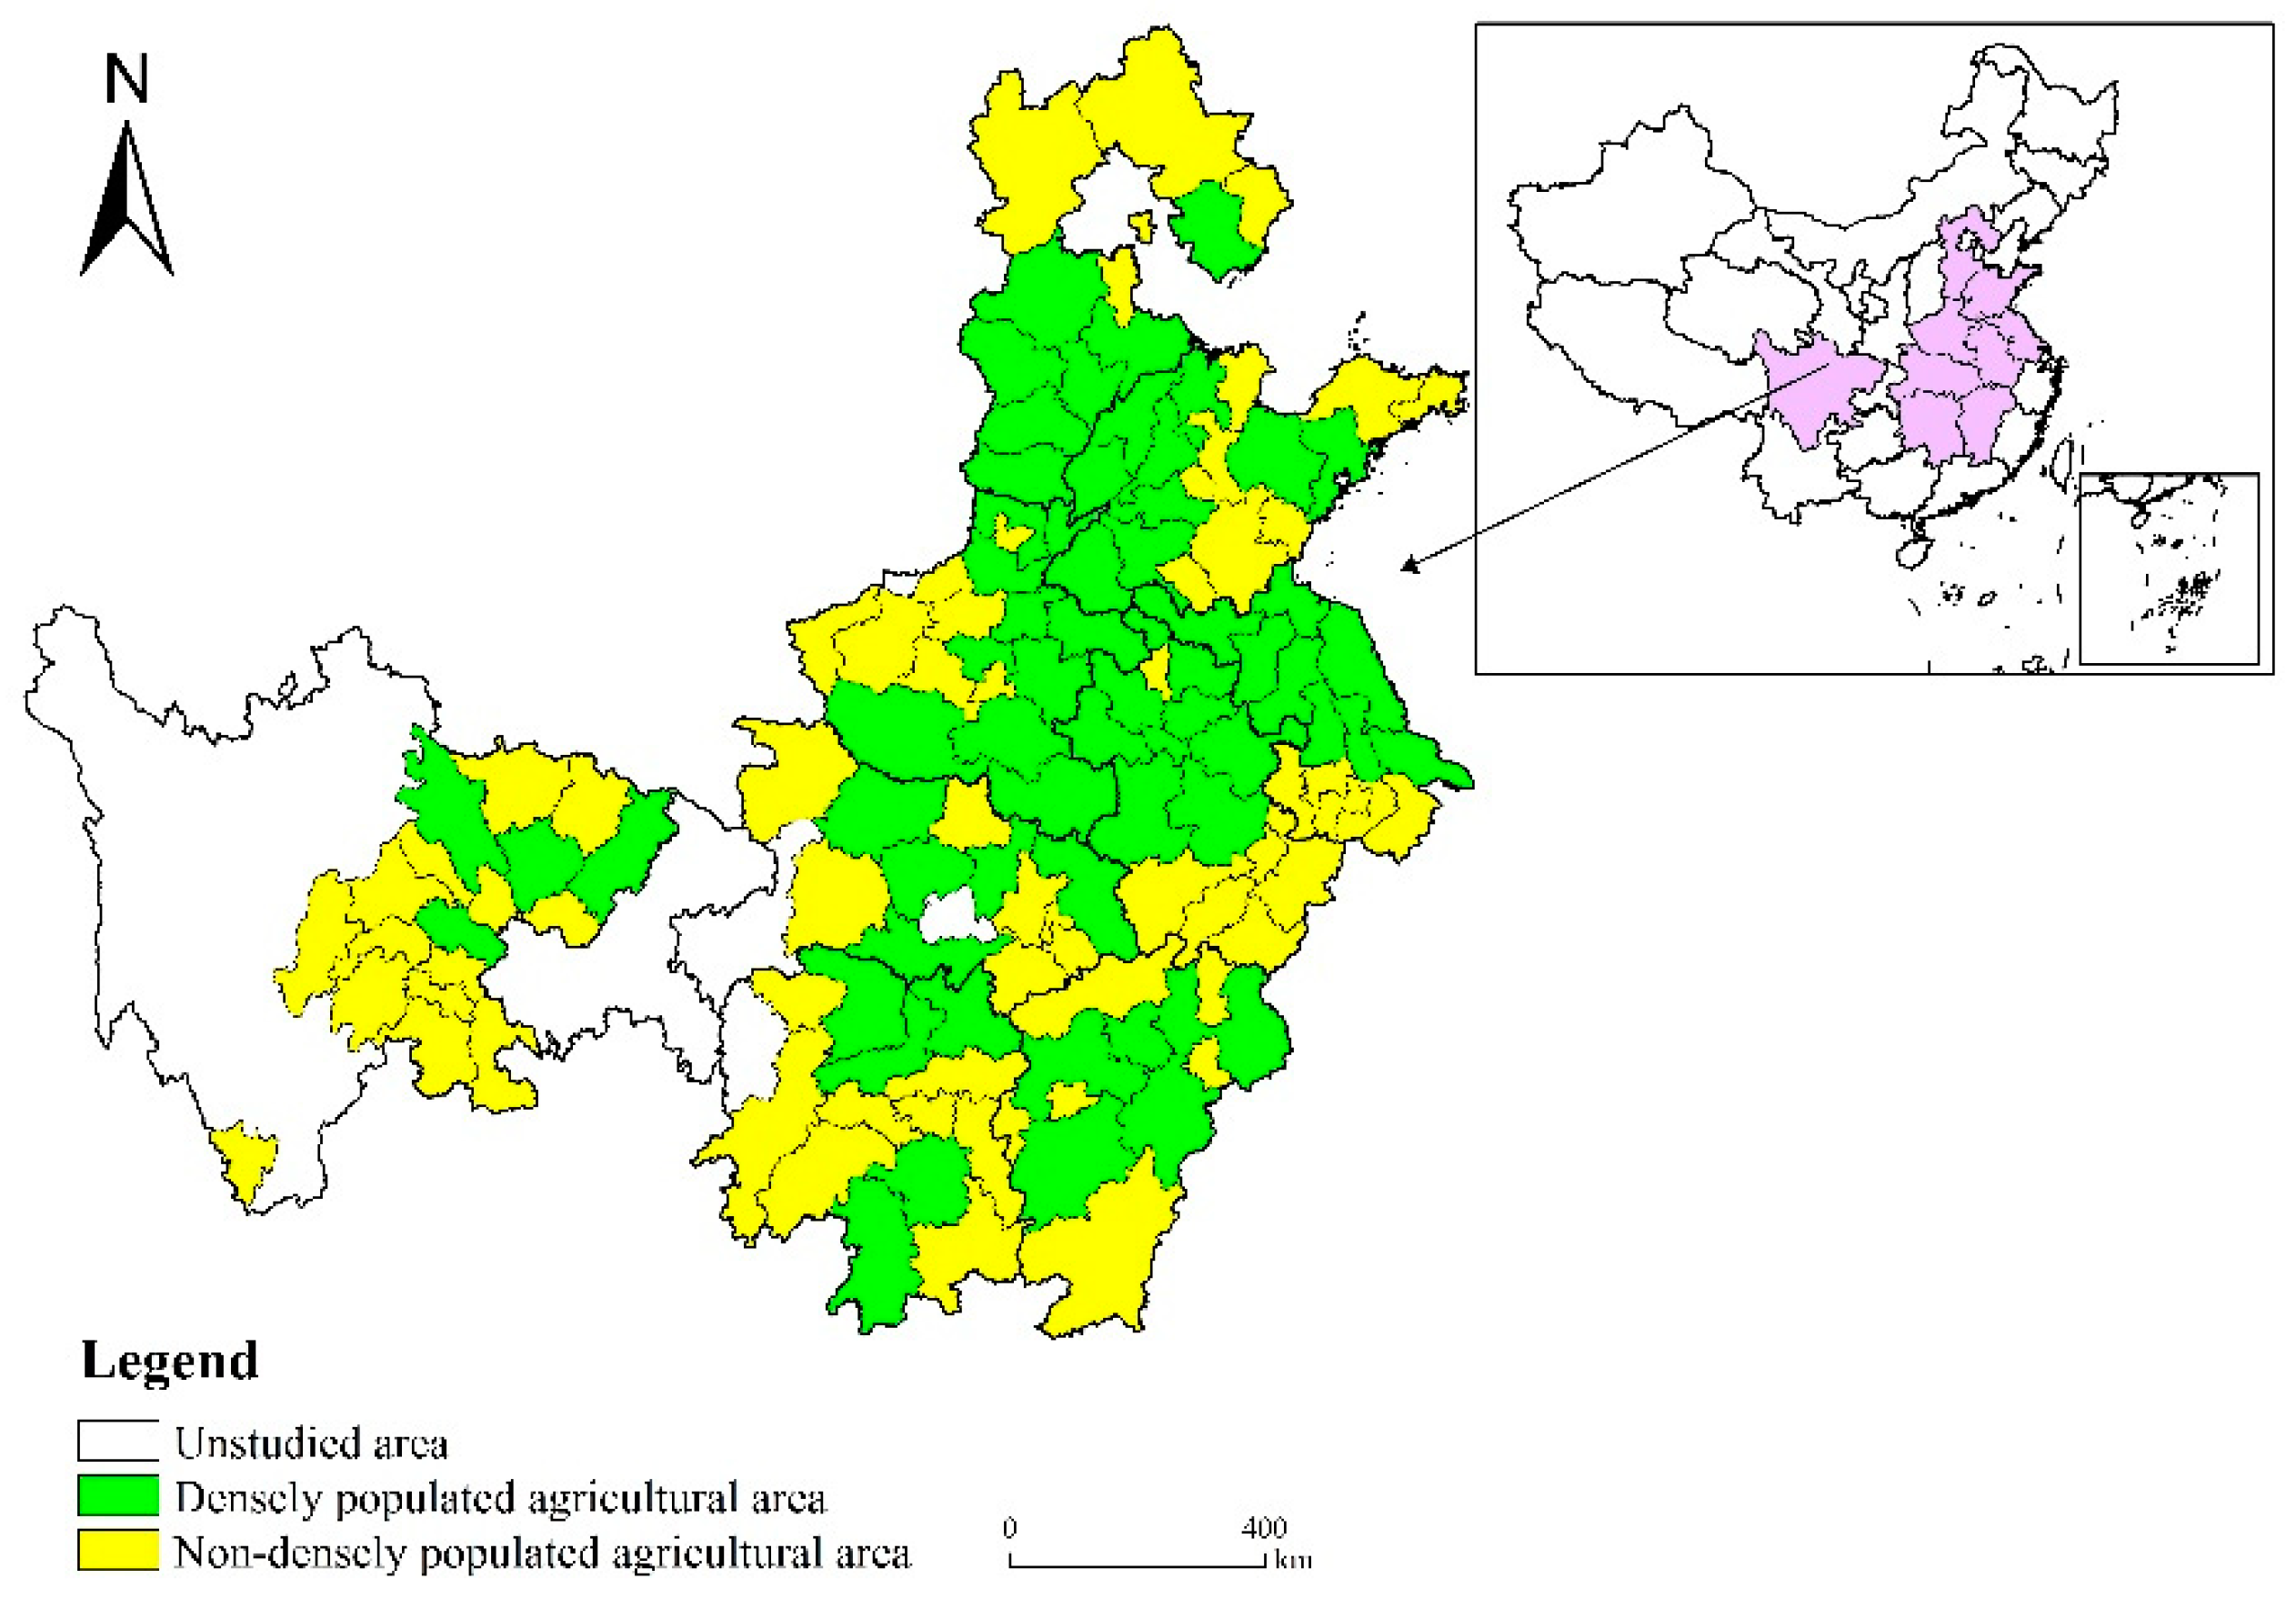
Moreover, urbanization quality in nondensely populated agricultural areas and densely populated agricultural areas continued to improve over time. Urbanization quality in nondensely populated agricultural areas was continuously higher than in densely populated agricultural areas (Table 4). In 2018, among cities with an urbanization quality higher than the average of MGPAs, 61% of the cities belonged to nondensely populated agricultural areas. Meanwhile, the top five cities for urbanization quality in MGPAs were Wuxi, Suzhou, and Ezhou (nondensely populated agricultural areas) and Yancheng and Yangzhou (densely populated agricultural areas).

5.2. Temporal and Spatial Characteristics of Subdimensional Quality

The mean values for economic efficiency, urbanization level, and environmental quality increased continuously over time. However, the mean value for agricultural development increased during 2010–2015 and then decreased during 2015–2018. Additionally, the mean value of urban–rural co-ordination continued to decline (Table 5). Specifically, from 2010 to 2018, economic efficiency rose from 0.765 to 0.785, and urbanization level steadily improved, with the mean value rising from 0.416 to 0.506. Average environmental quality increased from 0.555 to 0.585, indicating that MGPAs had recognized the importance of environmental protection and promoted the improvement of environmental quality. The mean value for agricultural development increased from 0.286 in 2010 to 0.306 in 2015 and then dropped to 0.287 in 2018. This indicates that agricultural development has declined in recent years, and attention should therefore be paid to the food security problem. However, the mean value for urban–rural co-ordination decreased from 0.652 to 0.628, indicating that income and consumption gaps of urban–rural residents have been widening.
Moreover, there were differences in the progress toward improving subdimensional qualities between nondensely and densely populated agricultural areas. The values for economic efficiency, urbanization level, and environmental quality in nondensely populated agricultural areas were all continuously higher than the densely populated agricultural areas. The mean value for urban–rural co-ordination in nondensely populated agricultural areas dropped sharply; it was slightly lower than that in densely populated agricultural areas in 2018. Densely populated agricultural areas had relatively high levels of agricultural development, with mean values 0.07 and 0.13 points higher than MGPAs and nondensely populated agricultural areas, respectively, in 2018.
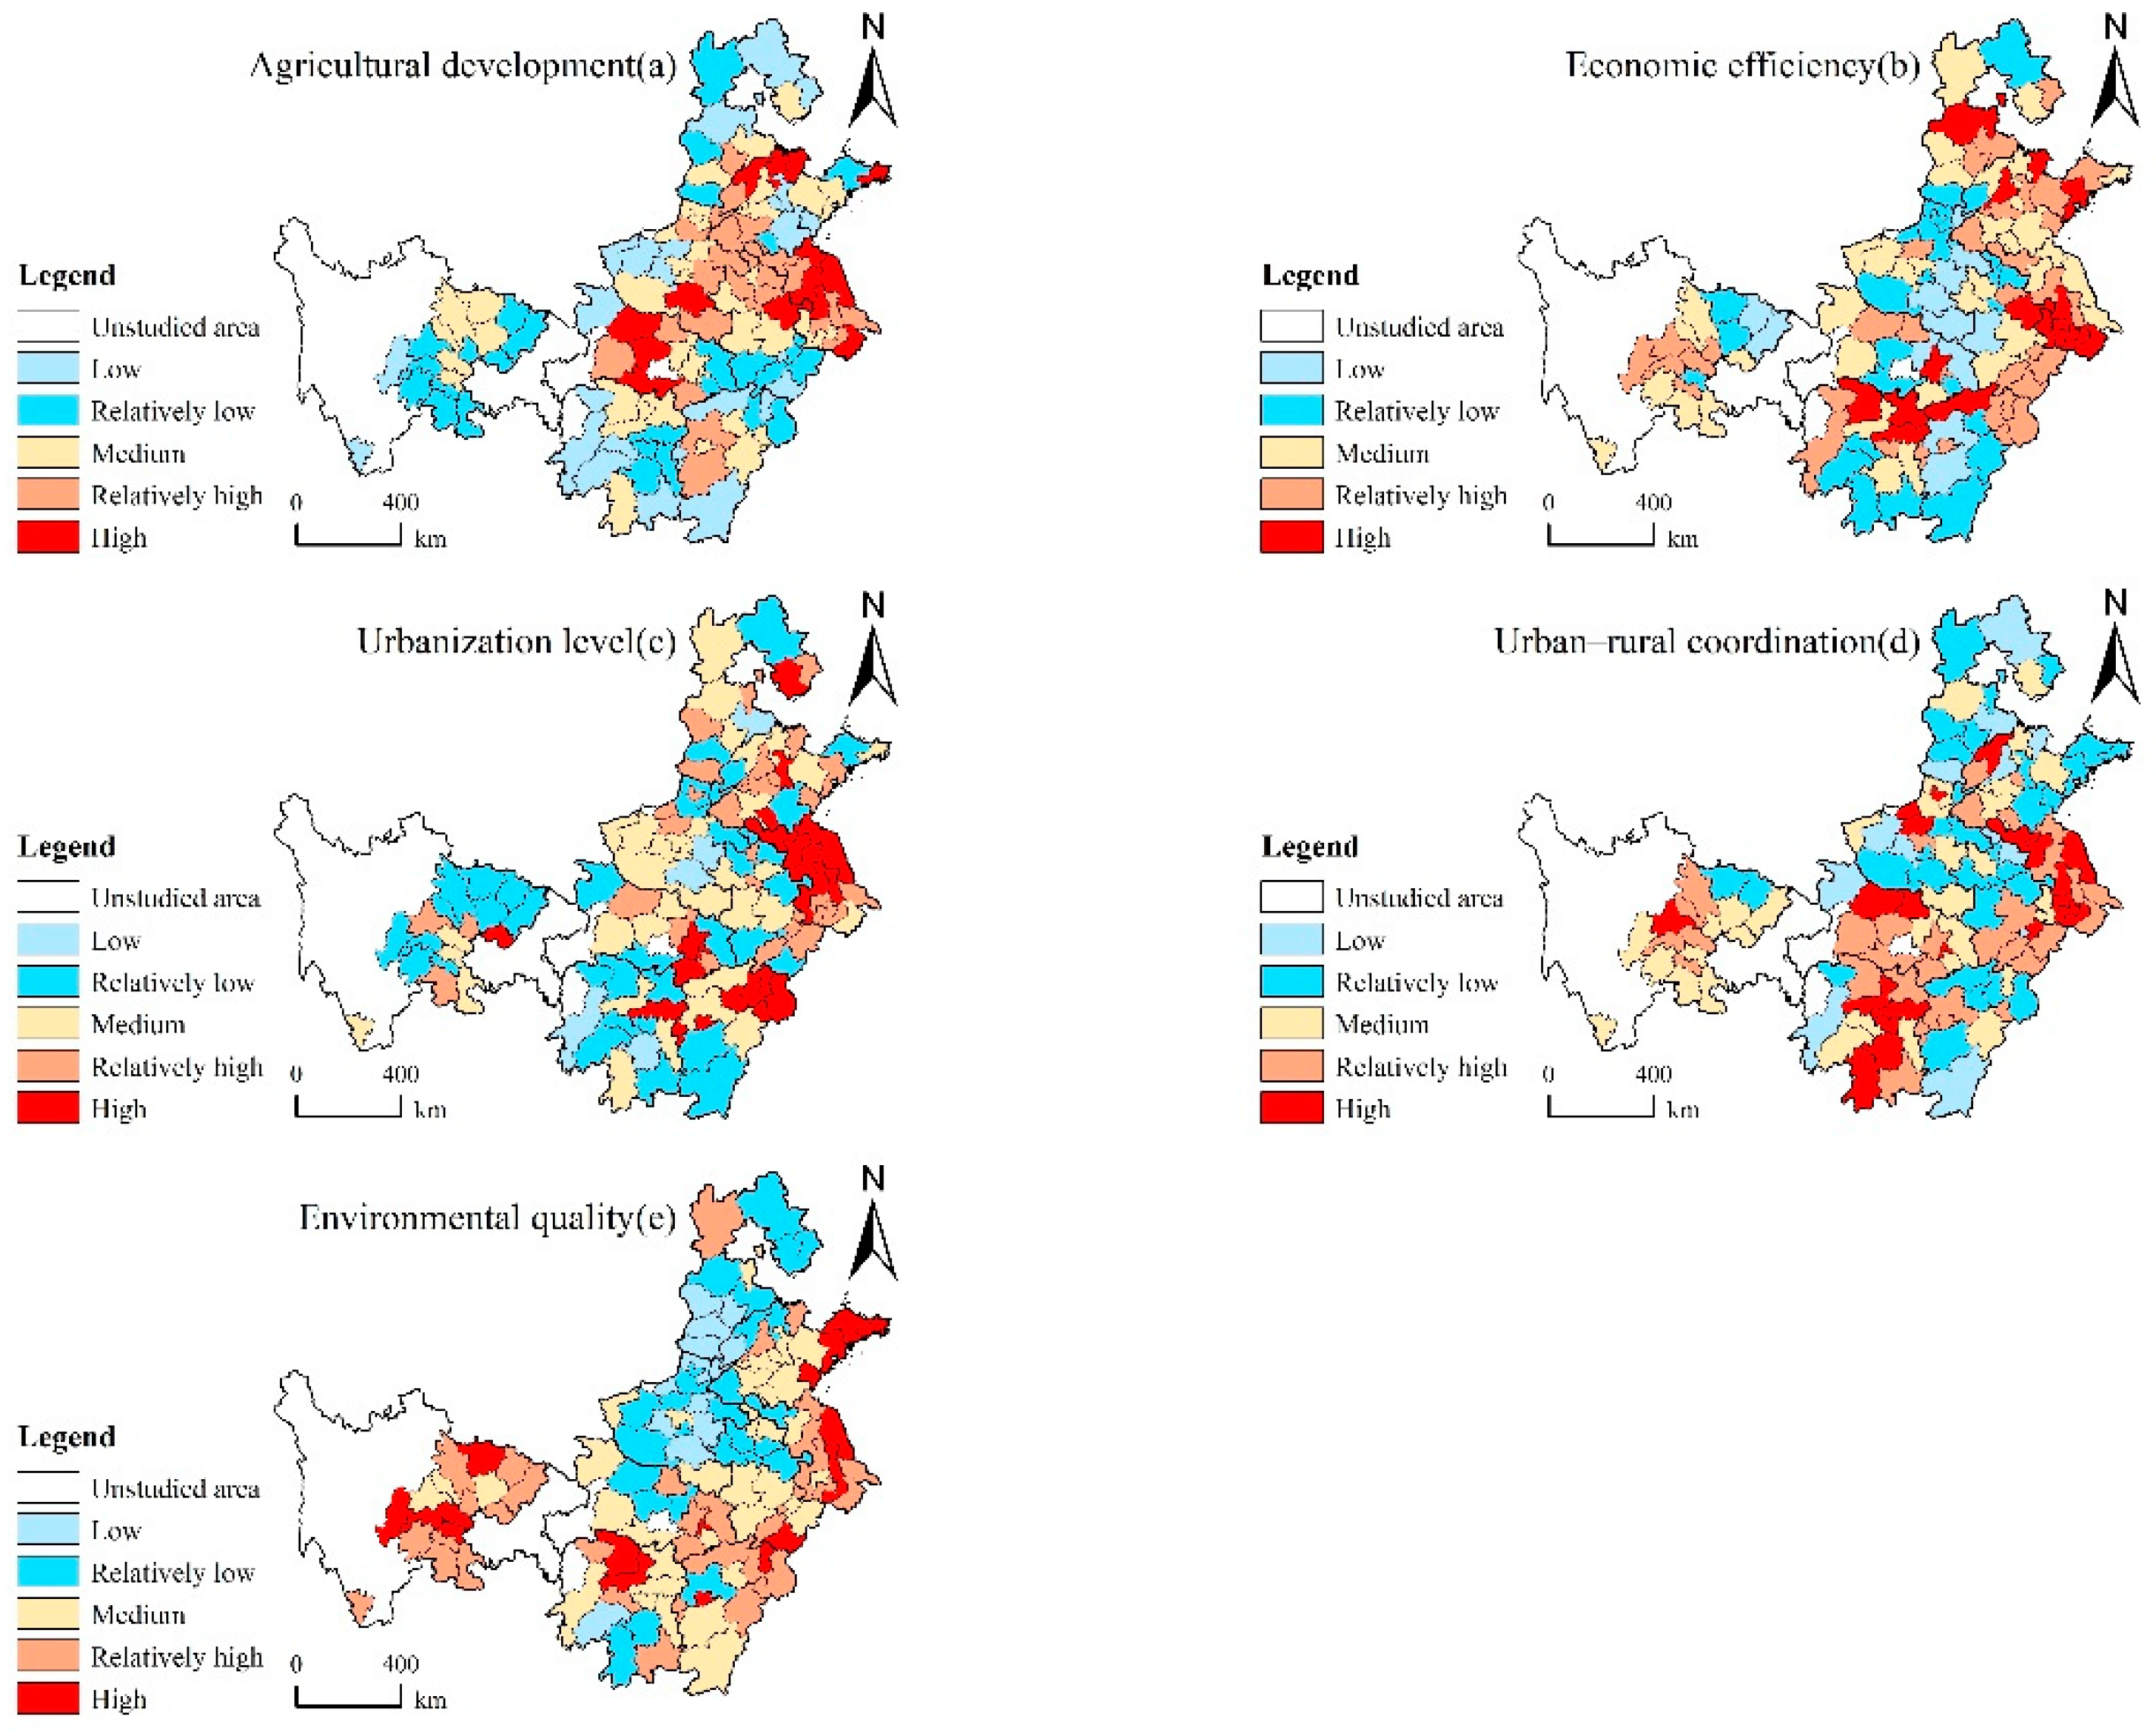
To further analyze spatial heterogeneity, this study used the Jenks function in ArcGIS10.5 to divide MGPAs in 2018 into five levels (
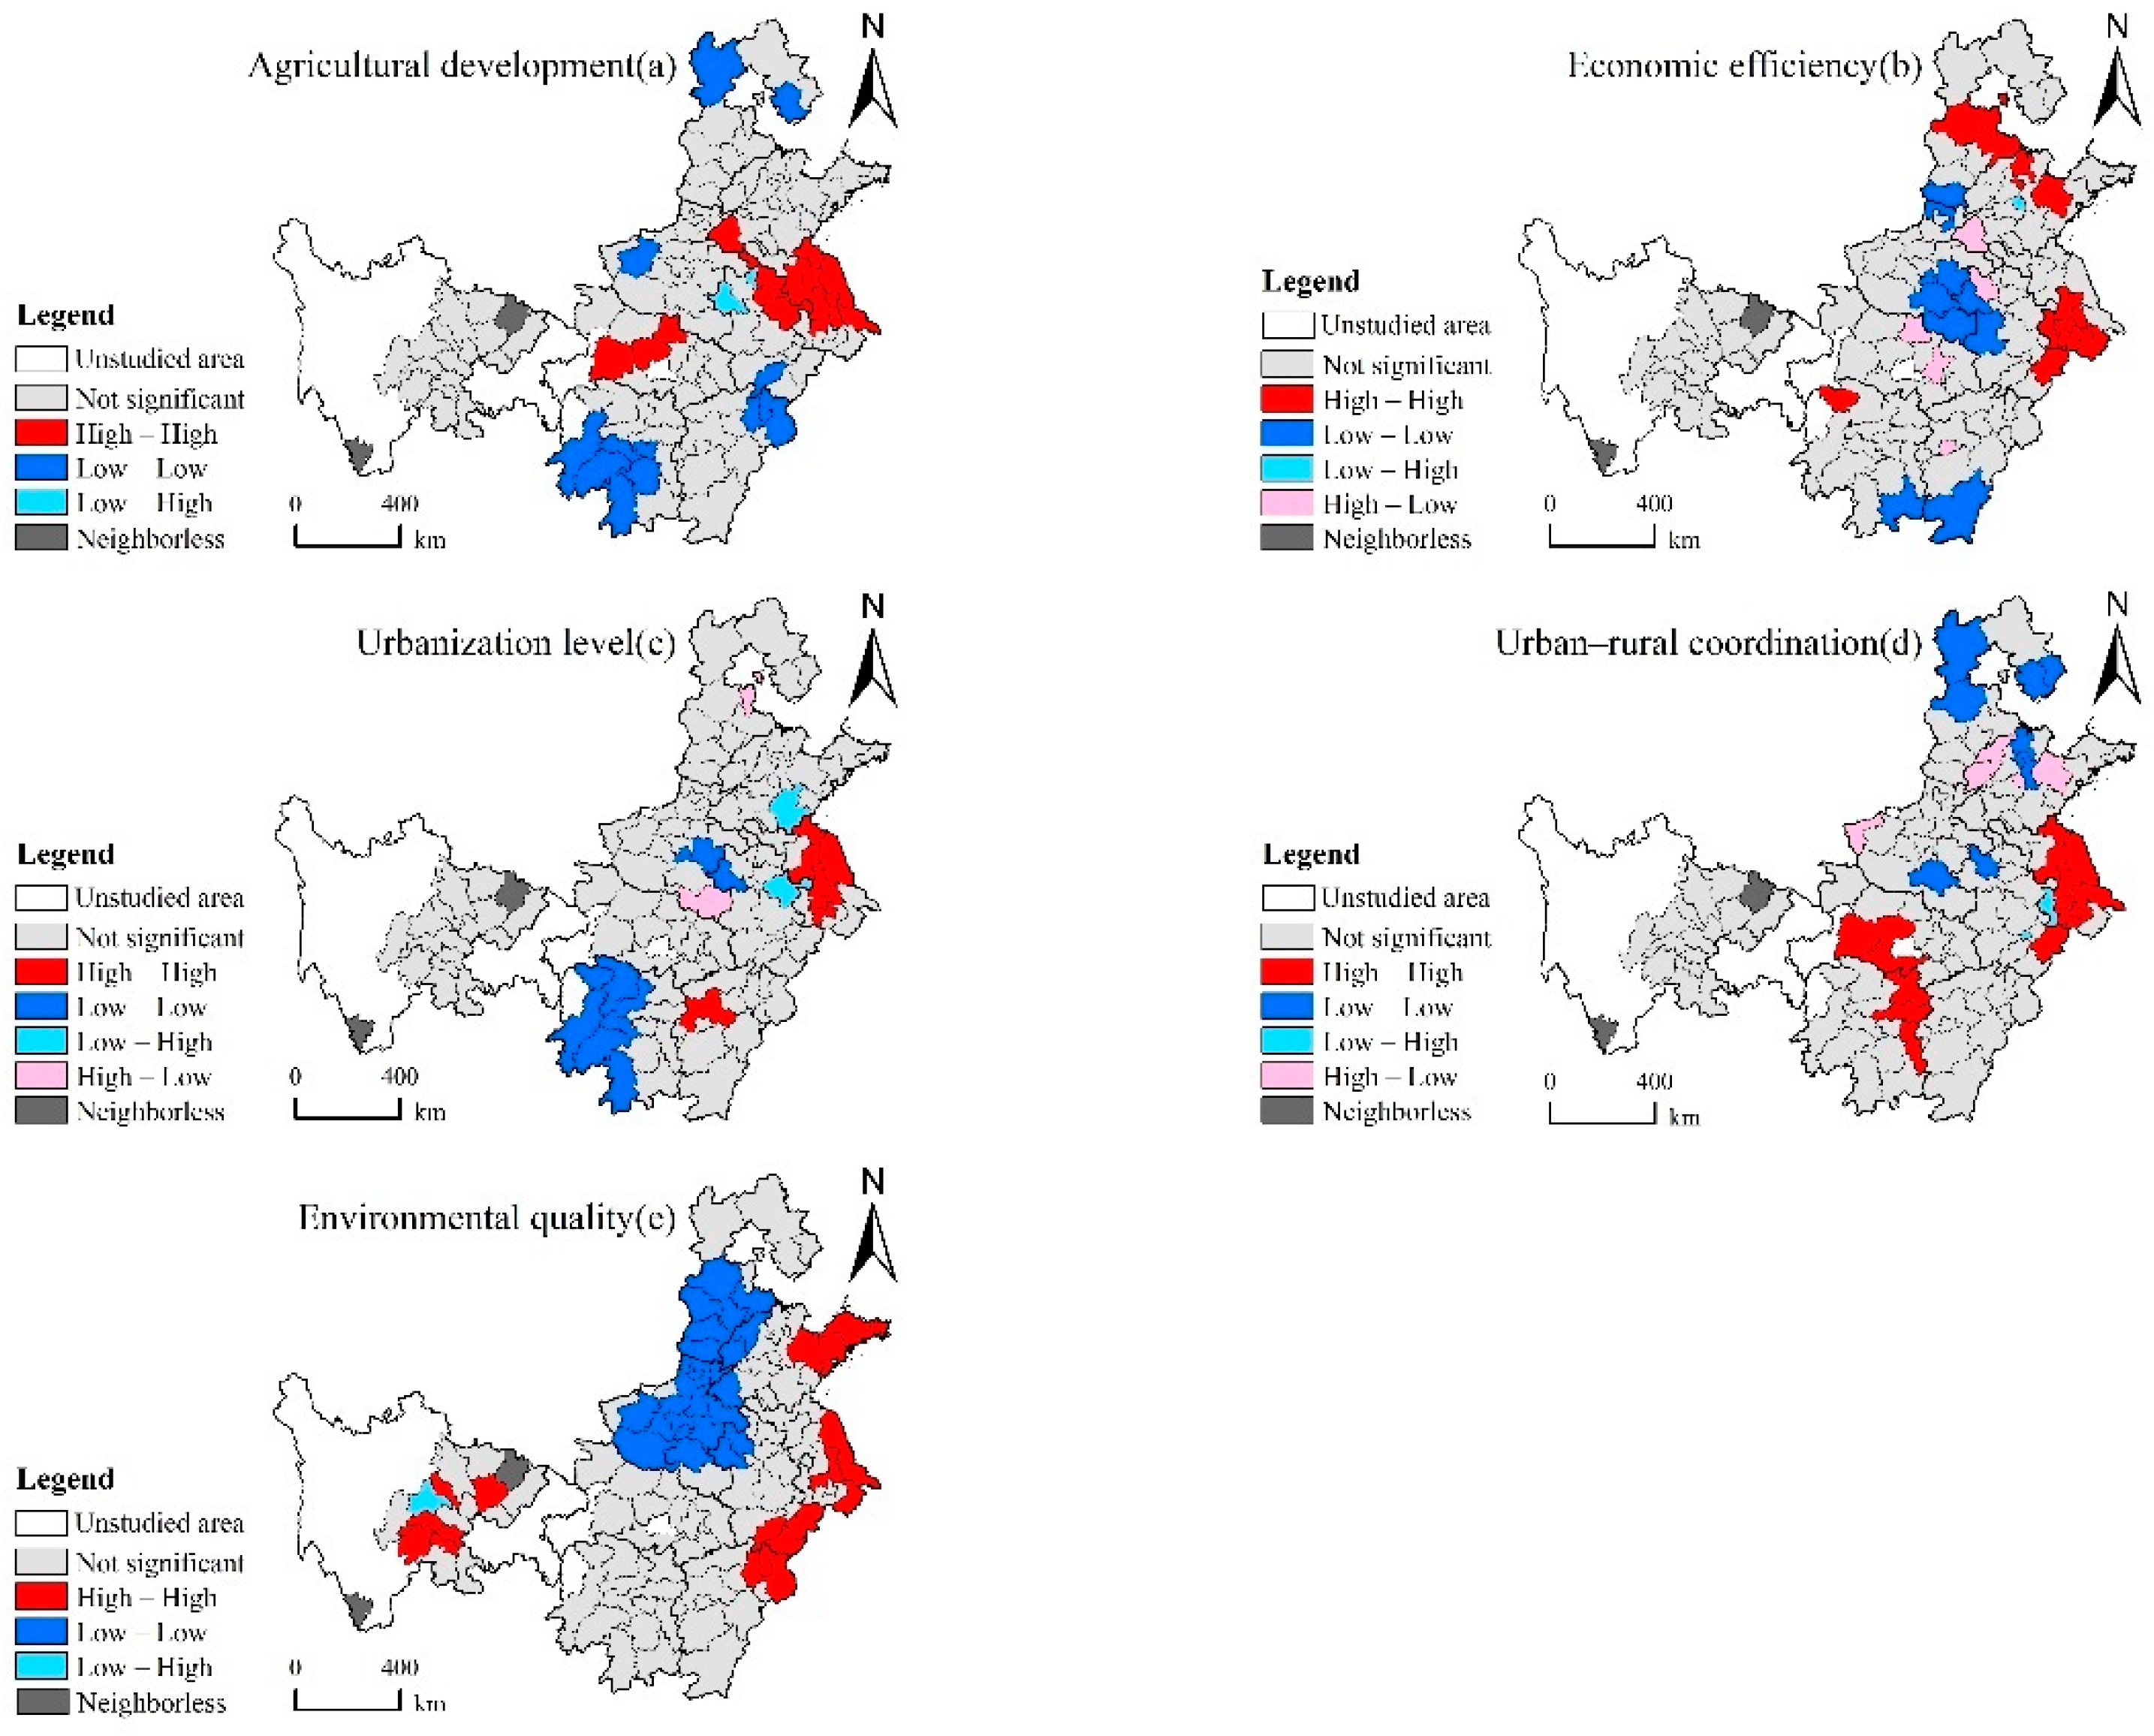
Figure 3). Then, we employed GeoDa 1.10 to explore spatial agglomeration characteristics of urbanization quality (Table 6 and Figure 4).
It can be inferred from Table 6 that the subdimensions had positive global spatial autocorrelations and presented agglomeration distributions in space. The Moran’s I of environmental quality was higher than that of the other dimensions, indicating that environmental quality had the strongest spatial autocorrelation. Meanwhile, urbanization level had the weakest spatial autocorrelation.
For agricultural development, high-value areas presented a centralized distribution in southeastern Henan, northern Anhui, central Hubei, and northern Jiangsu. Low-value areas were centralized in mountainous and hilly regions, such as southwestern Hunan, southern Anhui, northern Hebei, and southern Sichuan. In terms of local spatial autocorrelation, the high–high type was mainly located in Jiangsu, northeastern Anhui, and central Hubei. In addition to Zhangjiakou, Tangshan, Luoyang, Jingdezhen, Shangrao, and Chizhou, cities in southwestern Hunan were of the low–low type. Fuyang and Huaibei were of the low–high type.
For economic efficiency, high-value areas were mainly distributed in Jiangsu, Shandong, southern Anhui, and northern Hunan. Qingdao, Dongying, Wuxi, Changzhou, and Suzhou ranked in the top five. Jiangxi and southeastern Henan, with most of low-value areas located in, should further optimize resource utilization. Economic efficiency showed an obvious spatial agglomeration. The high–high type was concentrated in southern Jiangsu. Baoding, Cangzhou, Weifang, and Binzhou belonged to the high–high type as well. The low–low type mainly gathered in southeastern Henan while the high–low type was scattered. Laiwu was of the low–high type.
For urbanization level, high-value areas were concentrated in Jiangsu, provincial capital cities, and the surrounding areas. Low-value areas mainly gathered in Sichuan and Hunan, and the mean value for Sichuan and Hunan was lower than the average for MGPAs. Urbanization level also had spatial autocorrelation characteristics. The high–high type was centralized in Jiangsu. In addition to Fuyang, Zhoukou, and Luohe, cities in western Hunan were of the low–low type. Xinyang and Langfang were of the high–low type while Linyi and Chuzhou were of the low–high type.
For urban–rural co-ordination, high-value areas mainly gathered in Jiangsu, Hunan, and central Hubei. The mean value for Anhui, Henan, Shandong, Jiangxi, and Hebei was lower than the average for MGPAs. Urban–rural co-ordination showed a trend of spatial agglomeration. The high–high type showed a concentrated distribution in Jiangsu, eastern Hunan, and central Hubei. Zhangjiakou, Qinhuangdao, Tangshan, Baoding, Zhumadian, Binzhou, Zibo, and Bozhou were of the low–low type. Liaocheng, Dezhou, Laiwu, Weifang, and Sanmenxia were of the high–low type. Tongling and Nanjing belonged to the low–high type.
For environmental quality, the high-value and low-value areas showed obvious north–south differentiation. The mean value for the southern cities in MGPAs reached 0.641 while the mean value for northern cities was only 0.481. Low-value cities were concentrated in Henan and Hebei, with Shijiazhuang, Xingtai, Handan, Jiaozuo, and Pingdingshan being the lowest. Therefore, those cities should modify their development modes and attach more importance to environmental protection. As for local spatial autocorrelation, the low–low type was concentrated in Henan and Hebei while the high–high type was concentrated in Sichuan, eastern Shandong, southeastern Jiangsu, southern Anhui, and northeastern Jiangxi. Chengdu, meanwhile, was of the low–high type.

5.3. Urbanization Quality Differences under Two Evaluation Indicator Systems

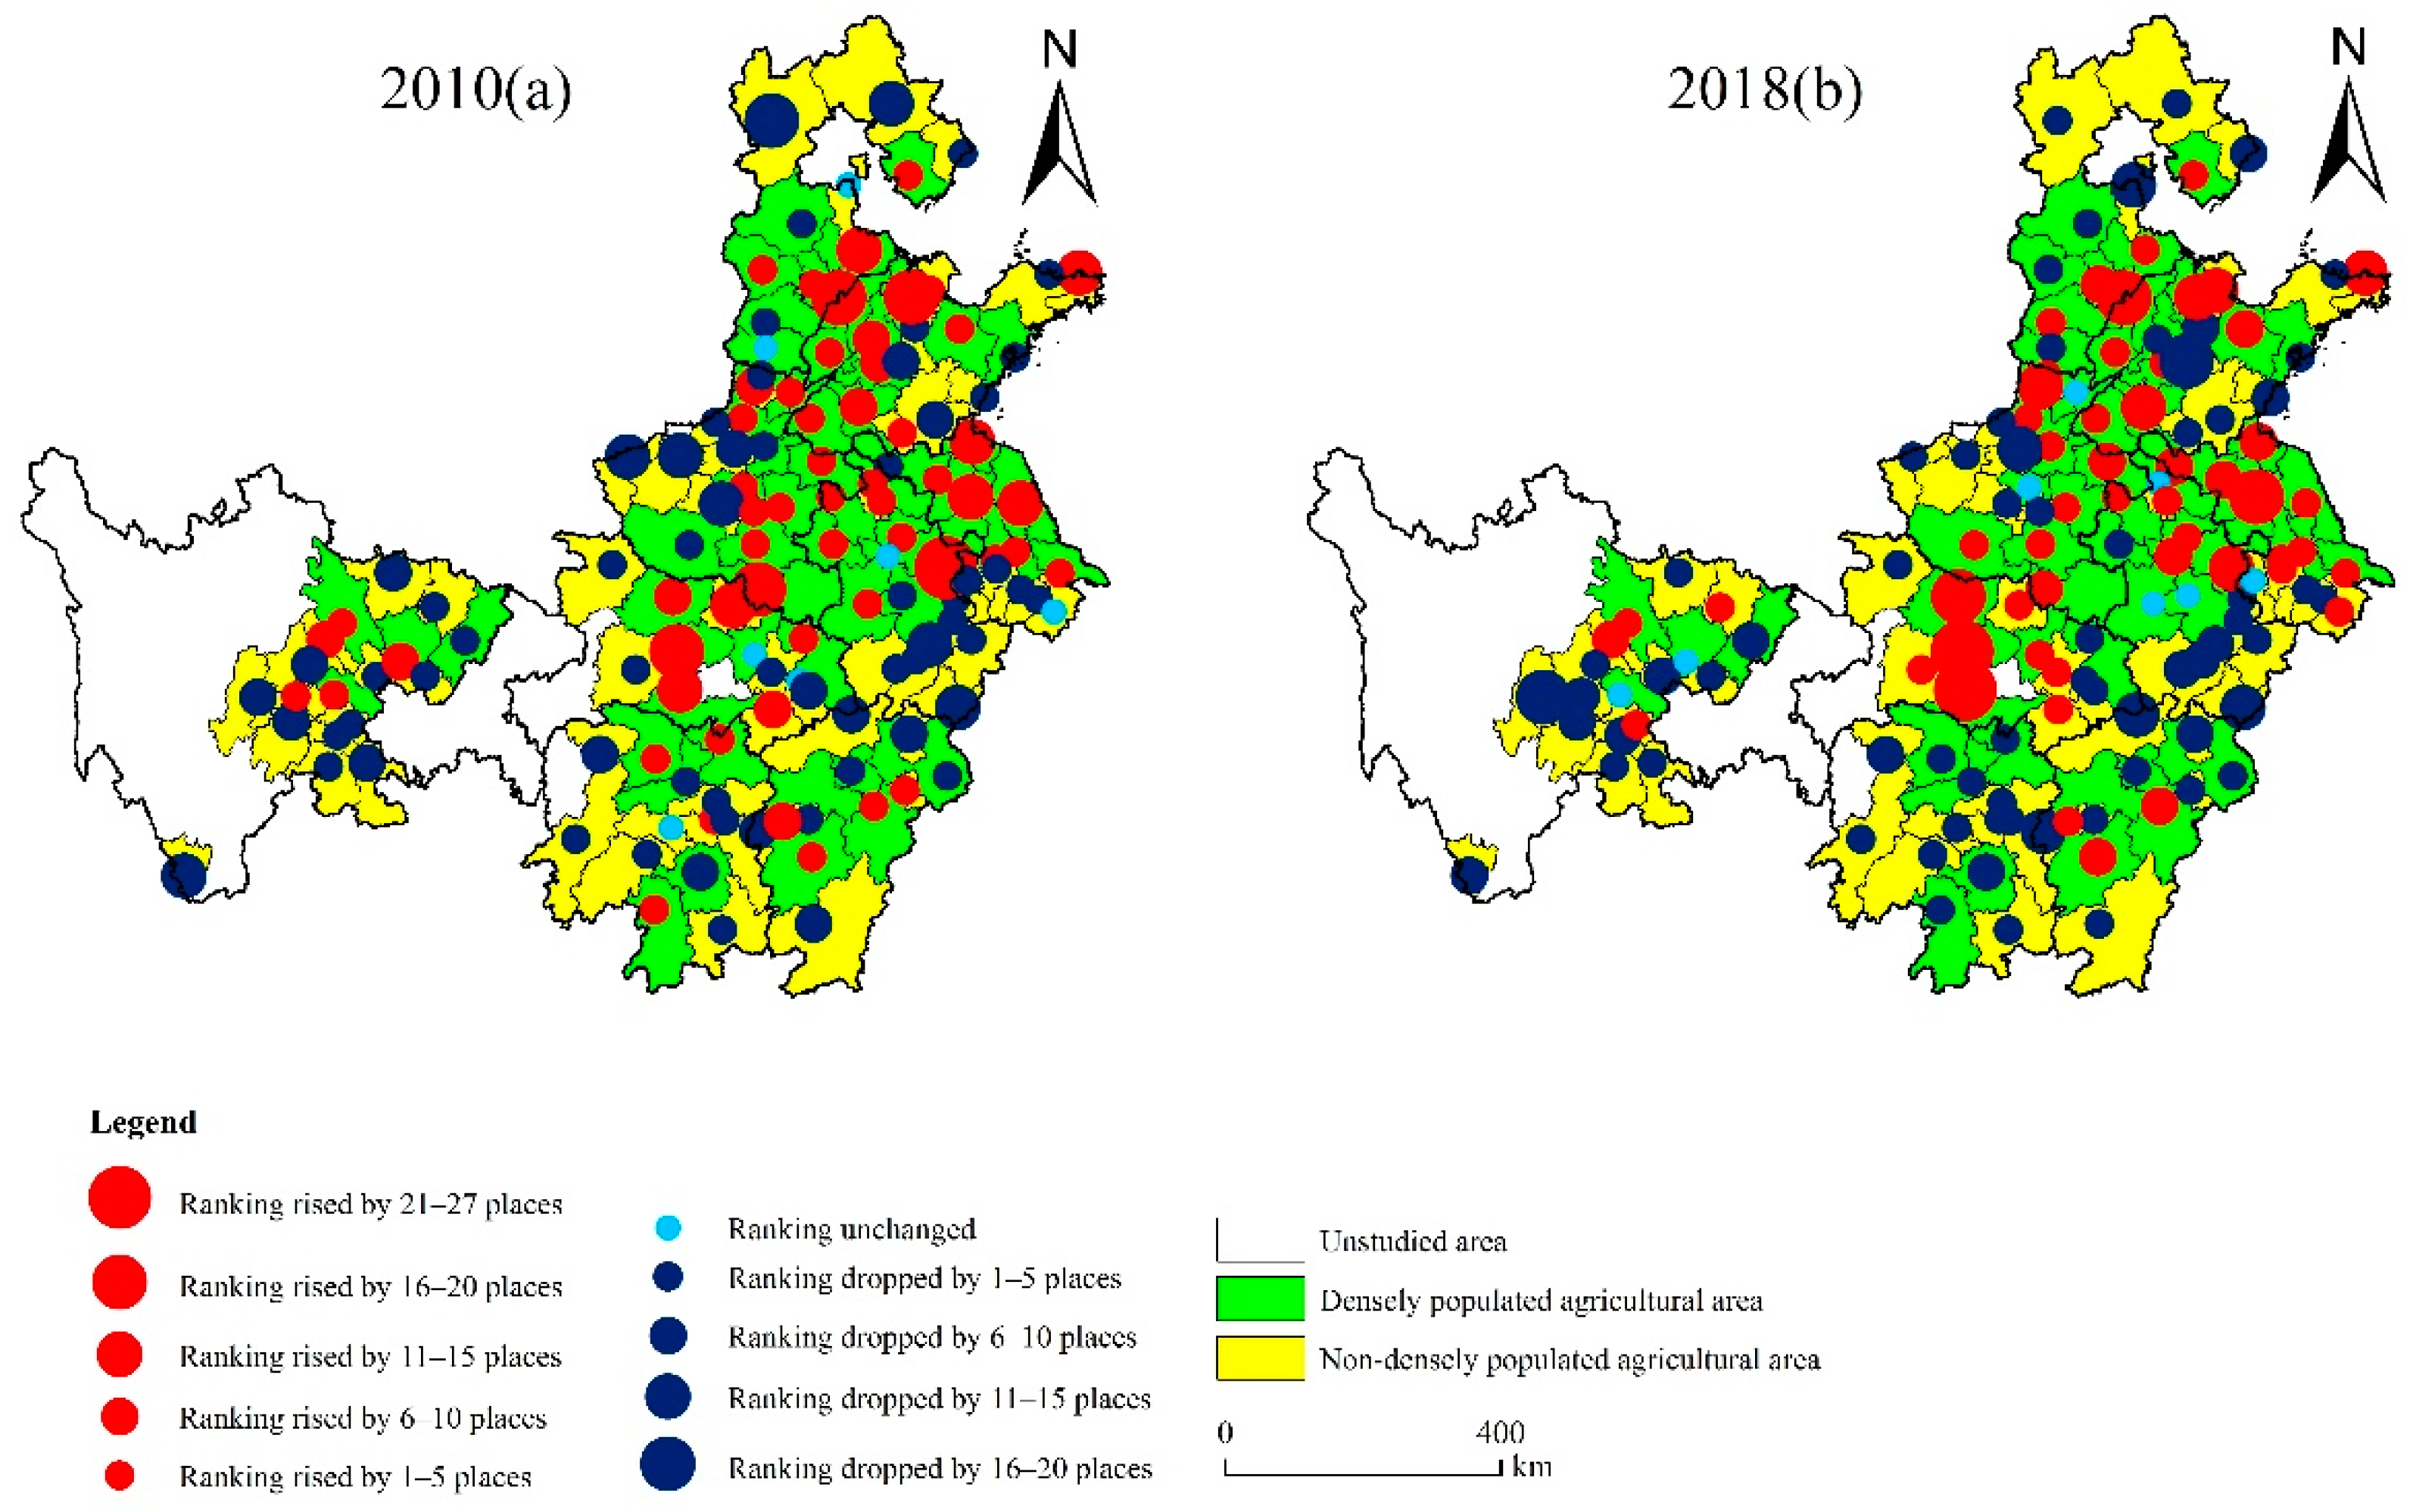
After agricultural development was added to the evaluation indicator system, the urbanization quality rankings of cities changed greatly (Figure 5). Cities with rising rankings presented a concentrated distribution in densely populated agricultural areas. Cities with falling rankings mainly gathered in nondensely populated agricultural areas. In 2010 and 2018, 57 and 52 cities improved their urbanization quality rankings, among which 79% and 77% were located in densely populated agricultural areas, respectively. Meanwhile, 64 and 68 cities fell in their urbanization quality rankings, of which 79% and 78% were located in nondensely populated agricultural areas, respectively. Only seven cities in 2010 and eight cities in 2018 remained unchanged in the rankings.
Specifically, among densely populated agricultural areas, the urbanization quality rankings of Jingmen, Jingzhou, Dezhou, Huai’an, Binzhou, and Chuzhou rose significantly in 2018 by 27, 23, 20, 16, 14, and 13 places, respectively. These cities had relatively high levels of agricultural development, and the rankings significantly rose when agricultural development was included in the evaluation system. The number of cities that dropped in the rankings was relatively small, and they only dropped slightly without obvious overall fluctuations. In nondensely populated agricultural areas, the rankings of Ya’an, Laiwu, Zhengzhou, Jiujiang, and Huangshan dropped significantly in 2018 by 17, 16, 15, 13, and 12 places, respectively.

5.4. Co-Ordinated Development Modes of Urbanization Quality

From 2010 to 2018, 88 cities remained unchanged in the co-ordination modes (Table 7). For the good co-ordination mode, there were 12 cities in densely populated agricultural areas and 14 cities in nondensely populated agricultural areas. The subdimensions of urbanization quality in these cities achieved good development and produced good co-ordination effects. Therefore, the good co-ordinated development trend should be stabilized and maintained in these cities to promote the sustainable development of urbanization. For the basic co-ordination mode, there were 19 cities in densely populated agricultural areas and 24 cities in nondensely populated agricultural areas. Initial achievements were made in the subdimensional development of urbanization quality in those cities, and an overall co-ordination effect has gradually appeared. Thus, it is necessary to further improve the development levels of all dimensions to achieve higher levels of co-ordination. For the low co-ordination mode, there were 10 cities in densely populated agricultural areas and nine cities in nondensely populated agricultural areas. Achieving the co-ordinated development of urbanization quality in these cities poses a relatively arduous task.
40 cities changed their co-ordination modes (Table 8). Specifically, 22 cities changed their co-ordination modes to a lower level, among which 11 cities changed from the good co-ordination mode to the basic co-ordination mode, and the other cities changed from the basic co-ordination mode to the low co-ordination mode. The imbalanced development of subdimensions was prominent in these cities. Therefore, the development of relatively lagging dimensions should be promoted. In addition, 18 cities changed their co-ordination modes to a higher level, among which 8 cities changed from the basic co-ordination mode to the good co-ordination mode, and 10 cities changed from the low co-ordination mode to the basic co-ordination mode.

6. Discussion

Food security and urbanization have become important aspects in promoting sustainable development [65]. As the key and typical areas for achieving the SDGs, MGPAs’ urbanization should not sacrifice agricultural development and follow other urbanization paths [29,66].
The comprehensive urbanization quality continued to improve over time, indicating a good trend in improving urbanization quality and implementing the SDGs. Meanwhile, the ongoing improvements in economic efficiency, urbanization level, and environmental quality have contributed to high-quality urbanization and the realization of Goals 8, 11, 6 and 12. However, urban–rural co-ordination has declined continuously, making it difficult to achieve overall development of urban and rural areas and reduce regional inequality. Moreover, the decline in agricultural development in recent years will pose a great threat to food security and increase the vulnerability of development [67]. Thus, MGPAs could prioritize urban–rural co-ordination and agricultural development and implement effective policies to facilitate overall improvement of urbanization quality.
Further, MGPAs should fully consider the heterogeneity of regional development. For example, targeted strategies should be formulated to reduce the urbanization quality gap between densely and nondensely populated agricultural areas. The densely populated agricultural areas experienced high-level agricultural development. They should adhere to the arable land protection policies, promote the agricultural technological innovation, and further improve capabilities for food security. Meanwhile, urbanization level and economic efficiency should be improved on the premise of reasonable development scale and intensity. The nondensely populated agricultural areas have relatively weak advantages in the agricultural development and should maintain a certain agricultural foundation and production capacity to provide necessary food support for urbanization. Additionally, it is necessary to improve public service facilities, optimize industrial structure, and promote urban–rural co-ordination.
In addition, the factors leading to the low degree of co-ordinated development varied among cities. Attention should also be paid to the cities with co-ordination modes changing to a lower level. Thus, each city should focus on the lagging dimensions. For example, Shangqiu and Zhoukou, as traditional agricultural areas, maintained relatively high levels of agricultural development. However, their economic efficiency was far lower than other cities, and the urbanization rate and degree of in situ urbanization were low, hindering the co-ordinated development of urbanization quality. Therefore, further promoting industrialization and urbanization should be taken as important strategic tasks.

7. Conclusions

In line with the specific targets of the SDGs related to urbanization, this study established two sets of multidimensional evaluation indicator systems, and analyzed the temporal and spatial dynamics of urbanization quality in China’s MGPAs during 2010–2018. Then, we compared cities’ rankings before and after adding agricultural development to the evaluation indicator system in order to further examine urbanization quality on the premise of not sacrificing agriculture. Finally, we studied the co-ordinated development modes of urbanization quality. The main conclusions were as follows:
(a)
Comprehensive urbanization quality increased over time and showed obvious regional differences. Urbanization quality in Jiangsu was continuously higher than in other provinces. Megacities and large cities had higher urbanization quality than small- and medium-sized cities. Nondensely populated agricultural areas had higher urbanization quality than densely populated agricultural areas.
(b)
Regarding subdimensions, economic efficiency, urbanization level, and environmental quality improved during 2010–2018. However, urban–rural co-ordination and agricultural development, with the mean values decreasing in recent years, have become the weak links in achieving high-quality urbanization and the SDGs. Furthermore, subdimensions presented agglomeration distributions in space.
(c)
When agricultural development was included in the evaluation indicator system, the urbanization quality rankings of cities varied greatly. Cities with an elevated ranking were mainly concentrated in densely populated agricultural areas while those with a decline in ranking were mainly concentrated in nondensely populated agricultural areas. Among 128 prefecture-level cities from 2010 to 2018, twenty-six cities remained in the good co-ordination mode; forty-three cities remained in the basic co-ordination mode; and nineteen cities remained in the low co-ordination mode. Eighteen cities’ co-ordination modes turned to a higher level, while twenty-two cities’ co-ordination modes turned to a lower level.
(d)
MGPAs should be guided by SDGs to undertake the important task of ensuring national food security and promoting new urbanization [68]. MGPAs need to improve land utilization, especially in nondensely populated agricultural areas, and focus on the problem of occupying cultivated land in densely populated agricultural areas. Moreover, MGPAs should promote cleaner food production. The degradation of cultivated land resources in MGPAs is partly due to the excessive use of chemical fertilizers, pesticides, and herbicides, which not only seriously damages the ecological environment and affects the quality of grains, but also increases production costs. Last but not least, compensation and subsidy policies for MGPAs’ grain production should be enlarged.
This study helps to enrich the evaluation indicator system, understand the urbanization quality with regards to MGPAs in detail, and provide a basis for formulating differentiated policies in different regions. It can also offer a reference for both improving urbanization quality and achieving the SDGs in developing countries. Improving the evaluation indicator system and exploring the mechanism of differences in urbanization quality warrant attention in further research.
However, this study has some limitations. First, because of the availability of data, the study period only includes 2010–2018. Second, this study only considers the degree of coupling and co-ordination between agriculture, food security, and urbanization, but they have a complex coupling, decoupling, and recoupling relationship, just like other SDGs researches, and they have an urgent need for further study [33]. Therefore, future research will further consider extending the research period to further explore the complex relationships. More importantly, because the COVID-19 pandemic has made the world deeply aware of the importance of food security, future research will incorporate new factors into the analytical framework.

Author Contributions

Conceptualization, F.G., C.M. and W.S.; methodology, F.G., C.M. and W.S.; software, F.G., J.Z. and L.Y.; validation, F.G., C.M. and W.S.; formal analysis, C.M. and W.S.; resources, J.Z. and L.Y.; data curation, J.Z. and L.Y.; writing—original draft preparation, F.G., C.M. and W.S.; writing—review and editing, J.Z. and L.Y.; visualization, F.G.; supervision, C.M. and W.S.; project administration, C.M. and W.S.; funding acquisition, C.M. and W.S. All authors have read and agreed to the published version of the manuscript.

Funding

This work was supported by the National Natural Science Foundation of China (Fund project host: Miao Changhong), grant number 41430637; The National Natural Science Foundation of China (Fund project host: Miao Changhong), grant number 42171186.

Institutional Review Board Statement

Not applicable.

Informed Consent Statement

Informed consent was obtained from all subjects involved in the study.

Data Availability Statement

The data used in this paper mainly come from the Hebei, Henan, Shandong, Anhui, Jiangsu, Hunan, Hubei, Jiangxi, and Sichuan Statistical Yearbooks. The PM2.5 dataset comes from the China Atmospheric Pollutant Dataset. Most of the data can be obtained by visiting the following links: https://data.cnki.net/Yeabook/Navi?type=type&code=A, http://www.gedata.cn/data/idex.html?word (accessed on 1 April 2022).

Acknowledgments

Informed consent was obtained from all subjects involved in the study.

Conflicts of Interest

The authors declare no conflict of interest.

References

  1. Bren D’Amour, C.; Reitsma, F.; Baiocchi, G.; Barthel, S.; Güneralp, B.; Erb, K.-H.; Haberl, H.; Creutzig, F.; Seto, K.C. Future urban land expansion and implications for global croplands. Proc. Natl. Acad. Sci. USA 2017, 114, 8939–8944. [Google Scholar] [CrossRef] [Green Version]
  2. Shen, L.; Zhou, J. Examining the effectiveness of indicators for guiding sustainable urbanization in China. Habitat Int. 2014, 44, 111–120. [Google Scholar] [CrossRef]
  3. Katz, C. SPLANETARY URBANIZATION. Int. J. Urban Reg. Res. 2021, 45, 597–611. [Google Scholar] [CrossRef]
  4. Ruddick, S.; Peake, L.; Tanyildiz, G.S.; Patrick, D. Planetary urbanization: An urban theory for our time? Environ. Plan. D Soc. Space 2017, 36, 387–404. [Google Scholar] [CrossRef]
  5. Grimm, N.B.; Faeth, S.H.; Golubiewski, N.E.; Redman, C.L.; Wu, J.; Bai, X.; Briggs, J.M. Global Change and the Ecology of Cities. Science 2008, 319, 756–760. [Google Scholar] [CrossRef] [Green Version]
  6. Thebo, A.L.; Drechsel, P.; Lambin, E.F. Global assessment of urban and peri-urban agriculture: Irrigated and rainfed croplands. Environ. Res. Lett. 2014, 9, 114002. [Google Scholar] [CrossRef]
  7. Song, W.; Pijanowski, B.C.; Tayyebi, A. Urban expansion and its consumption of high-quality farmland in Beijing, China. Ecol. Indic. 2015, 54, 60–70. [Google Scholar] [CrossRef]
  8. Long, H.; Li, Y.; Liu, Y.; Woods, M.; Zou, J. Accelerated restructuring in rural China fueled by ‘increasing vs. decreasing balance’ land-use policy for dealing with hollowed villages. Land Use Policy 2012, 29, 11–22. [Google Scholar] [CrossRef]
  9. Available online: https://tv.cctv.com/2022/05/05/VIDE3PDfSvLNqlQTu14g3mPB220505.shtml (accessed on 8 May 2022).
  10. Xu, Z.; Chau, S.N.; Chen, X.; Zhang, J.; Li, Y.; Dietz, T.; Wang, J.; Winkler, J.A.; Fan, F.; Huang, B.; et al. Assessing progress towards sustainable development over space and time. Nature 2020, 577, 74–78. [Google Scholar] [CrossRef] [PubMed]
  11. Chaolin, G. China’s Urbanization; Science Press: Beijing, China, 2021. [Google Scholar]
  12. Available online: https://m.gmw.cn/baijia/2022-02/01/1302786981.html (accessed on 5 May 2022).
  13. Shi, R. Study on New Urbanization Road of Main Grain-producing Area: A Case Study of Henan Province. Areal Res. Dev. 2012, 31, 29–32. [Google Scholar]
  14. Wang, B. Empirical study on the relationship between China’s industrialization, urbanization and agriculture modernization. Urban Probl. 2011, 9, 21–25. [Google Scholar] [CrossRef]
  15. Zhang, B.; Zhang, J.; Miao, C. Urbanization Level in Chinese Counties: Imbalance Pattern and Driving Force. Remote Sens. 2022, 14, 2268. [Google Scholar] [CrossRef]
  16. Li, L.; Zhao, K.; Wang, X.; Zhao, S.; Liu, X.; Li, W. Spatio-Temporal Evolution and Driving Mechanism of Urbanization in Small Cities: Case Study from Guangxi. Land 2022, 11, 415. [Google Scholar] [CrossRef]
  17. Leng, Z.; Fu, C. The influence of the disequilibrium development of urbanization on foods security. Economist 2014, 11, 58–65. [Google Scholar] [CrossRef]
  18. Fan, J. Social demands and new propositions of economic geography discipline development based on the Eleventh National Five-year Plan. Econ. Geogr. 2006, 26, 545–550. [Google Scholar]
  19. Ma, K. The Eleventh Five-Year Plan Strategy Research; Beijing Science & Technology Press: Beijing, China, 2005. [Google Scholar]
  20. Yang, W. Theoretical Exploration of the Reform of Planning System; China Prices Press: Beijing, China, 2003. [Google Scholar]
  21. Fan, J. Draft of major function oriented zoning of China. J. Geogr. Sci. 2015, 70, 186–201. [Google Scholar] [CrossRef]
  22. Available online: http://www.pidu.gov.cn/pidu/c135644/2022-04/18/content_bd190dde113345dfa0bb3e9fde0ab8d6.shtml (accessed on 1 June 2022).
  23. Gong, B.; Wang, L. A study on the impact of urbanization on food security in central China comes from empirical evidence from 14 prefectures and cities in Hunan. Urban J. 2019, 40, 88–93. [Google Scholar]
  24. Zhang, Y.E.; Chu, Q.Q.; Wang, H.G. China’s food security situation and countermeasures in the process of urbanization. Agric. Mod. Stud. 2009, 30, 270–274. [Google Scholar]
  25. Lu, D.D.; Chen, M.X. Several viewpoints on the background of compiling the “National New Urbanization Planning (2014–2020). Acta Geogr. Sin. 2015, 70, 179–185. [Google Scholar] [CrossRef]
  26. Xiao, Y.; Song, Y.; Wu, X. How Far Has China’s Urbanization Gone? Sustainability 2018, 10, 2953. [Google Scholar] [CrossRef] [Green Version]
  27. Chen, J. Rapid urbanization in China: A real challenge to soil protection and food security. Catena 2007, 69, 1–15. [Google Scholar] [CrossRef]
  28. Hanjra, M.A.; Qureshi, M.E. Global water crisis and future food security in an era of climate change. Food Policy 2010, 35, 365–377. [Google Scholar] [CrossRef]
  29. Zhou, C.S.; Wang, Y.Q.; Xu, Q.Y.; Li, S.J. The new process of urbanization in the Pearl River Delta. Geogr. Res. 2019, 38, 45–63. [Google Scholar] [CrossRef]
  30. Chen, R.; Zhao, Z.; Xu, D.; Chen, Y. Progress of research on sustainable development index for cities and urban agglomerations. Prog. Geogr. 2021, 40, 61–72. [Google Scholar] [CrossRef]
  31. Brelsford, C.; Lobo, J.; Hand, J.; Bettencourt, L.M.A. Heterogeneity and scale of sustainable development in cities. Proc. Natl. Acad. Sci. USA 2017, 114, 8963–8968. [Google Scholar] [CrossRef] [PubMed] [Green Version]
  32. Chopra, M.; Singh, S.K.; Gupta, A.; Aggarwal, K.; Gupta, B.B.; Colace, F. Analysis & prognosis of sustainable development goals using big data-based approach during COVID-19 pandemic. Sustain. Technol. Entrep. 2022, 1, 100012. [Google Scholar] [CrossRef]
  33. Wu, X.; Fu, B.; Wang, S.; Song, S.; Li, Y.; Xu, Z.; Wei, Y.; Liu, J. Decoupling of SDGs followed by re-coupling as sustainable development progresses. Nat. Sustain. 2022, 5, 452–459. [Google Scholar] [CrossRef]
  34. Diaz-Sarachaga, J.M.; Jato-Espino, D. Development and application of a new Resilient, Sustainable, Safe and Inclusive Community Rating System (RESSICOM). J. Clean. Prod. 2018, 207, 971–979. [Google Scholar] [CrossRef]
  35. Klopp, J.M.; Petretta, D.L. The urban sustainable development goal: Indicators, complexity and the politics of measuring cities. Cities 2017, 63, 92–97. [Google Scholar] [CrossRef]
  36. Baffoe, G.; Zhou, X.; Moinuddin, M.; Somanje, A.N.; Kuriyama, A.; Mohan, G.; Saito, O.; Takeuchi, K. Urban–rural linkages: Effective solutions for achieving sustainable development in Ghana from an SDG interlinkage perspective. Sustain. Sci. 2021, 16, 1341–1362. [Google Scholar] [CrossRef]
  37. Cobbinah, P.; Erdiaw-Kwasie, M.O.; Amoateng, P. Rethinking sustainable development within the framework of poverty and urbanisation in developing countries. Environ. Dev. 2015, 13, 18–32. [Google Scholar] [CrossRef]
  38. Shen, L.; Peng, Y.; Zhang, X.; Wu, Y. An alternative model for evaluating sustainable urbanization. Cities 2012, 29, 32–39. [Google Scholar] [CrossRef]
  39. Wenban-Smith, H.; Faße, A.; Grote, U. Food security in Tanzania: The challenge of rapid urbanisation. Food Secur. 2016, 8, 973–984. [Google Scholar] [CrossRef]
  40. Hák, T.; Janoušková, S.; Moldan, B. Sustainable Development Goals: A need for relevant indicators. Ecol. Indic. 2016, 60, 565–573. [Google Scholar] [CrossRef]
  41. Allen, C.; Metternicht, G.; Wiedmann, T. National pathways to the Sustainable Development Goals (SDGs): A comparative review of scenario modelling tools. Environ. Sci. Policy 2016, 66, 199–207. [Google Scholar] [CrossRef] [Green Version]
  42. Martínez-Córdoba, P.-J.; Amor-Esteban, V.; Benito, B.; García-Sánchez, I.-M. The Commitment of Spanish Local Governments to Sustainable Development Goal 11 from a Multivariate Perspective. Sustainability 2021, 13, 1222. [Google Scholar] [CrossRef]
  43. Bandauko, E.; Annan-Aggrey, E.; Arku, G. Planning and managing urbanization in the twenty-first century: Content analysis of selected African countries’ national urban policies. Urban Res. Pract. 2020, 14, 94–104. [Google Scholar] [CrossRef]
  44. Horn, P.; Grugel, J. The SDGs in middle-income countries: Setting or serving domestic development agendas? Evidence from Ecuador. World Dev. 2018, 109, 73–84. [Google Scholar] [CrossRef]
  45. Zou, J.L.; Yang, Z.S. Cultivated land use and policy implications in Chinese main grain producing areas with different urbanization levels. Resour. Sci. 2013, 35, 370–379. [Google Scholar]
  46. Feng, D.X.; Wang, X.F. Research on the urbanization of traditional rural areas. Bull. Chin. Acad. Sci. 2013, 28, 54–65. [Google Scholar] [CrossRef]
  47. Conceição, P.; Levine, S.; Lipton, M.; Warren-Rodríguez, A. Toward a food secure future: Ensuring food security for sustainable human development in Sub-Saharan Africa. Food Policy 2016, 60, 1–9. [Google Scholar] [CrossRef]
  48. Fafchamps, M.; Shilpi, F. Cities and Specialisation: Evidence from South Asia. Econ. J. 2005, 115, 477–504. [Google Scholar] [CrossRef]
  49. Xue, L.; Weng, L.F. The policy opportunities and challenges in China’s implementation of 2030 Sustainable Development Goals. China Soft Sci. 2017, 1, 1–12. [Google Scholar]
  50. Zhang, S.; Lv, Y.; Yuan, J.; He, G.; Zheng, X. Roles of sustainable urbanization in promoting the implementation of UN Sustainable Development Goals in China. Acta Ecol. Sin. 2019, 39, 1135–1143. [Google Scholar] [CrossRef]
  51. Xia, A.; Xu, X.; Xue, D. A Summary of the Studies on The Coordinated Development of Urban and Rural Areas in China. Hum. Geogr. 2003, 18, 56–60. [Google Scholar] [CrossRef]
  52. Yao, S.; Zhang, P.; Yu, C.; LI, G.; Wang, C. The theory and practice of new urbanization in China. Sci. Geogr. Sin. 2014, 34, 641–647. [Google Scholar] [CrossRef]
  53. Zhang, X.Q. The trends, promises and challenges of urbanisation in the world. Habitat Int. 2016, 54, 241–252. [Google Scholar] [CrossRef]
  54. Liu, X.; Sun, T.; Feng, Q. Dynamic spatial spillover effect of urbanization on environmental pollution in China considering the inertia characteristics of environmental pollution. Sustain. Cities Soc. 2020, 53, 101903. [Google Scholar] [CrossRef]
  55. Chen, M.; Gong, Y.; Lu, D.; Ye, C. Build a people-oriented urbanization: China’s new-type urbanization dream and Anhui model. Land Use Policy 2018, 80, 1–9. [Google Scholar] [CrossRef]
  56. Yin, P.H.; Fang, X.Q.; Tian, Q.; Ma, Y.L. Distribution and regional difference of main output regions in grain production in China in the early 21st century. Acta Geogr. Sin. 2006, 61, 190–198. [Google Scholar] [CrossRef]
  57. Puertas, R.; Guaita-Martinez, J.M.; Carracedo, P.; Ribeiro-Soriano, D. Analysis of European environmental policies: Improving decision making through eco-efficiency. Technol. Soc. 2022, 70, 102053. [Google Scholar] [CrossRef]
  58. Puertas, R.; Marti, L.; Guaita-Martinez, J.M. Innovation, lifestyle, policy and socioeconomic factors: An analysis of European quality of life. Technol. Forecast. Soc. Chang. 2020, 160, 120209. [Google Scholar] [CrossRef]
  59. Zang, L.; Su, Y. Internal Coordinated Development of China’s Urbanization and Its Spatiotemporal Evolution. Sustainability 2019, 11, 626. [Google Scholar] [CrossRef] [Green Version]
  60. Zhao, H.; Yu, F. Evaluation of Agricultural Green Development Level in Main Grain Producing Areas based on Entropy Method. Reform 2019, 11, 136–146. [Google Scholar]
  61. Xin, L.; An, X. Construction and Empirical Analysis of Agricultural High-quality Development Evaluation System in China. Econ. Rev. J. 2019, 05, 109–118. [Google Scholar] [CrossRef]
  62. Li, B.; Zhang, J.X. Temporal and spatial characteristics of county urbanization and rural coordinated development in the main grain producing areas—Taking 108 counties in Henan province as an example. Chin. J. Agric. Resour. Reg. Plan. 2016, 37, 52–60. [Google Scholar] [CrossRef]
  63. Chen, C.; Liu, Y.S. The spatio-temporal patterns of urbanization of China’s agricultural area and its influential factors: The case of Henan province. Econ. Geogr. 2014, 34, 48–54. [Google Scholar] [CrossRef]
  64. Jiang, X.J.; Yang, Q.S.; Zhang, Y.; Wang, X.Y.; Chen, C.Y. Spatial differentiation characteristics of coordinated development level between economy and society in China. Econ. Geogr. 2017, 37, 17–26. [Google Scholar] [CrossRef]
  65. Sachs, J.D. From Millennium Development Goals to Sustainable Development Goals. Lancet 2012, 379, 2206–2211. [Google Scholar] [CrossRef]
  66. Ning, Y.M.; Li, J. The mechanism, mode and strategy of urbanization in Pan-Yangtze River Delta. Nanjing J. Soc. Sci. 2009, 5, 8–14. [Google Scholar] [CrossRef]
  67. Djurfeldt, A.A. Urbanization and linkages to smallholder farming in sub-Saharan Africa: Implications for food security. Glob. Food Secur. 2015, 4, 1–7. [Google Scholar] [CrossRef] [Green Version]
  68. Miao, S.; Hou, X. The path of new urbanization in the main grain-producing areas with dense population is selected. Rural Econ. Sci.-Technol. 2020, 31, 262–264. [Google Scholar]
Figure 1. Analysis framework of the study.
Land 11 01163 g001
Figure 2. Locations of MGPAs including 128 prefecture-level cities in China.
Land 11 01163 g002
Figure 3. Spatial distribution of the subdimensional quality of MGPAs in 2018.
Land 11 01163 g003
Figure 4. LISA cluster maps for the subdimensional quality of MGPAs in 2018.
Land 11 01163 g004
Figure 5. Changes in urbanization quality rankings after adding agricultural development to the evaluation indicator system.
Land 11 01163 g005
Table 1. Comparison of the mean values of relevant indicators in different regions in 2018.
RegionPopulation Density (Person/sq. km)Grain Output (1000 Tons)Per Capita Share of Grain (kg/Person)
MGPAs561268484
Densely populated agricultural areas608411617
Nondensely populated agricultural areas519138364
Table 2. Four-dimensional evaluation indicator system and the weights of urbanization quality.
Primary IndicatorsWeightSecondary IndicatorsIndicator PropertiesWeight
Economic efficiency0.25Technical efficiencyPositive0.15
Scale efficiencyPositive0.10
Urbanization level0.25Urbanization ratePositive0.15
CitizenizationPositive0.10
Urban–rural co-ordination0.25Urban–rural income gapNegative0.125
Urban–rural consumption gapNegative0.125
Environmental quality0.25PM2.5Negative0.125
Sewage discharge intensityNegative0.125
Table 3. Five-dimensional evaluation indicator system and the weights of urbanization quality.
Primary IndicatorsWeightSecondary IndicatorsIndicator PropertiesWeight
Agricultural development0.12Per labor agricultural output valuePositive0.06
Per capita grain outputPositive0.06
Economic efficiency0.22Technical efficiencyPositive0.132
Scale efficiencyPositive0.088
Urbanization level0.22Urbanization ratePositive0.132
CitizenizationPositive0.088
Urban–rural co-ordination0.22Urban–rural income gapNegative0.11
Urban–rural consumption gapNegative0.11
Environmental quality0.22PM2.5Negative0.11
Sewage discharge intensityNegative0.11
Table 4. Average comprehensive urbanization quality in 2010, 2015, and 2018.
Areas201020152018
Densely populated agricultural areas0.5450.5700.575
Nondensely populated agricultural areas0.5730.5860.595
Hebei0.5130.5260.503
Henan0.5100.4870.507
Shandong0.5780.5730.604
Anhui0.5400.5730.568
Jiangsu0.6680.6900.703
Hubei0.5720.5970.609
Hunan0.5370.5920.589
Jiangxi0.5640.5940.597
Sichuan0.5610.5940.596
Table 5. Subdimensional quality values in 2010, 2015, and 2018.
SubdimensionMGPAsDensely Populated Agricultural AreasNondensely Populated Agricultural Areas
201020152018201020152018201020152018
Agricultural development0.2860.3060.2870.3540.3790.3570.2260.2400.224
Economic efficiency0.7650.7830.7850.7380.7560.7590.7890.8070.809
Urbanization level0.4160.4570.5060.4050.4510.5000.4260.4620.512
Urban–rural co-ordination0.6520.6420.6280.6400.6420.6350.6630.6420.623
Environmental quality0.5550.5810.5850.5030.5340.5260.6020.6220.639
Table 6. Moran’s I of subdimensions in 2018.
SubdimensionGlobal Moran’s Ip-ValueZ-Score
Agricultural development0.4280.0017.435
Economic efficiency0.3000.0015.448
Urbanization level0.1750.0043.188
Urban–rural co-ordination0.1820.0033.210
Environmental quality0.5840.00110.419
Table 7. Co-ordinated development modes remained unchanged during 2010–2018.
ModeDensely Populated Agricultural AreasNondensely Populated Agricultural Areas
Good co-ordinationYangzhou, Huai’an, Xiangyang, Xuzhou, Yueyang, Lianyungang, Changde, Suqian, Nantong, Taizhou, Yancheng, JingmenWeihai, Wuxi, Changzhou, Suzhou, Zhenjiang, Wuhan, Yichang, Ezhou, Suizhou, Changsha, Xinyu, Yingtan, Dongying, Nanjing
Basic co-ordinationXuchang, Jining, Tai’an, Liaocheng, Binzhou, Huainan, Chuzhou, Suzhou, Liu’an, Bozhou, Xiaogan, Hengyang, Yongzhou, Nanchang, Ji’an, Yichun, Mianyang, Nanchong, DazhouLangfang, Hebi, Luohe, Sanmenxia, Zaozhuang, Rizhao, Ma’anshan, Huaibei, Chizhou, Huangshi, Zhuzhou, Xiangtan, Jingdezhen, Pingxiang, Jiujiang, Chengdu, Zigong, Luzhou, Deyang, Guangyuan, Suining, Leshan, Yibin, Laiwu
Low co-ordinationHandan, Xingtai, Baoding, Hengshui, Kaifeng, Anyang, Puyang, Shangqiu, Zhoukou, FuyangZhengzhou, Jiaozuo, Linyi, Shiyan, Shaoyang, Zhangjiajie, Huaihua, Ganzhou, Pingdingshan
Table 8. Changes in the co-ordinated development modes during 2010–2018.
ModeDensely Populated Agricultural AreasNondensely Populated Agricultural Areas
Changing from good co-ordination to basic co-ordinationTangshan, Xinyang, Jinan, Qingdao, Weifang, FuzhouZibo, Yantai, Wuhu, Xuancheng, Guang’an
Changing from basic co-ordination to low co-ordinationShijiazhuang, Cangzhou, Nanyang, ZhumadianQinhuangdao, Chengde, Luoyang, Tongling, Panzhihua, Ya’an, Bazhong
Changing from basic co-ordination to good co-ordinationDezhou, Heze, Jingzhou, Yiyang, ZiyangXianning, Neijiang, Meishan
Changing from low co-ordination to basic co-ordinationXinxiang, Hefei, Bengbu, Huanggang, ShangraoZhangjiakou, Anqing, Huangshan, Chenzhou, Loudi
Publisher’s Note: MDPI stays neutral with regard to jurisdictional claims in published maps and institutional affiliations.

