Article

Seasonal Differences in Land Surface Temperature under Different Land Use/Land Cover Types from the Perspective of Different Climate Zones

1
Human Settlements Research Center, Liaoning Normal University, Dalian 116029, China
2
Key Laboratory of Regional Sustainable Development Modeling, Institute of Geographic Sciences and Natural Resources Research, Chinese Academy of Sciences, Beijing 100101, China
3
College of Geographical Sciences, Liaoning Normal University, Dalian 116029, China
*
Author to whom correspondence should be addressed.
Land 2022, 11(8), 1122; https://doi.org/10.3390/land11081122
Submission received: 18 June 2022 / Revised: 15 July 2022 / Accepted: 18 July 2022 / Published: 22 July 2022
(This article belongs to the Topic Climate Change and Environmental Sustainability)

Abstract

:
The process of urbanization is accelerating, and land surface temperature (LST) is increasing, seriously threatening human health. Therefore, it is crucial to explore the differences in LST of different land use/land cover (LULC) types. Using MOD11A2 and MCD12Q1 data, this study explored the seasonal differences in LST of each LULC type from the perspective of different climate zones. The results showed that the maximum and minimum LSTs during the day were higher than those at night. During the day, the LSTs of urban and built-up and barren lands were higher than those of forests, grasslands, and water bodies; at night, the LSTs of urban and built-up lands decreased but remained high, while barren lands showed a significant decrease to LSTs even lower than those of water bodies. In addition, the difference in daytime LST of the LU16 type (barren lands) in different climatic zones was the most obvious and was much higher than that of other LULC types in the middle temperate and south temperate zones, but much lower than those in the middle subtropical and north subtropical zones. This comparison of the LST differences of each LULC type under different climate backgrounds provides an important reference for rational urban planning.

1. Introduction

In the process of global rapid urbanization, numerous natural features have been transformed into impervious surfaces [1,2,3], resulting in an annual increase in land surface temperature (LST). Extreme high-temperature conditions have frequently occurred in large cities, triggering a series of environmental problems such as the urban heat island effect and extreme climatic events [4,5,6,7], causing serious threats to human physical and mental health [8,9,10]. Therefore, research on the spatiotemporal distribution and mechanism of LST has become a focus of Chinese and foreign scholars [11,12,13].
In LST research, the LST data acquisition method is a high priority. Compared with the air temperature data obtained by meteorological stations, LST is easier to obtain, has larger coverage, and is spatially continuous. With the development of remote sensing technology, LST acquisition methods mainly include remote sensing image inversion and numerical simulation [14,15,16]. The inversion of LST from remote sensing images mainly calculates LST based on the reflectivity of ground objects in the thermal infrared band through the thermal infrared band data in satellite sensors, through single-channel algorithm, split-window algorithm, single-window algorithm, and atmospheric correction methods [17,18,19,20]. At present, there are many remote sensors for LST inversion, such as Landsat series (TM, ETM+, and TIRS) and Advanced Spaceborne Thermal Emission & Reflection Radiometer (ASTER) [21,22,23], both are more suitable for small-scale research due to their high resolution. However, for studies across China, with large coverage, large-scale satellite LST datasets, such as Advanced Very High Resolution Radiometer (AVHRR) and Moderate Resolution Imaging Spectroradiometer (MODIS), are more suitable, and MODIS is also widely used due to the easy availability of data [24,25]. For example, Yao et al. [26] analyzed the differences between MYD11 and MYD21 land surface temperature products in mainland China.
The drivers of LST are complex and diverse, and mainly include: land use/land cover (LULC), urban climate, human activities, ecological environment, etc. [27,28,29,30,31]. Due to the continuous advancement of urbanization, the urban population has rapidly increased and the LULC has continued to change; hence, the LULC plays a pivotal role in LST change [32,33,34]. It is well known that LULC change is the main focus of sustainable development [35] and is also a very important concept in natural resource management and monitoring [36,37]. Many scholars have studied the relationship between LULC and LST [38,39,40,41,42]; however, most of the studies were based on a city, and few studies analyzed the impact of different LULC types in different cities on LST under different climate backgrounds. However, it has been found that the cooling effect of urban parks is different under different climate backgrounds [43]. China has a vast area and diverse climate types. Hence, taking China as an example to explore the LST differences under the background of climate differences is arguably more practical than city-scale studies. Therefore, this study took China as an example to explore the differences of LST corresponding to different LULC types under different climate backgrounds.
Based on the 2020 MODIS LST (MOD11A2) and LULC (MCD12Q1) products combined with remote sensing, geographical information system spatial analysis, and other methods, and with ArcGIS software, this paper explored the seasonal and diurnal differences in LST and discussed the impact of LULC types on LST under different climate backgrounds. This paper is structured as follows. Section 2 introduces the case study area, data sources, and research methods. Section 3 analyzes the results of the spatial distribution of LULC, LST diurnal, and seasonal differences, and the relationship between them. Following this, Section 4 discusses the results, and Section 5 concludes this paper.

2. Materials and Methods
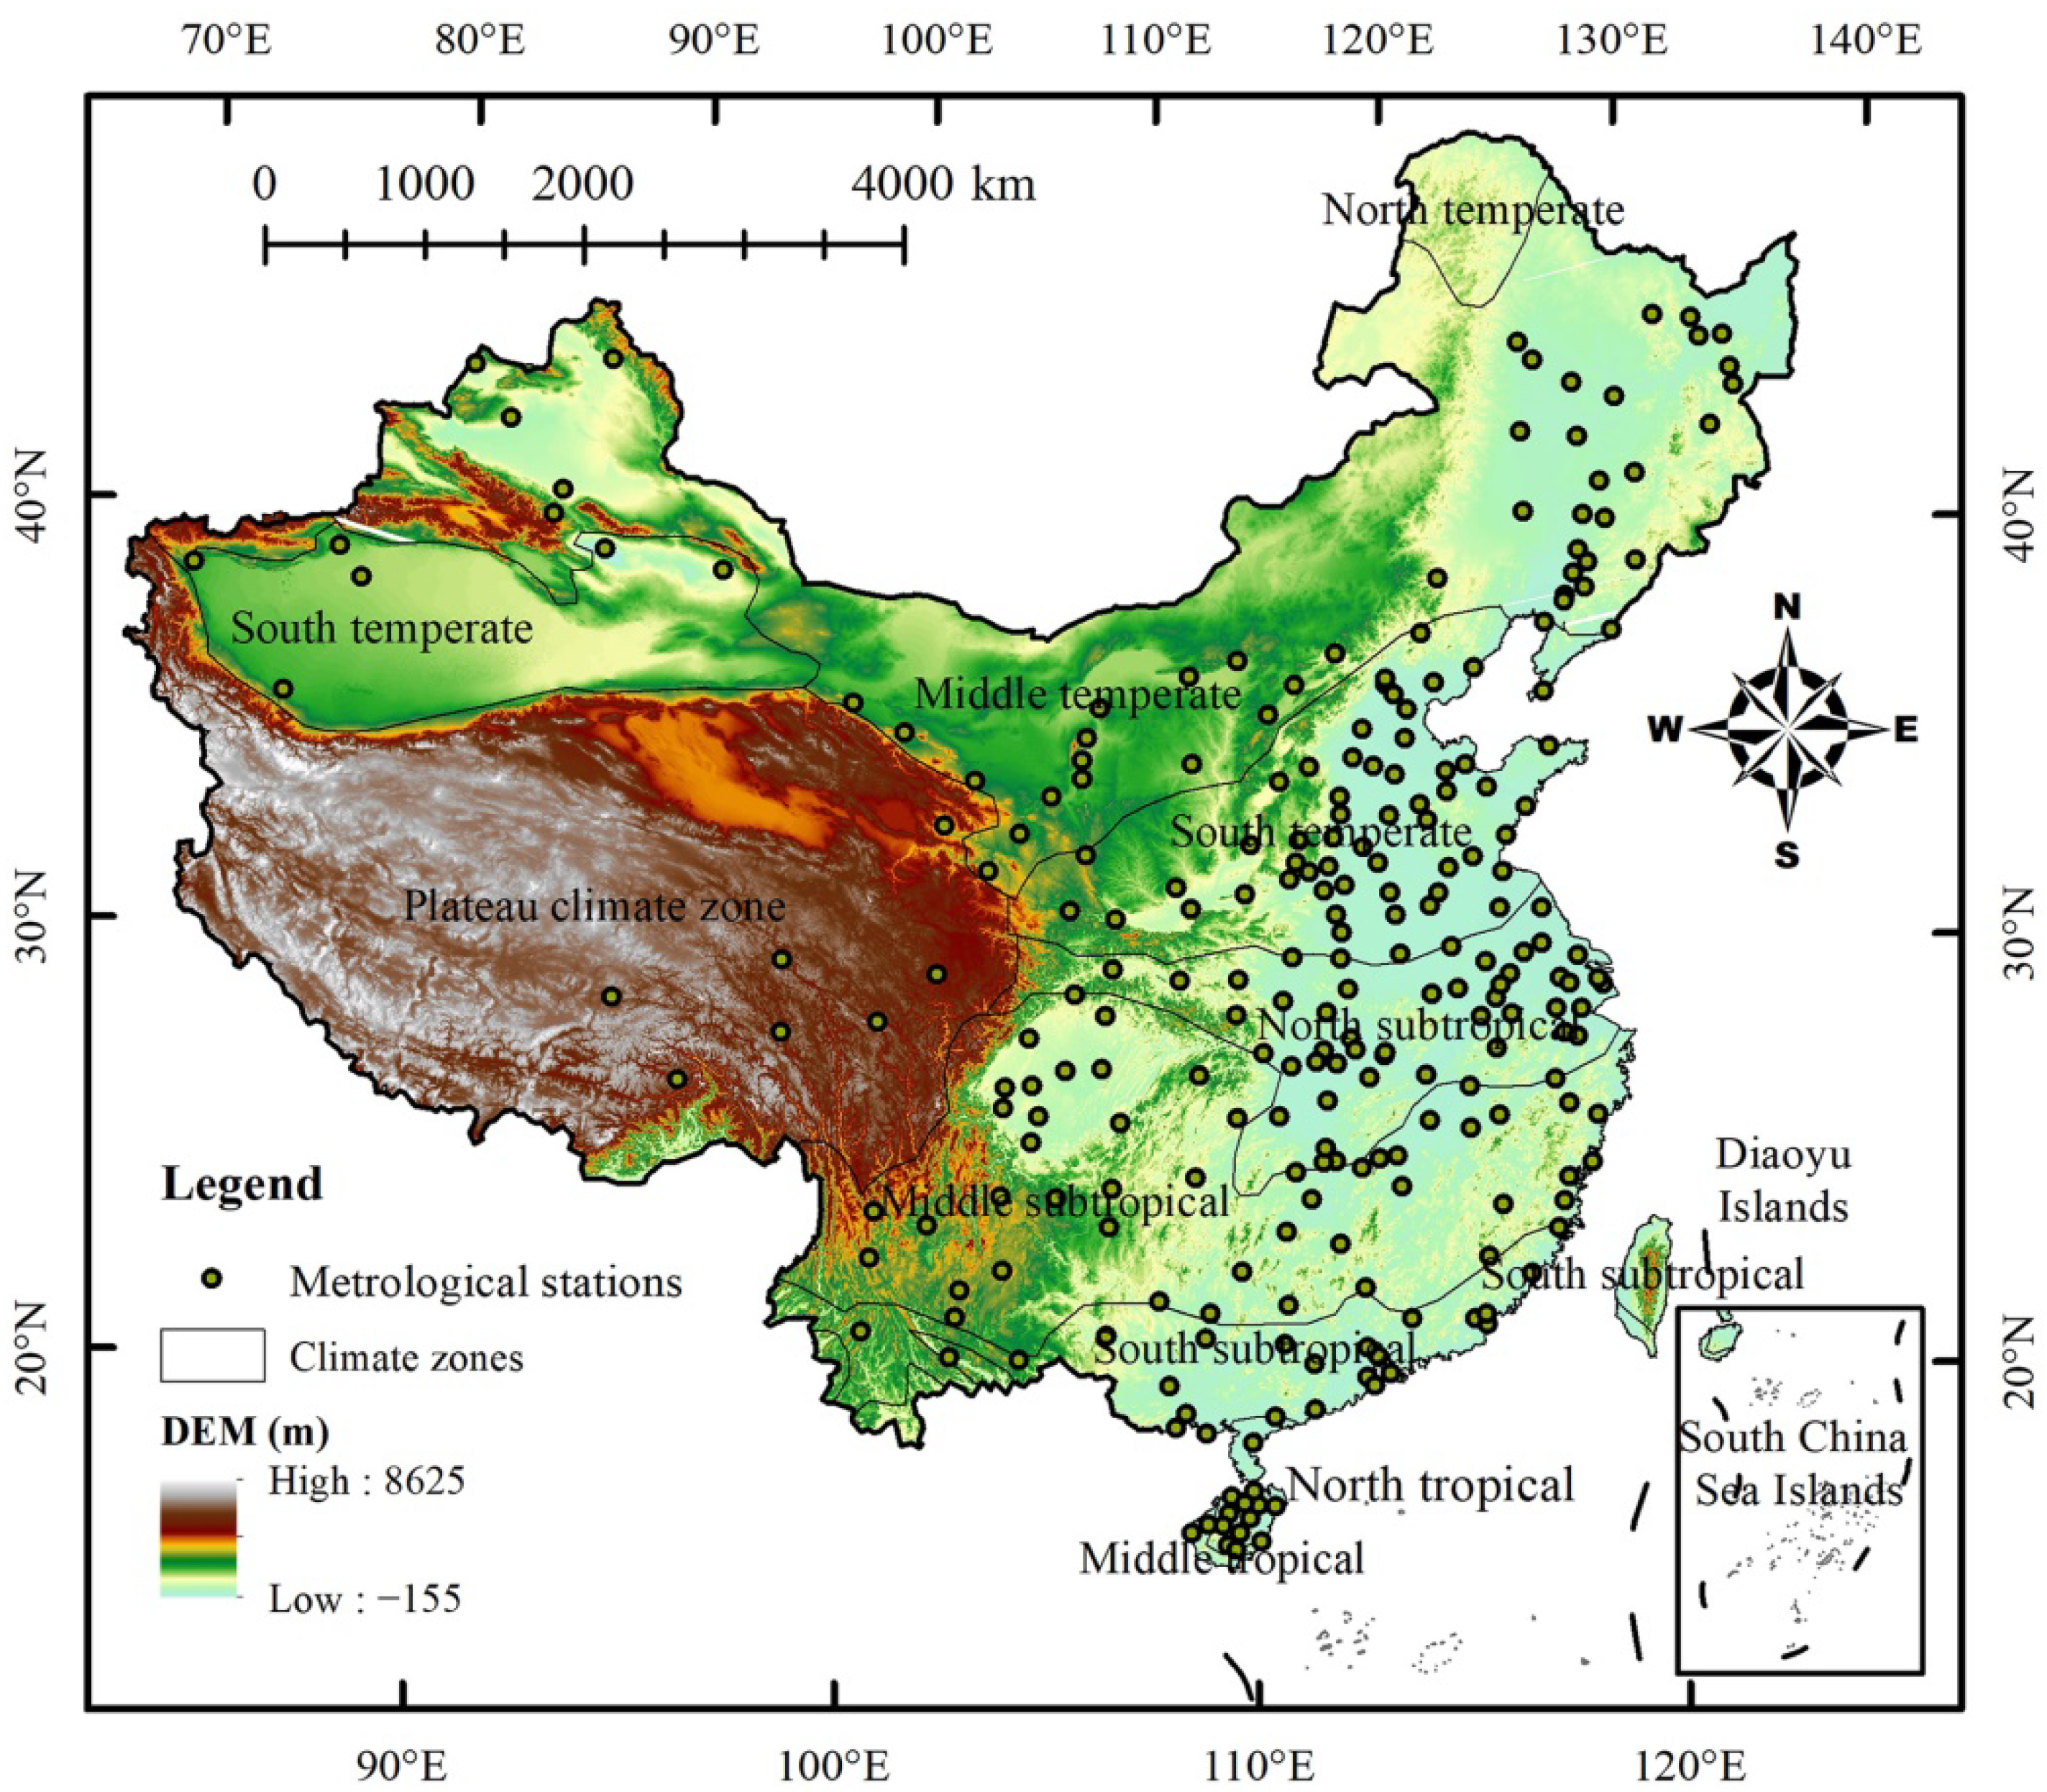
2.1. Study Area

Since the reform and opening up, China’s urbanization process has accelerated, and the population has continued to increase, especially in the eastern coastal cities. China has a vast territory (Figure 1), with a total land area of approximately 9,600,000 km2, ranking third in the world. It has a large latitudinal and longitudinal span and is rich in climate types, including temperate, tropical, subtropical, and plateau climates. The terrain of China is higher in the west than in the east, with roughly a ladder-like distribution. China has four distinct seasons. In this paper, according to the meteorological division method, March, April, and May are regarded as spring; June, July, and August as summer; September, October, and November as autumn; and December, January, and February as winter.

2.2. Data Sources

This study mainly used MODIS LST product (MOD11A2), MODIS LULC product (MCD12Q1), digital elevation model (DEM) data, and climate division data. See Table 1 for details.

2.3. Methods

At present, the common thermal infrared remote sensing data mainly include Landsat series (TM, ETM+, and TIRS), Advanced Spaceborne Thermal Emission & Reflection Radiometer (ASTER), Moderate Resolution Imaging Spectroradiometer (MODIS), and Advanced Very High Resolution Radiometer (AVHRR) data [26,44,45,46,47]. Among them, compared with MODIS data, Landsat series satellites have higher resolution (TM: 120, ETM+: 60, TIRS: 100 m); however, their revisit period is longer (16 d), and only daytime data can be obtained free of charge. ASTER data has a higher resolution (90 m), and the revisit period is also 16 d, but it can obtain day and night data. The Landsat series and ASTER are more suitable for small and medium-scale research; Environment-1 B satellite (HJ-1B) data has a lower resolution (300 m), and the playback period is long (31 d). AVHRR has a lower resolution (1100 m) but a short revisit period, passing the same area twice a day. MODIS data resolution is low (250 m, 500 m, and 1000 m), but it can obtain daily day and night data, which is suitable for large-scale research and is widely used in LST research [48,49]. At present, most studies take a single city as an example [50,51,52,53], which lacks general laws from a large-scale perspective. Due to the advantages of MODIS data in large-scale research, this paper selected the MOD11A2 data and obtained by the split window algorithm inversion; the error was <1 K in most cases [54,55,56].
This study selected MODIS LST product (MOD11A2) as the LST data of the study area (the error of MOD11A2 was <1 K in most cases [54,55,56]). To study the diurnal and seasonal differences of LST, this paper selected a total of 1288 image data in 2020 to calculate LST, and the MRT tool was used to perform projection and stitching processing, and the missing data were set to null values. Then, ArcGIS 10.4 software (version number: 10.4.1.5686)was used to clip according to the vector boundary of the study area. Finally, the image pixel value of MOD11A2 was converted to degrees Celsius by using ArcGIS 10.4 software (digital numbers [DNs]); the calculation formula is as follows:
LST (°C) = DN × 0.02 − 273.15,
where DN is the brightness temperature of the MOD11A2 image.
A total of 28 images of MODIS 2020 LULC product (MCD12Q1) were selected as the LULC data of the study area (accuracy assessment indicated that the Collection 6 product had an overall accuracy of 73.6% for the primary LCCS layer [57]), and were projected and spliced using MRT tools. Then, resampling to 1 km by ArcGIS 10.4 software and clipping according to the vector boundary of the study area were conducted to obtain the LULC spatial distribution map in China. When calculating the average LST of different LULC types, we first converted the LULC raster images into vector format and then used the zonal statistics tool of ArcGIS 10.4 software for calculations.
In order to further analyze the LST changes, this paper used the raster calculator tool of ArcGIS to calculate the same using the formula:
LSTC = LST2020 − LST2010,
where, LSTC represents LST changes, and LST2020 and LST2010 are the annual average LSTs in 2020 and 2010, respectively.

3. Results

3.1. LULC Spatial Distribution

From the perspective of the spatial distribution of LULC (Figure 2), croplands were mainly distributed in the northeastern middle temperate, south temperate, and north subtropical zones. Barren lands were mainly distributed in the south temperate, middle temperate, and northwestern plateau climate zones. Grasslands were mainly distributed in northwestern China. Forests were mainly distributed in the subtropical, tropical, and northeastern temperate zones of southern China. Urban and built-up areas were mainly distributed in the eastern coastal areas. In addition, we calculated the proportion of the area of different LULC types in each climate zone (Table 2). The results showed that barren land and grasslands were the main land types in the plateau climate zone, accounting for 90.3% of the total area. The middle tropical zone was dominated by woody savannas, savannas, grasslands, and evergreen broadleaf forests, accounting for 80.6% of the total area. In the northern tropics, evergreen broadleaf forests and savannas accounted for 28.4% and 28.5% of the total area, respectively. Woody savannas and savannas accounted for relatively large proportions in the south subtropical and middle subtropical zones, and croplands accounted for the largest proportion in the north subtropical zone, followed by the savannas. The largest proportions of barren land and croplands were in the south temperate zone, accounting for 40.4% and 33.7%, respectively. Grasslands and barren land accounted for the largest proportions in the middle temperate zone (45.6% and 22.2% of the total area, respectively), and woody savannas (66.8%) accounted for the largest proportion in the north temperate zone.

3.2. LST Spatial Distribution

The LST calculation results are shown in Figure 3 (validated with metrological station data, the RMSE result was 2.94 °C, and the distribution of meteorological stations is shown in Figure A1). There were obvious differences in the LSTs between the day, night, and seasons in China. Overall, the maximum LSTs during the day were higher than those at night: Annual mean LST: (44.09 °C) > (25.43 °C); spring: (46.55 °C) > (26.78 °C); summer: (63.25 °C) > (32.44 °C); autumn: (37.50 °C) > (26.83 °C); winter: (31.94 °C) > (22.12 °C). This was also the case for the minimum LSTs: Annual mean LST: (−21.77 °C) > (−39.43 °C); spring: (−21.58 °C) > (−41.69 °C); summer: (−12.47 °C) > (−43.57 °C); autumn: (−25.15 °C) > (−39.43 °C); winter: (−41.07 °C) > (−44.91 °C). This was mainly due to the rapid heating of the surface due to the influence of solar radiation during the day; whereas at night, without the effect of solar radiation, the ground dissipated heat outward, so the LST was lower. In addition, LST also showed seasonal differences. During the day, the maximum LST decreased from that in summer (63.25 °C) > spring (46.55 °C) > autumn (37.50 °C) > winter (31.94 °C). The minimum values decreased in the same order: summer (−12.47 °C) > spring (−21.58 °C) > autumn (−25.15 °C) > winter (−41.07 °C). At night, the maximum LST decreased from that in summer (32.44 °C) > autumn (26.83 °C) > spring (26.78 °C) > winter (22.12 °C); whereas the minimum LST decreased from that in autumn (−39.43 °C) > spring (−41.69 °C) > summer (−43.57 °C) > winter (−44.91 °C). This was mainly due to the fact that the maximum daytime LST occurred near the Tarim Basin in the Xinjiang Uygur Autonomous Region, and the solar radiation was strong during the day, causing the temperature to sharply increase. However, the Tarim Basin belongs to the temperate continental climate, which is cold in winter and hot in summer, and the annual and daily temperature ranges are very large. The maximum LST at night occurred in the southeastern coastal area, which belongs to the tropical and subtropical monsoon climate, and is affected by the difference in thermal properties between land and sea. The temperature was the highest in summer and the lowest in winter, and there was little difference between spring and autumn.

3.3. Relationship between LULC and LST

As shown in Figure 4 and Table 3, the mean LST of different LULC types also showed significant differences in different seasons and between day and night. For the same LULC type, the annual mean daytime LST was similar to the mean LST in autumn, and the seasonal trend decreased from summer > spring > autumn > winter; e.g., at LU1 it decreased from that in summer (19.47 °C) > spring (16.84 °C) > autumn (14.08 °C) > winter (7.42 °C). The annual mean LST at night was similar to that in spring or autumn, and the seasons showed a trend of summer > spring/autumn > winter; e.g., at LU1 where it decreased from that in summer (9.44 °C) > autumn (6.26 °C) > spring (9.44 °C) > winter (−0.35 °C), which was consistent with the seasonal differences in LST. For different LULCs, there were significant differences in the mean LST of the year, season, day, and night. During the day, the highest LSTs in the year, spring, summer, autumn, and winter occurred in LU14, LU13, LU16, LU13, and LU2 types, respectively, and the minimum LSTs occurred in LU15, LU15, LU15, LU3, and LU3 types, respectively. At night, the highest LSTs in the year, spring, summer, autumn, and winter were in LU2, LU2, LU13, LU2, and LU2 types respectively, and the minimum LSTs were all in the LU15 type. In addition, during the day, urban and built-up, and barren lands had higher LSTs, and forests, grasslands, snow and ice, and water bodies had lower LSTs. The LSTs of urban and built-up lands decreased at night, but remained high in many LULC types, while that in barren land showed a significant decrease (to temperatures even lower than that of water bodies), which was mainly due to the strong solar radiation during the day, and the rapid heating of barren land and built-up areas. At night, with no solar radiation, the built-up area still had a high LST due to human activities and other factors, the specific heat capacity of bare soil was small, and the temperature decreased rapidly.
To further analyze the LST difference of each LULC type in different climatic zones and ensure that all LULC types were distributed in each climatic zone, this study took five land-use types (LU10, LU12, LU13, LU16, and LU17) as examples to analyze the different LULC types. The LST differences of each LULC type under the climate zone are shown in Figure 5. Overall, the mean LST of the same LULC type (except LU16) under different climate backgrounds (except the plateau climate region) showed a trend of being high in the south and low in the north, which was mainly due to the solar radiation differences in different regions in the north and south. Specifically, in the daytime, the annual mean LSTs of LU10 and LU17 exhibited a pattern of decreasing from that in the middle tropical > north tropical > south subtropical > middle subtropical > north subtropical > south temperate > middle temperate > plateau climate zone > north temperate. The annual mean LSTs of LU12 and LU13 decreased in the order of middle tropical > north tropical > south subtropical > middle subtropical > north subtropical > south temperate > plateau climate zone > middle temperate > north temperate. The annual mean LST of LU16 decreased in the order of middle tropical > south temperate > north tropical > south subtropical > middle temperate > north subtropical > plateau climate zone > middle subtropical. At nighttime, the annual mean LST of LU10 presented a decreasing trend from middle tropical > north tropical > south subtropical > north subtropical > middle subtropical > south temperate > middle temperate > north temperate > plateau climate zone. The annual mean LSTs of LU12 and LU13 presented decreasing trends from the middle tropical > north tropical > south subtropical > middle subtropical > north subtropical > south temperate > middle temperate > plateau climate zone > north temperate. The annual mean LST of LU16 showed a decreasing trend from north tropical > middle tropical > south subtropical > north subtropical > south temperate > middle temperate > middle subtropical > plateau climate zone. For the same climate zone, the LSTs of different LULC types were also different. Regardless of day and night, the mean LST of each LULC type was different from that without distinguishing climate zones. When the climatic zones were not distinguished, the mean LST of different LULC types during daytime showed LU13 > LU16 > LU12 > LU10 > LU17, and nighttime showed LU13 > LU17 > LU12 > LU16 > LU10. However, there are significant differences in the statistics of LST differences of LULC types in different climatic zones. Specifically, in the daytime, among these five LULC types (LU10, LU12, LU13, LU16, and LU17), except in the south temperate, middle temperate, and north temperate zones, the remaining climate zones showed that LU12 and LU13 had higher LSTs (in the middle tropical and north temperate zones, LU12 > LU13, the rest were LU13 > LU12), and that LU10, LU16, and LU17 had lower LSTs. The LST of LU16 was the highest in the south temperate and middle temperate zones and the lowest in the middle subtropical and north subtropical zones. At night, LU17 and LU13 had higher LSTs in the plateau climate zone, middle subtropical, north subtropical, southern temperate, and middle temperate zones; whereas LU10, LU12, and LU16 had smaller LSTs. LU13 and LU16 in the middle tropical, north tropical, and southern subtropical zones had larger LSTs (LU16 > LU13), and LU10, LU12, and LU17 had smaller LSTs (LU17 > LU12 > LU10, consistent with the results when no climate zone was distinguished). The LST in the north temperate zone showed a trend of LU17 > LU10 > LU13 > LU12.

3.4. Variations in LST for Different LULC Types Changes

In order to study the effect of land use changes on LST, this paper selected LULC (MCD12Q1) and LST (MOD11A2, validated with metrological station data, the RMSE result was 4.14 °C, the distribution of LST and LULC in 2010 was shown in Figure A2) data in 2010 for processing, and obtained LST (Figure A3) and LULC (Figure A4) (Still taking LU10, LU12, LU13, LU16 and LU17 as examples) changes in 10 years (2010–2020), and using ArcGIS spatial analysis and zonal statistical tools to calculate the LST changes caused by LULC changes (Table 4). The results showed that, except for LU12 and LU13 in the south subtropical zone, the LST showed a decreasing trend in other climate zones even if the types of LULCs did not change. This was because the changes of these five LULC types mainly occur in southern temperate, middle temperate, plateau climate, and northern subtropical zones, which were affected by strong cold air in 2020, resulting in low temperatures (according to the statistics of the China Meteorological Administration, source: http: //www.cma.gov.cn/, access date: 2 July 2022). Meanwhile, affected by the Coronavirus disease (COVID-19) in 2020, LST also showed a decreasing trend [58,59]. When analyzing the response of LST to LULC changes, it was found that, except for the plateau climate zone, the LST changes in the remaining climate zones from LU10, LU12, LU16, and LU17 to LU13 were larger than those from LU13 to LU10, LU12, LU16, and LU17, indicating that even under the influence of cold air, urban and built-up lands still had a certain thermal insulation effect compared with other LULC types. However, the LST changes from LU12, LU13, LU16, and LU17 to LU10 were smaller than those from LU10 to LU12, LU13, LU16, and LU17, indicating that grasslands had a certain cooling effect compared with other LULC types.

4. Discussion

4.1. Relationship between LULC and LST

Most studies have found that for a city in a certain area, the temperature of vegetation and water bodies is low, and that of buildings is high [60,61,62,63,64]. There are few studies on the impact of different LULC types in different cities on LST [65,66,67], and it has been found that urban parks have different cooling effects under different climate backgrounds [44]. Therefore, this study discussed the difference in the LST of different LULC types under different climatic backgrounds in China and analyzed the warming and cooling effects of each LULC type under different climate backgrounds. For example, we found that the LU16 type had high LST in the south temperate and middle temperate zones, but a low LST in the middle subtropical zone. This finding has important significance as a reference for the rational use of urban land. Meanwhile, we analyzed LST variations for changes in different LULC types and found that even under the influence of cold air, compared with other LULC types, LU10 had lower LST and LU13 had higher LST. In addition, we found that extreme climate had a greater impact on LST.

4.2. Seasonal LST Variations of Different LULC Types

LST also shows seasonal differences under different LULCs [68,69]. For example, Yang et al. [27] analyzed the relationship between LCZ and LST and found that the mean LST in barren land was lower than most building types in summer but higher than most building types in winter. To further analyze the seasonal difference of the mean LST of each LULC type under different climate zones, in this study we calculated the seasonal difference of LST of LULC types under different climate zones (Figure 6). The results showed that, for the same LULC type (except LU16), during the daytime in spring and summer, the mean LST of each LULC type first decreased, then increased, and then decreased again with the increase of the latitude of the climate zones (except the plateau climate zone). However, during the daytime in autumn and winter, and at night in all seasons, the mean LST of each LULC type showed a decreasing trend with the increase of the latitude of the climate zones (except the plateau climate zone), which was consistent with the annual mean LST results. For the same climate zone, there were differences in the mean LST of each LULC type in different seasons. Taking the north temperate zone as an example, in daytime in spring and summer, the mean LST showed a trend of LU12 > LU13 > LU10 > LU17; and in daytime in autumn, the mean LST showed a trend of LU10 > LU12 > LU13 > LU17. In daytime in winter, the mean LST showed a trend of LU17 > LU10 > LU13 > LU12, which was mainly due to the location of the north temperate zone in the northernmost part of China. This area is covered with a large amount of snow and ice in winter, resulting in a decrease in the LST to a lower temperature than that of water bodies. In the context of the frequent occurrence of the global urban heat island effect, the LULC types with lower LSTs in each climatic zone can be identified by comparing the difference in mean LSTs in different LULC types in different climatic zones. Then, the proportions of the areas of these LULC types can be increased to alleviate the LST. This study shows that the proportions of water bodies and grassland areas in each climate zone can be increased to reduce the LST.

4.3. Limitations

Based on the LST and LULC data of MODIS, this paper analyzed the mean LST difference of each LULC type under different climate zones and found that the LST of each LULC type was significantly different under different climate zones. There were also differences in LST under the same climate zone, and the LST can be effectively decreased by increasing the proportion of LULC types with lower LSTs. However, the relationship between LULC and LST was complex. This study analyzed the mean LST of different LULC types but did not analyze the landscape pattern of LULC and spatial autocorrelation of LST. In the future, the difference in LST caused by the spatial agglomeration characteristics of different LULC types should be analyzed. In addition, the division of climate zones in this study was mainly based on temperature, and in future studies, factors such as precipitation should be considered, and the climate zones may be further divided into arid and humid regions.

5. Conclusions

Using MOD11A2 and MCD12Q1 in 2020 as data sources, this study explored the seasonal differences in LST of each LULC type from the perspective of different climate zones in China. The main conclusions were as follows:
(1)
Croplands were mainly distributed in the northeast middle temperate, south temperate, and north subtropical zones. Barren lands were mainly distributed in the south temperate, middle temperate, and northwest plateau climate zones. Grasslands were mainly distributed in northwest China. Forests were mainly distributed in southern China subtropical, tropical, and northeastern temperate zones. Urban and built-up areas were mainly distributed in eastern coastal areas.
(2)
Overall, the maximum and minimum LSTs during the day were higher than those at night. LST also showed seasonal differences. During the daytime, the maximum LST decreased from that in summer (63.25 °C) > spring (46.55 °C) > autumn (37.50 °C) > winter (31.94 °C), whereas at night, the maximum LST decreased from that in summer (32.44 °C) > autumn (26.83 °C) > spring (26.78 °C) > winter (22.12 °C).
(3)
During the day, urban and built-up lands and barren lands had higher LST, and forests, grasslands, snow and ice, and water bodies had lower LST. At nighttime, LST decreased in urban and built-up lands; however, the LST remained high at nighttime in many LULC types. Barren lands showed a significant decrease in LST at nighttime, i.e., to temperatures even lower than those of water bodies.
These comparisons of the differences in LST of each LULC type under different climate zones and identification of the LULC types with lower LSTs provide an important reference for alleviating the increasing urban heat island effect, temperature improvement, and urban planning.

Author Contributions

Conceptualization, J.Y.; methodology, J.X.; software, J.X. and T.H.; validation, J.X., J.Y. and D.S.; formal analysis, J.X.; investigation, J.X.; resources, J.X.; data curation, J.X.; writing—original draft preparation, J.X.; writing—review and editing, J.X., C.S. and Z.S.; visualization, J.X.; supervision, J.X.; project administration, J.Y.; funding acquisition, J.Y. All authors have read and agreed to the published version of the manuscript.

Funding

This research was funded by the National Natural Science Foundation of China (Grant No. 41771178, 42030409), Basic Scientific Research Project (Key Project) of the Education Department of Liaoning Province (Grant No. LJKZ0964), the Fundamental Research Funds for the Central Universities (Grant No. N2111003), and Innovative Talents Support Program of Liaoning Province (Grant No. LR2017017).

Data Availability Statement

All data used in this study are sourced from open-source websites. These data can be found here: (https://ladsweb.modaps.eosdis.nasa.gov/search/, accessed on 1 January 2020).

Acknowledgments

This research was funded by the National Natural Science Foundation of China (Grant No. 41771178, 42030409), Basic Scientific Research Project (Key Project) of the Education Department of Liaoning Province (Grant No. LJKZ0964), the Fundamental Research Funds for the Central Universities (Grant No. N2111003), and Innovative Talents Support Program of Liaoning Province (Grant No. LR2017017).

Conflicts of Interest

The authors declare no conflict of interest.

Appendix A

Figure A1. Location of the metrological stations. DEM, Digital Elevation Model.
Land 11 01122 g0a1
Figure A2. Distribution map of LST and LULC in 2010. LU1–LU17 represent evergreen needleleaf forests, evergreen broadleaf forests, deciduous needleleaf forests, deciduous broadleaf forests, mixed forests, closed shrublands, open shrublands, woody savannas, savannas, grasslands, permanent wetlands, croplands, urban and built-up lands, cropland/natural vegetation mosaics, permanent snow and ice, barren land, and water bodies, respectively. (a) LST, (b) LULC.
Land 11 01122 g0a2
Figure A3. Distribution map of LST changes.
Land 11 01122 g0a3
Figure A4. Distribution map of LULC changes. Numbers 10–17 represent grasslands, croplands, urban and built-up lands, barren land, and water bodies, respectively.
Land 11 01122 g0a4

References

  1. Kafy, A.-A.; Faisal, A.-A.; Shuvo, R.M.; Naim, M.D.N.H.; Sikdar, M.D.S.; Chowdhury, R.R.; Islam, M.D.A.; Sarker, M.D.H.S.; Khan, M.D.H.H.; Kona, M.A. Remote Sensing Approach to Simulate the Land Use/Land Cover and Seasonal Land Surface Temperature Change Using Machine Learning Algorithms in a Fastest-Growing Megacity of Bangladesh. Remote Sens. Appl. Soc. Environ. 2021, 21, 100463. [Google Scholar] [CrossRef]
  2. Imran, H.M.; Hossain, A.; Islam, A.K.M.S.; Rahman, A.; Bhuiyan, M.A.E.; Paul, S.; Alam, A. Impact of Land Cover Changes on Land Surface Temperature and Human Thermal Comfort in Dhaka City of Bangladesh. Earth Syst. Environ. 2021, 5, 667–693. [Google Scholar] [CrossRef]
  3. Peng, J.; Ma, J.; Liu, Q.; Liu, Y.; Hu, Y.; Li, Y.; Yue, Y. Spatial-Temporal Change of Land Surface Temperature across 285 Cities in China: An Urban-Rural Contrast Perspective. Sci. Total Environ. 2018, 635, 487–497. [Google Scholar] [CrossRef]
  4. Li, Z.; Wu, F.; Ma, H.; Xu, Z.; Wang, S. Spatiotemporal Evolution and Relationship between Night Time Light and Land Surface Temperature: A Case Study of Beijing, China. Land 2022, 11, 548. [Google Scholar] [CrossRef]
  5. Wang, P.; Yu, P.; Lu, J.; Zhang, Y. The Mediation Effect of Land Surface Temperature in the Relationship between Land Use-Cover Change and Energy Consumption under Seasonal Variations. J. Clean. Prod. 2022, 340, 130804. [Google Scholar] [CrossRef]
  6. Eka Prasetya, T.A.; Devi, R.M.; Fitrahanjani, C.; Wahyuningtyas, T.; Muna, S. Systematic Assessment of the Warming Trend in Madagascar’s Mainland Daytime Land Surface Temperature from 2000 to 2019. J. Afr. Earth Sci. 2022, 189, 104502. [Google Scholar] [CrossRef]
  7. Yang, J.; Wang, Y.; Xiu, C.; Xiao, X.; Xia, J.; Jin, C. Optimizing Local Climate Zones to Mitigate Urban Heat Island Effect in Human Settlements. J. Clean. Prod. 2020, 275, 123767. [Google Scholar] [CrossRef]
  8. Wang, Y.; Yi, G.; Zhou, X.; Zhang, T.; Bie, X.; Li, J.; Ji, B. Spatial Distribution and Influencing Factors on Urban Land Surface Temperature of Twelve Megacities in China from 2000 to 2017. Ecol. Indic. 2021, 125, 107533. [Google Scholar] [CrossRef]
  9. Yang, J.; Wang, Y.; Xue, B.; Li, Y.; Xiao, X.; Xia, J.C.; He, B. Contribution of Urban Ventilation to the Thermal Environment and Urban Energy Demand: Different Climate Background Perspectives. Sci. Total Environ. 2021, 795, 148791. [Google Scholar] [CrossRef]
  10. Ren, J.; Yang, J.; Zhang, Y.; Xiao, X.; Xia, J.C.; Li, X.; Wang, S. Exploring Thermal Comfort of Urban Buildings Based on Local Climate Zones. J. Clean. Prod. 2022, 340, 130744. [Google Scholar] [CrossRef]
  11. Yan, Y.; Mao, K.; Shi, J.; Piao, S.; Shen, X.; Dozier, J.; Liu, Y.; Ren, H.; Bao, Q. Driving Forces of Land Surface Temperature Anomalous Changes in North America in 2002–2018. Sci. Rep. 2020, 10, 6931. [Google Scholar] [CrossRef] [PubMed]
  12. Zhou, L.; Hu, F.; Wang, B.; Wei, C.; Sun, D.; Wang, S. Relationship between Urban Landscape Structure and Land Surface Temperature: Spatial Hierarchy and Interaction Effects. Sustain. Cities Soc. 2022, 80, 103795. [Google Scholar] [CrossRef]
  13. Masoudi, M.; Tan, P.Y. Multi-Year Comparison of the Effects of Spatial Pattern of Urban Green Spaces on Urban Land Surface Temperature. Landsc. Urban Plan. 2019, 184, 44–58. [Google Scholar] [CrossRef]
  14. Duan, S.-B.; Li, Z.-L.; Wang, C.; Zhang, S.; Tang, B.-H.; Leng, P.; Gao, M.-F. Land-Surface Temperature Retrieval from Landsat 8 Single-Channel Thermal Infrared Data in Combination with NCEP Reanalysis Data and ASTER GED Product. Int. J. Remote Sens. 2019, 40, 1763–1778. [Google Scholar] [CrossRef]
  15. Roy, S.; Pandit, S.; Eva, E.A.; Bagmar, M.D.S.H.; Papia, M.; Banik, L.; Dube, T.; Rahman, F.; Razi, M.A. Examining the Nexus between Land Surface Temperature and Urban Growth in Chattogram Metropolitan Area of Bangladesh Using Long Term Landsat Series Data. Urban Clim. 2020, 32, 100593. [Google Scholar] [CrossRef]
  16. Diaz, L.R.; Santos, D.C.; Käfer, P.S.; da Rocha, N.S.; da Costa, S.T.L.; Kaiser, E.A.; Rolim, S.B.A. Land Surface Temperature Retrieval Using High-Resolution Vertical Profiles Simulated by WRF Model. Atmosphere 2021, 12, 1436. [Google Scholar] [CrossRef]
  17. Peng, J.; Jia, J.; Liu, Y.; Li, H.; Wu, J. Seasonal Contrast of the Dominant Factors for Spatial Distribution of Land Surface Temperature in Urban Areas. Remote Sens. Environ. 2018, 215, 255–267. [Google Scholar] [CrossRef]
  18. Sekertekin, A.; Bonafoni, S. Land Surface Temperature Retrieval from Landsat 5, 7, and 8 over Rural Areas: Assessment of Different Retrieval Algorithms and Emissivity Models and Toolbox Implementation. Remote Sens. 2020, 12, 294. [Google Scholar] [CrossRef] [Green Version]
  19. Portela, C.I.; Massi, K.G.; Rodrigues, T.; Alcântara, E. Impact of Urban and Industrial Features on Land Surface Temperature: Evidences from Satellite Thermal Indices. Sustain. Cities Soc. 2020, 56, 102100. [Google Scholar] [CrossRef]
  20. Deng, Y.; Wang, S.; Bai, X.; Tian, Y.; Wu, L.; Xiao, J.; Chen, F.; Qian, Q. Relationship among Land Surface Temperature and LUCC, NDVI in Typical Karst Area. Sci. Rep. 2018, 8, 641. [Google Scholar] [CrossRef]
  21. Ermida, S.L.; Soares, P.; Mantas, V.; Göttsche, F.-M.; Trigo, I.F. Google Earth Engine Open-Source Code for Land Surface Temperature Estimation from the Landsat Series. Remote Sens. 2020, 12, 1471. [Google Scholar] [CrossRef]
  22. Guo, A.; Yang, J.; Sun, W.; Xiao, X.; Xia Cecilia, J.; Jin, C.; Li, X. Impact of Urban Morphology and Landscape Characteristics on Spatiotemporal Heterogeneity of Land Surface Temperature. Sustain. Cities Soc. 2020, 63, 102443. [Google Scholar] [CrossRef]
  23. Wu, C.; Li, J.; Wang, C.; Song, C.; Chen, Y.; Finka, M.; La Rosa, D. Understanding the Relationship between Urban Blue Infrastructure and Land Surface Temperature. Sci. Total Environ. 2019, 694, 133742. [Google Scholar] [CrossRef]
  24. Jia, A.; Ma, H.; Liang, S.; Wang, D. Cloudy-Sky Land Surface Temperature from VIIRS and MODIS Satellite Data Using a Surface Energy Balance-Based Method. Remote Sens. Environ. 2021, 263, 112566. [Google Scholar] [CrossRef]
  25. Zhao, W.; Duan, S.-B. Reconstruction of Daytime Land Surface Temperatures under Cloud-Covered Conditions Using Integrated MODIS/Terra Land Products and MSG Geostationary Satellite Data. Remote Sens. Environ. 2020, 247, 111931. [Google Scholar] [CrossRef]
  26. Yao, R.; Wang, L.; Wang, S.; Wang, L.; Wei, J.; Li, J.; Yu, D. A Detailed Comparison of MYD11 and MYD21 Land Surface Temperature Products in Mainland China. Int. J. Digit. Earth 2020, 13, 1391–1407. [Google Scholar] [CrossRef]
  27. Yang, J.; Ren, J.; Sun, D.; Xiao, X.; Xia, J.C.; Jin, C.; Li, X. Understanding Land Surface Temperature Impact Factors Based on Local Climate Zones. Sustain. Cities Soc. 2021, 69, 102818. [Google Scholar] [CrossRef]
  28. Koko, A.F.; Wu, Y.; Abubakar, G.A.; Alabsi, A.A.N.; Hamed, R.; Bello, M. Thirty Years of Land Use/Land Cover Changes and Their Impact on Urban Climate: A Study of Kano Metropolis, Nigeria. Land 2021, 10, 1106. [Google Scholar] [CrossRef]
  29. Yang, J.; Zhan, Y.; Xiao, X.; Xia, J.C.; Sun, W.; Li, X. Investigating the Diversity of Land Surface Temperature Characteristics in Different Scale Cities Based on Local Climate Zones. Urban Clim. 2020, 34, 100700. [Google Scholar] [CrossRef]
  30. Song, J.; Chen, W.; Zhang, J.; Huang, K.; Hou, B.; Prishchepov, A.V. Effects of Building Density on Land Surface Temperature in China: Spatial Patterns and Determinants. Landsc. Urban Plan. 2020, 198, 103794. [Google Scholar] [CrossRef]
  31. Logan, T.M.; Zaitchik, B.; Guikema, S.; Nisbet, A. Night and Day: The Influence and Relative Importance of Urban Characteristics on Remotely Sensed Land Surface Temperature. Remote Sens. Environ. 2020, 247, 111861. [Google Scholar] [CrossRef]
  32. Choudhury, D.; Das, K.; Das, A. Assessment of Land Use Land Cover Changes and Its Impact on Variations of Land Surface Temperature in Asansol-Durgapur Development Region. Egypt. J. Remote Sens. Space Sci. 2019, 22, 203–218. [Google Scholar] [CrossRef]
  33. Tan, J.; Yu, D.; Li, Q.; Tan, X.; Zhou, W. Spatial Relationship between Land-Use/Land-Cover Change and Land Surface Temperature in the Dongting Lake Area, China. Sci. Rep. 2020, 10, 9245. [Google Scholar] [CrossRef] [PubMed]
  34. Ayanlade, A.; Aigbiremolen, M.I.; Oladosu, O.R. Variations in Urban Land Surface Temperature Intensity over Four Cities in Different Ecological Zones. Sci. Rep. 2021, 11, 20537. [Google Scholar] [CrossRef]
  35. Lambin, E.F.; Rounsevell, M.D.A.; Geist, H.J. Are Agricultural Land-Use Models Able to Predict Changes in Land-Use Intensity? Agric. Ecosyst. Environ. 2000, 82, 321–331. [Google Scholar] [CrossRef]
  36. Sinha, S.; Sharma, L.K.; Nathawat, M.S. Improved Land-Use/Land-Cover Classification of Semi-Arid Deciduous Forest Landscape Using Thermal Remote Sensing. Egypt. J. Remote Sens. Space Sci. 2015, 18, 217–233. [Google Scholar] [CrossRef] [Green Version]
  37. Karakuş, C.B. The Impact of Land Use/Land Cover (LULC) Changes on Land Surface Temperature in Sivas City Center and Its Surroundings and Assessment of Urban Heat Island. Asia Pac. J. Atmos. Sci. 2019, 55, 669–684. [Google Scholar] [CrossRef]
  38. Gohain, K.J.; Mohammad, P.; Goswami, A. Assessing the Impact of Land Use Land Cover Changes on Land Surface Temperature over Pune City, India. Quat. Int. 2021, 575–576, 259–269. [Google Scholar] [CrossRef]
  39. He, B.-J.; Zhao, Z.-Q.; Shen, L.-D.; Wang, H.-B.; Li, L.-G. An Approach to Examining Performances of Cool/Hot Sources in Mitigating/Enhancing Land Surface Temperature under Different Temperature Backgrounds Based on Landsat 8 Image. Sustain. Cities Soc. 2019, 44, 416–427. [Google Scholar] [CrossRef]
  40. Nurwanda, A.; Honjo, T. The Prediction of City Expansion and Land Surface Temperature in Bogor City, Indonesia. Sustain. Cities Soc. 2020, 52, 101772. [Google Scholar] [CrossRef]
  41. Schwaab, J.; Meier, R.; Mussetti, G.; Seneviratne, S.; Bürgi, C.; Davin, E.L. The Role of Urban Trees in Reducing Land Surface Temperatures in European Cities. Nat. Commun. 2021, 12, 6763. [Google Scholar] [CrossRef]
  42. Zhao, Z.-Q.; He, B.-J.; Li, L.-G.; Wang, H.-B.; Darko, A. Profile and Concentric Zonal Analysis of Relationships between Land Use/Land Cover and Land Surface Temperature: Case Study of Shenyang, China. Energy Build. 2017, 155, 282–295. [Google Scholar] [CrossRef]
  43. Geng, X.; Yu, Z.; Zhang, D.; Li, C.; Yuan, Y.; Wang, X. The Influence of Local Background Climate on the Dominant Factors and Threshold-Size of the Cooling Effect of Urban Parks. Sci. Total Environ. 2022, 823, 153806. [Google Scholar] [CrossRef] [PubMed]
  44. García-Santos, V.; Cuxart, J.; Martínez-Villagrasa, D.; Jiménez, M.A.; Simó, G. Comparison of Three Methods for Estimating Land Surface Temperature from Landsat 8-TIRS Sensor Data. Remote Sens. 2018, 10, 1450. [Google Scholar] [CrossRef] [Green Version]
  45. Phan, T.N.; Kappas, M. Application of MODIS Land Surface Temperature Data: A Systematic Literature Review and Analysis. J. Appl. Remote Sens. 2018, 12, 041501. [Google Scholar] [CrossRef]
  46. Cristóbal, J.; Jiménez-Muñoz, J.C.; Prakash, A.; Mattar, C.; Skoković, D.; Sobrino, J.A. An Improved Single-Channel Method to Retrieve Land Surface Temperature from the Landsat-8 Thermal Band. Remote Sens. 2018, 10, 431. [Google Scholar] [CrossRef] [Green Version]
  47. Xie, C.; Zhang, X.; Zhuang, L.; Zhu, R.; Guo, J. Analysis of Surface Temperature Variation of Lakes in China Using MODIS Land Surface Temperature Data. Sci. Rep. 2022, 12, 2415. [Google Scholar] [CrossRef]
  48. Liu, X.; Zhou, Y.; Yue, W.; Li, X.; Liu, Y.; Lu, D. Spatiotemporal Patterns of Summer Urban Heat Island in Beijing, China Using an Improved Land Surface Temperature. J. Clean. Prod. 2020, 257, 120529. [Google Scholar] [CrossRef]
  49. Yang, Q.; Huang, X.; Tang, Q. Irrigation Cooling Effect on Land Surface Temperature across China Based on Satellite Observations. Sci. Total Environ. 2020, 705, 135984. [Google Scholar] [CrossRef]
  50. Guha, S.; Govil, H.; Dey, A.; Gill, N. Analytical Study of Land Surface Temperature with NDVI and NDBI Using Landsat 8 OLI and TIRS Data in Florence and Naples City, Italy. Eur. J. Remote Sens. 2018, 51, 667–678. [Google Scholar] [CrossRef]
  51. Balew, A.; Korme, T. Monitoring Land Surface Temperature in Bahir Dar City and Its Surrounding Using Landsat Images. Egypt. J. Remote Sens. Space Sci. 2020, 23, 371–386. [Google Scholar] [CrossRef]
  52. Cai, Z.; Han, G.; Chen, M. Do Water Bodies Play an Important Role in the Relationship between Urban Form and Land Surface Temperature? Sustain. Cities Soc. 2018, 39, 487–498. [Google Scholar] [CrossRef]
  53. Govil, H.; Guha, S.; Dey, A.; Gill, N. Seasonal Evaluation of Downscaled Land Surface Temperature: A Case Study in a Humid Tropical City. Heliyon 2019, 5, e01923. [Google Scholar] [CrossRef] [Green Version]
  54. Duan, S.-B.; Li, Z.-L.; Li, H.; Göttsche, F.-M.; Wu, H.; Zhao, W.; Leng, P.; Zhang, X.; Coll, C. Validation of Collection 6 MODIS Land Surface Temperature Product Using in Situ Measurements. Remote Sens. Environ. 2019, 225, 16–29. [Google Scholar] [CrossRef] [Green Version]
  55. Yu, P.; Zhao, T.; Shi, J.; Ran, Y.; Jia, L.; Ji, D.; Xue, H. Global Spatiotemporally Continuous MODIS Land Surface Temperature Dataset. Sci. Data 2022, 9, 143. [Google Scholar] [CrossRef] [PubMed]
  56. Wan, Z.; Zhang, Y.; Zhang, Q.; Li, Z. Validation of the Land-Surface Temperature Products Retrieved from Terra Moderate Resolution Imaging Spectroradiometer Data. Remote Sens. Environ. 2002, 83, 163–180. [Google Scholar] [CrossRef]
  57. Sulla-Menashe, D.; Gray, J.M.; Abercrombie, S.P.; Friedl, M.A. Hierarchical Mapping of Annual Global Land Cover 2001 to Present: The MODIS Collection 6 Land Cover Product. Remote Sens. Environ. 2019, 222, 183–194. [Google Scholar] [CrossRef]
  58. Hadibasyir, H.Z.; Rijal, S.S.; Sari, D.R. Comparison of Land Surface Temperature During and Before the Emergence of COVID-19 Using Modis Imagery in Wuhan City, China. Forum Geografi 2020, 34, 1–15. [Google Scholar] [CrossRef]
  59. Parida, B.R.; Bar, S.; Kaskaoutis, D.; Pandey, A.C.; Polade, S.D.; Goswami, S. Impact of COVID-19 Induced Lockdown on Land Surface Temperature, Aerosol, and Urban Heat in Europe and North America. Sustain. Cities Soc. 2021, 75, 103336. [Google Scholar] [CrossRef]
  60. Yang, J.; Xin, J.; Zhang, Y.; Xiao, X.; Xia, J.C. Contributions of Sea–Land Breeze and Local Climate Zones to Daytime and Nighttime Heat Island Intensity. NPJ Urban Sustain. 2022, 2, 12. [Google Scholar] [CrossRef]
  61. Shi, Z.; Yang, J.; Zhang, Y.; Xiao, X.; Xia, J.C. Urban Ventilation Corridors and Spatiotemporal Divergence Patterns of Urban Heat Island Intensity: A Local Climate Zone Perspective. Environ. Sci. Pollut. Res. 2022, 29, 1–13. [Google Scholar] [CrossRef] [PubMed]
  62. Hu, Y.; Dai, Z.; Guldmann, J.-M. Greenspace Configuration Impact on the Urban Heat Island in the Olympic Area of Beijing. Environ. Sci. Pollut. Res. 2021, 28, 33096–33107. [Google Scholar] [CrossRef] [PubMed]
  63. Burnett, M.; Chen, D. The Impact of Seasonality and Land Cover on the Consistency of Relationship between Air Temperature and LST Derived from Landsat 7 and MODIS at a Local Scale: A Case Study in Southern Ontario. Land 2021, 10, 672. [Google Scholar] [CrossRef]
  64. Zhao, Z.; Sharifi, A.; Dong, X.; Shen, L.; He, B.-J. Spatial Variability and Temporal Heterogeneity of Surface Urban Heat Island Patterns and the Suitability of Local Climate Zones for Land Surface Temperature Characterization. Remote Sens. 2021, 13, 4338. [Google Scholar] [CrossRef]
  65. Moisa, M.B.; Dejene, I.N.; Merga, B.B.; Gemeda, D.O. Impacts of Land Use/Land Cover Dynamics on Land Surface Temperature Using Geospatial Techniques in Anger River Sub-Basin, Western Ethiopia. Environ. Earth Sci. 2022, 81, 99. [Google Scholar] [CrossRef]
  66. Chen, Y.; Yang, J.; Yang, R.; Xiao, X.; Xia, J.C. Contribution of Urban Functional Zones to the Spatial Distribution of Urban Thermal Environment. Build. Environ. 2022, 216, 109000. [Google Scholar] [CrossRef]
  67. Dissanayake, D. Land Use Change and Its Impacts on Land Surface Temperature in Galle City, Sri Lanka. Climate 2020, 8, 65. [Google Scholar] [CrossRef]
  68. Chen, L.; Wang, X.; Cai, X.; Yang, C.; Lu, X. Seasonal Variations of Daytime Land Surface Temperature and Their Underlying Drivers over Wuhan, China. Remote Sens. 2021, 13, 323. [Google Scholar] [CrossRef]
  69. Du, P.; Chen, J.; Bai, X.; Han, W. Understanding the Seasonal Variations of Land Surface Temperature in Nanjing Urban Area Based on Local Climate Zone. Urban Clim. 2020, 33, 100657. [Google Scholar] [CrossRef]
Figure 1. Location of the study area. DEM, Digital Elevation Model.
Land 11 01122 g001
Figure 2. Land use/land cover (LULC) spatial distribution map.
Land 11 01122 g002
Figure 3. Land surface temperature (LST) spatial distribution maps.
Land 11 01122 g003
Figure 4. Mean land surface temperature (LST) values of different land use/land cover (LULC) types in the daytime and nighttime, in each season and annually. LU1–LU17 represent evergreen needleleaf forests, evergreen broadleaf forests, deciduous needleleaf forests, deciduous broadleaf forests, mixed forests, closed shrublands, open shrublands, woody savannas, savannas, grasslands, permanent wetlands, croplands, urban and built-up lands, cropland/natural vegetation mosaics, permanent snow and ice, barren land, and water bodies, respectively. (a) Daytime; (b) nighttime.
Land 11 01122 g004
Figure 5. Distribution map of mean daytime and nighttime annual land surface temperature (LST) in different land use/land cover (LULC) types in different climate zones of China. LU10, LU12, LU13, LU16, and LU17 represent grasslands, croplands, urban and built-up lands, barren land, and water bodies, respectively. (a) Daytime; (b) nighttime.
Land 11 01122 g005
Figure 6. Distribution map of daytime and nighttime seasonal mean land surface temperatures (LSTs) of different land use/land cover (LULC) types in different climate zones of China. LU10, LU12, LU13, LU16, and LU17 represent grasslands, croplands, urban and built-up areas, barren land, and water bodies, respectively.
Land 11 01122 g006
Table 1. Data sources and description.
Data TypeTime/YearResolutionSourcesData Processing
MOD11A22020, 20101 kmhttps://ladsweb.modaps.eosdis.nasa.gov/search/
(accessed date: 2 July 2022)
Projection and format conversion
MCD12Q12020, 2010500 mhttps://ladsweb.modaps.eosdis.nasa.gov/search/
(accessed date: 2 July 2022)
Projection and format conversion
GMTED2010-900 mDEM data included with ENVI 5.3.1 softwareExtraction using China’s administrative boundaries as a mask
Climate zones--https://www.resdc.cn/
(accessed date: 30 May 2022)
-
Table 2. Proportion of land use/land cover (LULC) types in different climate zones.
Plateau Climate ZoneMiddle TropicalNorth TropicalSouth SubtropicalMiddle SubtropicalNorth SubtropicalSouth TemperateMiddle TemperateNorth Temperate
LU10.015-0.0030.0090.0240.0090.0000.0000.000
LU20.0120.2010.2840.2450.0940.009-0.000-
LU30.000---0.000-0.0000.0000.070
LU40.0010.0030.0010.0000.0240.0780.0420.0760.096
LU50.0130.0000.0280.0350.1100.0900.0110.0090.062
LU60.000-0.0000.0000.000-0.0020.000-
LU70.0030.000-0.0000.000-0.0000.0010.000
LU80.0180.2030.1950.2080.3060.2260.0120.0230.668
LU90.0050.2980.2850.3030.2570.1490.0330.0250.056
LU100.5220.1040.0200.0150.0230.0170.1120.4560.038
LU110.0010.0050.0060.0070.0020.0150.0020.0020.000
LU120.0030.1070.0480.0440.0310.2510.3370.1700.006
LU130.0000.0190.0230.0480.0150.0490.0310.0060.003
LU140.0000.0430.1000.0750.1090.0730.0040.0040.001
LU150.014---0.0000.0000.0030.002-
LU160.3810.0000.0010.0010.0010.0000.4040.222-
LU170.0130.0160.0070.0080.0050.0340.0060.0040.000
Table 3. Mean land surface temperatures (LSTs) of different land use/ land cover (LULC) types in the day and night, in each season and annually.
LST (°C)Daytime Nighttime
LULC TypesAnnualSpringSummerAutumnWinterAnnualSpringSummerAutumnWinter
LU113.8916.8419.4714.087.424.934.999.446.26−0.35
LU221.9324.2827.2921.9015.7915.1916.4020.6415.549.54
LU33.449.6920.991.75−18.13−5.30−3.1711.97−6.35−23.34
LU411.5715.7623.7011.20−4.502.703.6315.672.64−10.79
LU516.2419.4324.1815.706.208.299.1515.998.03−0.39
LU615.9520.9526.8014.382.065.756.2917.605.70−6.83
LU720.6024.0733.2120.714.24−5.11−6.086.89−4.29−16.99
LU818.1821.6026.4617.467.099.2710.4018.258.90−0.39
LU921.4825.0728.8620.6911.8611.7613.2020.1511.523.00
LU1014.8919.5827.0214.80−1.88−4.36−3.927.91−3.51−17.65
LU1117.8019.6426.9018.606.8811.2512.0421.7712.350.40
LU1218.2723.4830.1818.061.815.236.2219.095.36−9.21
LU1323.1826.6534.0223.1010.0511.5612.5122.9311.810.35
LU1423.3826.4030.5022.5213.3113.7215.1422.2213.224.57
LU150.331.3511.161.76−12.87−13.46−14.83−2.49−11.01−24.22
LU1621.4625.5337.5320.212.13−2.73−1.4910.77−3.30−16.89
LU1711.2911.3320.7613.74−0.286.294.4816.969.87−6.14
LU1–LU17 represent evergreen needleleaf forests, evergreen broadleaf forests, deciduous needleleaf forests, deciduous broadleaf forests, mixed forests, closed shrublands, open shrublands, woody savannas, savannas, grasslands, permanent wetlands, croplands, urban and built-up lands, cropland/natural vegetation mosaics, permanent snow and ice, barren land, and water bodies, respectively.
Table 4. Variations in land surface temperatures (LSTs) for different land use/land cover (LULC) types from 2010 to 2020.
Middle Subtropical2020South Subtropical2020
LST Changes (°C)LU10LU12LU13LU16LU17LST Changes (°C)LU10LU12LU13LU16LU17
2010LU10−1.09−1.42−0.51−0.60−0.562010LU10−1.06−0.790.08−0.12−0.14
LU12−1.37−1.12−0.56−2.29−0.69LU12−0.57−0.25−0.08−0.06−0.24
LU13−0.71−0.60−0.01−0.84−0.34LU130.07−0.190.280.180.27
LU16−0.490.27−0.22−0.56−0.27LU160.390.640.420.140.13
LU17−0.48−0.68−0.33−0.12−0.16LU17−0.23−0.270.330.17−0.17
South temperate2020Plateau Climate Zone2020
LST Changes (°C)LU10LU12LU13LU16LU17LST Changes (°C)LU10LU12LU13LU16LU17
2010LU10−1.88−1.70−0.61−2.51−0.192010LU10−2.25−2.57−2.44−2.06−2.03
LU12−1.07−0.70−0.39−0.89−0.32LU12−2.54−2.77−2.48−2.70-
LU13−0.84−0.54−0.56−1.87−0.47LU13−2.51−2.67−2.52−3.15-
LU16−3.07−3.63−1.43−3.09−0.79LU16−1.96−1.94−2.54−2.12−2.43
LU17−0.32−0.30−0.36−0.45−0.02LU17−1.89--−1.77−1.79
North Temperate2020North Subtropical2020
LST Changes (°C)LU10LU12LU13LU16LU17LST Changes (°C)LU10LU12LU13LU16LU17
2010LU10−2.49−3.17−2.73--2010LU10−1.52−0.96−0.57−1.13−0.28
LU12−2.63−3.15−2.87--LU12−0.77−0.50−0.40−0.20−0.39
LU13−3.52−2.83−3.65--LU13−0.70−0.40−0.70−0.28−0.32
LU16-----LU16−1.40−0.83−0.53−1.36−0.10
LU17-----LU17−0.53−0.56−0.39−0.10−0.09
Middle Tropical2020Middle Temperate2020
LST Changes (°C)LU10LU12LU13LU16LU17LST Changes (°C)LU10LU12LU13LU16LU17
2010LU10−0.71−0.83−0.43 −0.612010LU10−2.62−2.22−2.20−2.00−1.78
LU12−0.84−0.68−0.38−0.79−0.42LU12−1.65−1.84−1.29−1.79−1.10
LU13−0.460.00−0.09--LU13−2.41−1.41−1.74−2.45−0.39
LU16−0.44-−0.30−0.15-LU16−2.12−2.84−2.35−2.43−3.33
LU17−0.53−0.88−1.07−0.03−0.37LU17−1.26−0.95−0.55−1.71−0.55
LU10, LU12, LU13, LU16, and LU17 represent grasslands, croplands, urban and built-up lands, barren land, and water bodies, respectively. LST changes.
Publisher’s Note: MDPI stays neutral with regard to jurisdictional claims in published maps and institutional affiliations.

