Article

Landscape Pattern Vulnerability of the Eastern Hengduan Mountains, China and Response to Elevation and Artificial Disturbance

1
School of Architecture, Southwest Jiaotong University, Chengdu 611756, China
2
China Railway Eryuan Engineering Group Co., Ltd., Chengdu 610031, China
*
Author to whom correspondence should be addressed.
Land 2022, 11(7), 1110; https://doi.org/10.3390/land11071110
Submission received: 19 June 2022 / Revised: 16 July 2022 / Accepted: 18 July 2022 / Published: 19 July 2022
(This article belongs to the Topic Climate Change and Environmental Sustainability)

Abstract

:
The eastern Hengduan Mountains are located in the transition zone between the Qinghai-Tibet Plateau and the Sichuan Basin and are important for global biodiversity and water conservation in China. However, their landscape pattern vulnerability index (LVI) and its influencing factors have not been systematically studied. Therefore, the spatial distribution patterns, LVI, and the landscape artificial disturbance intensity (LHAI) of Ganzi Prefecture were analyzed using ArcGIS software based on landscape data and Digital Elevation Model (DEM) digital elevation data. Then, the LVI response to LHAI and elevation was discussed. The results showed that Ganzi Prefecture was dominated by low- and middle-LVI areas, together accounting for 56.45% of the total area. LVI values were highest in the northern regions, followed by the southern and eastern regions. Batang and Derong counties had the highest LVI values. Most areas in Ganzi Prefecture had very low- or low-LHAI values, accounting for 81.48% of the total area, whereas high-LHAI areas accounted for 2.32% of the total area. Both the LVI and LHAI of Ganzi Prefecture had clustered distributions. Spearman analysis indicated that when elevation exceeded 4500 m, it was the most important factor affecting LVI and LHAI. In the range of 4500–5400 m, the relationship between elevation and LVI shifted from a weak positive correlation to a negative correlation, whereas LHAI was positively correlated with elevation. In addition, LVI also responded significantly to LHAI. However, the relationship kept changing as elevation increased. Hence, the ecological vulnerability of high elevation areas above 4500 m deserves greater attention. In addition, pasture areas in the upstream reaches of the Yalong River in the northern region, the coastal area in the downstream reaches of the Jinsha River in the southern region, and the eastern mining area, should be prioritized for protection and restoration. This research provides a basis for appropriate environmental planning mechanisms and policy protections at the landscape level.

1. Introduction

Landscape pattern refers to the spatial arrangement and combination of landscape elements and is a spatially integrated expression of landscape heterogeneity [1]. Landscape pattern is linked to various ecological processes. Previous studies have found a strong correlation between the landscape pattern index and ecological vulnerability [2]. Landscape pattern vulnerability refers to the degree of vulnerability exhibited by the interactions between landscape patterns and ecological processes [3]. It reflects the sensitivity and adaptive capacity of landscape patterns to human activities and natural disturbances, which lead to changes in the structure, function, and characteristics of the regional landscape system [4,5,6].
On the one hand, cultural and political influences play a significant role in constructing landscape patterns. Population growth, urbanization, and land development and utilization inevitably cause changes in landscape patterns [7,8]. Ecological land, such as forests and grasslands, may be converted into agricultural and construction lands [9]. The original single, holistic, and continuous natural landscape can be converted to a complex, heterogeneous, and discontinuous mosaic of mixed patches. Accordingly, landscapes in rapidly expanding urban areas exhibit a high degree of fragmentation, which represents further ecological fragility [10]. On the other hand, landscape patterns are also affected by global climate [11,12], regional topography, and the soil environment [13]. Natural factors (i.e., water and heat conditions, slope, and elevation) restrict the spatial distribution of land-use types. At the same time, the environment is highly sensitive to land-use changes, and unsuitable land uses can easily aggravate local land degradation, degrade ecosystems, and deteriorate environments [14].
The current research on mountain landscape patterns has mainly focused on understanding temporal and spatial changes [15]. Relatively complete methods for assessing landscape ecological security [16], ecological risk [17], and pattern sensitivity [18] have been developed. In addition, landscape pattern vulnerability studies continue to evolve. The plural definition of vulnerability has diversified the framework and methodology for assessing vulnerability. Bourgoin et al. [19] developed a rigorous methodological framework to assess highland forest ecological vulnerability. However, the popular proxy indicator-based approach has been used to analyze the relationship between landscape spatial patterns and ecological processes [20].
Feyissa et al. [21] calculated landscape structure indices using a patch-corridor-matrix ecological model for patches on Mount Wechecha, Ethiopia, and found that they declined in all years. Kumar et al. [22] selected six vulnerability indicators using the analytical hierarchy process (AHP) to assess the forest landscape vulnerability of the Western Himalayan region, India. Campagnaro et al. [23] used transition matrices to analyze spatial and temporal changes in a pair of alpine watersheds in Italy. Kulakowski et al. [24] explored changes in forest landscape structure and the factors influencing forest landscape patterns in the Swiss Alps using landscape indices such as patch density, number of patches, and Shannon diversity. Song et al. [25] established an evaluation index system that included ecological sensitivity (ES), natural and social pressure (NSP), and recovery capacity (ERC) aspects to explore the ecological condition of China’s southwest mountainous areas at the regional, county, and grade levels. Due to the complex effect factors, it is difficult to measure landscape pattern vulnerability. Although indicators are useful when synthesizing complex situations for vulnerability assessment into a single number, the selection of appropriate indicators is the hardest step in mountain vulnerability assessments.
In recent years, researchers have begun to use landscape indices to evaluate landscape pattern vulnerability. According to the definition of ecological vulnerability and the ecological significance of landscape indices, Sun et al. [4] constructed a new evaluation index for landscape pattern vulnerability based on the landscape sensitivity index (LSI) and the landscape adaptation index (LAI). The advantage of this method is that it establishes a direct link between landscape patterns and ecological issues at a large scale, and it guides the integration of resources and spatial restructuring of landscape patterns within a study area. Since then, many researchers have used this method for conducting spatial and temporal variability analyses of landscape pattern vulnerability for basin [26], wetland [27], watershed [28], urban [3], and mining landscapes [29]. Accordingly, the above studies have verified the feasibility of this method in different landscape environments.
Recently, there has been a fast-growing interest in assessing mountain vulnerability for environmental and socio-economic disciplines. Liu et al. [30] used remote sensing (RS) and Geography information systems (GIS) techniques to show that human activities were a decisive factor causing landscape vulnerability changes in the eastern part of the Qilian Mountains. Guo et al. [31] used a remote sensing evaluation system to find that human activities, precipitation, and topography were significant factors affecting the vulnerability of southwest karst mountain ecosystems. Similarly, Zhang et al. [32] found that geology and topography were the two major controlling factors affecting the landscape pattern vulnerability of the Guizhou karst region in China. Song et al. [25] showed that mountain pattern vulnerability in China’s Yunnan, Sichuan, and Gansu Provinces was greatly influenced by human economic activities. Donoso et al. [33] found that mountain landscape vulnerability suffers constant modifications due to the agricultural practices of dwellers and migrants. Jha et al. [34] indicated that mountain vulnerability varied along elevation gradients due to variations in socioeconomic profiles, livelihood requirements, resource availability, accessibility, utilization patterns, and climate risks. Schneiderbauer et al. [35] believed that mountain regions are vulnerable areas that are significantly exposed and susceptible to climate change.
The Hengduan Mountains form the longest and widest north-south-facing mountain range of southwestern China, with a total area of 449,841.00 km2 [36]. They are located at the junction of Sichuan Province, Yunnan Province, and Tibet. Due to the elevation differences, short growing season [37], intensive soil erosion [38], vertical climate differentiation [39], increasing human activities, and irrational land-use patterns [40], the Hengduan Mountains ecosystems are extremely vulnerable [41]. At the same time, due to the highly heterogeneous environment, the area has become the most important conservation area and a critical biodiversity hotspot in China [42]. However, the rapid development of urbanization has put a lot of pressure on its eco-environment, and it is necessary to carry out a series of vulnerability assessments of the area. Until now, the Hengduan Mountains landscape patterns had not been analyzed through the vulnerability lens using spatio-temporal landscape indicators. Studying the effect of elevation differences on the vulnerability of landscape patterns for mountainous areas is rare; however, the elevation factor cannot be ignored as both human activities and landscape patterns are affected by elevation to a certain extent. The above research gaps can be filled in this study. The data in this paper can help local decision-makers in establishing a good mechanism for the optimal allocation of various factors such as the land use, human and natural resources, as well as guiding the structure and layout of industries such as agriculture, animal husbandry, tourism, and energy. This will contribute to a balanced relationship between local socio-economic development and ecological conservation. In addition, the findings of this study can provide a reference point for monitoring future changes in the landscape.
To monitor and precisely quantify landscape patterns and identify ecosystem conservation strategies, the objective of this study was to produce spatial indicators at the landscape scale using multidimensional remote sensing in order to assess the ecological vulnerability of the Hengduan Mountains. The specific steps were: (a) to use GIS and landscape indicators to calculate the landscape pattern vulnerability index (LVI) and the landscape artificial disturbance intensity (LHAI) of Ganzi Prefecture, located in the eastern Hengduan Mountains; (b) to clarify the spatial differentiation characteristics of the LVI and LHAI in this region; and (c) to evaluate the univariate and multivariate effects of elevation and the LHAI on LVI.

2. Materials and Methods
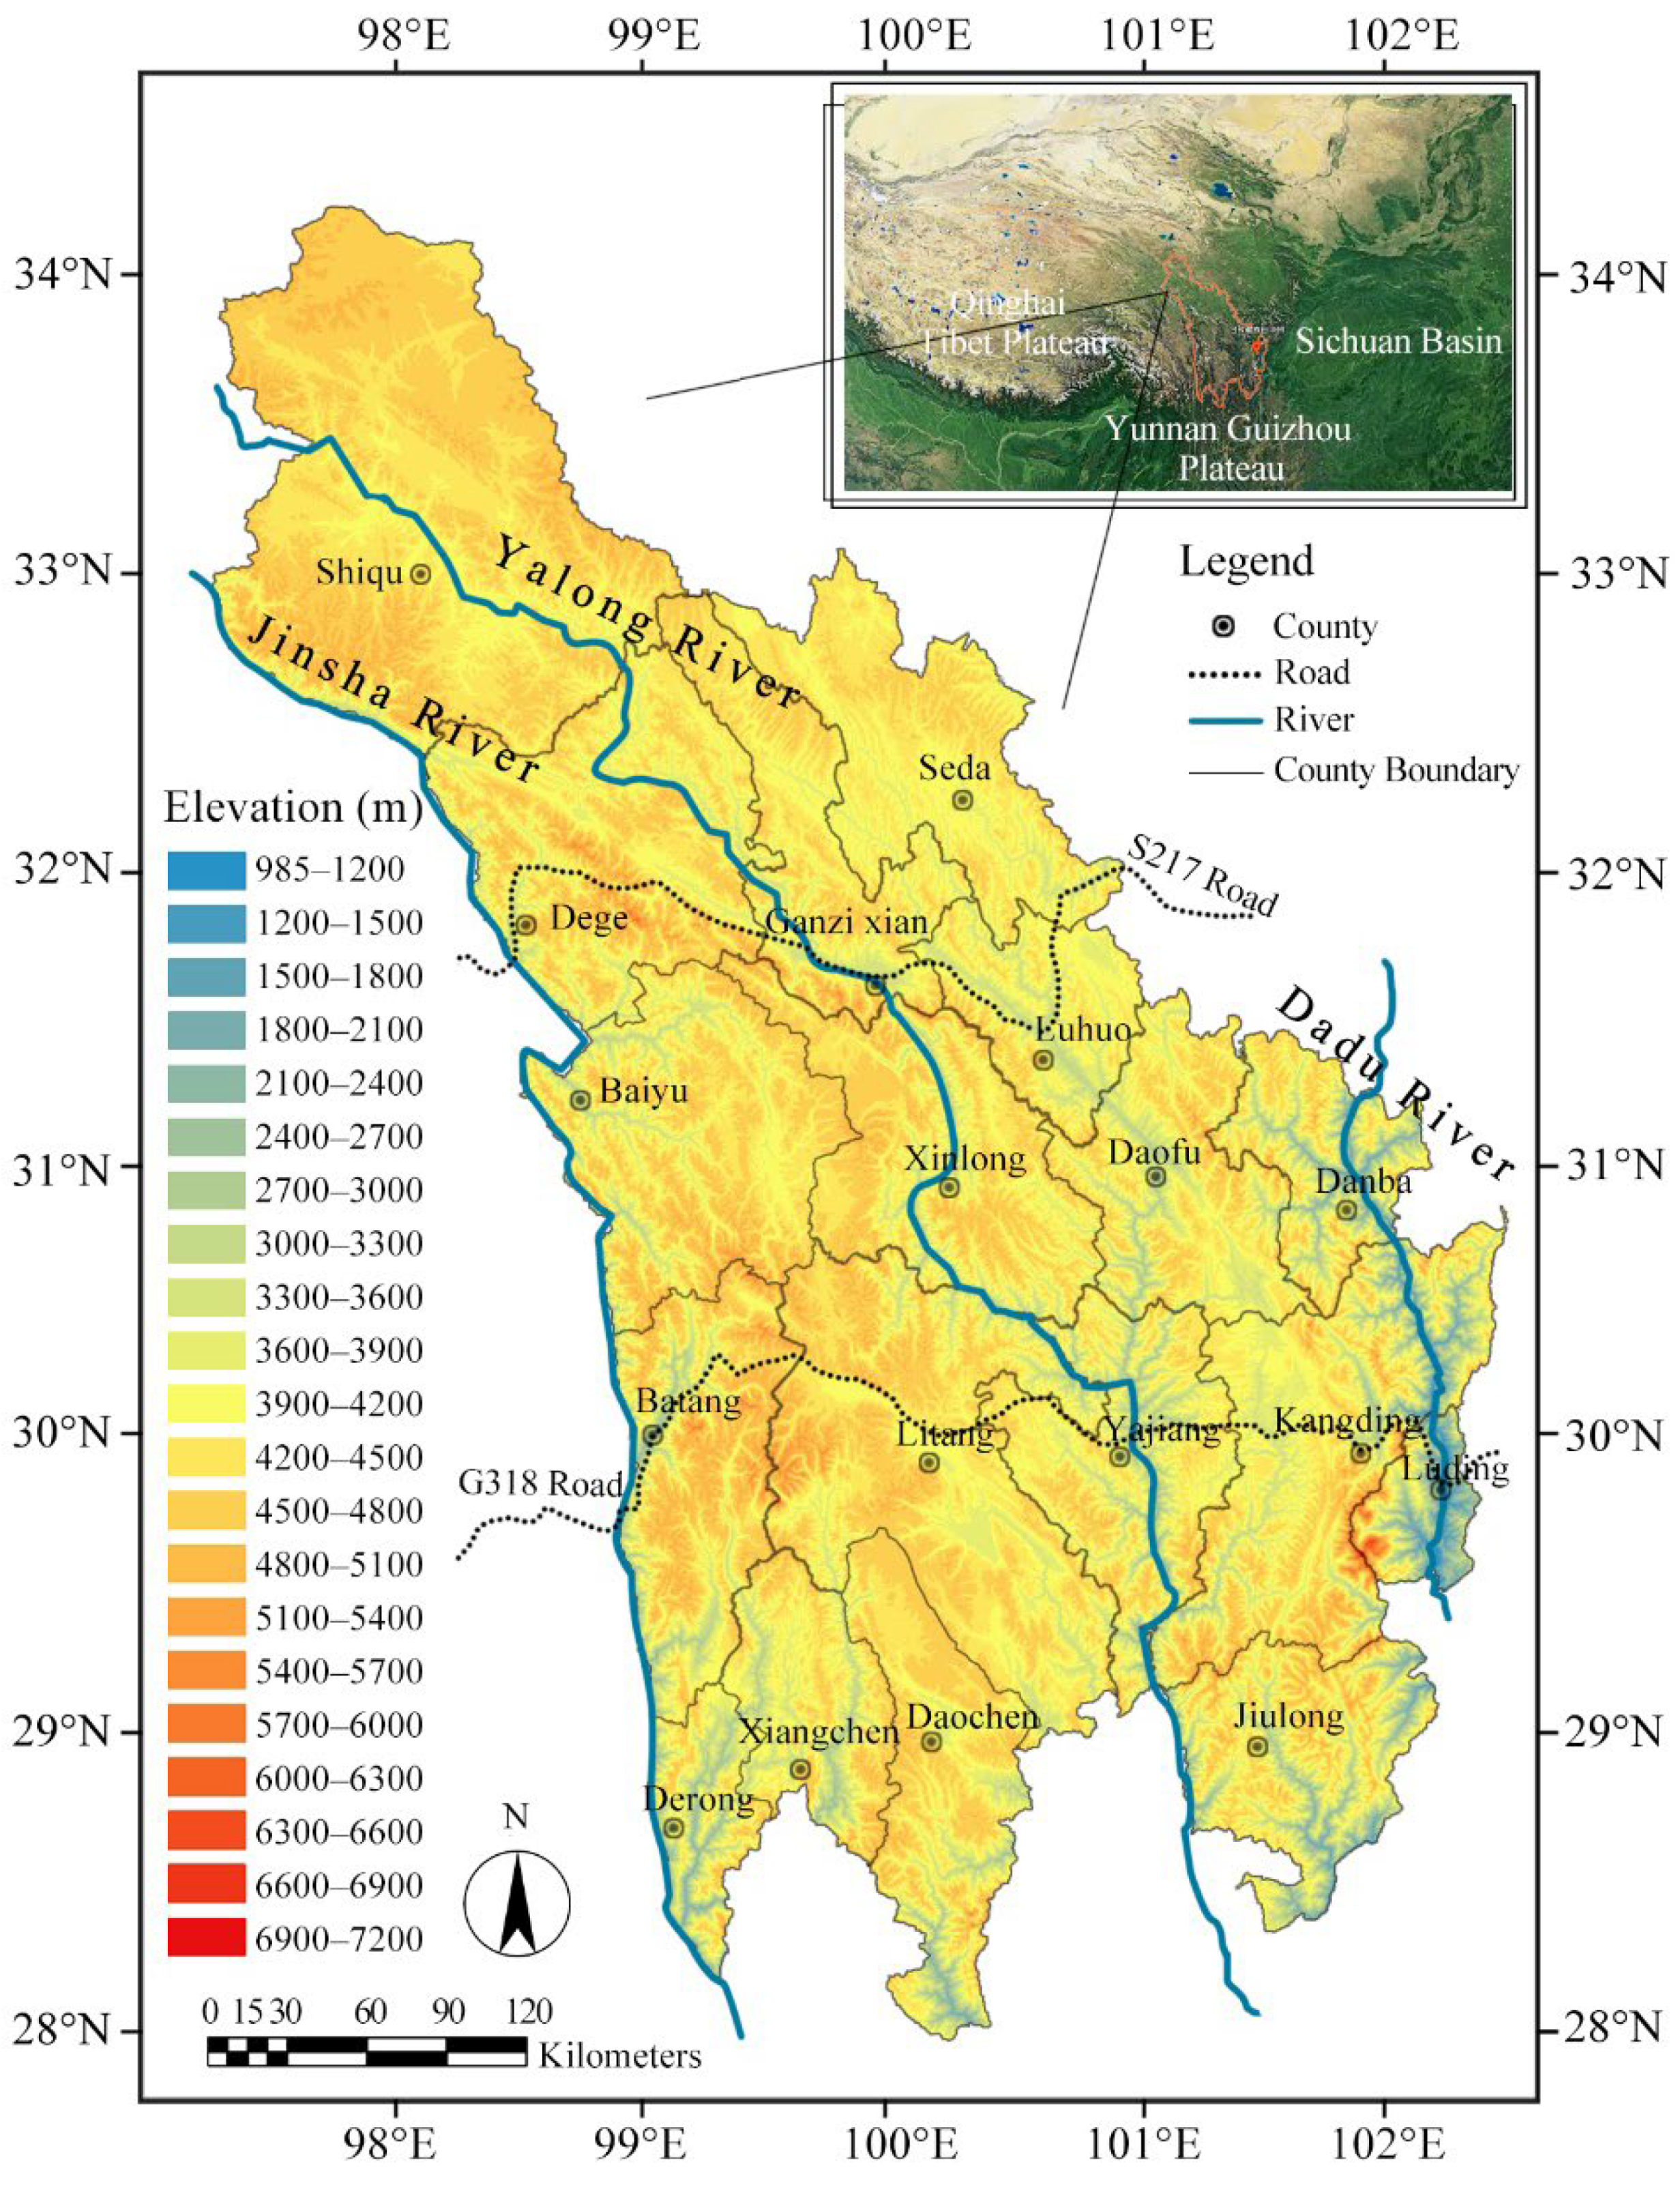
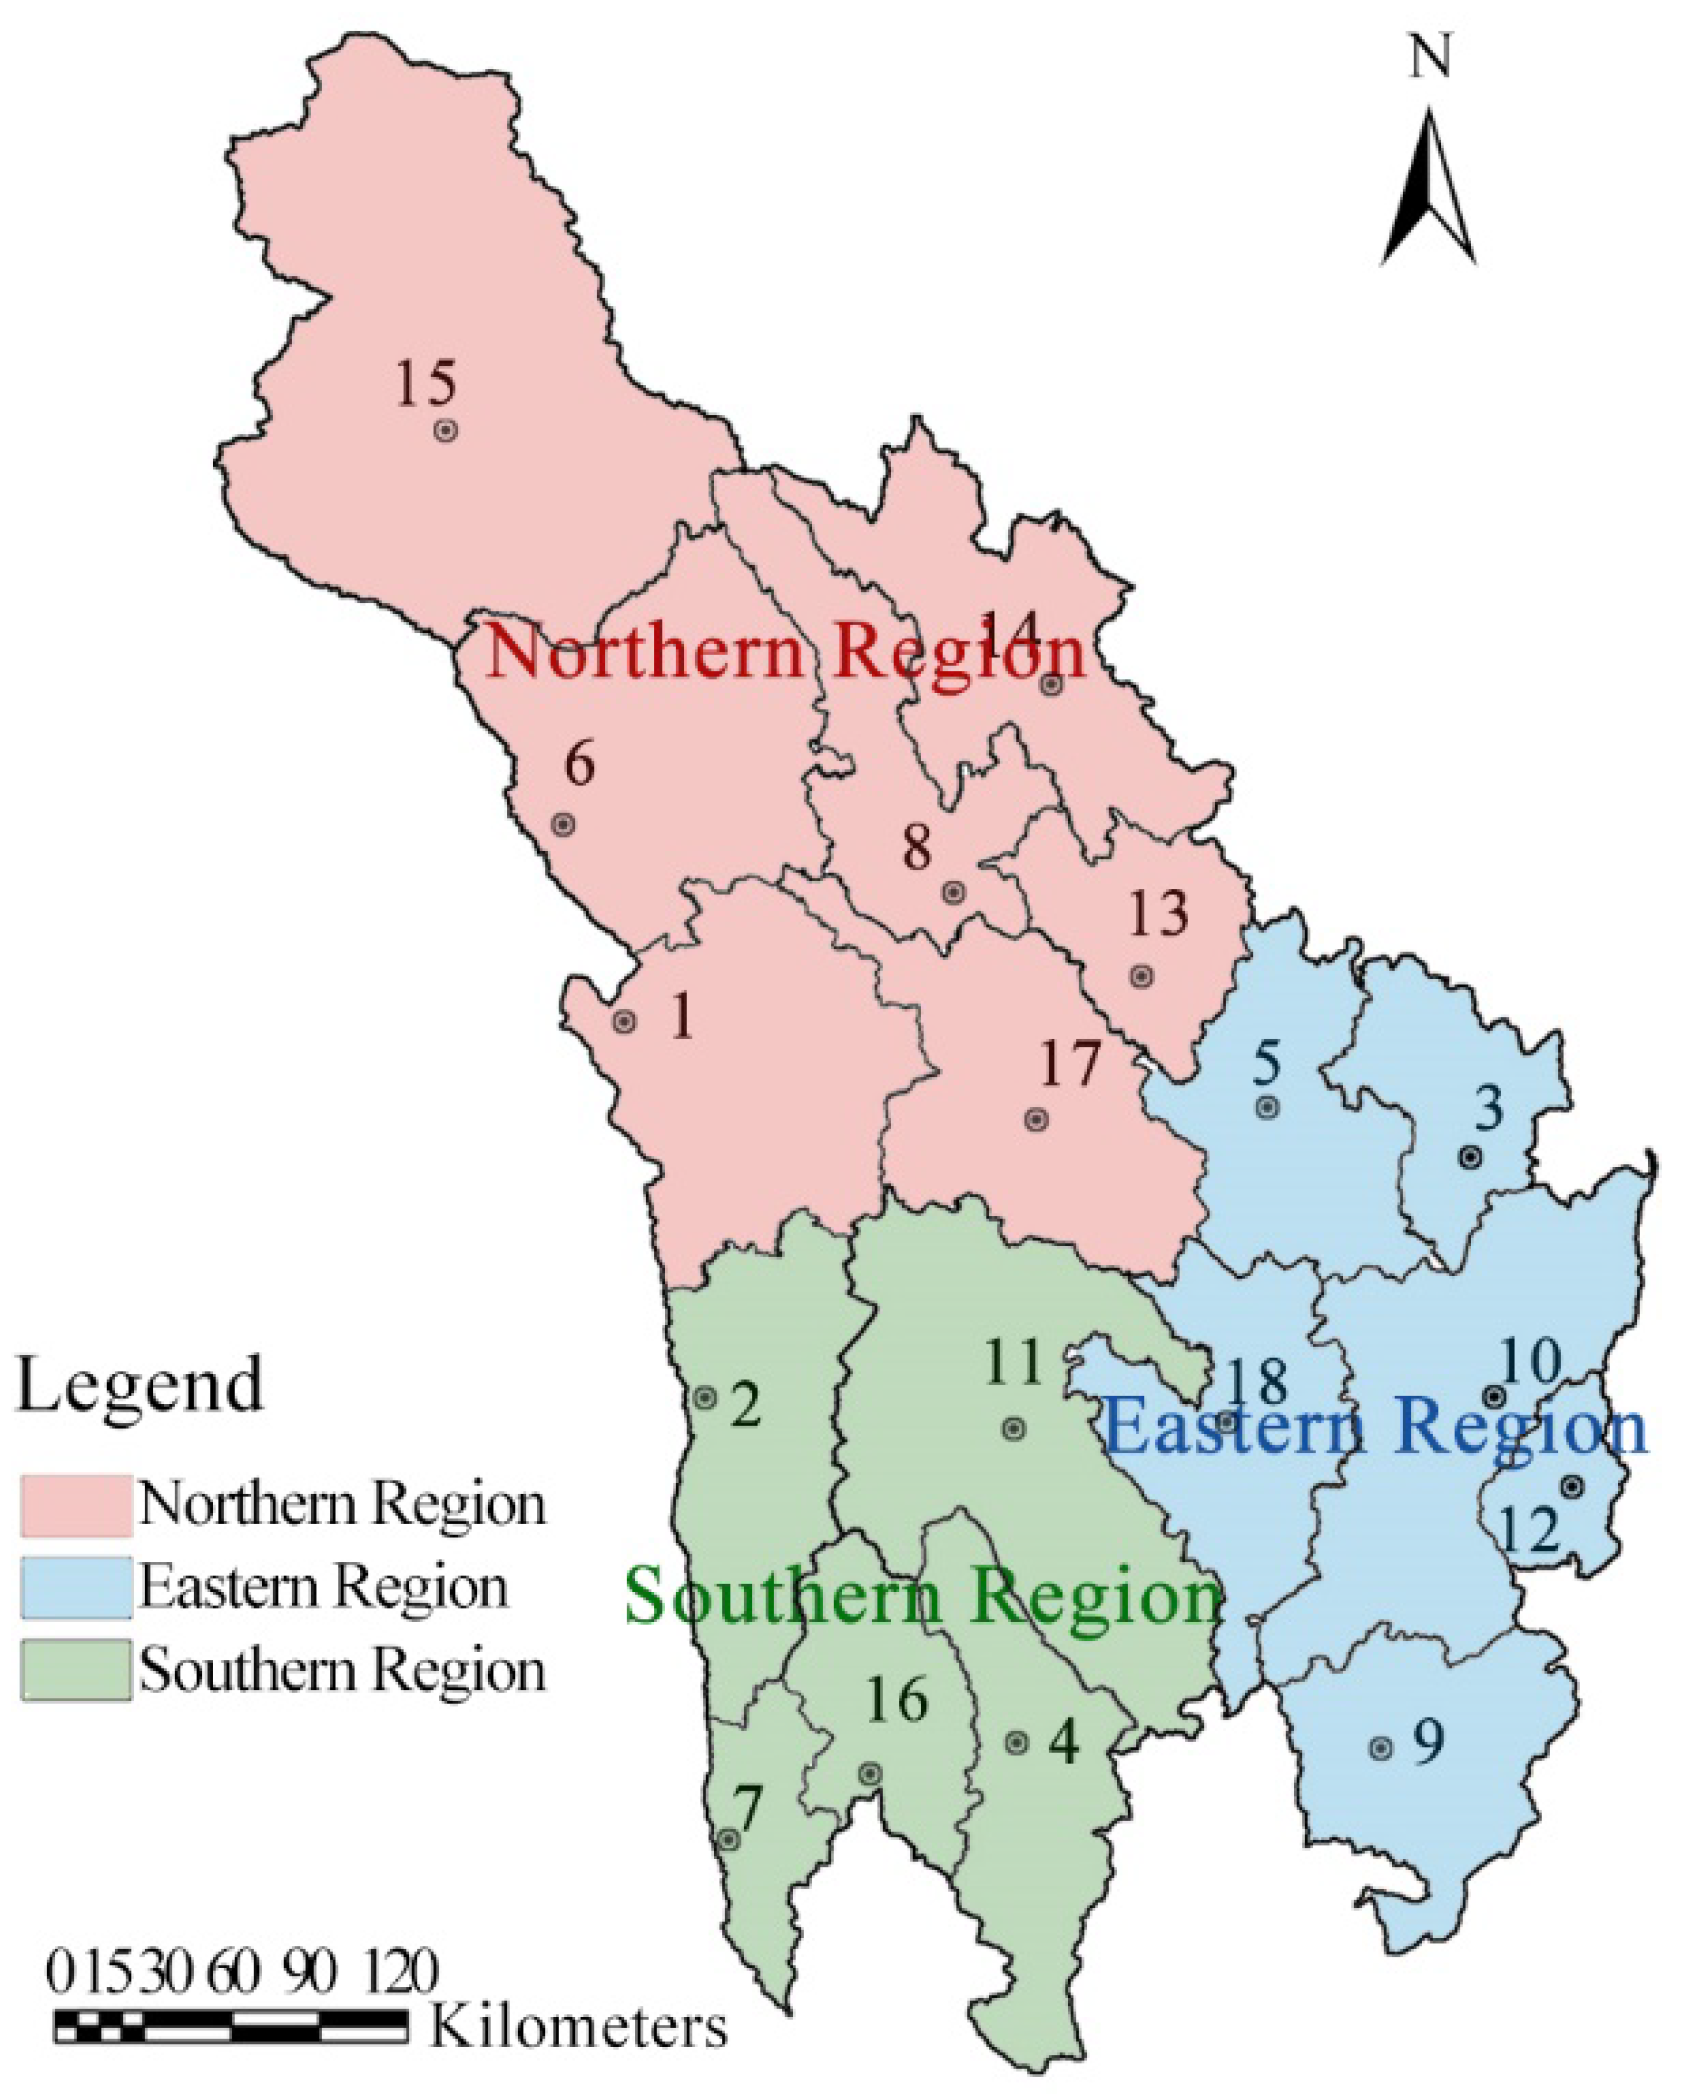
2.1. Study Area

The Hengduan Mountains range contains the eastern Qinghai-Tibet Plateau, the Western Sichuan Plateau, and the Northwestern Yunnan-Guizhou Plateau [43]. This study investigated the Ganzi Tibetan Autonomous Prefecture—abbreviated as “Ganzi Prefecture” (between 27°58″–34°20″ N and 97°22′–102°29′ E). It is located in the alpine valley area of western Sichuan and in the northern part of the Hengduan Mountains. It is an important part of the Qinghai-Tibet Plateau and an important ecological barrier in China. Ganzi Prefecture contains one city and 17 counties with a total area of 153,000 km2, accounting for more than one third of the area of Sichuan Province. A total of 120,000 km2 is covered by mountains, or 78.4% of the total area of Ganzi Prefecture [44]. The territory of Ganzi Prefecture spans six latitudes from north to south with an average elevation of 3500 m. The highest peak, Mount Gongga, is 7556 m above sea level. The relative elevation difference between it and the lowest point of the Dadu River is greater than 6000 m [45]. Snow or glaciers seasonally cover the peaks of some mountains in Ganzi Prefecture, such as the Shaluli and Daxue Mountains. Due to varying elevation, the study area has varied vegetation patterns that include subtropical forests, coniferous and broad-leaved forests, spruce and fir forests, alpine oak forests, alpine shrubs, alpine meadows, and alpine rocky beaches.
Moreover, the landforms of Ganzi Prefecture are diverse, including mountains, plateaus, flat dams, terraces, and mountain plains. Its natural pastureland is one of China’s five major pastoral areas. The main rivers in Ganzi Prefecture are the Jinsha, Yalong, and Dadu Rivers, all of which are major tributaries of the upper reaches of the Changjiang River (Figure 1). The region has a continental highland-mountain type monsoon climate, with an apparent vertical elevation difference. There are annual temperature differences of more than 17 °C along the six latitudes. The total annual precipitation has ranged from 417.8 to 935.8 mm over nearly 10 years [46]. On average, there are 1900–2600 annual sunshine hours and 18–228 frost days per year [47].
Due to the harsh environment and difficult access, a large area of Ganzi Prefecture is uninhabitable [44]. The economic level of Ganzi Prefecture is much lower than that of other regions in Sichuan Province. The gross regional product accounts for only 0.83% of the province [48]. In recent years, Ganzi Prefecture has been in a stage of rapid urbanization and industrialization. Transportation, hydropower, mineral resources, and tourism have developed. However, due to the adverse effects of global climate change and anthropogenic activities, the ecosystems in Ganzi Prefecture are under tremendous pressure with severe degradation of grasslands, desertification of land, soil erosion [49,50], and land salinization, and dramatic changes have occurred to the landscape patterns.

2.2. Data Sources and Processing

In the present study, local forestry survey data and a current land use map were acquired from the Ganzi Forestry Bureau. According to the national-level land use classification standards [51], and the actual land use in Ganzi Prefecture, six landscape types were classified in this study: cultivated land, forest, grassland, water body, construction land, and unused land. Table 1 shows the classified types.
Based on shapefiles developed by regional institutes, ArcMap software was used to create a database from which raster maps and tiff images of Ganzi Prefecture were created for this study. The tiff images were imported into Fragstats, a software program designed to calculate landscape indices, in order to obtain the index data needed in this study. LISA clustering maps were created using the “Anselin Local Moran’s I”, ArcToolbox in ArcMap.
To characterize the mountain terrain, an elevation map of Ganzi Prefecture was created from a shapefile of contour lines with elevation data from the SRTMDEMUTM dataset. The dataset was derived from the Shuttle Radar Topography Mission (SRTM3 V4.1) data product with a global Digital Elevation Model (DEM) at 90 m resolution that covers all of China and is freely available online at http://www.gscloud.cn, accessed on 15 April 2022 [52]. Elevation distribution maps of the LVI and LHAI were derived from a combination of elevation maps and a shapefile of their respective spatial distribution. The correlation analyses between the elevation, LVI, and LHAI were performed in statistical product service solutions (SPSS) software.

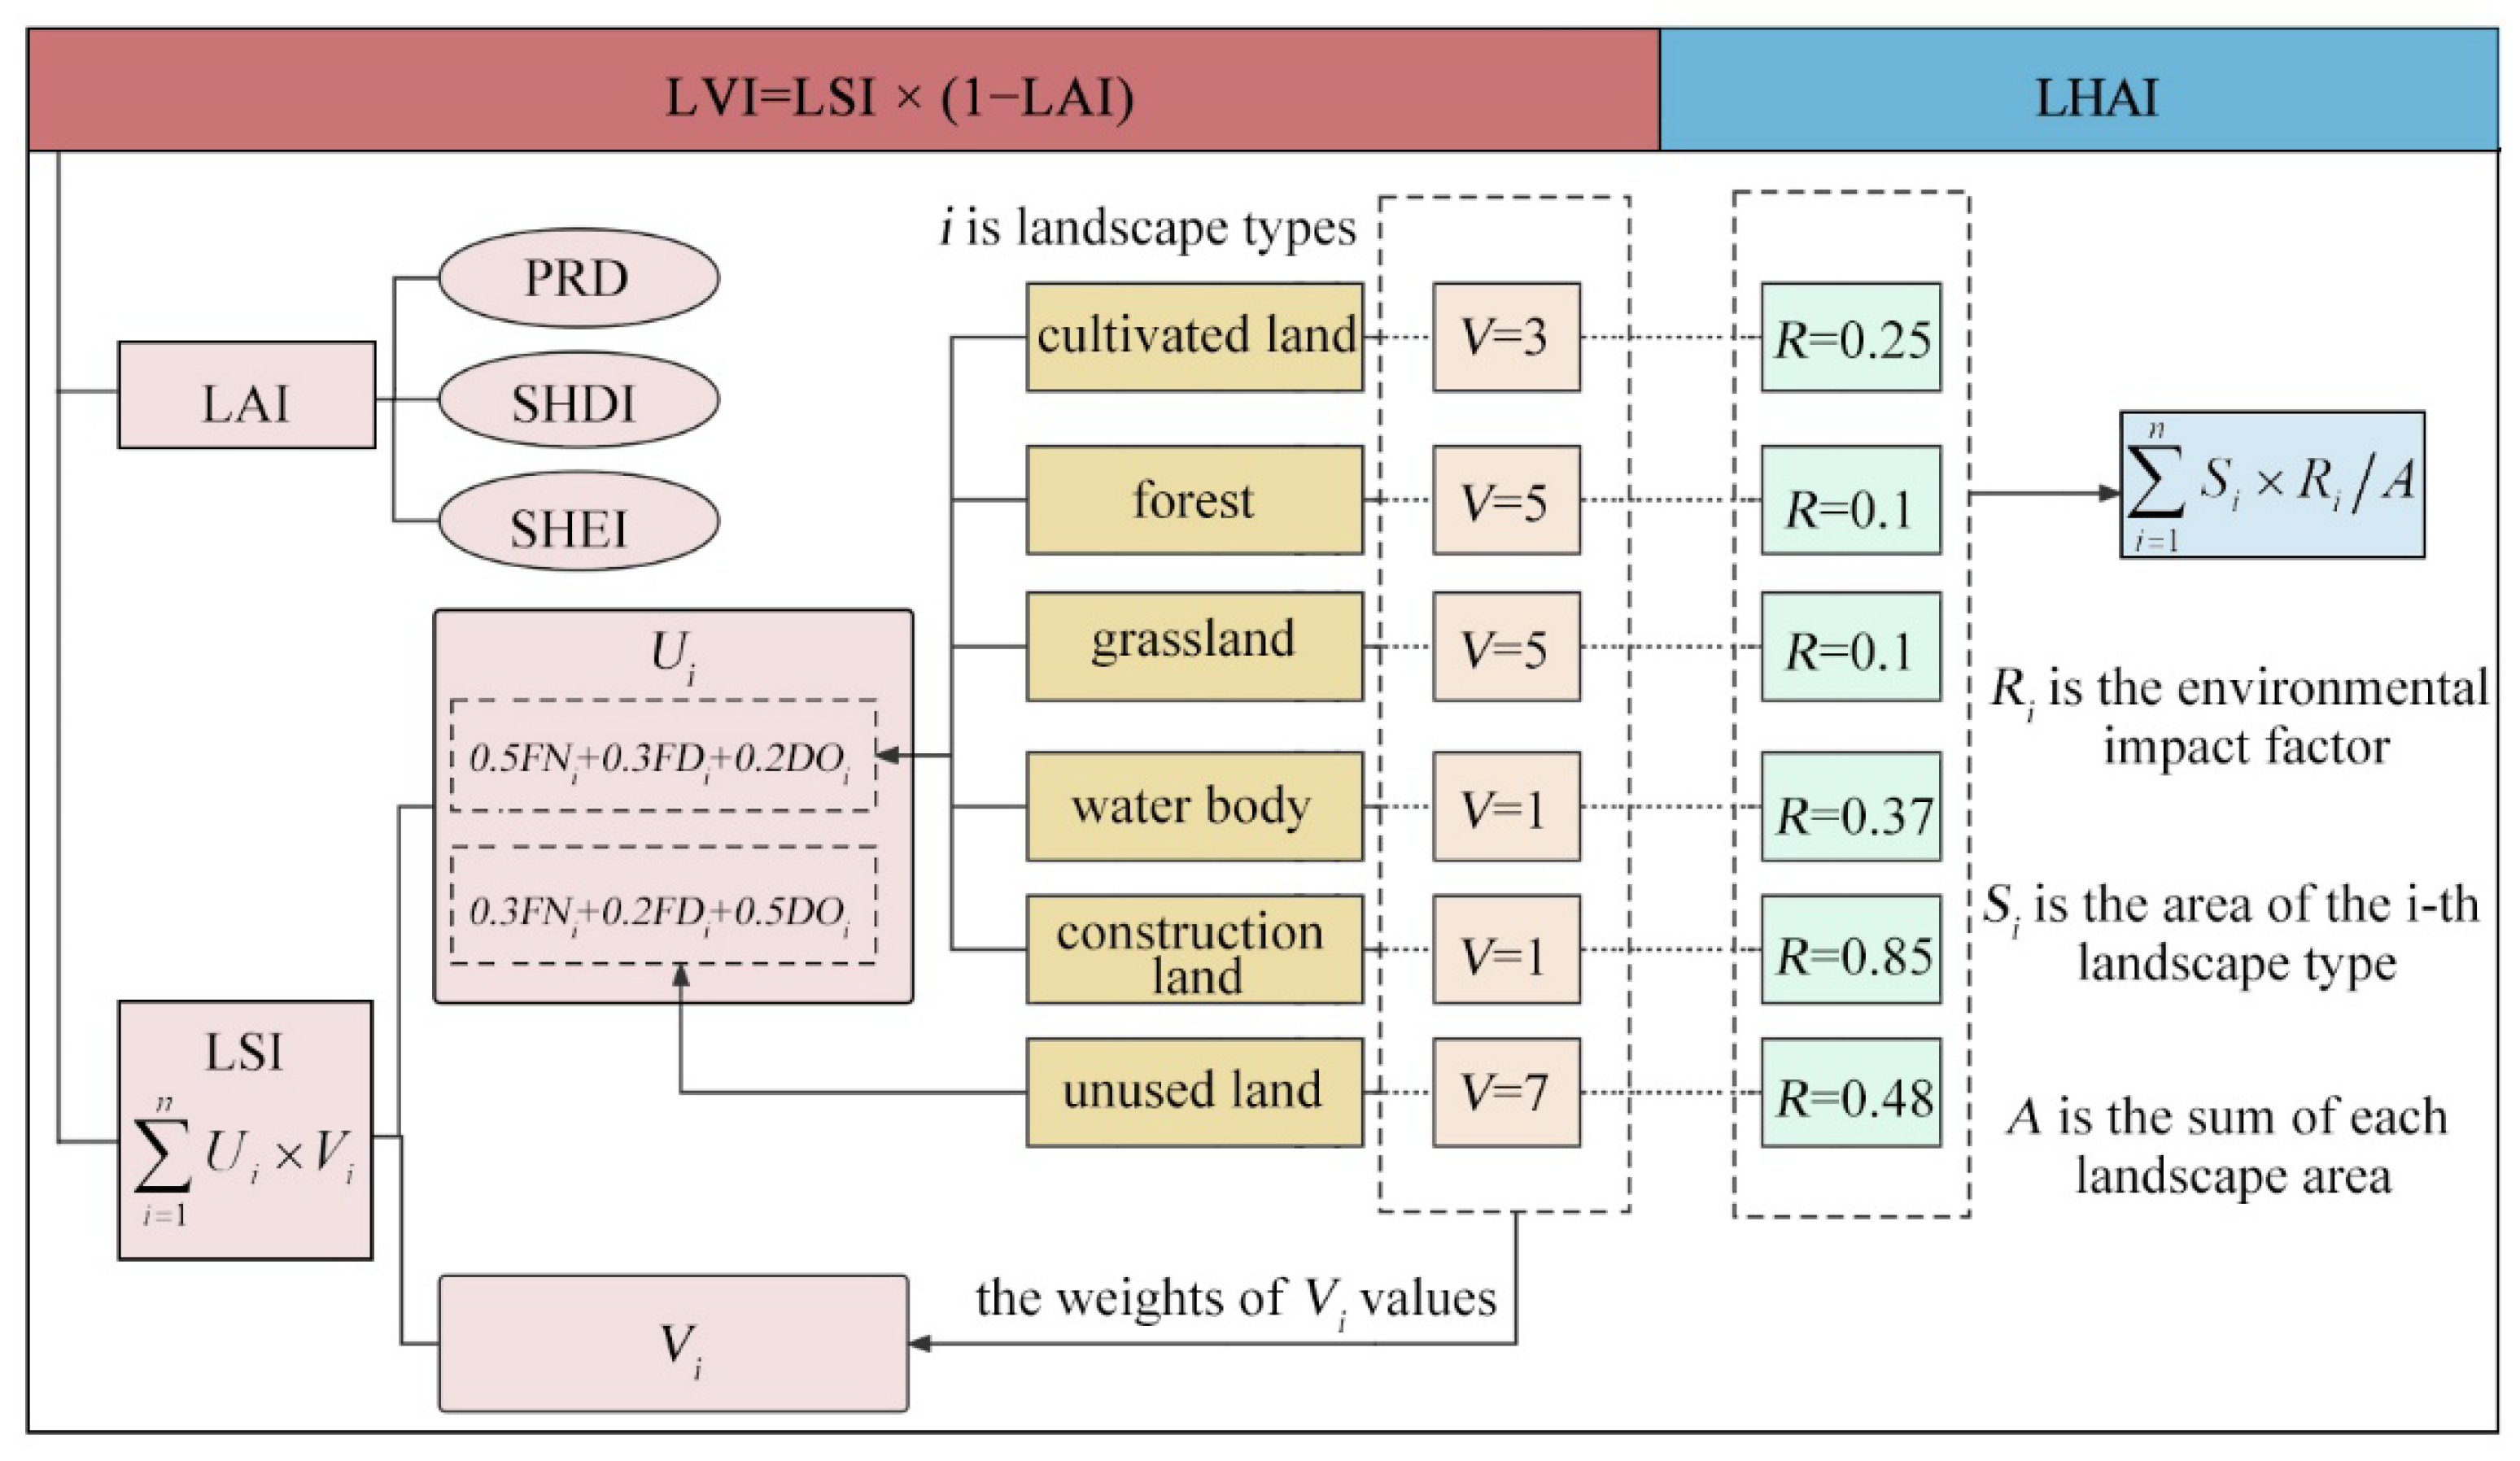
2.3. Calculation of the LVI

LVI is related to the LSI and LAI [53]. The larger the LVI value, the more vulnerable the landscape pattern is. The LVI was calculated using Fragstats software, following Equation (1) (Figure 2):
LVI = LSI × ( 1 LAI )
LSI can be measured by the landscape disturbance index (Ui) and landscape type vulnerability (Vi). The former represents the degree of external disturbance to the landscape, and the latter represents the degree of landscape loss to disturbance [28], following Equation (2). In addition, different landscape types also have different responses to environmental disturbances [53].
LSI = i = 1 n U i × V i
where, n is the number of landscape types, and i is the landscape type. Ui values were calculated following Equation (3) [26]:
U i = a F N i + b F D i + c D O i
where, FN is the fragmentation index, FD is the inverse of the fractional dimension, and DO is the dominance degree [54]. Ui is usually summed by FN, FD, and DO, and the weights of the three indices (a, b, and c) are assigned as 0.5, 0.3, and 0.2, respectively [3]. Considering the high proportion of unused land in Ganzi Prefecture and significant impact of DO on unused land, this study adjusted the weights of the three indices for unused land to 0.3, 0.2, and 0.5. Vi reflects the degree of loss of each landscape type under external disturbance. Unused land, forests, and grasslands are the most easily changed, cultivated land is the second most easily changed, while water bodies and construction land are not easily changed. Therefore, four relative weights of Vi values were assigned from high to low: unused land = 7, forest and grassland = 5, cultivated land = 3, and water body and construction land = 1.
LAI is related to system diversity, and a more complex structure and uniform distribution indicate a more stable system [55]. In this study, three representative indices of ecological significance (the patch richness density index (PRD), the Shannon diversity index (SHDI), and the Shannon evenness index (SHEI)) were selected to construct the LAI [56], following Equation (4):
LAI = PRD × SHDI × SHEI

2.4. Calculation of the LHAI

Landscape pattern evolution is influenced by both natural and human factors [57,58]. The study area is in the process of new urban development, and development and construction activities can induce profound spatial and directional changes in land use across the region. These, in turn, could affect the regional landscape pattern and ecosystem security. LHAI is used to describe the intensity of human disturbance of the landscape in a region. Therefore, this study chose LHAI to analyze the disturbance intensity of the Ganzi Prefecture landscape under the influence of human activities. LHAI was calculated using Equation (5) (Figure 2):
LHAI = i = 1 n S i × R i / A
where, n is the number of landscape types and i is the landscape type; Si is the area of the i-th landscape type; Ri is the environmental impact factor of the i-th landscape resource; and A is the sum of each landscape area. In this study, Ri is mainly based on the indicators of landscape artificial disturbances established by Liu et al. [58], which assess the impacts of the intensity of human activities on landscape changes. In addition, this study took into account differences in the degree of influence of landscape types on the regional ecological environment. Based on the degree of ecological maintenance [59] and the degree of the influence of human activities, the environmental impact factors for landscape resources in Ganzi Prefecture were determined, as shown in Table 1.

2.5. Spatial Analysis Methods

2.5.1. Delineation of the Unitary Mesh

To ensure accurate LVI and LHAI calculations, the map of Ganzi Prefecture was divided into grids of 2.5 × 2.5 km2 cells using the Fishnet tool in ArcGIS 10.5 software. There was a total of 26,379 grids. The LVI and LHAI values were then assigned to the centroids of each fishnet gird. At the same time, the data were optimized using the semi-variance function that explains the spatial variation structure of landscape characteristics [60]. We used the ordinary kriging method to interpolate a corresponding spatial distribution map and perform a horizontal comparative analysis of landscape vulnerability and artificial disturbance in Ganzi Prefecture. Five vulnerability levels were classified using the natural break method [61] for LVI values, i.e., very low-, low-, middle-, high-, and very high-vulnerability. Similarly, LHAI values were divided into five levels: very low-, low-, middle-, high-, and very high-intensity (Table 2).

2.5.2. Spatial Autocorrelation Analysis

In this paper, spatial autocorrelation analysis was performed to reveal the spatial correlation among LVI, LHAI, and their aggregation characteristics. The spatial autocorrelation indicators included the global spatial autocorrelation index (Moran’s I index) and the local spatial autocorrelation index (LASI index) [62,63]. The former characterizes land-cover change, especially from Landsat data. The LASI index was used to verify the degree of correlation between an attribute in a small local area over the whole area and the same attribute in a small adjacent area [64]. The LASI index decomposes Moran′s I value into individual spatial units and reflects the local spatial aggregation of high or low values, thus reflecting local spatial heterogeneity [65]. The following formulas were used to calculate Global Moran’s I (Equation (6)) and LASI index (Equation (7)):
GlobalMoran s   I = i = 1 n j = 1 m W i j ( x i x ¯ ) ( x j x ¯ ) S 2 i = 1 n j = 1 m W i j
where, S 2 = 1 n i = 1 n ( x i x ¯ ) 2 , x ¯ = 1 n i = 1 n x i , x i denotes an observation for region i, n is the number of rasters, and Wij is the binary adjacency space weight matrix that indicates the adjacency of spatial objects. i = 1, 2, ..., n; j = 1, 2, ..., m; Wij = 1 when region i and region j are adjacent, while Wij = 0 when region i and region j are not adjacent. Moran′s I value is generally between −1 and 1, where values less than 0 represent a negative correlation, values equal to 0 represent no correlation, and values greater than 0 represent a positive correlation.
LocalMoran s   I i = ( x i x ¯ m ) j = 1 n W i j ( x i x ¯ )
where, m = ( j = 1 , j 1 n x j 2 ) / ( n 1 ) x ¯ 2 , positive Ii values indicate spatial clustering of similar high or low values around the spatial unit, and negative Ii values indicate spatial clustering between non-similar values.
This study used the spatial statistics tool in ArcGIS 10.5 to calculate global Moran’ I coefficients for LVI and LHAI based on the spatial distribution data of the two. Significance testing of the approximately normal distribution was also conducted in order to reflect their average degree of association and spatial distribution patterns.

2.6. Different Elevation Sub-Bands

The study area was divided into 21 elevation sub-bands at 300 m intervals using DEM elevation data in order to investigate the changes in LVI and LHAI. The map of LVI at different elevations was obtained from a combination of the files of the 21 elevation sub-bands and the spatial distribution of LVI. The map of LHAI at different elevations was created following the same processing method. Then, based on the topographic features of China, the Chinese 1:1 million digital landform classification system [66], and the elevation characteristics of the study area, the study area was divided into four elevation levels: low, medium, high, and extremely high (Table 3).

3. Results

3.1. Spatial Differentiation of Landscape Pattern Vulnerability in Ganzi Prefecture

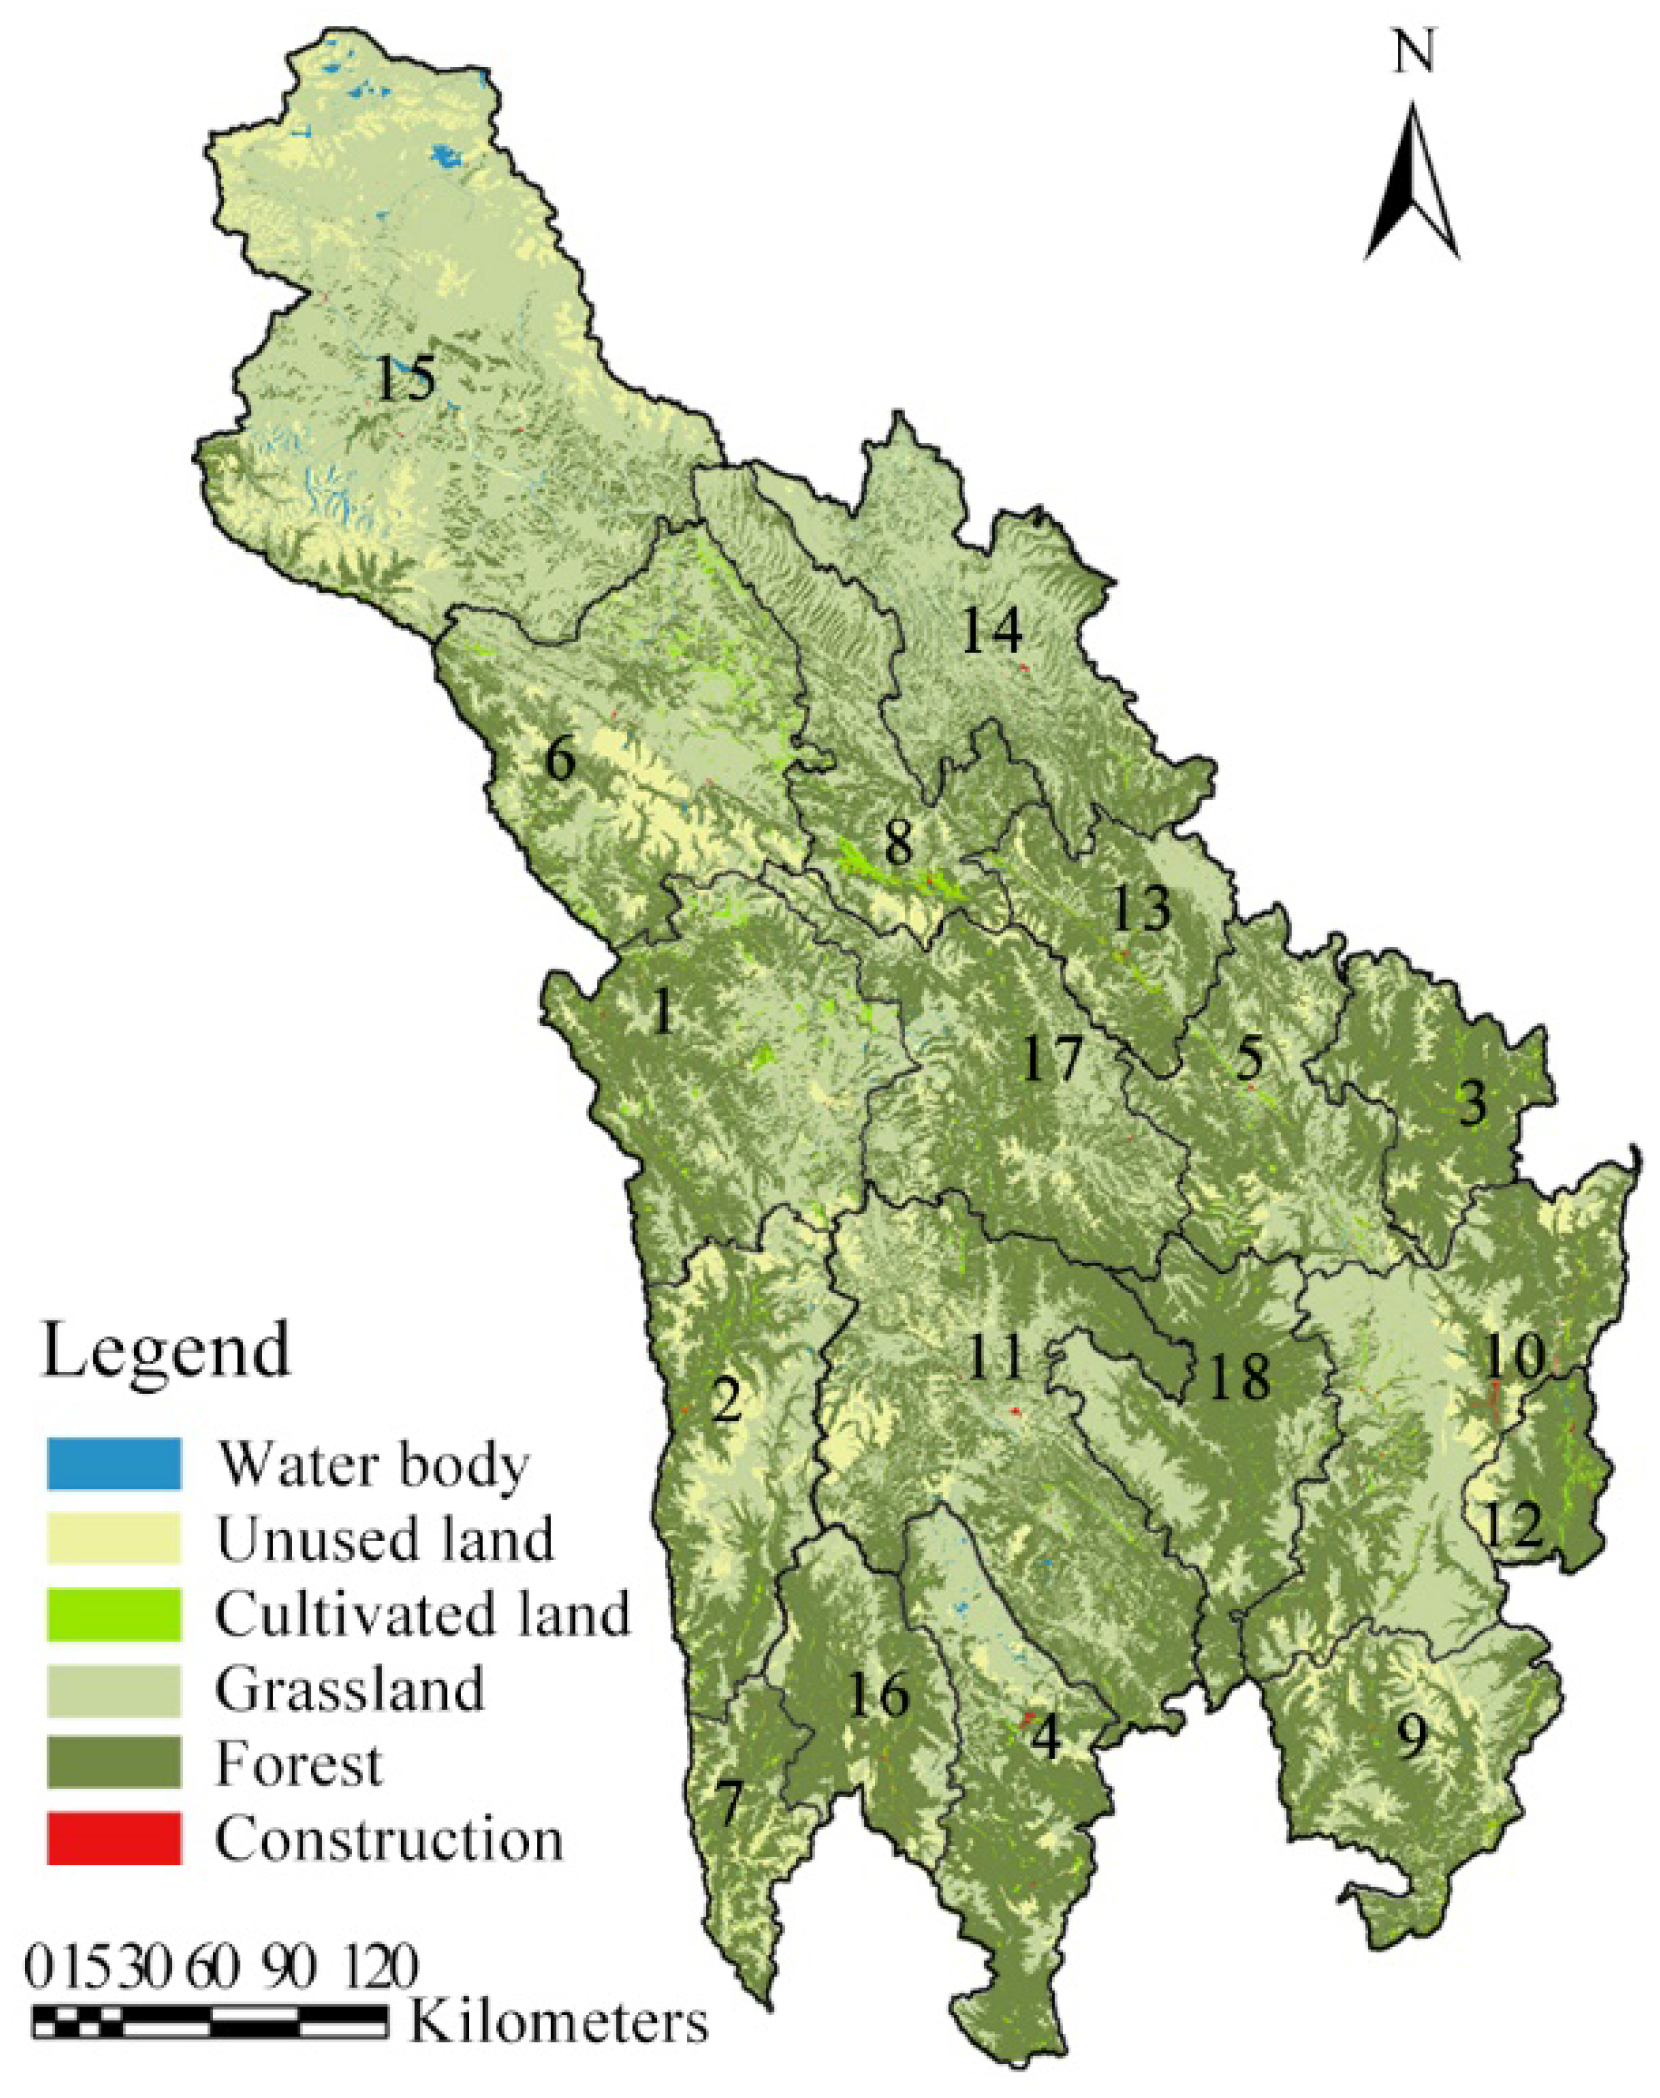
3.1.1. Analysis of Current Land Cover

Figure 3 and Table 4 show that land use in Ganzi Prefecture is diverse. Forests and grasslands were the most common land cover types, accounting for 45.25% and 44.17% of the total area, respectively. The per capita forest area was 17.71 km2 and the per capita grassland area was 18.15 km2. Both of these areas were significantly higher than the provincial and national averages. The percentage of unused land was 8.19%, and the water body percentage was 0.64%. Cultivated and construction lands accounted for 1.57% and 0.18% of the total area, respectively. These areas were scattered in the valleys of the Jinsha, Yalong, and Dadu Rivers and on the terraces, platforms and gentle slopes of their tributaries, with a low level of intensive use.

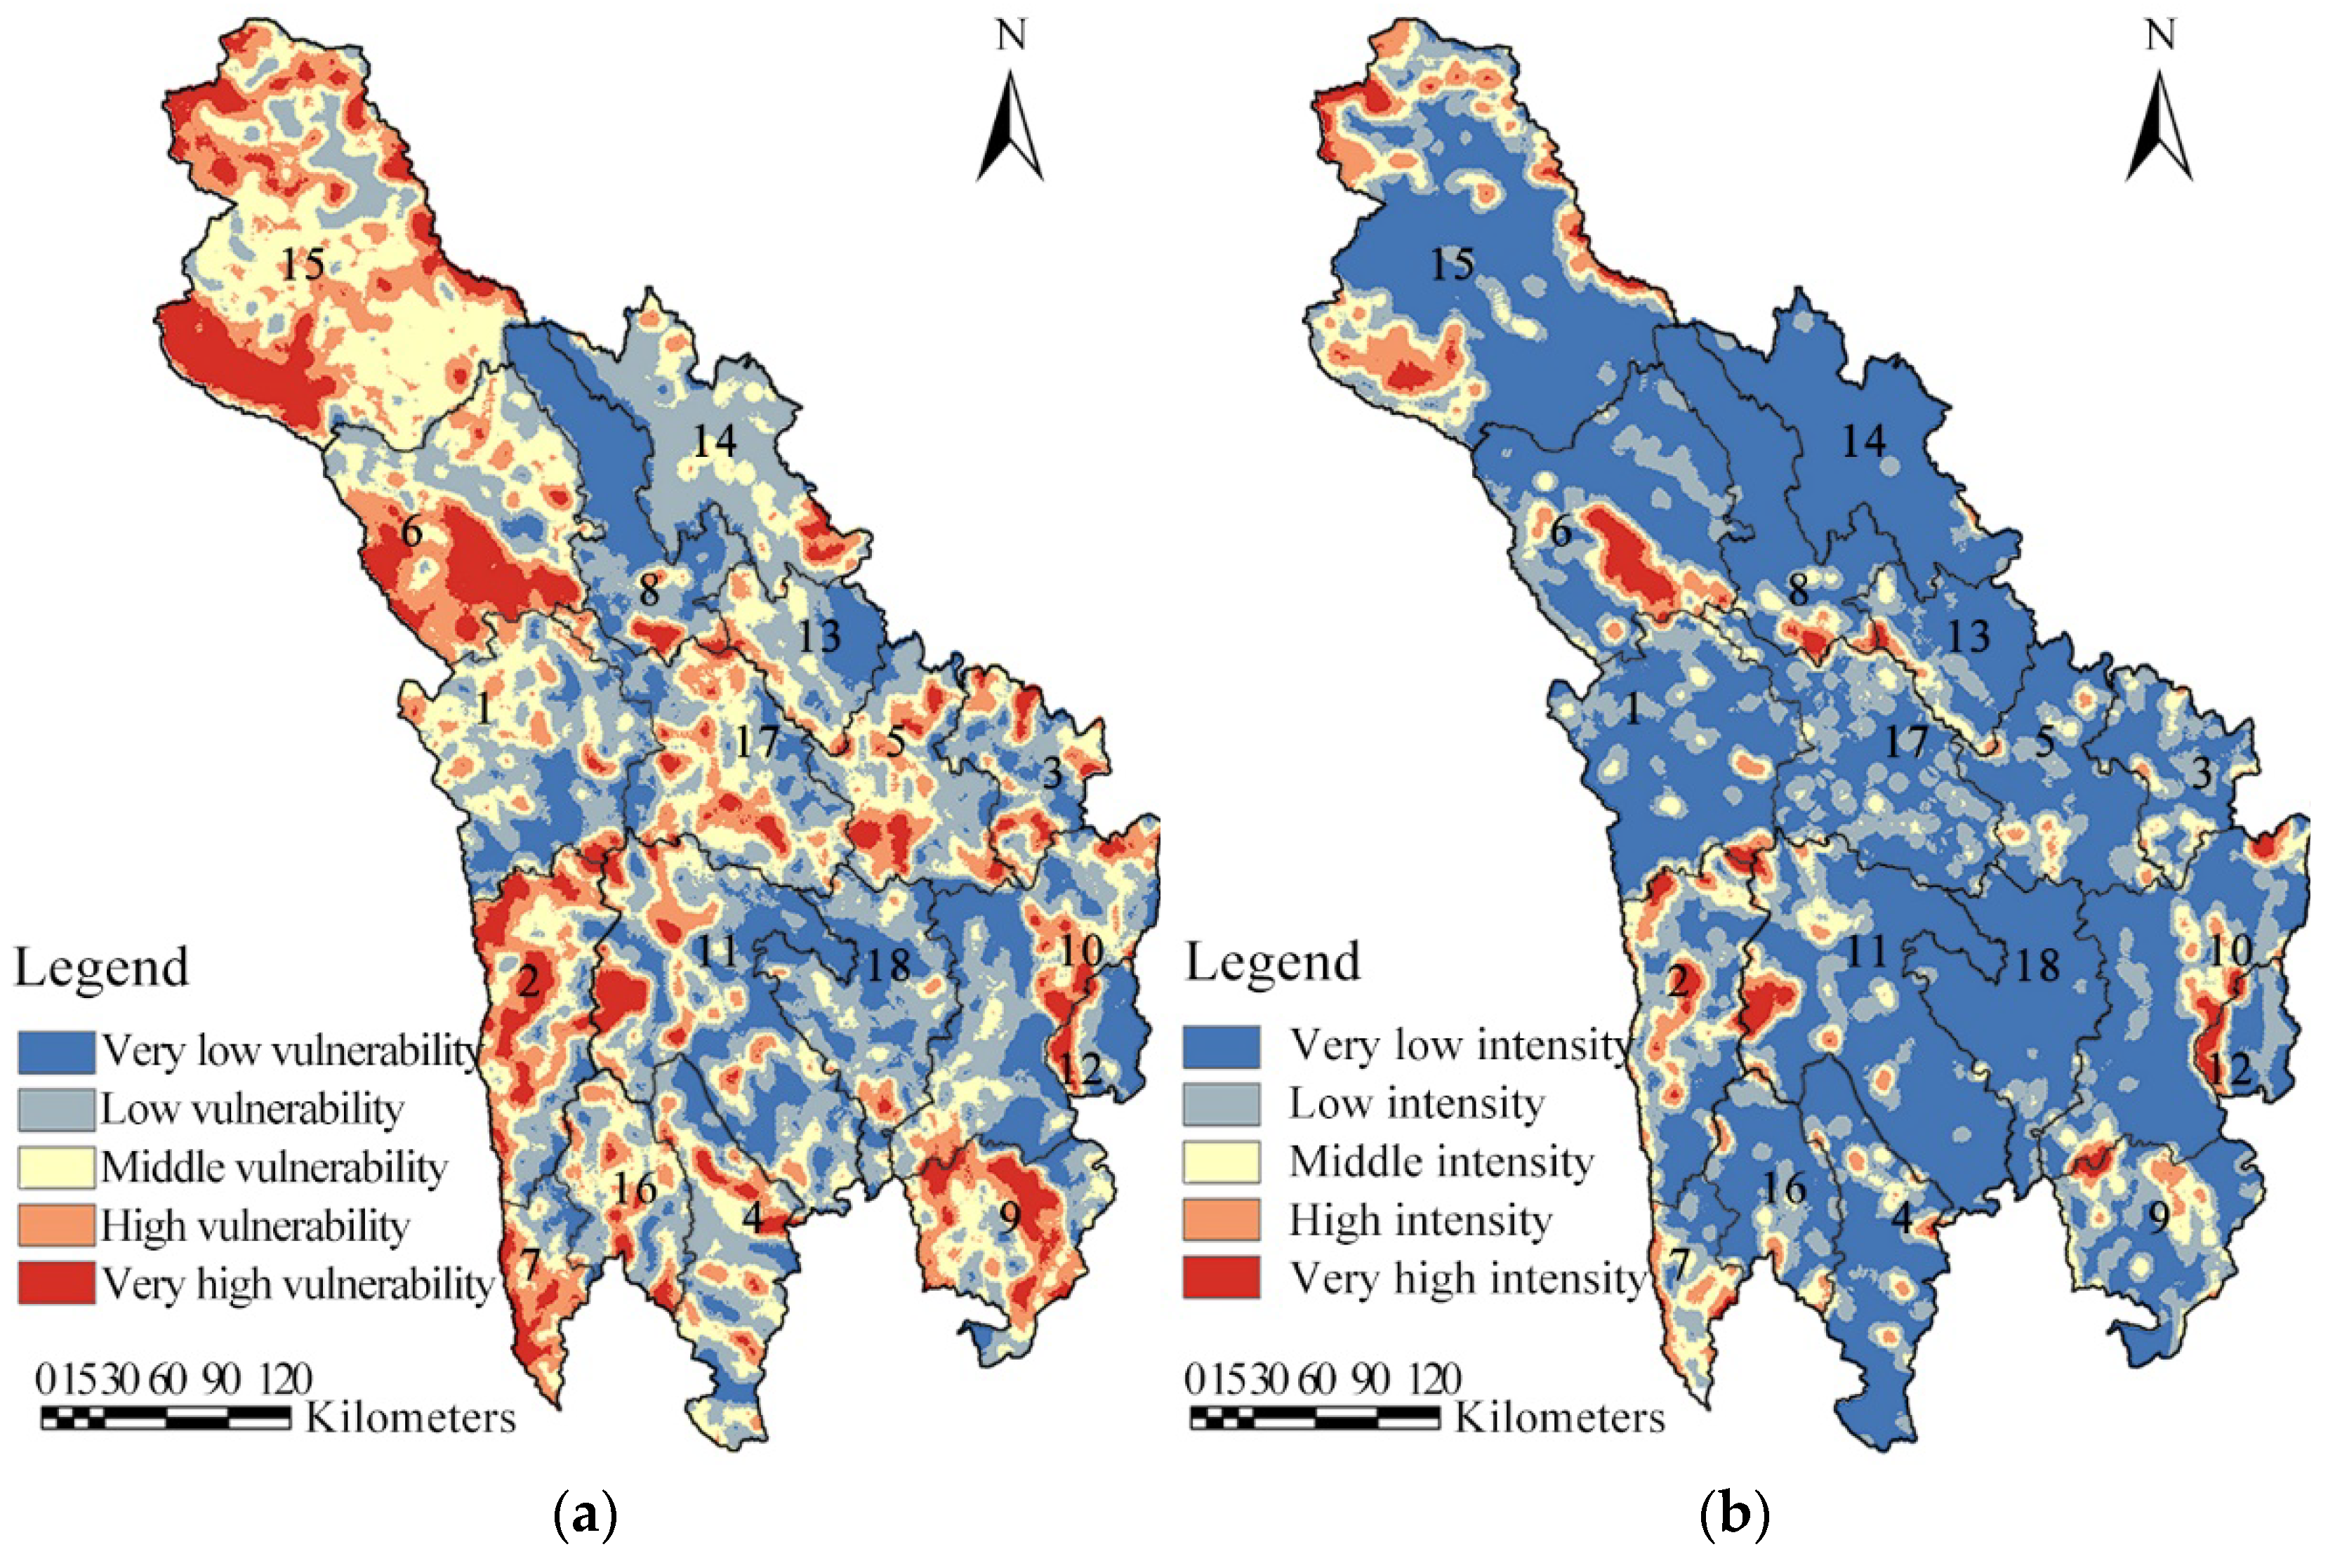
3.1.2. Spatial Distribution of LVI

The spatial distribution of LVI values in Ganzi Prefecture is complex (Figure 4a and Table 5). Low-vulnerability regions made up the most area, accounting for 29.47% of the total area, followed by middle-vulnerability areas. These two types of regions accounted for 56.45% of the total area and were uniformly distributed in the northern part of the study area and scattered in other areas. High- and very high-vulnerability areas were mainly concentrated in the southern and northern edges of the study area, which was also the Jinshal River system watershed. Other vulnerable areas were fragmented and widely distributed in the study area.
At the county level, as high- and very high-vulnerability areas accounted for more than half of the county areas, Batang and Derong counties were classified as highly vulnerable areas (Table 5). Baiyu, Daocheng, Ganzi, Kangding, Litang, Luding, Luhuo, Seda, and Yajiang county were classified as low-vulnerability areas. The low- and very low-vulnerability areas exceeded four-fifths of the total area in both Ganzi and Yajiang counties. This indicated stable landscape patterns in these two counties. The remaining seven counties were classified as middle-vulnerability areas.

3.2. Characterization of the Landscape Intensity of Artificial Disturbance in Ganzi Prefecture

Figure 4b shows that most of the study area is covered by connected very low- and low-intensity patches accounting for 81.48% of the total area. Conversely, there were minimal very high-intensity areas accounting for 2.32%. The results showed that the artificial disturbance intensity of the study area was low. In addition, the middle-, high-, and very high-intensity areas were scattered in the study area in the form of spots and blocks. The high- and very high-intensity areas were mainly distributed in Derong, Luding, Shiqu, Dege, and Batang counties. The other 13 counties had minimal high-intensity areas.

3.3. Spatial Autocorrelation Analysis

3.3.1. Global Autocorrelation

Global Moran’s I values for LVI and LHAI were 0.5242 and 0.3113 (p < 0.01), respectively (Table 6). Moreover, the Z-scores were greater than the threshold of 2.58 for a two-sided test with a 99% confidence interval under a normal distribution. This indicated that the spatial distribution of LVI and LHAI values of the study area was not random, but rather a clustered spatial phenomenon.

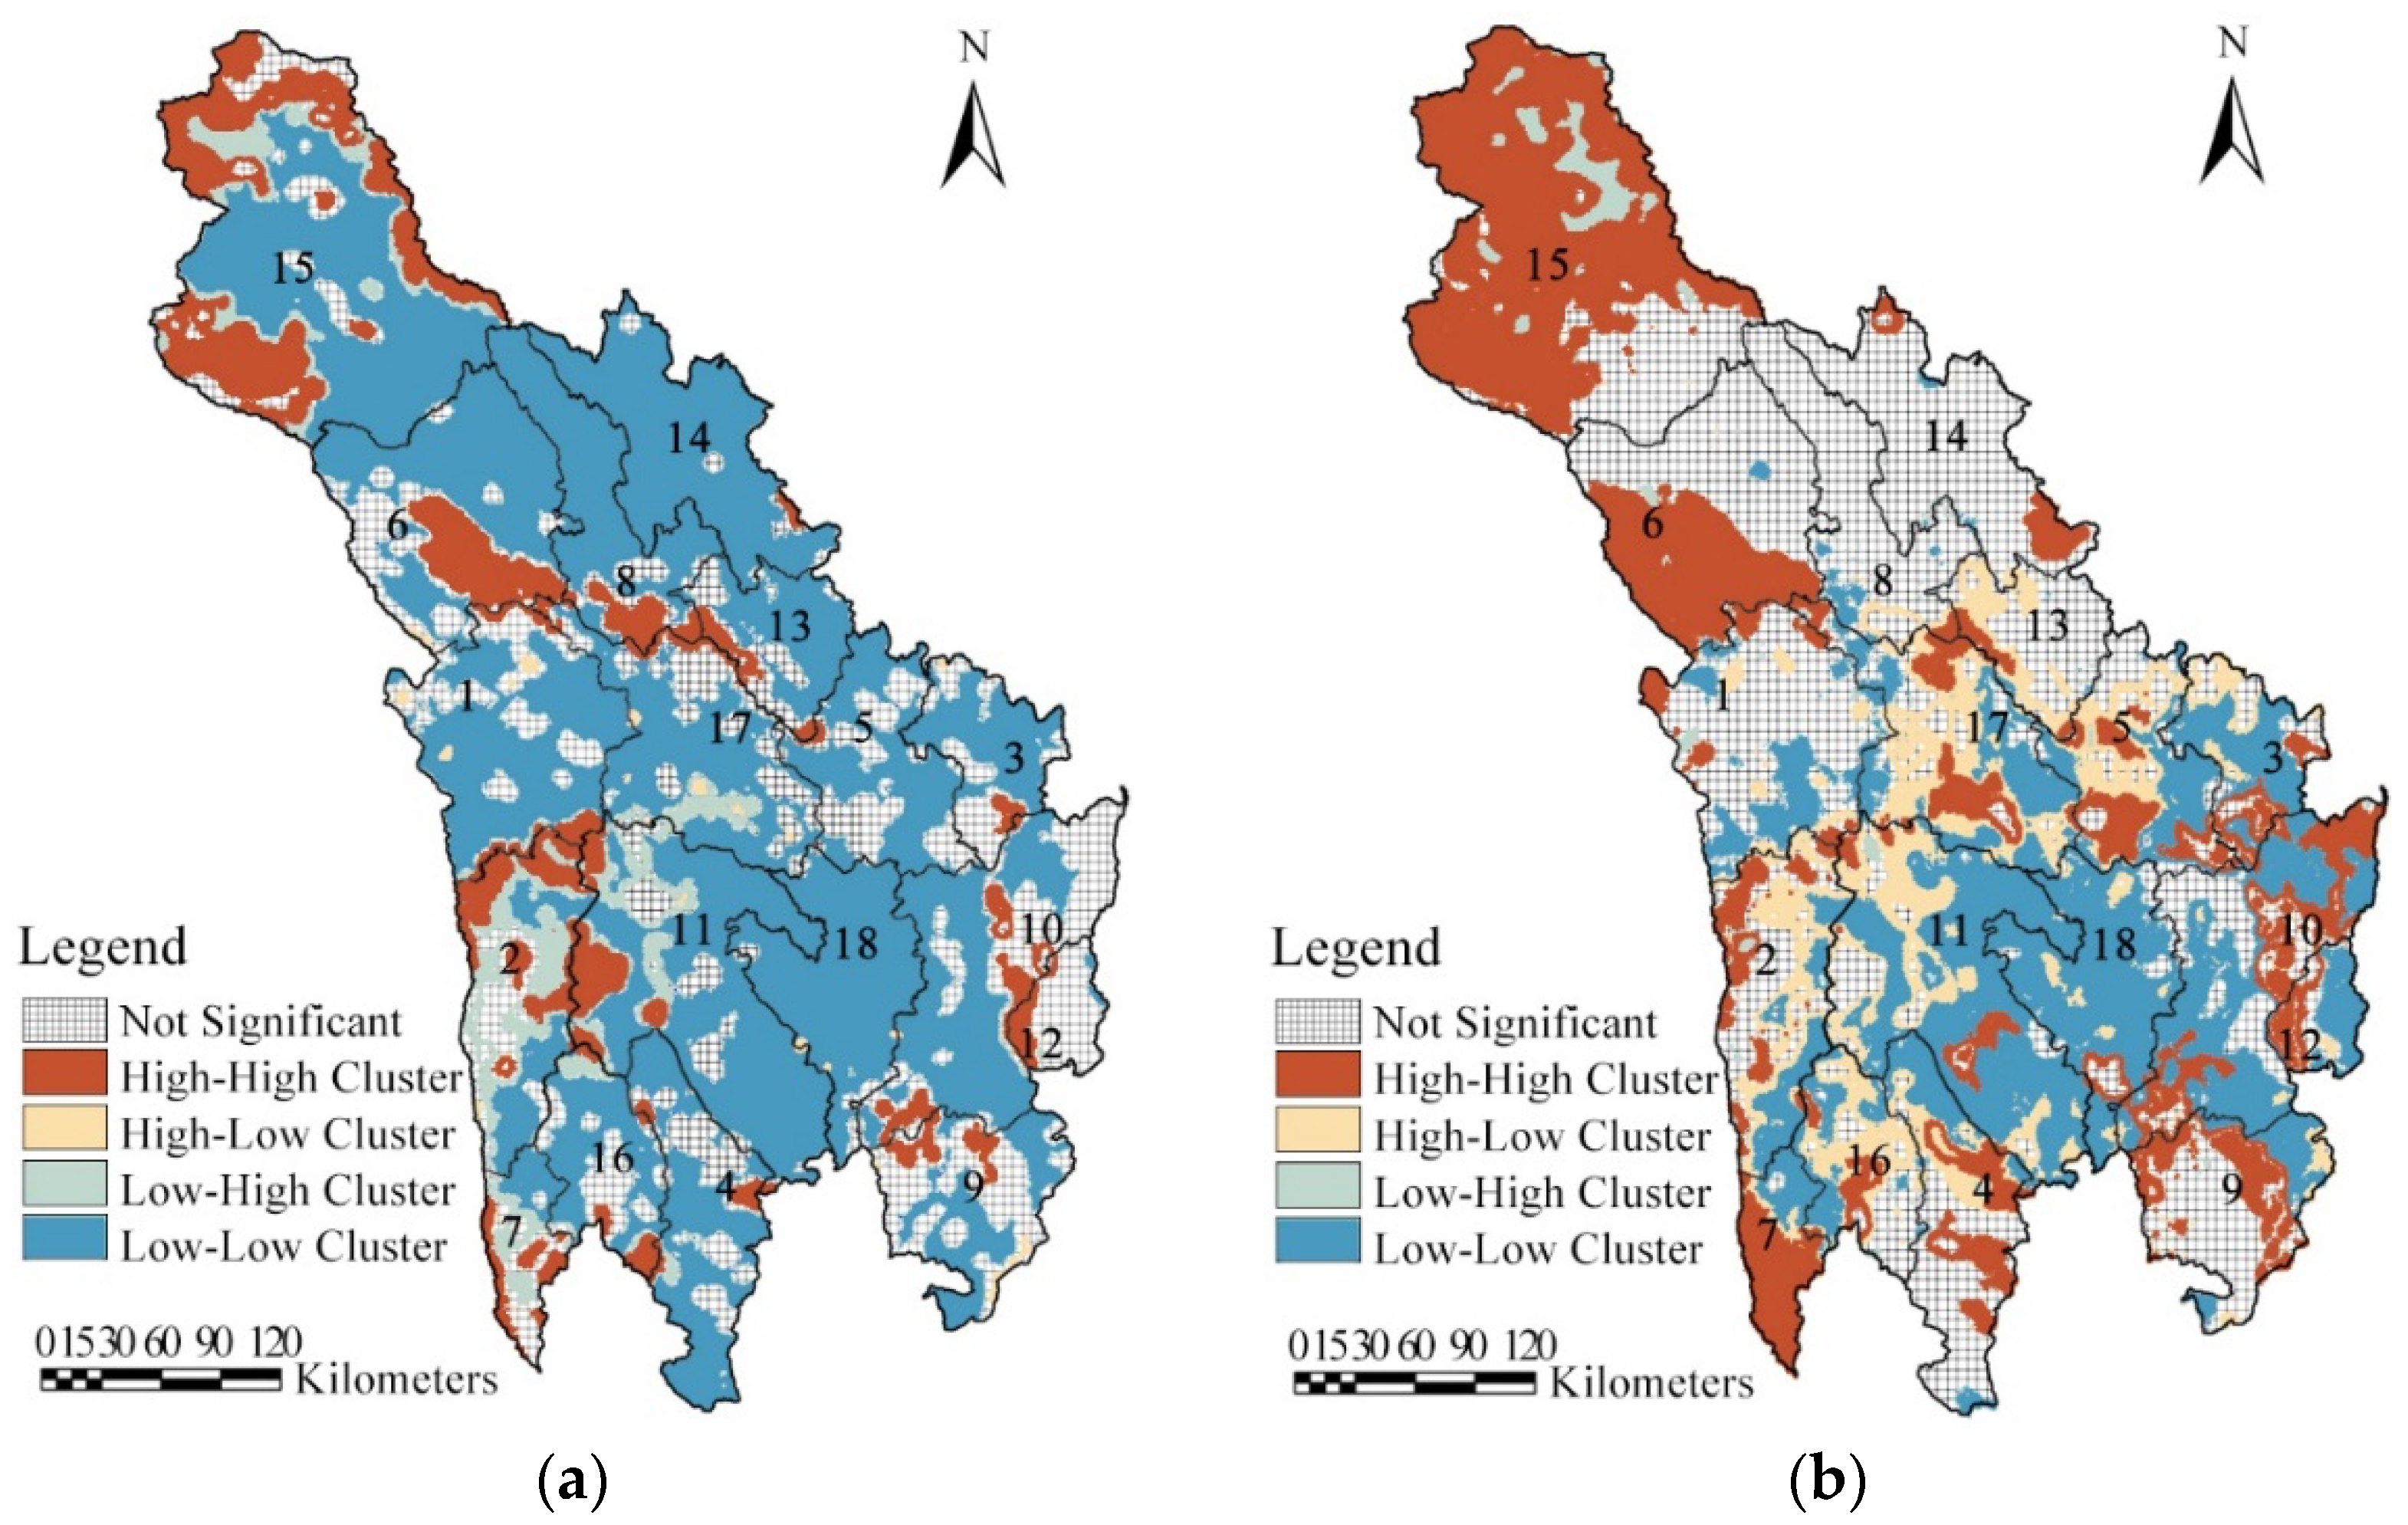
3.3.2. Local Autocorrelation

LISA clustering maps (Figure 5a) showed that the “high-high” values of LVI were mainly distributed in the plateau area of northwestern Ganzi Prefecture. The dominant land cover in this area is pasture. Due to the long-term dependence on natural grassland grazing, the landscape gradually became fragmented, which decreased the stability of the system. “High-high” values also dominated around mountains and valleys in the eastern and southern regions. Because of the topographic constraints, the cultivated land was mainly scattered in the river valleys, mesas, and gentle slopes. Most settlements were also scattered in the valley hinterland. Conversely, the eastern and southern parts of the study area were covered by a large area of “low-low” values, and these were the first development areas in Ganzi Prefecture. In accordance with national policy requirements, the regional government has continuously improved its ability to regulate land and formed distinctive industrial layouts so that the landscape patches in the region are relatively evenly distributed. As a result, the landscape pattern diversity and stability have increased.
Figure 5b shows the clustering of the “high-high” and “low-low” LHAI areas. The “low-low” areas were widely distributed across the study area. That could be due to the lower social and economic development levels. Most of the areas were covered by forests and grasslands and were less artificially disturbed. In addition, the terrain fluctuations caused cultivated land to be scattered in this area. It is impossible to implement large-scale, mechanized planting in cultivated lands. The “high-high” values were clustered along railways, highways, and the northern and southwestern edges of Shiqu County. Because of the influence of traffic projects, low LHAI areas (forest and grassland) constantly changed to high-disturbance landscapes with construction and cultivated lands. Furthermore, Shiqu County had many unused lands on the northern and southwestern edges, and “high-high” value clustering occurred.

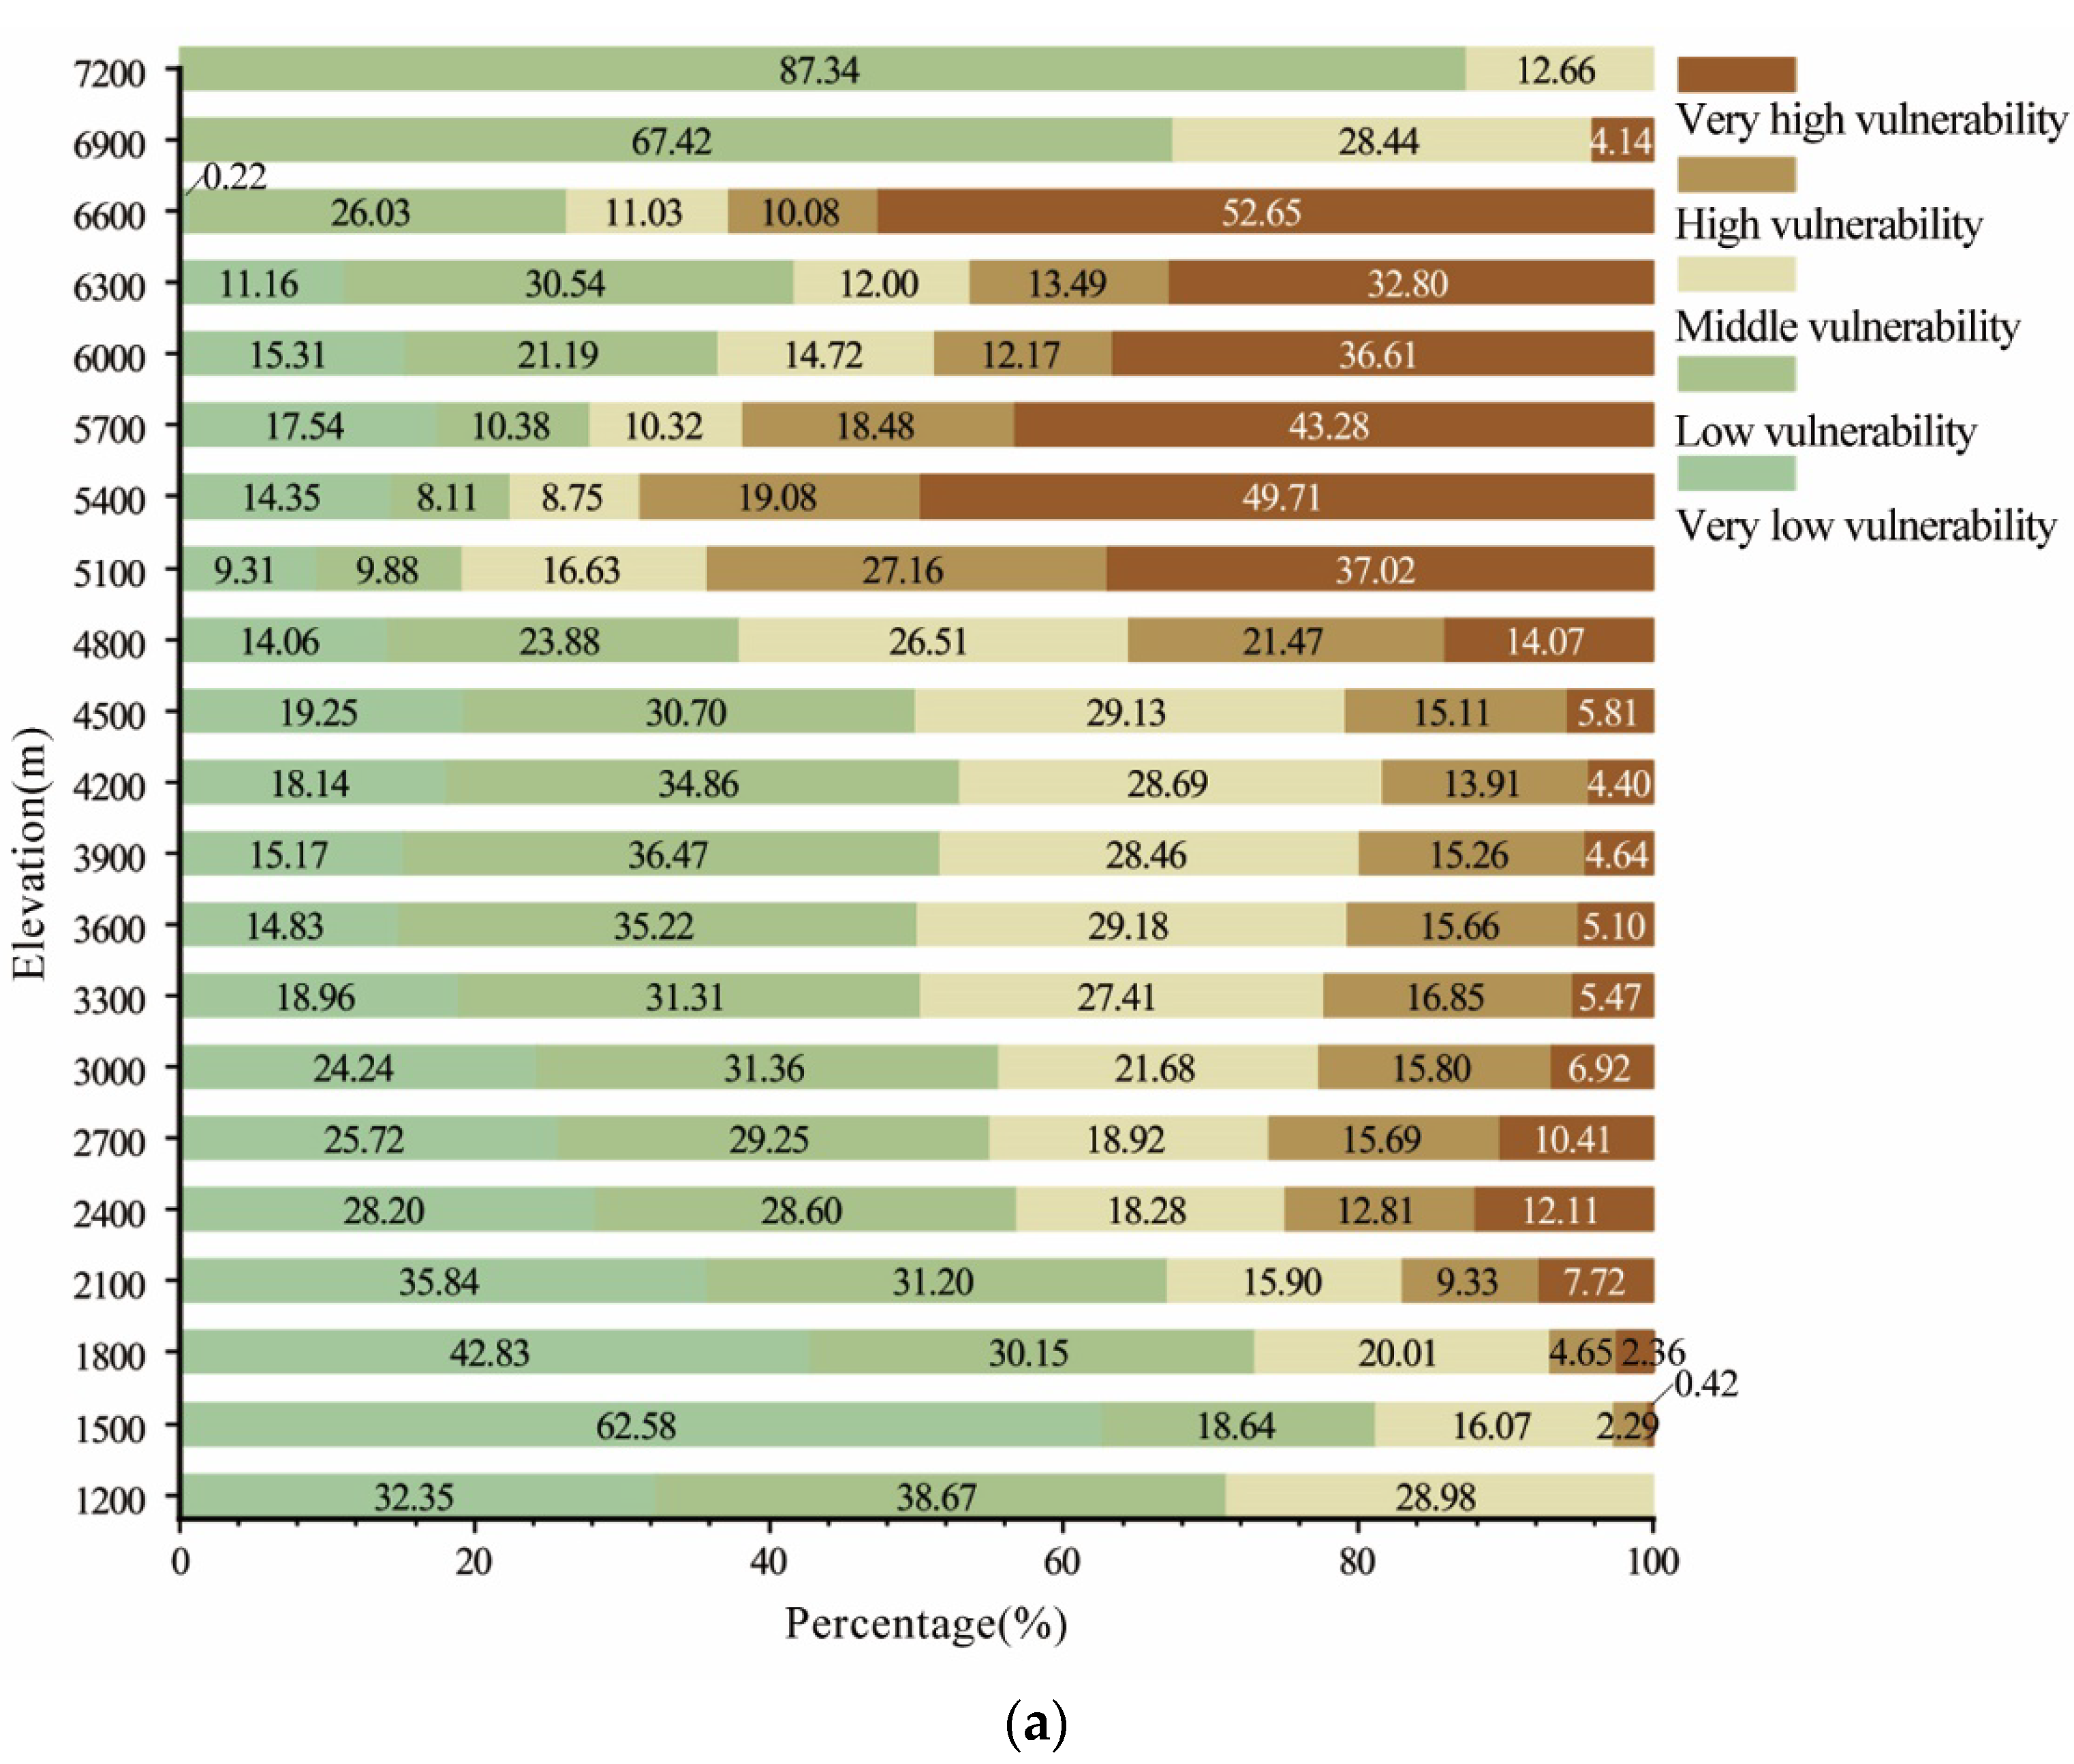
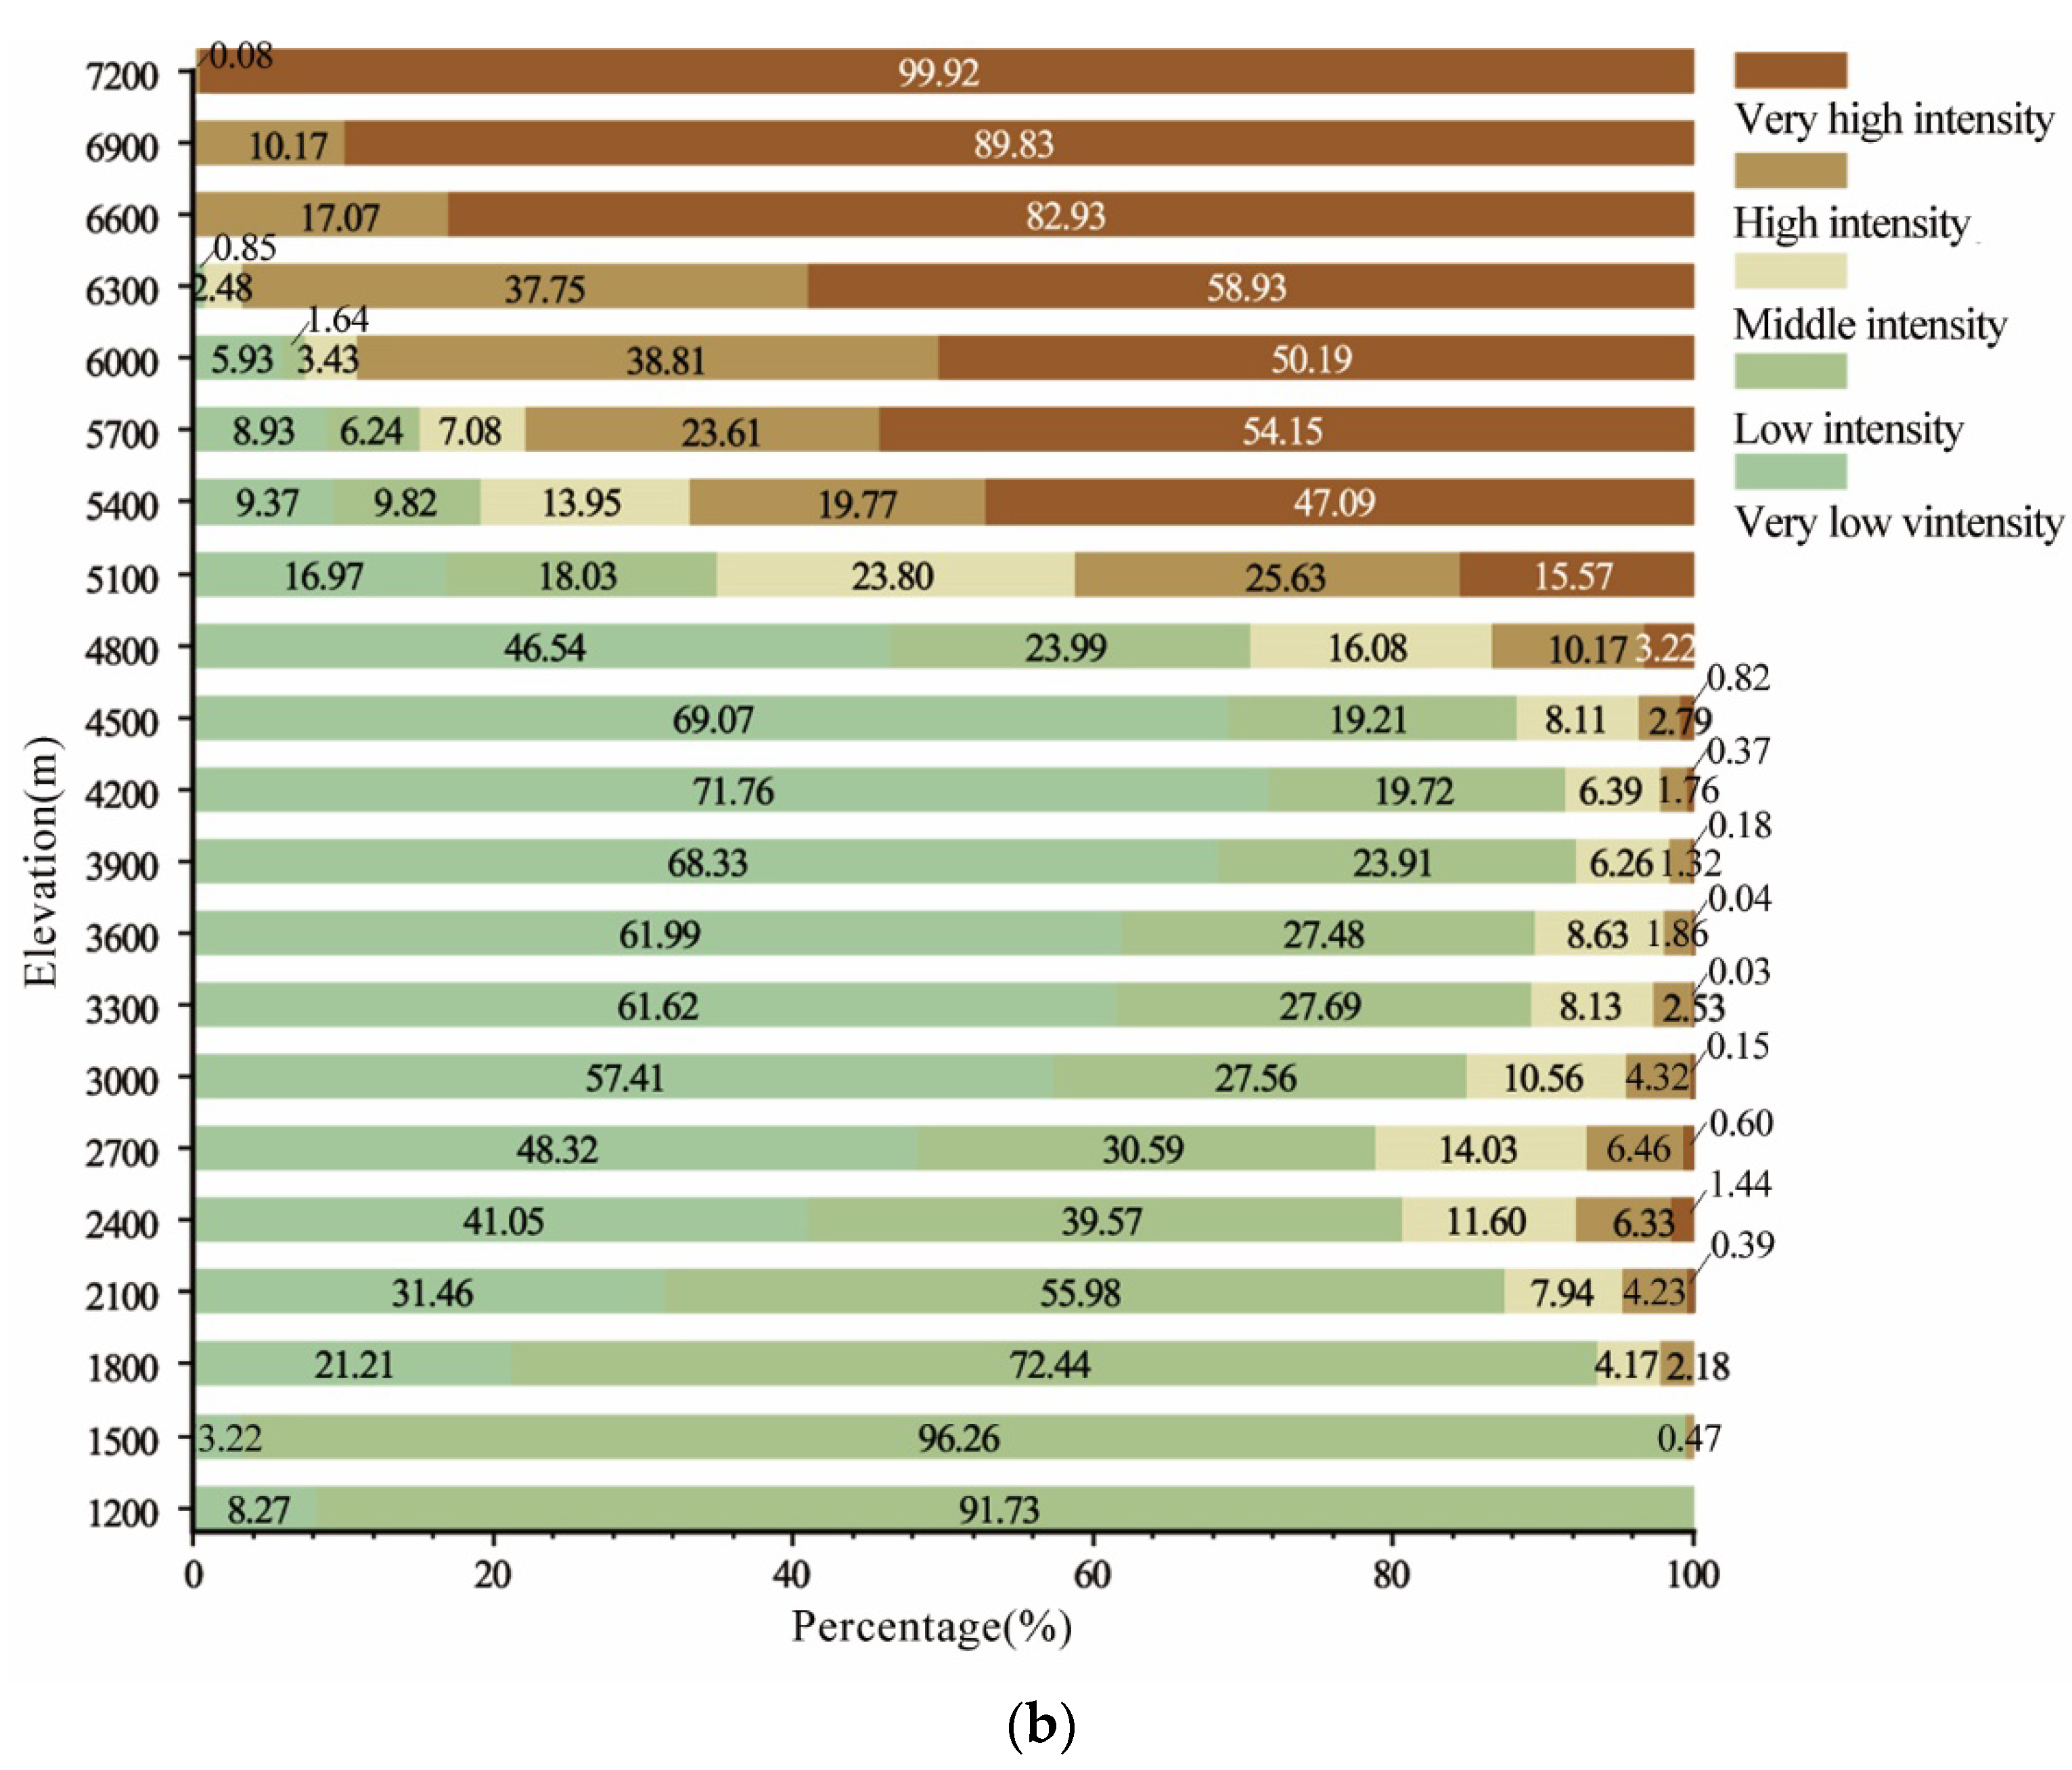
3.4. Vertical Distribution Characteristics of LVI and LHAI Values

As shown in Figure 6a, the low-LVI area decreased and then increased, while the high-LVI area increased and then decreased. Low-LVI areas were mainly found below 4500 m elevation. When the elevation was 4500–6600 m, high-LVI areas gradually replaced low-LVI-value areas. At elevations of 5400–6600 m, high-LVI-value areas dominated. When the elevation exceeded 6600 m, the LVI values began to decline sharply. At an elevation of 7200 m, the very high-LVI areas disappeared, and the landscape was dominated by low LVI values. This is because land at this elevation range is covered with ice and snow all year round, and the landscape system is relatively stable.
The LHAI values first decreased and then increased (Figure 6b). Low-LHAI areas covered most mountain areas below 2700 m. This area mainly included valleys where the settlements are located. It reflected the low socio-economic development and low development intensity of land in Ganzi Prefecture. Then, the LHAI shifted from low to very low values at medium- and high-level elevations (2700–4500 m), in the local traditional grazing area. There was significantly less interference of traditional grazing activities on the landscape pattern than in the urban construction areas of the valleys. When elevations exceeded 4500 m, the LHAI values clearly changed from low to high. Especially at elevations above 6300 m, the very high-LHAI area completely covered the study area. Although human activities hardly disturb this area, the landscape type is composed of glaciers, permanent snow, and barren land. A high weight was given to unused lands and thus there were very high LHAI values.

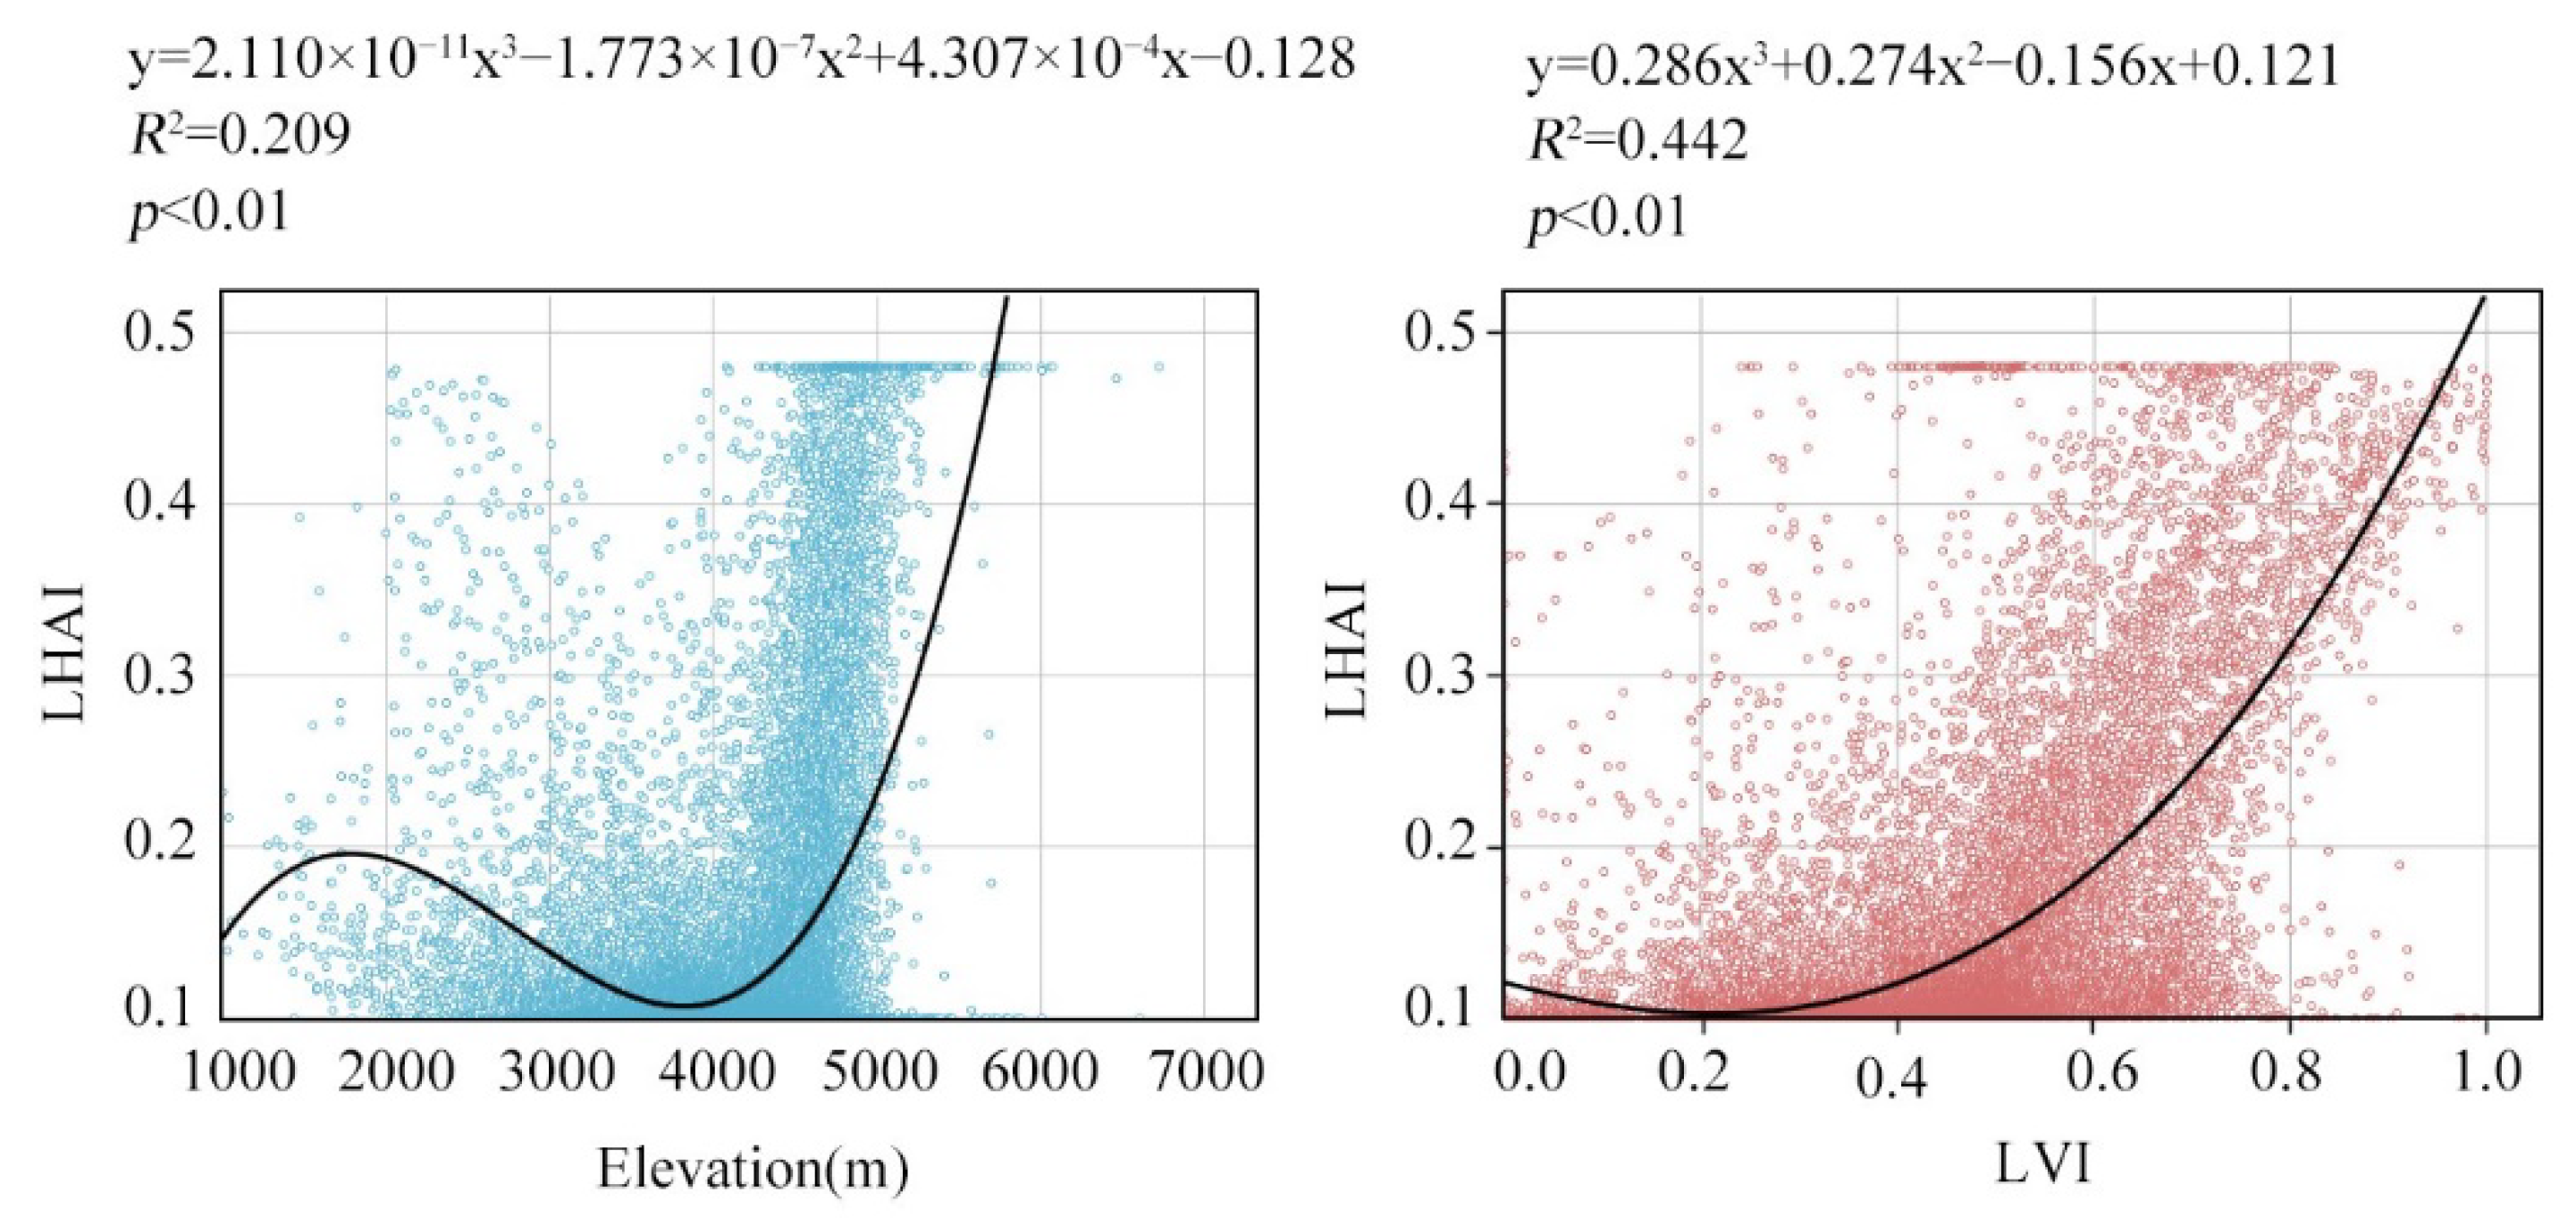
3.5. Spearman Correlation Analysis of LVI, LHAI, and Elevation

Spearman correlation analysis (Table 7) showed that both LVI and LHAI were not correlated with elevation below 4500 m. Regions at 4500–5400 m had a positive correlation between LHAI and elevation. However, there was a weak positive correlation to a negative correlation between LVI and elevation. In addition, there was a significant positive correlation between LVI and LHAI; moreover, it changed with elevation. A negative correlation between LVI and LHAI was only observed at elevations of 985–1200 m. Then, with the increase in elevation, there was always a significant positive correlation between LVI and LHAI. An extremely positive correlation (coefficient greater than 0.6) occurred at 3900–5100 m elevation. However, when the elevation exceeded 6000 m, all the correlations disappeared. Fitting the relationship between LHAI and elevation, LVI and LHAI, as shown in Figure 7, the goodness of fit indices were 0.209 and 0.442, respectively.

4. Discussion

4.1. Analysis of Landscape Pattern Vulnerability Drivers

In this paper, considering its regional development strategy and ecological characteristics [67], Ganzi Prefecture was divided into eastern (Kangding, Luding, Danba, Jiulong, Yajiang and Daofu countries), northern (Shiqu, Dege, Baiyu, Ganzi, Seda, Luhuo, and Xinlong counties), and southern (Batang, Litang, Derong, Xiangcheng, and Daocheng counties) regions to analyze the drivers of LVI distribution (Figure 8). Although the eastern region was the most socio-economically developed and the main population agglomeration area, Kangding, Luding, and Yajiang also had low LVI values. This could be due to two reasons. First, this was an important water conservation area in the upper reaches of the Yangtze River. It also contained the Gongga Mountain National Nature Reserve and the Gexigou Provincial Nature Reserve. It was a national key ecological function area, which effectively protects the integrity of the landscape pattern. Secondly, with the control of the urban development boundary, the layout and structure of urban and rural lands have been optimized. The landscape pattern has evolved from a disordered state to an ordered one, so that its stability has gradually improved. Similarly, Salvati et al. [68], Zhou et al. [69], and Wang et al. [70] pointed out that rational land-use policies for ecological development can increase the number of landscape types and stabilize the landscape pattern, which will reduce the landscape vulnerability. In addition, the very high- and high-vulnerability areas were mainly located in Jiulong, Danba, and Daofu Counties, which are important mineral resource development areas in Sichuan Province. Although mine development has brought huge production benefits, it has destroyed the stable mountain landscape pattern and caused serious ecological problems. Previous studies [6,71] indicated that mining activities could stimulate the rapid expansion of urban and industrial lands. Farmland, grassland, and gardens have been converted into urban and bare land. The aggregation and connectivity of various landscapes has been reduced, creating a scattered landscape pattern. The regional natural ecosystem gradually became sensitive and unstable.
The southern region belongs to the economically sub-developed area of Ganzi Prefecture. Low- and very low-vulnerability areas that are favorable for tourism development were mainly located in Litang and Daocheng counties. This result was consistent with the findings of Sun et al. [72] and Wang et al. [73] that responsible land resource use can mitigate the conflict between economic construction and environmental protection. Conversely, the high- and very high-vulnerability areas were mainly located in the arid river valley downstream of the Jinsha River. Intensive anthropogenic disturbance occurs in this area with relatively low elevations and gentle and concave slopes, as these areas are easy and convenient to access [74]. Thus, the long-term construction of hydropower facilities, as well as the disorderly reclamation of barren sloping land and the conversion of concentrated deforested land into construction land and arable land has caused severe soil erosion and debris flows in these arid valleys.
The northern region is the most remote, least developed, and least competitive region. Although the northwest of this area is primary natural grassland, excessive grazing has resulted in grassland degradation and salinization. Serious rodent damage and compaction problems in farming and pastoral areas have occurred. Thus, the high- and very high-vulnerability areas were clustered in blocks. As suggested by Oliva et al. [75], excessive grazing has led to the erosion of unstable soils and damage to perennial vegetation, causing farm production losses. In addition, although there was a large area of unused land, the unsustainable land use has led to the serious desertification of unused land. The middle-vulnerability areas were clustered in blocks in this area. The moderately vulnerable areas were distributed near the Yalong River and its tributaries. Driven by economic development, the construction of hydropower stations and the mining of sand and gravel have also caused a certain degree of damage to the water system. As Cai et al. [76] reported, as the intensity of development and utilization increased, the ecological pressure increased sharply, and the ecological vulnerability of the landscape increased.
In general, social and economic factors have a stronger impact on the landscape vulnerability than natural factors and are now the main factors affecting local landscape vulnerability in Ganzi Prefecture.

4.2. How Elevation Impacts LVI and LHAI

The vast elevation difference is one of the unique topographic features of mountainous areas, which is an important environmental factor affecting land use and carrying capacity [77]. In this study, areas with low- and medium-level elevations had relatively flat or hilly terrain dominated by waters, construction land and cultivated land, and were gathering areas for population and cities. The use of land resources in the region is varied and complex [78,79]. The vulnerability of the landscape pattern was significantly affected by topography and human activities, but it did not have a strong correlation with elevation. Jin et al. [80] and Song et al. [81] also found that low elevation areas were vulnerable to human activities, and the original continuous landscape matrix was easily broken in the Tibetan Plateau and the Songnen high plain.
Both LVI and LHAI transformed from negative to positive correlations with high elevation regions. Dwarf woodland and shrub-meadows dominated this area. Changes in climate factors caused by elevation played a key role in the formation of landscape patterns. As Zong et al. [44] pointed out, almost all the climatic variables were significantly (p ≤ 0.05) related to elevation in the Hengduan Mountains, and elevation was considered a crucial factor affecting the cover and richness of the plant community. Feng et al. [82] also suggested spatial differences in temperature, light, and water conservation capacity of the high mountains would enhance the constraints of terrain factors on land use. In this study, correlations between LVI and LHAI and elevation reached a maximum value at 4500–4800 m. This could be due to the topography of the Hengduan Mountains creating the “Massenerhebung” Effect, which distributes species or biomes at higher elevations [83], and the macro-landforms produce a thermos-dynamic impact that lengthens and warms the growing season in the central mountain ranges [84]. Ultimately, vertical zone boundaries such as forest and snow lines will be higher in the center of the mountain system than at the periphery. In addition, Buzhdygan et al. [85] suggested that human grazing practices on grassland ecosystems could become more obvious with increasing elevation, which may lead to the severe spatial fragmentation of the landscape [86]. Reclamation and deforestation in high mountains in order to meet food and timber needs will result in highly vulnerable regional landscapes [87,88,89]. In this area, there was a significant positive correlation between LVI and LHAI. Therefore, increasing human activities and harsh environments could be the main factors driving landscape pattern fragmentation. When elevations exceeded 6000 m, all correlations with elevation disappeared. This could be due to the homogenization of the landscape in this area.

4.3. Limitations

This paper only analyzed the current spatial distribution of LVI in the study area, which was inadequate because there were no comparisons over multiple time scales. Secondly, the impacts of natural factors, such as complex topography and climate, on landscape ecology should not be ignored. Also, social factors such as the degree of economic development, urbanization, and industrialization were not quantitatively analyzed. Therefore, research should be conducted on the driving forces of landscape ecological vulnerability based on multiple impact factors.

5. Conclusions

The study found that low- and middle-vulnerability areas dominated the landscape ecological vulnerability in Ganzi. Overall, the northern region had the highest landscape pattern vulnerability, followed by the southern region, while the eastern region had a relatively stable and healthy landscape pattern. At the county level, Derong, Batang, Shiqu, Dege and Jiulong were the most vulnerable. In addition, the study found that Ganzi had fragile alpine ecosystems that were highly sensitive to human activities, such as the level of human production and living, as well as land use guided by national policies. The spatial distribution of LHAI values varied greatly. The LVI was significantly impacted by the severe soil erosion in the lower Jinsha River basin, overgrazing in the upper Yalong River basin, and ecological damage caused by the construction of large hydropower facilities and mining activities. Elevation differences also accounted for the observed LVI variability. Particularly at elevations above 4500 m, the study area showed a high level of vulnerability.
The results suggested that unsustainable anthropogenic disturbances, such as uncontrolled construction land expansion and deforestation, excessive grazing, and farming, should be restricted. Integrated desertification management guided by policies premised on ecological development is effective and we suggest promoting it in the study area. In addition, there is a need to focus on restoring and protecting native vegetation at high and extremely high elevations (>3600 m).

Author Contributions

Conceptualization, J.S. and H.Z.; software, J.S.; formal analysis, J.S.; resources, H.Z. and L.Z.; writing—original draft preparation, J.S.; writing—review and editing, J.S. and H.Z.; visualization, J.S.; supervision, H.Z. and L.Z.; project administration and funding acquisition, H.Z. and L.Z. All authors have read and agreed to the published version of the manuscript.

Funding

This work was supported by the National Natural Science Foundation of China (grant No. 31971716), the National Natural Science Foundation of China (grant No. 52178059), and the horizontal project of the China Railway Second Institute (grant No. KYY2019132).

Institutional Review Board Statement

Not applicable.

Informed Consent Statement

Not applicable.

Data Availability Statement

China Geospatial Data Cloud Platform provides digital elevation data. The China Bureau of statistics and the Sichuan Provincial Bureau of statistics provided the relevant socio-economic data.

Acknowledgments

The authors would like to thank the anonymous reviewers for their valuable comments.

Conflicts of Interest

The authors declare no conflict of interest.

References

  1. Wu, J. Landscape Ecology-Pattern, Process, Scale and Hierarchy; Higher Education Press: Beijing, China, 2000; pp. 100–110. [Google Scholar]
  2. Turner, M.G.; Romme, W.H.; Gardner, R.H.; O’Neill, R.V.; Kratz, T.K. A revised concept of landscape equilibrium: Disturbance and stability on scaled landscapes. Landsc. Ecol. 1993, 8, 213–227. [Google Scholar] [CrossRef]
  3. Zhang, H.; Chen, H.; Shi, Q.; Zhang, M.; Liu, D. Spatiotemporal evolution and driving factors of landscape ecological vulnerability in Shaanxi Province. Arid Zone Res. 2020, 37, 496–505. [Google Scholar] [CrossRef]
  4. Yang, L.; Ao, Y.; Ke, J.; Lu, Y.; Liang, Y. To walk or not to walk? Examining non-linear effects of streetscape greenery on walking propensity of older adults. J. Transp. Geogr. 2021, 94, 103099. [Google Scholar] [CrossRef]
  5. Yang, L.; Tang, X.; Yang, H.; Meng, F.; Liu, J. Using a system of equations to assess the determinants of the walking behavior of older adults. Trans. GIS 2022, 26, 1339–1354. [Google Scholar] [CrossRef]
  6. Dadashpoor, H.; Azizi, P.; Moghadasi, M. Land use change, urbanization, and change in landscape pattern in a metropolitan area. Sci. Total Environ. 2019, 655, 707–719. [Google Scholar] [CrossRef] [PubMed]
  7. Yang, L.; Liang, Y.; He, B.; Lu, Y.; Gou, Z. COVID-19 effects on property markets: The pandemic decreases the implicit price of metro accessibility. Tunn. Undergr. Space Technol. 2022, 125, 104528. [Google Scholar] [CrossRef]
  8. Yang, L.; Liu, J.; Liang, Y.; Lu, Y.; Yang, H. Spatially varying effects of street greenery on walking time of older adults. ISPRS Int. J. Geo-Inf. 2021, 10, 596. [Google Scholar] [CrossRef]
  9. Liu, Y.; Yao, C.; Wang, G.; Bao, S. An integrated sustainable development approach to modeling the eco-environmental effects from urbanization. Ecol. Indic. 2011, 11, 1599–1608. [Google Scholar] [CrossRef]
  10. Chen, L.; Sun, R.; Liu, H. Eco-environmental effects of urban landscape pattern changes: Progresses, problems, and perspectives. Acta Ecol. Sin. 2013, 33, 1042–1050. [Google Scholar] [CrossRef] [Green Version]
  11. Zhao, Z.; Sharifi, A.; Dong, X.; Shen, L.; He, B.-J. Spatial Variability and Temporal Heterogeneity of Surface Urban Heat Island Patterns and the Suitability of Local Climate Zones for Land Surface Temperature Characterization. Remote Sens. 2021, 13, 4338. [Google Scholar] [CrossRef]
  12. Qi, J.; He, B.; Wang, M.; Zhu, J.; Fu, W. Do grey infrastructures always elevate urban temperature? No, utilizing grey infrastructures to mitigate urban heat island effects. Sustain. Cities Soc. 2019, 46, 101392. [Google Scholar] [CrossRef]
  13. Liu, C.; Zhang, F.; Johnson, V.C.; Duan, P.; Kung, H. Spatio-temporal variation of oasis landscape pattern in arid area: Human or natural driving? Ecol. Indic. 2021, 125, 107495. [Google Scholar] [CrossRef]
  14. Zang, Y.; Liu, Y.; Yang, Y. Land use pattern change and its topographic gradient effect in the mountainous areas: A case study of Jinggangshan city. J. Nat. Resour. 2019, 34, 1391–1404. [Google Scholar] [CrossRef]
  15. Liu, J.; Zhao, D.; Tian, X.; Zhao, L. Landscape pattern dynamics and driving forces analysis in the Sanjiang Plain from 1954 to 2010. Acta Ecol. Sin. 2014, 34, 3234–3244. [Google Scholar] [CrossRef]
  16. Zhang, Z.; Liu, S.; Dong, S. Ecological Security Assessment of Yuan River Watershed Based on Landscape Pattern and Soil Erosion. Procedia Environ. Sci. 2010, 2, 613–618. [Google Scholar] [CrossRef] [Green Version]
  17. Ma, L.; Bo, J.; Li, X.; Fang, F.; Cheng, W. Identifying key landscape pattern indices influencing the ecological security of inland river basin: The middle and lower reaches of Shule River Basin as an example. Sci. Total Environ. 2019, 674, 424–438. [Google Scholar] [CrossRef]
  18. Wang, L.; Xi, C.; Fu, Q.; Su, Y. Landscape Pattern-Based Eco-Environment Vulnerability Assessment of Three Gorges Reservoir Area. Res. Environ. Sci. 2010, 23, 1268–1273. [Google Scholar] [CrossRef]
  19. Bourgoin, C.; Oszwald, J.; Bourgoin, J.; Gond, V.; Blanc, L.; Dessard, H.; Phan, T.V.; Sist, P.; Läderach, P.; Reymondin, L. Assessing the ecological vulnerability of forest landscape to agricultural frontier expansion in the Central Highlands of Vietnam. Int. J. Appl. Earth Obs. 2020, 84, 101958. [Google Scholar] [CrossRef]
  20. Wang, X.; Zhong, X.; Liu, S.; Liu, J.; Wang, Z.; Li, M. Regional assessment of environmental vulnerability in the Tibetan Plateau: Development and application of a new method. J. Arid Environ. 2008, 72, 1929–1939. [Google Scholar] [CrossRef]
  21. Feyissa, N.; Gebremariam, E. Mapping of landscape structure and forest cover change detection in the mountain chains around Addis Ababa: The case of Wechecha Mountain, Ethiopia. Remote Sens. Appl. Soc. Environ. 2018, 11, 254–264. [Google Scholar] [CrossRef]
  22. Kumar, M.; Kalra, N.; Singh, H.; Sharma, S.; Rawat, P.S.; Singh, R.K.; Gupta, A.K.; Kumar, P.; Ravindranath, N.H. Indicator-based vulnerability assessment of forest ecosystem in the Indian Western Himalayas: An analytical hierarchy process integrated approach. Ecol. Indic. 2021, 125, 107568. [Google Scholar] [CrossRef]
  23. Campagnaro, T.; Frate, L.; Carranza, M.L.; Sitzia, C. Multi-scale analysis of alpine landscapes with different intensities of abandonment reveals similar spatial pattern changes: Implications for habitat conservation. Ecol. Indic. 2017, 74, 147–159. [Google Scholar] [CrossRef]
  24. Kulakowski, D.; Bebi, P.; Rixen, C. The interacting effects of land use change, climate change and suppression of natural disturbances on landscape forest structure in the Swiss Alps. Oikos 2011, 120, 216–225. [Google Scholar] [CrossRef]
  25. Song, G.; Chen, Y.; Tian, M.; Lv, S.; Zhang, S.; Liu, S. The Ecological Vulnerability Evaluation in Southwestern Mountain Region of China Based on GIS and AHP Method. Procedia Environ. Sci. 2010, 2, 465–475. [Google Scholar] [CrossRef] [Green Version]
  26. Ren, Z.; Zhang, H. Effects of land use change on landscape pattern vulnerability in Yinchuan Basin, Northwest China. Chin. J. Appl. Ecol. 2016, 27, 243–249. [Google Scholar] [CrossRef]
  27. Ren, J.; Yang, K.; Chen, Q.; Mo, S.; Wang, Z.; Feng, T. Spatio-Temporal Variation of Vulnerability of Landscape Ecology of Caohai Wetland. J. Ecol. Rural Environ. 2018, 34, 232–239. [Google Scholar] [CrossRef]
  28. Xu, Y.; Sun, X.; Zhang, D.; Shan, R.; Liu, F. Landscape pattern and its vulnerability of Nansihu Lake basin during 1980–2015. Chin. J. Appl. Ecol. 2018, 29, 635–642. [Google Scholar] [CrossRef]
  29. Qian, D.; Yang, C.; Xiu, L. Land cover change and landscape pattern vulnerability response in Muli mining and its surrounding areas in the Qinghai-Tibet Platea. J. Glaciol. Geocryol. 2020, 42, 1334–1343. [Google Scholar] [CrossRef]
  30. Liu, J.; Liu, X.; Hou, L. Changes and ecological vulnerability of landscape pattern in Eastern Qilian Mountain. Arid Land Geogr. 2012, 35, 795–805. [Google Scholar] [CrossRef]
  31. Guo, B.; Jiang, L.; Luo, W.; Yang, G.; Ge, D. Study of an evaluation method of ecosystem vulnerability based on remote sensing in a southwestern karst mountain area under extreme climatic conditions. Acta Ecol. Sin. 2017, 37, 7219–7231. [Google Scholar] [CrossRef]
  32. Zhang, X.; Wang, K.; Zhang, W.; Chen, H.; He, X. The quantitative assessment of eco-environment vulnerability in karst regions of Northwest Guangxi. Acta Ecol. Sin. 2009, 29, 749–757. [Google Scholar] [CrossRef]
  33. Donoso, M.E.; Sarmiento, F.O. Changing mountain farmscapes: Vulnerability and migration drivers in the Paute River watershed, Southern Ecuador. J. Mt. Sci. 2021, 18, 1902–1919. [Google Scholar] [CrossRef]
  34. Jha, S.K.; Negi, A.K.; Alatalo, J.M.; Negi, R.S. Socio-ecological vulnerability and resilience of mountain communities residing in capital-constrained environments. Mitig. Adapt. Strateg. Glob. Chang. 2021, 26, 38. [Google Scholar] [CrossRef] [PubMed]
  35. Schneiderbauer, S.; Fontanella Pisa, P.; Delves, J.L.; Pedoth, L.; Rufat, S.; Erschbamer, M.; Thaler, T.; Carnelli, F.; Granados-Chahin, S. Risk perception of climate change and natural hazards in global mountain regions: A critical review. Sci. Total Environ. 2021, 784, 146957. [Google Scholar] [CrossRef]
  36. Fan, J.; Yang, C.; Bao, W.; Liu, J.; Li, X. Distribution Scope and District Statistical Analysis of Dry Valleys in Southwest China. Mt. Res. 2020, 38, 303–313. [Google Scholar] [CrossRef]
  37. Duan, X.; Zhang, G.; Rong, L.; Fang, H.; He, D.; Feng, D. Spatial distribution and environmental factors of catchment scale soil heavy metal contamination in the dry–hot valley of Upper Red River in southwestern China. Catena 2015, 135, 59–69. [Google Scholar] [CrossRef]
  38. Dong, Y.; Xiong, D.; Su, Z.; Li, J.; Yang, D.; Shi, L.; Liu, G. The distribution of and factors influencing the vegetation in a gully in the dry–hot valley of southwest China. Catena 2014, 116, 60–67. [Google Scholar] [CrossRef]
  39. Wang, G.; Liu, G.; Shen, Z.; Wang, W. Research progress and future perspectives on the landscape ecology of mountainous areas. Acta Ecol. Sin. 2017, 37, 3967–3981. [Google Scholar] [CrossRef] [Green Version]
  40. Zheng, D.; Zhao, D. Characteristics of natural environment of the Tibetan Plateau. Sci. Technol. Rev. 2017, 35, 13–22. [Google Scholar]
  41. Zhao, G.; Hong, D.; Wei, X. A review grassland desertification characteristics of Qinghai-Tibet Plateau. Grassl. Turf. 2012, 32, 83–89. [Google Scholar] [CrossRef]
  42. Rong, T.; Liu, E.; Zhang, Y.; Schinnerl, J.; Sun, W.; Chen, G. Genetic diversity and population structure of Amorphophallus albus, a plant species with extremely small populations (PSESP) endemic to dry–hot valley of Jinsha River. BMC Genet. 2020, 21, 102–113. [Google Scholar] [CrossRef]
  43. Shi, Z.; Deng, W.; Zhang, S. Spatial pattern and spatio temporal change of territory space in Hengduan mountains region in recent 25 years. Geogr. Res. 2018, 37, 607–621. [Google Scholar] [CrossRef]
  44. Zong, H.; Sun, J.; Zhou, L.; Bao, F.; Zheng, X. Effect of altitude and climatic parameters on shrub-meadow community composition and diversity in the dry valley region of the eastern Hengduan Mountains, China. J. Mt. Sci. 2022, 19, 1139–1155. [Google Scholar] [CrossRef]
  45. Zhang, X. A Case Study of Geological Hazards Risk Assessement in a Large Scale Mountainous Environment. Doctoral Dissertation, Chengdu University of Technology, Chengdu, China, 2011. [Google Scholar]
  46. Wang, Q.; Han, Y.; Guo, B.; Wang, M.; Ran, W.; Chen, J. Temporal and spatial evolution of climate dry and wet conditions in ganzi in the past 57 years. Chin. J. Agrometeorol. 2019, 40, 435–443. [Google Scholar] [CrossRef]
  47. Ganzi Tibetan Autonomous Prefecture Bureau of Natural Resource and Planning. Available online: http://gtj.gzz.gov.cn/gzzrzy/c101362/202007/06ab0a26a95f41a38289b52bbe8d1f7d.shtml (accessed on 15 April 2022).
  48. Sichuan Statistical Yearbook. Available online: https://www.yearbookchina.com/navipage-n3020013151000107.html (accessed on 15 April 2022).
  49. Zhao, D.; Arshad, M.; Wang, J.; Triantafilis, J. Soil exchangeable cations estimation using Vis-NIR spectroscopy in different depths: Effects of multiple calibration models and spiking. Comput. Electron. Agric. 2021, 182, 105990. [Google Scholar] [CrossRef]
  50. Zhao, D.; Li, N.; Zare, E.; Wang, J.; Triantafilis, J. Mapping cation exchange capacity using a quasi-3d joint inversion of EM38 and EM31 data. Soil Tillage Res. 2020, 200, 104618. [Google Scholar] [CrossRef]
  51. Information Service Platform for Standardization of Natural Resources. Available online: http://www.nrsis.org.cn/portal/stdDetail/210854. (accessed on 15 April 2022).
  52. Geospatial Data Cloud. Available online: http://www.gscloud.cn. (accessed on 15 April 2022).
  53. Han, Z.; Li, J.; Shentu, Y.; Xu, C. Analysis of ecological security of wetland in Liaohe River delta based on the landscape pattern. Ecol. Environ. Sci. 2010, 19, 701–705. [Google Scholar] [CrossRef]
  54. Zhang, Y.; Qu, J.; Li, D.; Ye, M.; He, Q. Study of the Landscape Pattern Vulnerability and Spatial Correlation Patterns in the Harbin Section of the Songhua River Basin. Geogr. Geo-Inf. Sci. 2019, 35, 105–110. [Google Scholar]
  55. Sun, H.; Zhang, Z. Change of Landscape Pattern Vulnerability in the Songhua River Basin in Jilin Province and Its Driving Forces. Arid Zone Res. 2019, 36, 1005–1014. [Google Scholar] [CrossRef]
  56. Wu, X.; Tang, S. Comprehensive evaluation of ecological vulnerability based on the AHP-CV method and SOM model: A case study of Badong County, China. Ecol. Indic. 2022, 137, 108758. [Google Scholar] [CrossRef]
  57. Wu, J.; Wang, Z.; Zhang, L.; Song, J. Research Progresses on Driving Forces of the Changes of Landscape Pattern. Prog. Geogr. 2012, 31, 1739–1746. [Google Scholar] [CrossRef]
  58. Liu, Y.; Li, J.; Yuan, Q.; Shi, X.; Pu, R.; Yang, L.; Lu, X. Comparative research on the impact of human activities on changes in coastline and landscape in bay areas: A case study with Xiangshangang Bay, China and Tampa Bay, USA. Acta Geogr. Sin. 2016, 71, 86–103. [Google Scholar] [CrossRef]
  59. Zhang, Z.; Zhao, W. Effects of land consolidation on ecological environment. Trans. Chin. Soc. Agric. Eng. 2007, 23, 281–285. [Google Scholar]
  60. Singh, M.; Sinha, R. Evaluating dynamic hydrological connectivity of a floodplain wetland in North Bihar, India using geostatistical methods. Sci. Total Environ. 2019, 651, 2473–2488. [Google Scholar] [CrossRef] [PubMed]
  61. Hou, K.; Tao, W.; Wang, L.; Li, X. Study on hierarchical transformation mechanisms of regional ecological vulnerability and its applicability. Ecol. Indic. 2020, 114, 106343. [Google Scholar] [CrossRef]
  62. Yang, L.; Chau, K.W.; Szeto, W.Y.; Cui, X.; Wang, X. Accessibility to transit, by transit, and property prices: Spatially varying relationships. Transp. Res. Part D-Transp. Environ. 2020, 85, 102387. [Google Scholar] [CrossRef]
  63. Yang, L.; Chu, X.; Gou, Z.; Yang, H.; Lu, Y.; Huang, W. Accessibility and proximity effects of bus rapid transit on housing prices: Heterogeneity across price quantiles and space. J. Transp. Geogr. 2020, 88, 102850. [Google Scholar] [CrossRef]
  64. Anselin, L. Local indicators of spatial association. Geogr. Anal. 1995, 27, 93–115. [Google Scholar] [CrossRef]
  65. Zhang, Y.; Zhang, F.; Wang, J.; Ren, Y.; Wang, D. Evaluation of the Landscape Patterns Vulnerability and Analysis of Spatial-Temporal Patterns in the Typical Region of the Ebinur Lake. J. Catastrophol. 2016, 31, 222–229. [Google Scholar] [CrossRef]
  66. Zhou, C.; Chen, W.; Qian, J.; Li, B.; Zhang, B. Research on the Classification System of Digital Land Geomorphology of 1:1000000 in China. J. Geogr. Inf. Sci. 2009, 11, 707–724. [Google Scholar] [CrossRef]
  67. Pema, D.; Xiao, Y.; Ouyang, Z.; Wang, L. Gross ecosystem product accounting for the Garzê Tibetan Autonomous Prefecture. Acta Ecol. Sin. 2017, 37, 6302–6312. [Google Scholar] [CrossRef]
  68. Salvati, L.; Tombolini, I.; Perini, L.; Ferrara, A. Landscape changes and environmental quality: The evolution of land vulnerability and potential resilience to degradation in Italy. Reg. Environ. Chang. 2013, 13, 1223–1233. [Google Scholar] [CrossRef]
  69. Zhou, Y.; Pu, L.; Zhu, M. Coastal Landscape Vulnerability Analysis in Eastern China-Based on Land-Use Change in Jiangsu Province. Int. J. Environ. Res. Public Health 2020, 17, 1702. [Google Scholar] [CrossRef] [PubMed] [Green Version]
  70. Wang, Q.; Li, W.; Kou, X.; Fu, J.; Hu, H. Temporal and Spatial Evolution Characteristics of Landscape Pattern and Ecological Vulnerability in Yongtaiwen Coastal Zone. Bull. Soil Water Conserv. 2020, 40, 297–303+325. [Google Scholar] [CrossRef]
  71. Assari, A.; Mahesh, T. Demographic comparative in heritage texture of Isfahan City. J. Geogr. Reg. Plan. 2011, 4, 463–470. [Google Scholar]
  72. Sun, Y.; Liu, S.; Dong, Y.; An, Y.; Shi, F.; Dong, S.; Liu, G. Spatio-temporal evolution scenarios and the coupling analysis of ecosystem services with land use change in China. Sci. Total Environ. 2019, 681, 211–225. [Google Scholar] [CrossRef]
  73. Wang, B.; Ding, M.; Li, S.; Liu, L.; Ai, J. Assessment of landscape ecological risk for a cross-border basin: A case study of the Koshi River Basin, central Himalayas. Ecol. Indic. 2020, 117, 106621. [Google Scholar] [CrossRef]
  74. Liu, W.; Xu, X.; Luo, J.; Shen, Z.; Zhong, Q. Spatial distribution of land cover and vegetation activity along topographic gradient in an arid river valley, SW China. J. Mt. Sci. 2009, 6, 274–285. [Google Scholar] [CrossRef] [Green Version]
  75. Oliva, G.; Gaitan, J.; Ferrante, D. Humans Cause Deserts: Evidence of Irreversible Changes in Argentinian Patagonia Rangelands. In The End of Desertification; Behnke, R., Mortimore, M., Eds.; Springer: Berlin/Heidelberg, Germany, 2016; pp. 363–386. [Google Scholar]
  76. Cai, X.; Li, Z.; Liang, Y. Tempo-spatial changes of ecological vulnerability in the arid area based on ordered weighted average model. Ecol. Indic. 2021, 133, 108398. [Google Scholar] [CrossRef]
  77. Huang, M.; Li, Y.; Li, M.; Chen, S.; Zeng, C.; Zhang, B.; Xia, C. Coupling response of human activity intensity and landscape pattern in the Three Gorges Reservoir Area. Acta Ecol. Sin. 2022, 10, 1–15. [Google Scholar] [CrossRef]
  78. Abdullah, S.A.; Nakagoshi, N. Changes in landscape spatial pattern in the highly developing state of Selangor, peninsular Malaysia. Landsc. Urban Plan. 2006, 77, 263–275. [Google Scholar] [CrossRef]
  79. Yohannes, H.; Soromessa, T.; Argaw, M.; Dewan, A. Impact of landscape pattern changes on hydrological ecosystem services in the Beressa watershed of the Blue Nile Basin in Ethiopia. Sci. Total Environ. 2021, 793, 148559. [Google Scholar] [CrossRef] [PubMed]
  80. Jin, X.; Jin, Y.; Mao, X. Ecological risk assessment of cities on the Tibetan Plateau based on land use/land cover changes—Case study of Delingha City. Ecol. Indic. 2019, 101, 185–191. [Google Scholar] [CrossRef]
  81. Song, G.; Wang, P. Spatial Pattern of Land Use Along the Terrain Gradient of County in Songnen High Plain: A Case Study of Bayan County. Sci. Geogr. Sin. 2017, 37, 1218–1225. [Google Scholar] [CrossRef]
  82. Feng, C.; Yu, Y.; Gao, J.; Han, Y. Influences of Topographic on Distribution and Change of Land Use and Cover in Mentougou District, Beijing. J. Mt. Sci. 2007, 3, 274–279. [Google Scholar] [CrossRef]
  83. Grubb, P. Interpretation of the ‘Massenerhebung’ Effect on Tropical Mountains. Nature 1971, 229, 44–45. [Google Scholar] [CrossRef]
  84. Yao, Y.; Xu, M.; Zhang, B. The implication of mass elevation effect of the Tibetan Plateau for altitudinal belts. J. Geogr. Sci. 2015, 25, 1411–1422. [Google Scholar] [CrossRef]
  85. Buzhdygan, O.Y.; Tietjen, B.; Rudenko, S.S.; Nikorych, V.A.; Petermann, J.S. Direct and indirect effects of land-use intensity on plant communities across elevation in semi-natural grasslands. PLoS ONE. 2020, 15, e0231122. [Google Scholar] [CrossRef]
  86. Kamusoko, C.; Aniya, M. Land use/cover change and landscape fragmentation analysis in the Bindura District, Zimbabwe. Land Degrad. Dev. 2007, 18, 221–233. [Google Scholar] [CrossRef]
  87. Bocchiola, D.; Brunetti, L.; Soncini, A.; Polinelli, F.; Gianinetto, M. Impact of climate change on agricultural productivity and food security in the Himalayas: A case study in Nepal. Agric. Syst. 2019, 171, 113–125. [Google Scholar] [CrossRef]
  88. Thapa, U.K.; George, S.S. Detecting the influence of climate and humans on pine forests across the dry valleys of eastern Nepal’s Koshi River basin. For. Ecol. Manag. 2019, 440, 12–22. [Google Scholar] [CrossRef]
  89. Paudel, B.; Gao, J.; Zhang, Y.; Wu, X.; Li, S.; Yan, J. Changes in Cropland Status and Their Driving Factors in the Koshi River Basin of the Central Himalayas, Nepal. Sustainability 2016, 8, 933. [Google Scholar] [CrossRef] [Green Version]
Figure 1. Location and elevation of the study area.
Land 11 01110 g001
Figure 2. Flowchart for calculating LVI and LHAI.
Land 11 01110 g002
Figure 3. Landscape type map of the study area. Note: The county numbers in Figure 3 correspond to the numbers in Table 4.
Land 11 01110 g003
Figure 4. (a). Spatial distribution of LVI. (b). Spatial distribution of LHAI.
Land 11 01110 g004
Figure 5. (a). LISA cluster graph of local spatial autocorrelation on LVI. (b). LISA cluster graph of local spatial autocorrelation on LHAI.
Land 11 01110 g005
Figure 6. (a). LVI distribution map of different elevation zones. (b). LHAI distribution map of different elevation zones.
Land 11 01110 g006aLand 11 01110 g006b
Figure 7. Relationship between LHAI, LVI and elevation in the study area.
Land 11 01110 g007
Figure 8. Map of the northern, southern and eastern regions.
Land 11 01110 g008
Table 1. Factors affecting landscape resources and the environment.
Landscape TypeEnvironmental Impact of Landscape ResourcesImpact Factors
Cultivated landHas a small impact on resources and the environment, some of which is reversible, but is greatly affected by human activities 0.25
ForestHas the function of ecological maintenance and has little impact on resources and the environment. Orchards and tea gardens are clearly affected by human activities0.1
GrasslandHas the function of ecological maintenance and has a low impact on resources and the environment0.1
Water bodyRivers and lakes have little impact on resources and the environment and are less influenced by human activities0.37
Construction landIt is greatly affected by human activities, most of which are irreversible and have a significant impact on resources and the environment0.85
Unused landHas a slight impact on resources and the environment, most of which are irreversible0.48
Table 2. Classification statistics according to LVI and LHAI in Ganzi Prefecture.
LVIValueLHAIValue
Very low-vulnerability0.03–0.28Very low-intensity0.10–0.12
Low-vulnerability0.28–0.38Low-intensity0.12–0.17
Middle-vulnerability0.38–0.47Middle-intensity0.17–0.28
High-vulnerability0.47–0.57High-intensity0.28–0.31
Very high-vulnerability0.57–0.82Very high-intensity0.31–0.47
Table 3. Classification statistics according to elevation in Ganzi Prefecture.
ClassificationElevation (m)Proportion (%)
Low-level elevation<12000.01
Medium-level elevation1200–360012.56
High-level elevation3600–510086.74
Extremely high-level elevation>51000.69
Table 4. Land use in each county of Ganzi Prefecture.
NumberCountryConstruction Land (%)Forest
(%)
Grassland (%)Cultivated Land (%)Unused Land (%)Water Body (%)
1Baiyu0.1949.4042.083.414.520.39
2Batang0.0845.6435.491.4916.940.35
3Danba0.2374.1315.282.197.460.70
4Daochen0.1758.2434.611.085.110.79
5Daofu0.2652.6939.401.735.500.42
6Dege0.1734.7648.944.2011.560.38
7Derong0.2260.6417.561.9119.330.35
8Ganzi0.2143.3948.702.954.490.26
9Jiulong0.2456.0231.301.5410.550.36
10Kangding0.5041.7148.411.507.480.40
11Litang0.1255.3435.510.697.970.36
12Luding0.3366.4114.055.1813.360.67
13Luohuo0.3558.2333.391.905.900.24
14Seda0.0835.8461.590.230.791.47
15Shiqu0.0511.2573.940.2312.921.62
16Xiangchen0.3463.8026.951.007.630.28
17Xinlong0.0656.4936.660.665.850.27
18Yajiang0.0863.5933.601.131.310.30
Total0.1845.2544.171.578.190.64
Table 5. LVI and LHAI in each county of Ganzi Prefecture.
CountryLVI (%)LHAI (%)
Very Low LowMiddleHighVery HighVery Low LowMiddleHighVery High
Baiyu19.1336.7232.0710.671.4264.2625.676.842.420.80
Batang5.7017.0327.4130.6319.2328.7329.9323.6112.515.22
Danba16.5332.6425.2718.027.5346.2837.6614.331.720.00
Daochen15.7636.2329.5113.844.6566.1021.668.963.030.24
Daofu10.9434.6826.6219.758.0163.0823.9310.092.900.00
Dege1.9722.0430.5024.5120.9953.2224.867.957.016.96
Derong9.5313.1920.4937.7119.0821.1626.5830.5919.022.65
Ganzi59.5127.455.923.933.1977.5510.346.093.792.23
Jiulong7.8420.8928.6526.4216.2041.3332.5119.355.401.42
Kangding30.2633.7420.2111.674.1260.0020.7211.444.892.94
Litang28.0233.8920.7911.176.1266.9317.498.534.202.84
Luding45.1822.0611.3810.5010.8941.8533.136.108.3110.61
Luohuo27.0638.9425.318.140.5664.7822.159.512.660.91
Seda8.4160.8522.025.922.7994.194.750.640.400.01
Shiqu0.149.8243.0226.9120.1150.5017.5915.0113.173.73
Xiangchen8.1931.7234.7719.555.7856.2128.1910.285.240.07
Xinlong13.9231.0530.8719.404.7649.6541.447.521.300.09
Yajiang36.5046.4812.234.260.5389.469.361.180.000.00
Total17.0029.4726.9817.089.4659.3722.1110.535.662.32
Table 6. Global Moran’s I values.
-LVILHAI
Moran’s I0.52420.3113
z55.927825.8204
p<0.01<0.01
Table 7. Spearman correlation analysis between LVI, LHAI and elevation.
Elevation (m)LVILHAILVI and LHAI
985–12000.700−0.400−0.900 *
1200–1500−0.0400.120−0.143
1500–1800−0.083−0.055−0.114
1800–21000.0930.1800.403 **
2100–24000.069−0.0080.438 **
2400–2700−0.026−0.0570.581 **
2700–30000.035−0.100 *0.570 **
3000–3300−0.038−0.0570.519 **
3300–3600−0.008−0.092 **0.488 **
3600–3900−0.058 **−0.093 **0.570 **
3900–4200−0.022−0.067 **0.642 **
4200–45000.053 **0.051 **0.646 **
4500–48000.171 **0.188 **0.770 **
4800–51000.0490.124 **0.751 **
5100–5400−0.251 **0.0320.450 **
5400–5700−0.167−0.1320.485 **
5700–60000.036−0.2050.597 **
6000–63000.0000.2580.775
Total0.168 **0.082 **0.674 **
** p < 0.01, * p < 0.05.
Publisher’s Note: MDPI stays neutral with regard to jurisdictional claims in published maps and institutional affiliations.

