Article

Knowledge Mapping on Nepal’s Protected Areas Using CiteSpace and VOSviewer

1
Faculty of Environmental Earth Science, Hokkaido University, Sapporo 060-0810, Japan
2
College of Tourism, Rikkyo University, Niiza Campus, 1-2-26 Kitano, Niiza-shi 352-8558, Japan
*
Author to whom correspondence should be addressed.
Land 2022, 11(7), 1109; https://doi.org/10.3390/land11071109
Submission received: 30 May 2022 / Revised: 13 July 2022 / Accepted: 14 July 2022 / Published: 19 July 2022
(This article belongs to the Special Issue National Parks and Protected Areas)

Abstract

:
Protected areas (PAs) play a vital role in environmental conservation, particularly in Asian countries. Numerous studies were conducted on PAs in Nepal. We analyzed 864 papers from the Web of Science database using two visualization tools: VOSviewer and CiteSpace. This study identified the most influential journals, institutions, countries, and regions. In addition, we investigated the changing trend of research hotspots on PAs in Nepal. Keyword mapping was conducted for each type of PA and their differences were compared. We found that the research hotspots are changing with the shifting of conservation policies in Nepal. We suggest conducting more predictive studies on the future development of PAs. Currently, PA research is mainly conducted in traditional disciplines, but with the impact of climate change and the consequent increase in its negative impacts, academic contributions from other disciplines are expected to increase much more. We found that there was a shift in research power in countries and regions. We also detected an imbalanced distribution in which “protected areas” and “national parks” have been studied the most. Only 12 publications were about the hunting reserve, despite its importance to snow leopard conservation and economic significance to the buffer zone communities.

1. Introduction

Protected areas (PAs) play a vital role in conservation around the world [1,2,3,4]. According to the International Union for Conservation of Nature (IUCN), a protected area is “a clearly defined geographical space, recognized, dedicated, and managed, through legal or other effective means, to achieve the long-term conservation of nature with associated ecosystem services and cultural values” [5,6]. These include national parks, national forests, natural reserves, conservation areas, wilderness areas, marine protected areas, wildlife refuges, and sanctuaries. PAs have significantly increased in number and coverage over the last century [7]. There were 248,754 designated PAs as of November 2021, encompassing approximately 15.72% of the Earth’s land surface area and 7.91% of the Earth’s ocean surface area [8]. The rapid increase in the number and area of PAs combined with wide support from different social groups has increased the worldwide expectations from the performance of PAs [9]. PAs also play an important role in biodiversity conservation and environmental stability [10,11]. Furthermore, as part of the Millennium Development Goals, PAs are projected to play a direct role in national development and poverty alleviation [9].
Although PAs serve as powerful tools to ensure conservation and sustainable development, they face major challenges arising from various aspects that undermine their efficiencies. Therefore, site selection is of great significance. However, some PAs have been designated merely because of the low cost of management rather than conservation priorities [12,13,14]. Various other issues, either inside or outside the PAs, also hamper management efficacy. Due to inadequate management staff and budgets [15] and lack of management schemes [16], many problems can occur within PAs, including competition over natural resources with PAs and conflicts between humans and wildlife [17,18,19,20], illegal poaching [21,22,23,24], illegal logging [25,26,27], and invasion of alien plant species [28,29,30]. However, challenges have also been identified outside the PAs. These challenges are largely related to the pressures and impacts of anthropogenic factors from adjacent areas [31,32,33]—notably, human encroachment [34,35,36,37,38]. Changes in land use and activities occurring in the surrounding regions can evoke a majority of negative impacts on PAs [39,40,41]. Therefore, extensive studies have been conducted to examine the relationship between PAs and their surrounding areas [42,43,44] because these impacts can destroy the conservation-development balance within and around PAs [45]. Much effort has been made to overcome these problems with mixed success. These efforts include conservation of PAs, sustainable development, and community-based management, which have been well documented by Du et al. [46].
PAs are usually densely populated by rural communities and bordered by agricultural land and are largely established in areas of the world where poverty is common and 92% of the world’s poor rely on natural resources for their survival [47]. Thus, PAs are expected to contribute to community livelihoods and well-being [48], which is an important aspect of advancing sustainable development. Asia’s PAs have great ecological value [9] while maintaining large concentrations of people, supporting local livelihoods and development, yet suffering from commercial pressures such as tourism and the construction of roads, mines, and dams [49]. Given widespread poverty [9], rapid population increase [50], and political instability [51], managing protected areas in developing countries poses significant challenges. Furthermore, PAs have attracted significant investment at the cost of opening remote areas for logging, oil exploitation, and mining [52]. Hence, to understand the various aspects of PAs in developing nations, much research has been conducted, resulting in a substantial and expanding corpus of literature.
Pritchard proposed bibliometric analysis, which is a mathematical and statistical strategy for analyzing relevant literature and understanding worldwide research patterns in a particular field [53,54]. Bibliometric analysis approaches have been employed in environmental engineering and science, soil science, ecology, food safety, new energy use, and other domains to provide quantitative evaluations of the academic literature [55]. A bibliometric study aids in identifying research gaps and directions in a certain field [56].
Bibliometric studies have been successfully applied in several fields to review and detect research trends and hot topics. For instance, Pratikshya et al. filled the research gap in the limited data on ecosystem science [57]. They revealed temporal trends, geographical distribution, and patterns of authors, institutions, and topics. Yang et al. conducted a systemic and objective review of climate change and tourism [58], identifying the most urgent issues in this field. In the field of regenerative medicine, Chen et al. identified the most active topics and revealed emerging trends and new developments in the interplay between basic and applied research [59].
Nepal is one of the world’s 46 least developed and lowest income countries [60], sandwiched between two economic heavyweights—India and China [61]. Nepal is an ecologically and culturally diversified country with a large area of PAs [61,62] and some globally important ecoregions [63] Moreover, Nepal is ambitious and enthusiastic about advocating for PA strategies. It has signed many international conventions and treaties to promote conservation courses, including the Convention on Biological Diversity, Ramsar Convention, the Convention on International Trade in Endangered Species of Wild Fauna and Flora, and the World Heritage Convention [64]. Nepal has also had various policy and plan transitions, from state control to community-based management [65]. Therefore, drawing a holistic picture of Nepal’s PAs can provide insights into relevant studies on PAs.
The increasing number of academic, governmental, and (inter)national entities investigating, implementing, and managing PAs in Nepal has resulted in an increase in the literature, which includes a constantly rising body of research in academic journals, books, and conference proceedings. The volume of scientific literature available on PA research continues to grow, making it difficult for researchers and practitioners to obtain a thorough and structured overview of essential data. A large number of review studies have been conducted on management issues [66], environmental policy [64], community forestry and livelihood [67], ecotourism [68], conservation issues [64,69], human-wildlife conflict [70], biodiversity [71], and climate change impacts [72]. These perspectives are interdependent on one another and conducted separately, focusing on a certain perspective. Thus, it is difficult to grasp the whole picture using traditional literature review methods. However, scientific knowledge mapping analysis based on bibliometrics is a more practical method for extracting insightful information from large amounts of data [73].
Therefore, this study employed a combination of performance analysis, which reveals the number of articles, as well as the main journals and research areas, and science mapping analysis, which reveals the main research topics, their structure, evolution, and trends. It aimed to understand the performance, lineage of research, main aspects, and trends of research on PAs in Nepal from a vast amount of literature to provide a reference for other scholars in related research. In this study, we have used bibliometrics as a research method for the first time to conduct a study on PAs in Nepal. It provides a more comprehensive and systematic analysis compared to the common literature review to deal with large amounts of data. In addition, in terms of research methodology, we analyzed each type of PA in Nepal. This is because different types of PAs have different conservation objectives and priorities, and they face different problems. By doing so, this study not only provides a panoramic view but also allows comparison between different protected area types.
This study contributes to the literature in several ways. First, it reflects the status quo and content of the research more immediately, making it easier to trace the field’s origins and trends. Second, it depicts the evolution of research, allowing scholars to better comprehend the field’s evolution and identify new directions. Third, it displays the most prominent institutions and journals, allowing scholars to more precisely search for journals and articles.

2. Materials and Methods
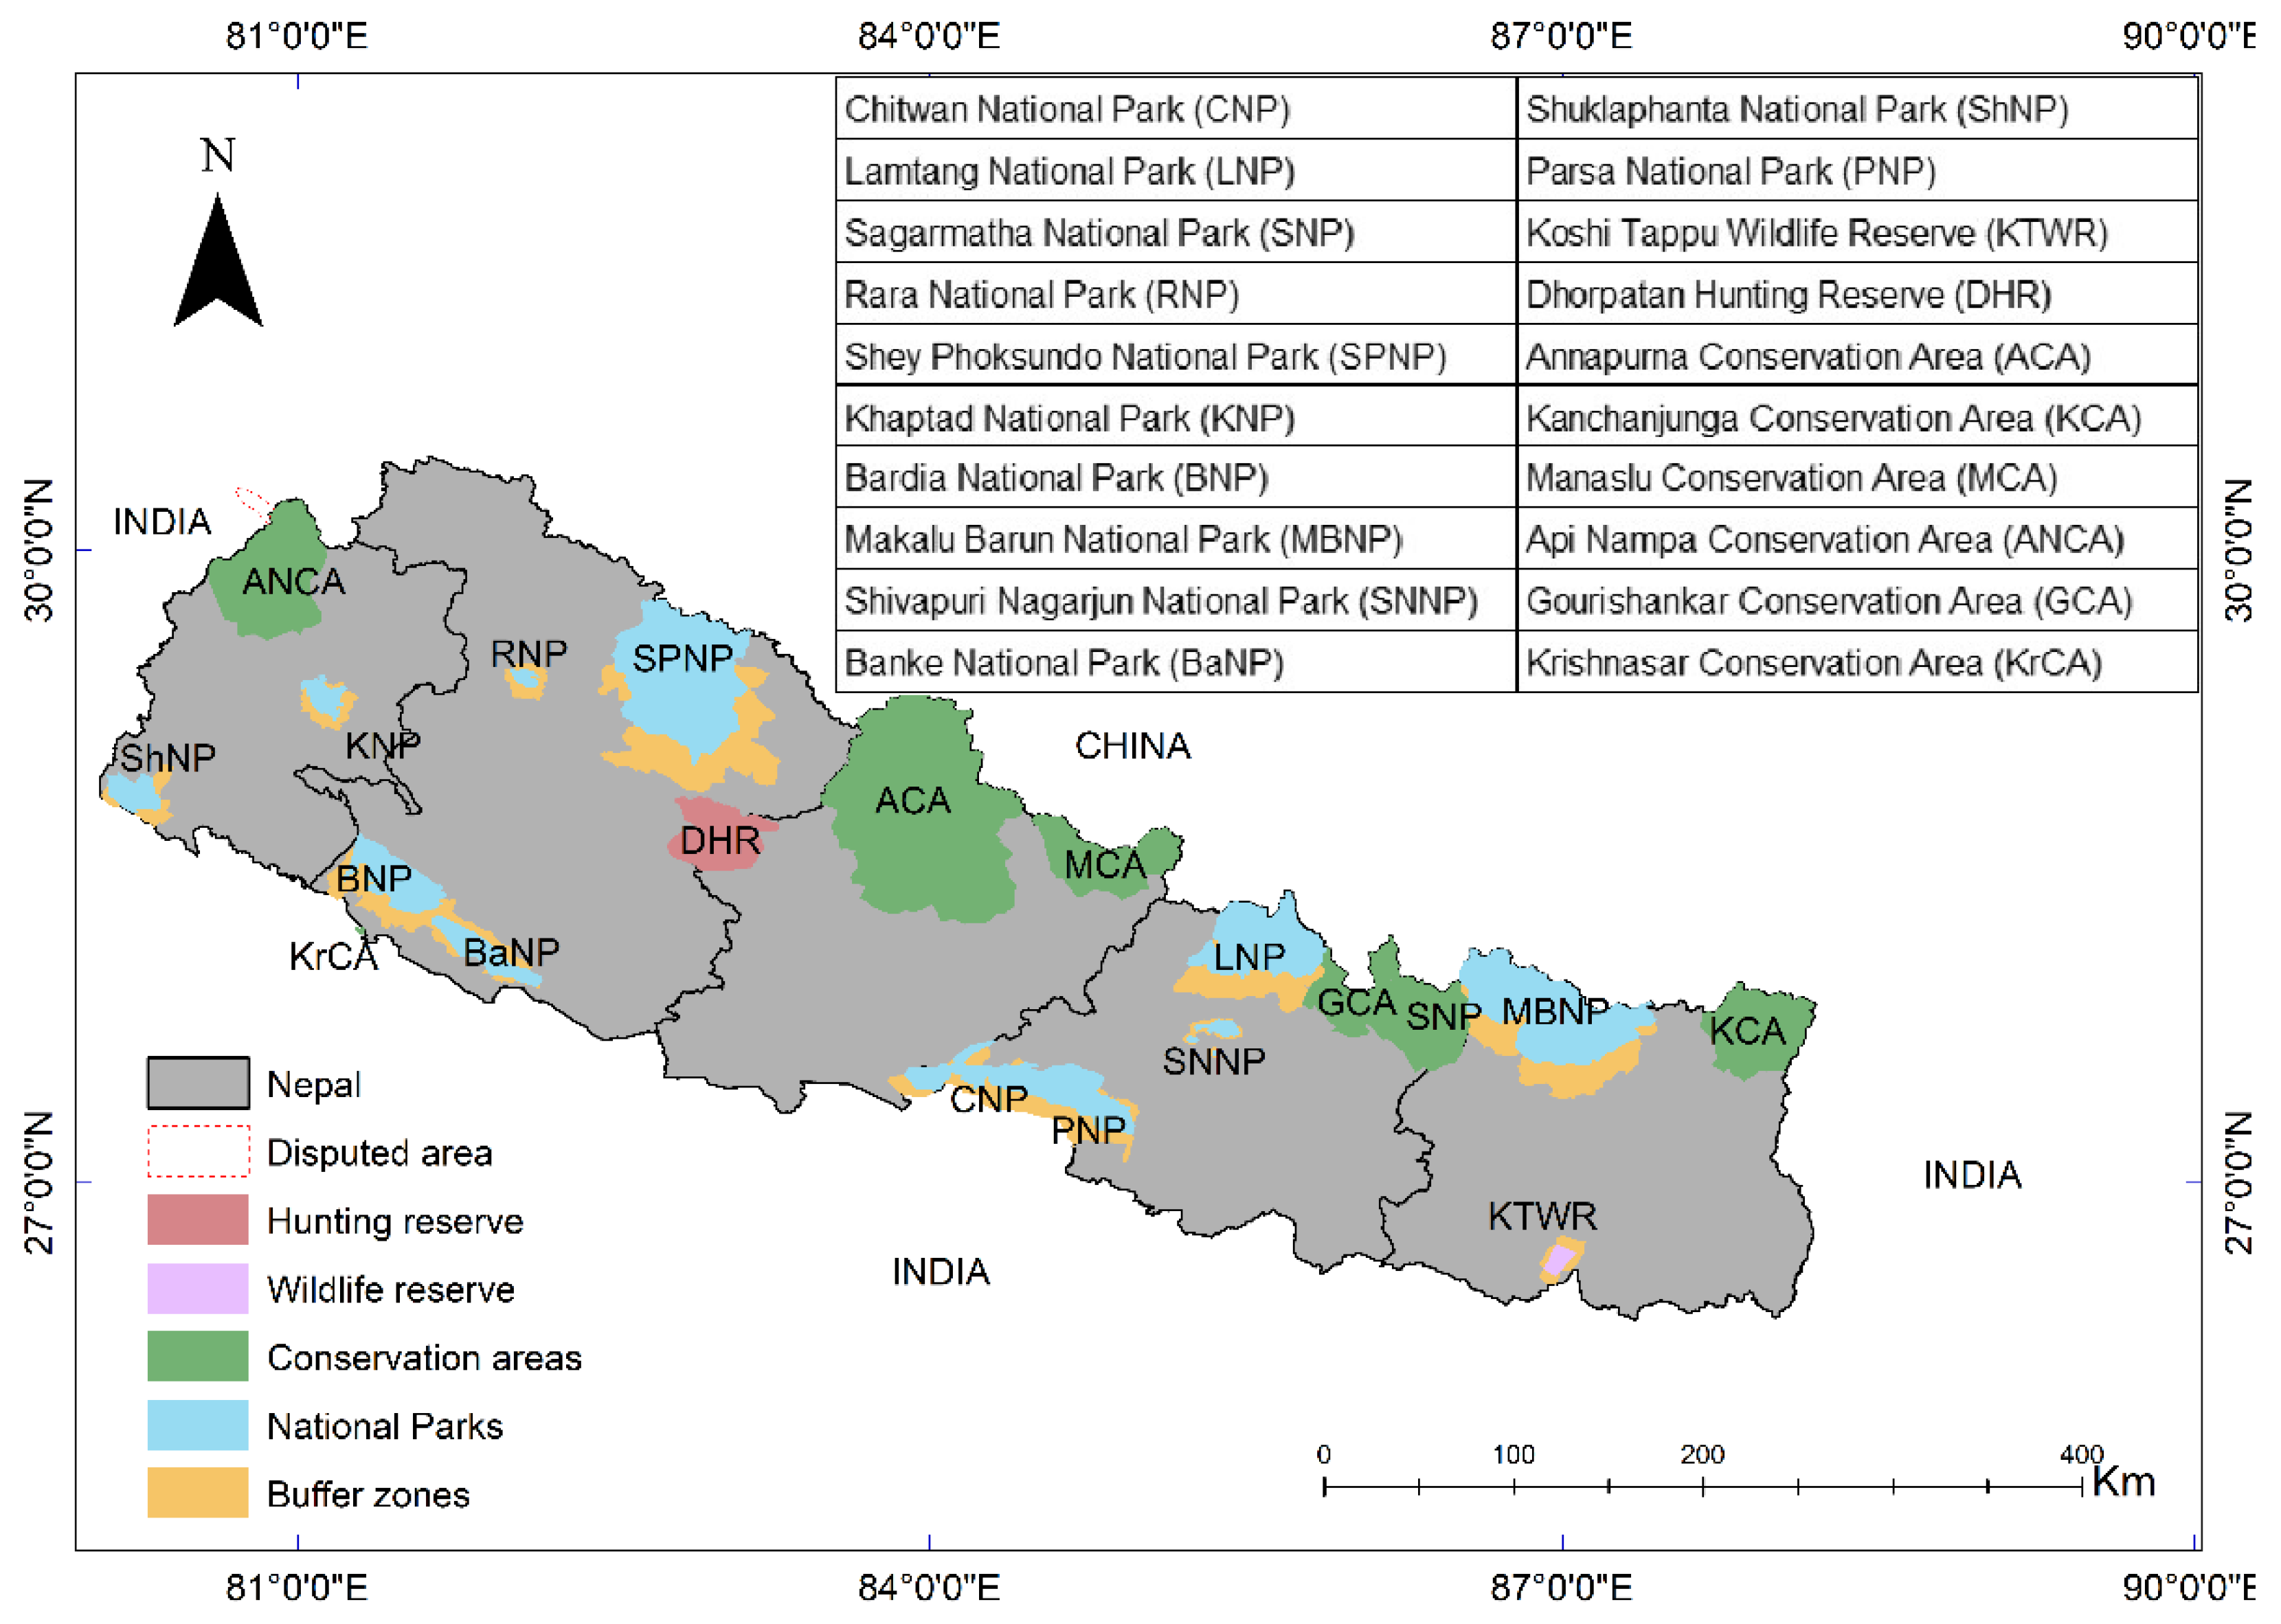
2.1. Study Area

These are of five types: national parks, buffer zones, wildlife reserves, hunting reserves, and conservation areas (Figure 1). They are spread across Nepal’s high mountains, mid-hill areas, and lowland areas, covering 23.63% of the country’s total land area in 2021 [74] ranking eighth among Asian countries and regions as of 2021 [75]. Details of Nepal’s PAs are presented in the Supplementary Materials (Table S1).
However, PAs in Nepal are facing increasing issues as the country’s human and cattle populations grow [65]. Nepal counts on the tourism industry to alleviate poverty, and it has already been confirmed as a powerful tool for reducing the degree of poverty in Nepal [77]. However, tourism-related negative impacts have also received considerable attention. In several of Nepal’s protected regions, issues of tourism pressure and waste control are evident [78]. Furthermore, Nepalese PAs are not fully representative of conservation priorities. It has been identified that although vulnerable animal species are effectively protected, the existing PA system does not cover a vast number of threatened plant species [79]. Given the fact that Nepal is located in the Himalayas, one of the world’s top 20 biodiversity hotspots and is a biodiversity-rich country that contributes significantly to global biodiversity [79], the success of its PAs can have an impact beyond its own territory.

2.2. Methods

Bibliometric analysis is a quantitative tool for evaluating academic work on a certain topic by reviewing previous publications [80]. This is a quantitative analysis of scientific production, allowing us to track the growth of a scientific subject in detail. By examining secondary data obtained from a digital database from a quantitative and objective standpoint, bibliometric analysis can introduce a systematic, transparent, and repeatable review procedure, thereby improving the reliability and quality of the results [81].

2.2.1. Software

There is no consensus on which method is the best among existing bibliographic software [82]. Therefore, VOSviewer (1.6.18) and CiteSpace (5.8. R3) were used to create knowledge maps. They are both Java-based research tools that are widely used for visualizing and analyzing knowledge maps, as stated earlier. Both use scientometric theory to present the structure, patterns, distribution, and potential knowledge of scientific knowledge; they can produce collaboration networks of authors, countries, or regions, and co-occurrence of authors and keywords. The combination of the two can help achieve accurate visualization of the literature. According to Fu and Ding [83], CiteSpace was found to have specific advantages in revealing the dynamic development of disciplines and detecting citation bursts. VOSviewer can be used to create a knowledge map when there is a clear relationship between subjects or when the amount of data is substantial.

2.2.2. Indicators of Analysis

We employed descriptive and relational bibliometric indicators and methods. Countries and institutions contribute to a better understanding of the socio-demographic context. The publication year frequency aids in visualizing and establishing stages in the history of research. Keywords aid the comprehension of how concepts and research are classified and linked in this context. This clarifies which of these have not been thoroughly examined.

2.2.3. Data Sourcing and Analysis Method
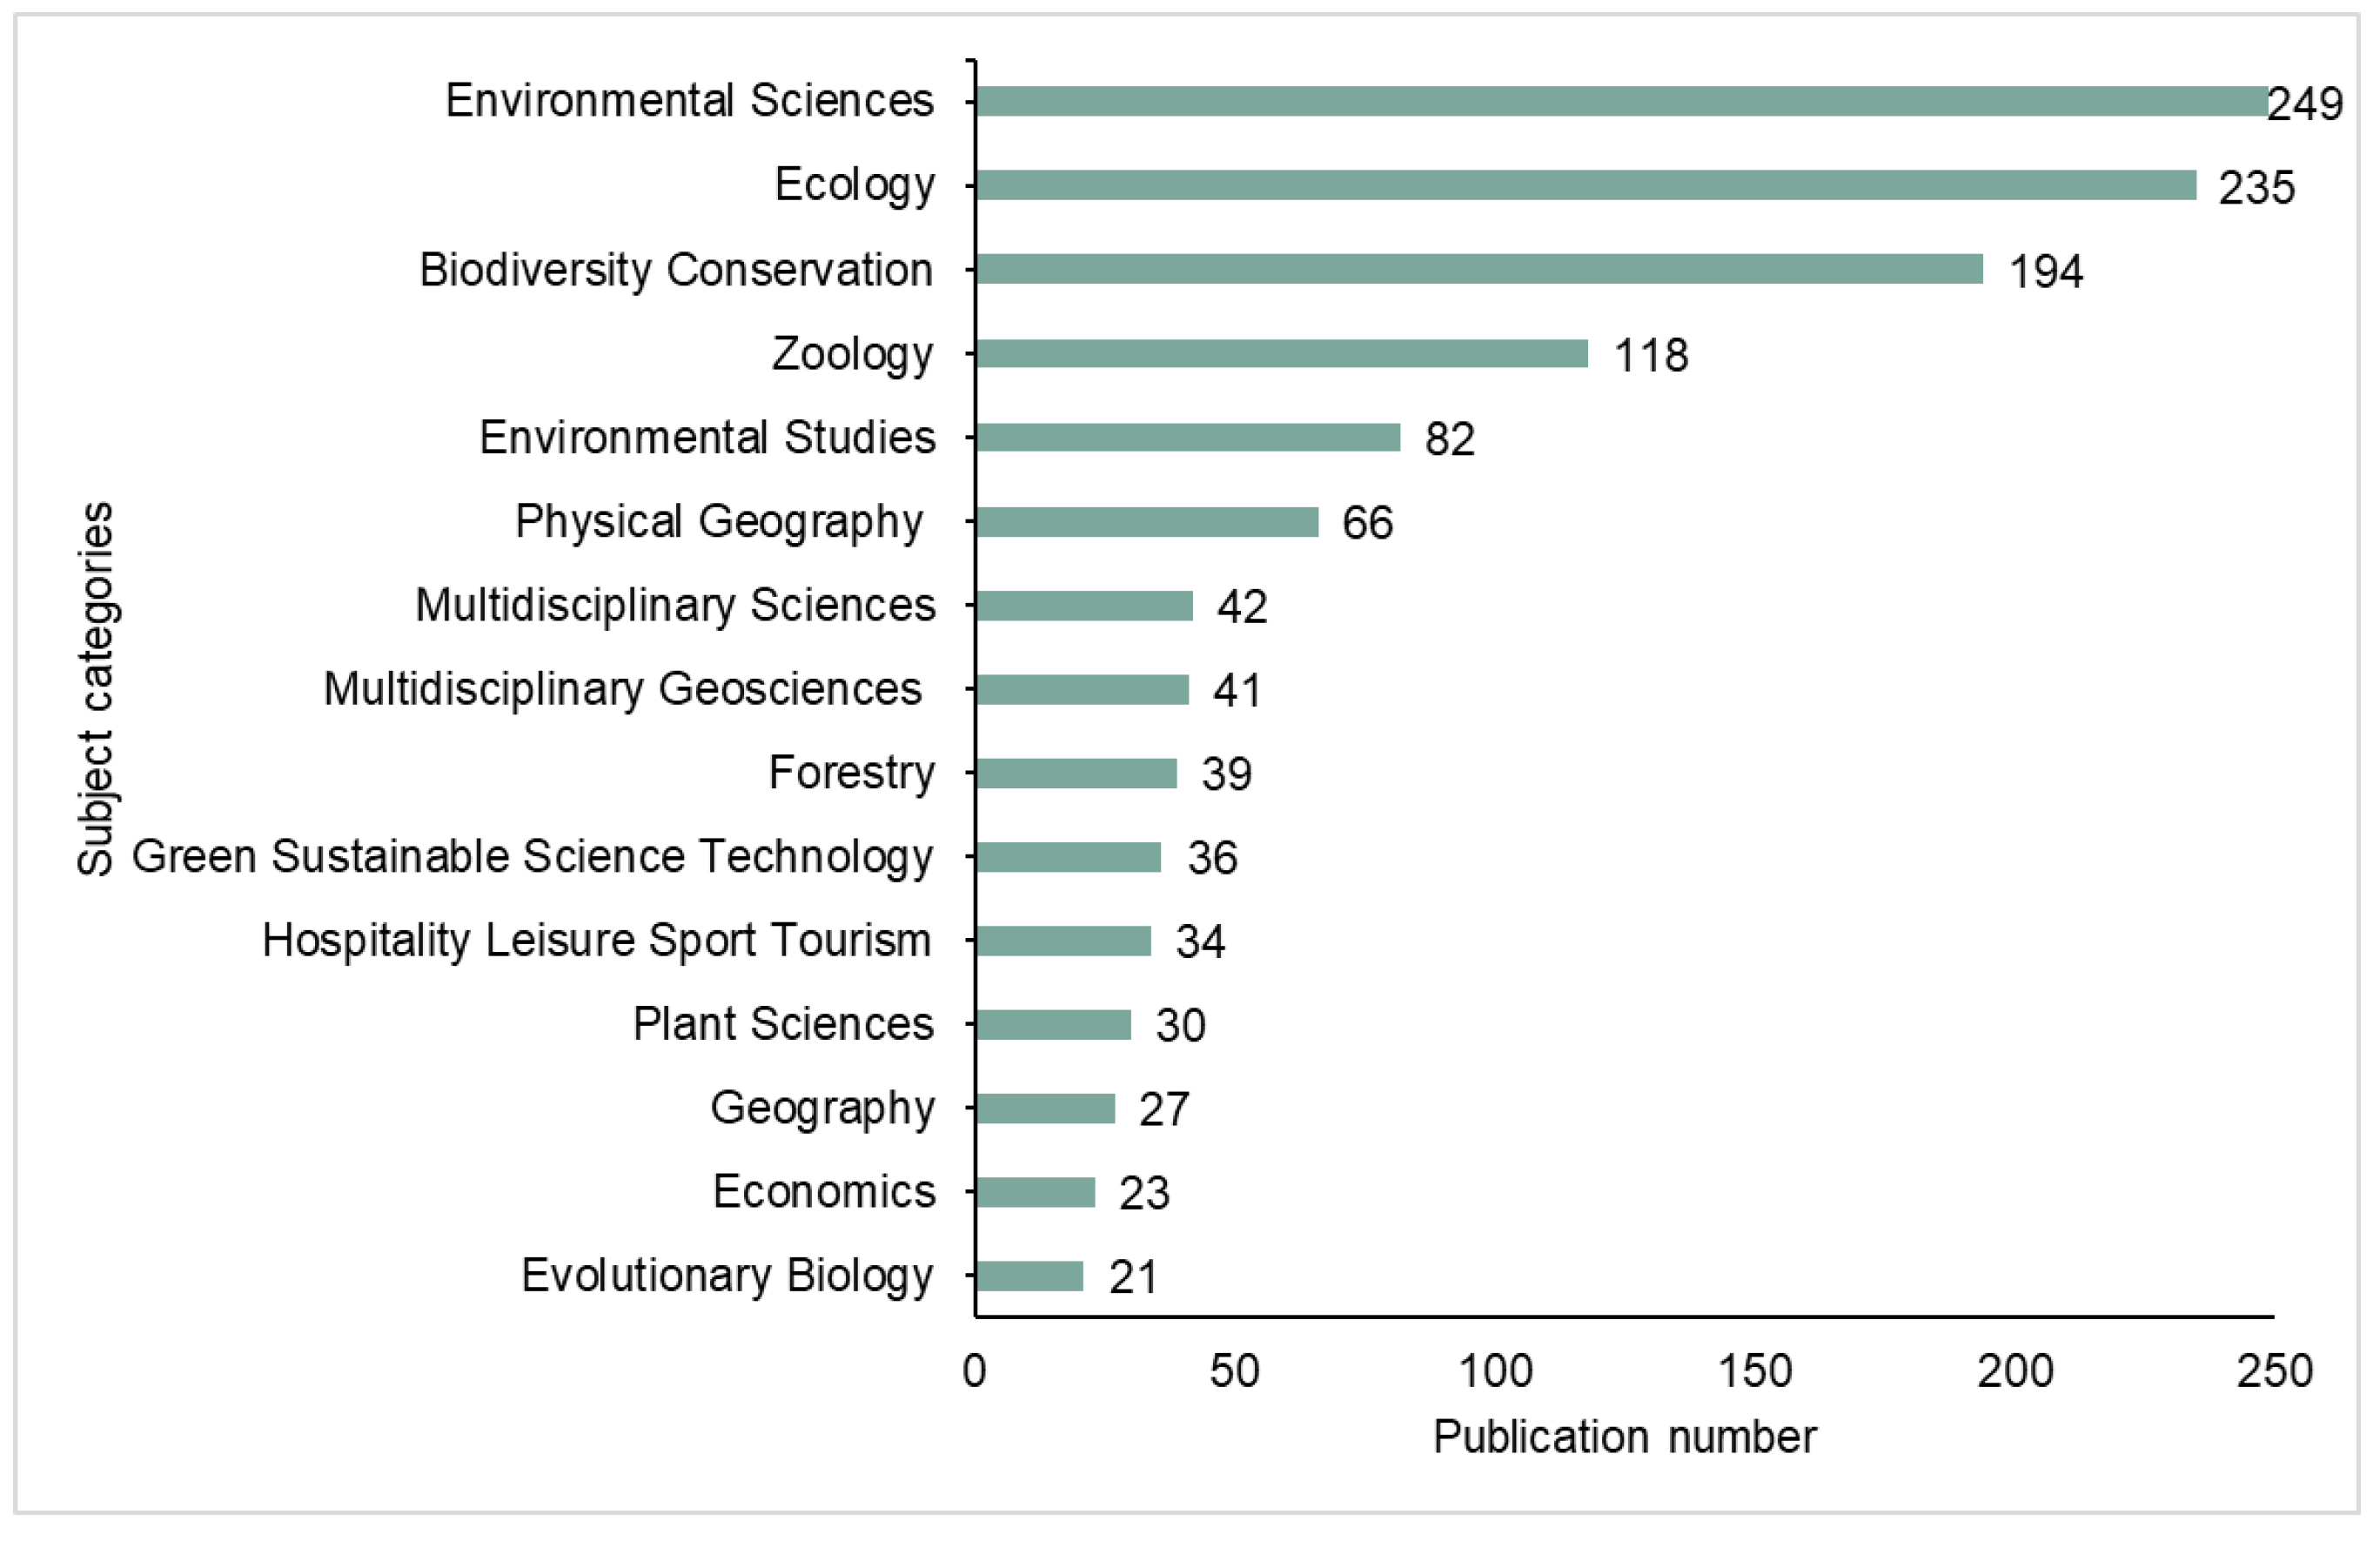
In terms of the database selection, Google Scholar lacks the quality control needed for its use as a bibliometric tool; the larger coverage it provides consists in some cases of items not comparable with those provided by other similar databases [84]. We did not choose Scopus either as it has a more comprehensive list of contemporary sources. However, our study aims to cover a broader time range, that is, starting from the earliest documents. Based on the discussion above, Google Scholar and Scopus have been excluded from this study.
This study used datasets from Web of Science (WoS). WoS is a well-known and widely used digital database that provides researchers with high-quality publications of various types [73,85,86]. WoS has over 21,000 peer-reviewed journals in over 250 categories and covers a wide spectrum of publications from many fields [87]. Furthermore, WoS is an appropriate database because it contains a variety of data, including titles, authors, institutions, countries, abstracts, keywords, references, citation counts, impact factors, and other information [82,88]. As a result, the datasets can be used for bibliometric analysis and information visualization.
The data were retrieved from the WoS Core Collection (WoSCC) database on 10 January, 2022, and the time span was set from “1 January, 1900 to 31 December, 2021.” There are five types of PAs in Nepal [76]. Therefore, the search formula used was “TS = Nepal protected area* OR Nepal national park* OR Nepal wildlife reserve* OR Nepal buffer zone* OR Nepal hunting reserve* OR Nepal conservation area*” and the document type was chosen as “ARTICLE” and in “English”, yielding a total of 864 documents. We only selected journal articles because they are regarded as “certified knowledge” and because they are the outcome of an evaluation procedure, which gives the results credibility [89]. As a result, we excluded proceedings papers, news articles, or other documents (Table 1).
We did not analyze “Hunting reserve” because the sample size was too small (only 12) to be used for knowledge mapping (Table 2) since the ideal sample size should be more than 50 documents [90]. After searching and screening, 864 articles covering 73 research areas were collected. These papers were by 2057 authors affiliated with 1026 institutions in 64 countries and regions. These were published in 315 journals and cited 13,014 references (Table 3).
Using the WoS “Analyze the Results” function, descriptive statistics on year and count, research categories, countries, and regions were conducted; SPSS 26.0 was used to conduct statistical analysis on the stages of publication; CiteSpace V and VOSviewer were used to conduct the mapping process.

3. Results

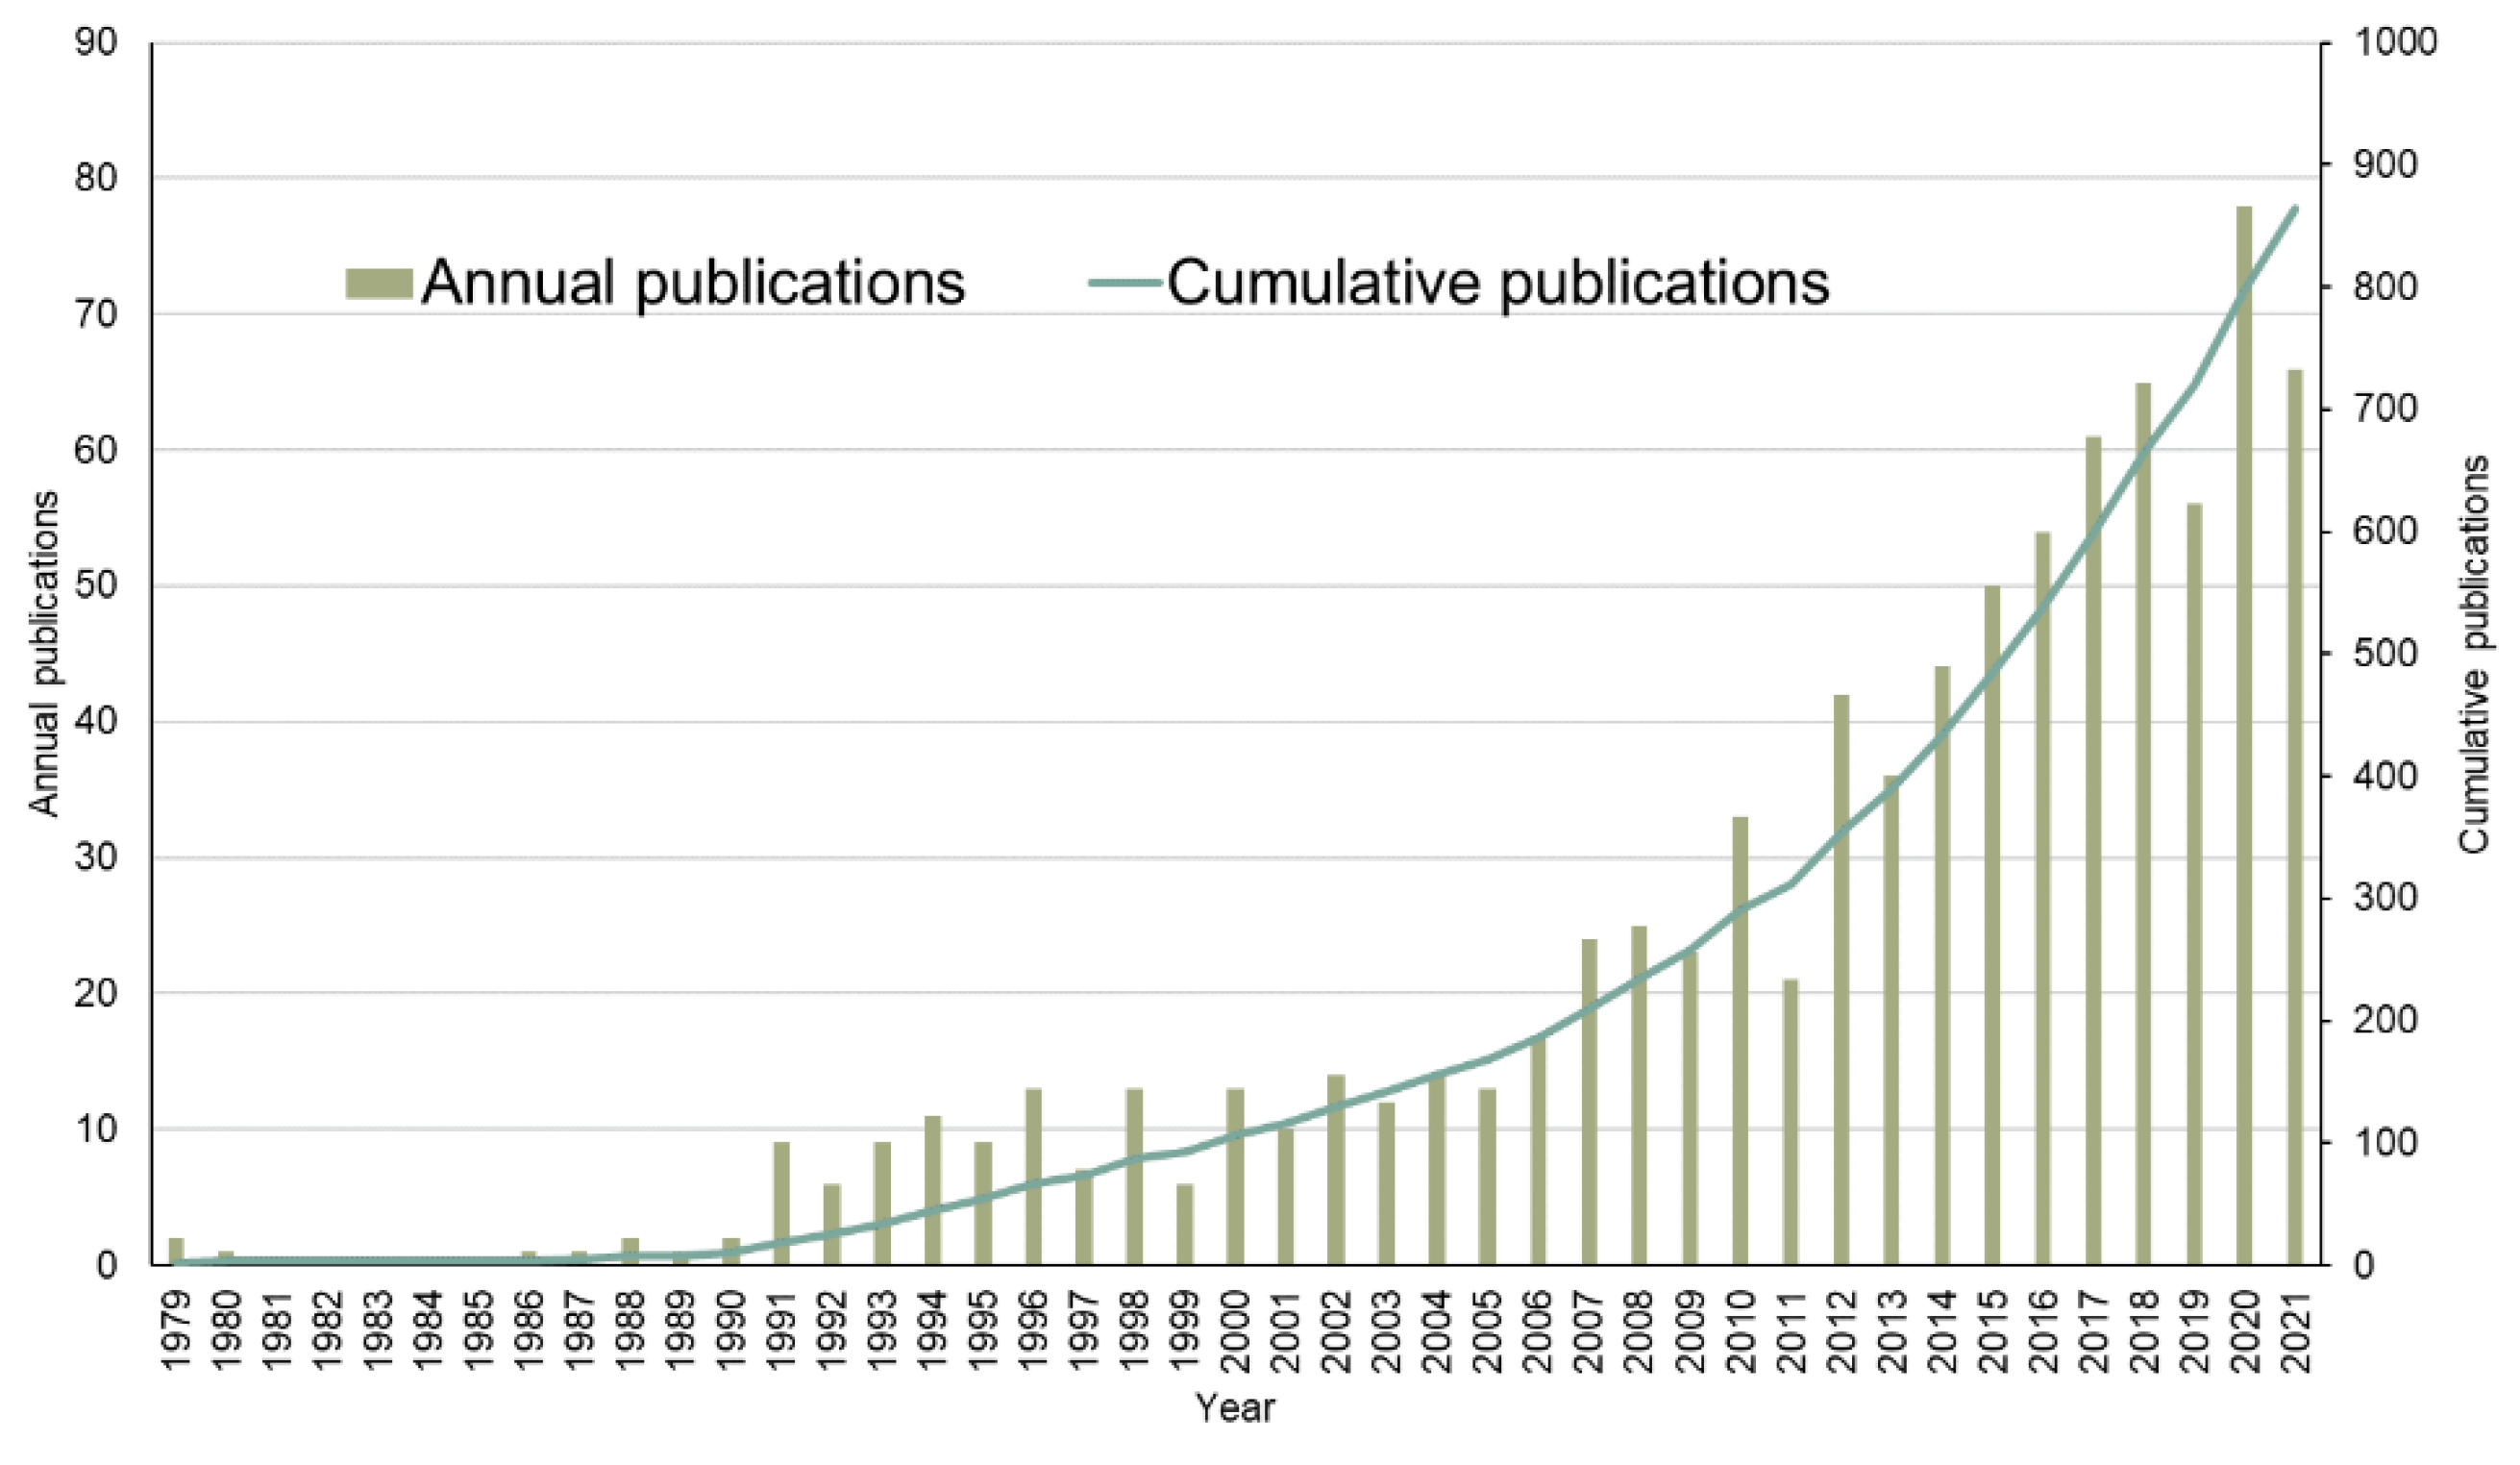
3.1. Publication Performance Statistics

Figure 2 depicts the publication counts over the years and the cumulative publications. All data were imported into SPSS 26.0 for a correlation test. This shows that there is an exponential relationship between the volume of the literature and time (Table 4).
From 1979 to 1990, there was a period in which only a few publications were produced, with a barren period between 1979 and 1990, the incipient period. The second phase (1991–2006) witnessed a nearly 10-fold increase in the number of publications on average. Although the third period (2007 to 2014) had some fluctuations, it still showed a significant increase in the number of articles, indicating that the study had progressed. After 2015, the number of articles increased sharply. The year 2020, with 78 articles, had the most publications. By the end of 2021, the cumulative number of publications reached 864. A further increase is expected for 2022.
A total of 73 research categories were included. The research domain was broad in scope, encompassing a wide range of topics and disciplines. Figure 3 shows the top 15 with more than 20 publications. Environmental sciences came first with 249 papers, followed by ecology with 235 papers. Biodiversity conservation contributed 194 publications, and zoology 118 publications. Publications can also be found in other disciplines.
In total, there were 864 publications in 315 journals. Although many journals supported a wide range of research themes and multidisciplinary characteristics of studies on Nepal’s PAs, 33% (n = 286) of the journals had published no more than five publications. Table A1 provides a list of journals with more than 10 publications; Table A2 shows the top 10 most cited articles.
The visualization map produced using VOSviewer provides a more direct impression of the journals’ citation correlation (Figure 4). The threshold was set at five to study the connections and clusters of the most prolific journals. The map shows five clusters (five colors). The cluster shown on the right part of the map consists of five journals of geoscience and appears slightly distant from the other four clusters, which are closely connected to one another. The journals were extensively connected to each cluster. The node size denotes the number of journal publications, as illustrated in the map.

3.2. Analysis of Countries and Regions and Major Research Institutions

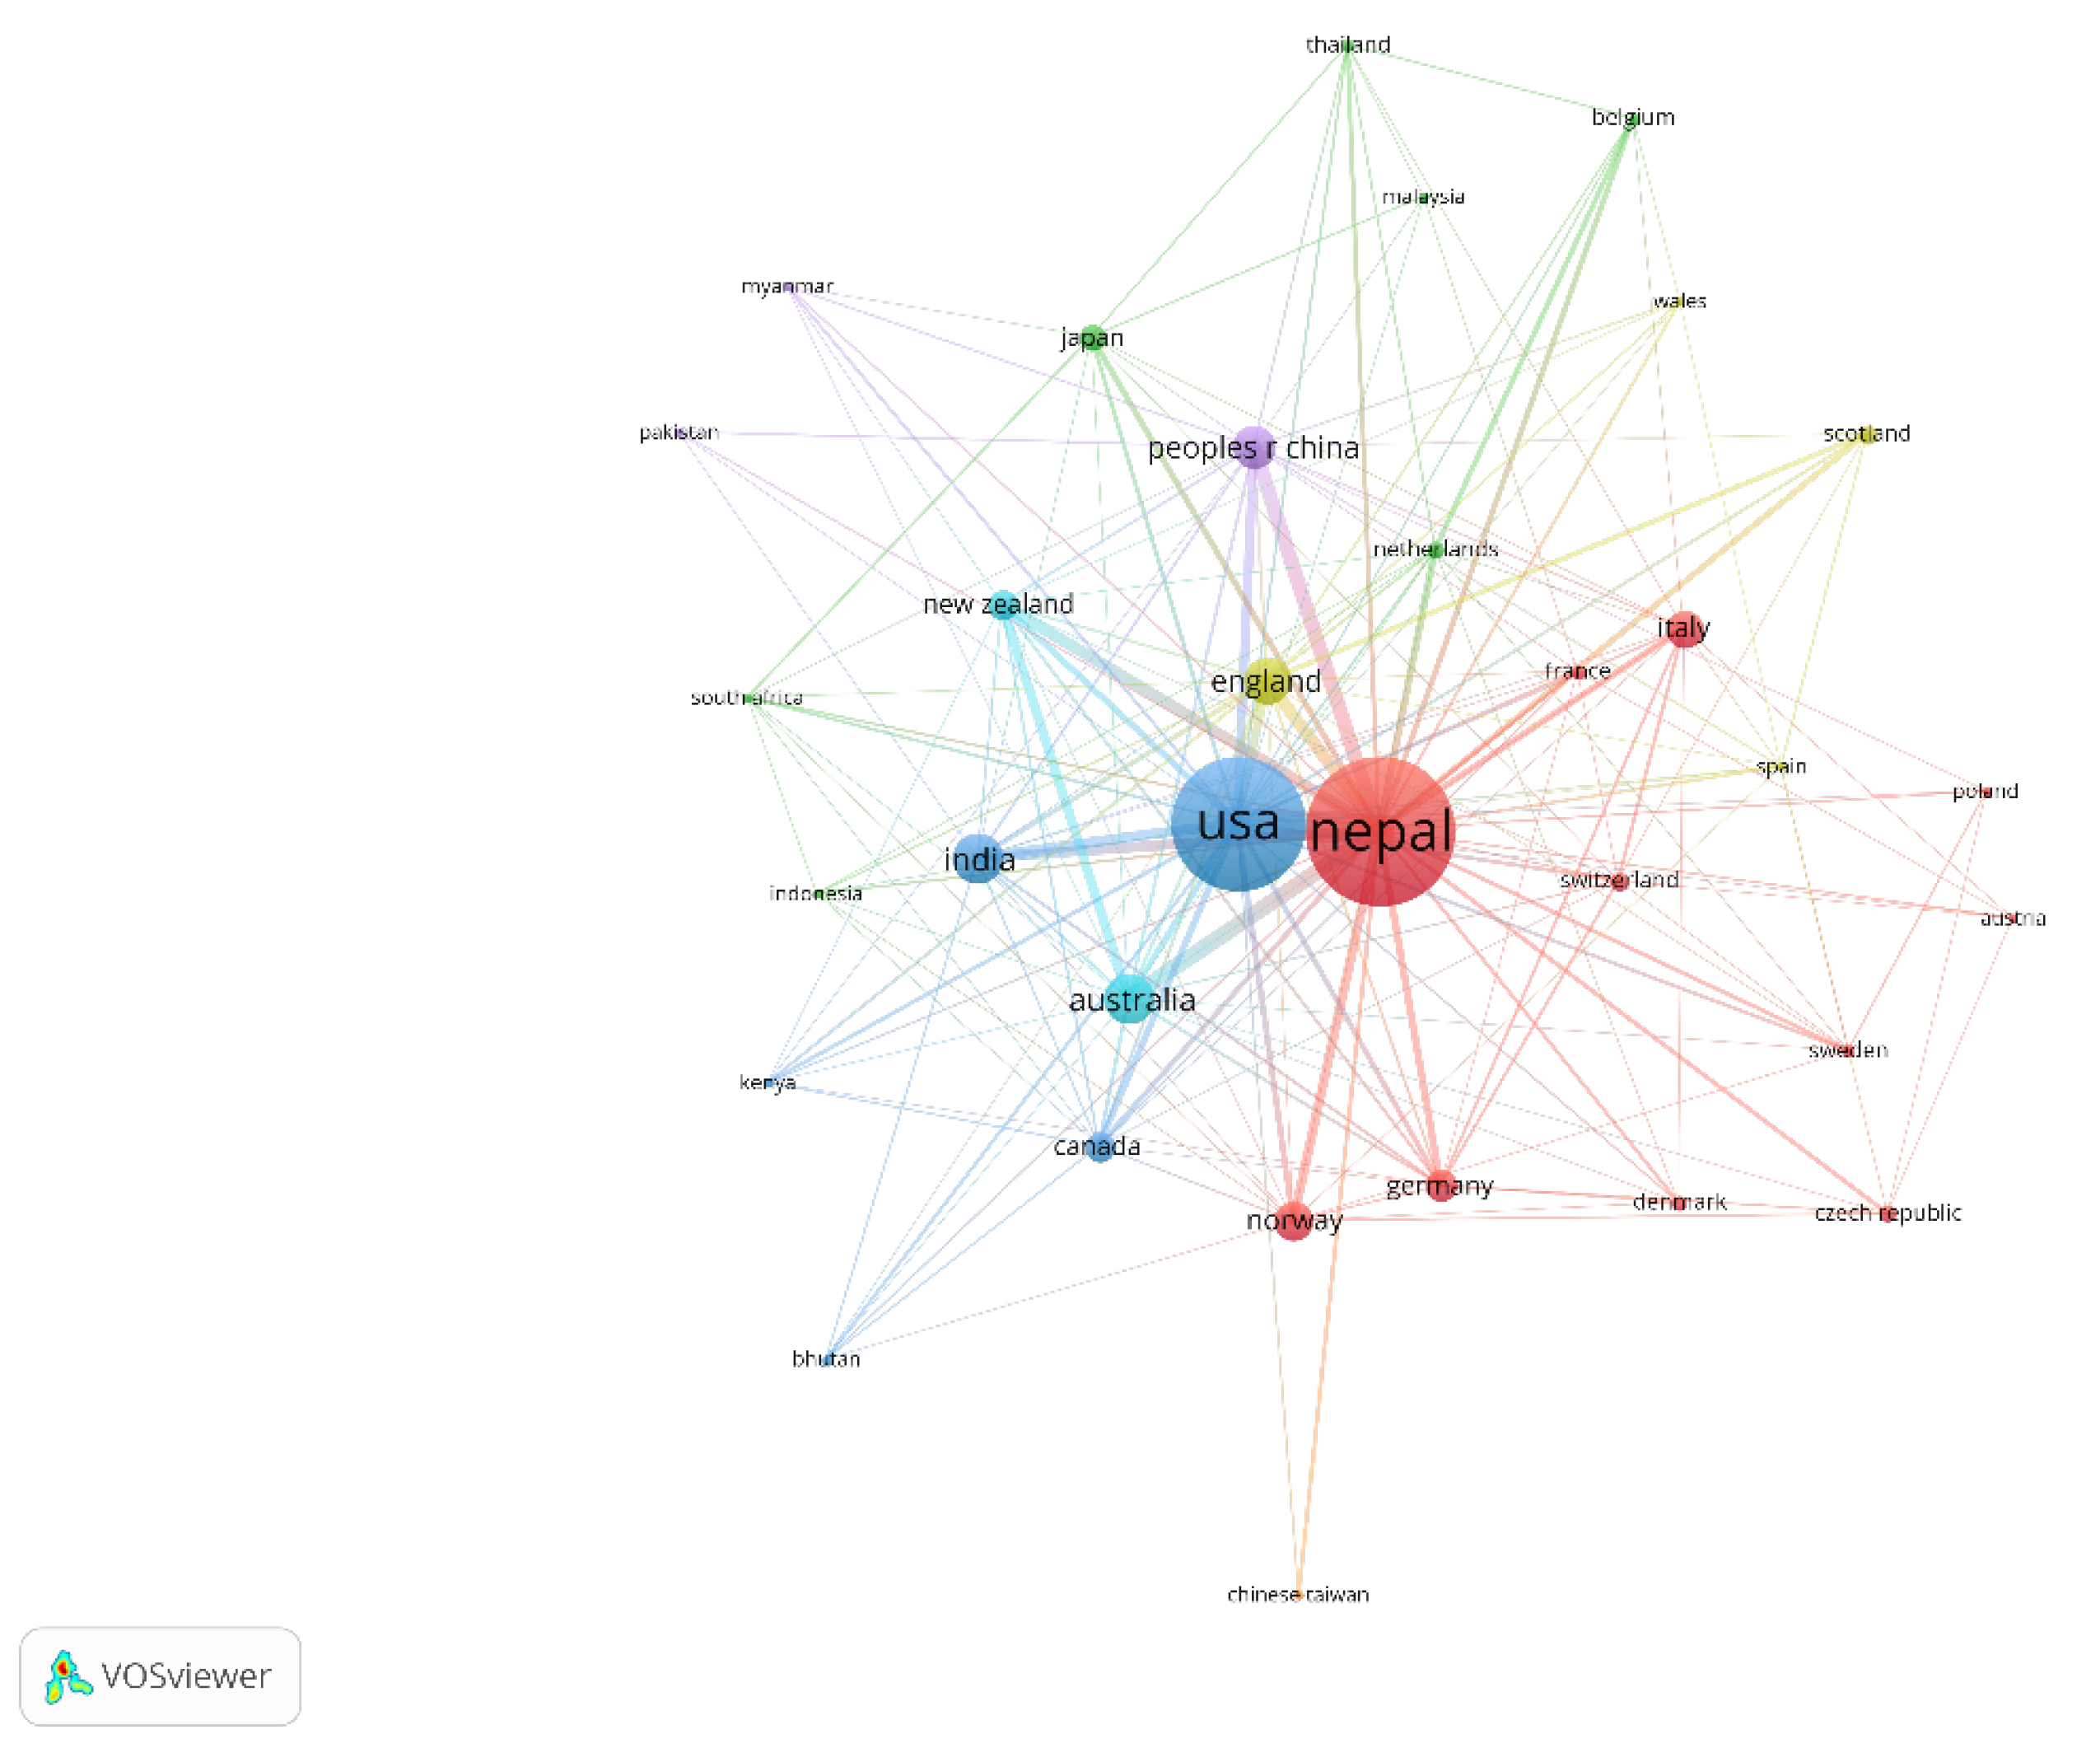
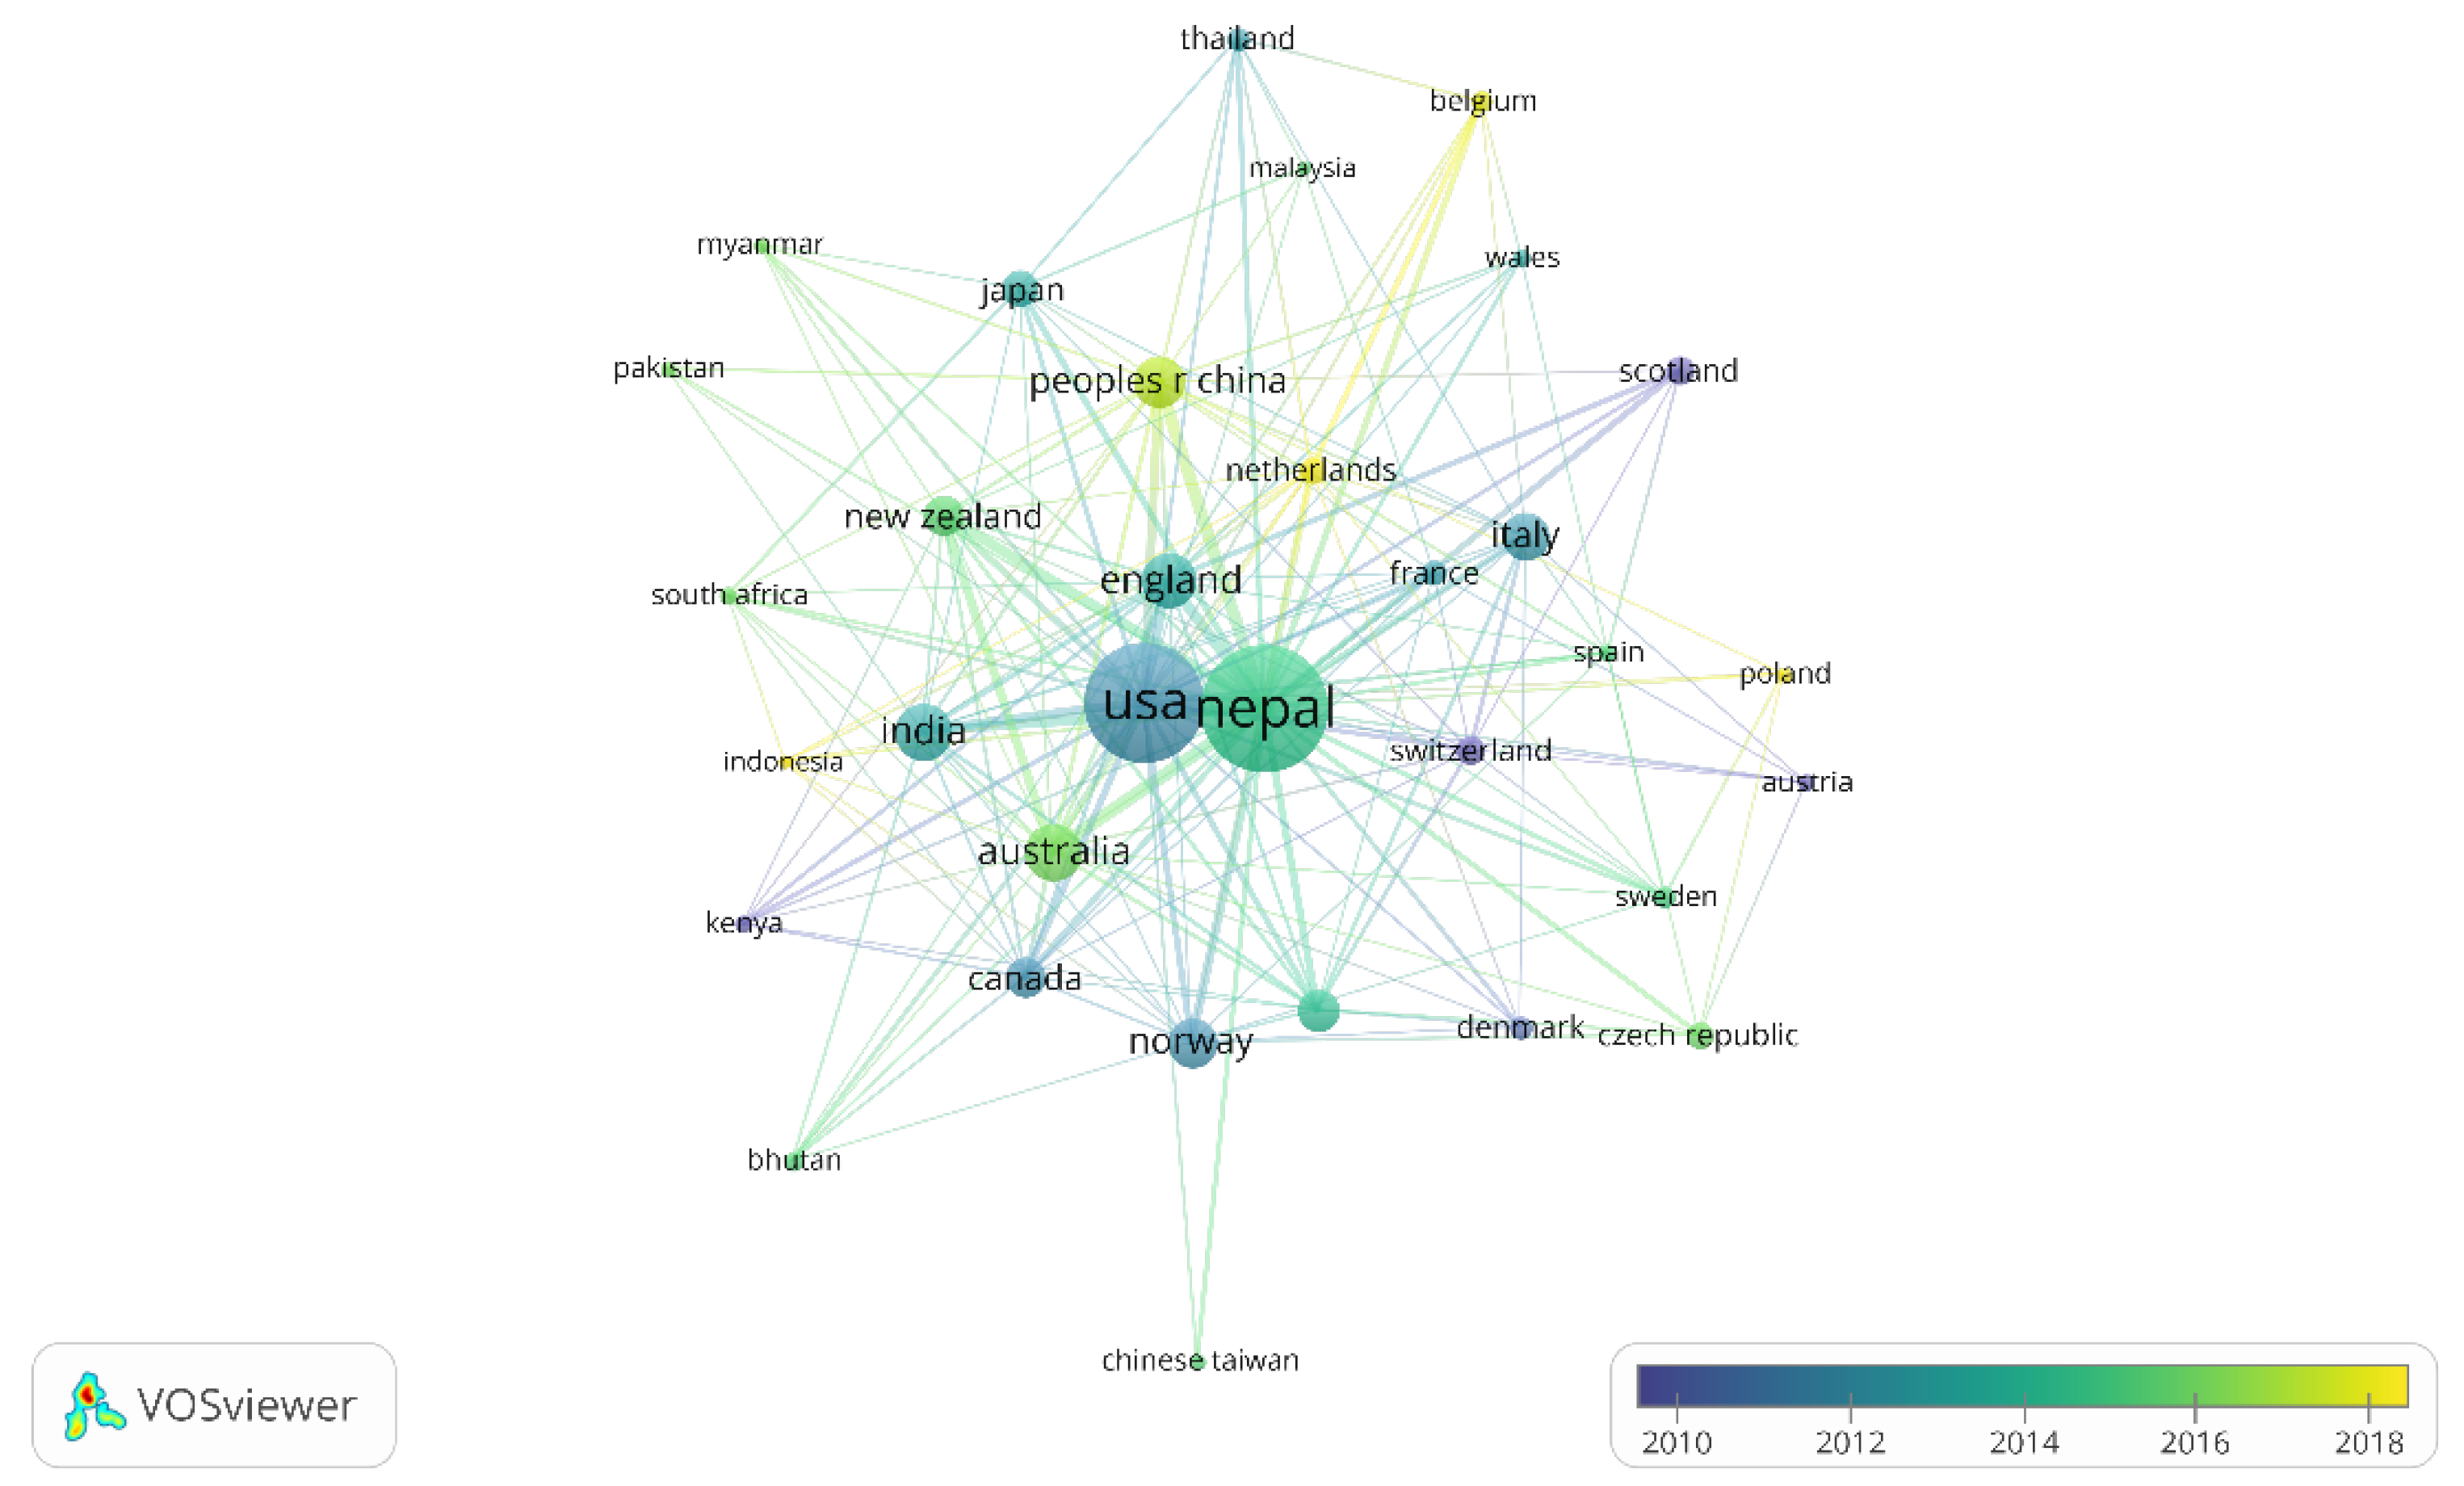
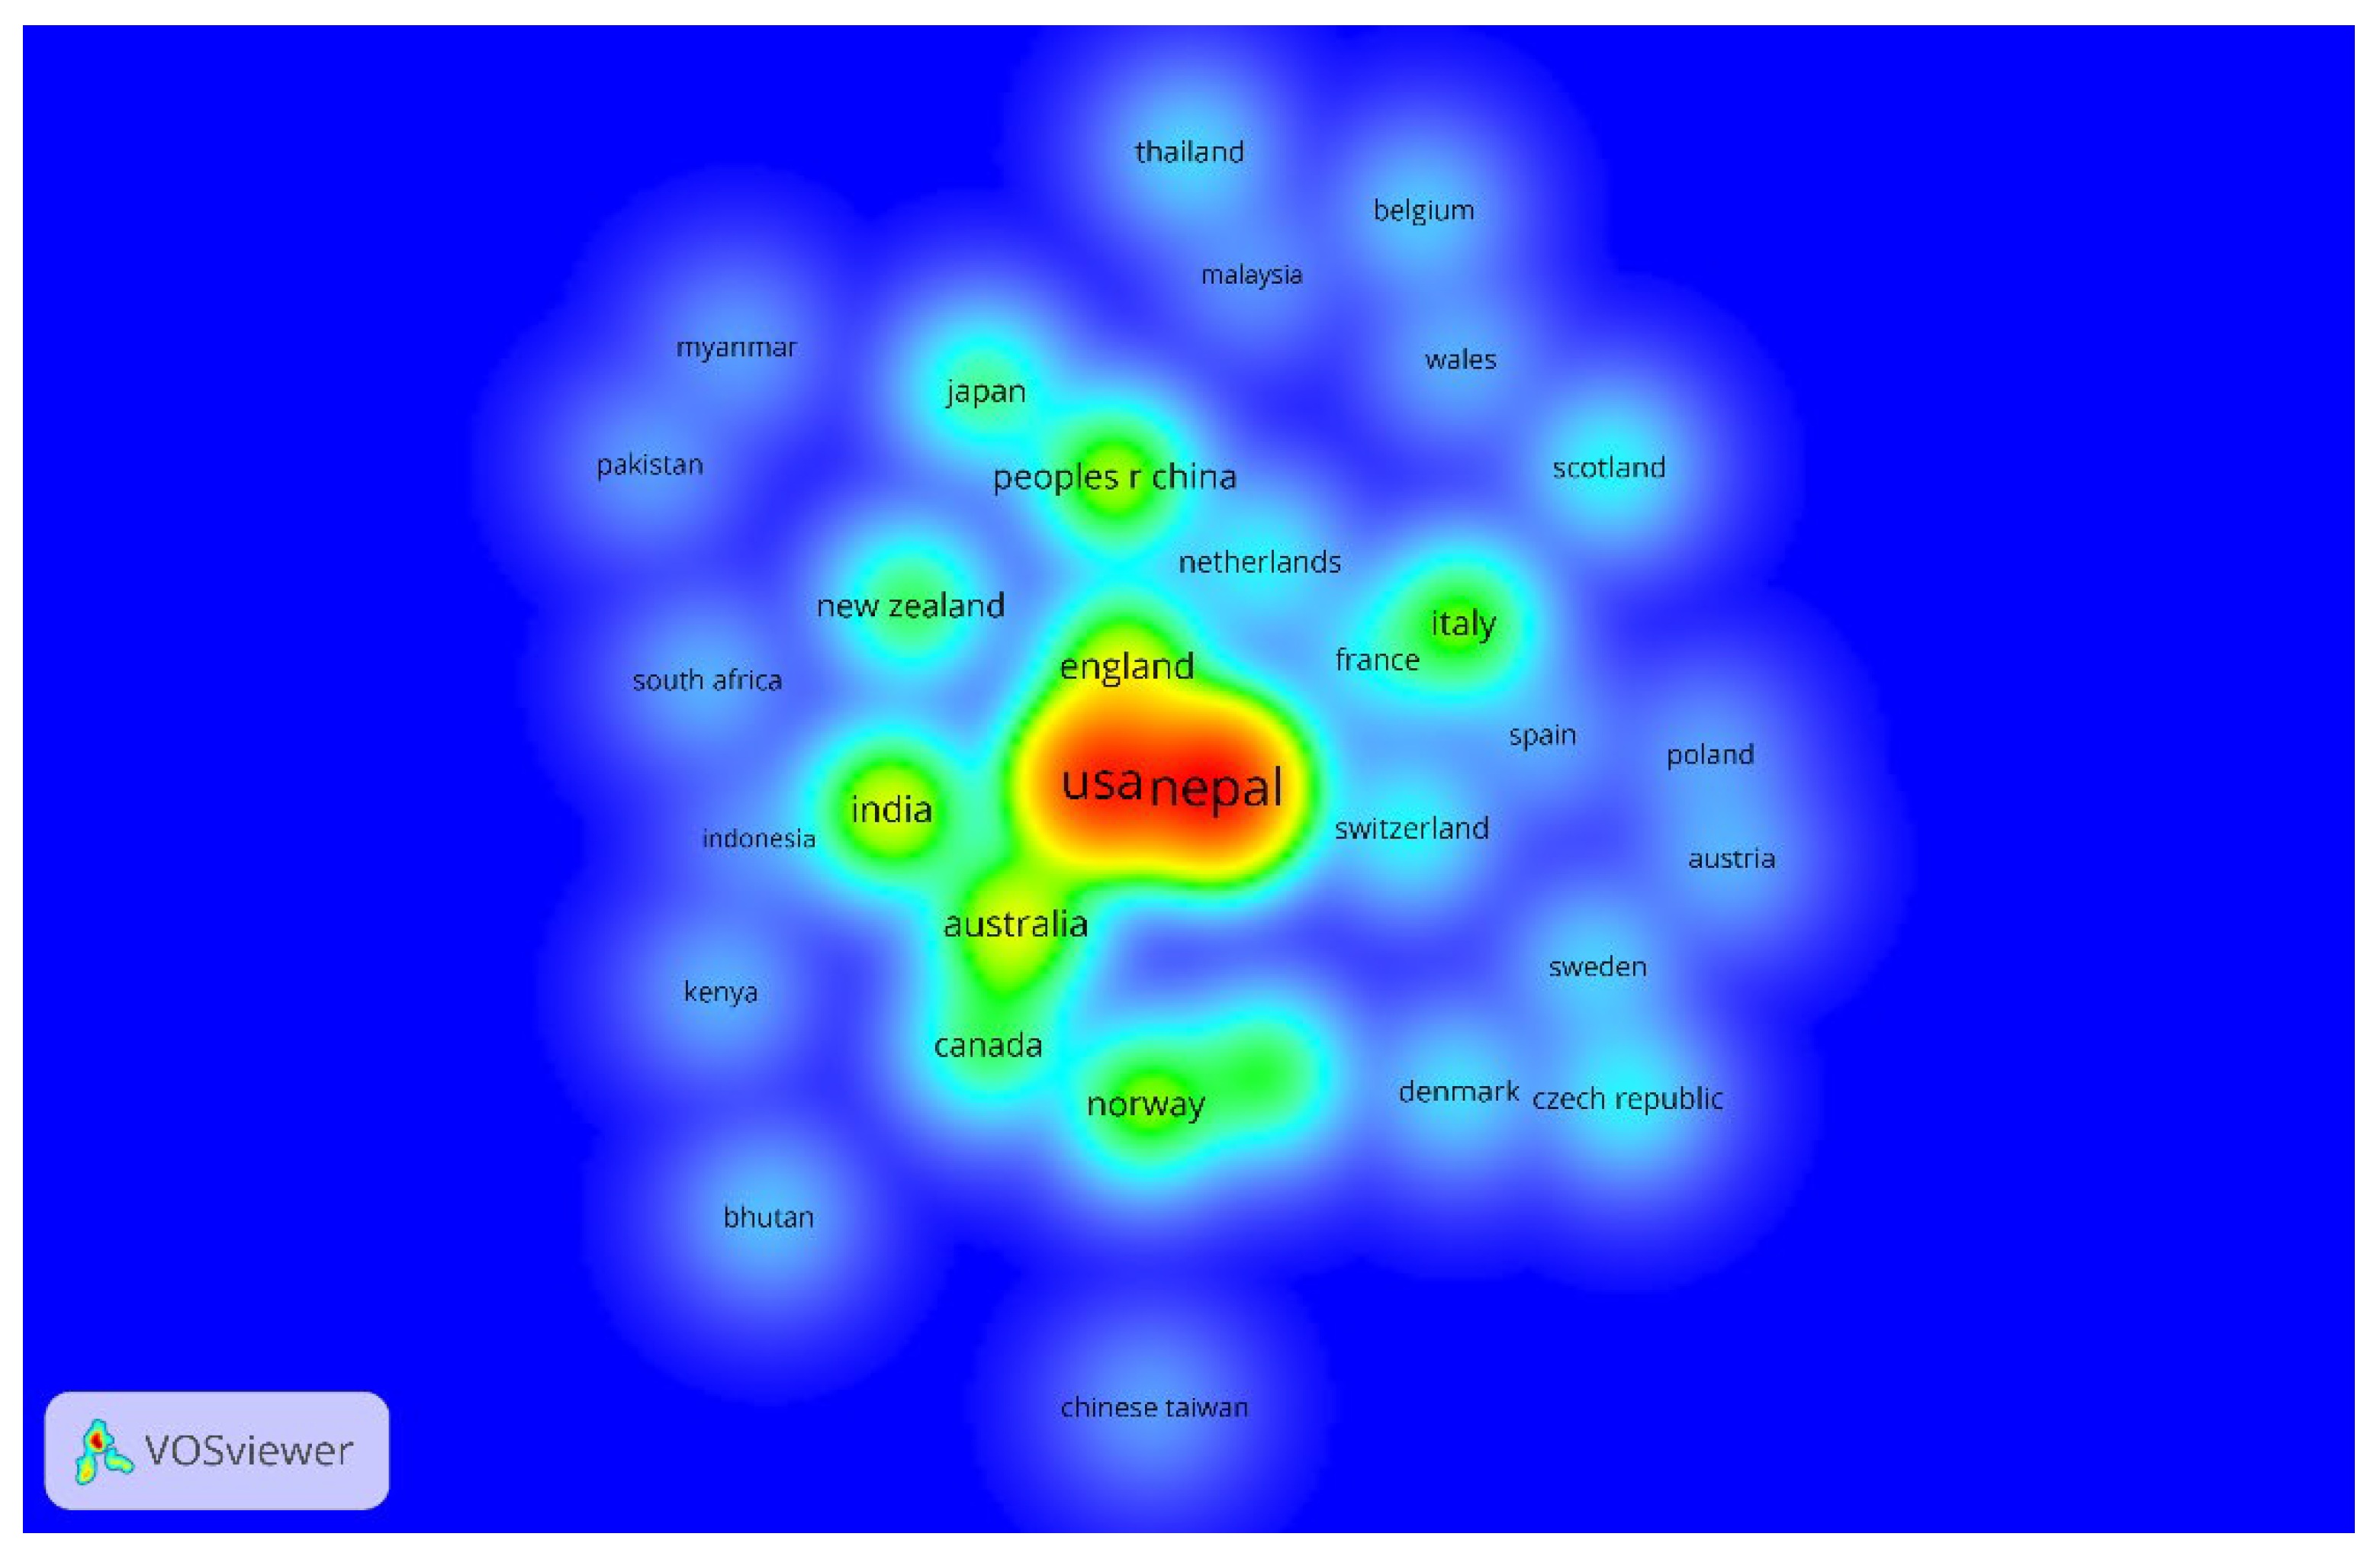
3.2.1. Countries and Regions

A countries/regions co-authorship network visualization map (Figure 5) was built to show their relationships. The minimum document criterion is set at 5. Of the 64 units, 33 were identified as visualization objects. The number of papers is represented by the size of the circles, with larger circles indicating more documents. Seven clusters can be recognized by their distinct colors. For example, Nepal and the United States collaborated extensively, and their contributions were obviously larger than others. Nepal contributed 360 publications, while the United States contributed 313. Other countries and regions have also contributed to this research field as well. However, many of them are far from each other on the map, showing weak cooperation.

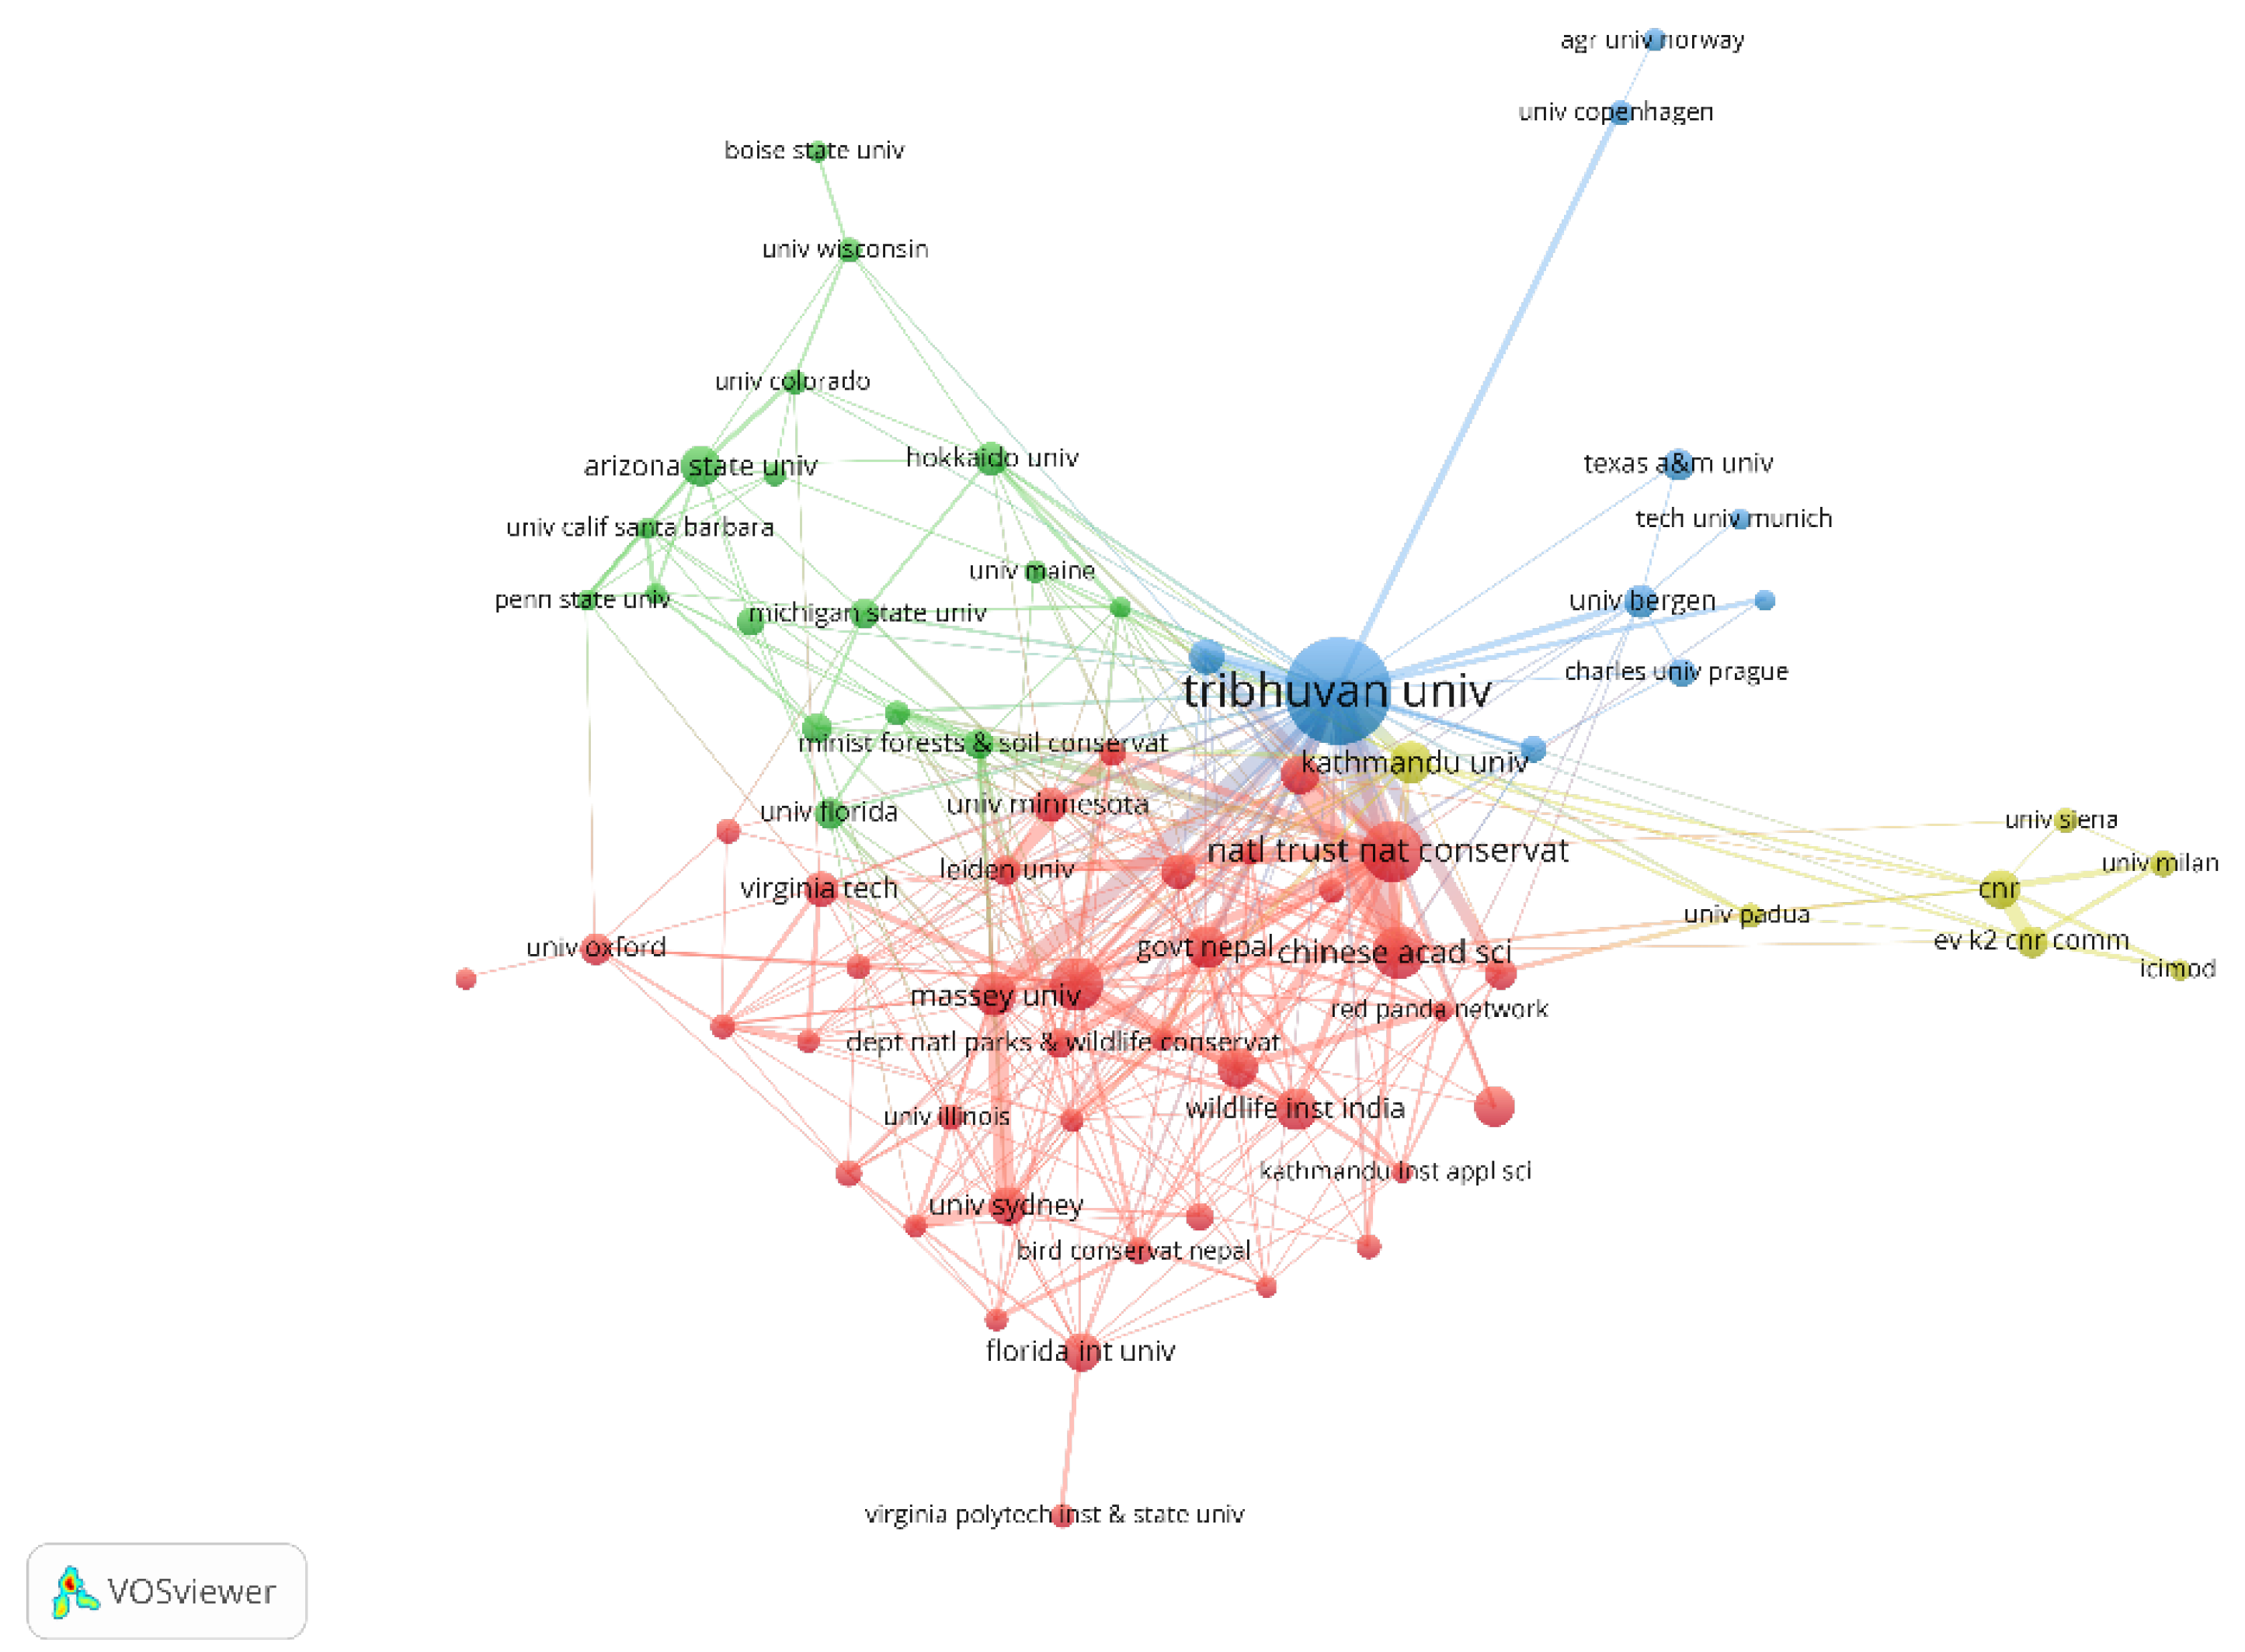
3.2.2. Major Research Institutions

VOSviewer was used to create an organization citation visualization map to investigate primary collaboration among the 976 organizations (Figure 6). There were 73 powerful organizations (7.5%) that remained when the threshold value was set to 6. The map shows that these organizations are grouped into four clusters (shown in 10 colors in Figure 6).
The size of the node symbolizes the number of publications, and the line connecting the two nodes indicates the academic connection between the two organizations. The stronger the connection, the shorter the line. All institutes are labeled with their abbreviations. As shown in the map, the red cluster has the most members (39). The National Trust for Nature Conservation (natl trust nat conservat) led the red cluster in terms of publication production (46), followed by the Chinese Academy of Sciences (chinese acad sci) with 35 documents. Tribhuvan University (tribhuvan univ) led to a blue cluster. Tribhuvan University contributed the most to both publications (138) and linkages (146). Arizona State University (arizona state univ) led its cluster (in green color) with 20 publications followed by Hokkaido University (hokkaido univ) (14). In the yellow cluster, Kathmandu University (kathmandu university) contributed 23 documents. All clusters showed a close internal connection, except for the blue cluster. On top of the map, two institutes, the Agricultural University of Norway (agr univ norway) and University of Copenhagen (univ copenhagen), are remotely related to Tribhuvan University and bear no connection to any other clusters (Figure 6).

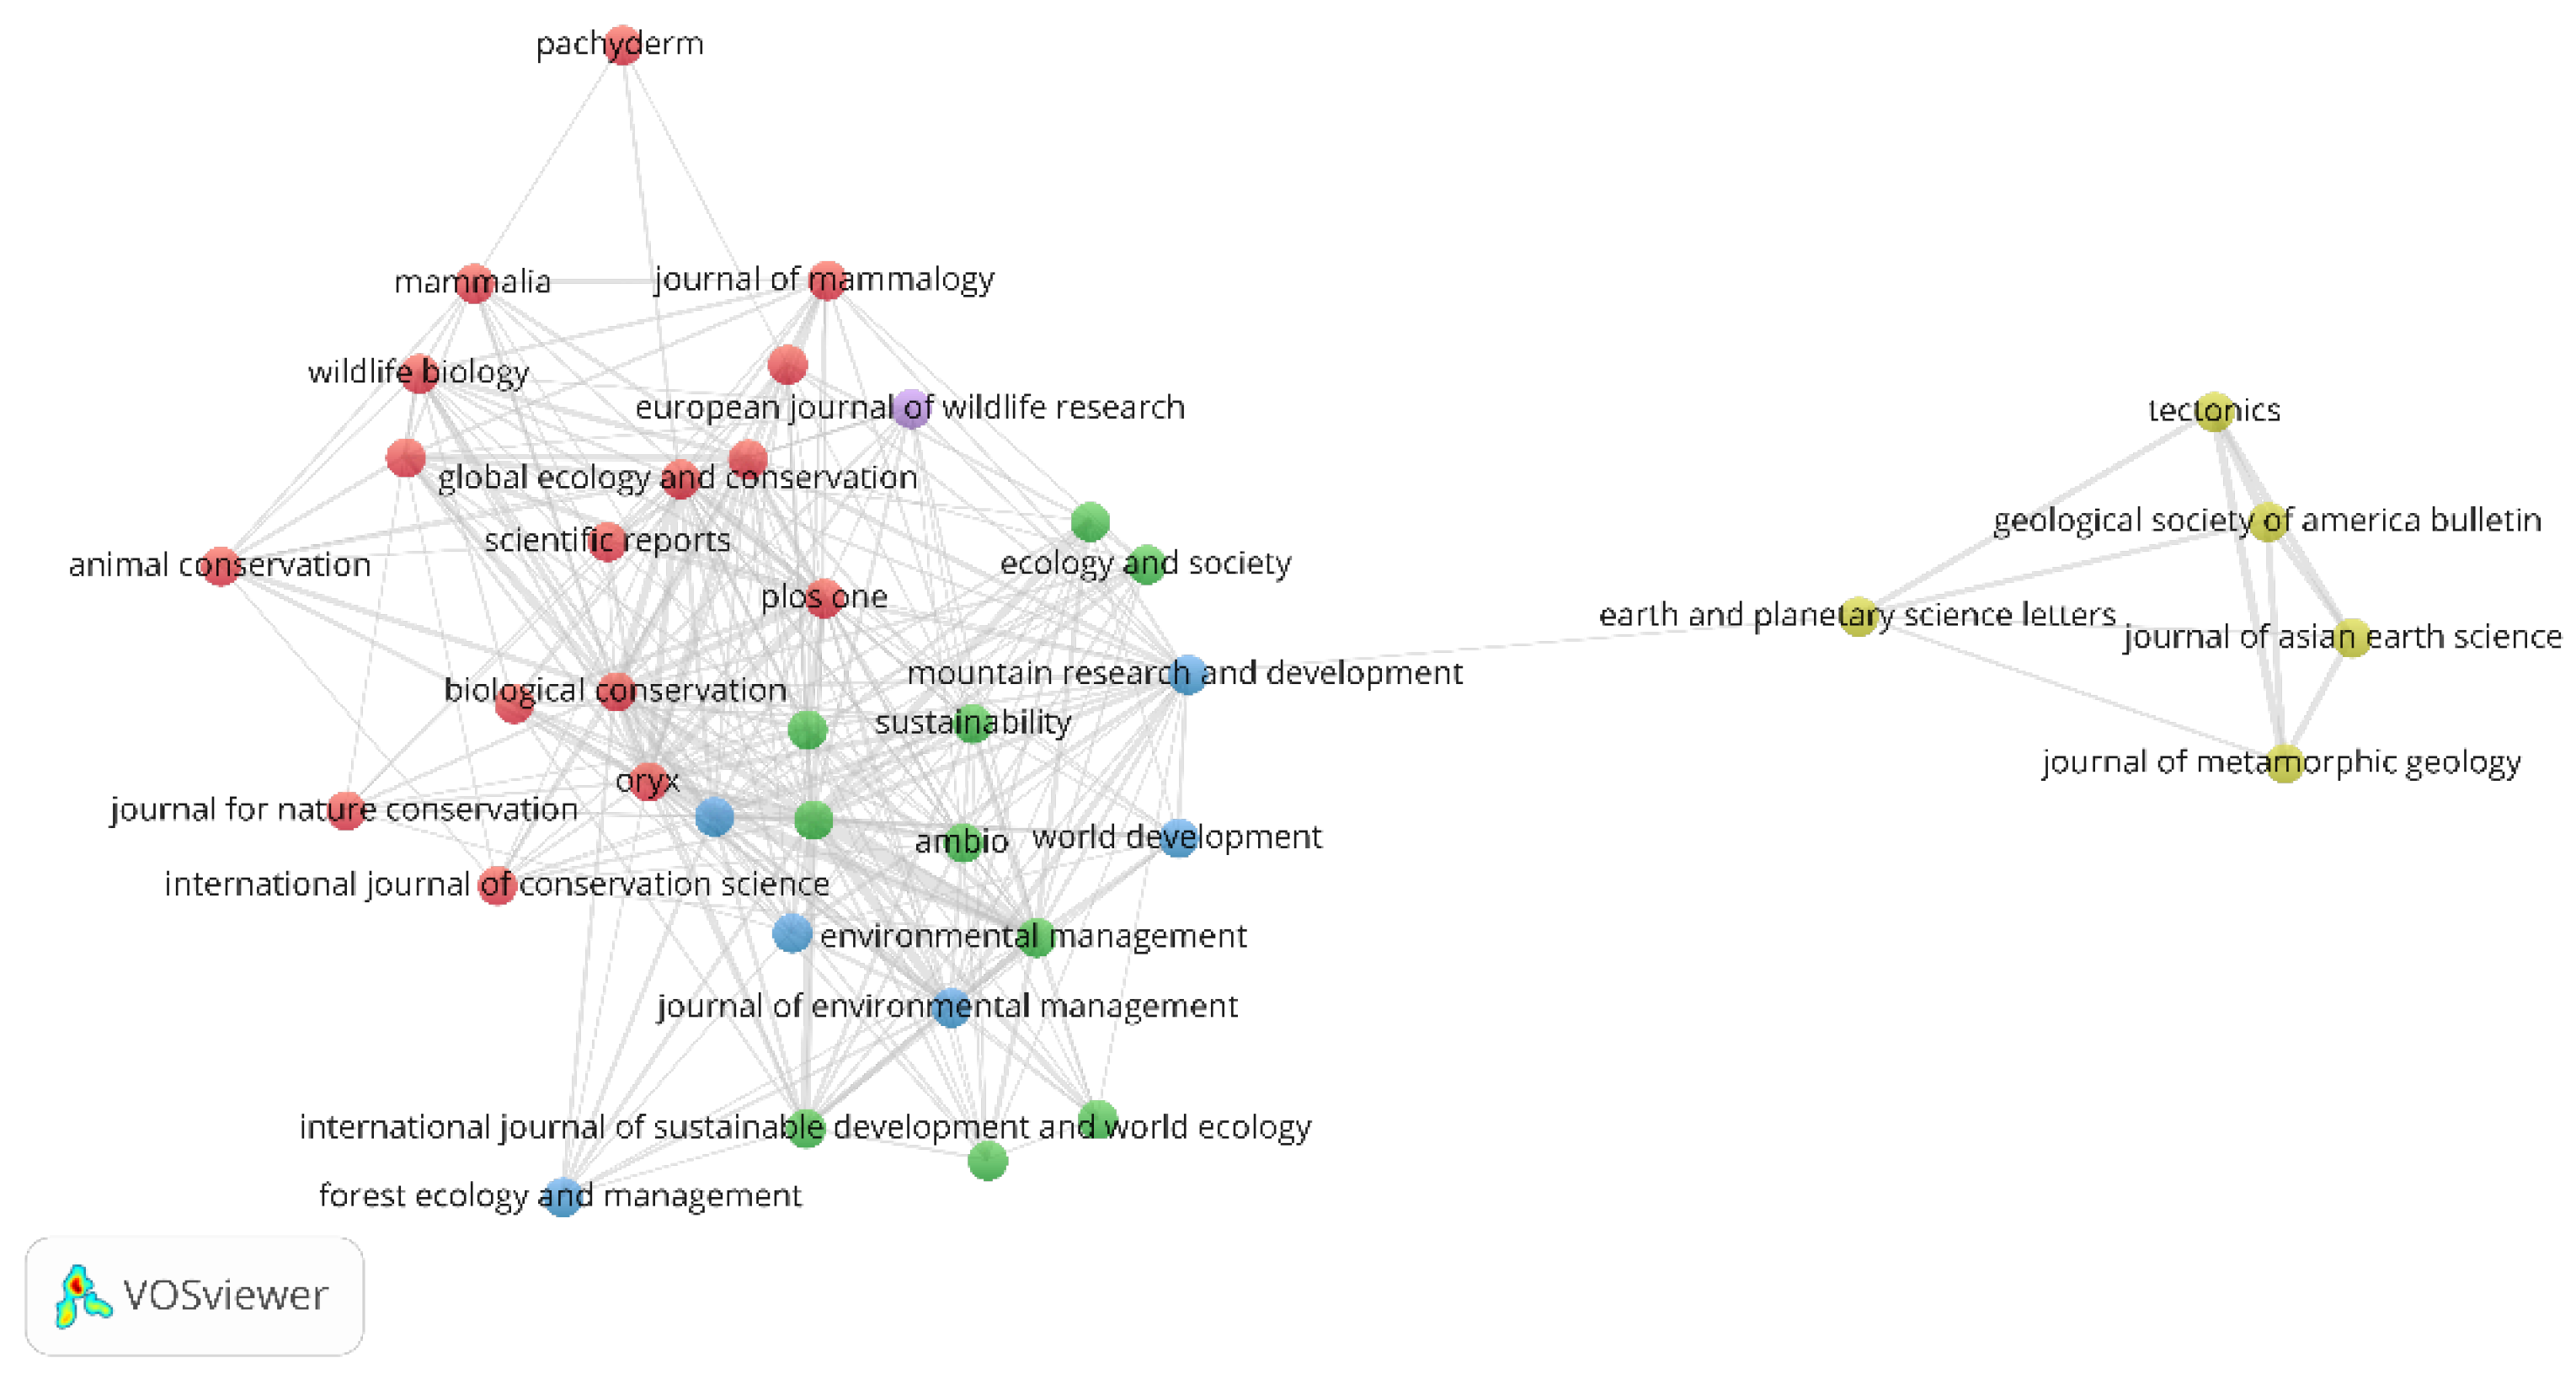
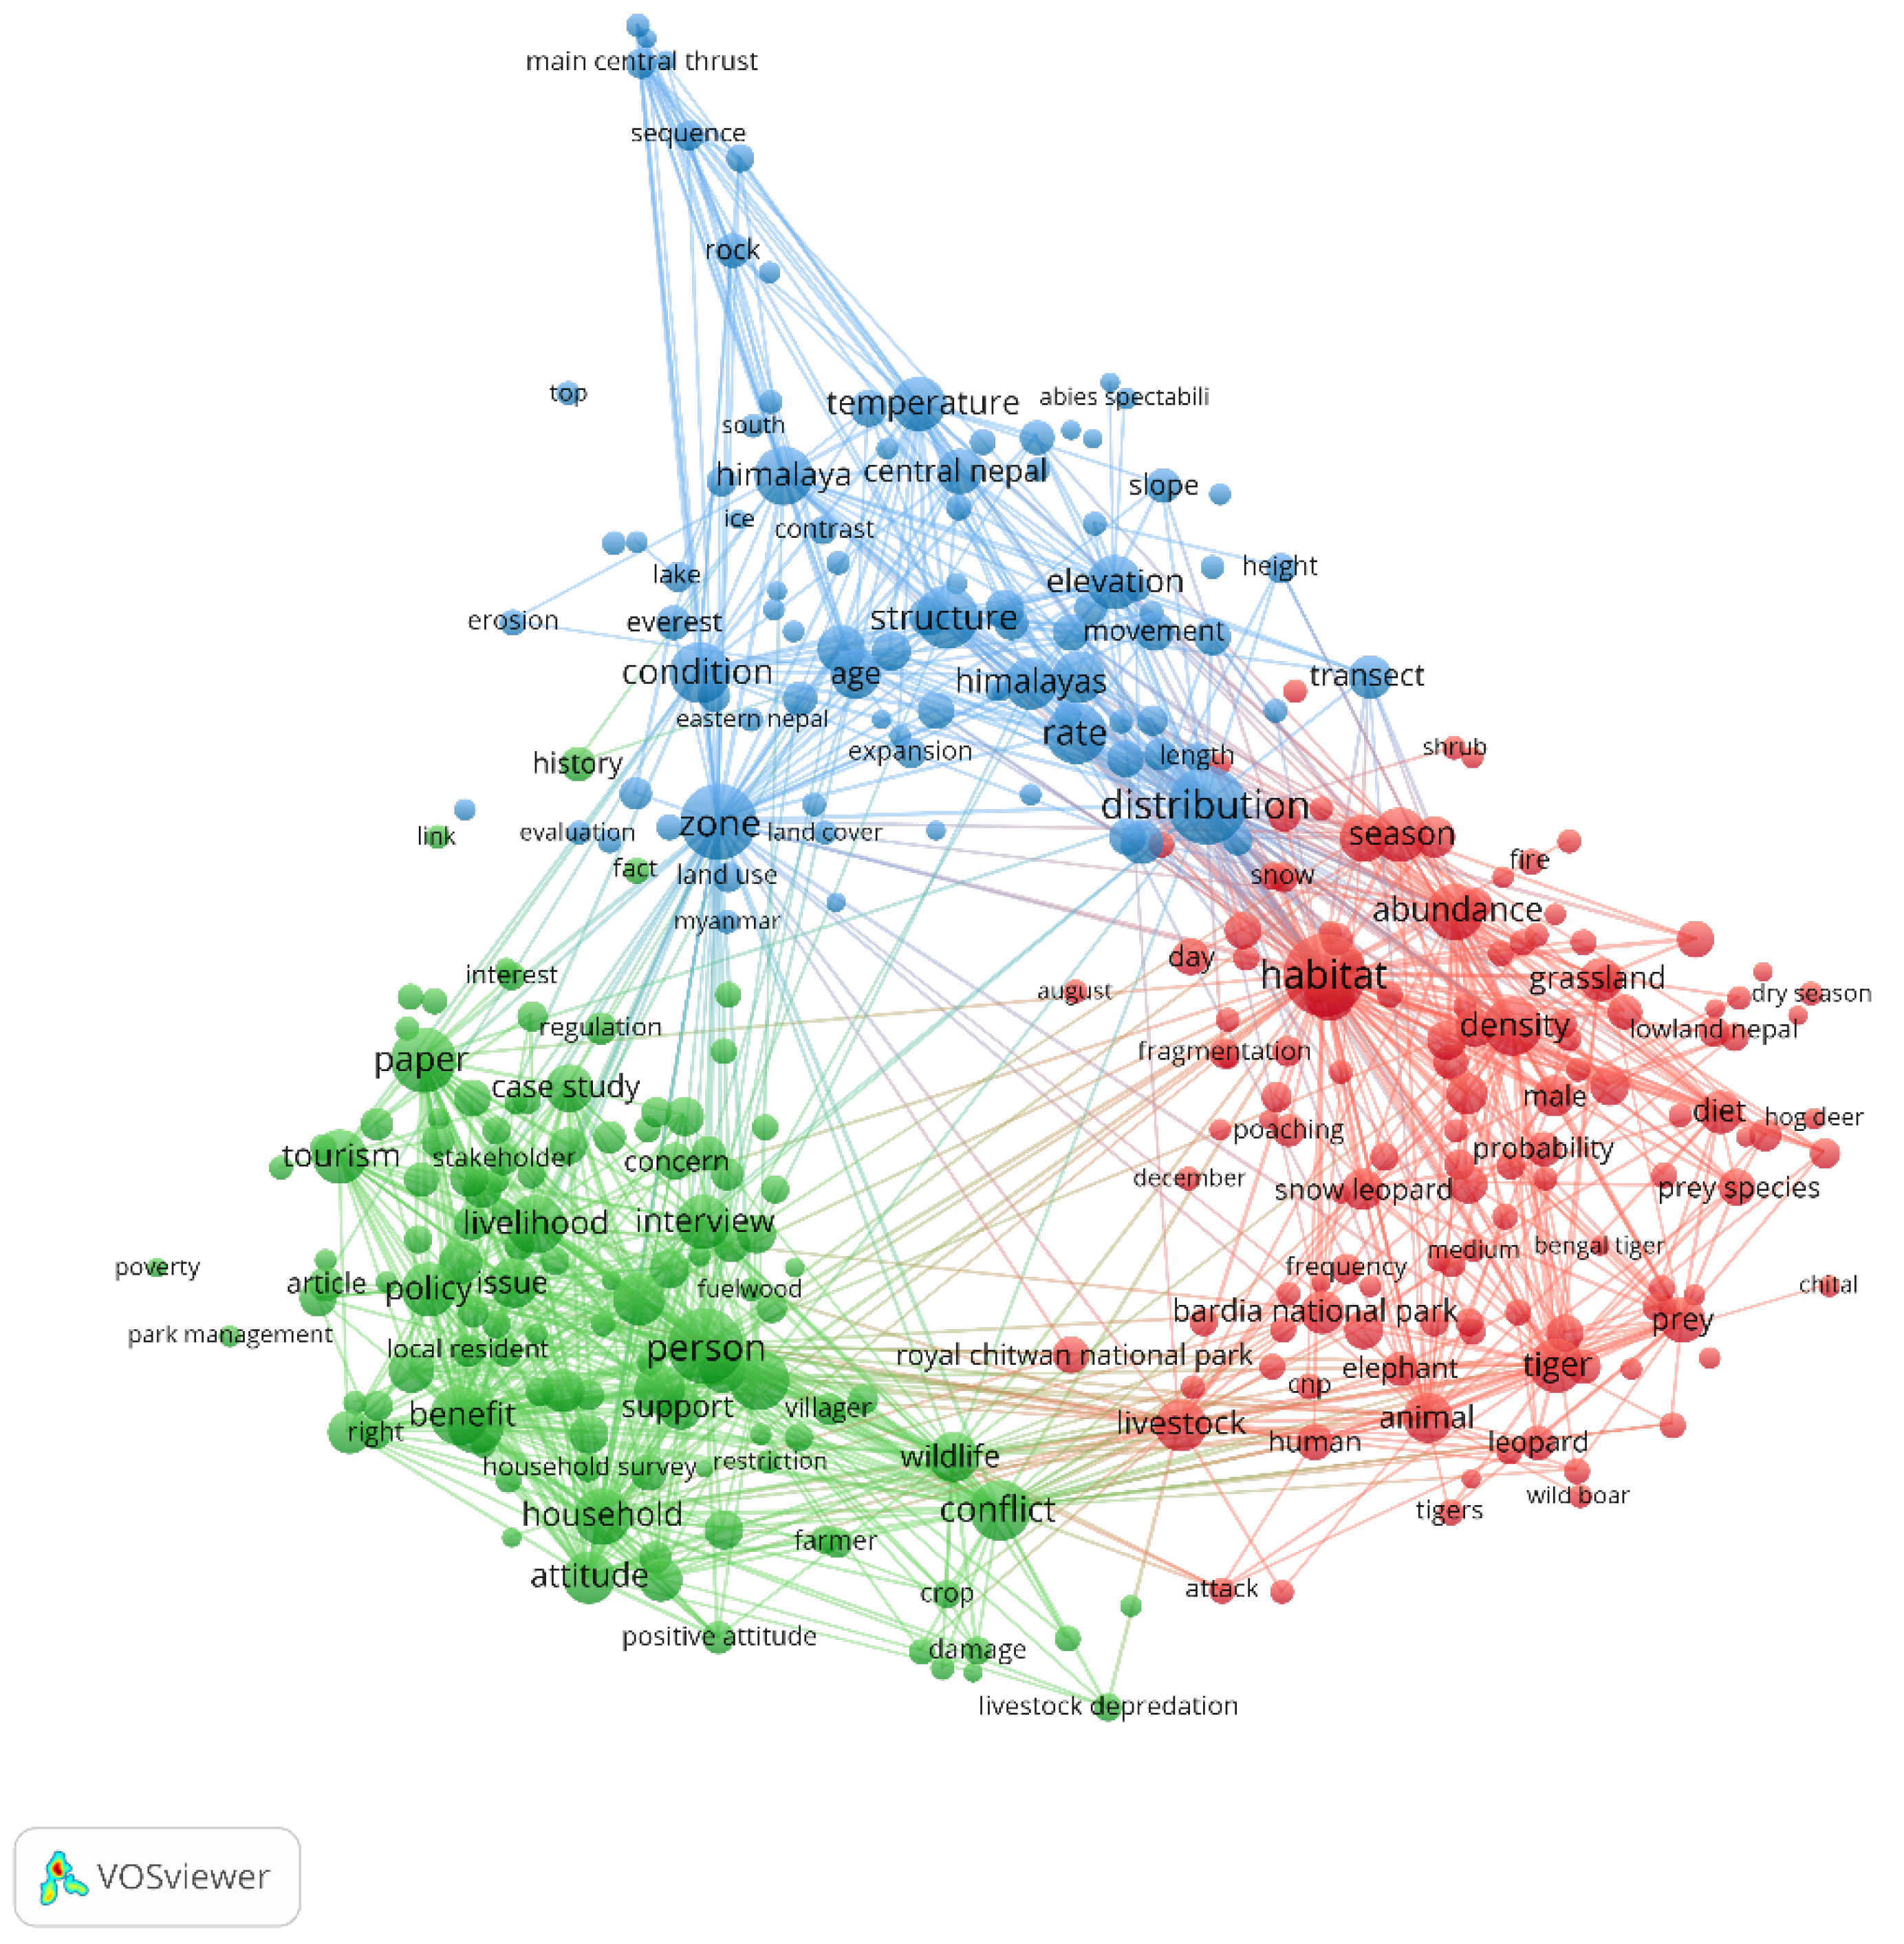
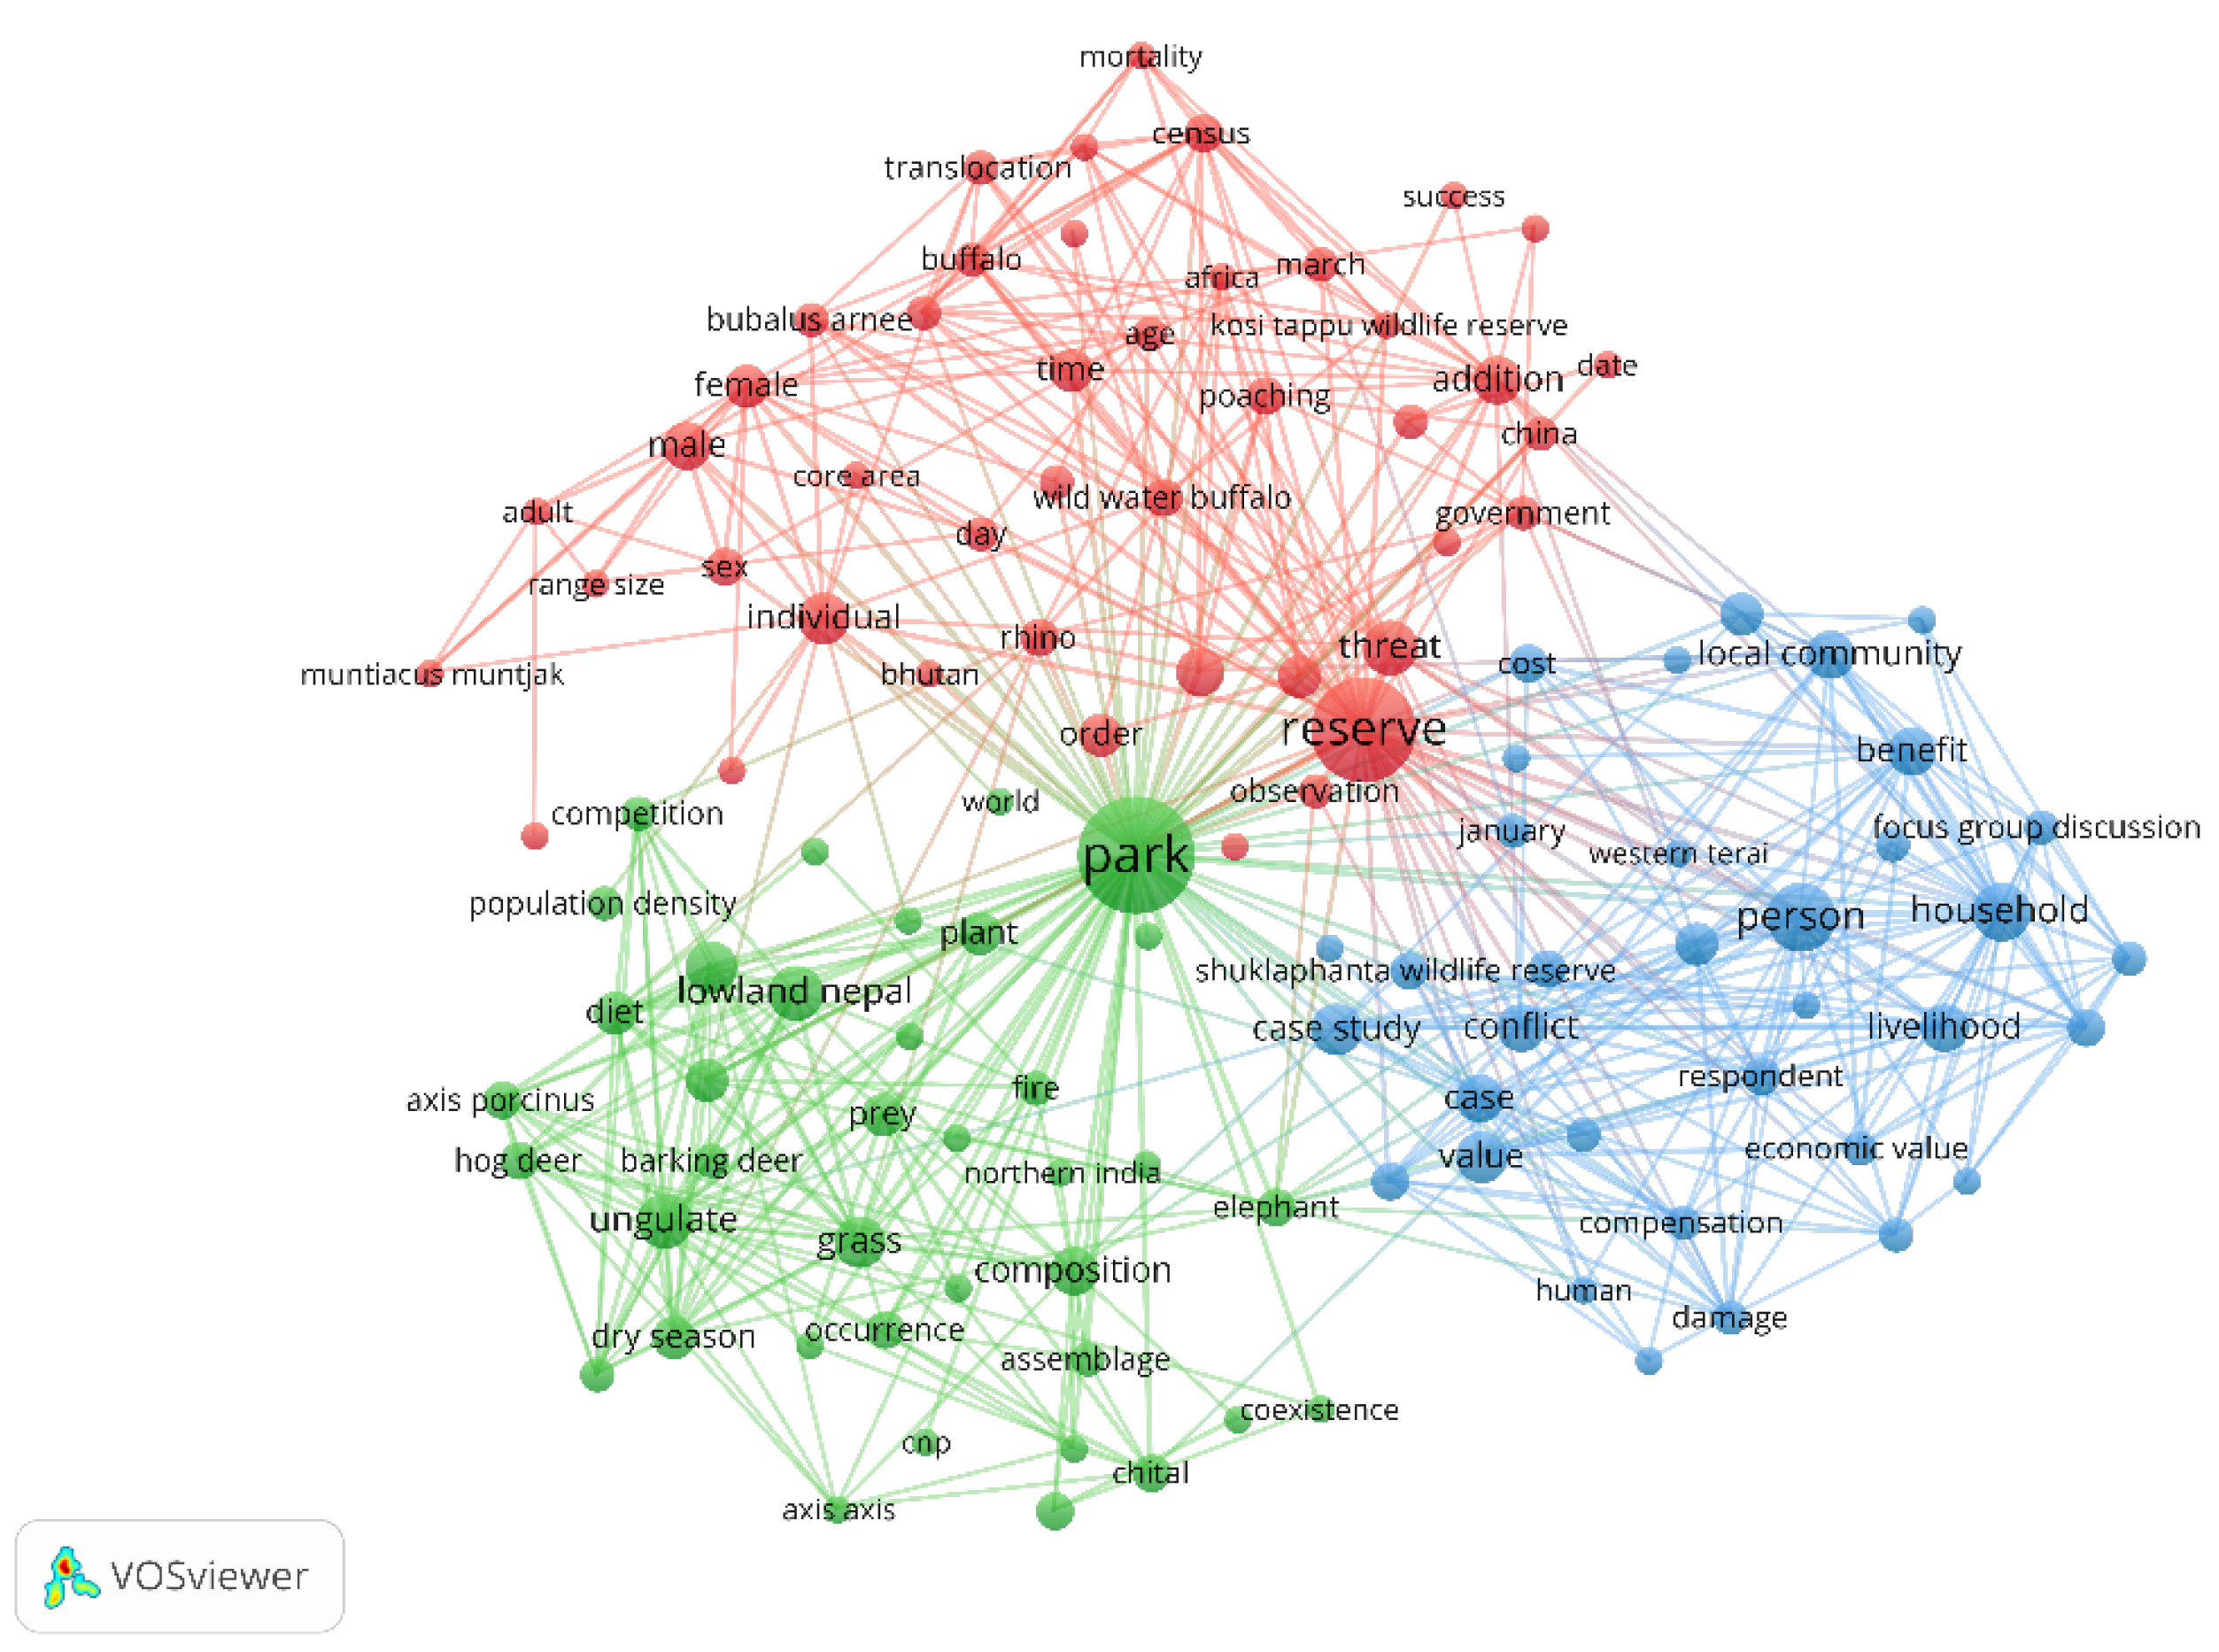
3.3. Analysis of Research Lineage

Diverse Research Aspects

Keywords are nouns or phrases that express the important substance of an article [91]. The keywords used in the publications were analyzed to provide both the most important themes and significant research trends in the field [92]. VOSviewer was used to create a keyword co-occurrence map that visualizes variations in scientific production [93]. We set the threshold as the default value (10), and a binary counting method from both titles and abstracts, ignoring structured abstract labels and copyright statements, was adopted. A total of 339 (out of 20,916) items were discovered and sorted into three clusters (separated by color, as shown in Figure 7). The most frequently used keywords are shown in larger nodes. These nodes are connected to each other at various distances. The greater the association between the terms, the shorter the distance between the different nodes.
The sizes of the nodes in Figure 7 show the frequency of the terms used. Larger nodes indicate more frequently used keywords. The term “person”, “zone”, “distribution”, and “habitat” had the most power. The nodes in the same cluster indicated that these publications had a common theme. As illustrated in the red cluster (cluster 1, right, 130 nodes), the primary nodes like “habitat” and “density” were found. In this cluster, other keywords such as “animal”, “livestock”, “tiger”, and “poaching” indicate a research interest in major animals and related topics. Keywords like “person”, “wildlife”, “conflict”, “household”, “livelihood”, “income”, “policy”, and “tourism” formed core topics in the green cluster (cluster 2, bottom left, 115 items). We can determine that this cluster’s main concern is related to people’s lives and their interactions with wildlife. Other keywords such as “interview” and “case study” indicated the most adopted research methods in this cluster. Next, nodes such as “zone”, “distribution”, “elevation”, “himalaya”, “temperature”, and “transect” focused on the aspect of geographical and geological studies in the blue cluster (cluster 3, top, 91 items).
Burst detection is a valuable analytic tool for identifying keywords that attract considerable attention from connected scientific communities over time. Keyword citation bursts occur when the number of citations for a certain keyword spike is dramatic. Here, 25 bursts discovered on the keywords were calculated using CiteSpace (parameter settings: years per slice: 1; node types: keyword) to investigate the PA-relevant studies and to explore the intensely explored directions (Figure 8). The top 25 keywords with bursts were mirrored by the discovered hotspot keywords displayed in Figure 8. The period during which the citation boom occurred is indicated in red.
The keywords of the early stage were “constraint”, “main central thrust”, and “inverted metamorphism”, denoting a period of research interest in geological studies. Then, from 1998 to 2015, “local people”, “community”, “conservation”, and “protected area management” and wildlife attracted intense research enthusiasm. Two of Nepal’s famous national parks, Sagarmatha National Park and Chitwan National Park, have received intense attention from the scientific community. In recent years, topics related to climate change have enjoyed a boom. Keywords “climate change” and “precipitation” are now in the burst range, along with the two other burst leading keywords, “abies spectabili” and “impact”, indicating the latest research hotspot related to climate change.
By assessing the burst keyword order, such as “main central thrust”, “local people”, “conservation”, “attitude”, “climate change”, and “impact”, the dynamic process can be found in Figure 8. The keyword bursts also revealed that the focus of the study shifted rapidly over time.

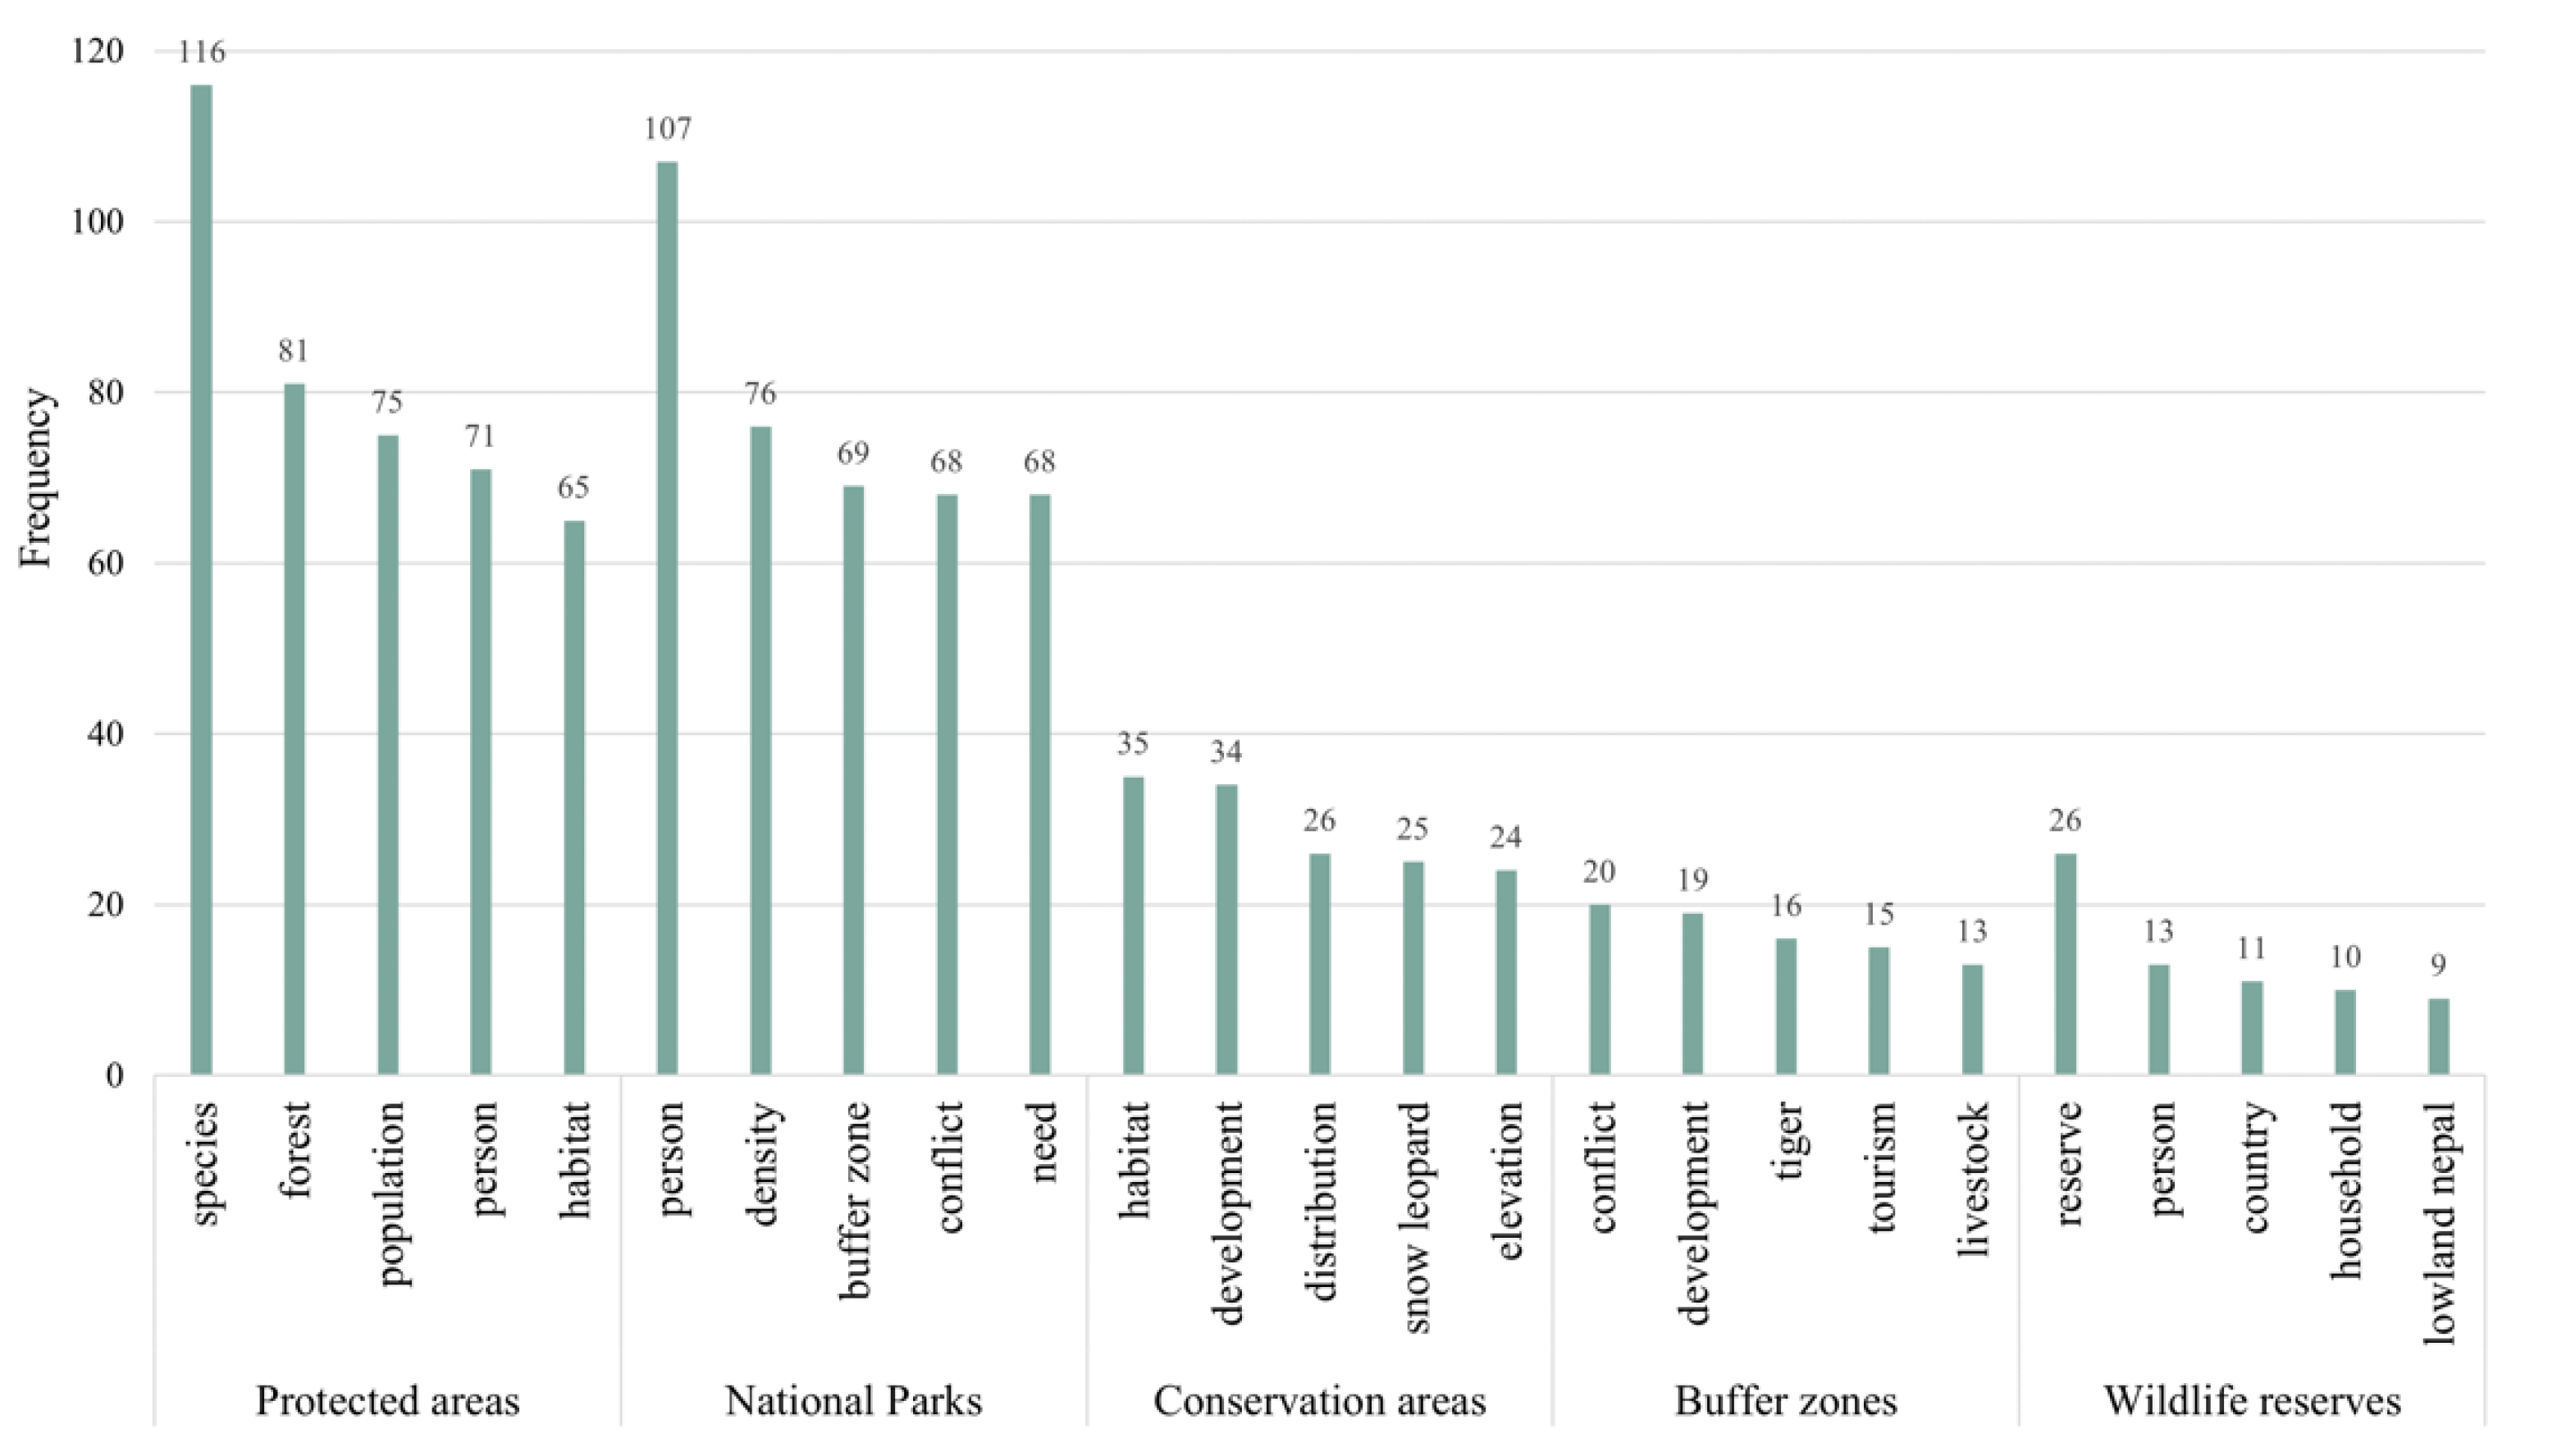
3.4. Comparison among Different Keywords

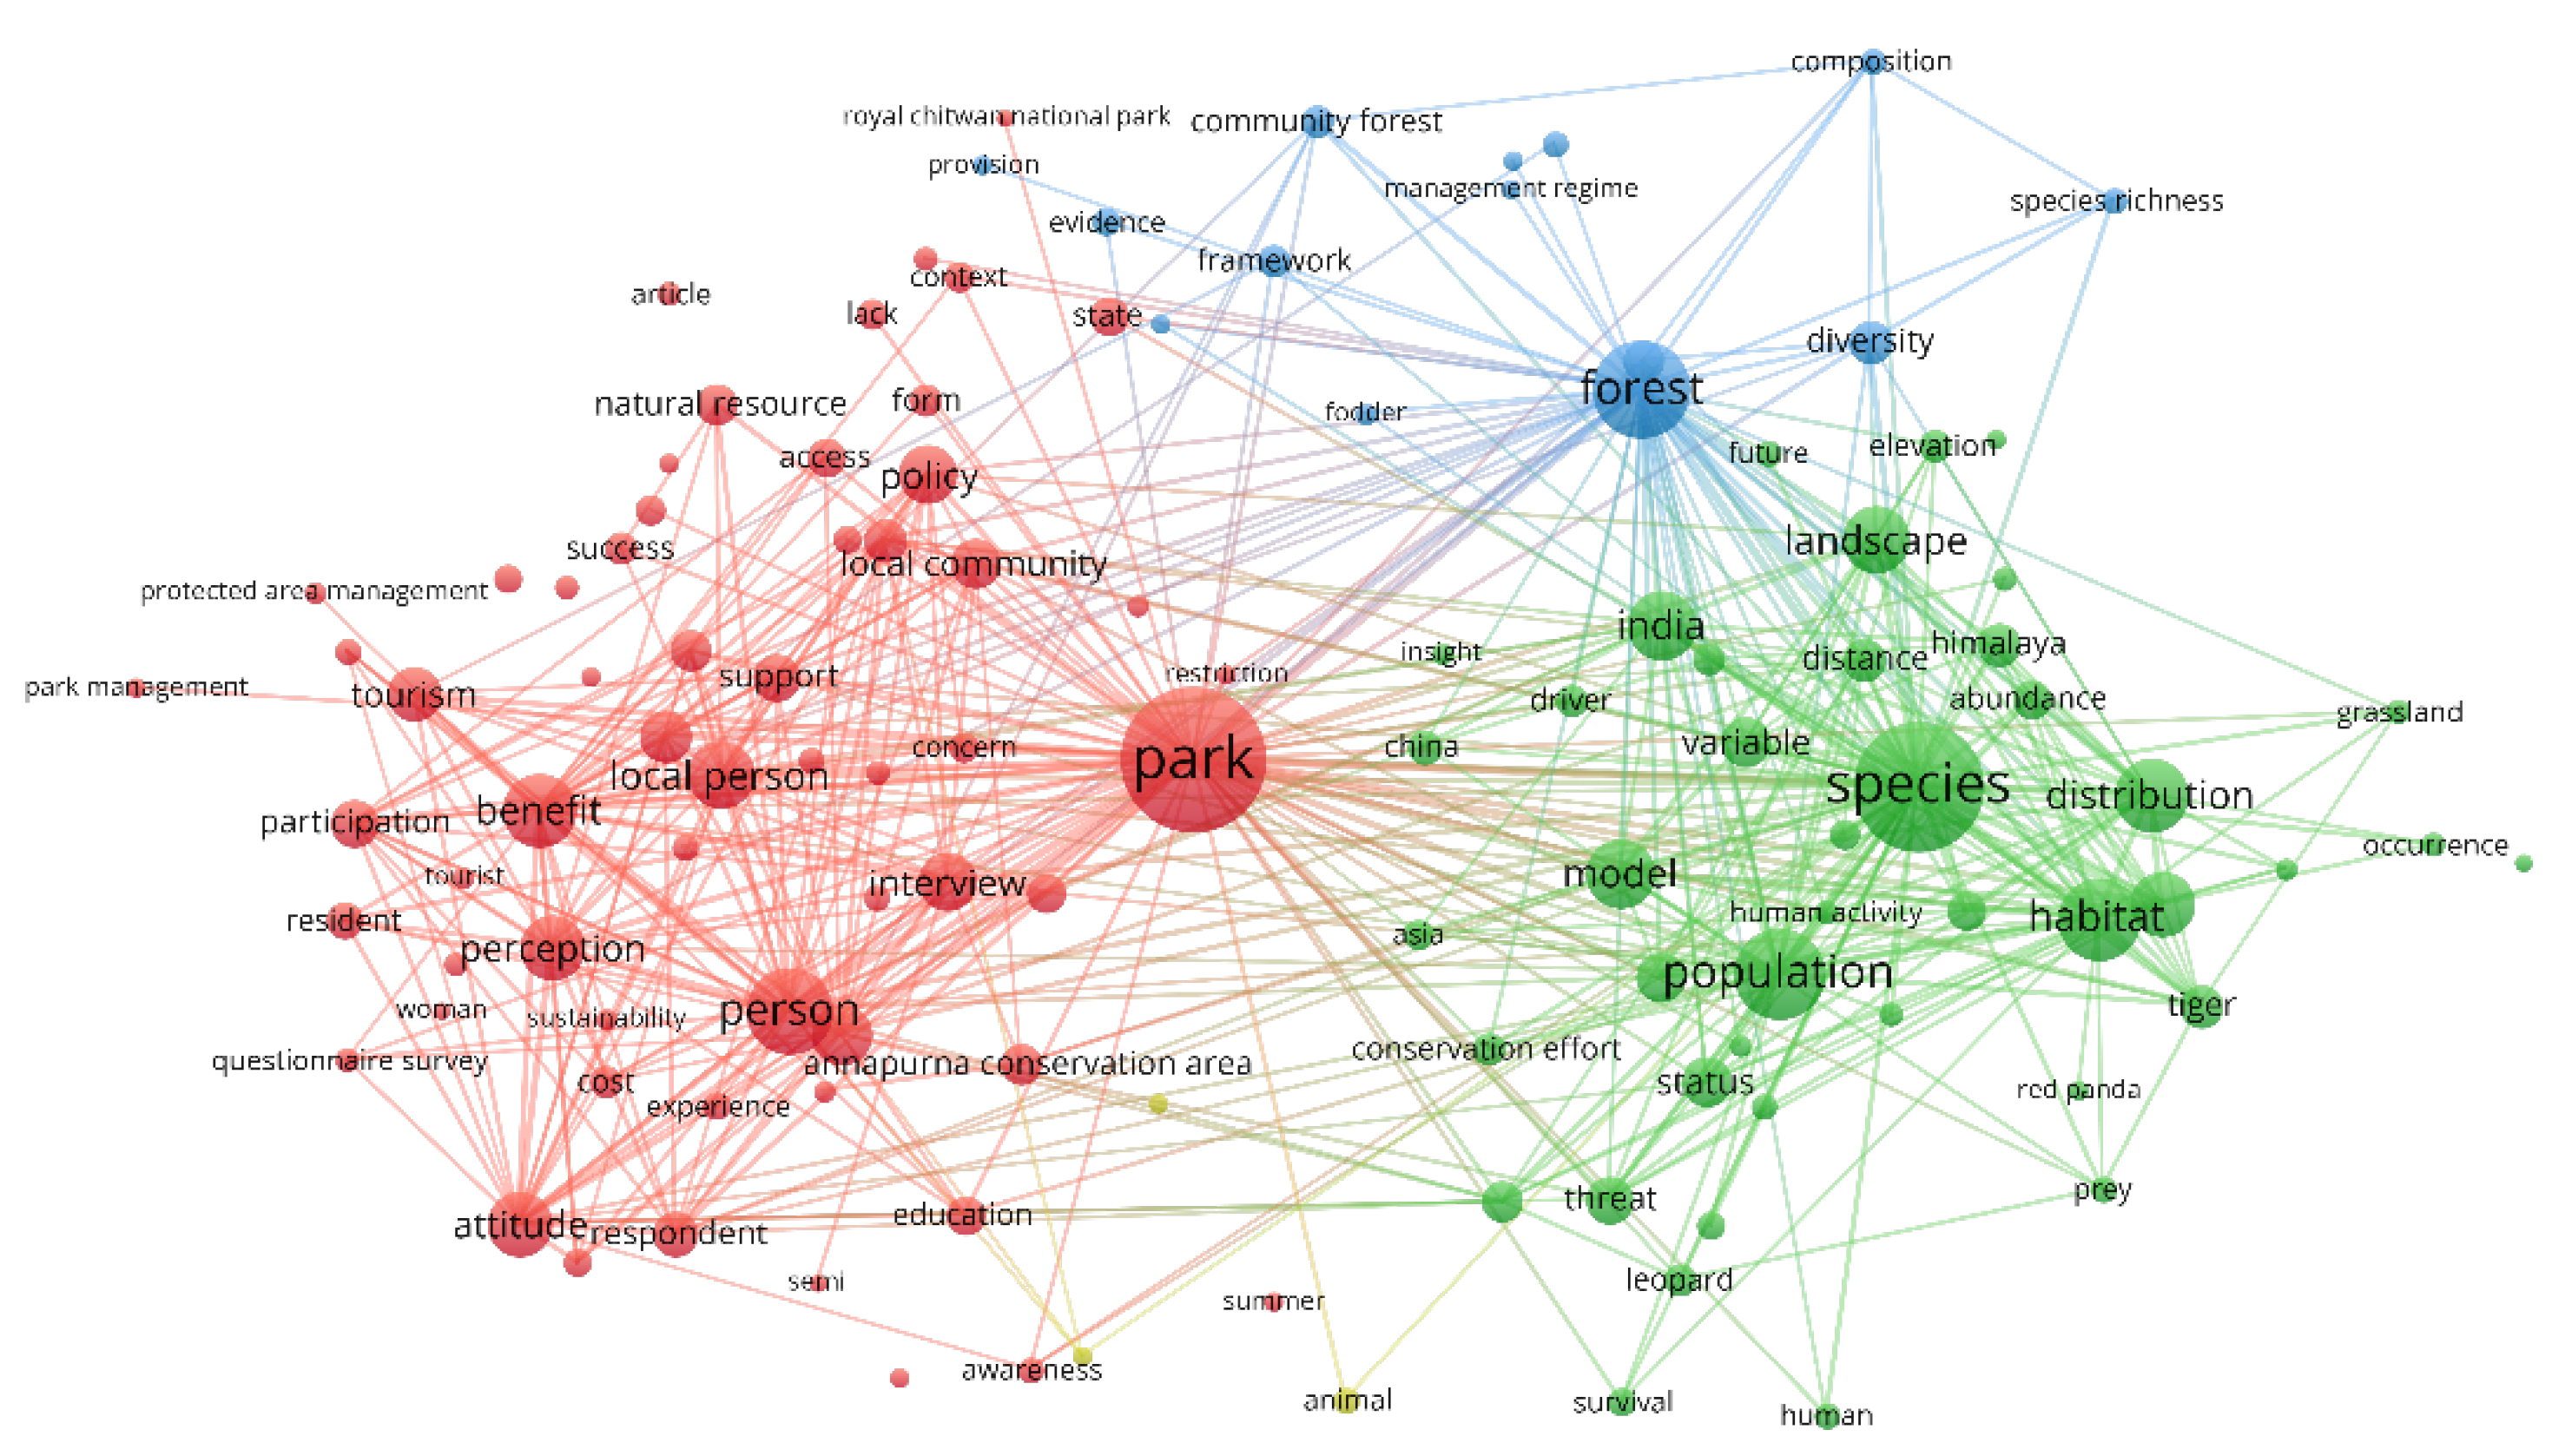
3.4.1. Protected Areas

PA subjects were divided into five colored clusters (120 items) (Figure 9). The red cluster with the most terms (60) is led by “park”. Other keywords in this cluster include “local person”, “perception”, “policy”, “attitude”, “interview”, and “tourism”. Most of the keywords in this cluster were related to parks and interactions with local people/communities. “Species”, “population”, “distribution”, “threat”, “habitat”, and “landscape” are the primarily associated terms in the green cluster (43 items), which is related to research on wildlife and their habitats as well as the impact of human. The blue cluster contains 14 items with “forest”, “diversity”, and “community forest” being bigger nodes, indicating a research interest in forests and interaction with the community. The other two clusters contained too few items to be analyzed.

3.4.2. National Parks
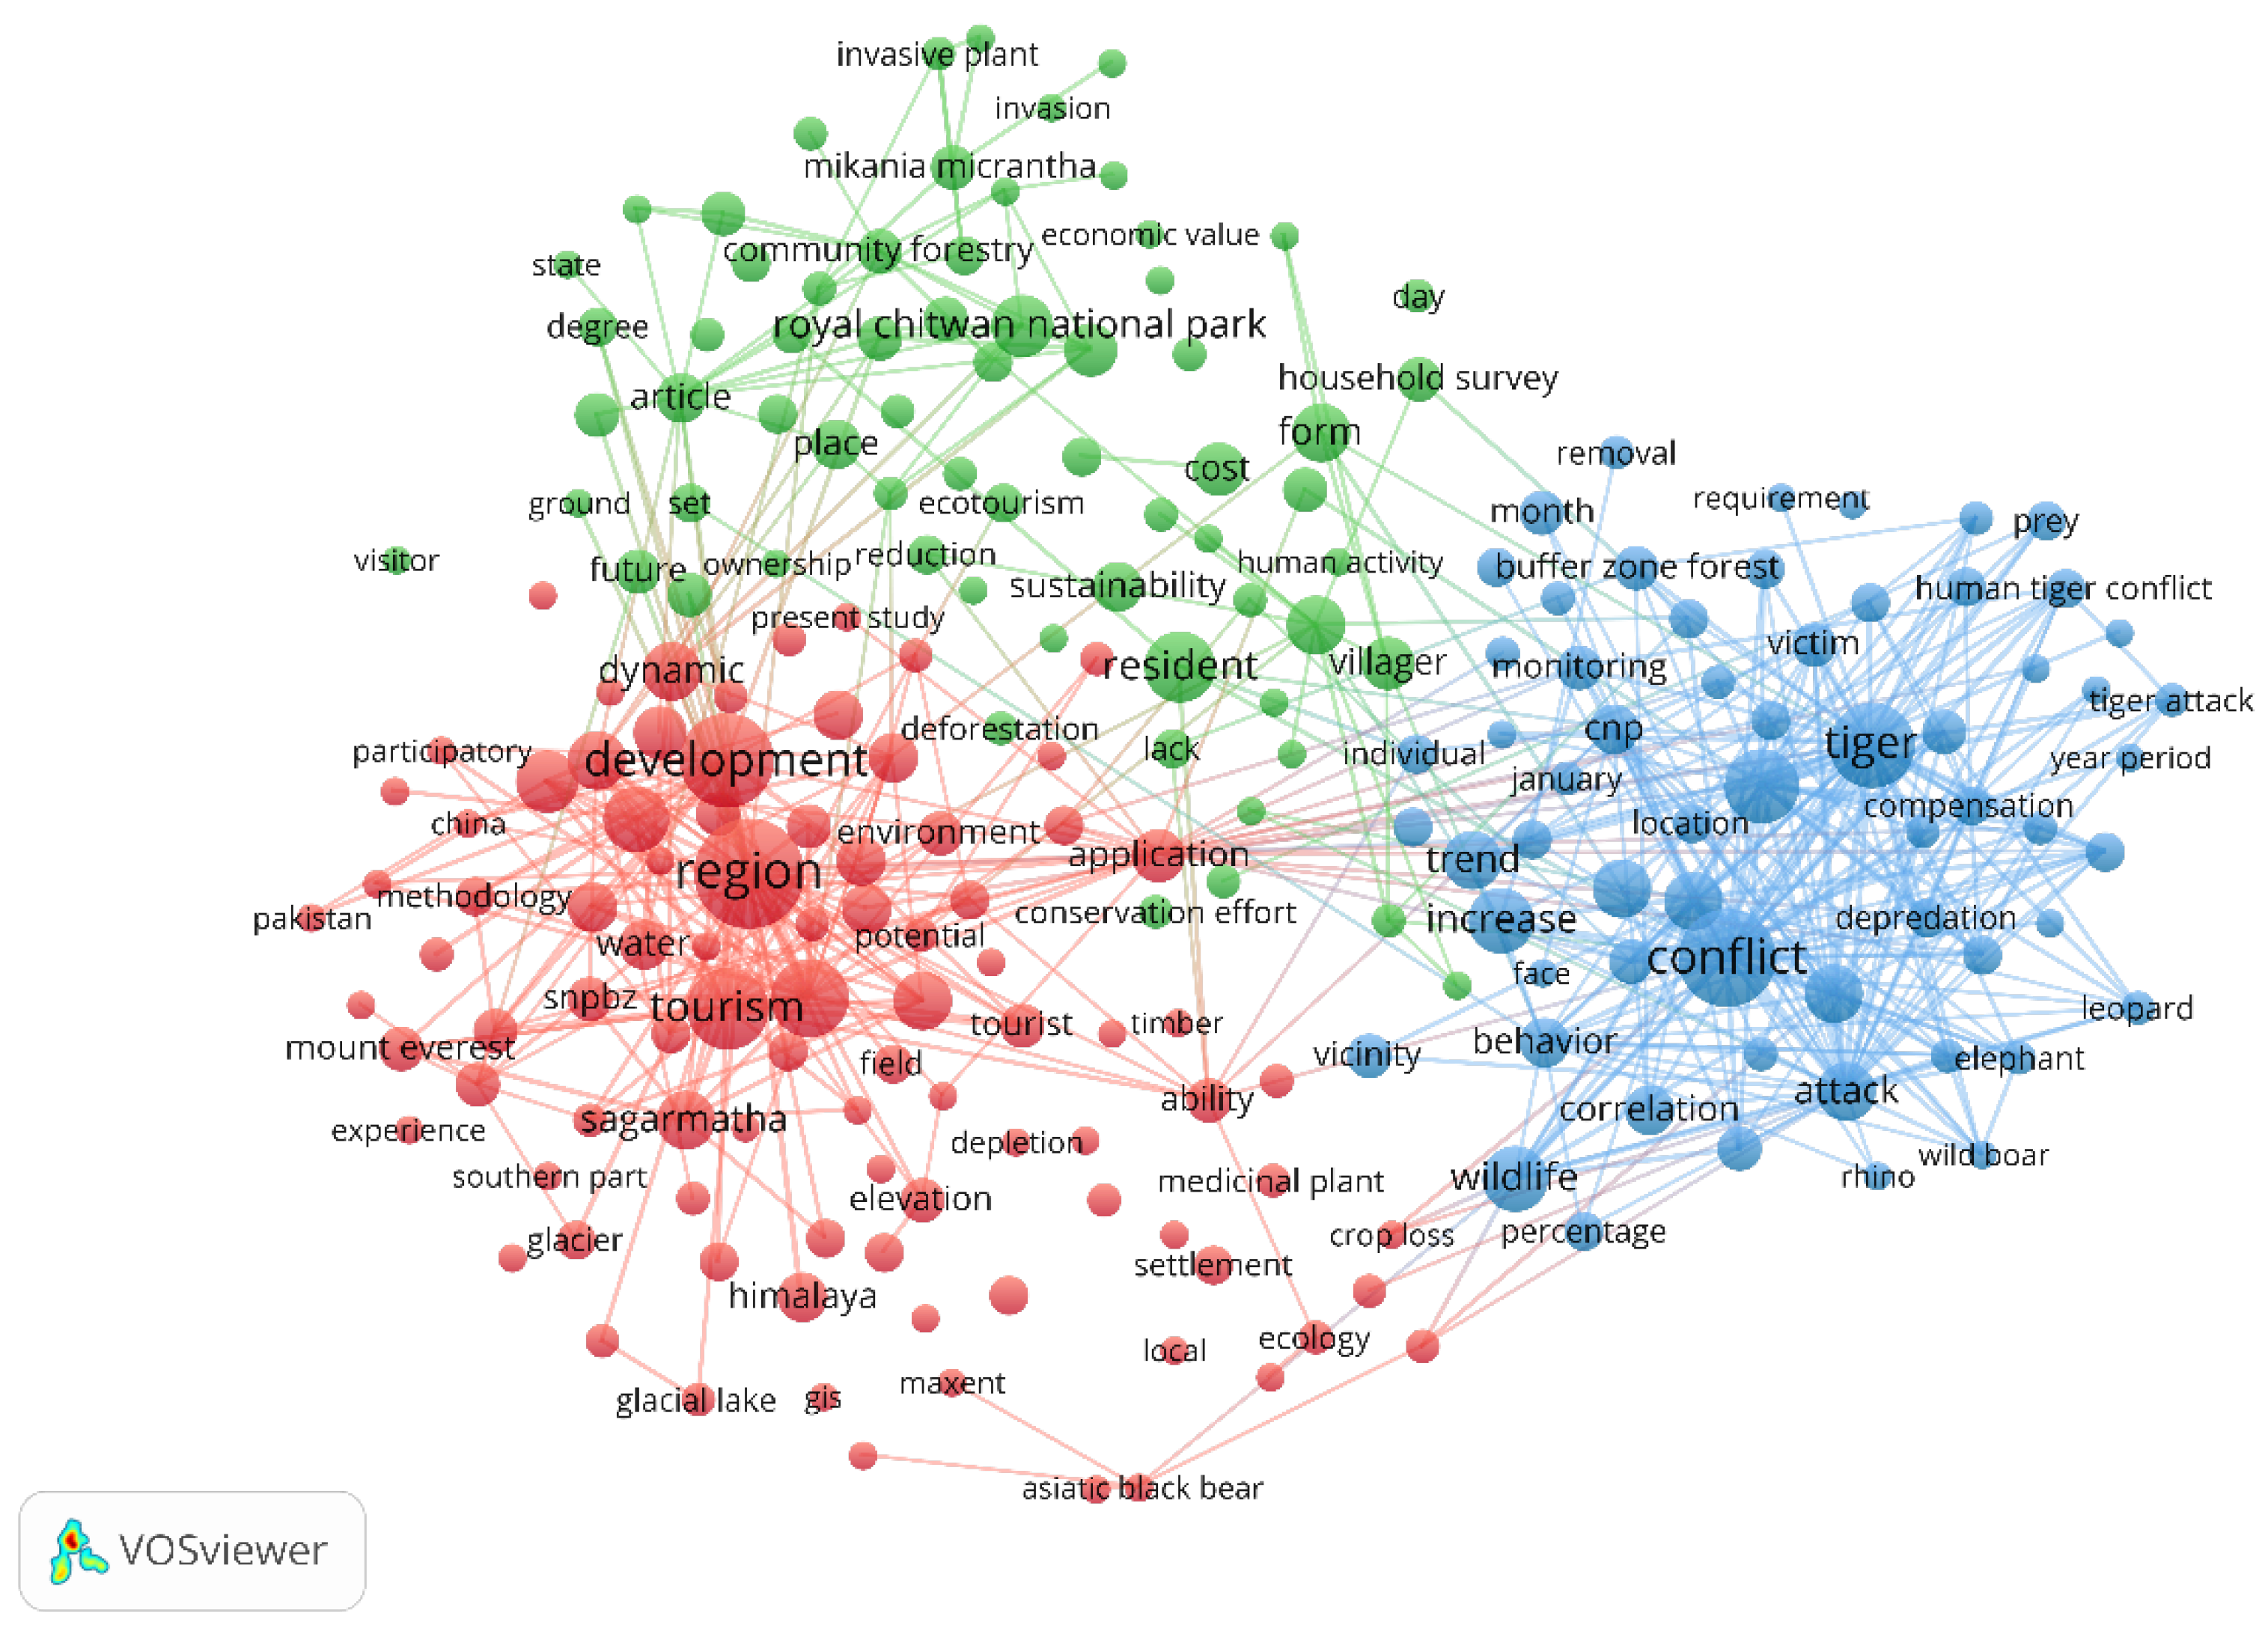
The “National Parks” topic has three colored clusters with 228 items (Figure 10). The red cluster holds the most terms (87) with “person” at the center. Other keywords in this cluster include “livelihood”, “attitude”, “perception”, “conflict”, “wildlife”, and “tourism”, suggesting studies related to local people’s relationship with national parks. The green cluster contains 82 items with bigger nodes of “range”, “density”, “animal”, “abundance”, “livestock”, and “tiger”, which demonstrates a research interest in wildlife and their living environment and interaction with the community. Most of the keywords in the blue cluster (59 items) were related to abiotic studies, such as geological and climate change. “Himalaya”, “structure”, “climate change”, and “glacier” are important terms in this cluster.

3.4.3. Buffer Zones

“Buffer zones” brought up 221 items and were grouped into three clusters (Figure 11). The keywords such as “region”, “tourism”, “development”, “dynamic”, and “sagarmatha”, led the red cluster (92 items). In the green cluster, studies were more related to “royal chitwan national park”, “resident”, “cost”, and “place” places (67 items). The blue cluster has 62 items with “conflict”, “increase”, “wildlife”, “tiger”, “attack”, and “victim” being eye-catching. This cluster concerns wildlife attacks and their impact.

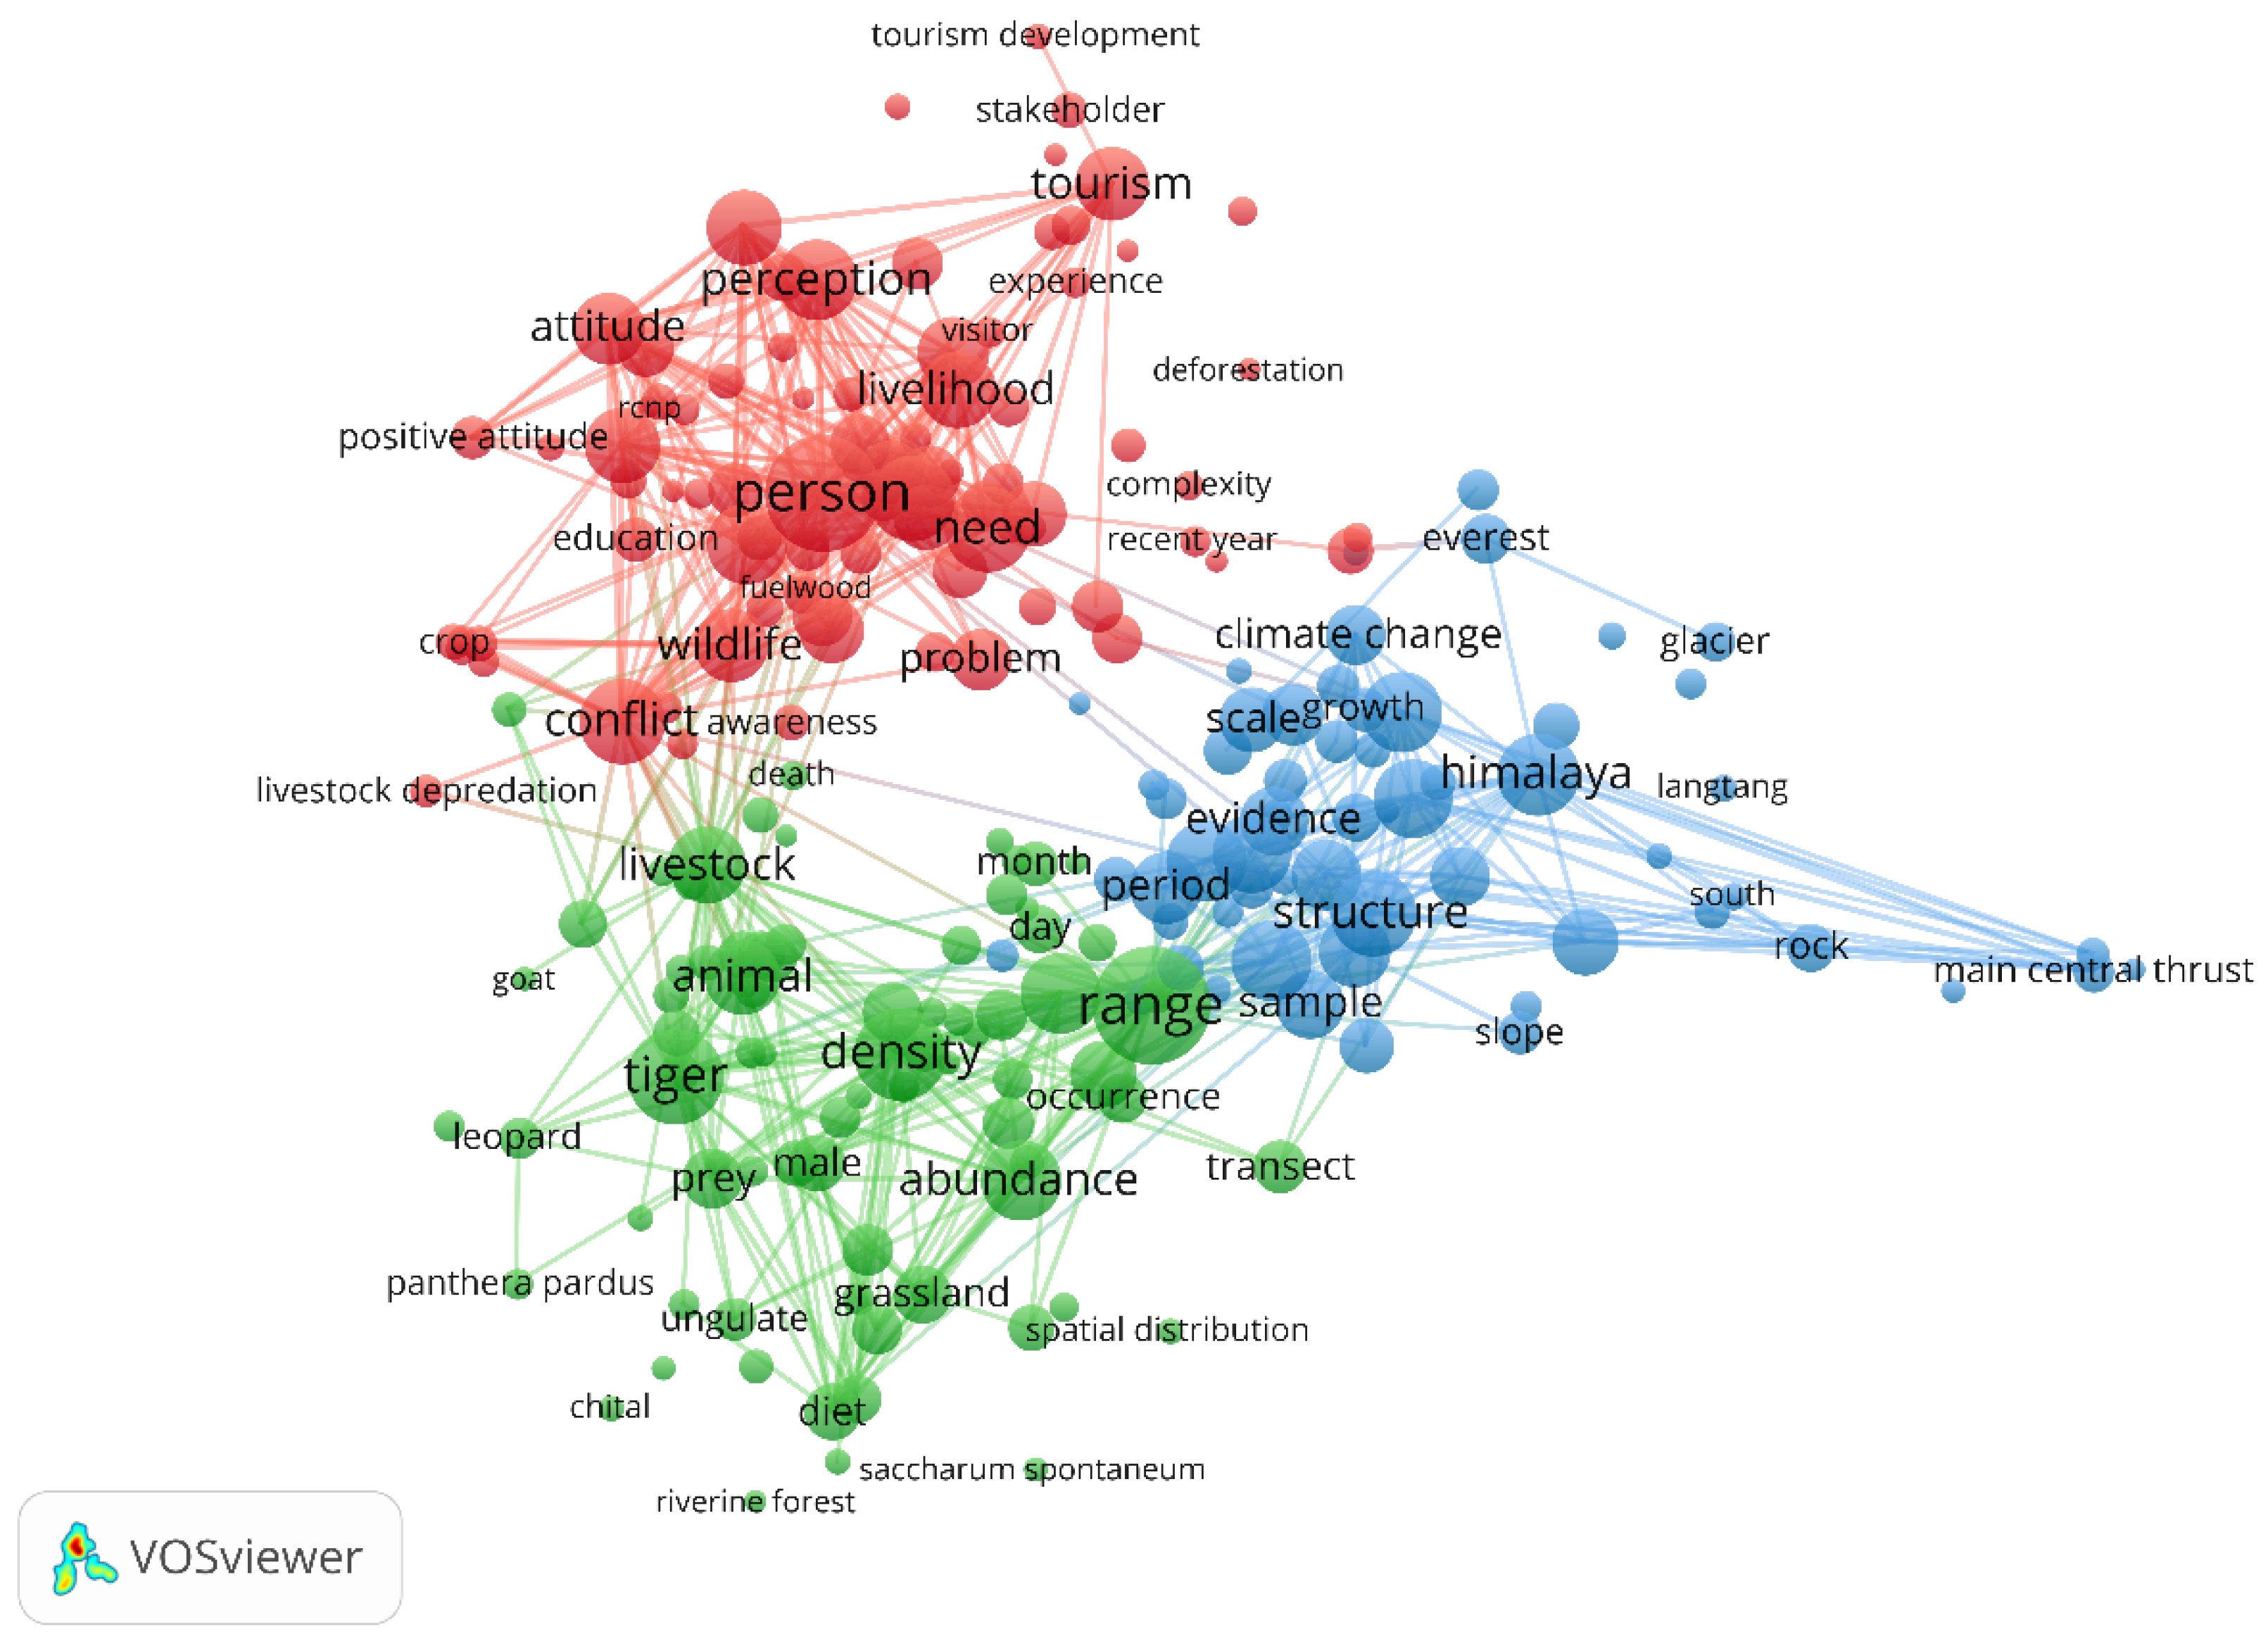
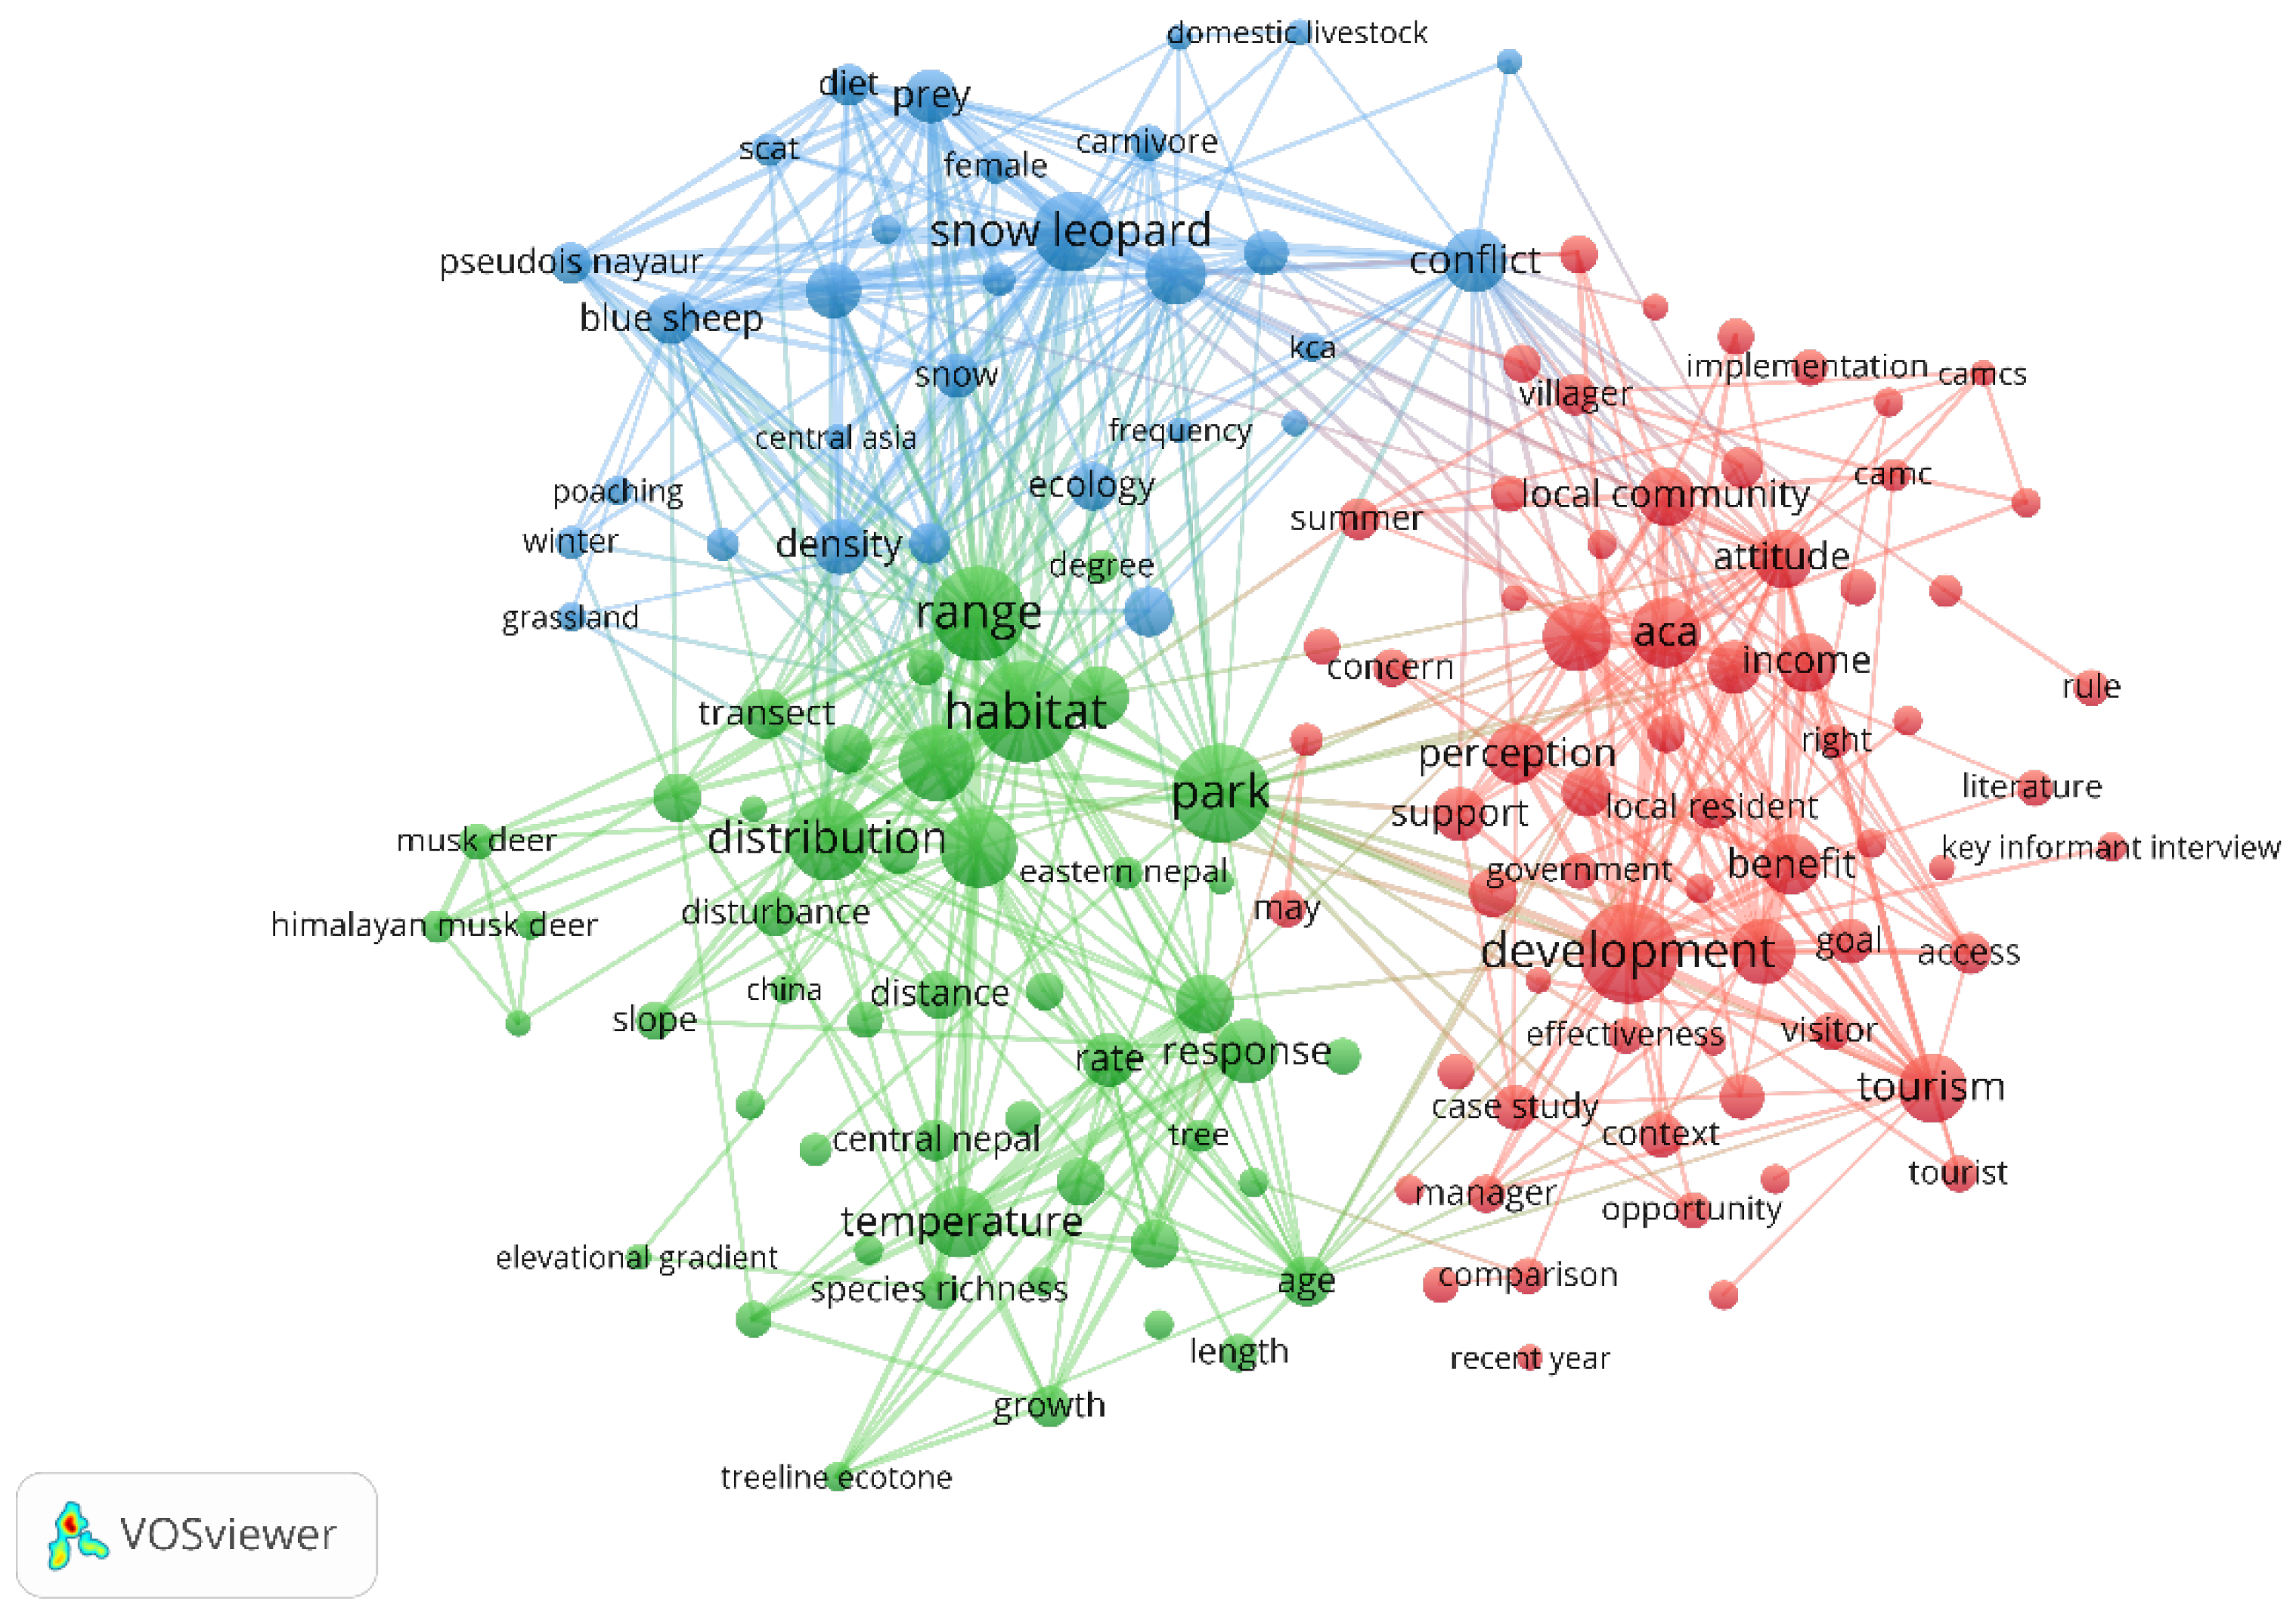
3.4.4. Conservation Areas

This field of “conservation areas” generated three clusters as well, containing 144 items (Figure 12). The threshold for this map was set at five because the sample size was too small to produce a satisfactory map. It is worth noting that the keyword “park” is centered on the whole map, showing a close connection to the other two clusters.
The red cluster holds 65 items with important nodes of “development”, “participation”, “local community”, “income”, “tourism”, and “aca (Annapurna Conservation Area)” pointing to studies on tourism-led development and local participation. The green cluster (49 items) is led by items of “habitat”, “park”, “distribution”, “range”, “species richness”, “temperature”, “treeline ecotone”, and “musk deer” showing a mixed research focus on wildlife, their habitat and plants’ correlation with temperature. In the blue cluster (30 items), “snow leopard”, “conflict”, “blue sheep”, “density”, “ecology”, and “prey” are bigger nodes showing intense research interest in animal and ecological perspectives. The word “conflict” is very close to the red cluster, indicating a close relationship between wildlife and “development”.

3.4.5. Wildlife Reserves

Mapping of this topic produced 119 items that were organized into three clusters (Figure 13). “Park” and “reserve” are considerably larger than the other keywords with the former being center of the map. Apart from “reserve”, the red cluster (46 items) concentrates on “threat”, “individual”, “water buffalo”, and “poaching”. It is also a field of research on animals and their living environments. Green (38 items) is mainly about animals, such as “ungulate”, “axis porcinus”, and “prey”. However, this cluster’s studies have been mostly low with regard to “lowland Nepal”. The blue one is clearly related to studies on local people and conservation because this cluster is led by keywords such as “person”, “household”, “benefit”, “local community”, “conflict”, “damage”, and “compensation”.

4. Discussion

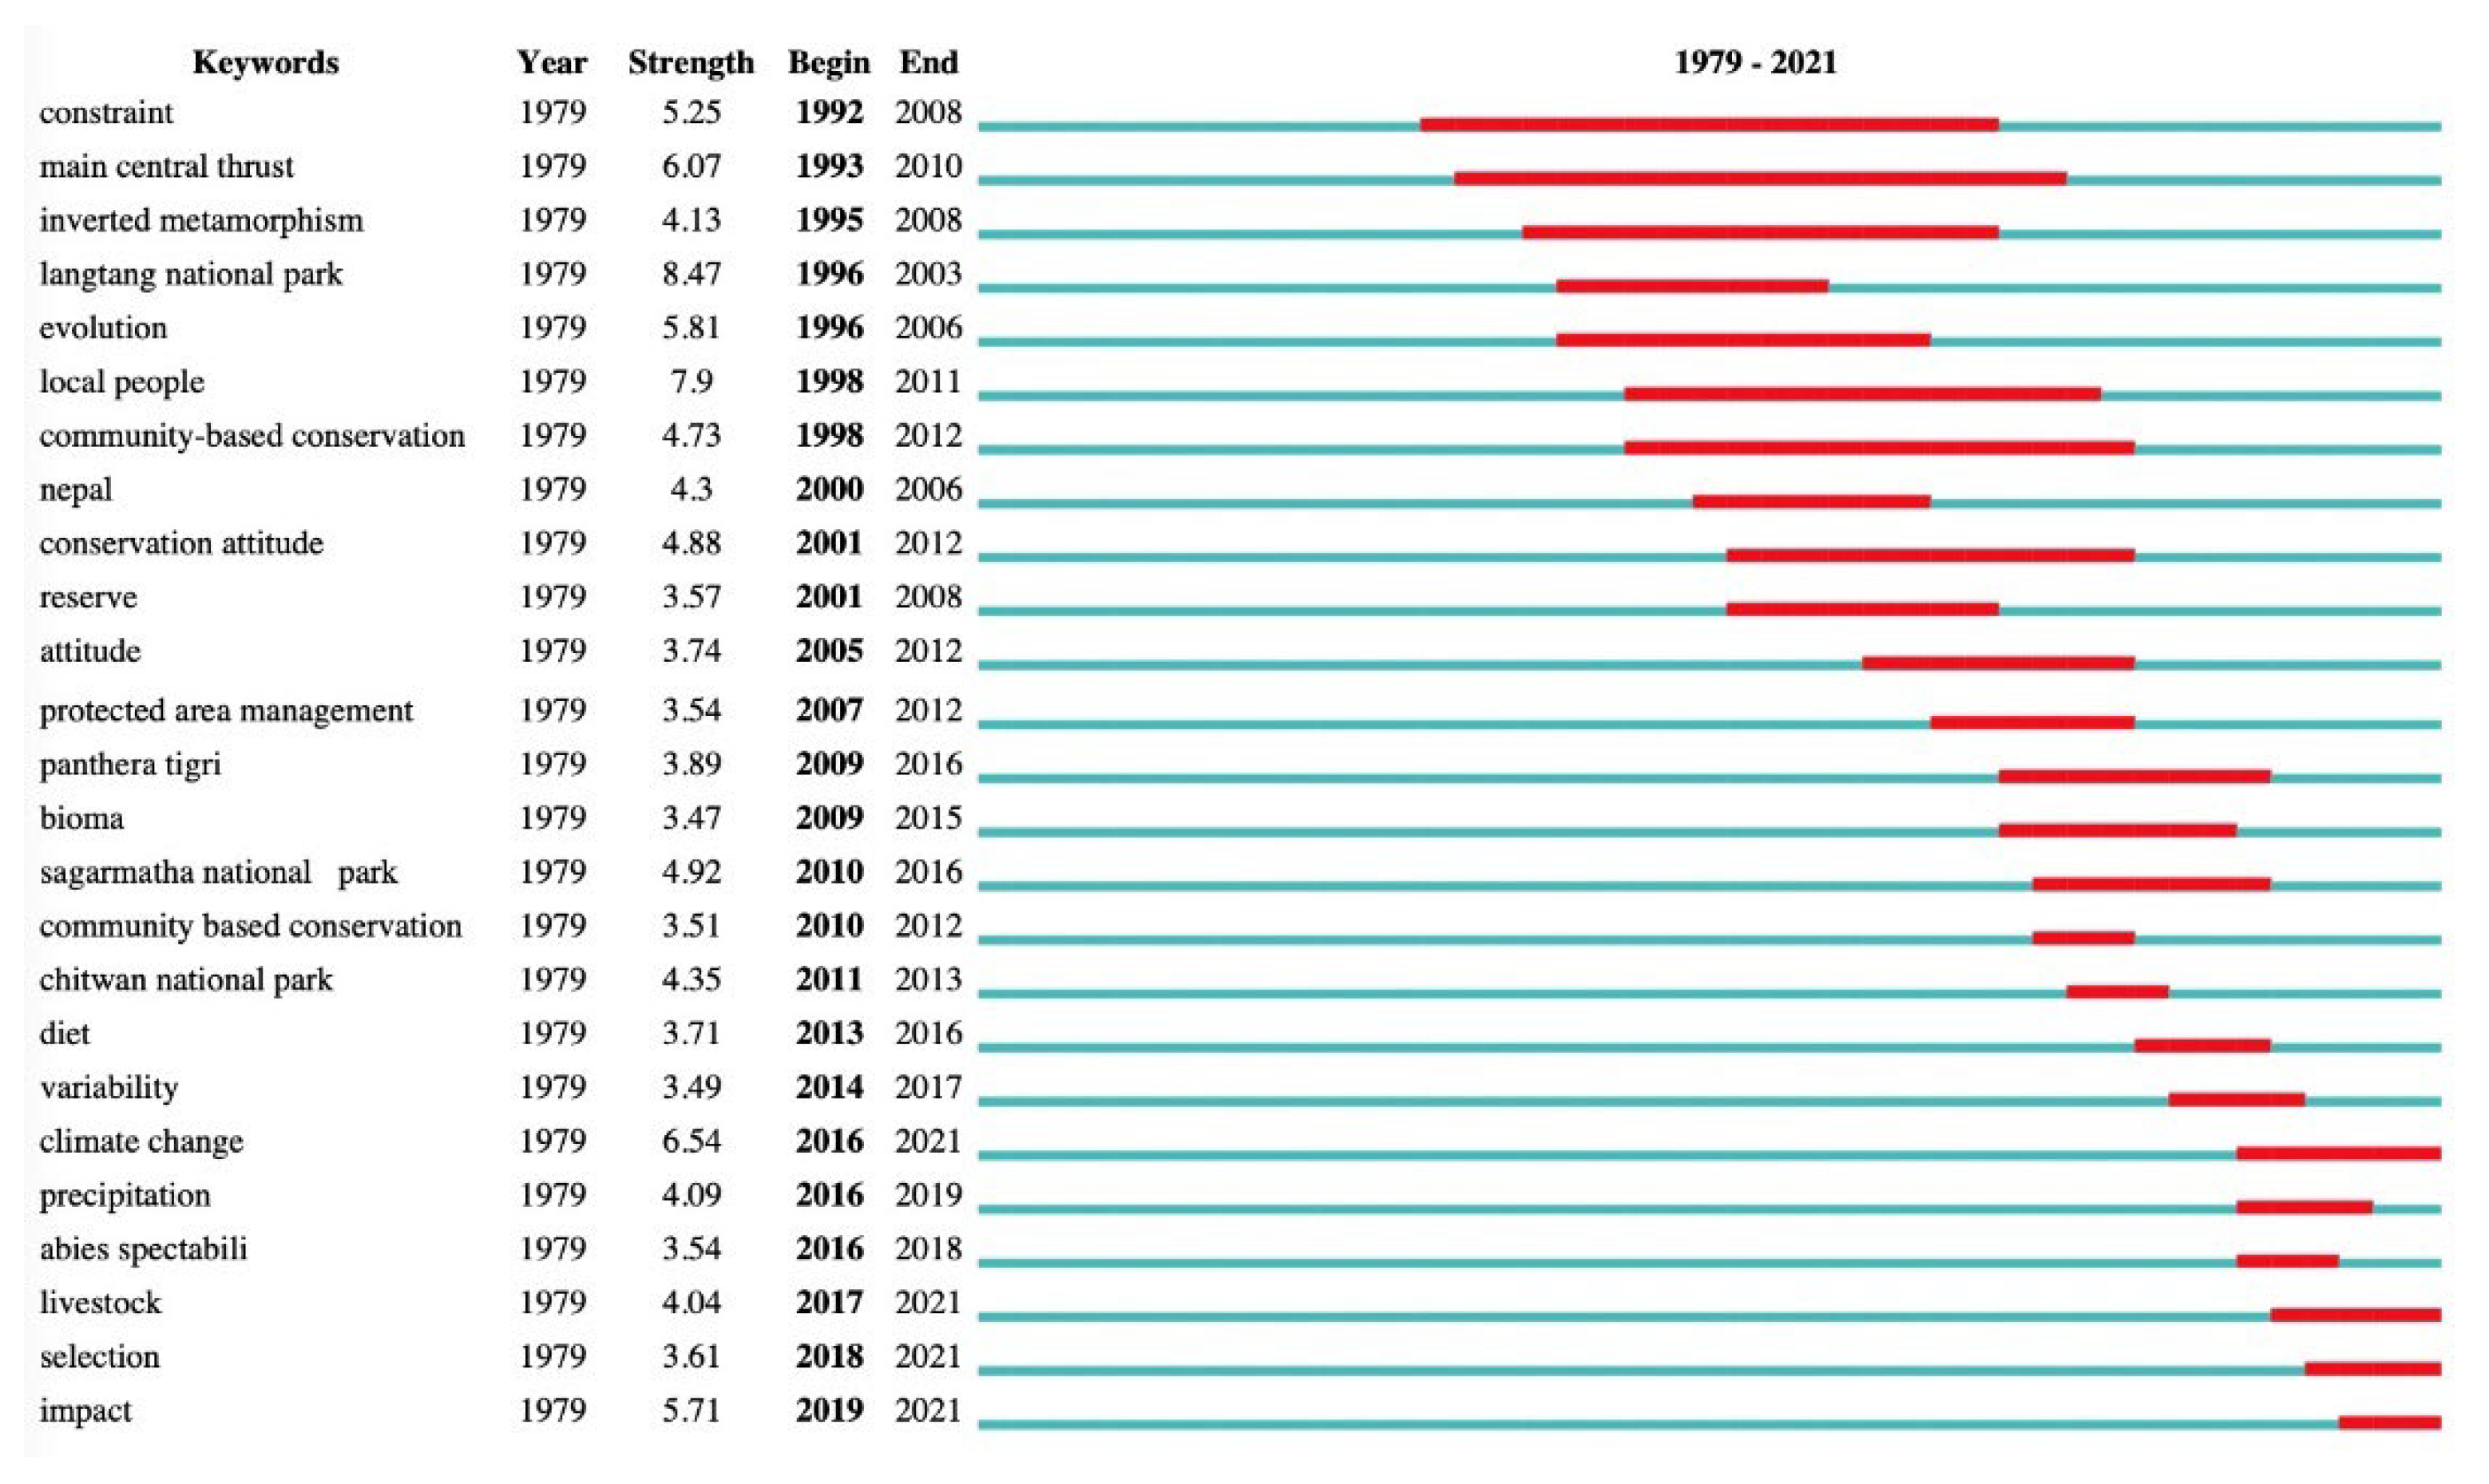
4.1. Research Trends Shifting

The multidisciplinary nature of research on PAs, as well as the numerous and complicated interrelationships between these fields, have made it difficult to identify its trends shifting pattern. We discovered buried information underpinning this major body of research.
The conservation strategy of protected areas is in a process of dynamic change. National policies and socio-economics are the drivers of these changes [65]. The emergence of new changes leads to changes in research hotspots accordingly. This trend of changes is also reflected in our study. In 1973, the Chitwan National Park (CNP) was established and the Nepalese conservation paradigm entered the “Yellowstone paradigm”, with strict management and a ban on people living in the park [65]. This phase was dominated by research focused on geology.
From the 1980s onward, the Nepalese government recognized the importance of a participatory conservation and development model. The government legislated in 1989 to define the approach, that is, to recognize the indispensable role of local people in the conservation process [65]. Our keyword burst analysis also reflects this trend. The burst of the keyword “community-based conservation” (Figure 8) from 1998 to 2012 marks the emergence of a great number of relevant studies. The large number of studies also provides a strong theoretical basis for Nepal to be a successful model of biodiversity conservation [94]. As the new conservation approach no longer completely excludes people from PAs, it has also led to some new thinking. For example, studies on people’s attitudes toward conservation, on the relationship between people and animals have been conducted.
The latest research trends are mainly related to climate change and its impacts, as Nepal is a country prone to climate change disasters [95], which is in accordance with the global concern regarding this topic.
It is important to note that we observed a lag in the changes in research hotspots relative to policy changes. This is because it takes time for policies to take effect and for research to progress. Based on this, we highly encourage research on future projections based on the previous research findings and changes in research hotspots. Research on PAs in Nepal is mostly conducted in traditional academic disciplines. However, with the impact of climate change and the resultant increase in natural disasters, studies from other research areas, such as remote sensing, meteorology, and atmospheric sciences, are thus expected to contribute much more [96].

4.2. Power Shifting and New Players

By using the WoS function “analyze results”, we found that Kenya and Austria were among the pioneers of studying Nepal’s Pas (Figure 14). Kenya contributed to animal research, with its first publication concerning the ivory trade in 1998 [97]. Austria started its studies on Nepal’s PAs with a publication in 1994 in Germany about the impact of tourism [98]. As new players, the Netherlands and Belgium have contributed mostly to studies on biodiversity conservation and ecology. Meanwhile, Poland is interested in the management of national parks, waste management, plants, and tourism.
Something interesting can be found in the density map of countries and regions (Figure 15). Besides the US and Nepal, another contributor to the research on PAs in Nepal is China. This is not unusual because China is naturally interested because of its neighboring location in Nepal. To a certain degree, these two countries are connected to one another ecologically. Other close neighbors of Nepal, such as Bhutan and Bangladesh, seem to be less active in this party. However, bordering on each other means that they are bound to have mutual benefits or losses. Transboundary PAs exist in Nepal. For example, the Sacred Himalayan Landscape (SHL) connects Nepal, India, and Bhutan. These PAs also play the role of ecological corridors for some iconic animals [65] between countries and regions. Hence, here we highly suggest that these neighboring countries and regions conduct joint research, which will bring more benefit to a larger regional, even international scale.

4.3. Uneven Research Interest and Homogenization of Research Methods about Each PA Type

Among the mapping results, we found that the keywords about people, animals, development, and conflict were the most prevalent research topics. The management policies at the early stage did not allow people to live in PAs, and people’s demand for natural resources created conflicts with the reserve [99]. The community-based conservation recognizes the indispensable role of local people in the conservation process and no longer completely prevents people from living and working in PAs. However, it increases the chances of encounters between people and wildlife, which can lead to conflicts. For example, in CNP alone, there were over 4000 wildlife-attack losses to humans, livestock, and property from 1998 to 2016 [100]. In other PAs around the world, human–animal conflict is also of widespread concern [101]. In addition, it is difficult to strike a perfect balance between conservation and development, for example, using tourism to promote the economy will inevitably bring some environmental pressure.
Figure 16 shows the top five keywords that appeared to fall into each category. The first two, “protected areas” and “national parks”, have received much more attention from researchers. One of the reasons that national parks have been accumulating more publications would be their longest history in Nepal’s conservation progress since the establishment of the first national park, Chitwan National Park [79], a sign of formal conservation in the country. Another reason may be the dominant number of parks (12 national parks), which is the most common type of PAs in the country (Figure 1). Being different from national parks, buffer zones, conservation areas, and wildlife reserves allow local people to use forest products in a sustainable way in Nepal [65]. Under such circumstances, the management goals and practical needs of local people often lead to “park–people conflicts” [102,103]. The buffer zone is thought to be a major conservative priority, but few studies have been conducted to test its effectiveness in Nepal [104]. Hence, more studies in these less-investigated areas should be conducted in the future.
Many studies related to “people”, such as perception and attitude studies, employ the research methods of questionnaire surveys or interviews. However, it is worth noting that even in different studies, repeated questions may evoke the “memory effect” leading to unreliable answers [105]. Therefore, more studies should be pursued, and new relevant topics and previously under-studied disciplines should be investigated.

4.4. Insufficient Attention to “Hunting Reserves”

The Dhorpatan Hunting Reserve (DHR; Figure 1) is the only hunting reserve in Nepal and is home to many mammalian species [101]. We did not analyze the keywords of “hunting reserves” because there were only 12 papers concerning this topic, which was not sufficient to generate a preferable map for reasonable analysis. However, this does not indicate that this hunting reserve deserves no academic attention. There are approximately 350–500 snow leopards (Uncia uncia) living in Nepal’s northern frontier, and their presence has been suggested in many PAs of Nepal, with DHR being one of them [106]. However, their survival is threatened by conflict with humans [107]. As a controlled hunting area, the DHR has the potential to contribute to the conservation of snow leopards. Many scholars have studied this endangered species in conservation areas, as suggested by the large node (Figure 12). However, little research has been conducted on snow leopards in the DHR. We suggest that special attention be paid to this issue. However, buffer zone communities depend on the revenue generated by the DHR. This avenue usually comes from the government’s sale of hunting permits, and DHR creates certain job opportunities [99]. Given the importance of DHR in terms of its social and ecological aspects, more relevant studies are needed.

4.5. Limitations of This Study

Proceedings were excluded from our study. However, papers in proceedings derived from international conferences usually contain hot topics. Book chapters were also excluded, but many important social science studies have been described. Here, we suggest that future studies consider an analysis that includes proceeding papers and book chapters. We did not perform thesaurus removal because of the large number of keywords analyzed in our study. This may cause some inaccuracies in the node size and links.

5. Conclusions

To draw a holistic and systematic picture of research on PAs in Nepal, we undertook an integrative study using bibliometric analysis. An increase in the number of papers indicates that the topic is growing and has attracted intense research interest. This research did not receive widespread attention in the early years. However, the exponential growth trend in the literature shows a high level of enthusiasm for research on this topic in Nepal. We identified the changing trend in this field from geological aspects in the early stage to the recent hotspots of climate change-related perspectives. There has been a shift of “research powers” in countries and regions. Kenya, Canada, Norway, Switzerland, and the US were among the earliest players. Nepal contributed the most in the middle stage. China also became interested in this period. Belgium and Poland contributed the latest publications.
We found that the research hotspots are changing with the shifting of conservation policies in Nepal. We suggest conducting more predictive studies on the future development of PAs. Currently, PAs research is mainly conducted in traditional disciplines, but with the impact of climate change and the consequent increase in its negative impacts, academic contributions from other study disciplines, such as remote sensing, meteorology, and atmospheric sciences, are expected to contribute much more. Research enthusiasm toward each keyword showed some imbalance with “protected areas” and “national parks”, attracting much more attention than others. Although there is currently only one hunting reserve, we suggest that more relevant studies should be conducted.

Supplementary Materials

The following are available online at https://www.mdpi.com/article/10.3390/land11071109/s1, Table S1: Detailed information of Nepal’s PAs.

Author Contributions

Conceptualization and methodology, L.C., T.W., H.X. and J.H.; validation, formal analysis, investigation, resources, data curation, and visualization, L.C. and T.W.; writing—original draft preparation, L.C.; writing—review and editing, L.C., T.W., H.X. and J.H.; supervision and project administration, T.W. All authors have read and agreed to the published version of the manuscript.

Funding

This work was supported by JSPS KAKENHI (Grant-in-Aid for Scientific Research), Grant Number JP21H04371 (T.W.).

Institutional Review Board Statement

Not applicable.

Informed Consent Statement

Not applicable.

Data Availability Statement

The data supporting the findings of this study are available from the corresponding author upon reasonable request.

Acknowledgments

We thank Sun Yujie, Atupelye Komba, Anushilan Acharya, and Mengyu for their kind assistance in collecting publications and suggestions.

Conflicts of Interest

The authors declare no conflict of interest.

Appendix A

Table A1. The journals with more than 10 publications.
RankingJournalsPublication Number
1Mountain Research And Development39
2Oryx31
3Environmental Conservation29
4Global Ecology And Conservation26
5Biological Conservation23
6Environmental Management22
7Ecology And Evolution19
8Plos One19
9Biodiversity And Conservation18
10Journal Of Environmental Management14
11Sustainability14
12Journal Of Mountain Science12
13International Journal Of Sustainable Development And World Ecology11
Table A2. The top 10 most cited articles.
RankTitle of PublicationsJournalsPublication YearCitation Count
1Tectonic evolution of the central Annapurna Range, Nepalese HimalayasTectonics1996423
2Neogene foreland basin deposits, erosional unroofing, and the kinematic history of the Himalayan fold-thrust belt, western NepalGeological Society of America Bulletin1998361
3Shisha Pangma leucogranite, south Tibetan Himalaya: Field relations, geochemistry, age, origin, and emplacementJournal of Geology1997332
4Isotopic constraints on the age and provenance of the Lesser and Greater Himalayan sequences, Nepalese HimalayaGeological Society of America Bulletin1996323
5Insights on linking forests, trees, and people from the air, on the ground, and in the laboratoryProceedings of the National Academy of Sciences of the United States of America2006319
6Decompression And Anatexis of Himalayan MetapelitesTectonics1994301
7Tectonometamorphic evolution of the Himalayan metamorphic core between the Annapurna and Dhaulagiri, central NepalJournal of Metamorphic Geology1996254
8Exhumation, crustal deformation, and thermal structure of the Nepal Himalaya derived from the inversion of thermochronological and thermobarometric data and modeling of the topographyJournal of Geophysical Research-solid Earth2010217
9P-T-t data from central Nepal support critical taper and repudiate large-scale channel flow of the Greater Himalayan SequenceGeological Society of America Bulletin2008213
10Local attitudes towards conservation and tourism around Komodo National Park, IndonesiaEnvironmental Conservation2001208

References

  1. Rodrigues, A.S.L.; Akçakaya, H.R.; Andelman, S.J.; Bakarr, M.I.; Boitani, L.; Brooks, T.M.; Chanson, J.S.; Fishpool, L.D.C.; da Fonseca, G.A.B.; Gaston, K.J.; et al. Global Gap Analysis: Priority Regions for Expanding the Global Protected-Area Network. BioScience 2004, 54, 1092–1100. [Google Scholar] [CrossRef]
  2. Chape, S.; Harrison, J.; Spalding, M.; Lysenko, I. Measuring the Extent and Effectiveness of Protected Areas as an Indicator for Meeting Global Biodiversity Targets. Philos. Trans. R. Soc. Lond. B Biol. Sci. 2005, 360, 443–455. [Google Scholar] [CrossRef] [Green Version]
  3. Loucks, C.; Ricketts, T.H.; Naidoo, R.; Lamoreux, J.; Hoekstra, J. Explaining the Global Pattern of Protected Area Coverage: Relative Importance of Vertebrate Biodiversity, Human Activities and Agricultural Suitability. J. Biogeogr. 2008, 35, 1337–1348. [Google Scholar] [CrossRef]
  4. Craigie, I.D.; Baillie, J.E.M.; Balmford, A.; Carbone, C.; Collen, B.; Green, R.E.; Hutton, J.M. Large Mammal Population Declines in Africa’s Protected Areas. Biol. Conserv. 2010, 143, 2221–2228. [Google Scholar] [CrossRef]
  5. UN. UNEP-WCMC State of the World’s Protected Areas: An Annual Review of Global Conservation Progress; UN: Cambridge, UK, 2008. [Google Scholar]
  6. Dudley, N. Guidelines for Applying Protected Area Management Categories; IUCN: Gland, Switzerland, 2008; ISBN 9782831710860. [Google Scholar]
  7. Watson, J.E.M.; Dudley, N.; Segan, D.B.; Hockings, M. The Performance and Potential of Protected Areas. Nature 2014, 515, 67–73. [Google Scholar] [CrossRef] [PubMed]
  8. WDPA February 2021 Update for the WDPA. Available online: https://livereport.protectedplanet.net/chapter-2 (accessed on 13 February 2021).
  9. Naughton-Treves, L.; Holland, M.B.; Brandon, K. The Role of Protected Areas in Conserving Biodiversity and Sustaining Local Livelihoos. Ann. Rev. Environ. Res. 2005, 17, 219–252. [Google Scholar] [CrossRef] [Green Version]
  10. Adhikari, S.; Southworth, J. Simulating Forest Cover Changes of Bannerghatta National Park Based on a CA-Markov Model: A Remote Sensing Approach. Remote Sens. 2012, 4, 3215–3243. [Google Scholar] [CrossRef] [Green Version]
  11. Watson, J.E.M.; Venter, O.; Lee, J.; Jones, K.R.; Robinson, J.G.; Possingham, H.P.; Allan, J.R. Protect the Last of the Wild. Nature 2018, 563, 27–30. [Google Scholar] [CrossRef]
  12. Venter, O.; Fuller, R.A.; Segan, D.B.; Carwardine, J.; Brooks, T.; Butchart, S.H.M.; Di Marco, M.; Iwamura, T.; Joseph, L.; O’Grady, D.; et al. Targeting Global Protected Area Expansion for Imperiled Biodiversity. PLoS Biol. 2014, 12, e1001891. [Google Scholar] [CrossRef] [Green Version]
  13. Pouzols, F.M.; Toivonen, T.; di Minin, E.; Kukkala, A.S.; Kullberg, P.; Kuustera, J.; Lehtomaki, J.; Tenkanen, H.; Verburg, P.H.; Moilanen, A. Global Protected Area Expansion Is Compromised by Projected Land-Use and Parochialism. Nature 2014, 516, 383–386. [Google Scholar] [CrossRef] [Green Version]
  14. Joppa, L.N.; Pfaff, A. High and Far: Biases in the Location of Protected Areas. PLoS ONE 2009, 4, e8273. [Google Scholar] [CrossRef] [PubMed]
  15. Geldmann, J.; Coad, L.; Barnes, M.D.; Craigie, I.D.; Woodley, S.; Balmford, A.; Brooks, T.M.; Hockings, M.; Knights, K.; Mascia, M.B.; et al. A Global Analysis of Management Capacity and Ecological Outcomes in Terrestrial Protected Areas. Conserv. Lett. 2018, 11, 1–10. [Google Scholar] [CrossRef]
  16. Hockings, M.; Stolton, S.; Leverington, F. Evaluating Effectiveness: A Framework for Assessing Management Effectiveness of Protected Areas, 2nd ed.; IUCN: Gland, Switzerland, 2006. [Google Scholar]
  17. Soliku, O.; Schraml, U. Making Sense of Protected Area Conflicts and Management Approaches: A Review of Causes, Contexts and Conflict Management Strategies. Biol. Conserv. 2018, 222, 136–145. [Google Scholar] [CrossRef]
  18. Redpath, S.M.; Young, J.; Evely, A.; Adams, W.M.; Sutherland, W.J.; Whitehouse, A.; Amar, A.; Lambert, R.A.; Linnell, J.D.C.; Watt, A.; et al. Understanding and Managing Conservation Conflicts. Trends Ecol. Evolut. 2013, 28, 100–109. [Google Scholar] [CrossRef] [PubMed]
  19. Vedeld, P.; Jumane, A.; Wapalila, G.; Songorwa, A. Protected Areas, Poverty and Conflicts. A Livelihood Case Study of Mikumi National Park, Tanzania. For. Policy Econ. 2012, 21, 20–31. [Google Scholar] [CrossRef]
  20. Abel, N.; Blaikie, P. Elephants, People, Parks and Development: The Case of the Luangwa Valley, Zambia. Environ. Manag. 1986, 10, 735–751. [Google Scholar] [CrossRef]
  21. De Matos Dias, D.; Ferreguetti, Á.C.; Rodrigues, F.H.G. Using an Occupancy Approach to Identify Poaching Hotspots in Protected Areas in a Seasonally Dry Tropical Forest. Biol. Conserv. 2020, 251, 108796. [Google Scholar] [CrossRef]
  22. Moore, J.F.; Mulindahabi, F.; Masozera, M.K.; Nichols, J.D.; Hines, J.E.; Turikunkiko, E.; Oli, M.K. Are Ranger Patrols Effective in Reducing Poaching-Related Threats within Protected Areas? J. Appl. Ecol. 2018, 55, 99–107. [Google Scholar] [CrossRef]
  23. Ghoddousi, A.; Soofi, M.; Hamidi, A.K.; Ashayeri, S.; Egli, L.; Ghoddousi, S.; Speicher, J.; Khorozyan, I.; Kiabi, B.H.; Waltert, M. The Decline of Ungulate Populations in Iranian Protected Areas Calls for Urgent Action against Poaching. Oryx 2019, 53, 151–158. [Google Scholar] [CrossRef]
  24. Cooney, R.; Roe, D.; Dublin, H.; Phelps, J.; Wilkie, D.; Keane, A.; Travers, H.; Skinner, D.; Challender, D.W.S.; Allan, J.R.; et al. From Poachers to Protectors: Engaging Local Communities in Solutions to Illegal Wildlife Trade. Conserv. Lett. 2017, 10, 367–374. [Google Scholar] [CrossRef]
  25. Brancalion, P.H.S.; De Almeida, D.R.A.; Vidal, E.; Molin, P.G.; Sontag, V.E.; Souza, S.E.X.F.; Schulze, M.D. Fake Legal Logging in the Brazilian Amazon. Sci. Adv. 2018, 4, 8. [Google Scholar] [CrossRef] [PubMed] [Green Version]
  26. Müller, J.; Noss, R.F.; Thorn, S.; Bässler, C.; Leverkus, A.B.; Lindenmayer, D. Increasing Disturbance Demands New Policies to Conserve Intact Forest. Conserv. Lett. 2019, 12, e12449. [Google Scholar] [CrossRef] [Green Version]
  27. Abman, R. Rule of Law and Avoided Deforestation from Protected Areas. Ecol. Econ. 2018, 146, 282–289. [Google Scholar] [CrossRef]
  28. Hulme, P.E.; Pyšek, P.; Pergl, J.; Jarošík, V.; Schaffner, U.; Vilà, M. Greater Focus Needed on Alien Plant Impacts in Protected Areas. Conserv. Lett. 2014, 7, 459–466. [Google Scholar] [CrossRef] [Green Version]
  29. Allen, J.A.; Brown, C.S.; Stohlgren, T.J. Non-Native Plant Invasions of United States National Parks. Biol. Invas. 2009, 11, 2195–2207. [Google Scholar] [CrossRef]
  30. Foxcroft, L.C.; Spear, D.; van Wilgen, N.J.; McGeoch, M.A. Assessing the Association between Pathways of Alien Plant Invaders and Their Impacts in Protected Areas. NeoBiota 2019, 43, 1–25. [Google Scholar] [CrossRef] [Green Version]
  31. Meyer, C.G. The Impacts of Spear and Other Recreational Fishers on a Small Permanent Marine Protected Area and Adjacent Pulse Fished Area. Fish. Res. 2007, 84, 301–307. [Google Scholar] [CrossRef]
  32. Environmental Impacts of Tourism on the Australian Alps Protected Areas. Available online: https://bioone.org/journals/mountain-research-and-development/volume-23/issue-3/0276-4741_2003_023_0247_EIOTOT_2.0.CO_2/Environmental-Impacts-of-Tourism-on-the-Australian-Alps-Protected-Areas/10.1659/0276-4741(2003)023[0247:EIOTOT]2.0.CO;2.full (accessed on 1 April 2022).
  33. Guetté, A.; Godet, L.; Juigner, M.; Robin, M. Worldwide Increase in Artificial Light at Night around Protected Areas and within Biodiversity Hotspots. Biol. Conserv. 2018, 223, 97–103. [Google Scholar] [CrossRef]
  34. Jones, K.R.; Venter, O.; Fuller, R.A.; Allan, J.R.; Maxwell, S.L.; Negret, P.J.; Watson, J.E.M. One-Third of Global Protected Land Is under Intense Human Pressure. Science 2018, 360, 788–791. [Google Scholar] [CrossRef] [Green Version]
  35. Geldmann, J.; Joppa, L.N.; Burgess, N.D. Mapping Change in Human Pressure Globally on Land and within Protected Areas. Conserv. Biol. J. Soc. Conserv. Biol. 2014, 28, 1604–1616. [Google Scholar] [CrossRef]
  36. Watson, F.G.R.; Becker, M.S.; Milanzi, J.; Nyirenda, M. Human Encroachment into Protected Area Networks in Zambia: Implications for Large Carnivore Conservation. Reg. Environ. Change 2014, 15, 415–429. [Google Scholar] [CrossRef]
  37. Laurance, W.F. Does Research Help to Safeguard Protected Areas? Trends Ecol. Evolut. 2013, 28, 261–266. [Google Scholar] [CrossRef] [PubMed]
  38. Geldmann, J.; Manica, A.; Burgess, N.D.; Coad, L.; Balmford, A. A Global-Level Assessment of the Effectiveness of Protected Areas at Resisting Anthropogenic Pressures. Proc. Natl. Acad. Sci. USA 2019, 116, 23209–23215. [Google Scholar] [CrossRef]
  39. Kozlowski, J.; Vass-Bowen, N. Buffering External Threats to Heritage Conservation Areas: A Planner’s Perspective. Landsc. Urban Plan. 1997, 37, 245–267. [Google Scholar] [CrossRef]
  40. Palomo, I.; Martín-López, B.; Potschin, M.; Haines-Young, R.; Montes, C. National Parks, Buffer Zones and Surrounding Lands: Mapping Ecosystem Service Flows. Ecosyst. Serv. 2013, 4, 104–116. [Google Scholar] [CrossRef]
  41. Sharma, U.R. An Overview of Park-People Interactions in Royal Chitwan National Park, Nepal. Landsc. Urban Plan. 1990, 19, 133–144. [Google Scholar] [CrossRef]
  42. Weladji, R.B.; Moe, S.R.; Vedeld, P. Stakeholder Attitudes towards Wildlife Policy and the Bénoué Wildlife Conservation Area, North Cameroon. Environ. Conserv. 2003, 30, 334–343. [Google Scholar] [CrossRef]
  43. Albers, H.J. Spatial Modeling of Extraction and Enforcement in Developing Country Protected Areas. Resour. Energy Econ. 2010, 32, 165–179. [Google Scholar] [CrossRef]
  44. Bajracharya, B.; Uddin, K.; Chettri, N.; Shrestha, B.; Siddiqui, S.A. Understanding Land Cover Change Using a Harmonized Classification System in the Himalaya. Mountain Res. Dev. 2010, 30, 143–156. [Google Scholar] [CrossRef]
  45. Abdullah, J.; Ahmad, C.B.; Jaafar, J.; Sa’ad, S.R.M. Stakeholders’ Perspectives of Criteria for Delineation of Buffer Zone at Conservation Reserve: FRIM Heritage Site. Proc. Soc. Behav. Sci. 2013, 105, 610–618. [Google Scholar] [CrossRef] [Green Version]
  46. Du, W.; Penabaz-Wiley, S.M.; Njeru, A.M.; Kinoshita, I. Models and Approaches for Integrating Protected Areas with Their Surroundings: A Review of the Literature. Sustainability 2015, 7, 8151–8177. [Google Scholar] [CrossRef] [Green Version]
  47. Secretariat of the Convention on Biological Diversity. CBD Protected Areas in Today’s World: Their Values and Benefits for the Welfare of the Planet; Secretariat of the Convention on Biological Diversity: Montreal, QC, Canada, 2008.
  48. Ervin, J.; Sekhran, N.; Dinu, A.; Gidda, S.; Vergeichik, M.; Mee, J. Protected Areas for the 21st Century: Lessons from UNDP/GEF’s Portfolio; UNDP: New York, NY, USA, 2010. [Google Scholar]
  49. DeFries, R.; Karanth, K.K.; Pareeth, S. Interactions between Protected Areas and Their Surroundings in Human-Dominated Tropical Landscapes. Biol. Conserv. 2010, 143, 2870–2880. [Google Scholar] [CrossRef]
  50. Nepal, S.K. Mountain Ecotourism and Sustainable Development: Ecology, Economics, and Ethics. Mt. Res. Dev. 2002, 22, 104–109. [Google Scholar] [CrossRef] [Green Version]
  51. Hamilton, A.; Cunningham, A.; Byarugaba, D.; Kayanja, F. Conservation in a Region of Political Instability: Bwindi Impenetrable Forest, Uganda. Conserv. Biol. 2000, 14, 1722–1725. [Google Scholar] [CrossRef] [PubMed]
  52. Bowles, I.; Rosenfeld, A.B.; Sugal, C.A.; Mittermeier, R.A. Natural Resource Extraction in the Latin American Tropics; National Geographic: Washington, DC, USA, 1998. [Google Scholar]
  53. Khudzari, J.; Kurian, J.; Tartakovsky, B.; Raghavan, G.S.V. Bibliometric Analysis of Global Research Trends on Microbial Fuel Cells Using Scopus Database. Biochem. Eng. J. 2018, 136, 51–60. [Google Scholar] [CrossRef]
  54. Zou, X.; Yue, W.L.; Vu, H. Le Visualization and Analysis of Mapping Knowledge Domain of Road Safety Studies. Accid. Anal. Prev. 2018, 118, 131–145. [Google Scholar] [CrossRef] [PubMed]
  55. Chen, D.; Liu, Z.; Luo, Z.; Webber, M.; Chen, J. Bibliometric and Visualized Analysis of Emergy Research. Ecol. Eng. 2016, 90, 285–293. [Google Scholar] [CrossRef]
  56. Geng, Y.; Chen, W.; Liu, Z.; Chiu, A.S.F.; Han, W.; Liu, Z.; Zhong, S.; Qian, Y.; You, W.; Cui, X. A Bibliometric Review: Energy Consumption and Greenhouse Gas Emissions in the Residential Sector. J. Clean. Prod. 2017, 159, 301–316. [Google Scholar] [CrossRef]
  57. Kandel, P.; Chettri, N.; Chaudhary, S.; Sharma, P.; Uddin, K. Ecosystem Services Research Trends in the Water Tower of Asia: A Bibliometric Analysis from the Hindu Kush Himalaya. Ecol. Indic. 2021, 121, 107152. [Google Scholar] [CrossRef]
  58. Fang, Y.; Yin, J.; Wu, B. Climate Change and Tourism: A Scientometric Analysis Using CiteSpace. J. Sustain. Tour. 2018, 26, 108–126. [Google Scholar] [CrossRef]
  59. Chen, C.; Dubin, R.; Kim, M.C. Emerging Trends and New Developments in Regenerative Medicine: A Scientometric Update (2000–2014). Exp. Opin. Biol. Ther. 2014, 14, 1295–1317. [Google Scholar] [CrossRef] [PubMed] [Green Version]
  60. United Nations. UN List of Least Developed Countries; UNCTAD: Geneva, Switzerland, 2017; Volume 5, pp. 8–11. [Google Scholar]
  61. Vaidya, A.; Mayer, A.L. Critical Review of the Millennium Project in Nepal. Sustainability 2016, 8, 1043. [Google Scholar] [CrossRef] [Green Version]
  62. Rotich, D. Concept of Zoning Management in Protected Areas. Sage J. 2012, 2, 173–183. [Google Scholar]
  63. WWF. The Greater One-Horned Rhinoceros Conservation Action Plan for Nepal (2006–2011); WWF: Washington, DC, USA, 2006. [Google Scholar]
  64. Aryal, K.; Dhungana, R.; Silwal, T. Understanding Policy Arrangement for Wildlife Conservation in Protected Areas of Nepal. Hum. Dimens. Wildlife 2021, 26, 1–12. [Google Scholar] [CrossRef]
  65. Bhattarai, B.R.; Wright, W.; Poudel, B.S.; Aryal, A.; Yadav, B.P.; Wagle, R. Shifting Paradigms for Nepal’s Protected Areas: History, Challenges and Relationships. J. Mt. Sci. 2017, 14, 964–979. [Google Scholar] [CrossRef]
  66. Heinen, J.T.; Kattel, B. Parks, People, and Conservation: A Review of Management Issues in Nepal’s Protected Areas. Popul. Environ. 1992, 14, 49–84. [Google Scholar] [CrossRef] [Green Version]
  67. Dhruba Bijaya, G.C.; Cheng, S.; Xu, Z.; Bhandari, J.; Wang, L.; Liu, X. Community Forestry and Livelihood in Nepal: A Review. J. Anim. Plant Sci. 2016, 26, 1–12. [Google Scholar]
  68. Regmi, K.D.; Walter, P. Modernisation Theory, Ecotourism Policy, and Sustainable Development for Poor Countries of the Global South: Perspectives from Nepal. Int. J. Sustain. Dev. World Ecol. 2017, 24, 1–14. [Google Scholar] [CrossRef]
  69. Heinen, J.T.; Yonzon, P.B. A Review of Conservation Issues and Programs in Nepal: From a Single Species Focus toward Biodiversity Protection. Mt. Res. Dev. 1994, 14, 61–76. [Google Scholar] [CrossRef]
  70. Sharma, P.; Chettri, N.; Wangchuk, K. Human–Wildlife Conflict in the Roof of the World: Understanding Multidimensional Perspectives through a Systematic Review. Ecol. Evolut. 2021, 11, 11569–11586. [Google Scholar] [CrossRef]
  71. Rana, S.K.; Rawal, R.S.; Dangwal, B.; Bhatt, I.D.; Price, T.D. 200 Years of Research on Himalayan Biodiversity: Trends, Gaps, and Policy Implications. Front. Ecol. Evolut. 2021, 8, 1–9. [Google Scholar] [CrossRef]
  72. Lamsal, P.; Kumar, L.; Atreya, K.; Pant, K.P. Vulnerability and Impacts of Climate Change on Forest and Freshwater Wetland Ecosystems in Nepal: A Review. Ambio 2017, 46, 915–930. [Google Scholar] [CrossRef] [PubMed]
  73. Zhong, L.; Yang, R.; Zhao, Z. Critical Review of English Literature for National Parks Based on Bibliometric Analysis. Chin. Landsc. Archit. 2018, 07, 23–28. [Google Scholar]
  74. Explore the World’s Protected Areas. Available online: https://www.protectedplanet.net/country/NPL (accessed on 15 December 2021).
  75. The World Bank Group World Development Indicators. Available online: https://databank.worldbank.org/source/world-development-indicators (accessed on 29 May 2022).
  76. DNPWC, Government of Nepal Ministry of Forests and Environment. Available online: https://dnpwc.gov.np/en/ (accessed on 15 November 2021).
  77. Den Braber, B.; Evans, K.L.; Oldekop, J.A. Impact of Protected Areas on Poverty, Extreme Poverty, and Inequality in Nepal. Conserv. Lett. 2018, 11, 1–9. [Google Scholar] [CrossRef]
  78. Nepal, S.K. Tourism in protected areas: The Nepalese Himalaya. Ann. Tour. Res. 2000, 27, 661–681. [Google Scholar] [CrossRef]
  79. Shrestha, U.B.; Shrestha, S.; Chaudhary, P.; Chaudhary, R.P. How Representative Is the Protected Areas System of Nepal? Mt. Res. Dev. 2010, 30, 282–294. [Google Scholar] [CrossRef]
  80. Rey-Martí, A.; Ribeiro-Soriano, D.; Palacios-Marqués, D. A Bibliometric Analysis of Social Entrepreneurship. J. Bus. Res. 2016, 69, 1651–1655. [Google Scholar] [CrossRef]
  81. Albort-Morant, G.; Ribeiro-Soriano, D. A Bibliometric Analysis of International Impact of Business Incubators. J. Bus. Res. 2016, 69, 1775–1779. [Google Scholar] [CrossRef]
  82. Gaviria-Marin, M.; Merigó, J.M.; Baier-Fuentes, H. Knowledge Management: A Global Examination Based on Bibliometric Analysis. Technol. Forecast. Soc. Chang. 2019, 140, 194–220. [Google Scholar] [CrossRef]
  83. Jian, F.; Jingda, D. Comparison of Visualization Principles between Citespace and VOSviewer. J. Libr. Inform. Sci. Agric. 2019, 31, 31–37. [Google Scholar]
  84. Aguillo, I.F. Is Google Scholar useful for bibliometrics? A webometric analysis. Scientometrics 2012, 91, 343–351. [Google Scholar] [CrossRef]
  85. Ding, X.; Yang, Z. Knowledge Mapping of Platform Research: A Visual Analysis Using VOSviewer and CiteSpace. Electron. Commerce Res. 2020, 1–23. [Google Scholar] [CrossRef]
  86. Thelwall, M. Bibliometrics to Webometrics. J. Inform. Sci. 2008, 34, 605–621. [Google Scholar] [CrossRef]
  87. Merigó, J.M.; Yang, J.B. A Bibliometric Analysis of Operations Research and Management Science. Omega 2017, 73, 37–48. [Google Scholar] [CrossRef] [Green Version]
  88. Carvalho, M.M.; Fleury, A.; Lopes, A.P. An Overview of the Literature on Technology Roadmapping (TRM): Contributions and Trends. Technol. Forecast. Soc. Chang. 2013, 80, 1418–1437. [Google Scholar] [CrossRef]
  89. Antonio-Rafael, R.-R.; José, R.-N. Changes in the Intellectual Structure of Strategic Management Research: A Bibliometric Study of the Strategic Management Journal. Strategic Manag. J. 2001, 25, 981–1004. [Google Scholar] [CrossRef]
  90. Cornelius, B.; Landström, H.; Persson, O. Guidelines for Using Bibliometrics at the Swedish Research Council. 2015. Available online: https://www.vr.se/download/18.514d156f1639984ae0789dc2/1529480565499/Guidelines+for+using+bibliometrics+at+the+Swedish+Research+Council.pdf (accessed on 21 May 2022).
  91. Xiang, C.; Wang, Y.; Liu, H. A Scientometrics Review on Nonpoint Source Pollution Research. Ecol. Eng. 2017, 99, 400–408. [Google Scholar] [CrossRef]
  92. Medina-Mijangos, R.; Seguí-Amórtegui, L. Research Trends in the Economic Analysis of Municipal Solid Waste Management Systems: A Bibliometric Analysis from 1980 to 2019. Sustainability 2020, 12, 8509. [Google Scholar] [CrossRef]
  93. Hoppen, N.H.F.; Vanz, S.A.d.S. Neurosciences in Brazil: A Bibliometric Study of Main Characteristics, Collaboration and Citations. Scientometrics 2016, 109, 121–141. [Google Scholar] [CrossRef]
  94. Heinen, J.T.; Shrestha, S.K. Evolving policies for conservation: An Historical Profile of the Protected Area System of Nepal. J. Environ. Plan. Manag. 2006, 49, 41–58. [Google Scholar] [CrossRef]
  95. Ojha, H.R.; Ghimire, S.; Pain, A.; Nightingale, A.; Khatri, D.B.; Dhungana, H. Policy without politics: Technocratic control of climate change adaptation policy making in Nepal. Clim. Policy 2016, 16, 415–433. [Google Scholar] [CrossRef] [Green Version]
  96. Wang, Y.; Lu, Z.; Sheng, Y.; Zhou, Y. Remote Sensing Applications in Monitoring of Protected Areas. Remote Sens. 2020, 12, 1370. [Google Scholar] [CrossRef]
  97. Martin, E.B. Ivory in Kathmandu. Oryx 1998, 32, 317–320. [Google Scholar] [CrossRef]
  98. Fisscher, W.; Sulzer, W. Economical and Ecological Effects of Tourism in Langtang National-Park (Nepal). Mitt. Osterr. Geogr. Ges. 1994, 136, 225–242. [Google Scholar]
  99. Thapa Karki, S. Do Protected Areas and Conservation Incentives Contribute to Sustainable Livelihoods? A Case Study of Bardia National Park, Nepal. J. Environ. Manag. 2013, 128, 988–999. [Google Scholar] [CrossRef]
  100. Lamichhane, B.R.; Persoon, G.A.; Leirs, H.; Poudel, S.; Subedi, N.; Pokheral, C.P.; Bhattarai, S.; Thapaliya, B.P.; de Iongh, H.H. Spatio-temporal patterns of attacks on human and economic losses from wildlife in Chitwan National Park, Nepal. PLoS ONE 2018, 13, e0195373. [Google Scholar] [CrossRef] [Green Version]
  101. Tessema, M.E.; Lilieholm, R.J.; Ashenafi, Z.T.; Leader-Williams, N. Community attitudes toward wildlife and protected areas in Ethiopia. Soc. Nat. Resour. 2010, 23, 489–506. [Google Scholar] [CrossRef] [Green Version]
  102. Sunam, R.K.; Bishwokarma, D.; Darjee, K.B. Conservation Policy Making in Nepal: Problematising the Politics of Civic Resistance. Conserv. Soc. 2015, 13, 179–188. [Google Scholar] [CrossRef]
  103. Karanth, K.K.; Nepal, S.K. Local residents perception of benefits and losses from protected areas in India and Nepal. Environ. Manag. 2012, 49, 372–386. [Google Scholar] [CrossRef]
  104. Martino, D. Buffer zones around protected areas: A brief literature review. Electron. Green J. 2001, 1. [Google Scholar] [CrossRef]
  105. Schwarz, H.; Revilla, M.; Weber, W. Memory Effects in Repeated Survey Questions Reviving the Empirical Investigation assumption of the Independent Measurements Assumption. Survey Res. Methods 2020, 14, 325–344. [Google Scholar]
  106. WWF. Available online: https://www.wwfnepal.org/what_we_do/wildlife/snow_leopard/ (accessed on 25 April 2022).
  107. DNPWC. Department of National Parks and Wildlife Reserve, Ministry of Forests and Soil Conservation; Annual Report; DNPWC: Kathmandu, Nepal, 2012.
Figure 1. Nepal’s PAs [76].
Land 11 01109 g001
Figure 2. Publication counts and cumulative counts over years.
Land 11 01109 g002
Figure 3. Research categories.
Land 11 01109 g003
Figure 4. Journals citation correlation.
Land 11 01109 g004
Figure 5. Countries and regions.
Land 11 01109 g005
Figure 6. Map of “Research Institutions”.
Land 11 01109 g006
Figure 7. Mapping of “All Keywords”.
Land 11 01109 g007
Figure 8. Citation burst detection.
Land 11 01109 g008
Figure 9. Mapping of “Protected Areas”.
Land 11 01109 g009
Figure 10. Mapping of “National Parks”.
Land 11 01109 g010
Figure 11. Mapping of “Buffer Zones”.
Land 11 01109 g011
Figure 12. Mapping of “Conservation Areas”.
Land 11 01109 g012
Figure 13. Mapping of “Wildlife Reserves”.
Land 11 01109 g013
Figure 14. Overlay map of countries and regions.
Land 11 01109 g014
Figure 15. Density map of countries and regions.
Land 11 01109 g015
Figure 16. Comparison of top five keywords under each topic.
Land 11 01109 g016
Table 1. A summary of searching criteria.
Data SourceWeb of Science Core Collection
Citation indexesSCI-EXPANDED; SSCI; AHCI; ESCI
Date range1 January 1900–31 December 2021
Keywords“Nepal protected areas OR Nepal national parks OR Nepal wildlife reserves OR Nepal buffer zones OR Nepal Hunting reserves”
Document types“Articles”
Language“English”
Sample size864
Table 2. Counts of keywords.
KeywordsCounts%
All864100.0
National Park62271.9
Protected area32737.8
Wildlife reserve687.8
Conservation area17119.8
Buffer zone11813.7
Hunting reserve121.39
Table 3. Descriptive results.
CriteriaQuantity
Publications864
Research categories73
Authors2057
Journals315
Institutions1026
Countries and regions64
Cited references13,014
Table 4. Statistical analysis of counts and years.
YearCount
YearPearson Correlation10.893 **
Sig. (2-tailed) 0.000
N3838
CountPearson Correlation0.893 **1
Sig. (2-tailed)0.000
N3838
** Correlation is significant at the 0.01 level (2-tailed).
Publisher’s Note: MDPI stays neutral with regard to jurisdictional claims in published maps and institutional affiliations.

