Article

The Effect of Innovation City Construction on Carbon Emissions in China

1
School of Economics, Zhejiang University of Finance and Economics, Hangzhou 310018, China
2
School of Economics and Business Administration, Central China Normal University, Wuhan 430079, China
3
School of Mathematics and Statistics, Central China Normal University, Wuhan 430079, China
*
Author to whom correspondence should be addressed.
These authors contributed equally to this work.
Land 2022, 11(7), 1099; https://doi.org/10.3390/land11071099
Submission received: 18 June 2022 / Revised: 11 July 2022 / Accepted: 15 July 2022 / Published: 18 July 2022

Abstract

:
Innovation, as a driving force to economic growth, has been referred to as an important development strategy by the central government of China. In order to improve the innovative capability of cities, Chinese officials started to construct innovation cities in 2008. Previous studies have investigated the ecological and economic effects of innovation city construction; however, the environmental effect of the project remains unclear. In this study, we constructed an annual panel of 285 cities in China, from 2007 to 2015, to assess the effect of innovation city construction on carbon emissions. Our baseline results are obtained from a difference-in-differences estimator, comparing cities with and without introducing innovation city construction, whose results show that innovation city construction reduces carbon emissions by about 2% on average. We found a similar effect of innovation city construction on carbon emissions when we controlled for the estimated propensity of a city to launch the innovation city construction based on a series of urban characteristics, such as gross regional product and population. We obtained comparable estimates when we used the propensity score as weights to balance urban characteristics between cities with and without launching the innovation city construction. Our results also show that innovation city construction has a larger effect on carbon emissions in western, poorer, and fewer population cities than in those with opposite characteristics. We found suggested the persistence of the effect that innovation city construction had on carbon emissions, implying that the Chinese government should encourage innovation to reduce carbon emissions. Besides, we performed a series of robustness tests, including the leave-one-city-out test, the bootstrapping test, and the permutation test, to illustrate the robustness of our results.

1. Introduction

Global warming, climate change, and extreme weather have attracted worldwide attention [1,2,3,4,5]. There exists wide agreement in the scientific community that carbon emissions have a major responsibility for these unexpected events [6,7,8,9,10]. Policymakers around the world are positively searching for a desired solution to abate carbon emissions in order to deal with them successfully. China, as the largest emitter of carbon dioxide, has launched a series of environmental regulations to reduce carbon emissions [11,12].
Innovation, as a driving force to economic growth, has been referred to as an important development strategy by the central government of China [13]. In order to improve the innovative capability of cities, Chinese officials started to construct innovation cities in 2008 [14,15]. The policy is implemented at the city level, with two basic requirements. First, it aims to improve urban innovation capability by encouraging talent immigration, promoting enterprise patents, and increasing the investment in infrastructure such as internet and roads. Second, it requires a city to transfer its development mode from the classical resource-based to the innovation-driven, which further emphasizes the importance of optimizing the industrial structure [16,17,18]. Up to now, the innovation city pilot policy has been launched in three rounds, covering about a third of cities in China.
The investigation into the effect of innovation city construction on carbon emissions should be especially interesting, given the crucial role that innovation played in carbon emissions [19,20]; quite surprisingly, however, few studies have yet investigated whether innovation city construction would affect urban carbon emissions.
In this paper, we filled that void. Using a panel of cities from 2007 to 2015, we estimated the effect on carbon emissions of innovation city construction across China. The evidence suggests that innovation city construction does cause a reduction in carbon emissions, and its average effect is economically and statistically significant. Our estimates imply that cities from the status of not launching the innovation city construction to the status of launching the innovation city construction achieve about 2% larger carbon emissions on average in the following years than cities that still do not launch the innovation city construction.
To understand whether the effect on carbon emissions of innovation city construction was evenly distributed across different regions, we then turned to evidence from heterogeneity analysis. We found that the innovation city construction effect on carbon emissions was dependent on urban characteristics. That is, innovation city construction would be more conducive to the reduction in carbon emissions for cities with less population, lower levels of economic development, and the location in Western China.
Finally, in order to demonstrate the robustness of our results, we implemented a series of sensitivity analyses, including the leave-one-city-out-test, the bootstrapping test, and the permutation test; these results, from the three tests, suggest that innovation city construction has an economically and statistically significant negative effect on carbon emissions, again.
On the topics of innovation city construction and carbon emissions, there is little literature available. On the other hand, there are a few studies assessing the ecological and economic effects of innovation city construction [21,22,23]. For example, Zhao et al., estimated the effect of innovation city construction on financial development by fitting a difference-in-differences regression model based on the data of 235 cities in China [24]; they found that innovation city construction had a positive effect on financial development, and they thought that the improvement mainly caused by the talents gathering and the industrial upgrade. Li et al., adopted a matching framework integrating the difference-in-differences estimator to investigate the effect of innovation city construction on ecological efficiency [25]. Their results showed that innovation city construction brought a sizeable and statistically significant growth in ecological efficiency and that the effect relied on urban characteristics. Zhang and Wang explored whether innovation city construction affected industry–university–research knowledge flow, and they found that the former had a statistically significant correlation with the latter, but their relationship was linear [26]. In general, although there exist a few studies available on innovation city construction, they just focus on the economic and ecological effects. To our knowledge, it is the first to investigate the environmental effect of innovation city construction by focusing on its effect on carbon emissions.
The rest of this paper is organized as follows. The following section describes the construction of the dataset, and the implementation of the models, which would be used in later empirical analysis. Section 3 presents the estimates from our three estimators, including, the difference-in-differences estimator, the propensity-score-matching difference-in-differences estimator, and the inverse-probability-weighting difference-in-differences estimators. In that section, we also examined whether the treated group and the control group were comparable, reported the results from heterogeneity analysis, and carried out a series of robustness tests, including the leave-one-city-out-test, the bootstrapping test, and the permutation test. Section 4 concludes.

2. Methods

2.1. Data

In order to assess the effect of innovation city construction on carbon emissions, we extracted data from several resources and constructed an annual city-level panel data during the periods between 2007 and 2019.
Carbon emissions. The main indicator of an outcome is the carbon emission, which is measured in one thousand kilograms. In our later analysis, we took the logarithm of carbon emissions as the indicator of an outcome, so that the coefficient of our key independent variable could be interpreted as a percentage change. We obtained the data from the Ministry of Ecology and Environment of China.
Innovation city construction. The independent variable of our interest is the innovation city construction which is a dummy variable indicating whether a city is launching the innovation city construction, with a value of one representing that it is launching the project whereas a value of zero meaning that it is not doing so. We collected the information about the local government implementing innovation city construction city by city to fill in the values for our key independent variable.
Urban characteristics. To remove the potential confounding factors, we included a series of time-varying urban characteristics, which are used as controls, in our models; these urban characteristics contain gross regional product per capita measured in the year 2007. Chinese Yuan, population measured in persons, industrialization measured by the secondary industry as a percentage of gross regional product, urbanization measured by local urban population as a percentage of local total population, and energy structure were measured by coal consumption as a percentage of the total energy consumption. in some exercises, we divided total China into North China and South China, as well as Eastern China, Central China, Western China, and Northeastern China, according to the rule from the National Bureau of Statistics of China.

2.2. Models

Difference-in-differences estimators. We used difference-in-differences estimates as our baseline results. The difference-in-differences estimate could be obtained by fitting the following model:
Y i t = D i t × β + X i t × α + μ i + π t + ε i t
where Y i t represents carbon emissions in the city i per year t . D i t denotes whether a city i is launching the innovation city construction in year t , with the value of one representing that city c is launching the innovation city construction in the year t and the value of zero representing that city c is not launching the innovation city construction in the year t . X i t are a series of control variables, that is, urban characteristics, including gross regional product per capita, population, and so on. μ i indicate a collection of city fixed effects, and π t indicate a collection of year fixed effects.
The city fixed effects, μ i , are a full set of city-specific dummy variables, absorbing any time-invariant confounding effect specific to each city. For example, urban location, local culture, and short-term socio-economic status could be controlled through introducing the fixed effects specific to cities. The year fixed effects, π t , are a full set of year dummy variables, accounting for common shocks to all the cities in a given year, such as public holidays, macro-economic performance, and the total trend in carbon emissions across cities in our sample.
Because both of city and year fixed effects are included in the above model, the coefficient of β estimates the difference in carbon emissions between the treated group and the control group before and after the introduction of the launch of the innovation city construction. The treated group contains cities launching the innovation city construction, while the control group contains cities without innovation city construction. We referred to the difference as the effect of innovation city construction on carbon emissions. We expected β to be negative because a negative value illustrates a reduction in carbon emissions due to innovation city construction.
Propensity-score-matching difference-in-differences estimators. The second approach, which often is called propensity score matching, first fits a logistical regression, using urban characteristics as independent variables and using the indicator of whether a city is launching the innovation city construction as a dependent variable, to generate the propensity score that represents the probability of whether a city would launch the innovation city construction. After obtaining these propensity scores, we could match an observation with another observation conditional based on whether they had a similar propensity score. We consider the matching sample as the new sample. Based on the new sample, we could estimate the effect of innovation city construction on carbon emissions using the previous proposed difference-in-differences estimator. To distinguish the new proposed difference-differences estimator from the previous proposed difference-in-differences estimator, we refer to the former as a propensity-score-matching difference-in-differences estimator.
Inverse-probability-weighting difference-in-differences estimators. Though the matching approach would be a good one to make the treated group and the control group comparable, it leads to a loss of observations, which cannot match with others, consequently amplifying the uncertainty of estimates due to a relatively small size in the new sample. In order to make the two groups comparable, as well as to avoid the reduction of sample size in the processing of creating the counterfactual of the treated group, we now turn to another common approach, which follows a sampling technique called inverse probability weighting. Similarly to the matching approach, this approach also relies on probabilities, but the difference between it and the matching approach lies in that this approach does not require implementing one-to-one matching and discarding all the observations that could be matched, whereas it uses all the information on observations. That is, we would give a relatively large weight to an observation that could match with others, and give a relatively small weight to an observation that cannot match with others. Next, we explained how to create the weight, as well as how to estimate the effect of innovation city construction on carbon emission. We first estimated an exposure model using urban characteristics, then we produced weights using the propensity score, and finally, we assessed the effect of innovation city construction on carbon emissions using a difference-in-differences estimator with weights. Because the processing of assigning weights is often called inverse probability weighting, we referred to the approach presented here as an inverse-probability-weighting difference-in-differences estimator.
Event study. As we said earlier, the econometric assumption of difference-in-differences estimators is that cities with and without launching the innovation city construction would have common trends in carbon emissions in the absence of innovation city construction. Even if the estimates exhibit that innovation city construction reduces carbon emissions after an introduction of the project, the estimates might not be caused by the innovation city construction, but by a systematic difference between the treated group and the control group. For example, if cities with innovation city construction have a downward trend in carbon emissions, this could lead to the results; this assumption is untested because we could not observe the counterfactual. That is, what would happen to the trend in carbon emissions in the treated group in the absence of the launch of the innovation city construction. Nevertheless, we could still examine the trends in carbon emissions for the two groups before the introduction of the innovation city’s construction, and investigate whether they are comparable. To do so, we performed an event study by fitting the following model:
Y i t = m = k , m 1 M D i t , k × β k + X i t × α + μ i + π t + ε i t
where Y i t represents carbon emissions in city i in the year t . D i t , k denotes a collection of dummy variables indicating the treated status during different periods. Here, we set a year as a period. The dummy for m 1 is omitted in the above equation so that the dynamic effect of innovation city construction on carbon emissions is relative to the period instantaneously before the launch of the project. The coefficient of β k exactly estimates the effect of the project m years after it is launched. We included the leads of these dummy variables in Equation (2) to test whether the parallel trends assumption is reasonable. Intuitively, the coefficient of β k estimates the difference in carbon emissions between cities with and without launching the innovation city construction. We expected that these coefficients are statistically insignificant when K 2 , which indicates that the trends in carbon emissions between the two groups are similar, whereas we expected that these coefficients are statistically significant when K 0 , which suggests that innovation city construction has a persistent effect on carbon emissions. X i t are a series of control variables, that is, urban characteristics, including gross regional product per capita, population, and so on. μ i indicate a collection of city fixed effects, and π t indicate a collection of year fixed effects.
Robustness check. We performed three tests to illustrate the robustness of our results. First, we did the leave-one-city-out-test. That is, we first formed 285 new samples, for which one city is left out. By fitting a difference-in-differences regression model for the 285 sample, then, we obtained 285 estimates in the effect on carbon emissions of innovation city construction and their standard errors. We next constructed the confidence interval for the 285 estimates, using these estimates and standard errors. Finally, we compared the raw estimate with the 285 estimates. If the major of constructed 285 confidence intervals contain the raw estimate, then we would illustrate that our results are little sensitive to the selection of individual units.
Our second test is the bootstrapping test. That is, we first created 1000 random samples, with the total periods of one city as group. We then implemented the difference-in-differences estimator for each new created random sample, and obtained 1000 estimates in the effect of innovation city construction on carbon emissions. We plotted the empirical distribution of the effect on carbon emissions, and checked the location of the raw estimate in the empirical distribution. If the mean of the empirical distribution approaches to the raw estimate and if the mean of the empirical distribution is far from zero, then we could demonstrate that our results are robust to sample selection.
The third test uses the permutation test; this test could be implemented by the following steps. First, we randomly chose an individual, and gave it a treatment in a particular period or referred to the unit as a control unit. Second, we could create a new sample by carrying out the first step for all the cities in the raw sample. Third, we use the first two step to form 1000 new samples. Fourth, we obtained 1000 estimates based on the 1000 samples by fitting a difference-in-differences regression model. Fifth, we plotted the empirical distribution, and compared the mean of the empirical distribution with the raw estimate. If our raw is far from the mean of the empirical distribution of the permutation test and if the mean of the empirical distribution is around zero, then our interpretation is that our results have a economic and statistical significance.
Heterogeneity analysis. The effect of innovation city construction on carbon emissions might be different conditional on urban characteristics. For example, the effects could be dependent on gross regional product per capita, population, industrialization, urbanization, and energy structure. To explore the heterogeneity, we used the following equation based on different urban characteristics:
Y i t = D i t × β + X i t × α + μ i + π t + ε i t   for   one   specific   urban   characteristic  
where Y i t represents carbon emissions in the city i in the year t . D i t denotes whether a city c is launching the innovation city construction in the year t , with the value of one representing that city c is launching the innovation city construction in year t and the value of zero representing that city c is not launching the innovation city construction in the year t . X i t are a series of control variables, that is, urban characteristics, including gross regional product per capita, population, and so on. μ i indicate a collection of city fixed effects, and π t indicate a collection of year fixed effects. We depicted the results from heterogeneity analysis in the corresponding subsection using a forest plot.

3. Results

3.1. The Effect on Carbon Emissions

Difference-in-differences estimates. We found that innovation city construction did reduce carbon emissions. That is, relative to cities without launching the innovation city construction, carbon emissions in cities with launching the project substantially declined when including a series of urban characteristics and a collection of fixed effects; these estimates are not sensitive to the inclusion of urban characteristics.
Table 1 reports the difference-in-differences estimates adjusted for different numbers of urban characteristics. The first column of this table does not control for any urban characteristics. In a pattern similar with all of the estimates that we presented, we found that a statistically significant amount of average impact on carbon emissions, with a coefficient on innovation city construction of −0.024. Column 2, controlling for gross regional product per capita, shows that the estimate of the impact of innovation city construction on carbon emissions is similar to that found in Column 1. Column 3 adds gross regional product per capita and population, exhibiting that the average change in carbon emissions around the introduction of innovation city construction is the same as that of Column 2. Column 4 includes three control variables, that is, gross regional product per capita, population, and industrialization. The estimated coefficient on our variable of innovation city construction, here, remains the same as those reported in the previous columns. Columns 5 to 6 absorb four more controls of urban characteristics. We found that the results, obtained from the last two columns, were very close to those in the first four columns. The coefficient on the variable of our interest is now −0.021, indicating that innovation city construction reduces annual carbon emissions by about 2%.
Overall, these results boost our confidence. That is, our results are not driven by the chance, which is extremely robust, including different numbers of urban characteristics. Motivated by this, we pay attention to the specification in Column 6, controlling for a rich collection of urban characteristics, as well as fixed effects, for the results from event study, further robustness check, and heterogeneity analysis; moreover, we referred to these estimates here as baseline results.
Propensity-score-matching difference-in-differences estimates. Table 2 reports the estimates obtained from our propensity-score-matching difference-in-differences estimator, adjusted for different numbers of urban characteristics. To compare these results in Table 2 with those in Table 1, we used the controls in one column of Table 2 in just the same way as we did in the corresponding column of Table 1. That is, each column of Table 1 and Table 2 have the same specification. In line with our expectation, the estimates from our propensity-score-matching difference-in-differences estimators are very similar to those from baseline models, although there is a small difference between them, with an estimated coefficient of innovation city construction ranging from −0.023 to −0.020.
Inverse-probability-weighting difference-in-differences estimates. Table 3 presents the results obtained from the inverse-probability-weighting difference-in-differences estimator, adjusted for different numbers of urban characteristics. To make that these results reported here could be compared with baseline results, as well as with those in Table 2, in Columns 1 to 5 of Table 3, we adopted the specifications from the same six columns of Table 1. We found that the results were similar across the three tables, with a substantial reduction in urban carbon emissions, indicating that the estimated results are extremely robust to the choice of econometric models. Of course, the results suggest that the control group is comparable to the treated group before an introduction of the innovation city construction in the raw sample.

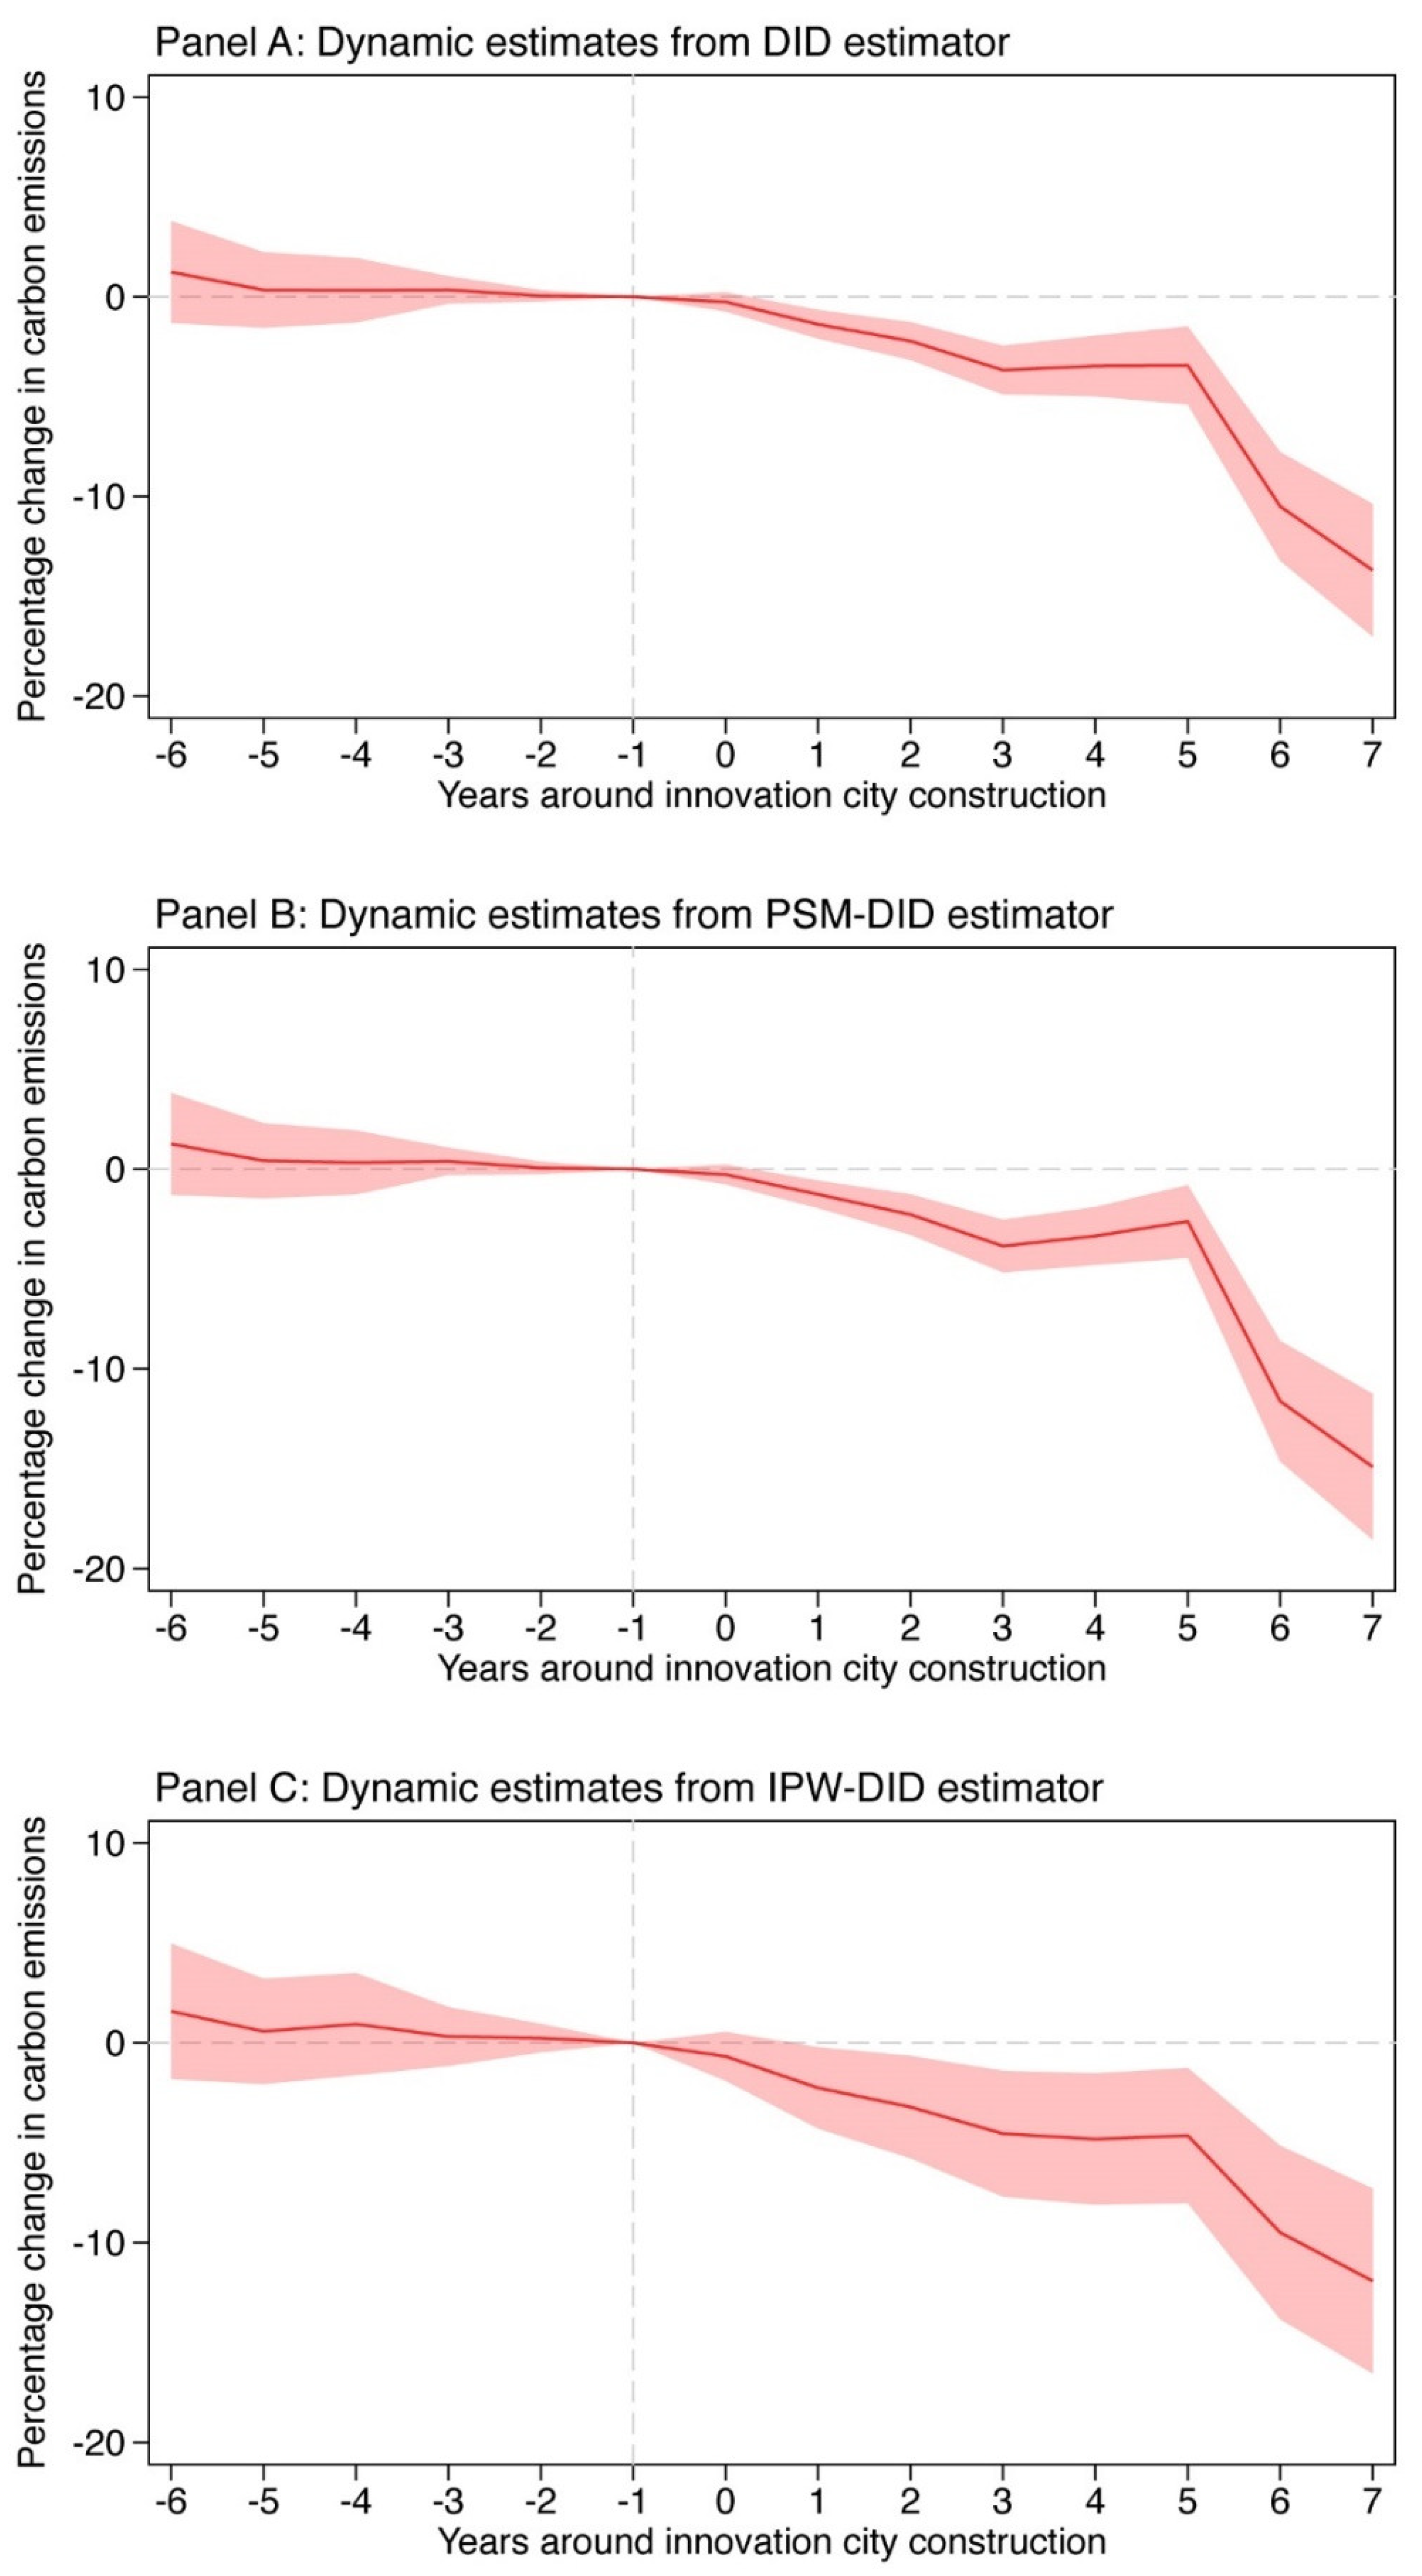
3.2. Tests for Parallel Trends Assumption

We conducted event studies to investigate the evolution of the trends in carbon emissions in the treated group and the control group; this analysis allows us to check whether their trends are similar before the introduction of the innovation city construction. By the way, we investigated the dynamics of carbon emissions after the introduction of the innovation city construction, which helps us check whether innovation city construction has an instantaneous effect on carbon emissions, as well as whether it persistently affects carbon emissions.
Figure 1 plots our findings; this figure is structured in three panels. In the top panel, we depicted the estimates of dynamic effects of innovation city construction on carbon emissions from our preferred specification by fitting a difference-in-differences estimator, along with their 95% confidence intervals constructed using standard errors robust against heteroskedasticity and serial correlation at the city level. In the middle panel, we depicted the estimates of dynamic effects of innovation city construction on carbon emissions from our preferred specification by fitting a propensity-score-matching difference-in-differences estimator, along with their 95% confidence intervals, constructed using standard errors robust against heteroskedasticity and serial correlation at the city level. In the bottom panel, we depicted the estimates of dynamic effects of innovation city construction on carbon emissions from our preferred specification by fitting an inverse-probability-weighting difference-in-differences estimator, along with their 95% confidence intervals constructed using standard errors robust against heteroskedasticity and serial correlation at the city level. In each panel, the red line represents the estimate of dynamic effects of innovation city construction on carbon emissions, while the red shadow represents their 95% confidence intervals, with the values of years equal to 0 corresponding to the year of the launch of the innovation city construction.
Across the three figures, we found a similar pattern in the dynamics of carbon emissions. That is, before an introduction of the innovation city construction, although the difference in trends of carbon emissions between the treated group and the control group exhibits a slightly downward trend, all the coefficients are statistically insignificant, implying that the parallel trends assumption could be reasonable if the innovation city construction was not launched. In contrast, we observe that after an introduction of the innovation city construction, carbon emissions in the treated group have a clear decline during the first periods, indicating that innovation city construction might have an instantaneous and persistent negative effect on carbon emissions.

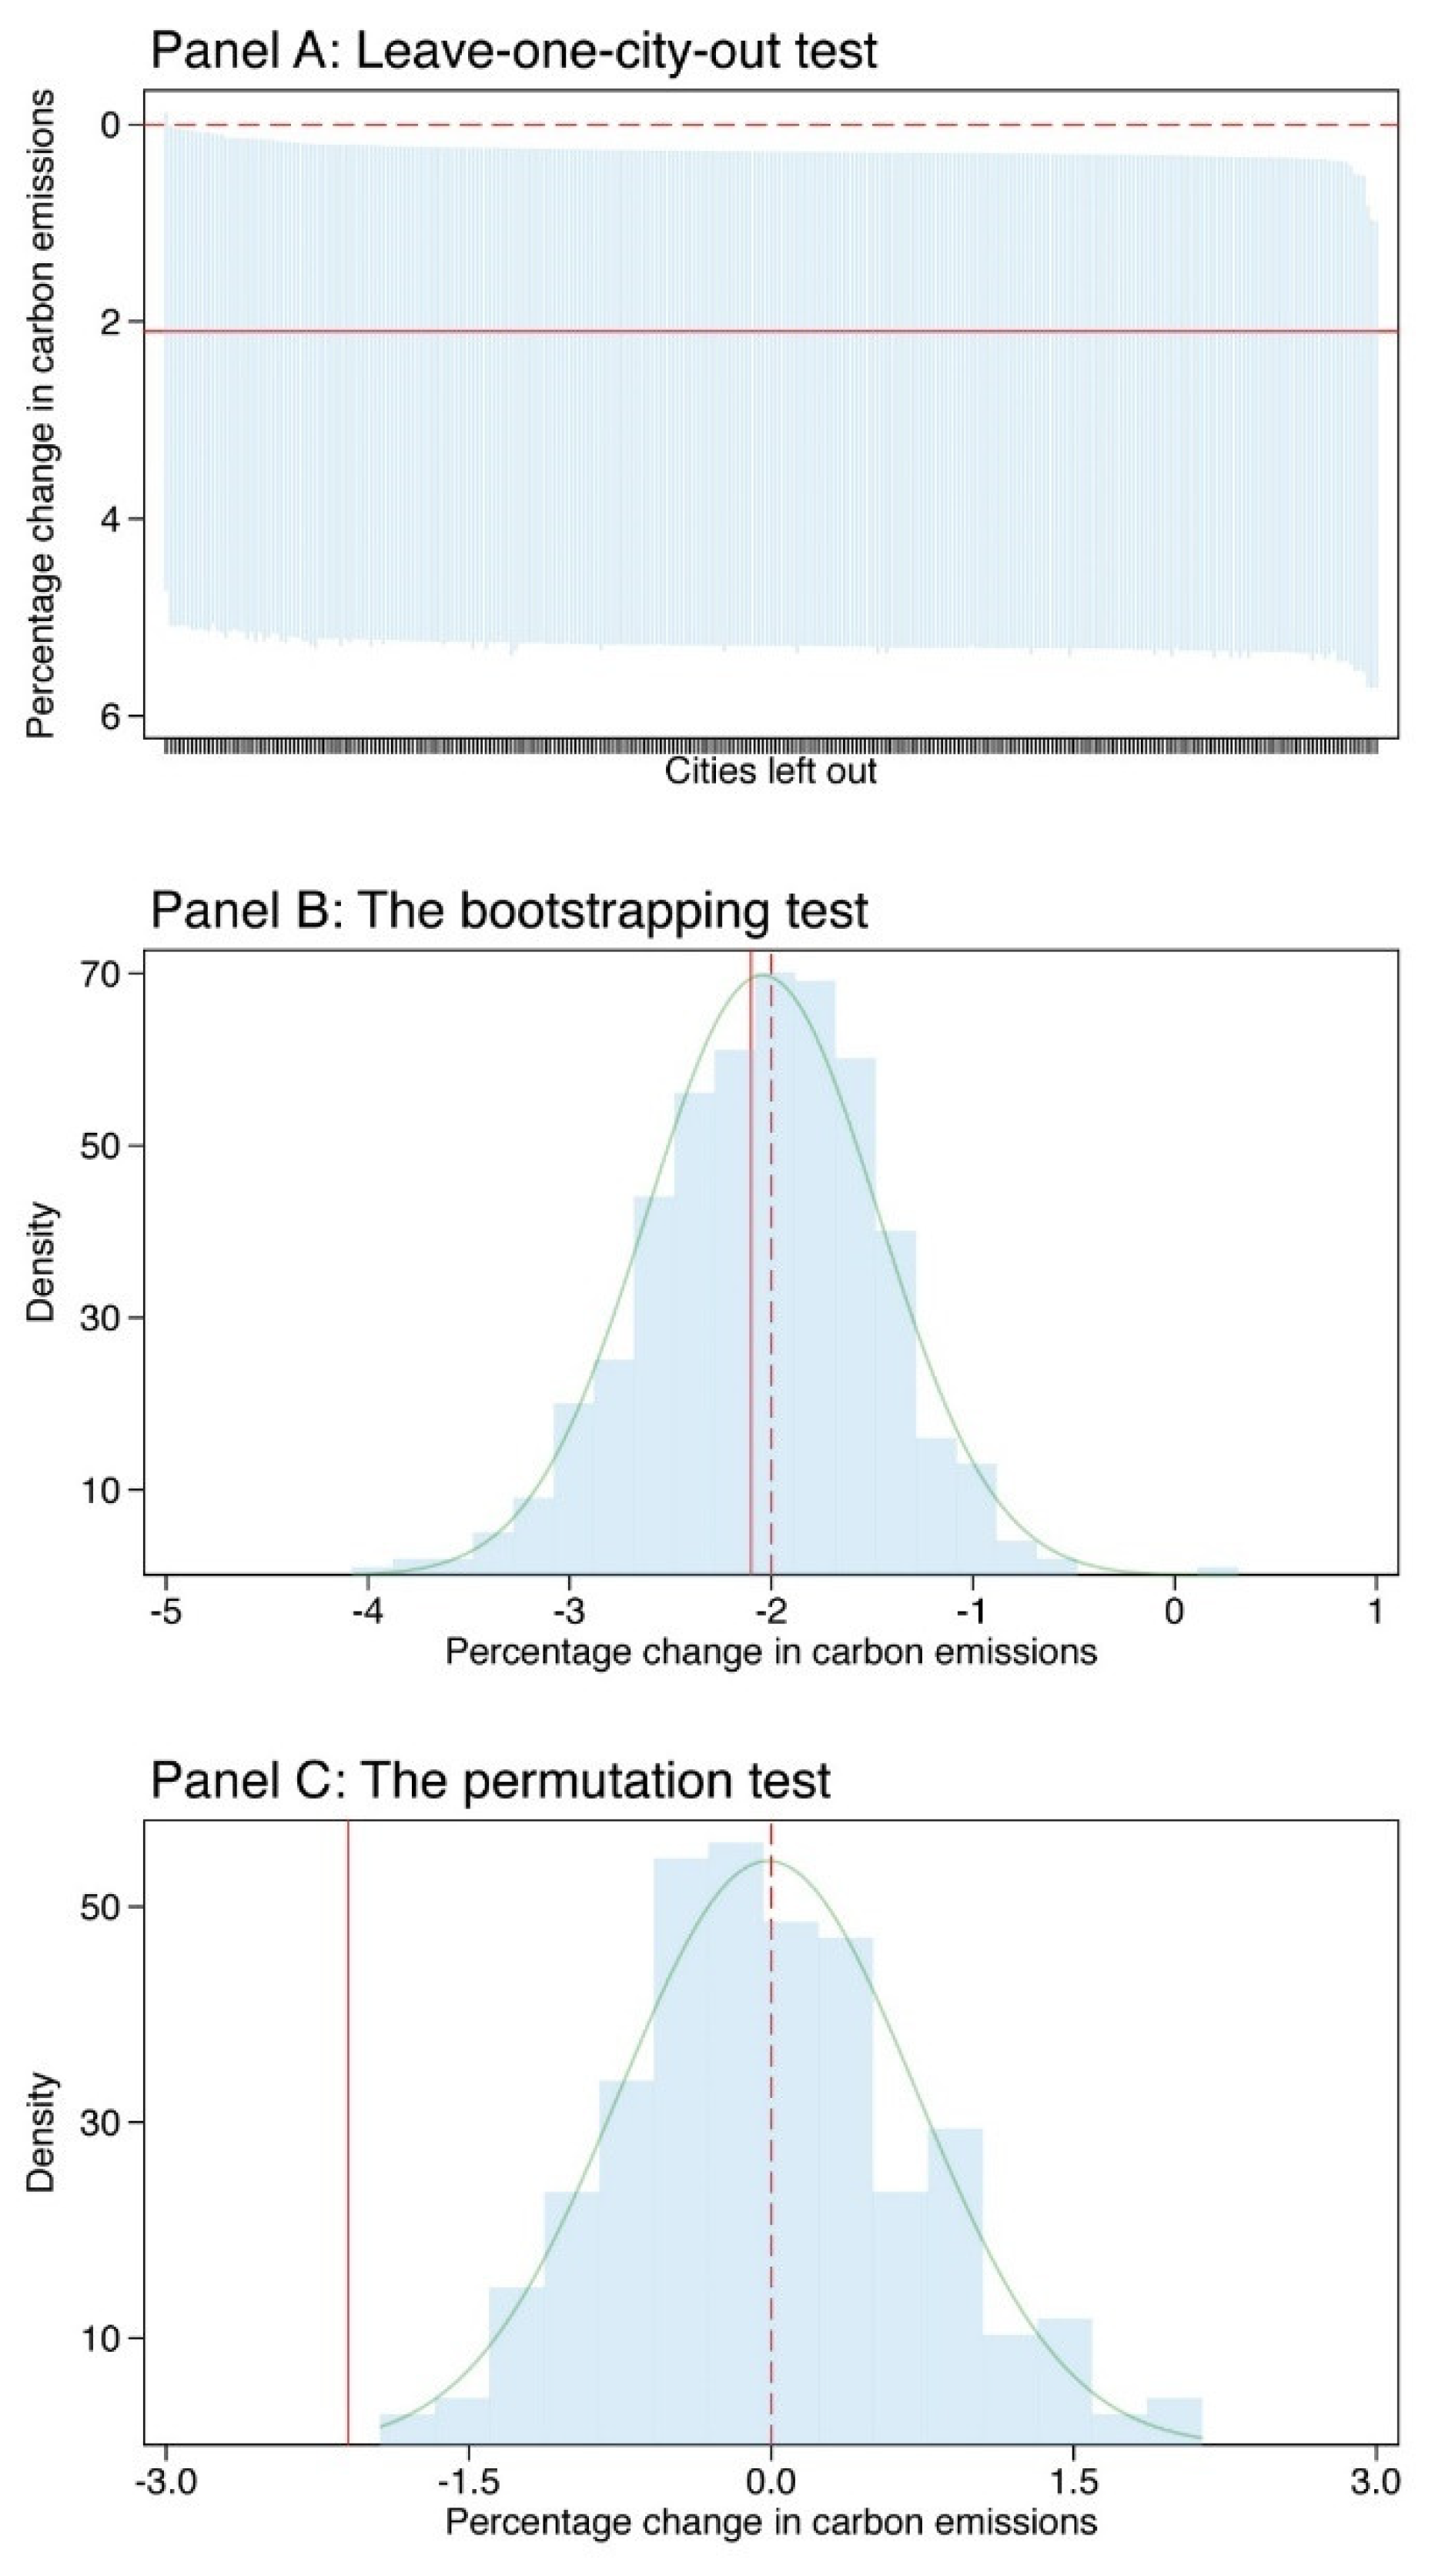
3.3. Further Robustness Check

In Figure 2, we further investigate the robustness of our estimates in the effect of innovation city construction on carbon emissions, by implementing a series of statistical tests. In Panel A of Figure 2, we performed the leave-one-city-out test. The red line represents the raw estimate from our preferred specification, which is reported in Column 6 of Table 1. Using the same specification, we obtained 285 estimates in the effect from the 285 leave-one-city-out samples. The blue represents the 95% confidence intervals of these estimates, which are constructed using their standard errors robust to heteroskedasticity and serial correlation at the city level. We found that all the 95% confidence intervals contain the raw estimate, suggesting that our results are robust to the selection of individual units.
In Panel B of Figure 2, we performed the bootstrapping test with 1000 random samples. The red solid line represents the raw estimate from our preferred specification reported in Column 6 of Table 1, while the red dash line represents the mean of the empirical distribution of these estimates from the bootstrapping test. The blue shadow is the empirical distribution, and the green curve is the fitted normally distributed curve for the empirical distribution. We found that the mean of the empirical distribution is similar to the raw estimate, and at the same time they are far away from zero, implying that our results are not sensitive to sample selection.
In Panel C of Figure 2, we performed the permutation test with 1000 random samples, where we randomly assigned a treatment or control to cities. The red solid line represents the raw estimate from our preferred specification reported in Column 6 of Table 1, while the red dash line represents the mean of the empirical distribution of these estimates from the permutation test. The blue shadow is the empirical distribution, and the green curve is the fitted normally distributed curve for the empirical distribution. We found that the mean of the empirical distribution approaches to the zero, but is far away from the raw estimate, indicating that our results are robust, and economically and statistically significant, again.

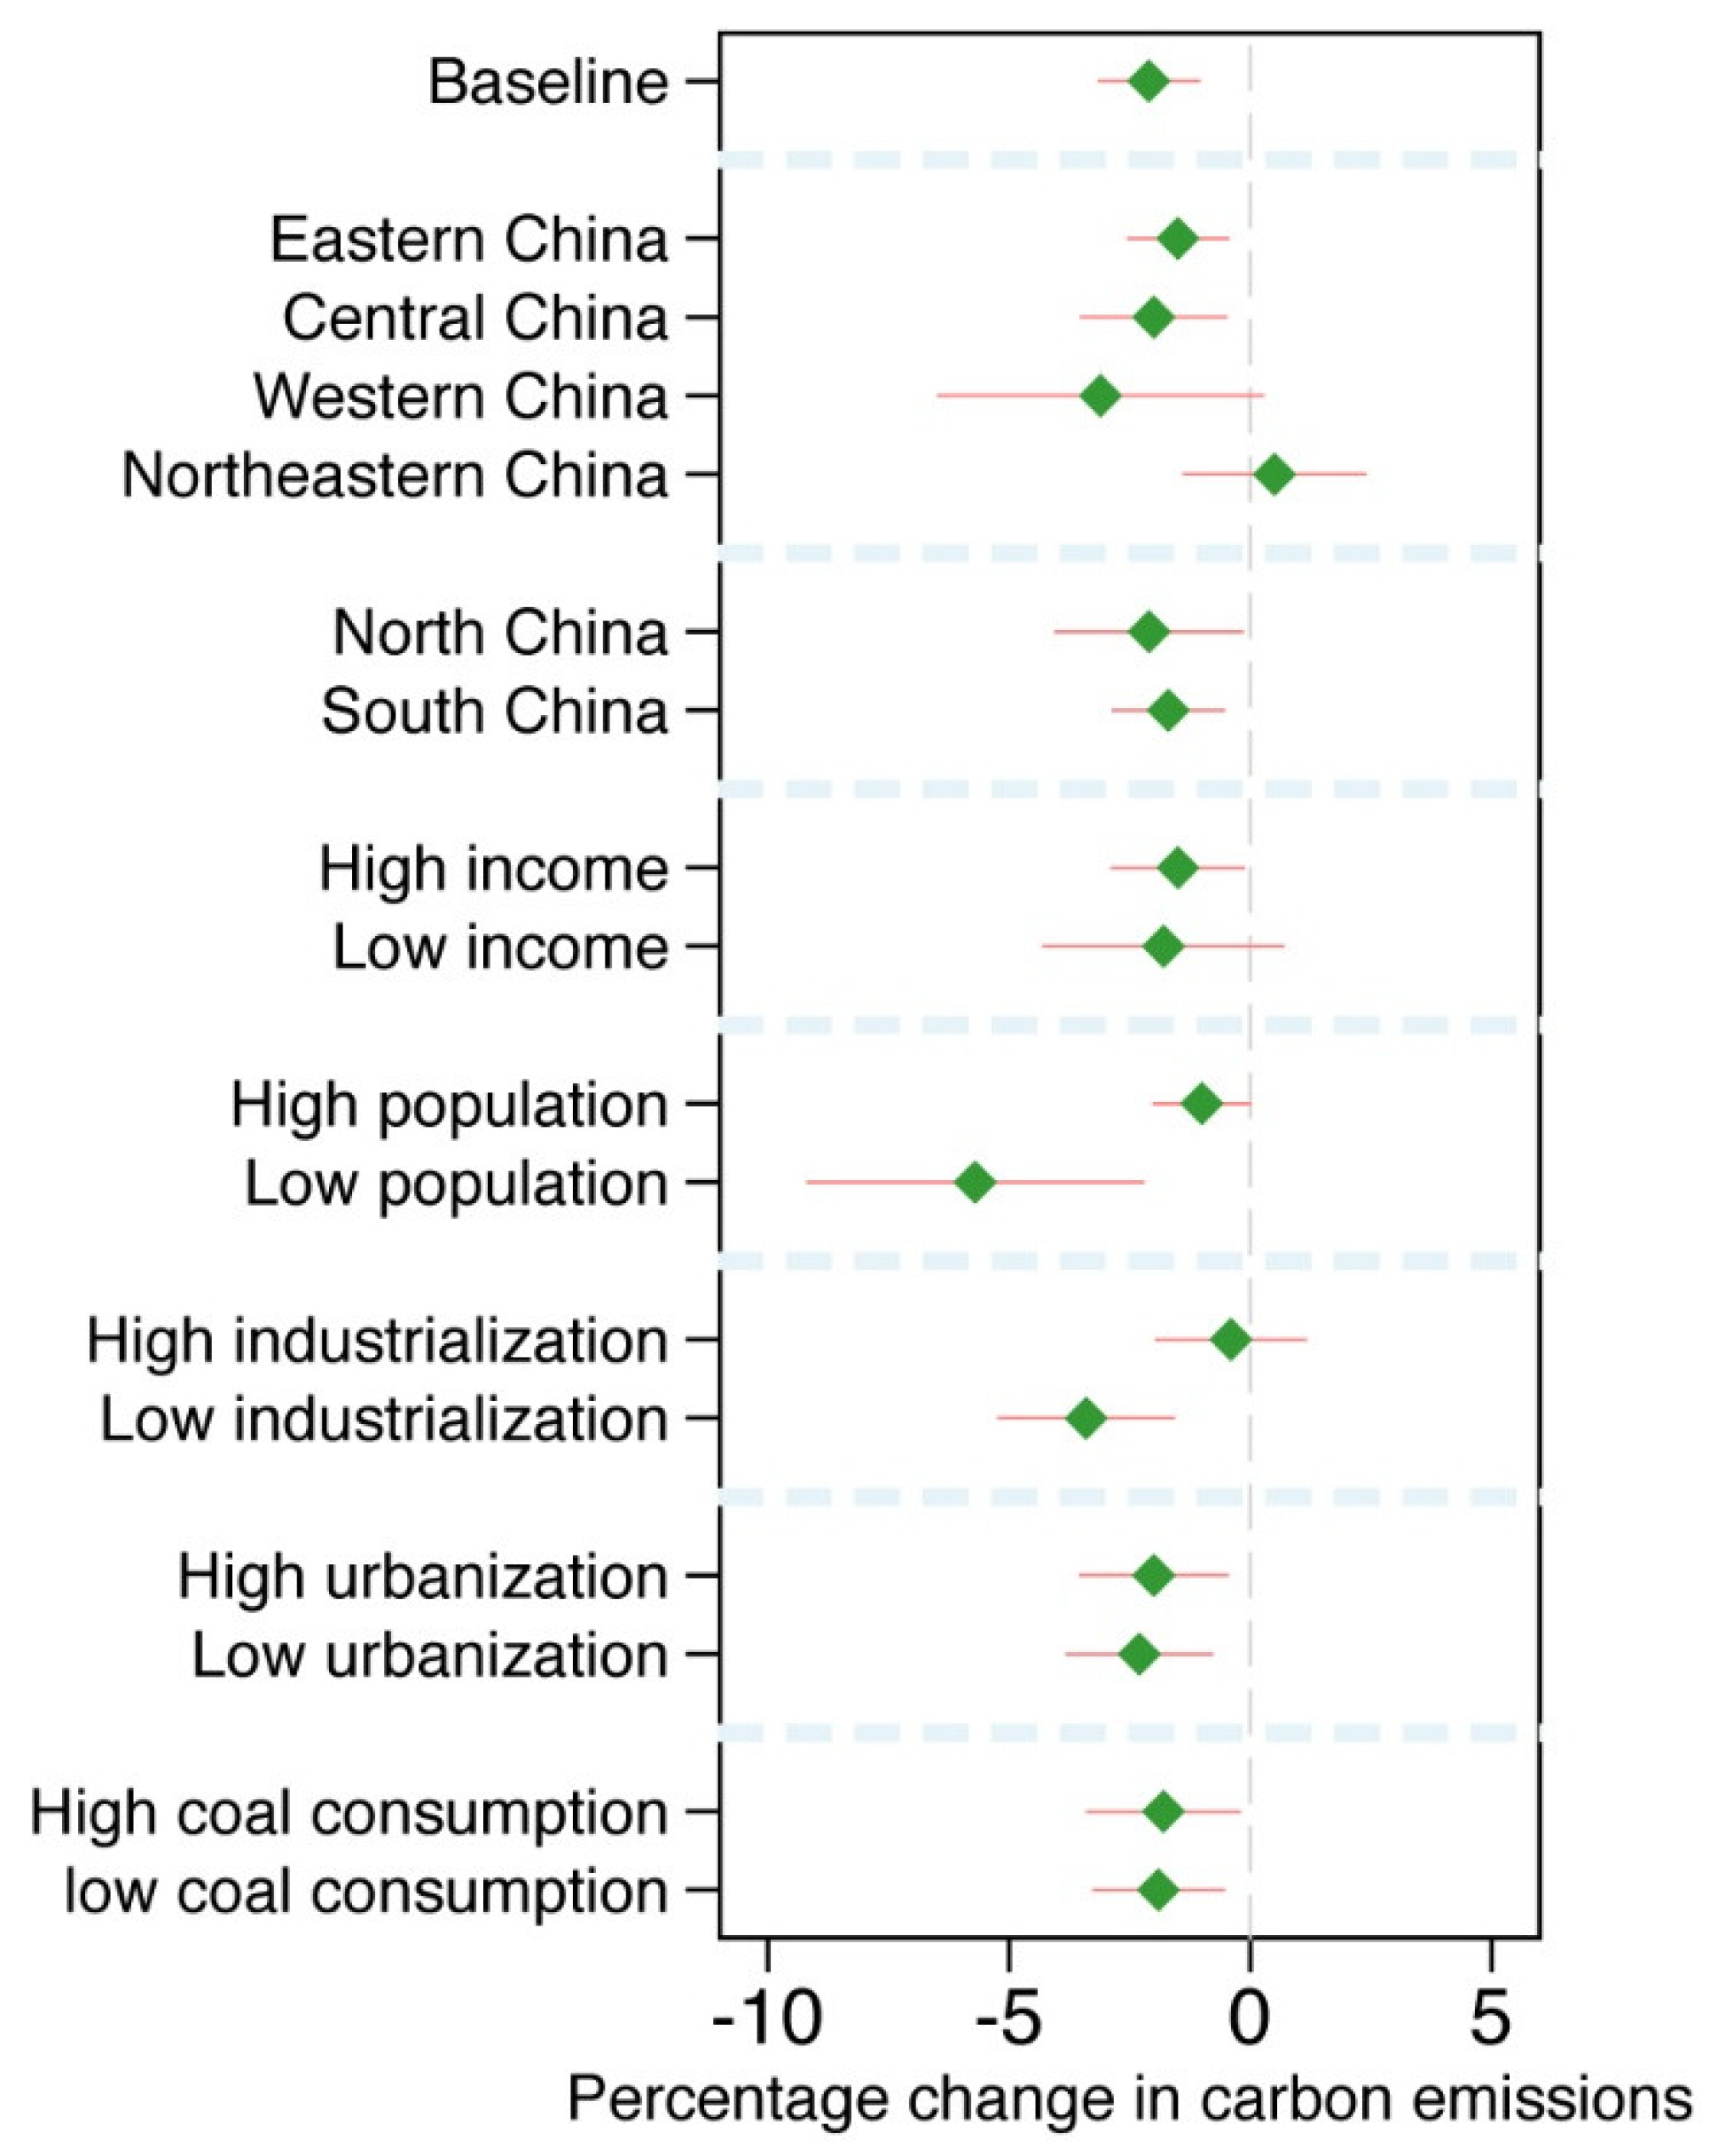
3.4. Heterogeneity Analysis

In Figure 3, we investigated whether the effect of innovation city construction on carbon emissions varied across different urban characteristics. Note that the analysis of heterogeneous effects does not have a causal interpretation, but it is beneficial for us to understand the potential channels via which innovation city construction had an effect on carbon emissions.
First, we grouped cities into four geographic regions according to the classification of the Nation Bureau of Statistics of China; these regions are Eastern China, Central China, Western China, and Northeastern China. We also use the Qinling-Mountain-Huai-River line, which is often used by Chinese geographers to distinguish between North China and South China, to divide the total cities in our sample into two geographic regions, the North and the South. The top section of Figure 3 reports our findings. We observed that the impact was the largest in Western China, followed by Central China and Eastern China, while it was positive but not significant in Northeastern China. We also found that the innovation city construction had a larger impact on carbon emissions in North China than in South China.
In the middle section of Figure 3, we examined the impact heterogeneity corresponding to income per person and urban population. We found that the impact of innovation city construction on carbon emissions was larger in cities with lower income per person and smaller population sizes.
Finally, the bottom section of Figure 3 shows that, in these cities that are more heavily dependent on industrial activities and have a higher level of urbanization, the impact of innovation city construction on carbon emissions is more substantial.
In short, the results from heterogeneity analysis suggest that the impact that innovation city construction has on carbon emissions is not evenly distributed across different types of cities.

4. Conclusions

Innovation, as a driving force to economic growth, has been referred to as an important development strategy by the central government of China. In order to improve the innovative capability of cities, the Chinese officials started to construct innovation cities in 2008. Previous studies have investigated the ecological and economic effects of innovation city construction. Yet, evidence on the environmental effect of the project remains unclear.
In this paper, we explored whether innovation city construction affected carbon emissions. To our knowledge, it is the first to assess the environmental effect of the project. We provided concrete evidence that innovation city construction had an economically and statistically significant negative effect on carbon emissions on average; this result remains true with difference-in-differences estimators that compare cities with and without introducing the innovation city construction while controlling for urban characteristics, as well as in propensity-score-matching difference-in-differences estimates that model the propensity of whether a city would launch the innovation city construction. Our preferred specifications show that the average reduction in carbon emissions is about 2% around the introduction of innovation city construction.
We also used the propensity score as a weight to balance urban characteristics between the treated group and the control group. Using the inverse-probability-weighting difference-in-differences estimator, we, again, confirmed the finding that innovation city construction had a negative effect on carbon emissions.
The triangulation of evidence, from the three difference-in-differences estimators, all leads to a similar estimate of the effect of innovation city construction on carbon emissions, giving us confidence that there exists a negative causal effect of innovation city construction on carbon emissions. Our results also show that innovation city construction have a larger effect on carbon emissions in western, poorer, and less populated cities than in those with opposite characteristics.
More importantly, the estimates of the dynamic effect of innovation city construction on carbon emissions, obtained from event studies, present evidence that innovation city construction has a persistent effect on carbon emissions, implying that the Chinese government should encourage innovation to reduce carbon emissions.
In sum, our results suggest that there is an instantaneous and persistent reduction in carbon emissions around the introduction of innovation city construction. Work using a fully comprehensive data set to investigate the potential mechanisms through which innovation city construction affected carbon emissions is an obvious and fruitful area for future research. An exploration of whether the effect of innovation city construction on carbon emissions is dependent on the ability of the government to manage the economy, as well as the degree to which a city is being converted from the planned economy to the market economy, is another important field of future inquiry.

Author Contributions

Both authors equally contributed to this paper. J.K. conceptualized the study and provided supervision. C.W. collected the data from several sources. J.K. conducted the statistical analysis and drafted the manuscript. C.W. and J.K. contributed to the interpretation of the results. All authors have read and agreed to the published version of the manuscript.

Funding

We acknowledge funding from the National Social Science Foundation of China (Grant no. 18ZDA051), the National Natural Science Foundation of China (Grant no. 72171100), the National Natural Science Foundation of China (Grant no. 72073049), the National Natural Science Foundation of China (Grant no. 71703052), and the Natural Science Foundation of Hubei Province (Grant no. 2020CFB853). This paper does not reflect an official statement or opinion from the organizations.

Institutional Review Board Statement

Not applicable.

Informed Consent Statement

Not applicable.

Data Availability Statement

Correspondence and requests for materials should be addressed to Jiayang Kong.

Acknowledgments

We thank Botao Liu, Yu Cao, Lang Cheng, Wei Wei, and Yihui Li for their helpful comments on an earlier version of this paper. In addition, Jiayang Kong wants to thank, in particular, the patience, care, and support from Jia Zhang over the years.

Conflicts of Interest

The authors declare no conflict of interest.

References

  1. Calleja-Agius, J.; England, K.; Calleja, N. The effect of global warming on mortality. Early Hum. Dev. 2021, 155, 105222. [Google Scholar] [CrossRef] [PubMed]
  2. Campbell, T.G.; Al-Qureshi, S. Ophthalmologists and climate change. Clin. Exp. Ophthalmol. 2022, 50, 274–279. [Google Scholar] [CrossRef] [PubMed]
  3. Tan, X.; Liu, Y.; Dong, H.; Xiao, Y.; Zhao, Z. The health consequences of greenhouse gas emissions: A potential pathway. Environ. Geochem. Health 2022. [Google Scholar] [CrossRef] [PubMed]
  4. Matias, S.R.; Ferreira, P.A. The role of railway traffic and extreme weather on slab track long-term performance. Constr. Build. Mater. 2022, 322, 126445. [Google Scholar] [CrossRef]
  5. Hang, X.; Li, N. Characterizing individual mobility perturbations in cities during extreme weather events. Int. J. Disaster Risk Reduct. 2022, 72, 102849. [Google Scholar] [CrossRef]
  6. Frederick, A.B.M. Population, Carbon Emmissions, and Global Warming: The Forgotten Relationship at Kyoto. Popul. Dev. Rev. 1998, 24, 115–130. [Google Scholar] [CrossRef]
  7. Fang, J.; Zhu, J.; Wang, S.; Yue, C.; Shen, H. Global warming, human-induced carbon emissions, and their uncertainties. Sci. China Earth Sci. 2011, 54, 1458. [Google Scholar] [CrossRef]
  8. Williams, R.G.; Roussenov, V.; Goodwin, P.; Resplandy, L.; Bopp, L. Sensitivity of Global Warming to carbon emissions: Effects of Heat and Carbon Uptake in a Suite of Earth System Models. J. Clim. 2017, 30, 9343–9363. [Google Scholar] [CrossRef] [Green Version]
  9. Flagey, N.; Thronas, K.; Petric, A.; Withington, K.; Seidel, M.J. Measuring carbon emissions at the Canada–France–Hawaii Telescope. Nat. Astron. 2020, 4, 816–818. [Google Scholar] [CrossRef]
  10. Bruckner, B.; Hubacek, K.; Shan, Y.; Zhong, H.; Feng, K. Effects of poverty alleviation on national and global carbon emissions. Nat. Sustain. 2022, 5, 311–320. [Google Scholar] [CrossRef]
  11. Peng, T.; Deng, H. Research on the sustainable development process of low-carbon pilot cities: The case study of Guiyang, a low-carbon pilot city in south-west China. Environ. Dev. Sustain. 2020, 23, 2382–2403. [Google Scholar] [CrossRef]
  12. Wang, M.; Yang, Q. The heterogeneous treatment effect of low-carbon city pilot policy on stock return: A generalized random forests approach. Financ. Res. Lett. 2022, 47, 102808. [Google Scholar] [CrossRef]
  13. Feng, Z.; Cai, H.; Chen, Z.; Zhou, W. Influence of an interurban innovation network on the innovation capacity of China: A multiplex network perspective. Technol. Forecast. Soc. Change 2022, 180, 121651. [Google Scholar] [CrossRef]
  14. Yu, Y.; Chen, X.; Zhang, N. Innovation and energy productivity: An empirical study of the innovative city pilot policy in China✰. Technol. Forecast. Soc. Change 2022, 176, 121430. [Google Scholar] [CrossRef]
  15. Zhang, M.; Hong, Y.; Zhu, B. Does national innovative city pilot policy promote green technology progress? Evidence from China. J. Clean. Prod. 2022, 363, 132461. [Google Scholar] [CrossRef]
  16. Zhou, Y.; Li, S. Can the innovative-city-pilot policy promote urban innovation? An empirical analysis from China. J. Urban Aff. 2021. [Google Scholar] [CrossRef]
  17. Wang, S.; Wang, J.; Wei, C.; Wang, X.; Fan, F. Collaborative innovation efficiency: From within cities to between cities—Empirical analysis based on innovative cities in China. Growth Change 2021, 52, 1330–1360. [Google Scholar] [CrossRef]
  18. Li, L.; Li, M.; Ma, S.; Zheng, Y.; Pan, C. Does the construction of innovative cities promote urban green innovation? J. Environ. Manag. 2022, 318, 115605. [Google Scholar] [CrossRef]
  19. Erdoğan, S.; Yıldırım, S.; Yıldırım, D.Ç.; Gedikli, A. The effects of innovation on sectoral carbon emissions: Evidence from G20 countries. J. Environ. Manag. 2020, 267, 110637. [Google Scholar] [CrossRef]
  20. Mo, J.Y. Technological innovation and its impact on carbon emissions: Evidence from Korea manufacturing firms participating emission trading scheme. Technol. Anal. Strateg. Manag. 2022, 34, 47–57. [Google Scholar] [CrossRef]
  21. Jin, P.; Mangla, S.K.; Song, M. Moving towards a sustainable and innovative city: Internal urban traffic accessibility and high-level innovation based on platform monitoring data. Int. J. Prod. Econ. 2021, 235, 108086. [Google Scholar] [CrossRef]
  22. Ahn, J.; Seo, D.; Kwon, Y. Impact of Innovation City Projects on National Balanced Development in South Korea: Identifying Regional Network and Centrality. ISPRS Int. J. Geo-Inf. 2021, 10, 169. [Google Scholar] [CrossRef]
  23. Yang, J.; Xiong, G.; Shi, D. Innovation and sustainable: Can innovative city improve energy efficiency? Sustain. Cities Soc. 2022, 80, 103761. [Google Scholar] [CrossRef]
  24. Zhao, Z.; Zheng, Y.; Chen, Y.; Ye, C.; He, Z. Research on the Impact of Innovative City Construction on Financial Development: Evidence from China. Discret. Dyn. Nat. Soc. 2021, 2021, 7541690. [Google Scholar] [CrossRef]
  25. Li, Y.; Zhang, J.; Yang, X.; Wang, W.; Wu, H.; Ran, Q.; Luo, R. The impact of innovative city construction on ecological efficiency: A quasi-natural experiment from China. Sustain. Prod. Consum. 2021, 28, 1724–1735. [Google Scholar] [CrossRef]
  26. Zhang, S.; Wang, X.; Zhang, B. The policy effects of innovative city pilot on the dual efficiency of industry–university–research knowledge flow. Technol. Anal. Strateg. Manag. 2021. [Google Scholar] [CrossRef]
Figure 1. Dynamic estimates.
Land 11 01099 g001
Figure 2. Robustness check.
Land 11 01099 g002
Figure 3. Heterogeneity analysis.
Land 11 01099 g003
Table 1. Estimates in the impact on carbon emissions from difference-in-differences estimators.
(1)(2)(3)(4)(5)(6)
Key independent variable
Innovation city pilot construction–0.024 ***–0.021 ***–0.021 ***–0.021 ***–0.021 ***–0.021 ***
(0.0055)(0.0055)(0.0055)(0.0054)(0.0054)(0.0054)
Control variables and
other statistics
Gross regional product per catita YYYYY
Population YYYY
Industrialization YYY
Urbanization YY
Energy structure Y
City fixed effectsYYYYYY
Year fixed effectsYYYYYY
Adjusted R-squared0.9980.9980.9980.9980.9980.998
Number of cities285285285285285285
Note: Each column represents one specific model. In Columns (1) to (6), we separately included different numbers of urban characteristics in the model, with Y representing that the variable corresponding row name is controlled. For example, in the first column, we controlled city and year fixed effects. Standard errors robust against heteroskedasticity and serial correlation at the city level are reported in parentheses. *** p < 0.01.
Table 2. Estimates in the impact on carbon emissions from propensity-score-matching difference-in-differences estimators.
(1)(2)(3)(4)(5)(6)
Key independent variable
Innovation city pilot construction–0.023 ***–0.020 ***–0.020 ***–0.020 ***–0.020 ***–0.020 ***
(0.0053)(0.0054)(0.0054)(0.0053)(0.0053)(0.0053)
Control variables and other statistics
Gross regional product per catita YYYYY
Population YYYY
Industrialization YYY
Urbanization YY
Energy structure Y
City fixed effectsYYYYYY
Year fixed effectsYYYYYY
Adjusted R-squared0.9980.9980.9980.9980.9980.998
Number of cities285285285285285285
Note: Each column represents one specific model. In Columns (1)–(6), we separately included different numbers of urban characteristics in the model, with Y representing that the variable corresponding row name is controlled. For example, in the first column, we controlled city and year fixed effects. Standard errors robust against heteroskedasticity and serial correlation at the city level are reported in parentheses. *** p < 0.01.
Table 3. Estimates in the impact on carbon emissions from inverse-probability-weighting difference-in-differences estimators.
(1)(2)(3)(4)(5)(6)
Key independent variable
Innovation city pilot construction–0.027 **–0.025 *–0.025 *–0.025 *–0.025 *–0.025 *
(0.0125)(0.0128)(0.0128)(0.0129)(0.0129)(0.0129)
Control variables and other statistics
Gross regional product per catita YYYYY
Population YYYY
Industrialization YYY
Urbanization YY
Energy structure Y
City fixed effectsYYYYYY
Year fixed effectsYYYYYY
Adjusted R–squared0.9980.9980.9980.9980.9980.998
Number of cities285285285285285285
Note: Each column represents one specific model. In Columns (1)–(6), we separately included different numbers of urban characteristics in the model, with Y representing that the variable corresponding row name is controlled. For example, in the first column, we controlled city and year fixed effects. Standard errors robust against heteroskedasticity and serial correlation at the city level are reported in parentheses. * p < 0.10; ** p < 0.05.
Publisher’s Note: MDPI stays neutral with regard to jurisdictional claims in published maps and institutional affiliations.

